Cambridge IGCSE Sciences - Co-ordinated (Double) 0654 — 2020 May/June Paper 6 · Variant 1
0654/61/M/J/20 · 6 questions · 60 marks · ≈68 min
The question paper and its mark scheme, free to read here and free to download. This is Cambridge’s own paper, exactly as it was sat.
Question paper16 pages


Mark scheme8 pages
Answers below. Sit the paper first if you are practising.
Questions as text
Question 1
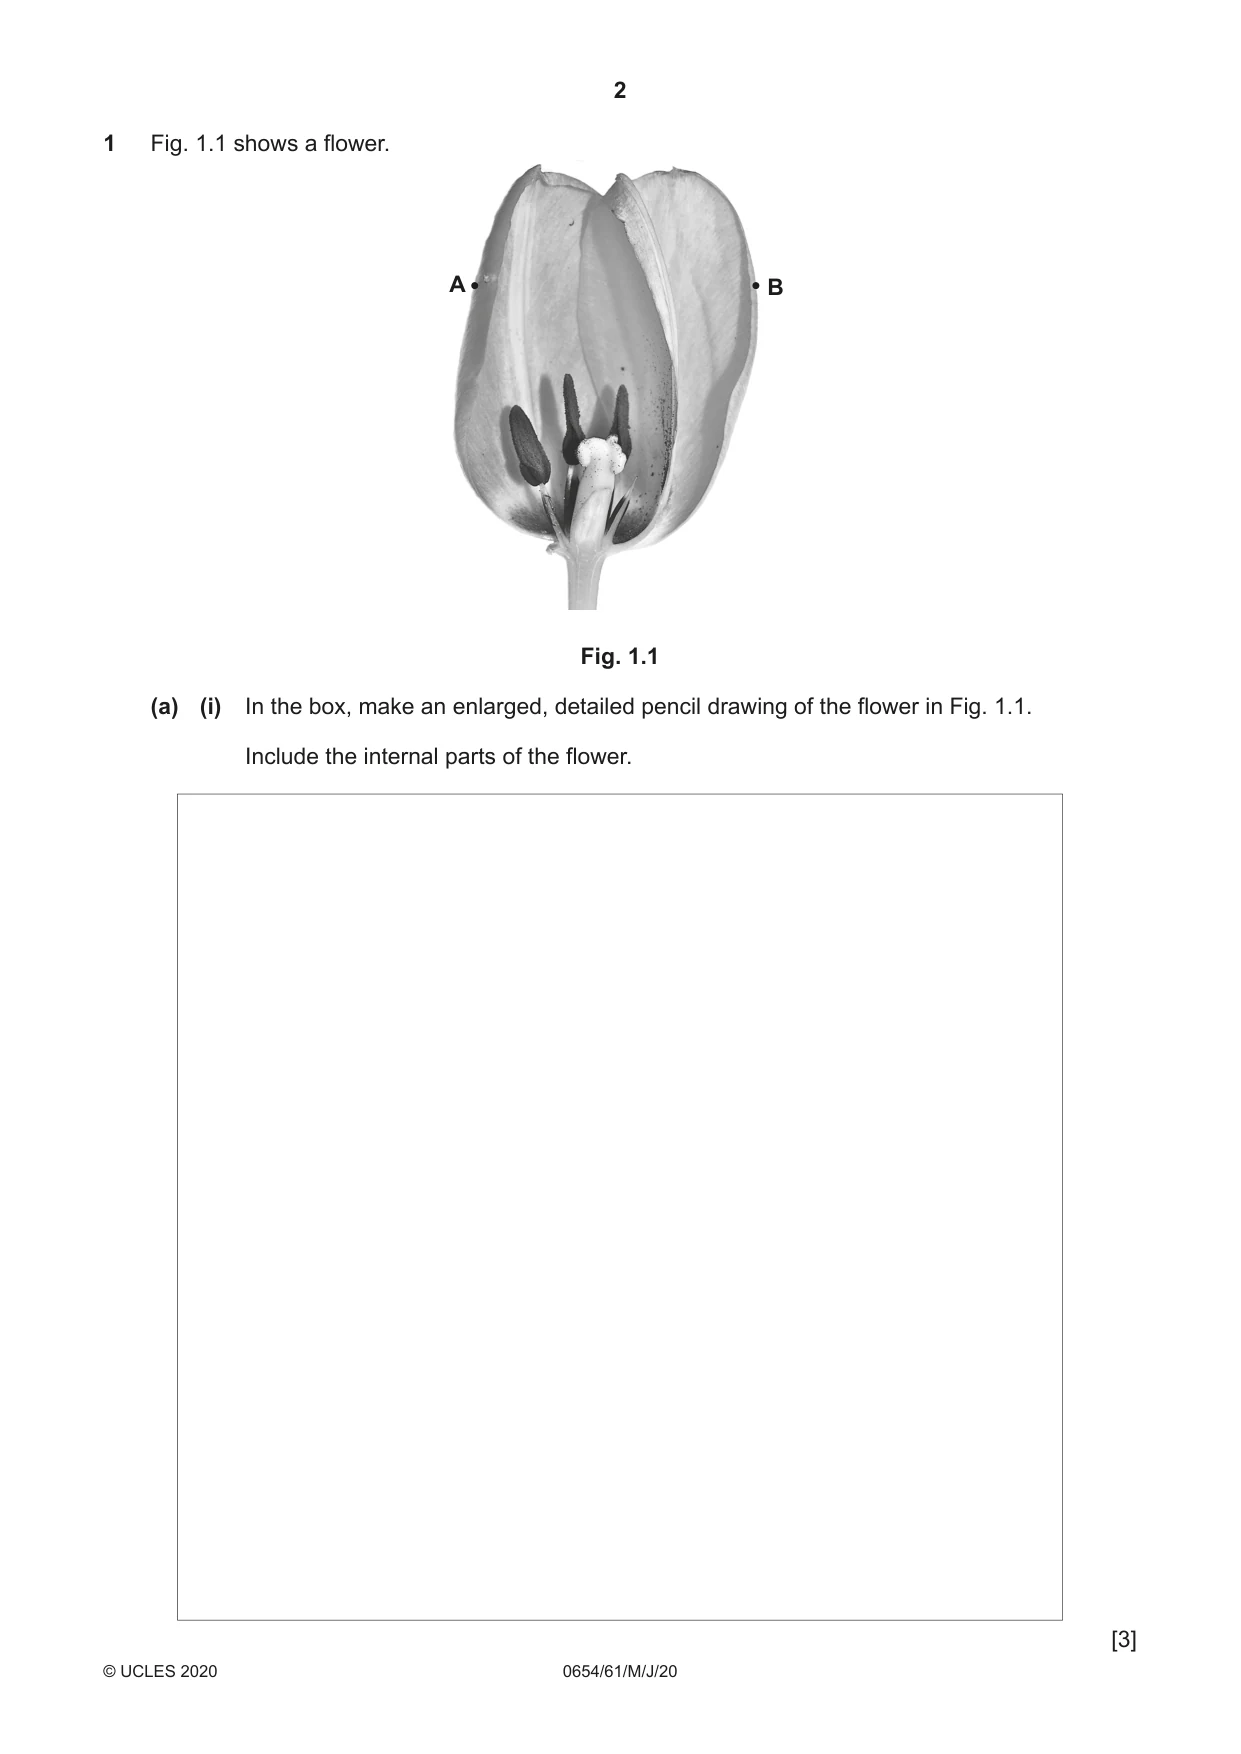
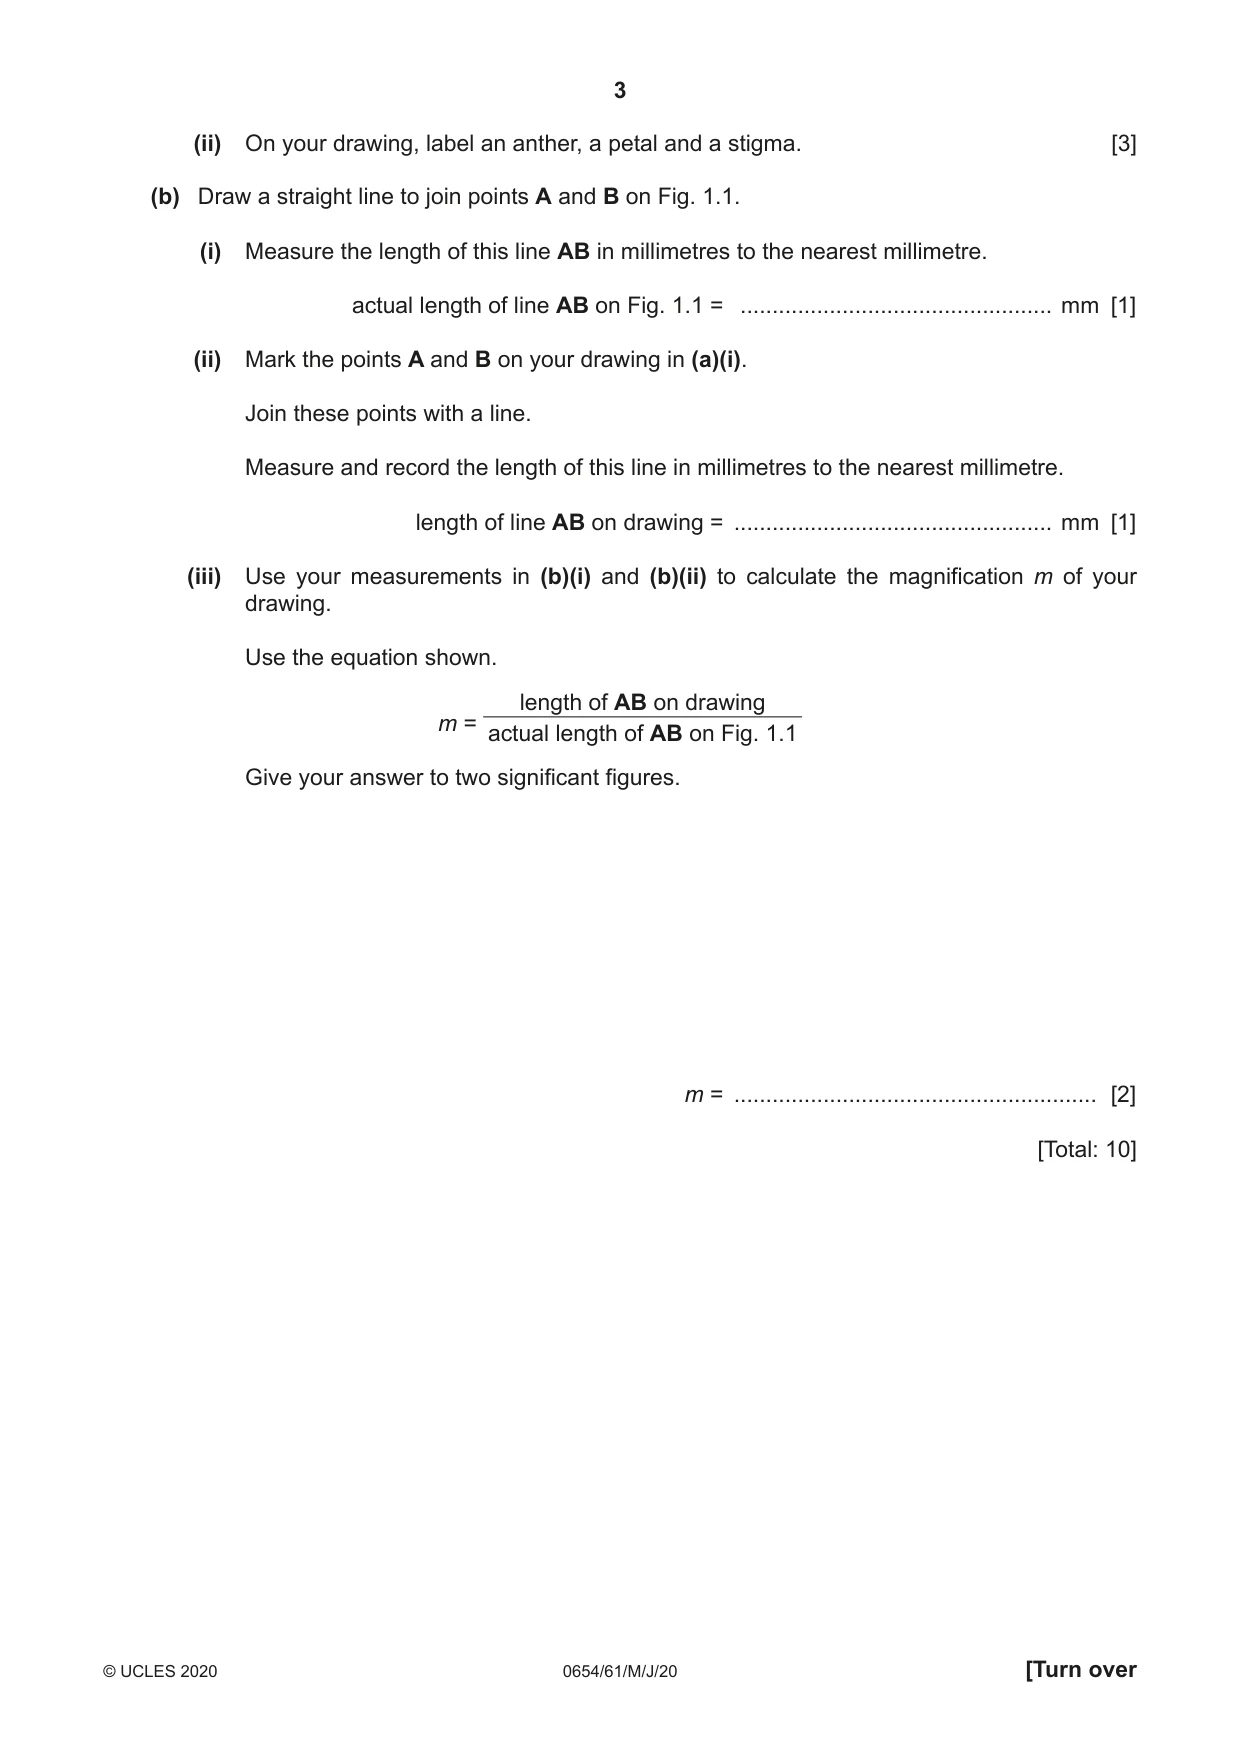
1 Fig. 1.1 shows a flower. A B Fig. 1.1 (a) (i) In the box, make an enlarged, detailed pencil drawing of the flower in Fig. 1.1. Include the internal parts of the flower. [3] (ii) On your drawing, label an anther, a petal and a stigma. [3] (b) Draw a straight line to join points A and B on Fig. 1.1. (i) Measure the length of this line AB in millimetres to the nearest millimetre. actual length of line AB on Fig. 1.1 = ................................................. mm [1] (ii) Mark the points A and B on your drawing in (a)(i). Join these points with a line. Measure and record the length of this line in millimetres to the nearest millimetre. length of line AB on drawing = .................................................. mm [1] (iii) Use your measurements in (b)(i) and (b)(ii) to calculate the magnification m of your drawing. Use the equation shown. length of AB on drawing m = actual length of AB on Fig. 1.1 Give your answer to two significant figures. m = ......................................................... [2] [Total: 10]
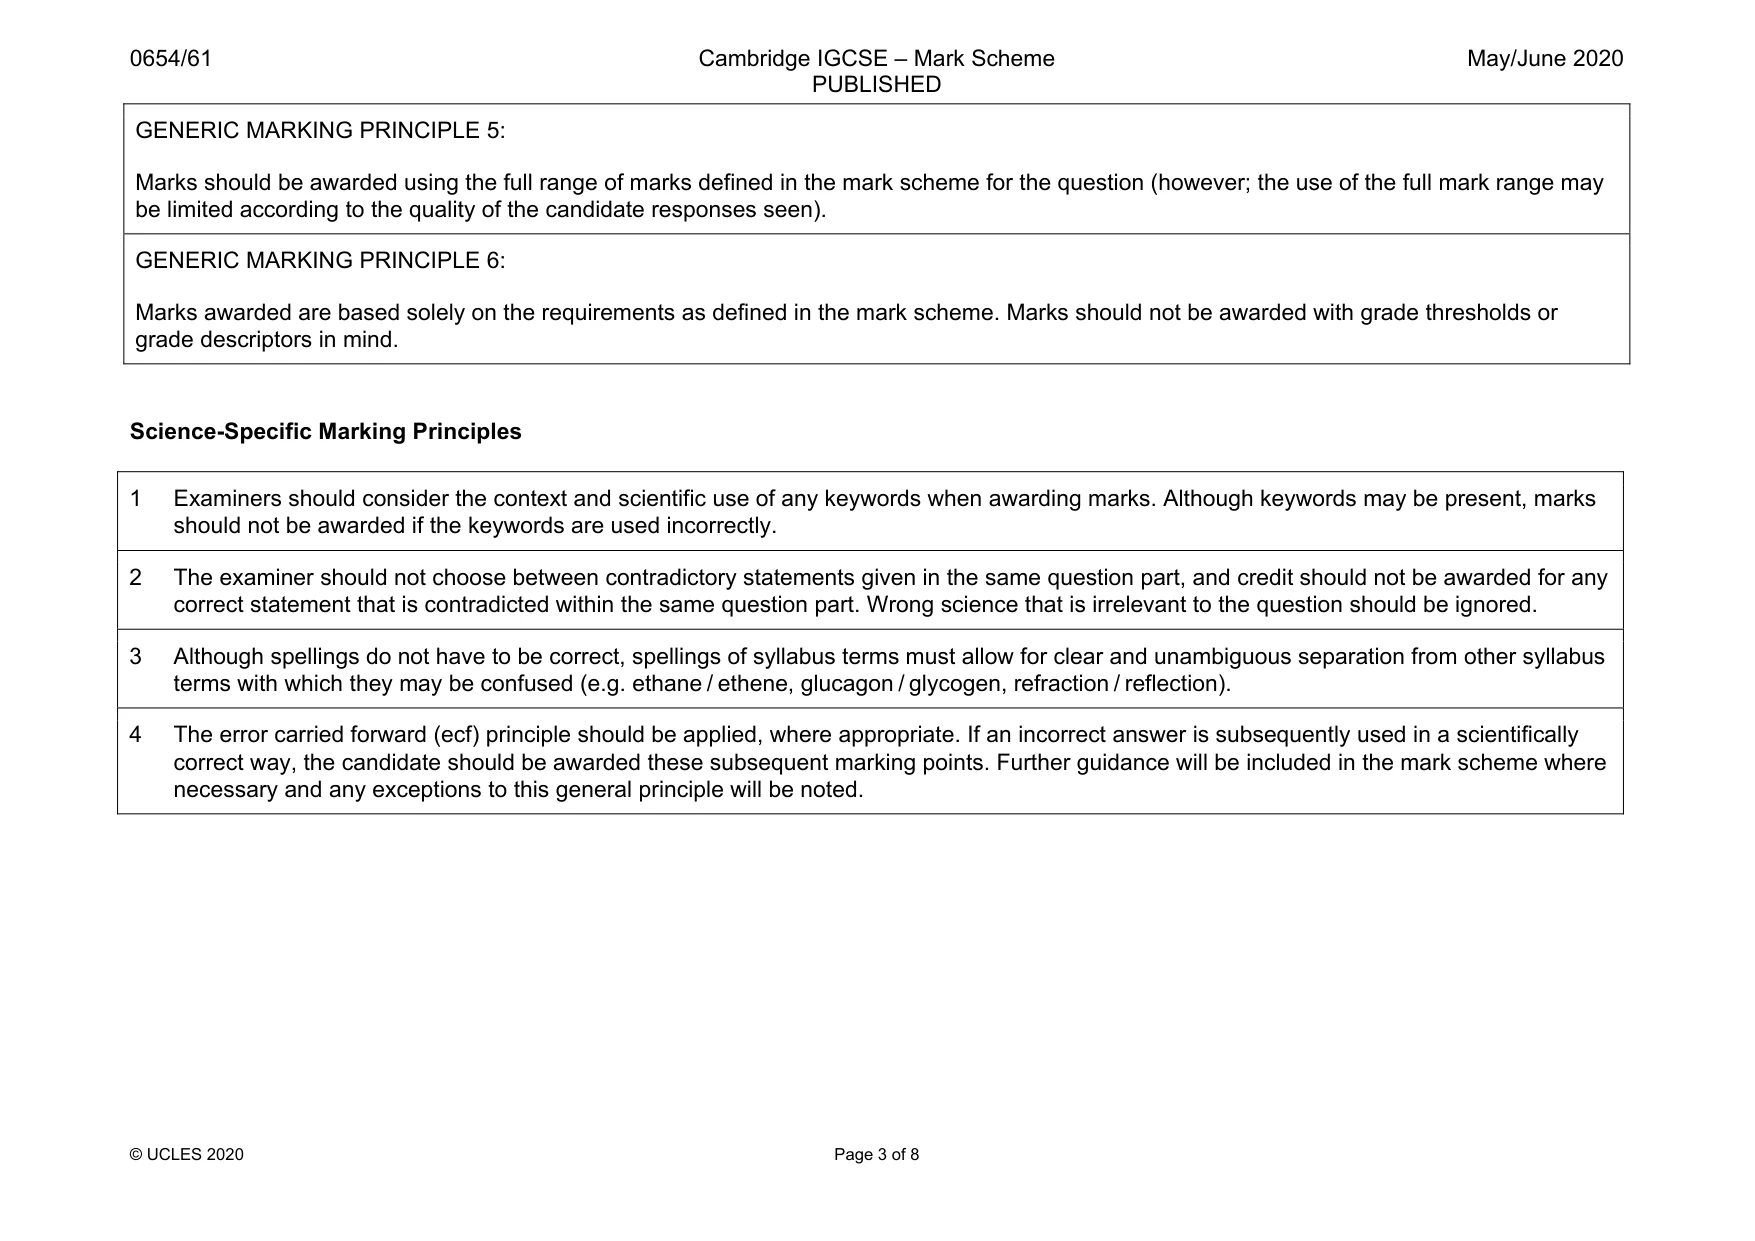
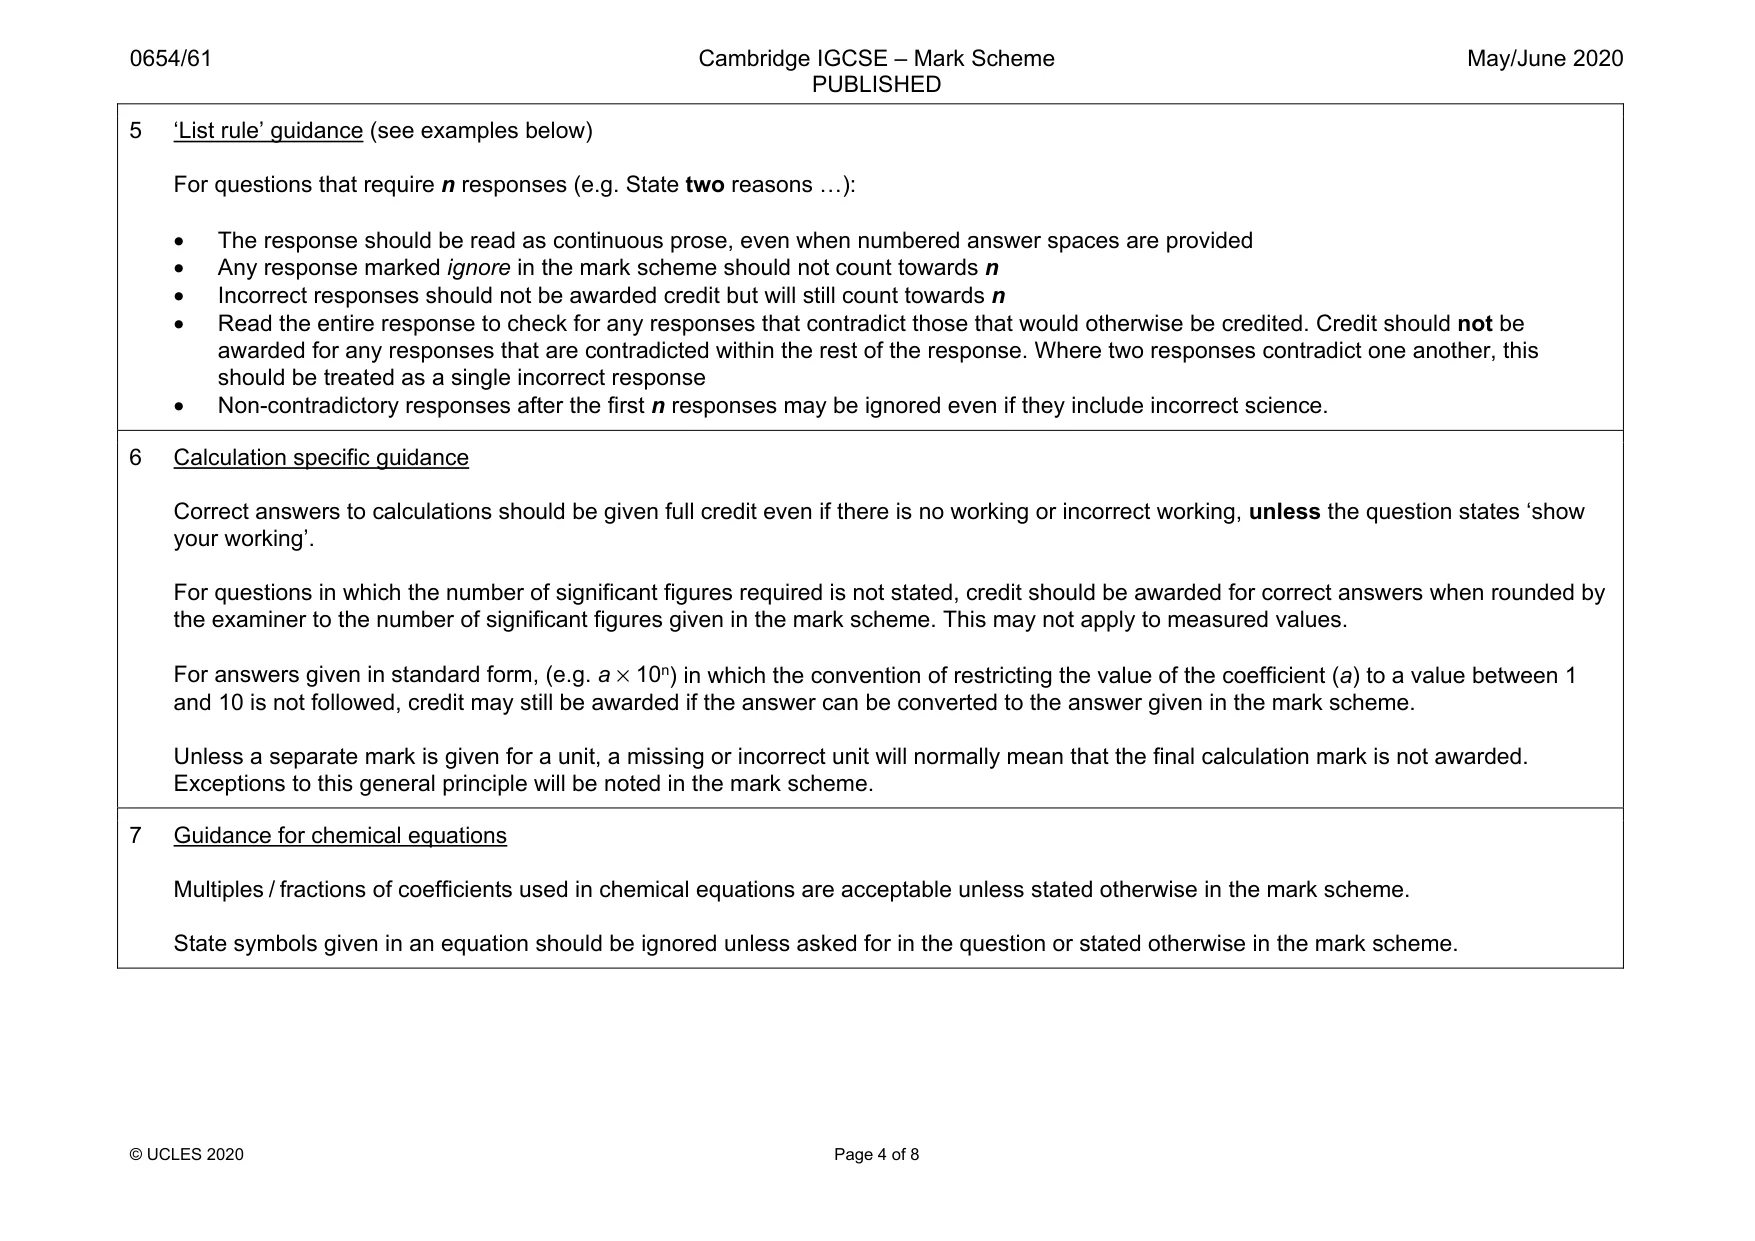
Mark scheme: 1(a)(i) clear and continuous outline; uses at least half of the box; detail including petals, filament and style; 3 1(a)(ii) anther correctly labelled; petal correctly labelled; stigma correctly labelled; 3 1(b)(i) correct measurement in mm; 1 1(b)(ii) line drawn and correct measurement; 1 1(b)(iii) correct calculation with correct rounding; to 2 sf ; 2
Q2 · A student has a sample of nectar and a sample of pollen from a flower
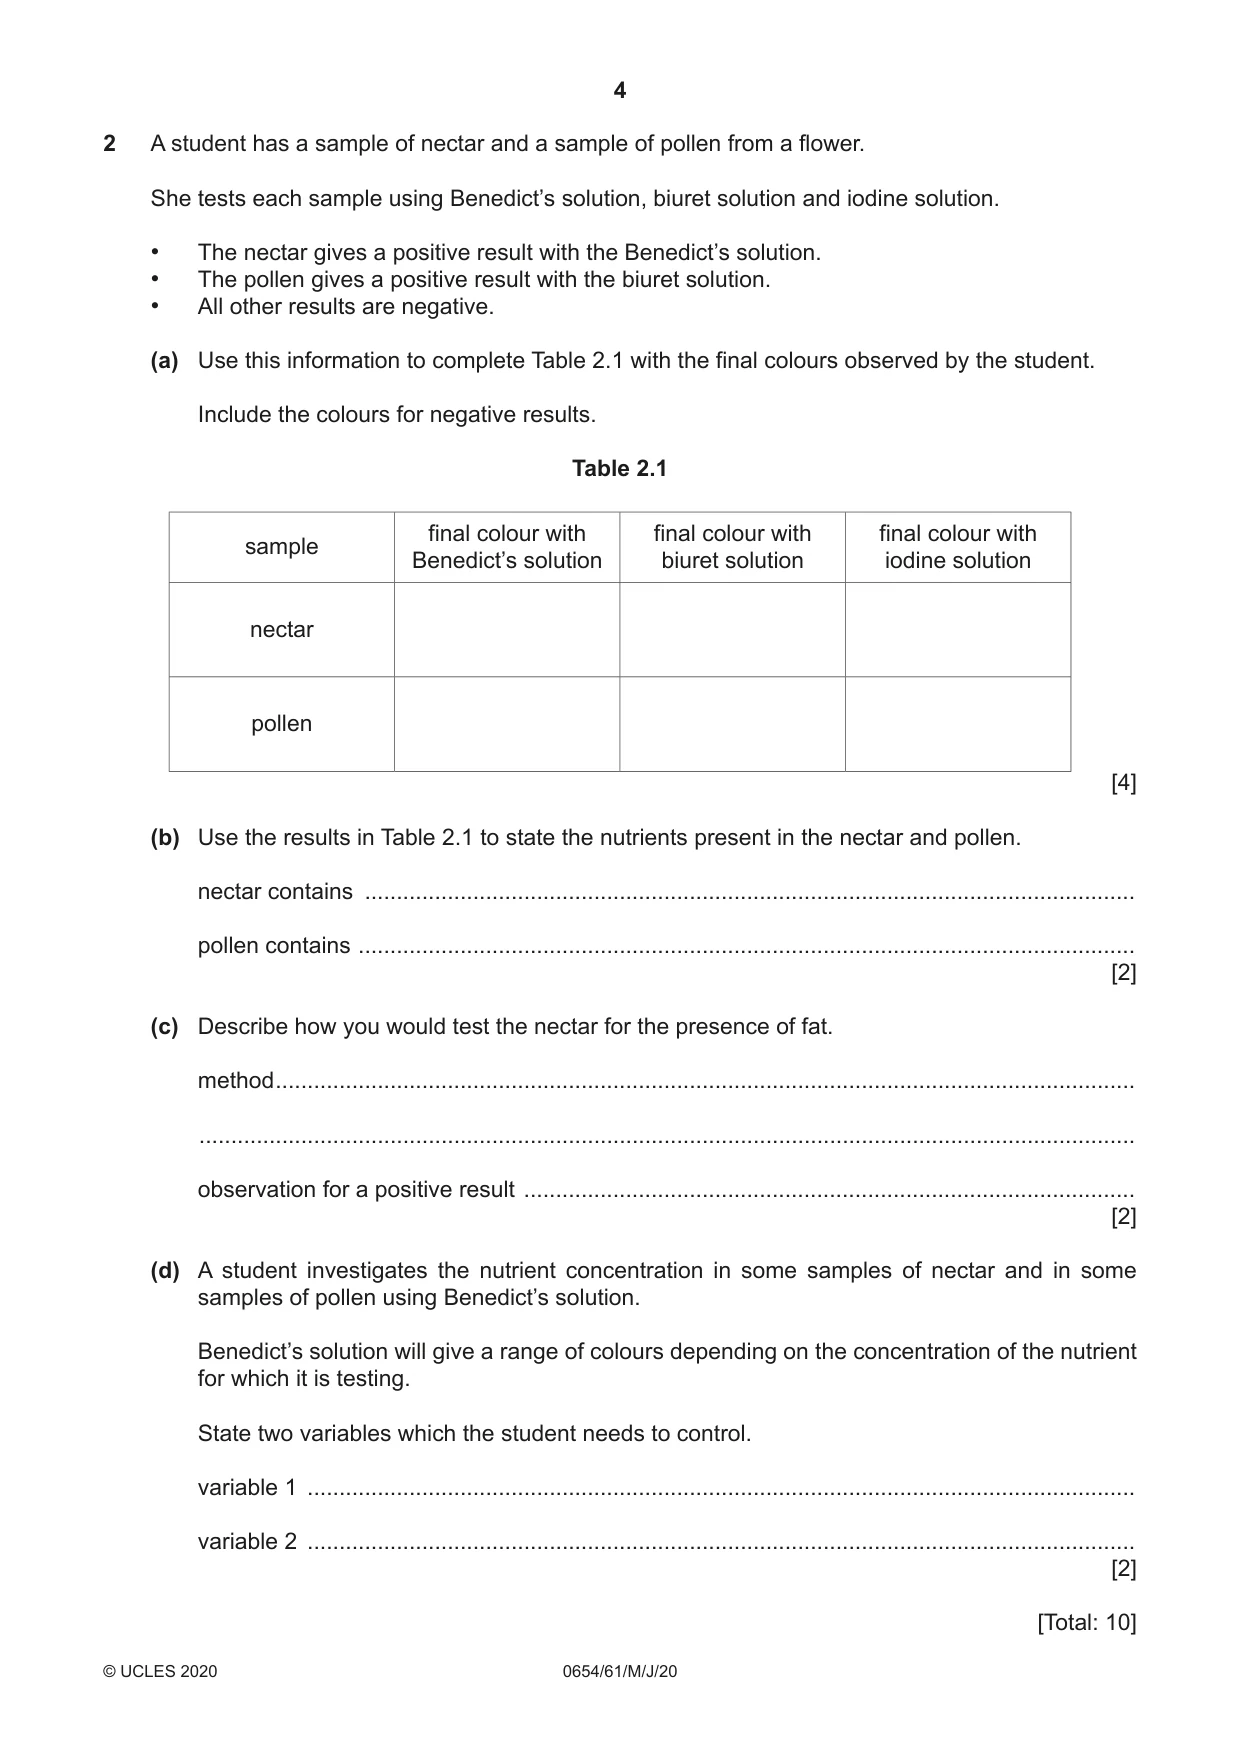
2 A student has a sample of nectar and a sample of pollen from a flower. She tests each sample using Benedict’s solution, biuret solution and iodine solution. • The nectar gives a positive result with the Benedict’s solution. • The pollen gives a positive result with the biuret solution. • All other results are negative. (a) Use this information to complete Table 2.1 with the final colours observed by the student. Include the colours for negative results. Table 2.1 final colour with final colour with final colour with sample Benedict’s solution biuret solution iodine solution nectar pollen [4] (b) Use the results in Table 2.1 to state the nutrients present in the nectar and pollen. nectar contains ......................................................................................................................... pollen contains .......................................................................................................................... [2] (c) Describe how you would test the nectar for the presence of fat. method ....................................................................................................................................... ................................................................................................................................................... observation for a positive result ................................................................................................ [2] (d) A student investigates the nutrient concentration in some samples of nectar and in some samples of pollen using Benedict’s solution. Benedict’s solution will give a range of colours depending on the concentration of the nutrient for which it is testing. State two variables which the student needs to control. variable 1 .................................................................................................................................. variable 2 .................................................................................................................................. [2] [Total: 10]
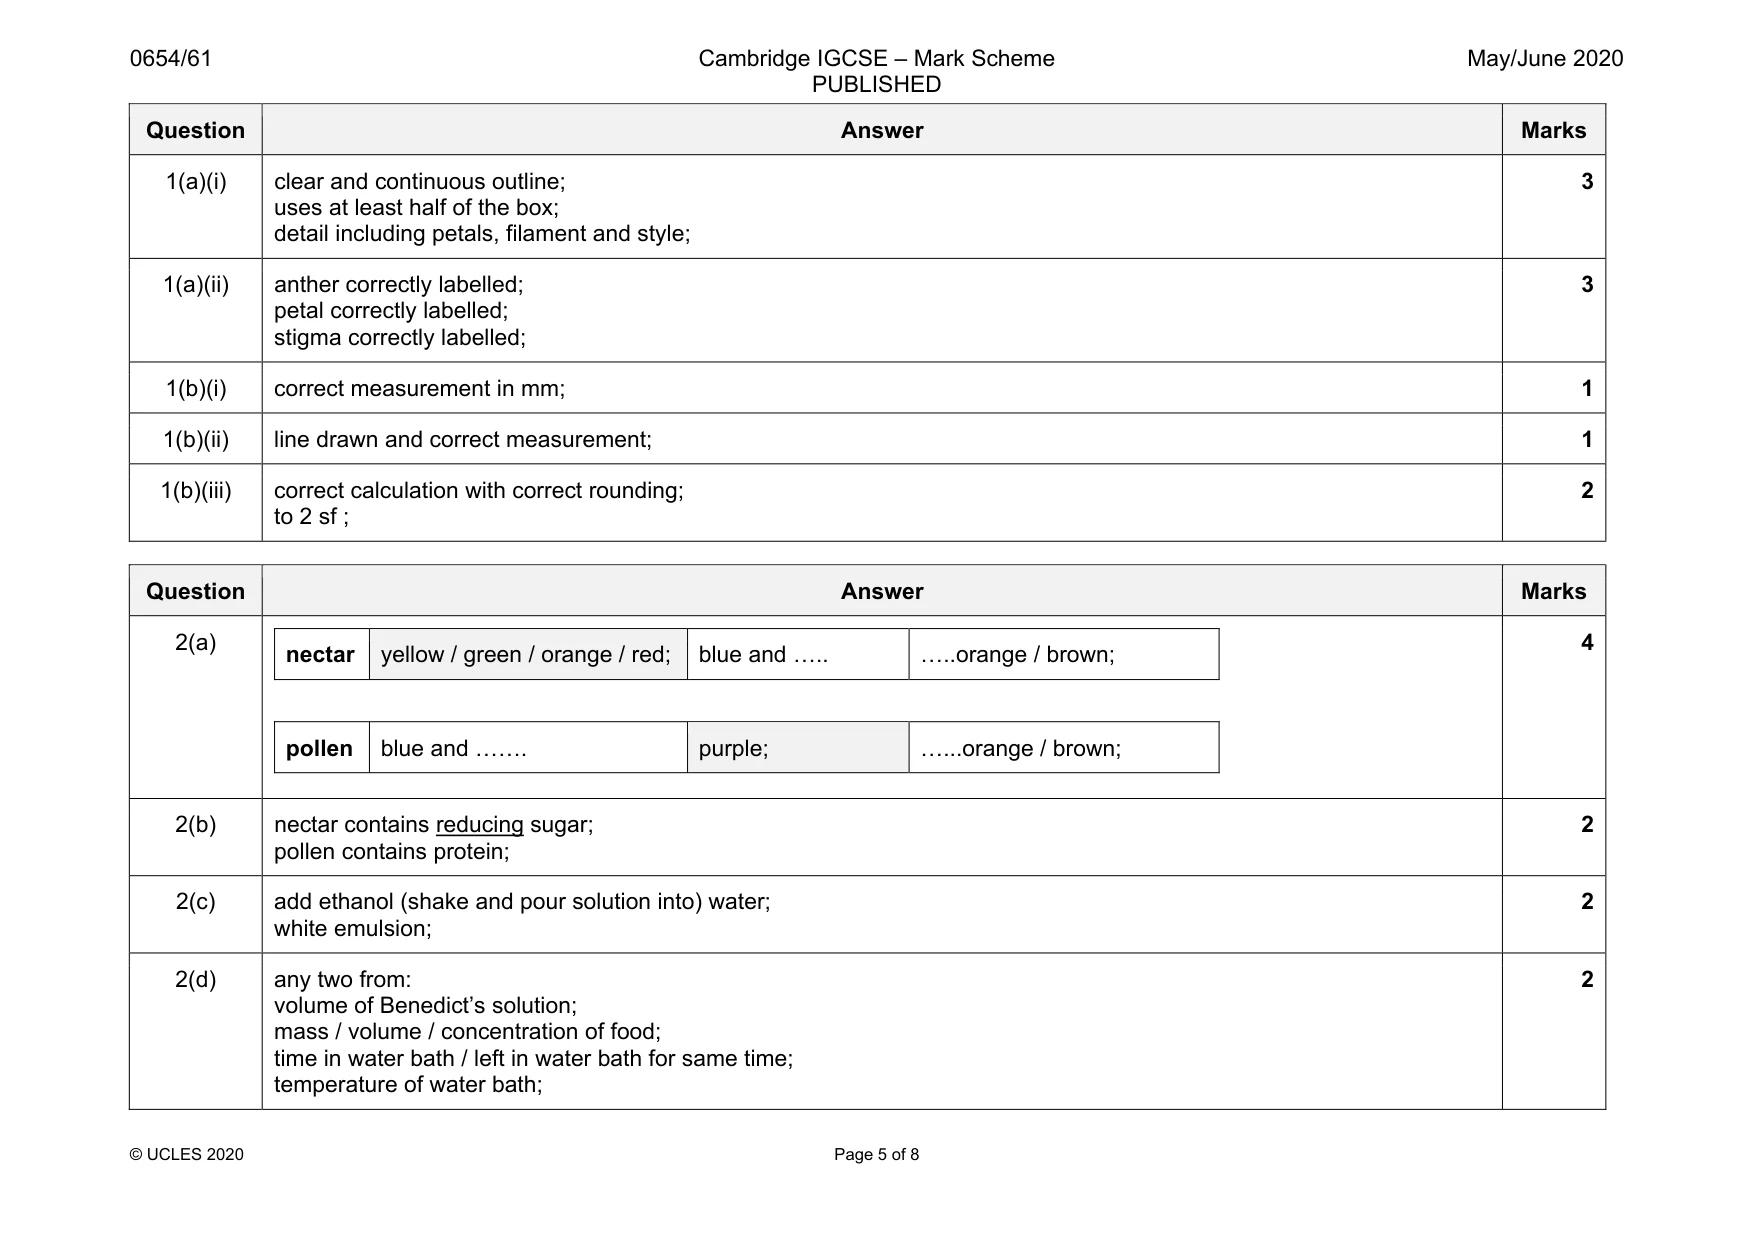
Mark scheme: 2(a) nectar yellow / green / orange / red; blue and ….. …..orange / brown; pollen blue and ……. purple; …...orange / brown; 4 2(b) nectar contains reducing sugar; pollen contains protein; 2 2(c) add ethanol (shake and pour solution into) water; white emulsion; 2 2(d) any two from: volume of Benedict’s solution; mass / volume / concentration of food; time in water bath / left in water bath for same time; temperature of water bath; 2
Q3 · In this investigation a student is going to identify five solutions, J, K, L, M and N
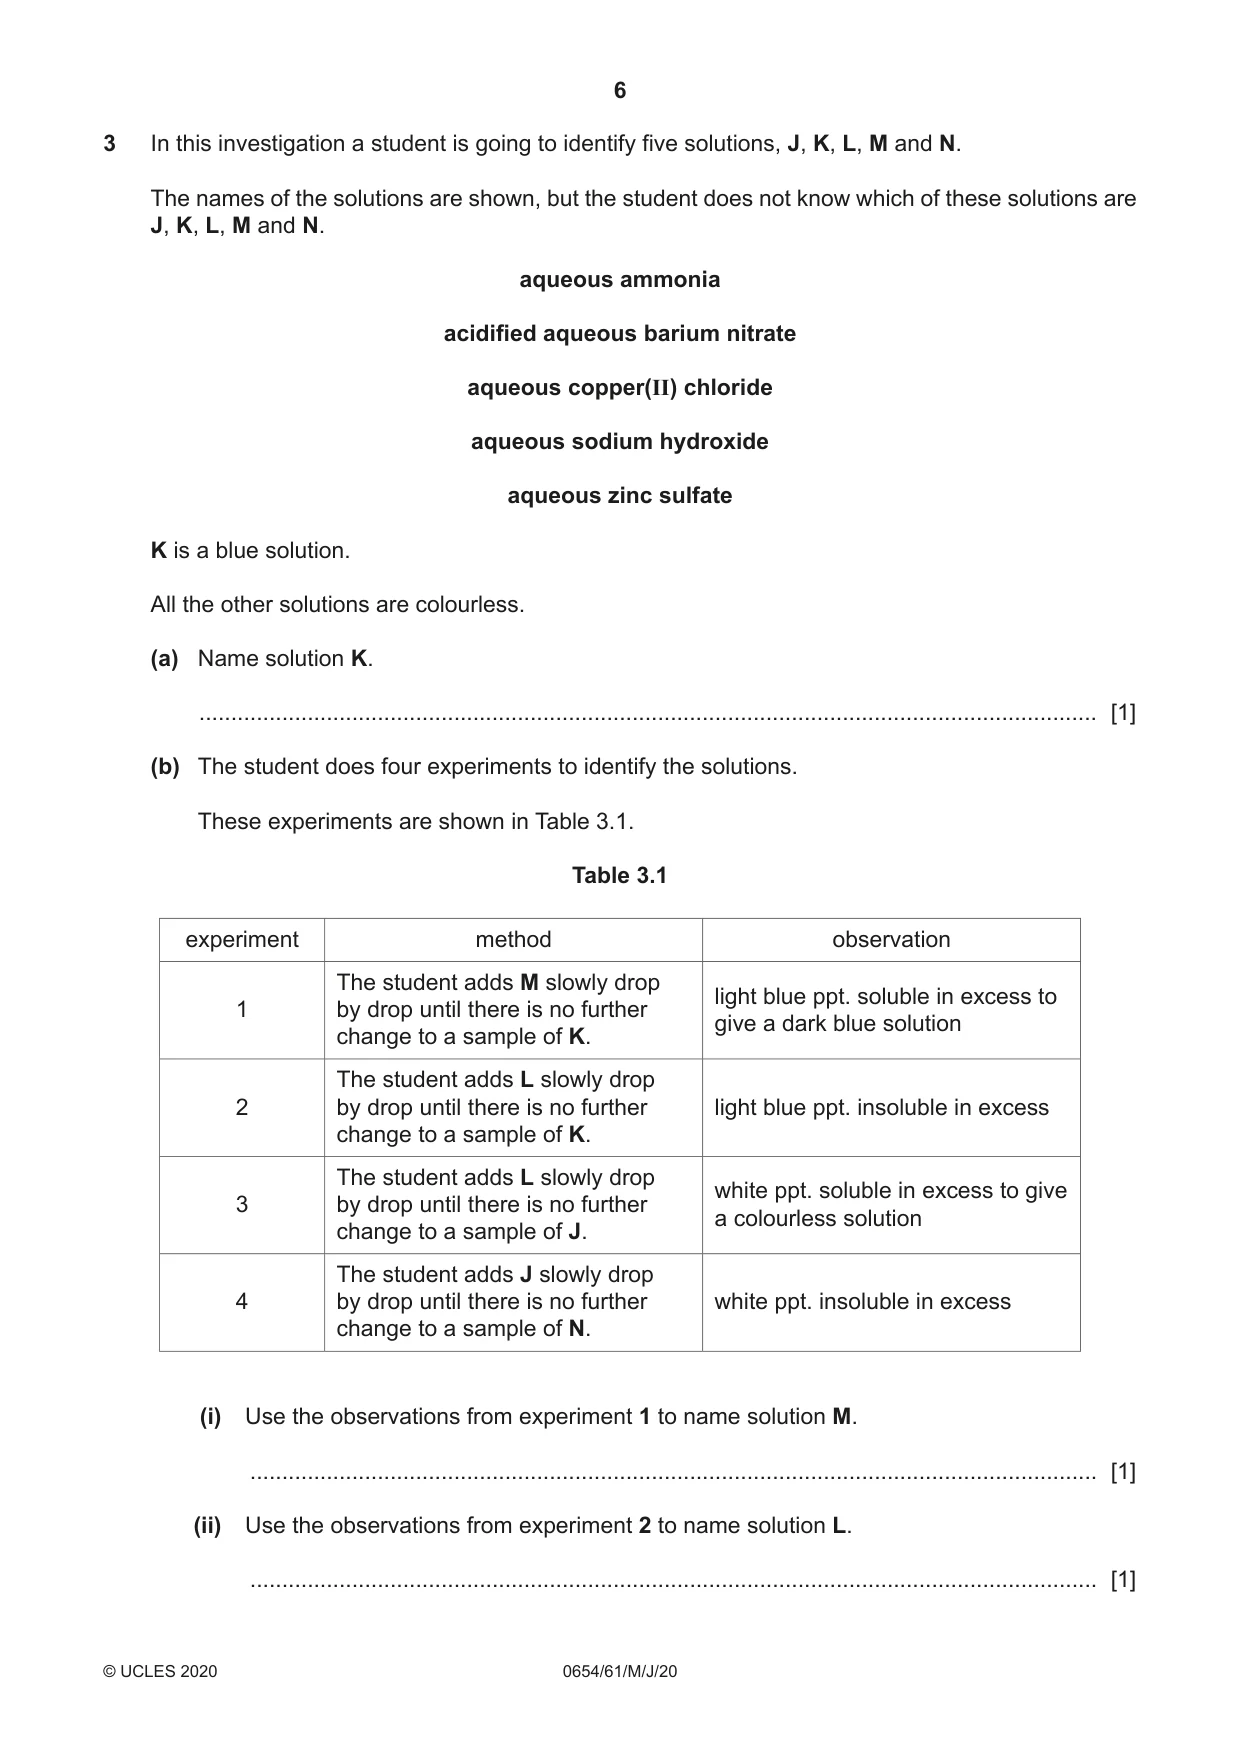
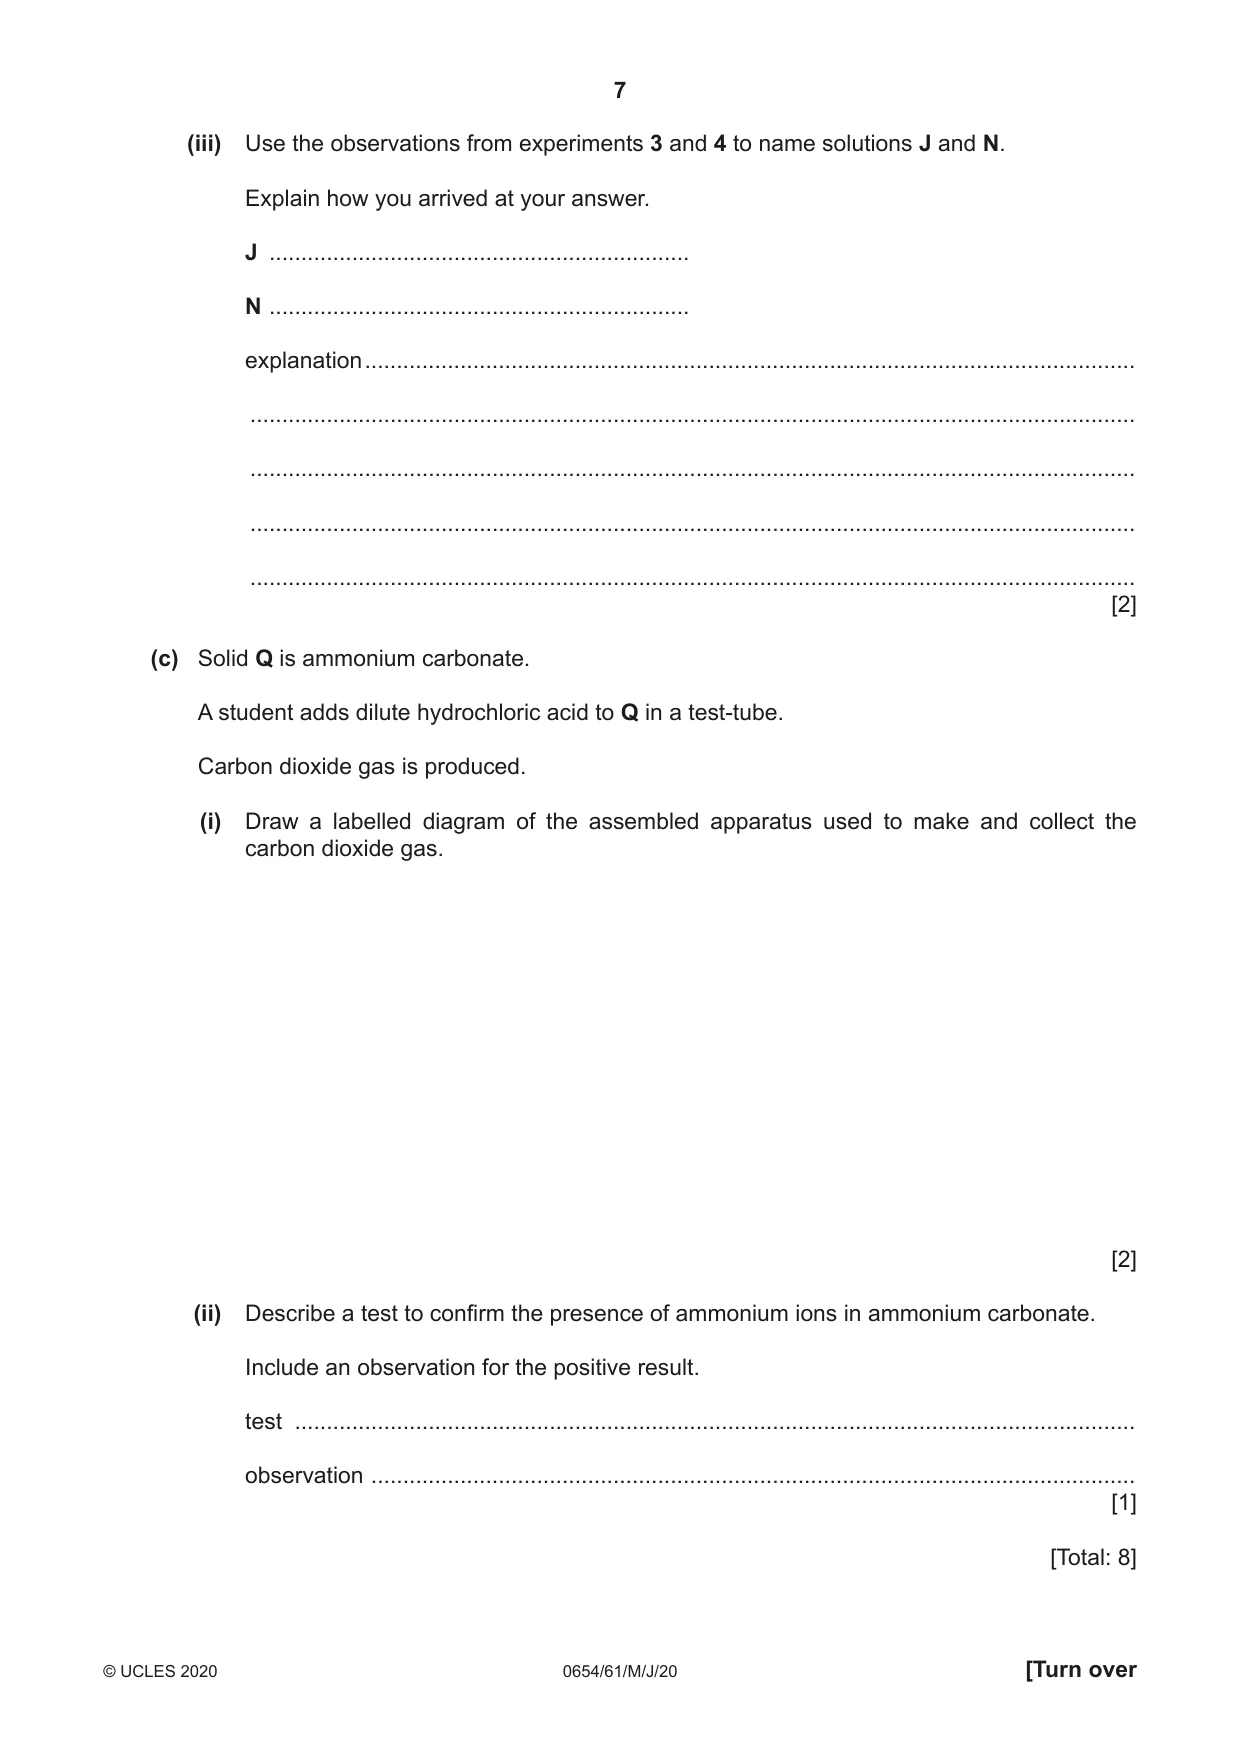
3 In this investigation a student is going to identify five solutions, J, K, L, M and N. The names of the solutions are shown, but the student does not know which of these solutions are J, K, L, M and N. aqueous ammonia acidified aqueous barium nitrate aqueous copper(II) chloride aqueous sodium hydroxide aqueous zinc sulfate K is a blue solution. All the other solutions are colourless. (a) Name solution K. ............................................................................................................................................. [1] (b) The student does four experiments to identify the solutions. These experiments are shown in Table 3.1. Table 3.1 experiment method observation The student adds M slowly drop light blue ppt. soluble in excess to 1 by drop until there is no further give a dark blue solution change to a sample of K. The student adds L slowly drop 2 by drop until there is no further light blue ppt. insoluble in excess change to a sample of K. The student adds L slowly drop white ppt. soluble in excess to give 3 by drop until there is no further a colourless solution change to a sample of J. The student adds J slowly drop 4 by drop until there is no further white ppt. insoluble in excess change to a sample of N. (i) Use the observations from experiment 1 to name solution M. ..................................................................................................................................... [1] (ii) Use the observations from experiment 2 to name solution L. ..................................................................................................................................... [1] (iii) Use the observations from experiments 3 and 4 to name solutions J and N. Explain how you arrived at your answer. J .................................................................. N .................................................................. explanation ......................................................................................................................... ........................................................................................................................................... ........................................................................................................................................... ........................................................................................................................................... ........................................................................................................................................... [2] (c) Solid Q is ammonium carbonate. A student adds dilute hydrochloric acid to Q in a test-tube. Carbon dioxide gas is produced. (i) Draw a labelled diagram of the assembled apparatus used to make and collect the carbon dioxide gas. [2] (ii) Describe a test to confirm the presence of ammonium ions in ammonium carbonate. Include an observation for the positive result. test .................................................................................................................................... observation ........................................................................................................................ [1] [Total: 8]
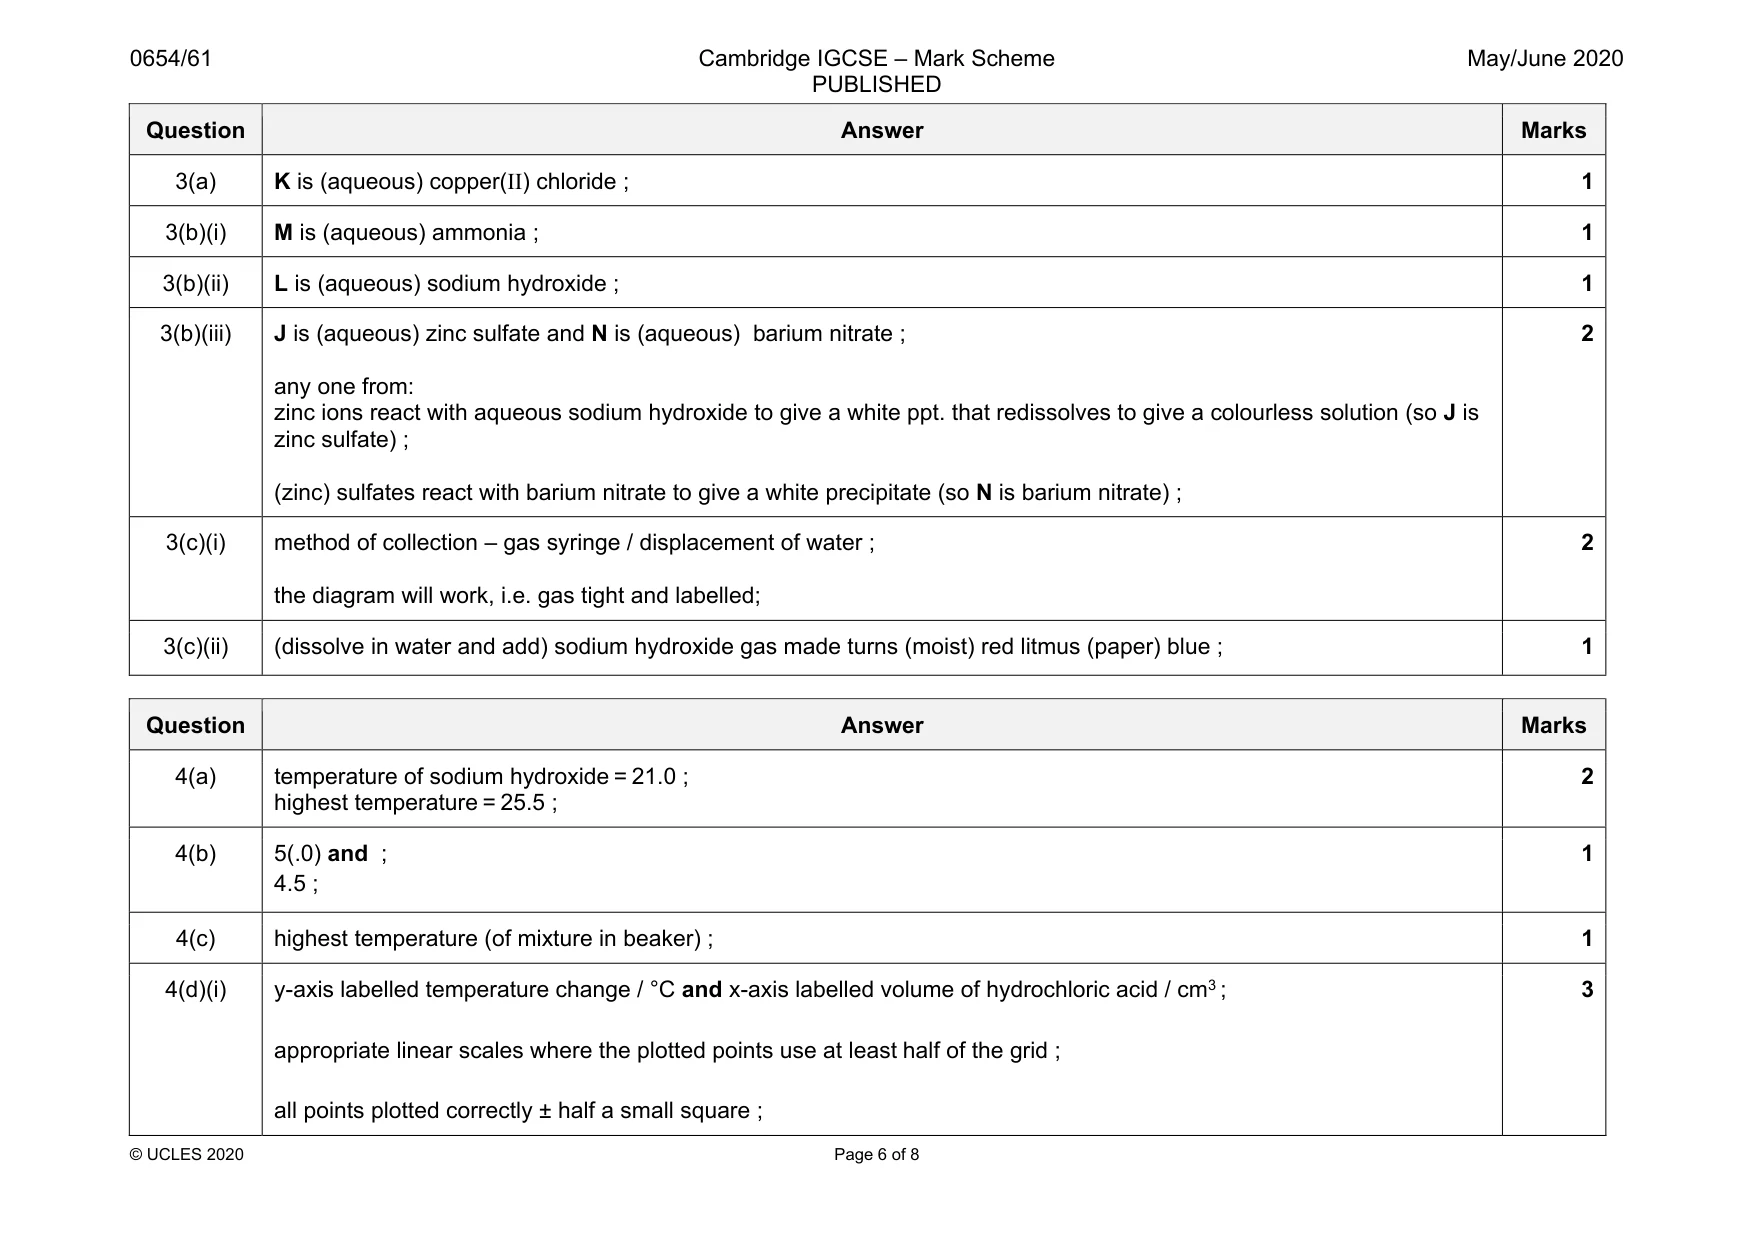
Mark scheme: 3(a) K is (aqueous) copper(II) chloride ; 1 3(b)(i) M is (aqueous) ammonia ; 1 3(b)(ii) L is (aqueous) sodium hydroxide ; 1 3(b)(iii) J is (aqueous) zinc sulfate and N is (aqueous) barium nitrate ; any one from: zinc ions react with aqueous sodium hydroxide to give a white ppt. that redissolves to give a colourless solution (so J is zinc sulfate) ; (zinc) sulfates react with barium nitrate to give a white precipitate (so N is barium nitrate) ; 2 3(c)(i) method of collection – gas syringe / displacement of water ; the diagram will work, i.e. gas tight and labelled; 2 3(c)(ii) (dissolve in water and add) sodium hydroxide gas made turns (moist) red litmus (paper) blue ; 1
Q4 · A student investigates the temperature change when dilute hydrochloric acid is…
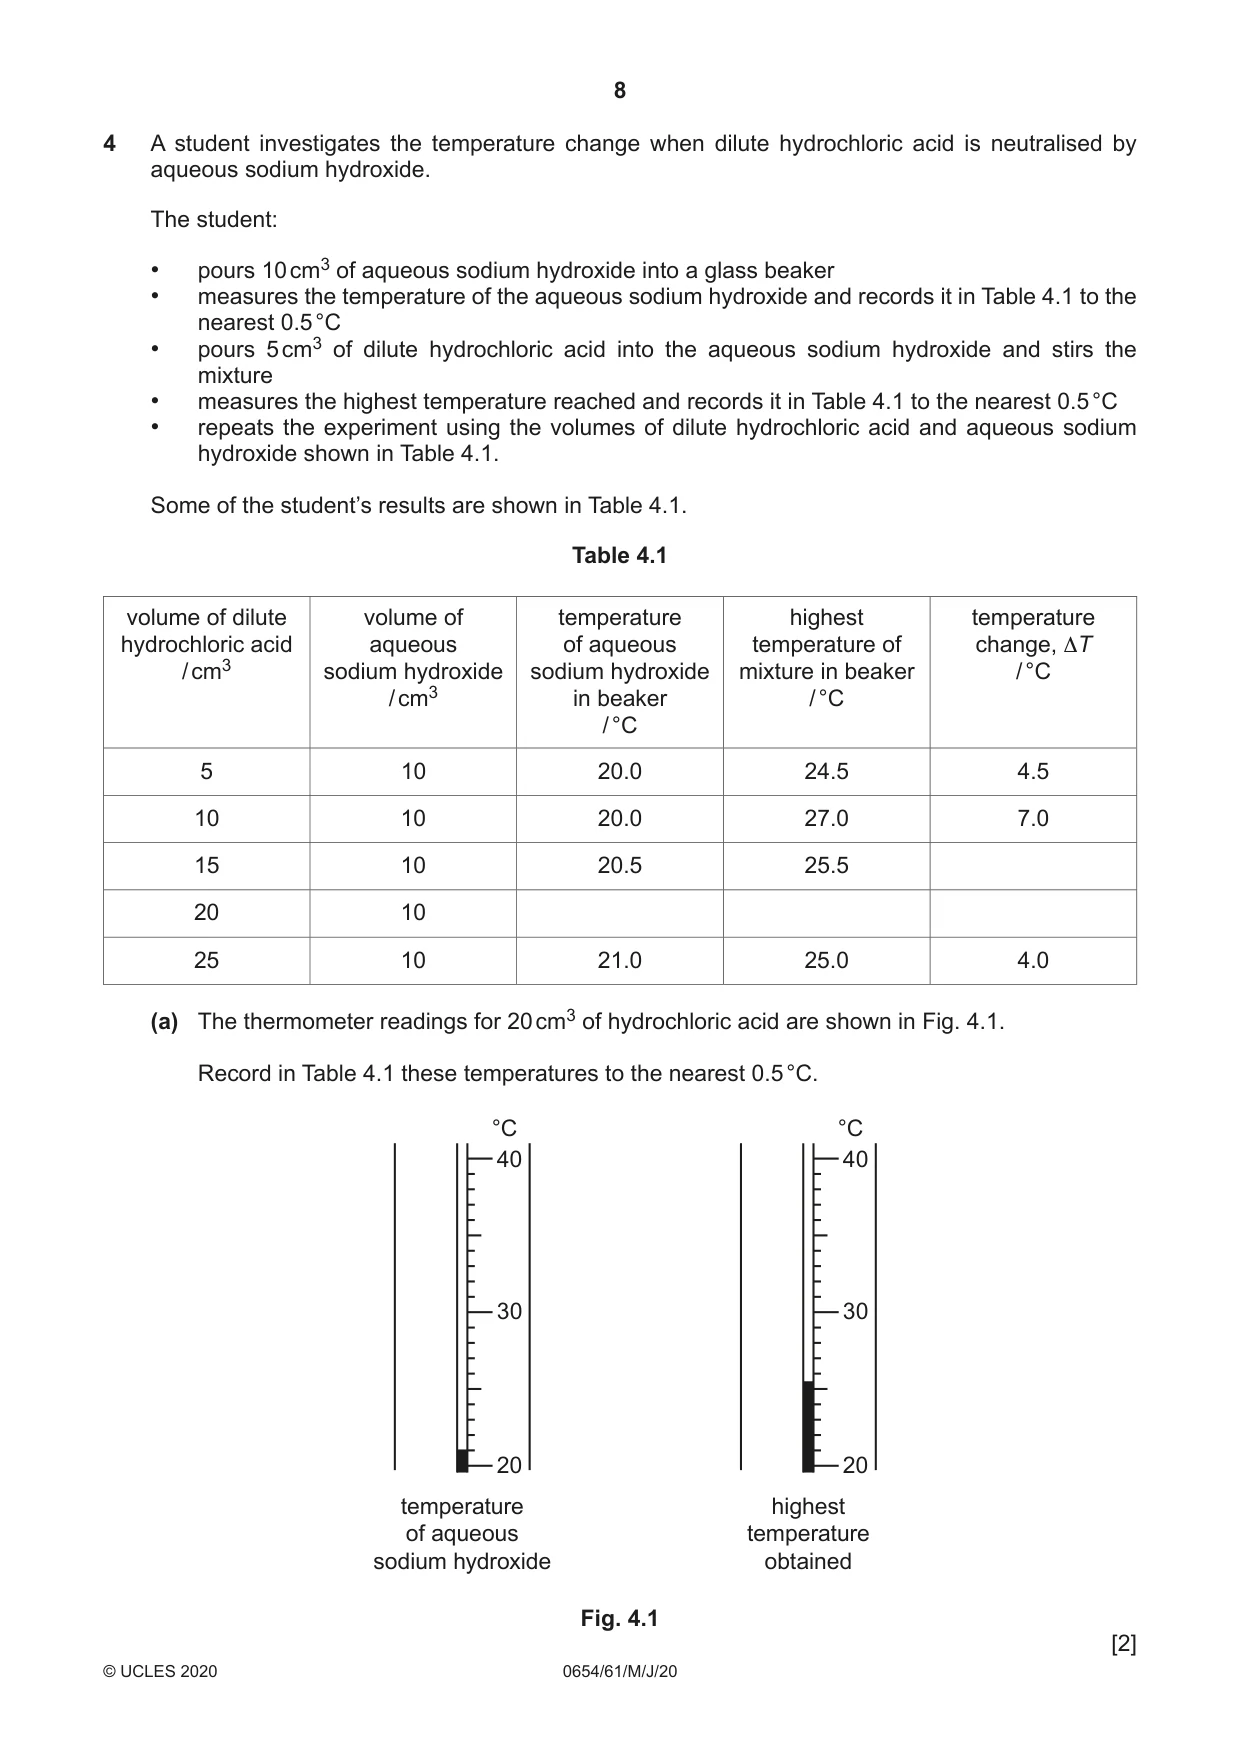
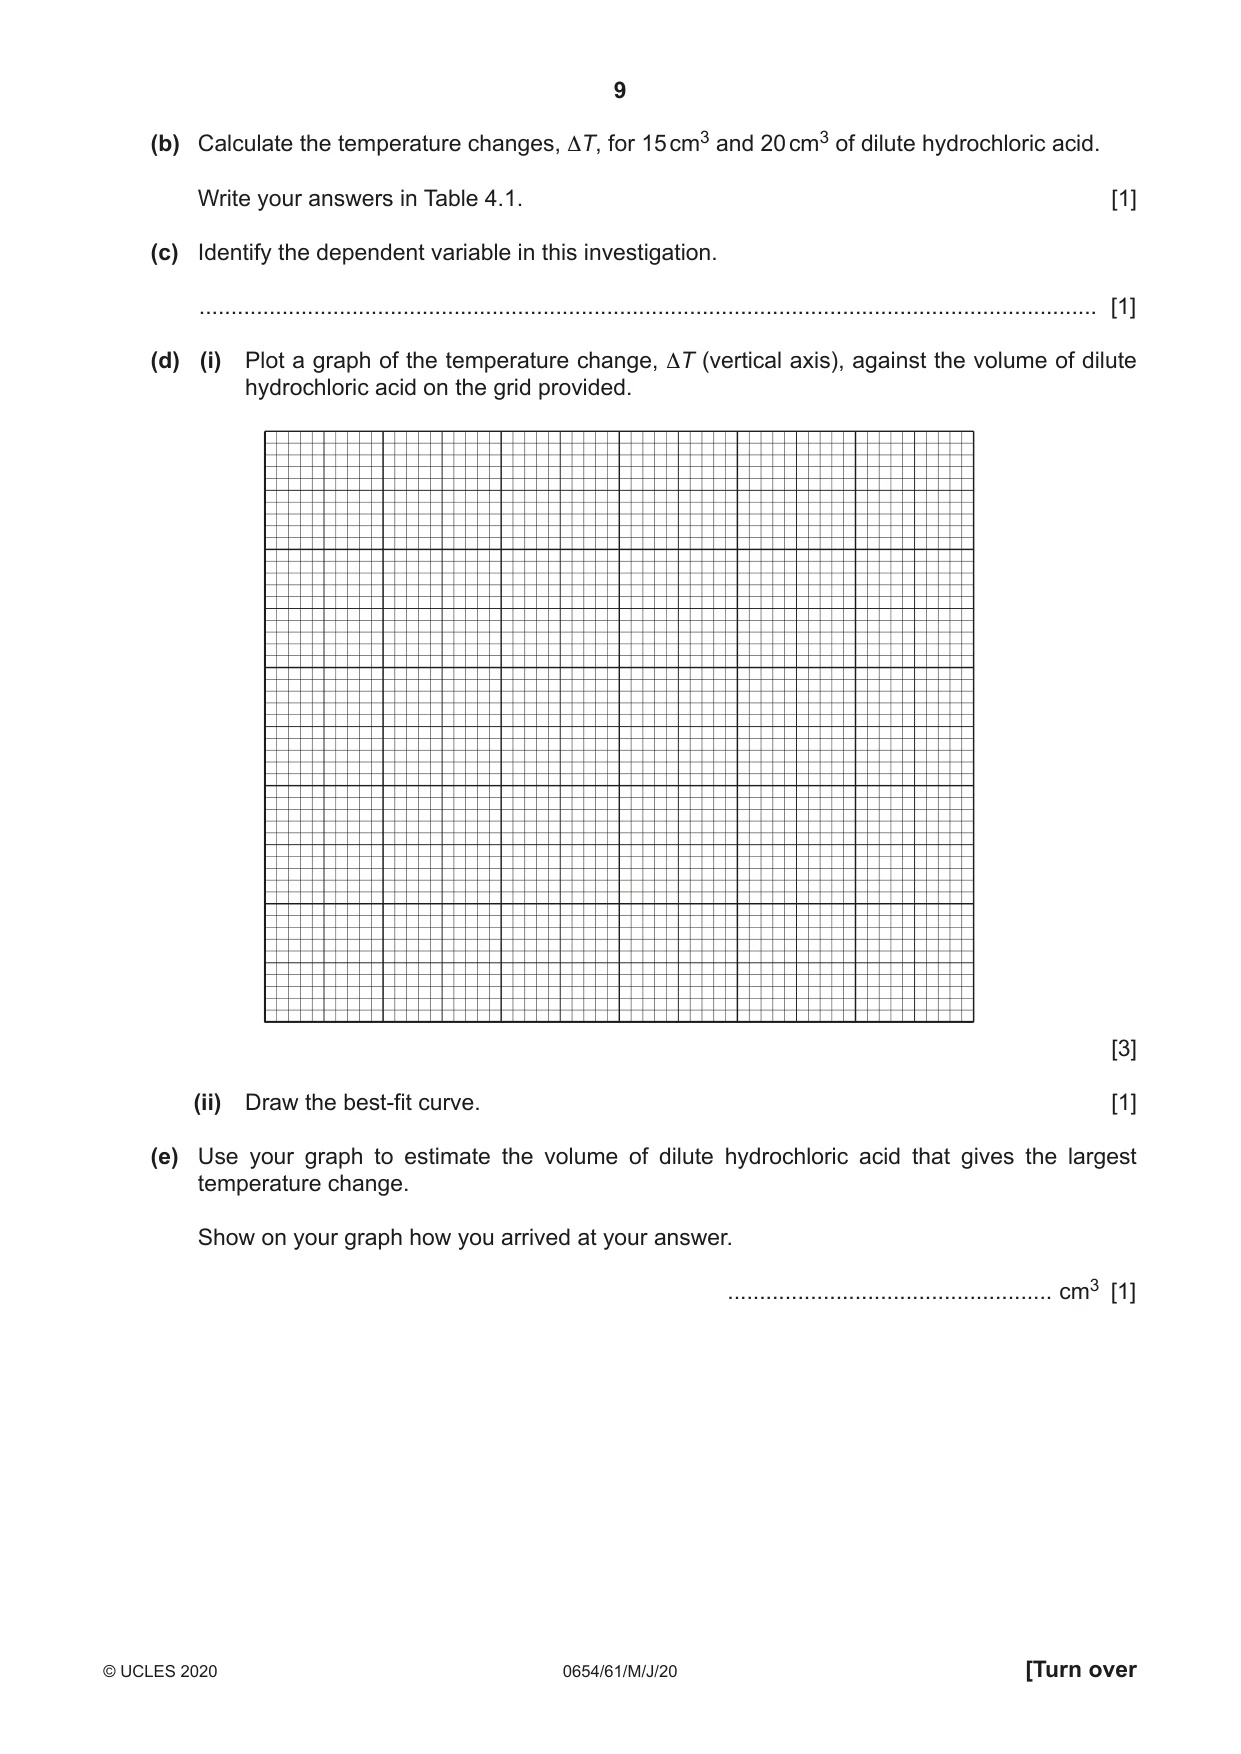
4 A student investigates the temperature change when dilute hydrochloric acid is neutralised by aqueous sodium hydroxide. The student: • pours 10 cm3 of aqueous sodium hydroxide into a glass beaker • measures the temperature of the aqueous sodium hydroxide and records it in Table 4.1 to the nearest 0.5 °C • pours 5 cm3 of dilute hydrochloric acid into the aqueous sodium hydroxide and stirs the mixture • measures the highest temperature reached and records it in Table 4.1 to the nearest 0.5 °C • repeats the experiment using the volumes of dilute hydrochloric acid and aqueous sodium hydroxide shown in Table 4.1. Some of the student’s results are shown in Table 4.1. Table 4.1 volume of dilute volume of temperature highest temperature hydrochloric acid aqueous of aqueous temperature of change, ∆T / cm3 sodium hydroxide sodium hydroxide mixture in beaker / °C / cm3 in beaker / °C / °C 5 10 20.0 24.5 4.5 10 10 20.0 27.0 7.0 15 10 20.5 25.5 20 10 25 10 21.0 25.0 4.0 (a) The thermometer readings for 20 cm3 of hydrochloric acid are shown in Fig. 4.1. Record in Table 4.1 these temperatures to the nearest 0.5 °C. °C °C 40 40 30 30 20 20 temperature highest of aqueous temperature sodium hydroxide obtained Fig. 4.1 [2] (b) Calculate the temperature changes, ∆T, for 15 cm3 and 20 cm3 of dilute hydrochloric acid. Write your answers in Table 4.1. [1] (c) Identify the dependent variable in this investigation. ............................................................................................................................................. [1] (d) (i) Plot a graph of the temperature change, ∆T (vertical axis), against the volume of dilute hydrochloric acid on the grid provided. [3] (ii) Draw the best-fit curve. [1] (e) Use your graph to estimate the volume of dilute hydrochloric acid that gives the largest temperature change. Show on your graph how you arrived at your answer. ................................................... cm3 [1] (f) During the experiment the liquid in the beaker loses thermal energy to the surroundings. (i) State the effect this will have on the results of the experiment. ........................................................................................................................................... ..................................................................................................................................... [1] (ii) Suggest one way of reducing the loss of thermal energy in this experiment. ........................................................................................................................................... ..................................................................................................................................... [1] (g) Give one advantage of using a 10 cm3 measuring cylinder to measure the volume of aqueous sodium hydroxide rather than a 25 cm3 measuring cylinder. ............................................................................................................................................. [1] [Total: 12]
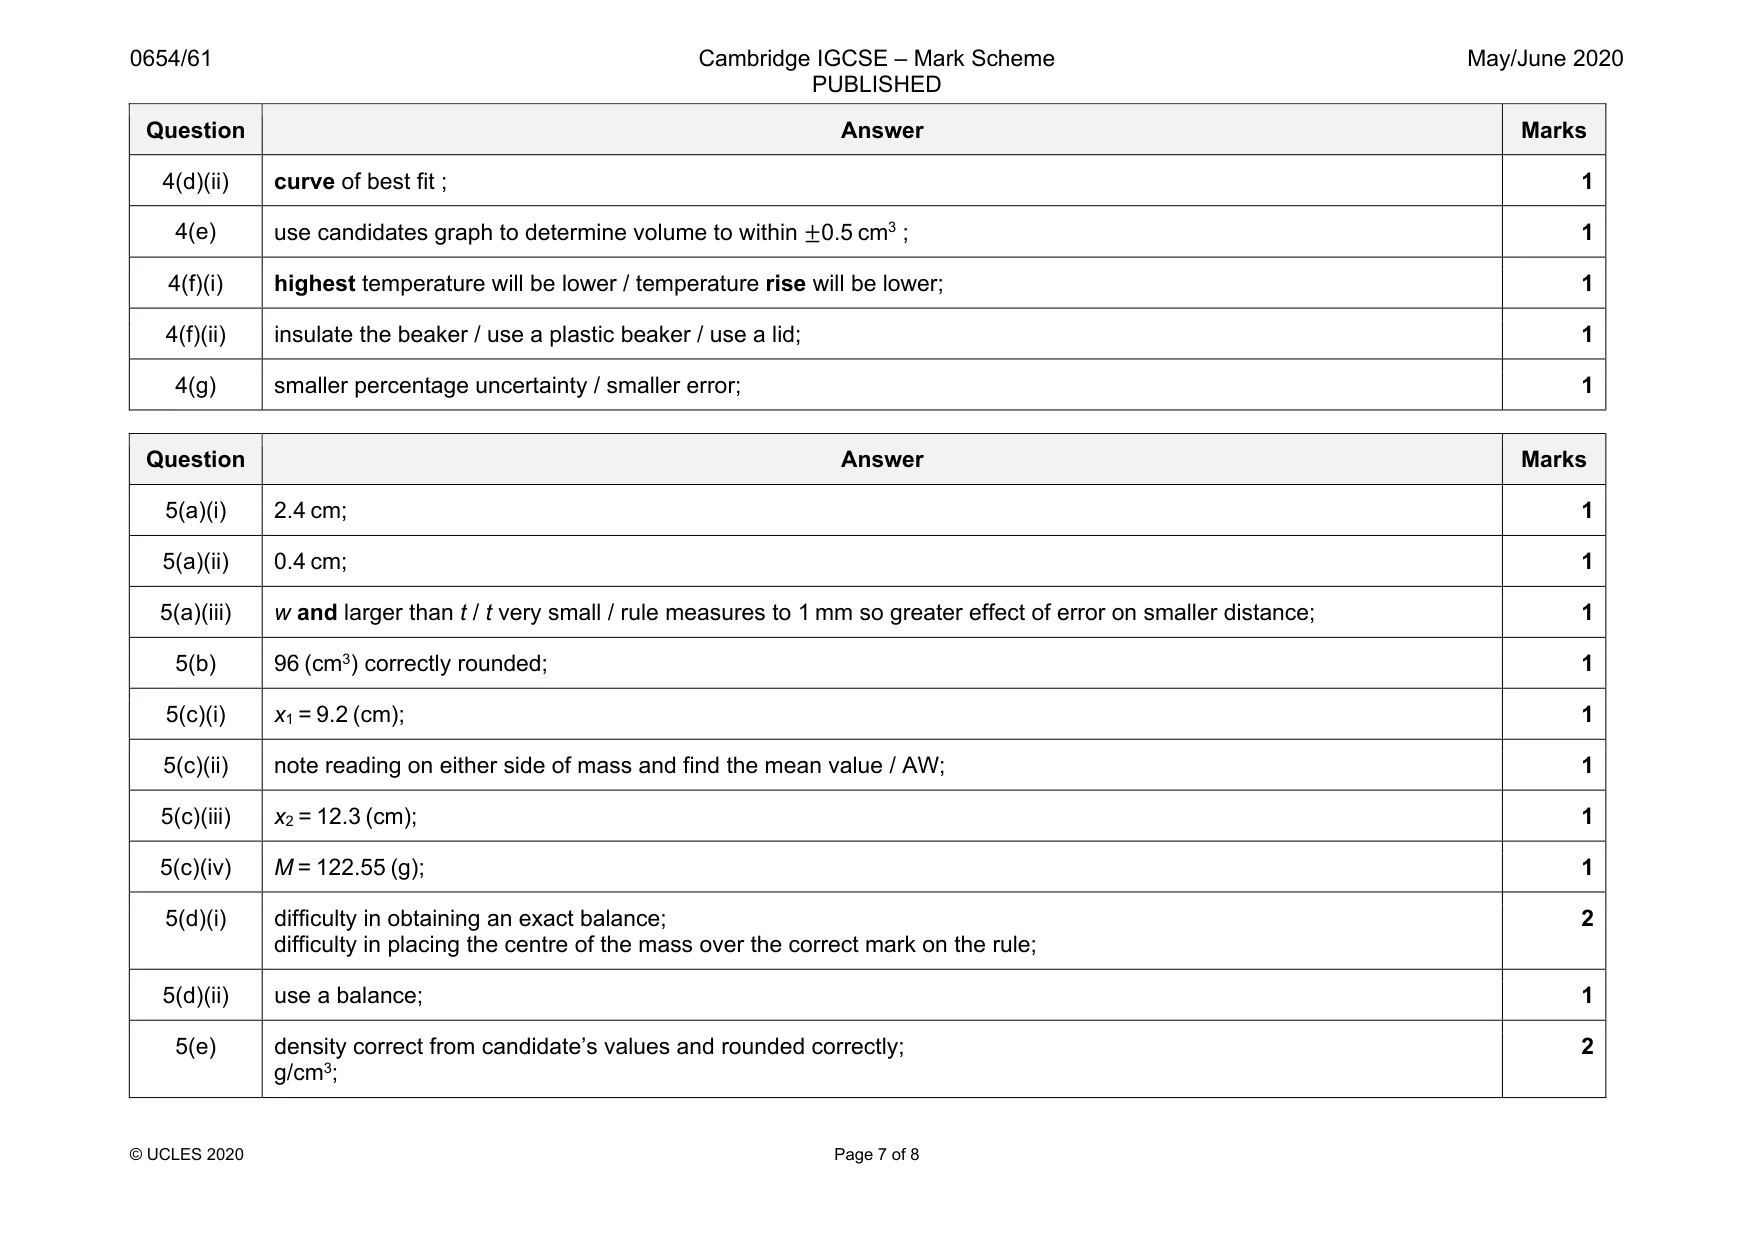
Mark scheme: 4(a) temperature of sodium hydroxide = 21.0 ; highest temperature = 25.5 ; 2 4(b) 5(.0) and ; 4.5 ; 1 4(c) highest temperature (of mixture in beaker) ; 1 4(d)(i) y-axis labelled temperature change / °C and x-axis labelled volume of hydrochloric acid / cm3 ; appropriate linear scales where the plotted points use at least half of the grid ; all points plotted correctly ± half a small square ; 3 Question Answer Marks 4(d)(ii) curve of best fit ; 1 4(e) use candidates graph to determine volume to within ±0.5 cm3 ; 1 4(f)(i) highest temperature will be lower / temperature rise will be lower; 1 4(f)(ii) insulate the beaker / use a plastic beaker / use a lid; 1 4(g) smaller percentage uncertainty / smaller error; 1
Q5 · A student determines the density of the material from which a metre rule is made
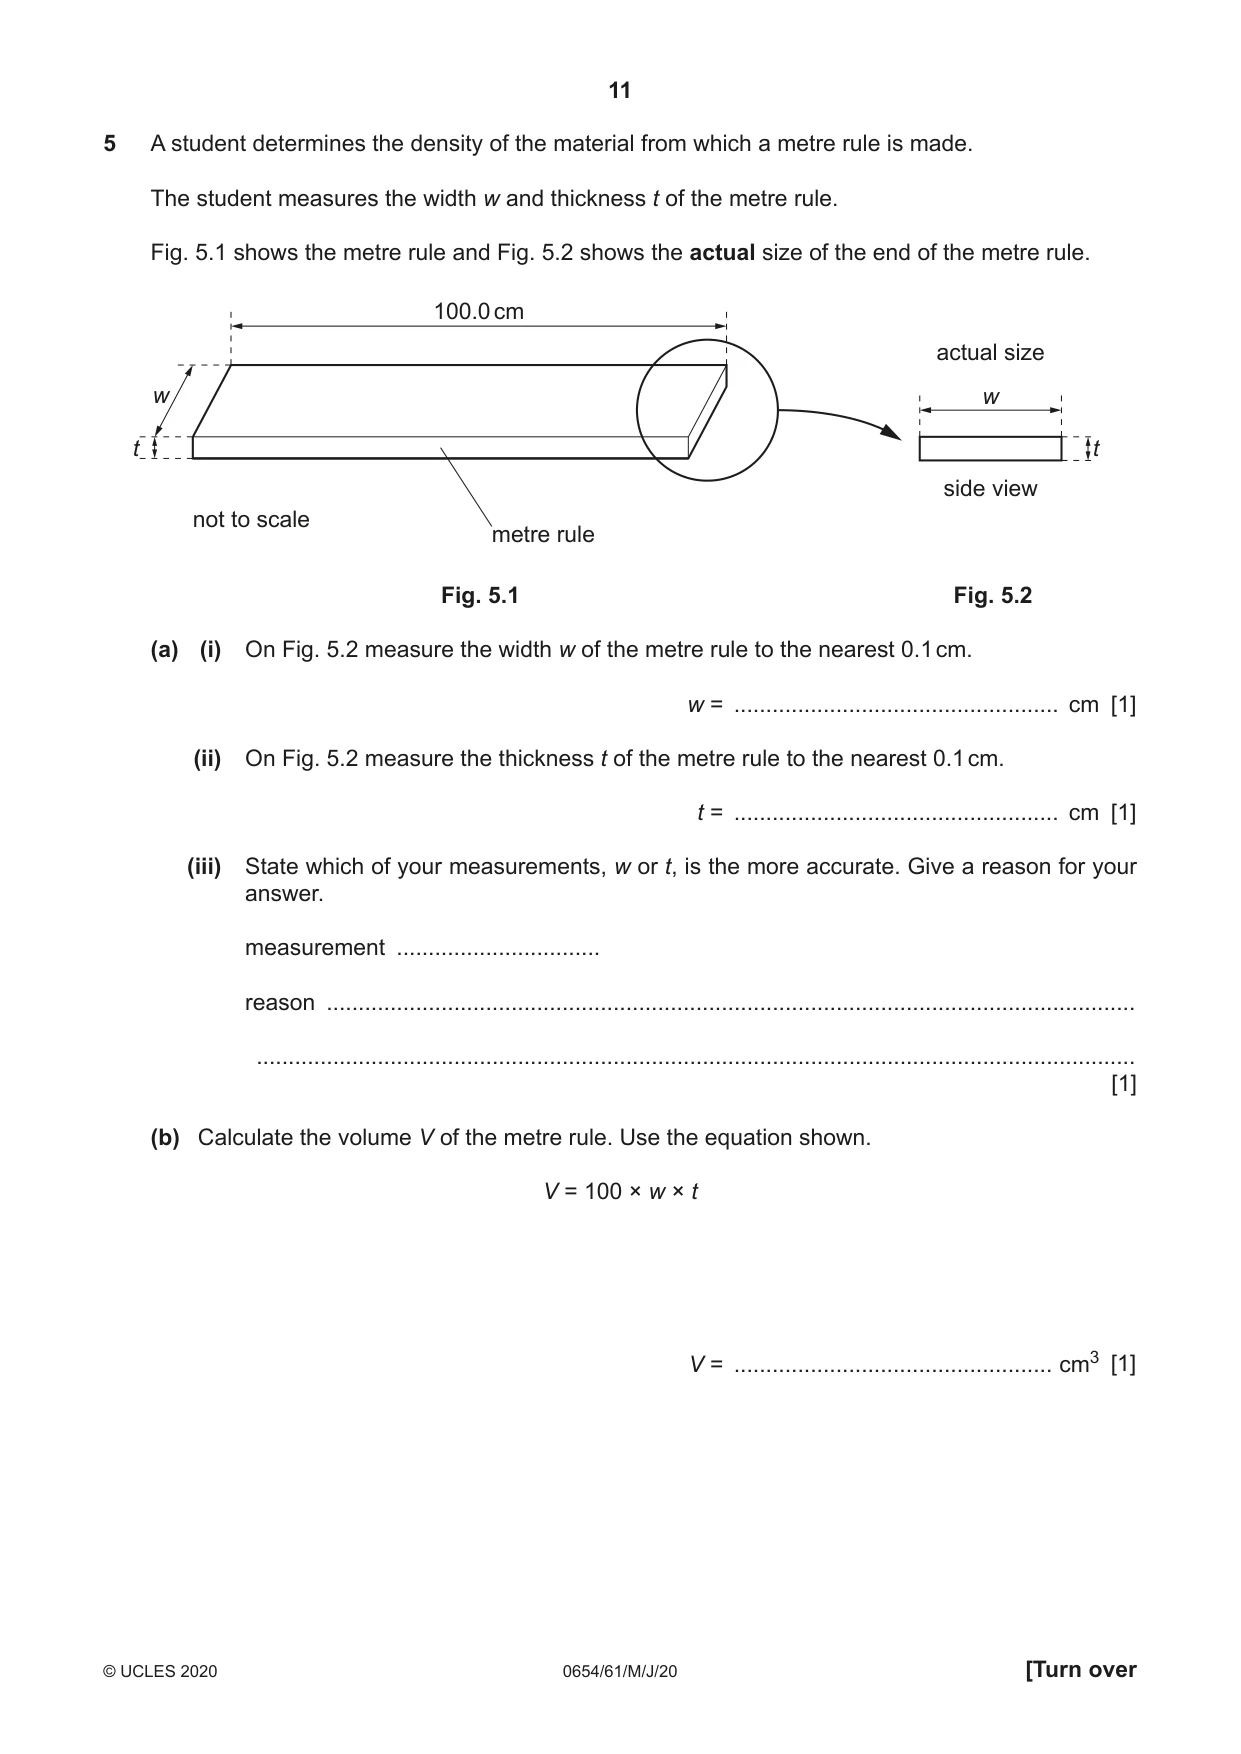
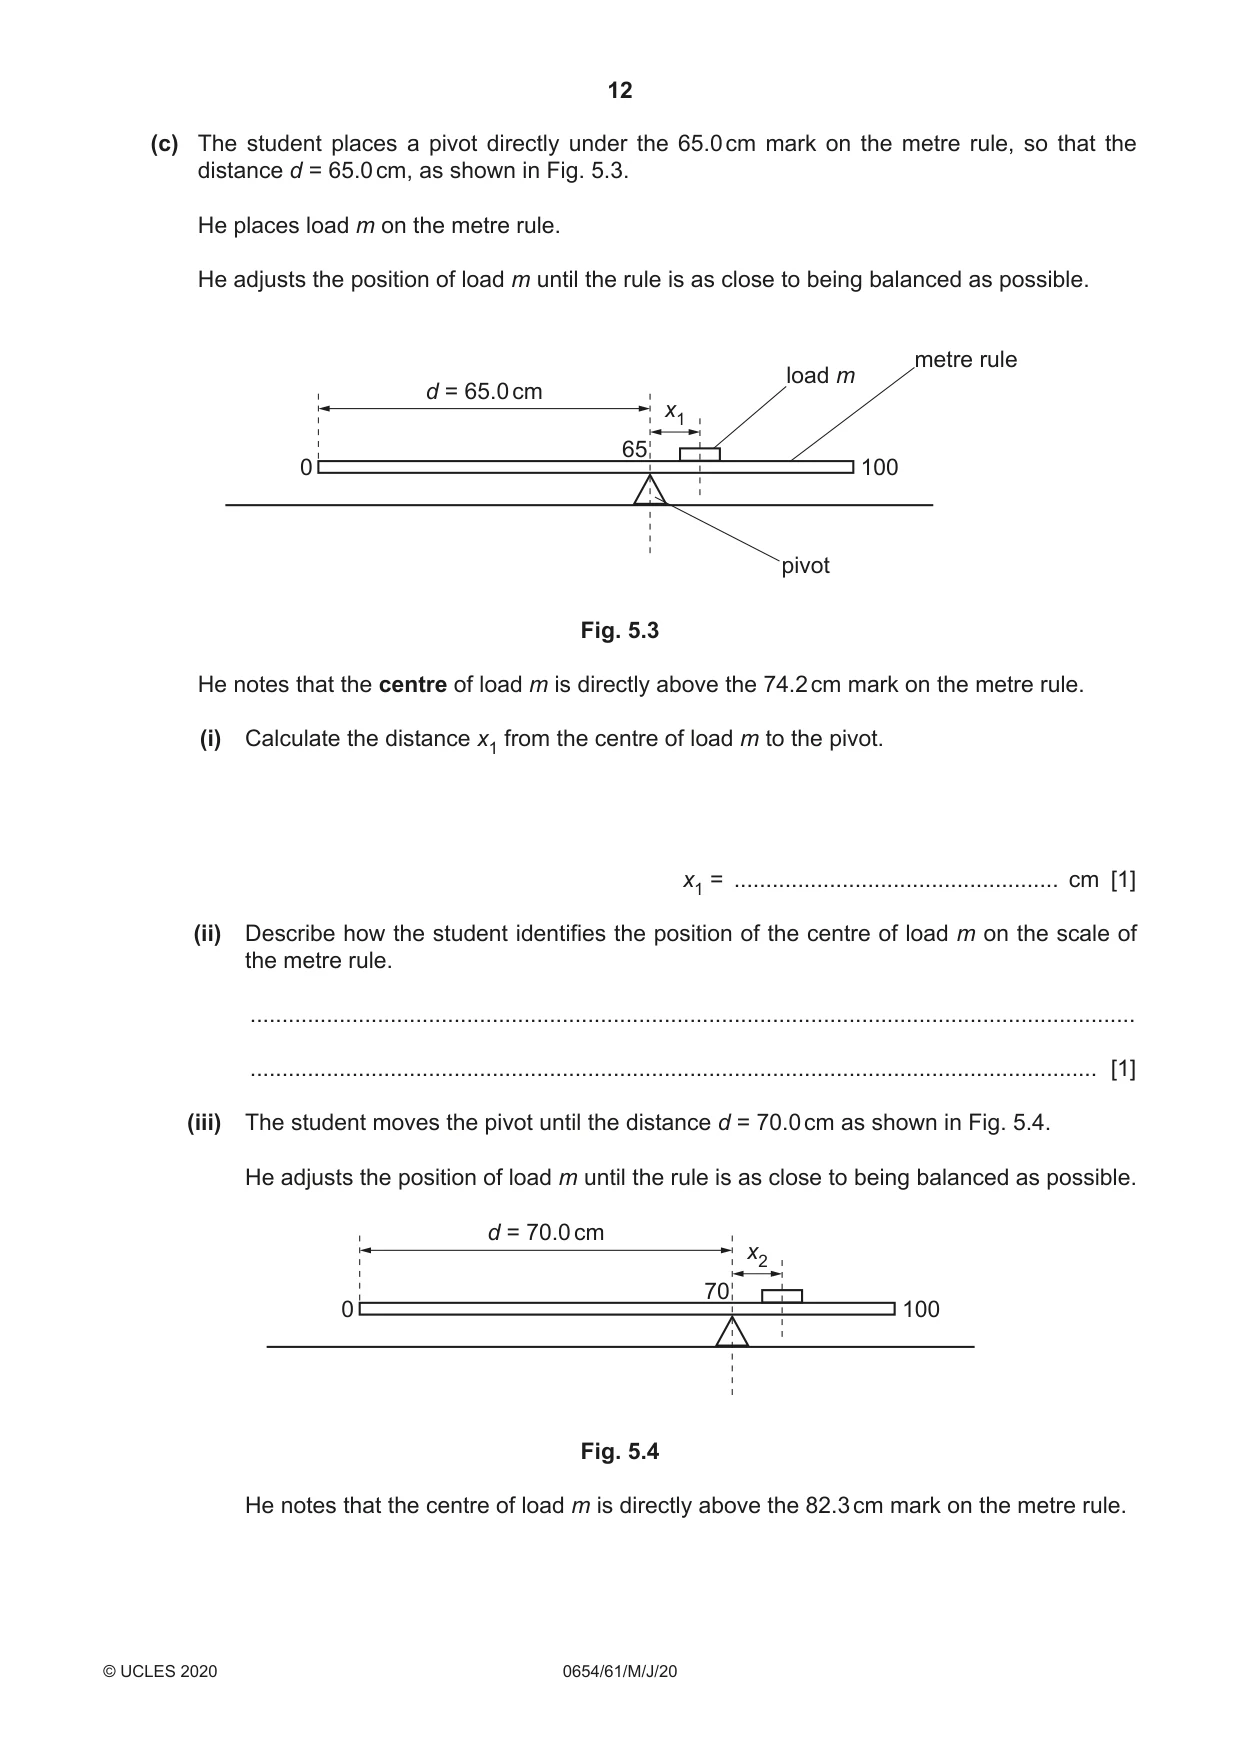
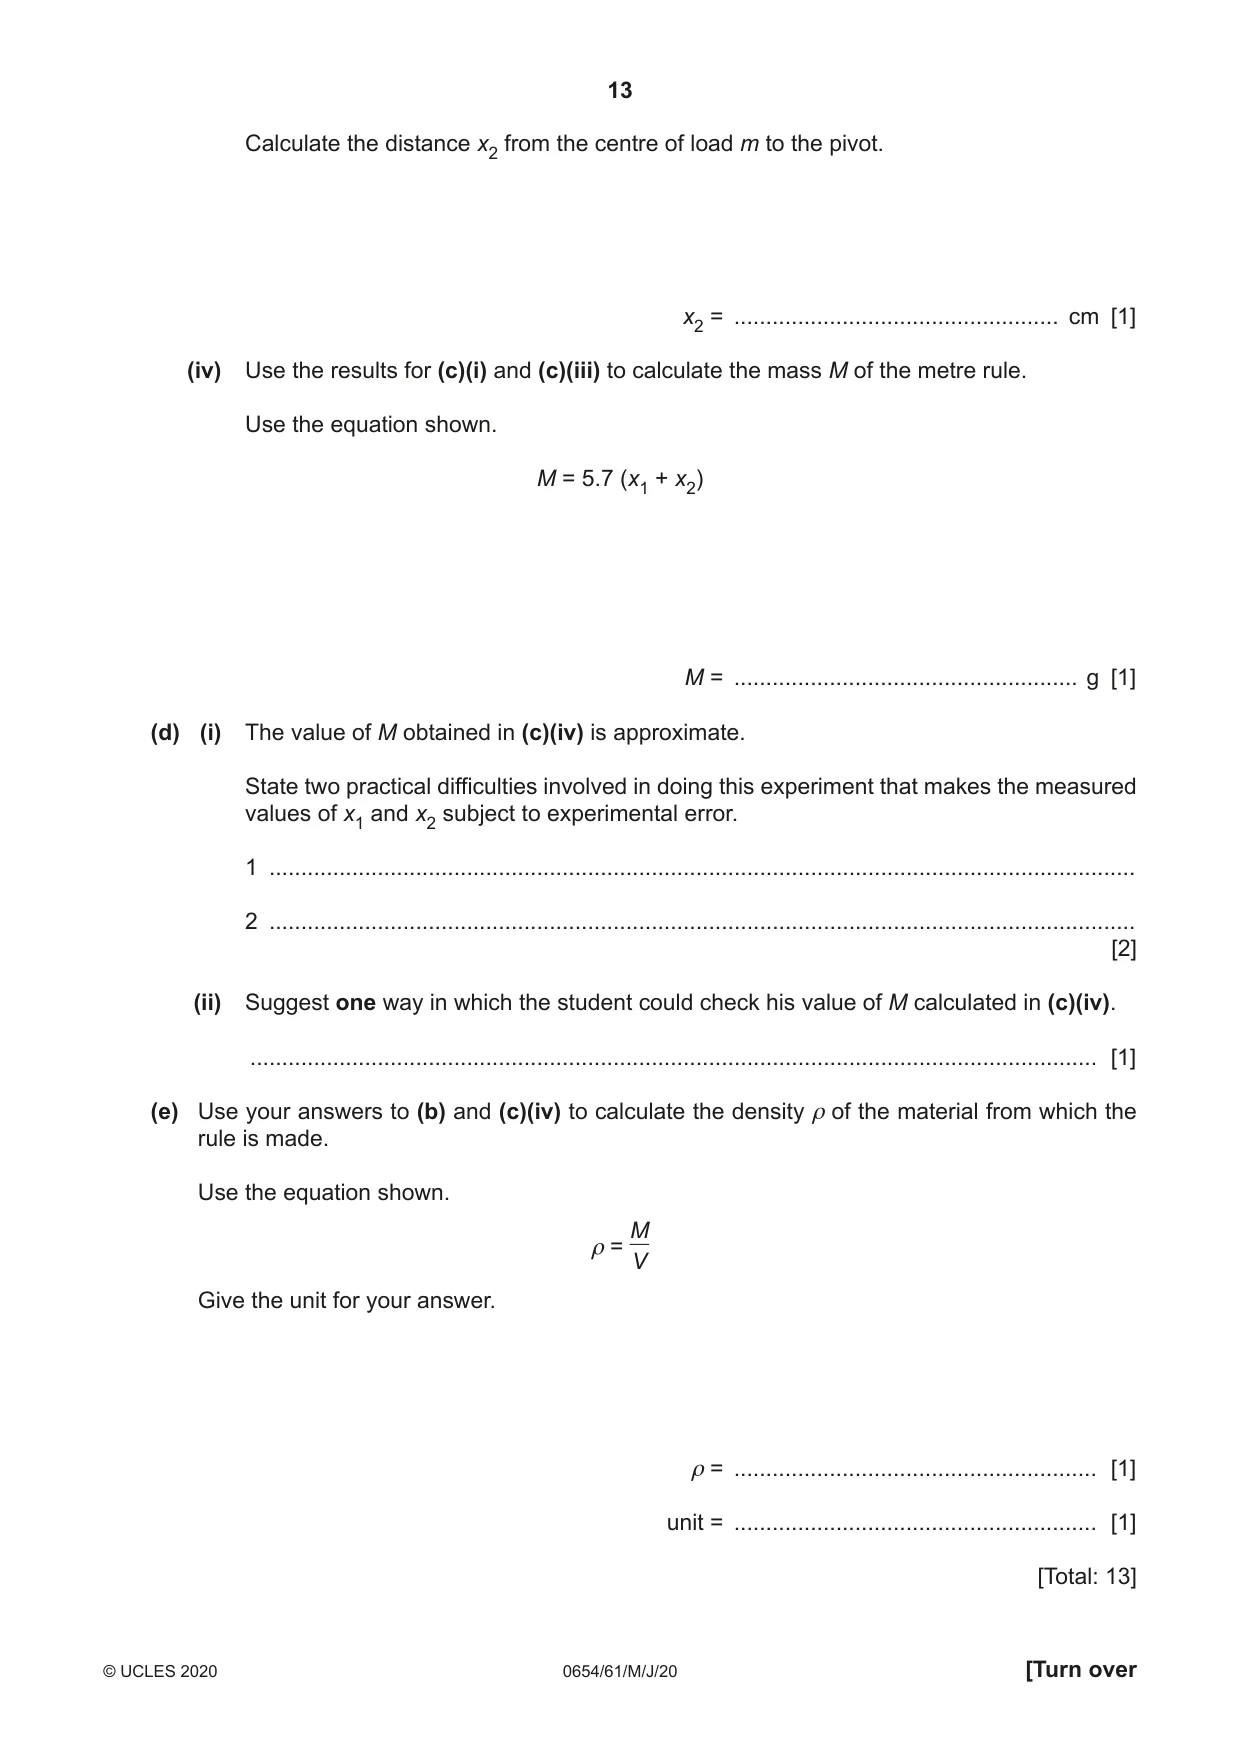
5 A student determines the density of the material from which a metre rule is made. The student measures the width w and thickness t of the metre rule. Fig. 5.1 shows the metre rule and Fig. 5.2 shows the actual size of the end of the metre rule. 100.0 cm actual size w w t t side view not to scale metre rule Fig. 5.1 Fig. 5.2 (a) (i) On Fig. 5.2 measure the width w of the metre rule to the nearest 0.1 cm. w = ................................................... cm [1] (ii) On Fig. 5.2 measure the thickness t of the metre rule to the nearest 0.1 cm. t = ................................................... cm [1] (iii) State which of your measurements, w or t, is the more accurate. Give a reason for your answer. measurement ................................ reason ............................................................................................................................... .......................................................................................................................................... [1] (b) Calculate the volume V of the metre rule. Use the equation shown. V = 100 × w × t V = .................................................. cm3 [1] (c) The student places a pivot directly under the 65.0 cm mark on the metre rule, so that the distance d = 65.0 cm, as shown in Fig. 5.3. He places load m on the metre rule. He adjusts the position of load m until the rule is as close to being balanced as possible. metre rule load m d = 65.0 cm x1 65 0 100 pivot Fig. 5.3 He notes that the centre of load m is directly above the 74.2 cm mark on the metre rule. (i) Calculate the distance x1 from the centre of load m to the pivot. x1 = ................................................... cm [1] (ii) Describe how the student identifies the position of the centre of load m on the scale of the metre rule. ........................................................................................................................................... ..................................................................................................................................... [1] (iii) The student moves the pivot until the distance d = 70.0 cm as shown in Fig. 5.4. He adjusts the position of load m until the rule is as close to being balanced as possible. d = 70.0 cm x2 70 0 100 Fig. 5.4 He notes that the centre of load m is directly above the 82.3 cm mark on the metre rule. Calculate the distance x2 from the centre of load m to the pivot. x2 = ................................................... cm [1] (iv) Use the results for (c)(i) and (c)(iii) to calculate the mass M of the metre rule. Use the equation shown. M = 5.7 (x1 + x2) M = ...................................................... g [1] (d) (i) The value of M obtained in (c)(iv) is approximate. State two practical difficulties involved in doing this experiment that makes the measured values of x1 and x2 subject to experimental error. 1 ........................................................................................................................................ 2 ........................................................................................................................................ [2] (ii) Suggest one way in which the student could check his value of M calculated in (c)(iv). ..................................................................................................................................... [1] (e) Use your answers to (b) and (c)(iv) to calculate the density ρ of the material from which the rule is made. Use the equation shown. M ρ = V Give the unit for your answer. ρ = ......................................................... [1] unit = ......................................................... [1] [Total: 13]
Mark scheme: 5(a)(i) 2.4 cm; 1 5(a)(ii) 0.4 cm; 1 5(a)(iii) w and larger than t / t very small / rule measures to 1 mm so greater effect of error on smaller distance; 1 5(b) 96 (cm3) correctly rounded; 1 5(c)(i) x1 = 9.2 (cm); 1 5(c)(ii) note reading on either side of mass and find the mean value / AW; 1 5(c)(iii) x2 = 12.3 (cm); 1 5(c)(iv) M = 122.55 (g); 1 5(d)(i) difficulty in obtaining an exact balance; difficulty in placing the centre of the mass over the correct mark on the rule; 2 5(d)(ii) use a balance; 1 5(e) density correct from candidate’s values and rounded correctly; g/cm3; 2
More questions on Physical quantities and measurement techniques
Q6 · The rate of cooling of water in a beaker depends upon the volume of water in the beaker
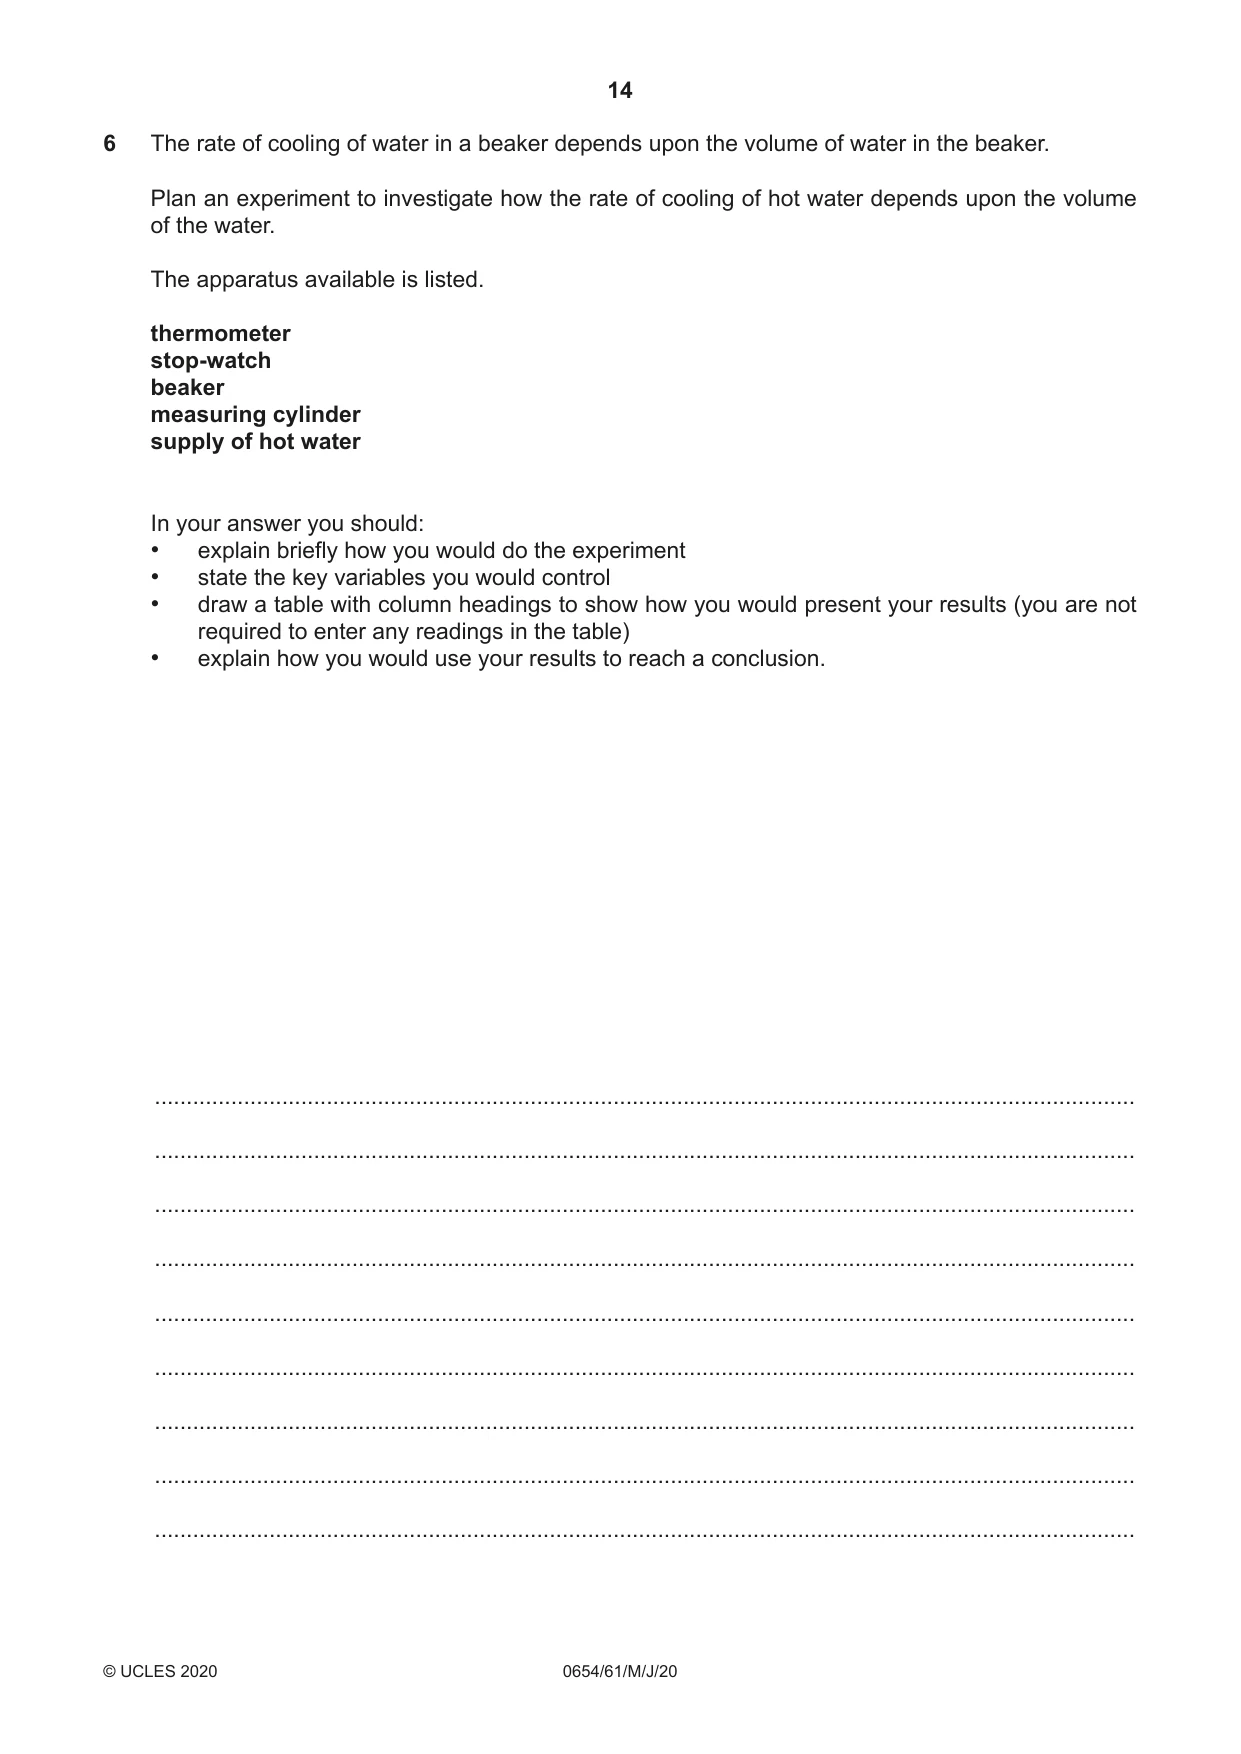
6 The rate of cooling of water in a beaker depends upon the volume of water in the beaker. Plan an experiment to investigate how the rate of cooling of hot water depends upon the volume of the water. The apparatus available is listed. thermometer stop-watch beaker measuring cylinder supply of hot water In your answer you should: • explain briefly how you would do the experiment • state the key variables you would control • draw a table with column headings to show how you would present your results (you are not required to enter any readings in the table) • explain how you would use your results to reach a conclusion. .......................................................................................................................................................... .......................................................................................................................................................... .......................................................................................................................................................... .......................................................................................................................................................... .......................................................................................................................................................... .......................................................................................................................................................... .......................................................................................................................................................... .......................................................................................................................................................... .......................................................................................................................................................... .......................................................................................................................................................... .......................................................................................................................................................... .......................................................................................................................................................... .......................................................................................................................................................... .................................................................................................................................................... [7] [Total: 7]
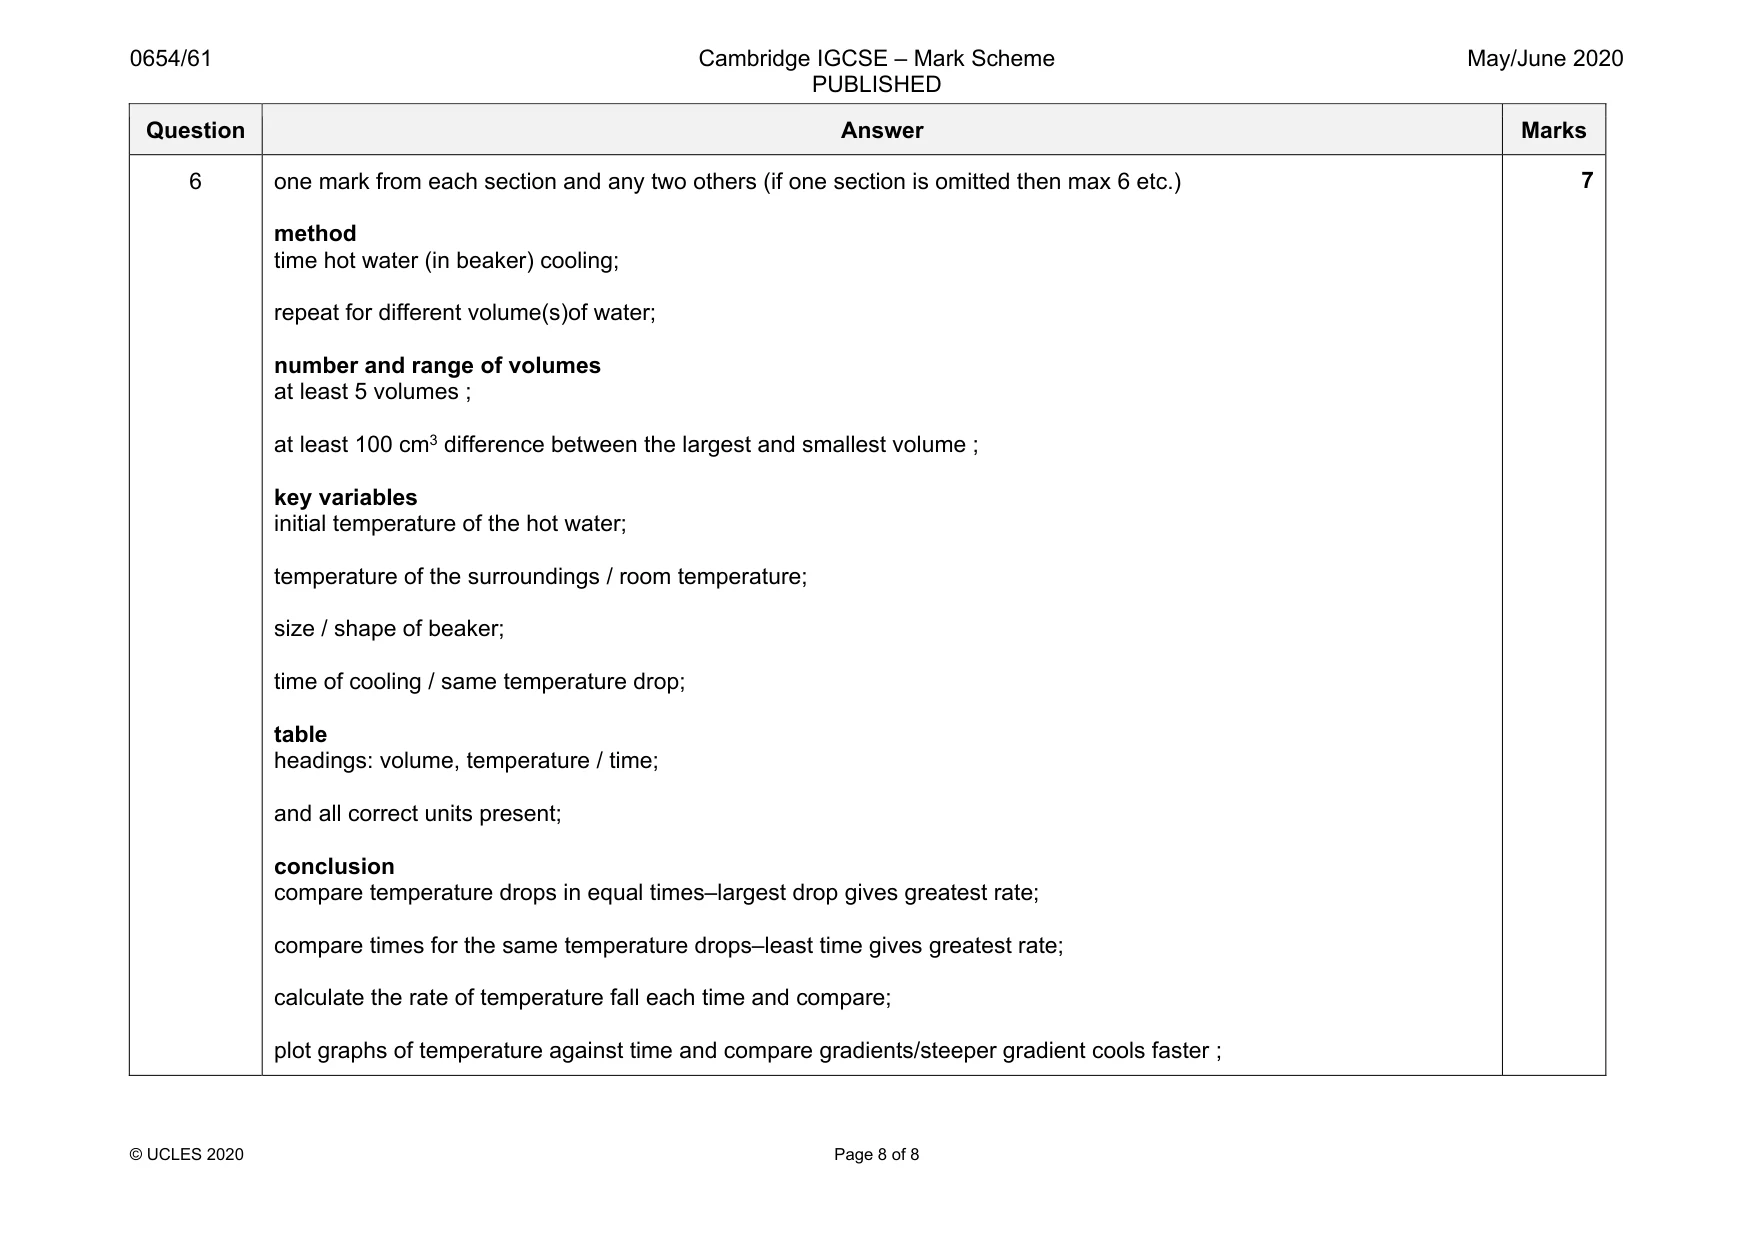
Mark scheme: 6 one mark from each section and any two others (if one section is omitted then max 6 etc.) method time hot water (in beaker) cooling; repeat for different volume(s)of water; number and range of volumes at least 5 volumes ; at least 100 cm3 difference between the largest and smallest volume ; key variables initial temperature of the hot water; temperature of the surroundings / room temperature; size / shape of beaker; time of cooling / same temperature drop; table headings: volume, temperature / time; and all correct units present; conclusion compare temperature drops in equal times–largest drop gives greatest rate; compare times for the same temperature drops–least time gives greatest rate; calculate the rate of temperature fall each time and compare; plot graphs of temperature against time and compare gradients/steeper gradient cools faster ;
What was in this paper
The subtopics covered by these 6 questions, and how many questions each got. Open one in a new tab to see every Cambridge question on it.