Cambridge IGCSE Sciences - Co-ordinated (Double) 0654 — 2024 Feb/March Paper 6 · Variant 2
0654/62/F/M/24 · 6 questions · 60 marks · ≈68 min
The question paper and its mark scheme, free to read here and free to download. This is Cambridge’s own paper, exactly as it was sat.
Question paper20 pages


Mark scheme9 pages
Answers below. Sit the paper first if you are practising.
Questions as text
Q1 · A student investigates the effect of catalase on the breakdown of hydrogen peroxide
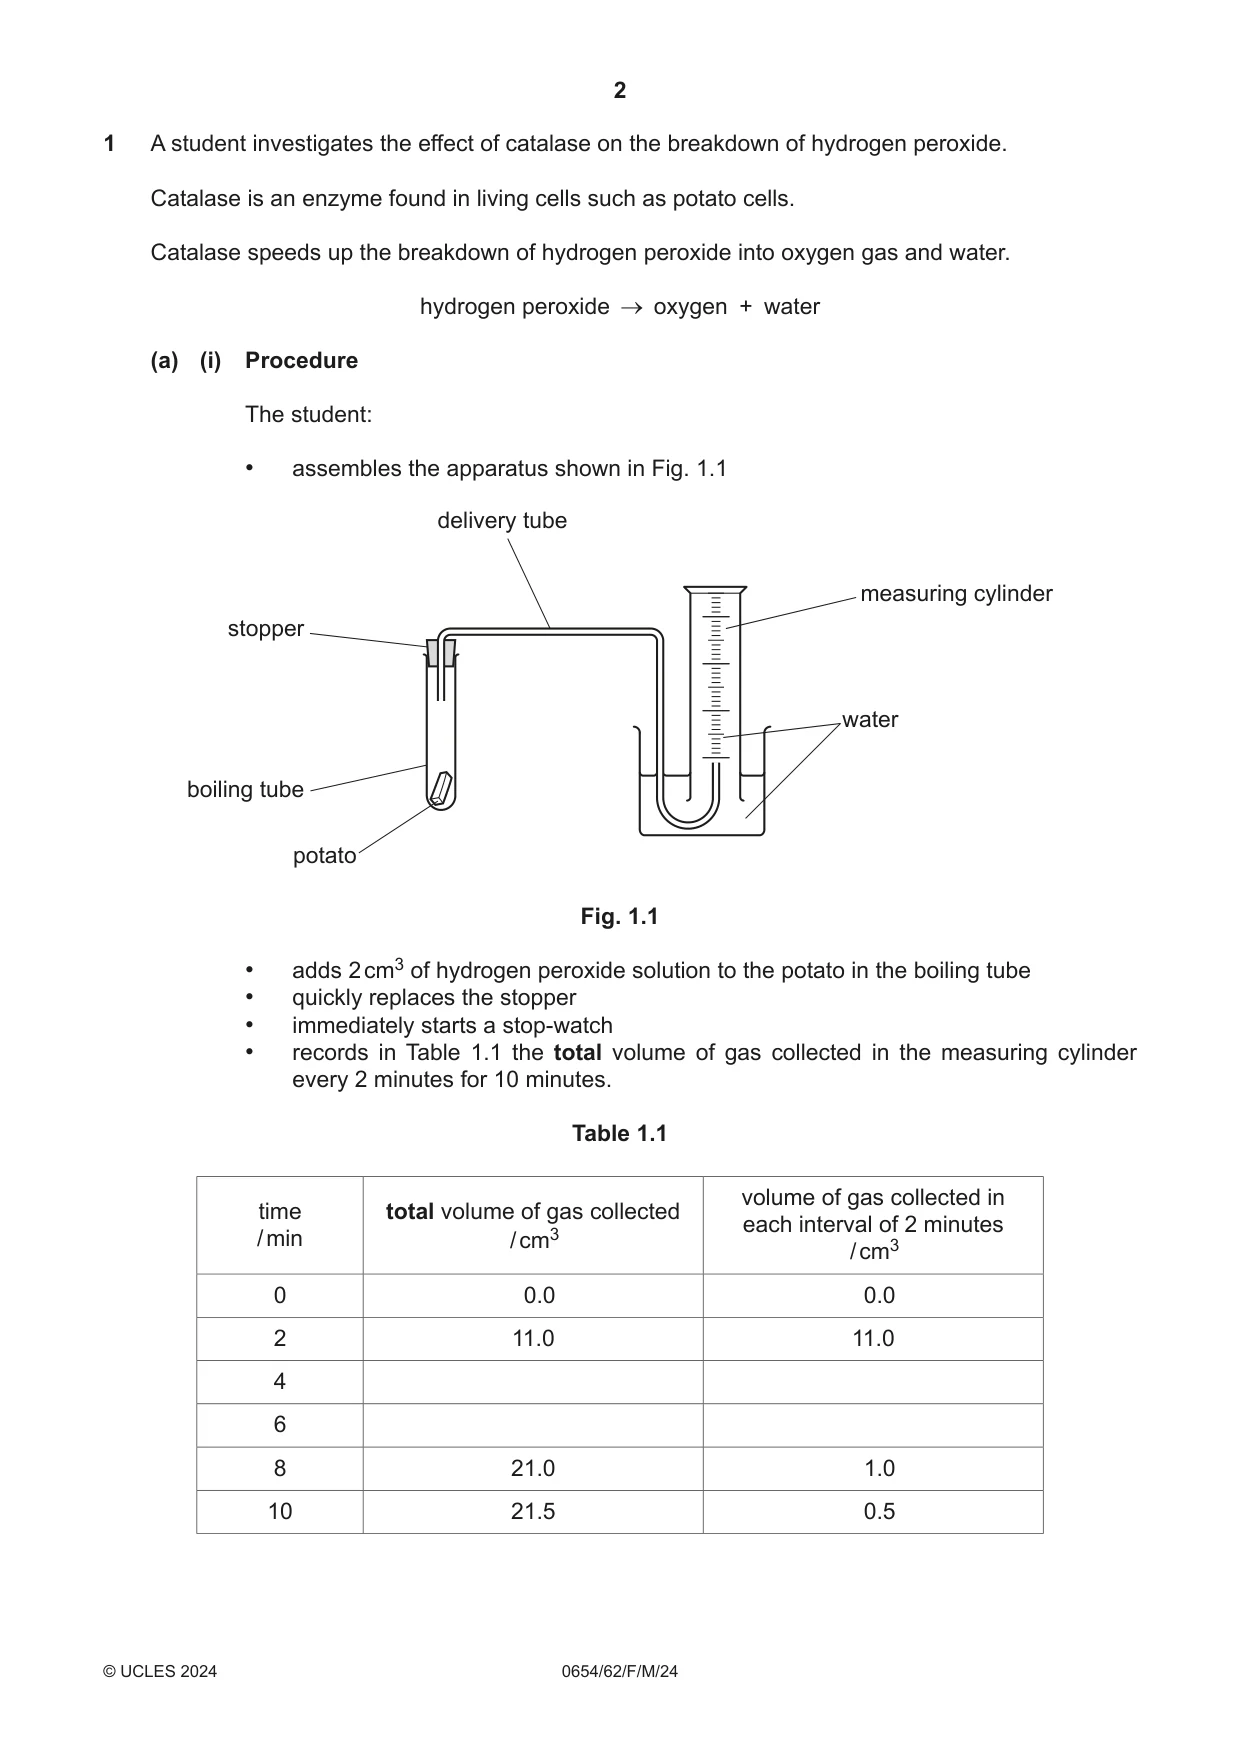
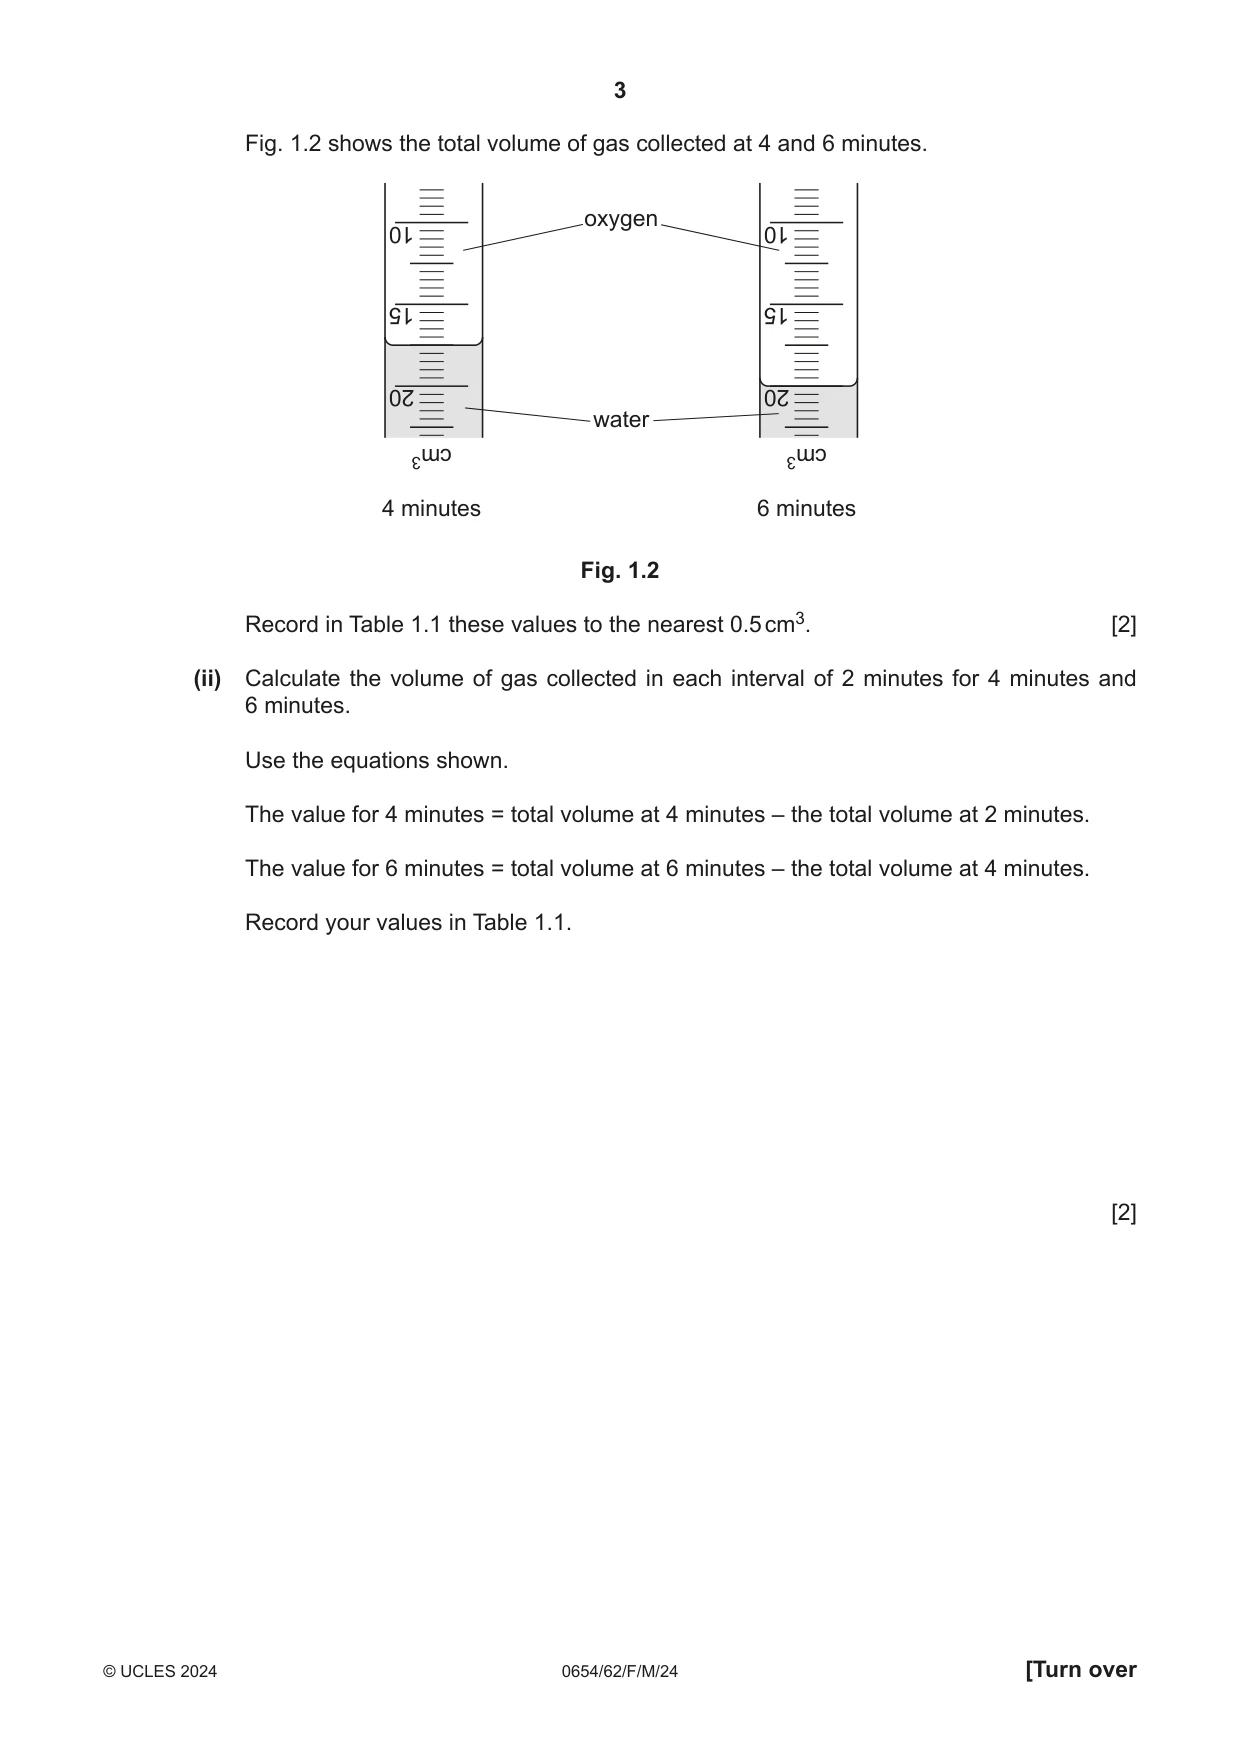
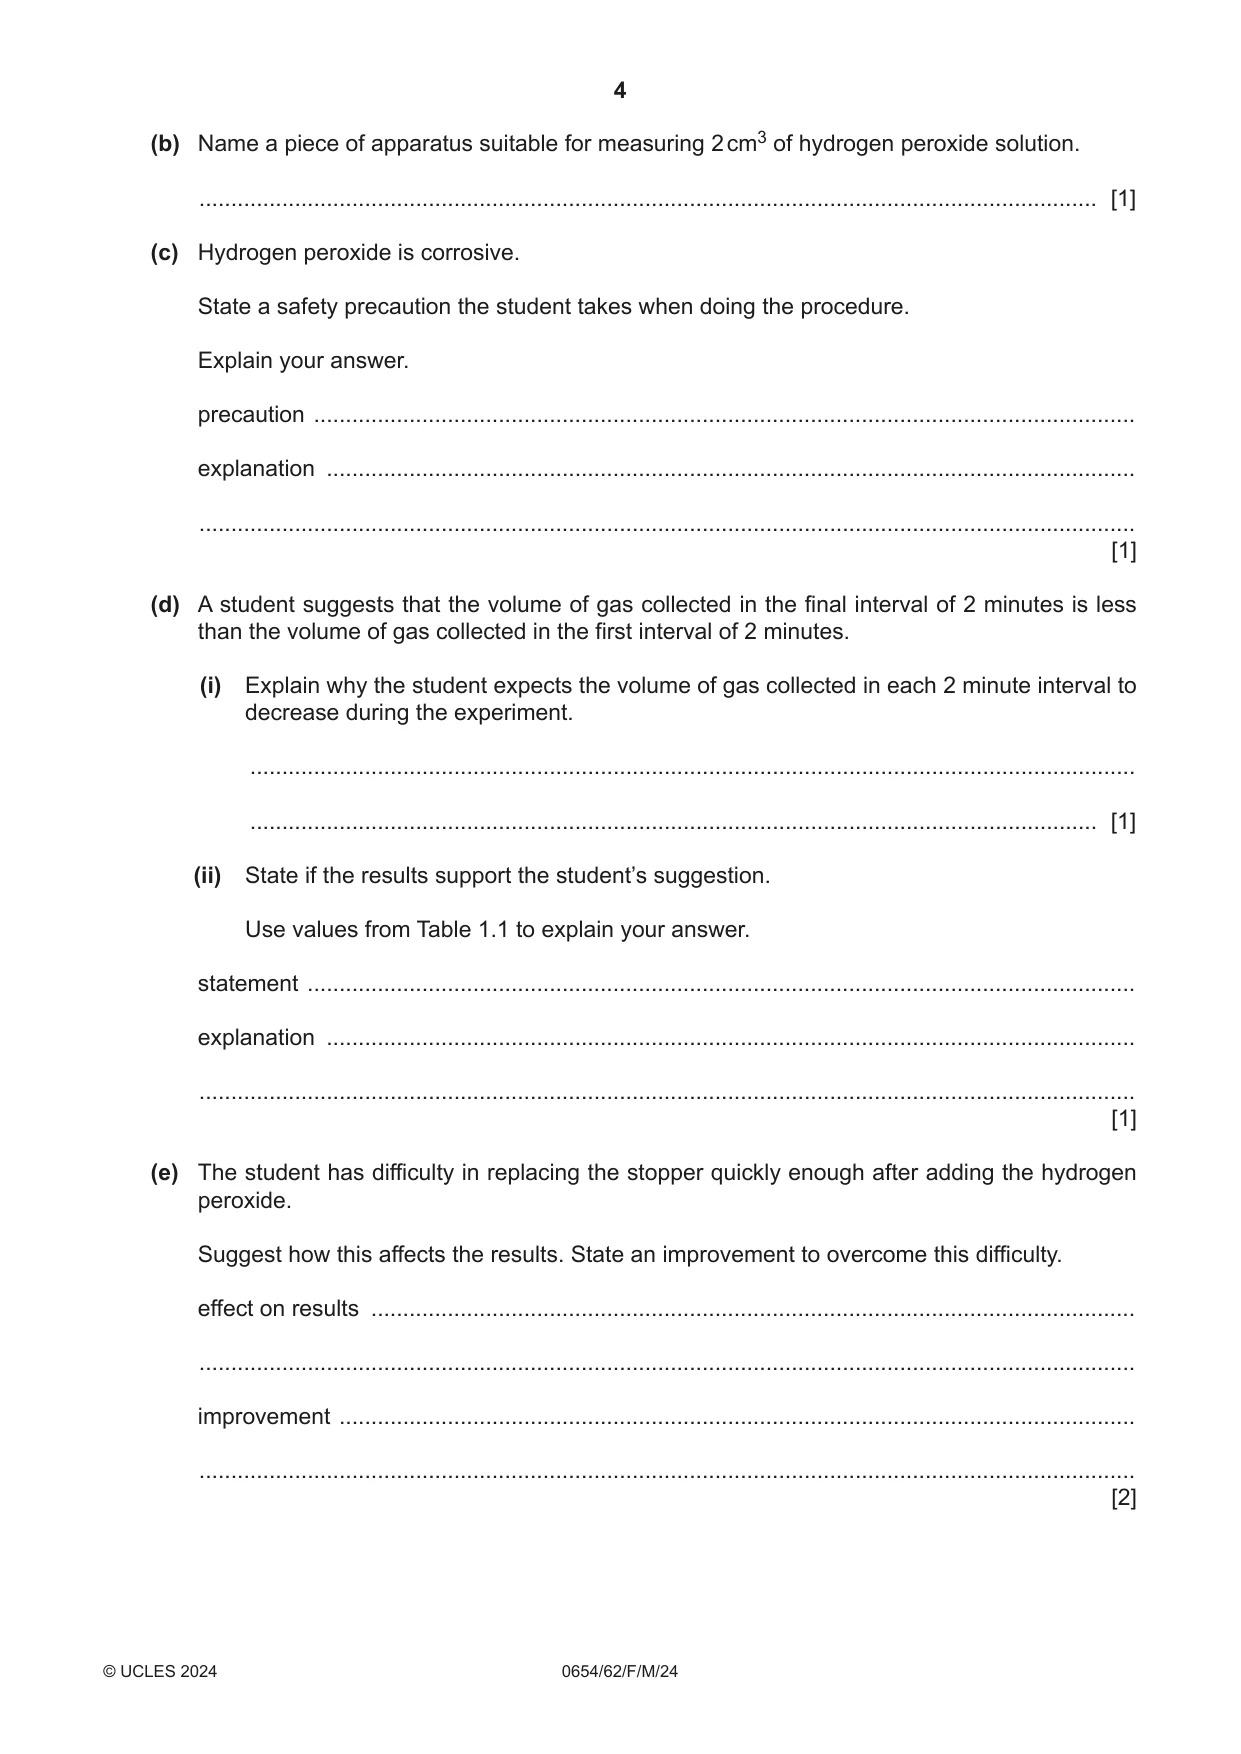
1 A student investigates the effect of catalase on the breakdown of hydrogen peroxide. Catalase is an enzyme found in living cells such as potato cells. Catalase speeds up the breakdown of hydrogen peroxide into oxygen gas and water. hydrogen peroxide oxygen + water (a) (i) Procedure The student: • assembles the apparatus shown in Fig. 1.1 delivery tube measuring cylinder stopper water boiling tube potato Fig. 1.1 • adds 2 cm3 of hydrogen peroxide solution to the potato in the boiling tube • quickly replaces the stopper • immediately starts a stop-watch • records in Table 1.1 the total volume of gas collected in the measuring cylinder every 2 minutes for 10 minutes. Table 1.1 volume of gas collected in time total volume of gas collected each interval of 2 minutes / min / cm3 / cm3 0 0.0 0.0 2 11.0 11.0 4 6 8 21.0 1.0 10 21.5 0.5 Fig. 1.2 shows the total volume of gas collected at 4 and 6 minutes. oxygen 10 10 15 15 20 20 water cm3 cm3 4 minutes 6 minutes Fig. 1.2 Record in Table 1.1 these values to the nearest 0.5 cm3. [2] (ii) Calculate the volume of gas collected in each interval of 2 minutes for 4 minutes and 6 minutes. Use the equations shown. The value for 4 minutes = total volume at 4 minutes – the total volume at 2 minutes. The value for 6 minutes = total volume at 6 minutes – the total volume at 4 minutes. Record your values in Table 1.1. [2] (b) Name a piece of apparatus suitable for measuring 2 cm3 of hydrogen peroxide solution. ............................................................................................................................................. [1] (c) Hydrogen peroxide is corrosive. State a safety precaution the student takes when doing the procedure. Explain your answer. precaution ................................................................................................................................. explanation ............................................................................................................................... ................................................................................................................................................... [1] (d) A student suggests that the volume of gas collected in the final interval of 2 minutes is less than the volume of gas collected in the first interval of 2 minutes. (i) Explain why the student expects the volume of gas collected in each 2 minute interval to decrease during the experiment. ........................................................................................................................................... ..................................................................................................................................... [1] (ii) State if the results support the student’s suggestion. Use values from Table 1.1 to explain your answer. statement .................................................................................................................................. explanation ............................................................................................................................... ................................................................................................................................................... [1] (e) The student has difficulty in replacing the stopper quickly enough after adding the hydrogen peroxide. Suggest how this affects the results. State an improvement to overcome this difficulty. effect on results ........................................................................................................................ ................................................................................................................................................... improvement ............................................................................................................................. ................................................................................................................................................... [2] (f) Explain why repeating the procedure increases confidence in the results. ................................................................................................................................................... ............................................................................................................................................. [1] (g) Describe a test to confirm the gas collected is oxygen. State the observation for a positive result. test ............................................................................................................................................ observation ............................................................................................................................... ................................................................................................................................................... [2] [Total: 13]
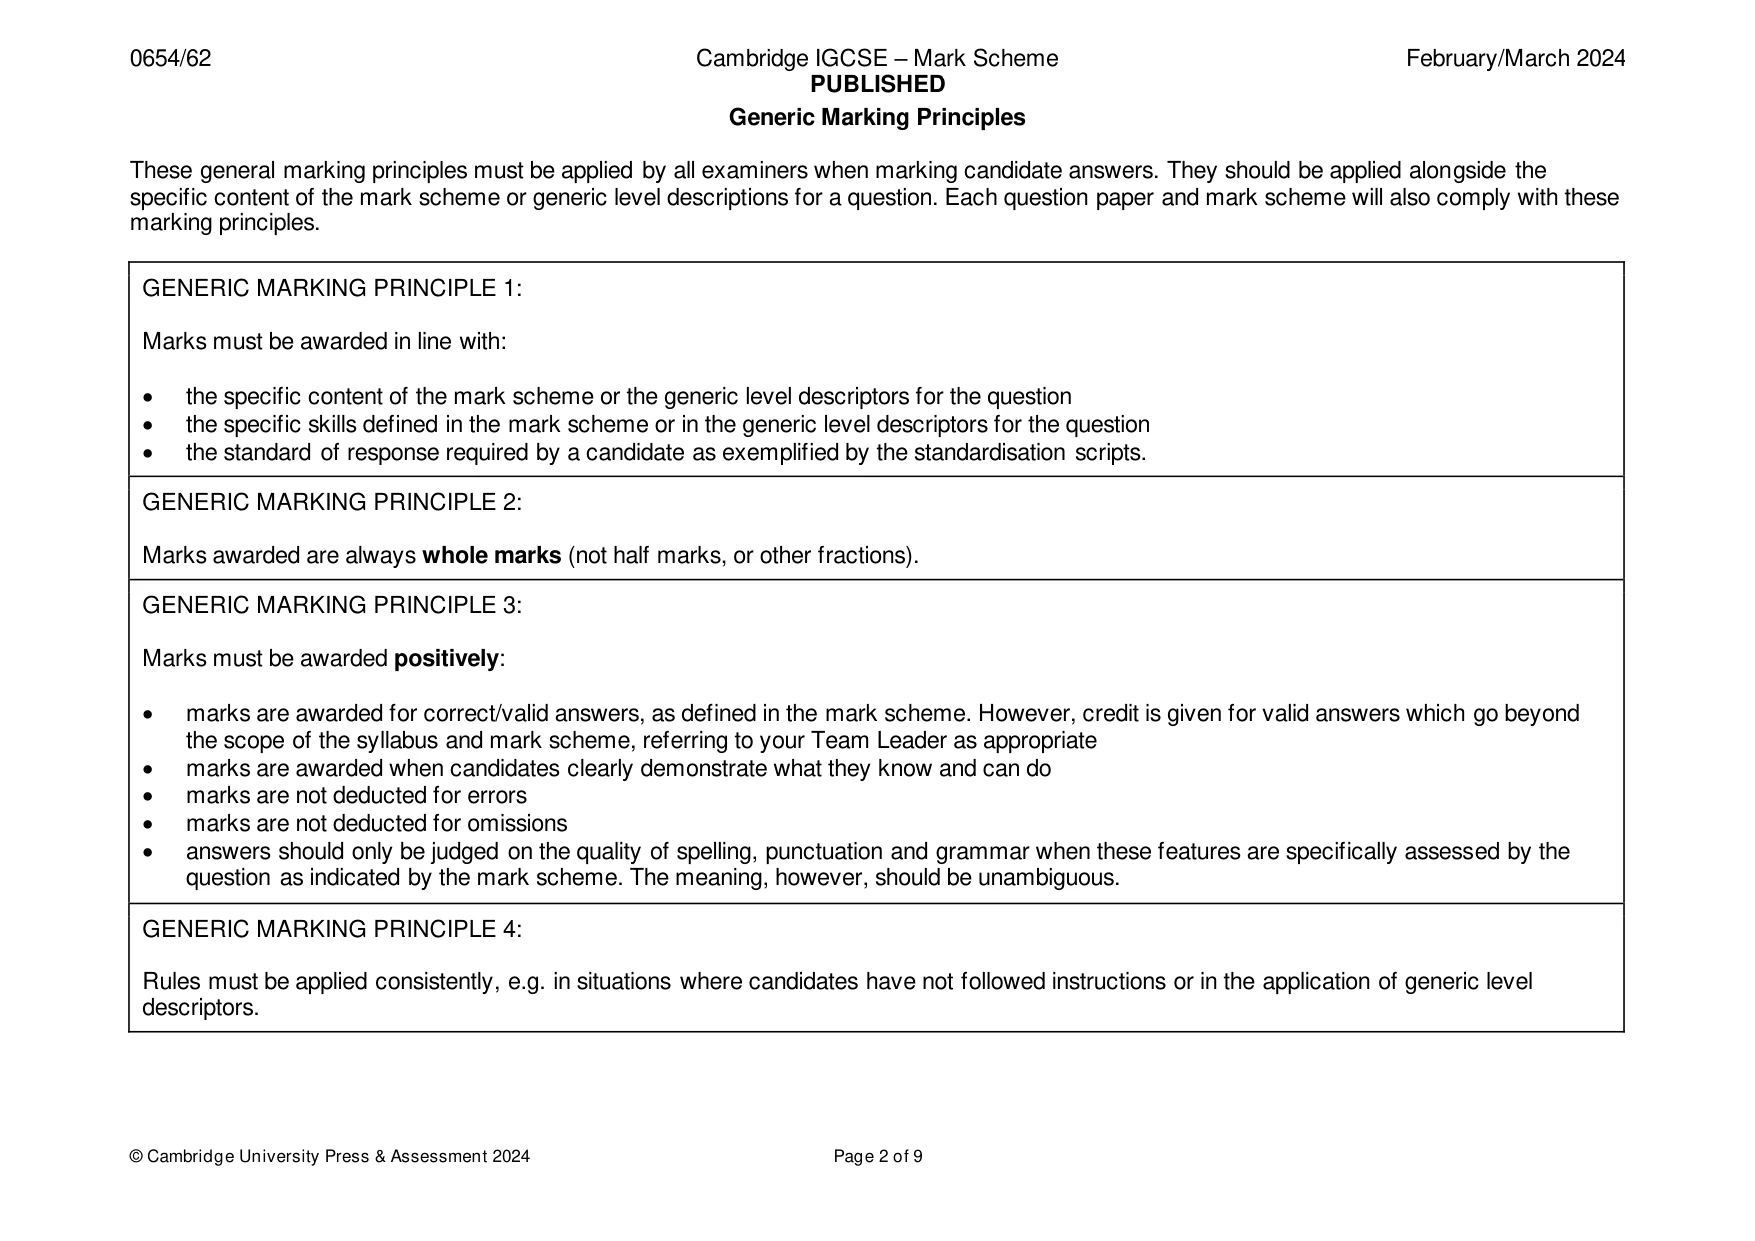
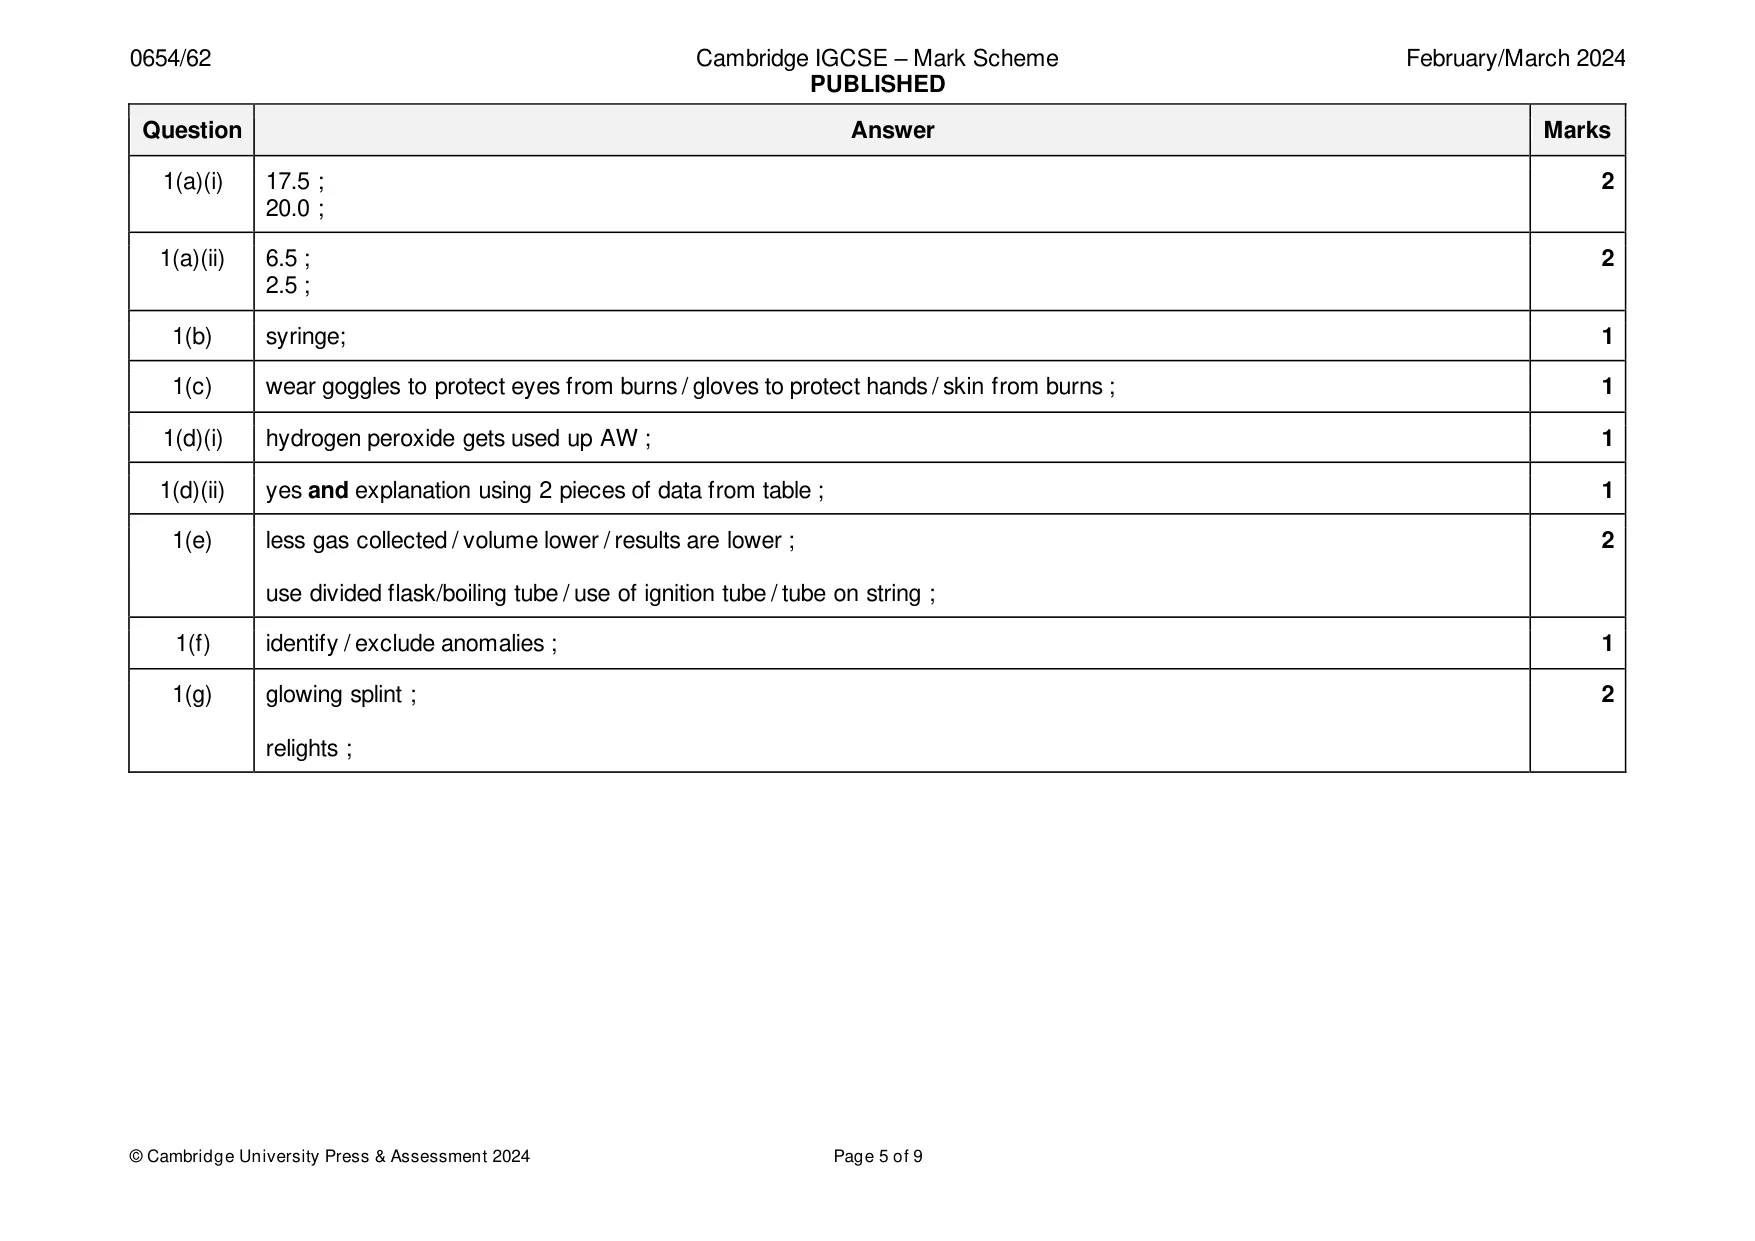
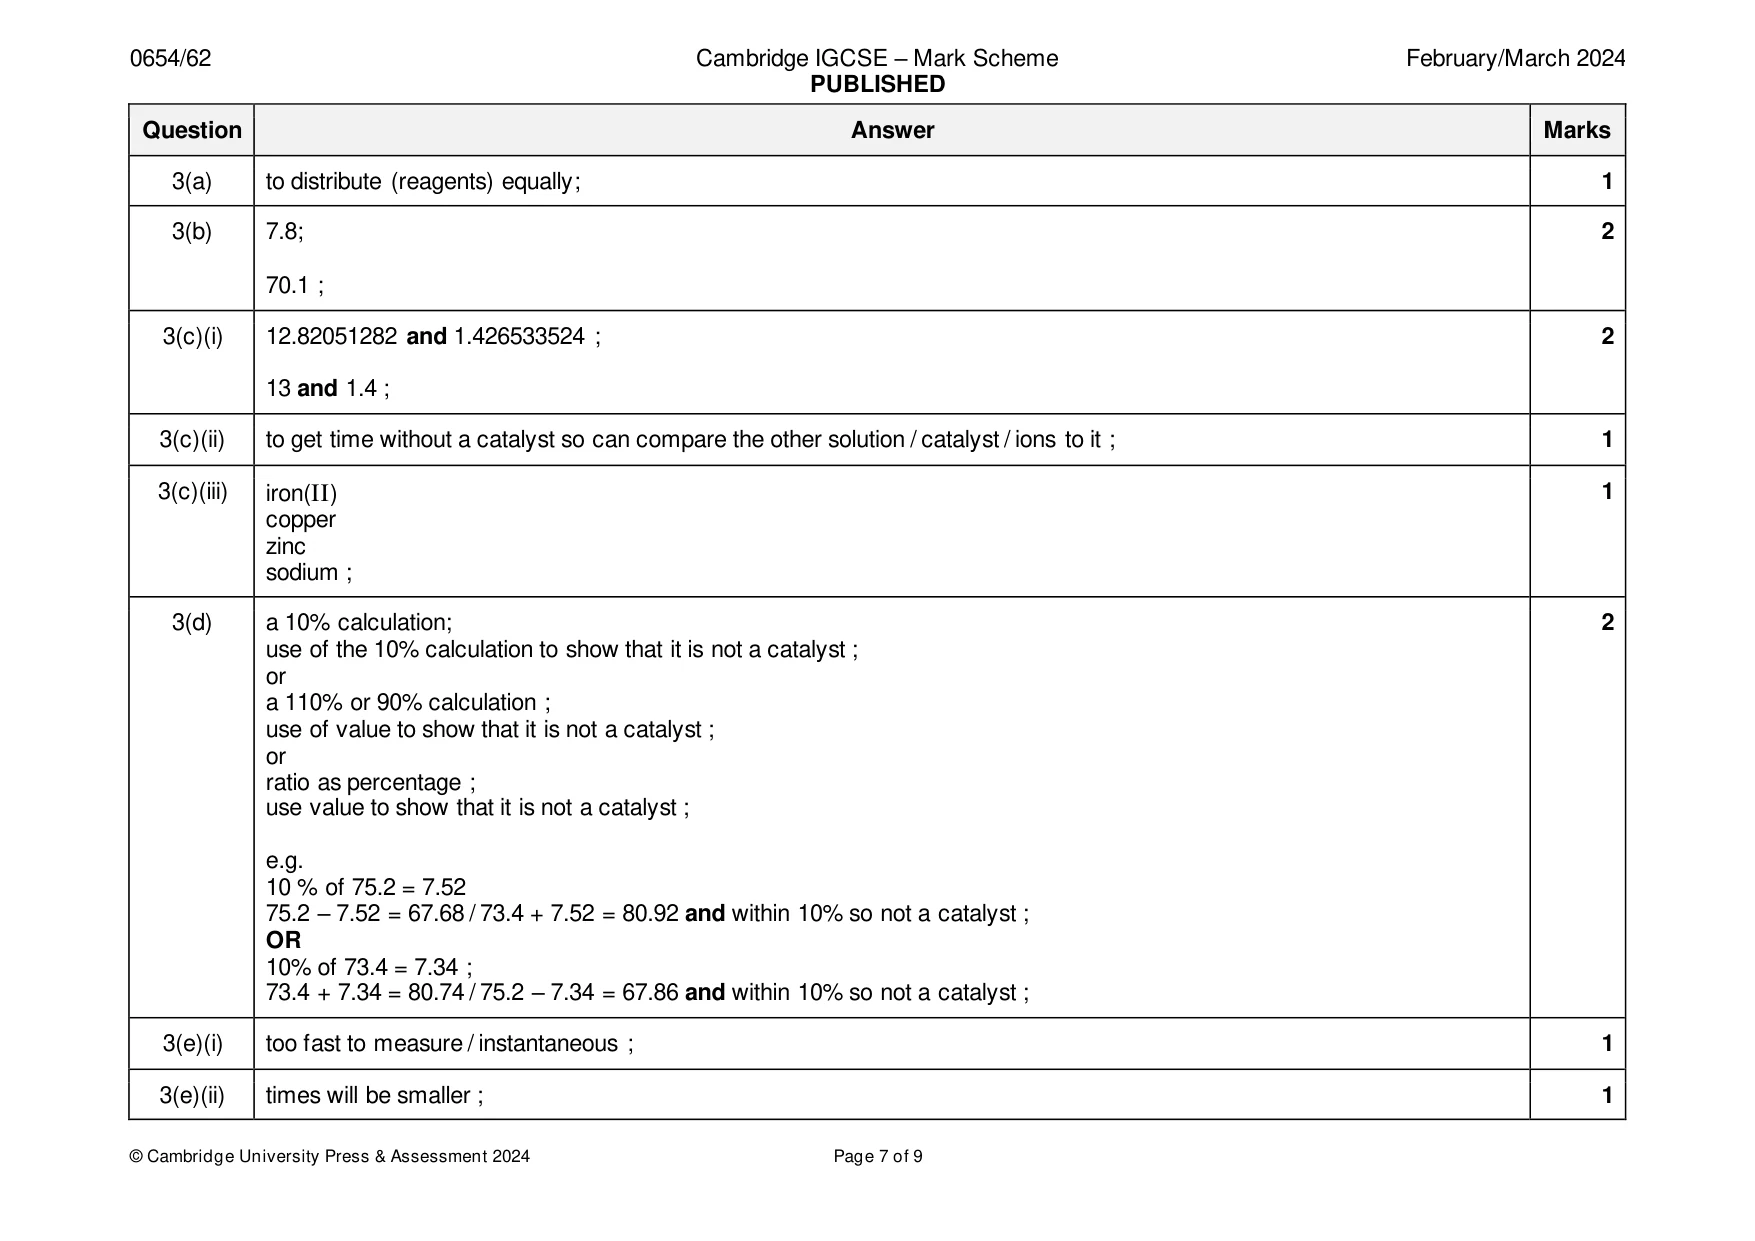
Mark scheme: Question Answer Marks 1(a)(i) 17.5 ; 2 20.0 ; 1(a)(ii) 6.5 ; 2 2.5 ; 1(b) syringe; 1 1(c) wear goggles to protect eyes from burns / gloves to protect hands / skin from burns ; 1 1(d)(i) hydrogen peroxide gets used up AW ; 1 1(d)(ii) yes and explanation using 2 pieces of data from table ; 1 1(e) less gas collected / volume lower / results are lower ; 2 use divided flask/boiling tube / use of ignition tube / tube on string ; 1(f) identify / exclude anomalies ; 1 1(g) glowing splint ; 2 relights ;
Q2 · Fertilisers contain nutrients that are added to crops to help them grow
2 Fertilisers contain nutrients that are added to crops to help them grow. A farmer has a choice of three fertilisers, A, B and C for use on his rice crop. Plan an investigation to find out which fertiliser produces the highest rate of growth of the rice plants. You are provided with: • rice plant seedlings • fertilisers A, B and C. You may also use any common laboratory apparatus. Include in your plan: • the apparatus needed • a brief description of the method • the measurements you will make • the variables you will control • how you will process your results to draw a conclusion. You may include a results table if you wish, you are not required to enter any readings in the table. You may include a labelled diagram if you wish. .......................................................................................................................................................... .......................................................................................................................................................... .......................................................................................................................................................... .......................................................................................................................................................... .......................................................................................................................................................... .......................................................................................................................................................... .......................................................................................................................................................... .......................................................................................................................................................... .......................................................................................................................................................... .......................................................................................................................................................... .......................................................................................................................................................... .......................................................................................................................................................... .......................................................................................................................................................... .......................................................................................................................................................... .......................................................................................................................................................... .......................................................................................................................................................... .......................................................................................................................................................... .......................................................................................................................................................... .......................................................................................................................................................... .......................................................................................................................................................... .......................................................................................................................................................... .......................................................................................................................................................... .......................................................................................................................................................... .......................................................................................................................................................... .......................................................................................................................................................... .......................................................................................................................................................... .......................................................................................................................................................... .................................................................................................................................................... [7]
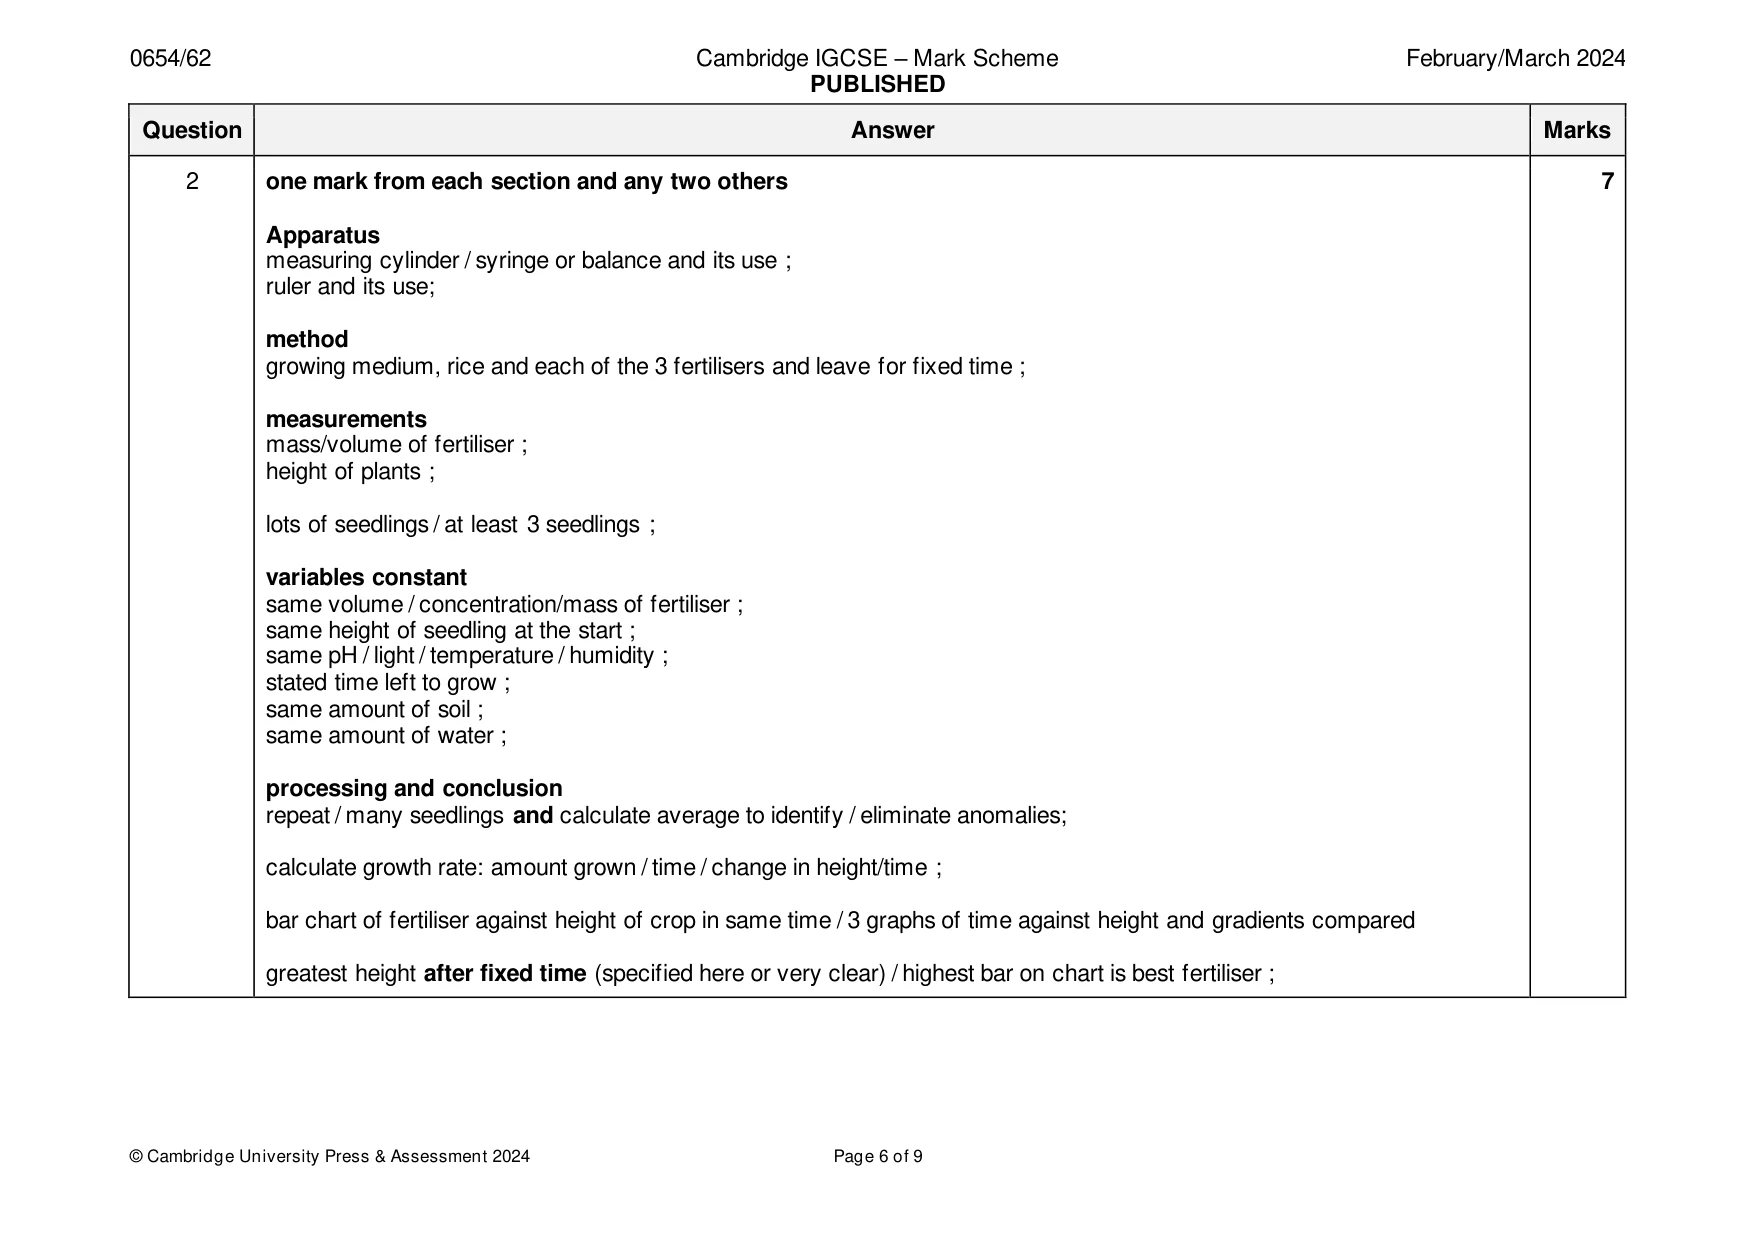
Mark scheme: 2 one mark from each section and any two others 7 Apparatus measuring cylinder / syringe or balance and its use ; ruler and its use; method growing medium, rice and each of the 3 fertilisers and leave for fixed time ; measurements mass/volume of fertiliser ; height of plants ; lots of seedlings / at least 3 seedlings ; variables constant same volume / concentration/mass of fertiliser ; same height of seedling at the start ; same pH / light / temperature / humidity ; stated time left to grow ; same amount of soil ; same amount of water ; processing and conclusion repeat / many seedlings and calculate average to identify / eliminate anomalies; calculate growth rate: amount grown / time / change in height/time ; bar chart of fertiliser against height of crop in same time / 3 graphs of time against height and gradients compared greatest height after fixed time (specified here or very clear) / highest bar on chart is best fertiliser ;
Q3 · A student investigates which metal ions catalyse a reaction
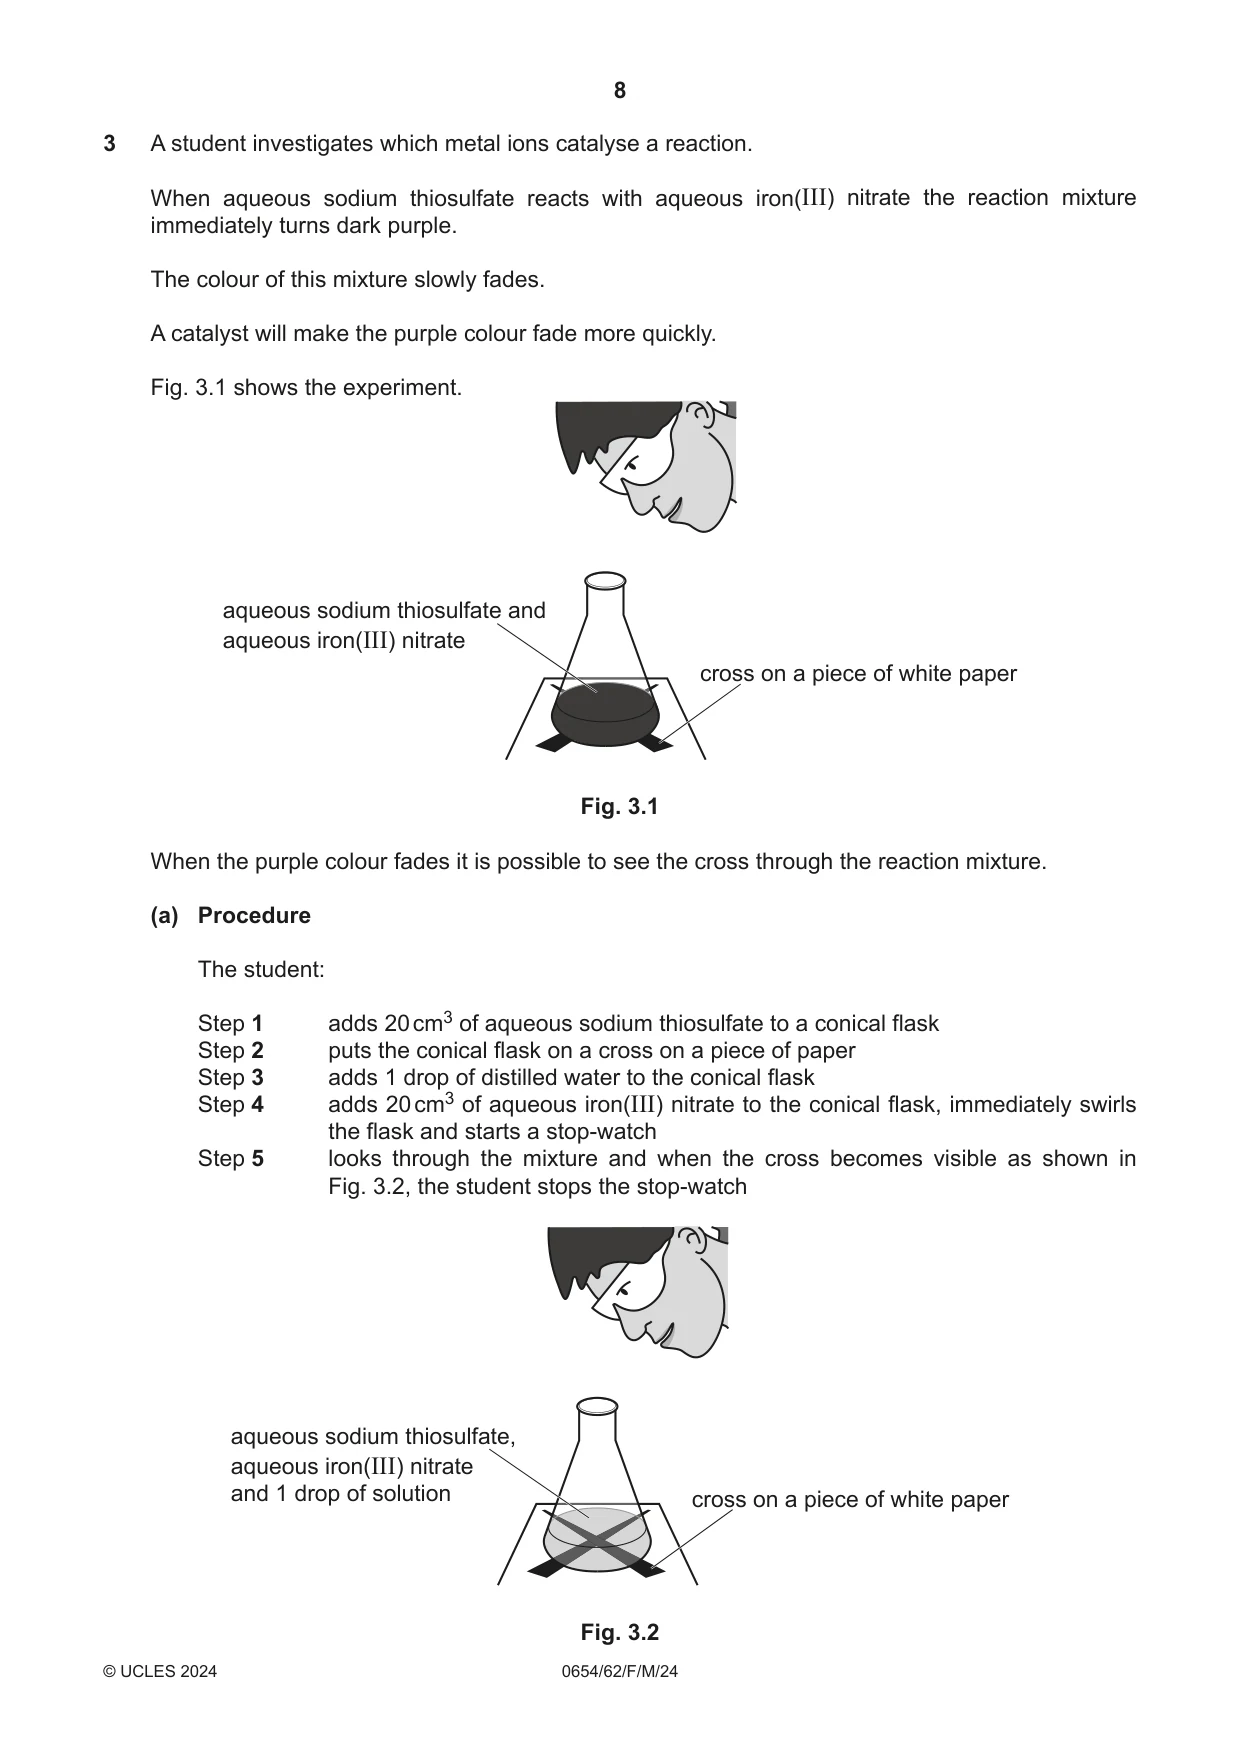
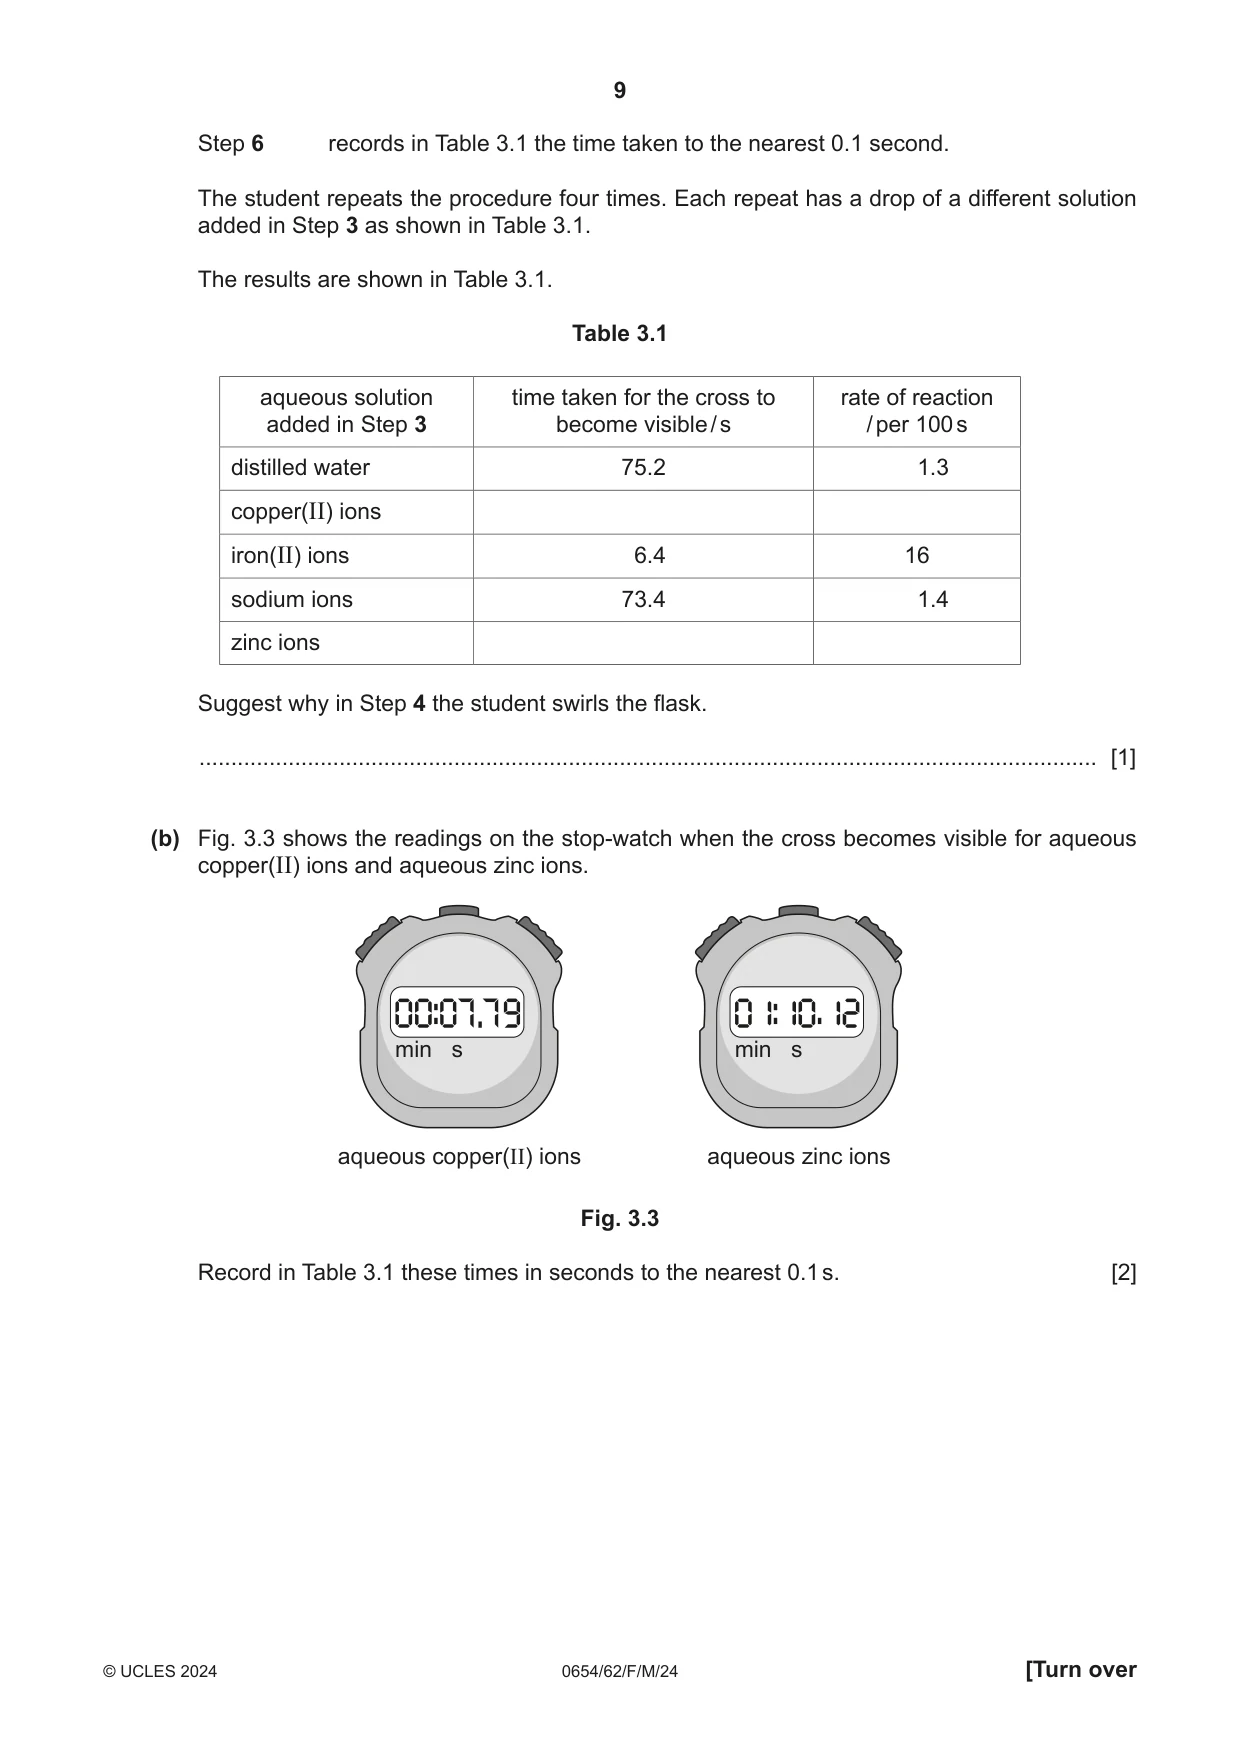
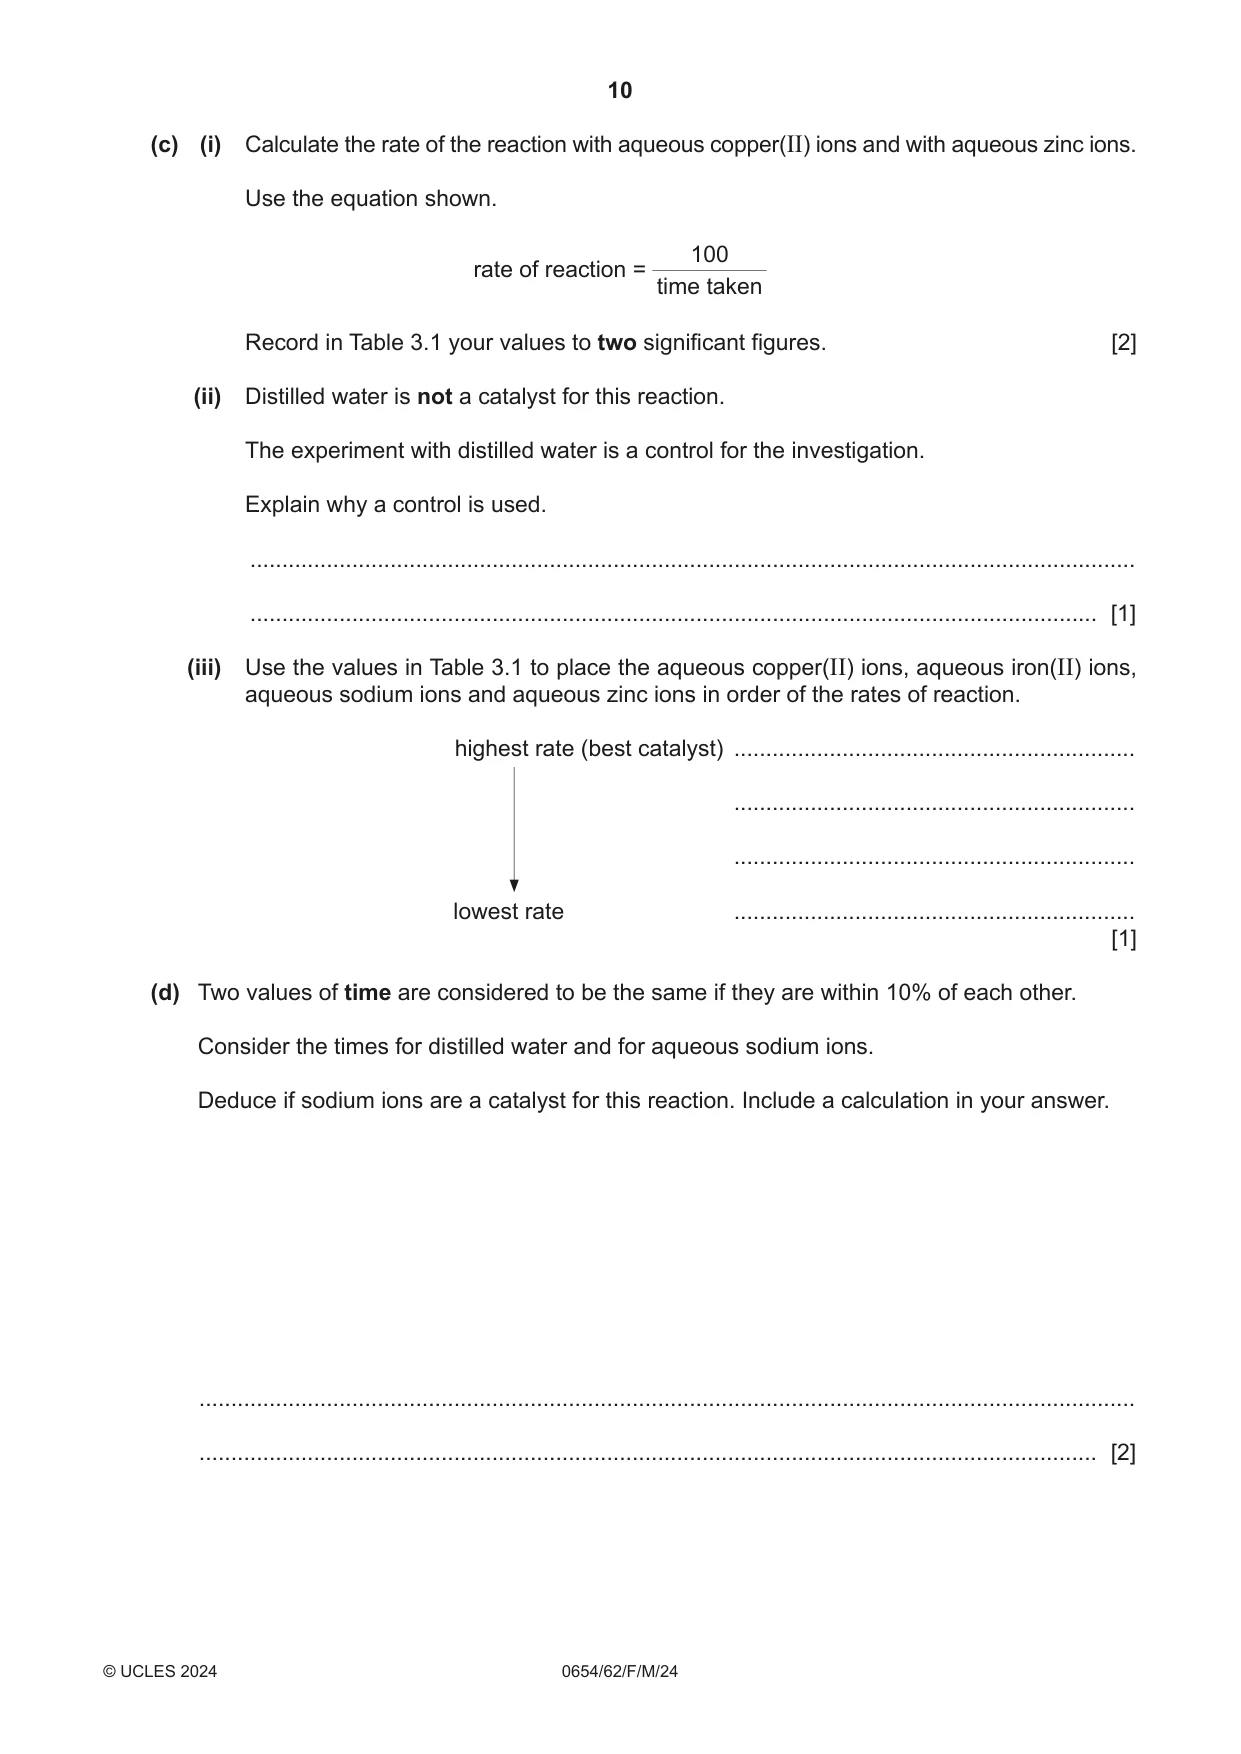
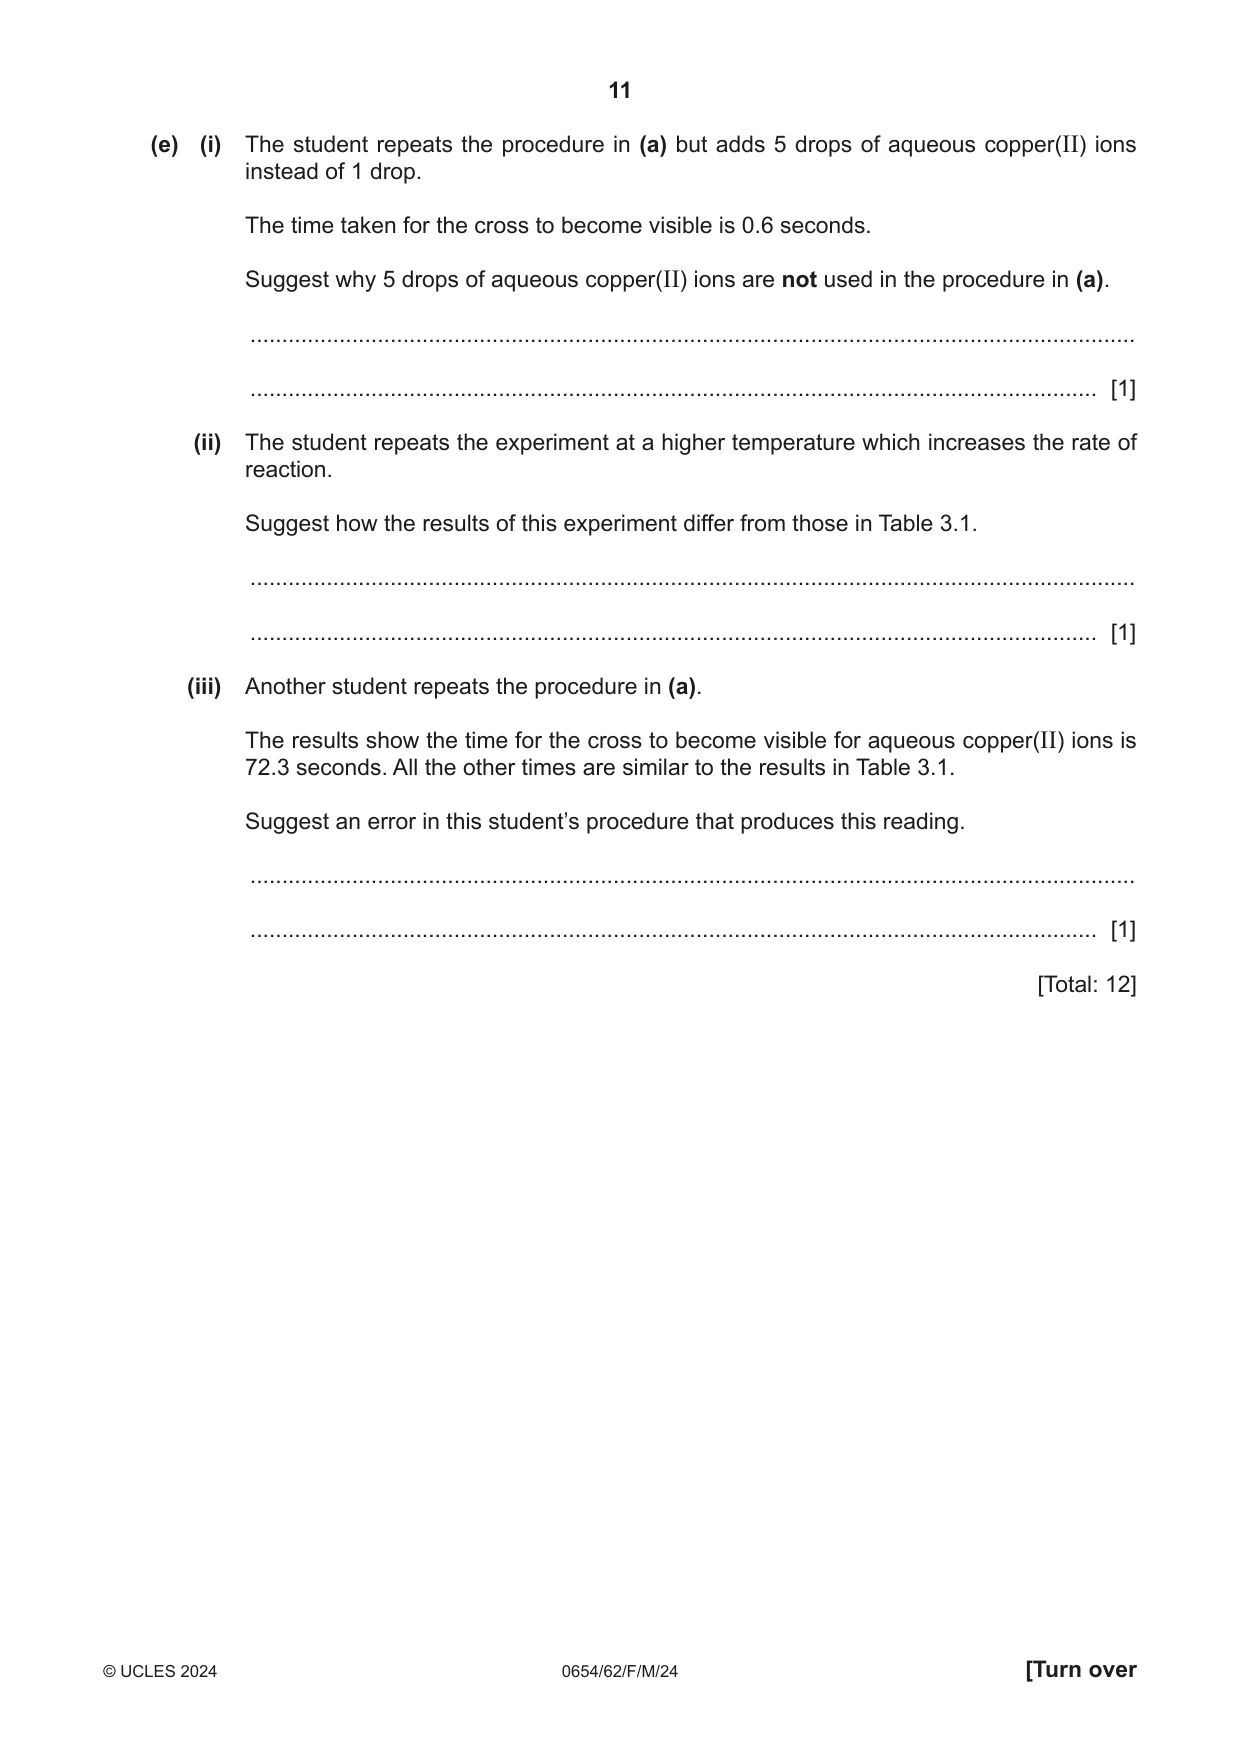
3 A student investigates which metal ions catalyse a reaction. When aqueous sodium thiosulfate reacts with aqueous iron(III) nitrate the reaction mixture immediately turns dark purple. The colour of this mixture slowly fades. A catalyst will make the purple colour fade more quickly. Fig. 3.1 shows the experiment. aqueous sodium thiosulfate and aqueous iron(III) nitrate cross on a piece of white paper Fig. 3.1 When the purple colour fades it is possible to see the cross through the reaction mixture. (a) Procedure The student: Step 1 adds 20 cm3 of aqueous sodium thiosulfate to a conical flask Step 2 puts the conical flask on a cross on a piece of paper Step 3 adds 1 drop of distilled water to the conical flask Step 4 adds 20 cm3 of aqueous iron(III) nitrate to the conical flask, immediately swirls the flask and starts a stop-watch Step 5 looks through the mixture and when the cross becomes visible as shown in Fig. 3.2, the student stops the stop-watch aqueous sodium thiosulfate, aqueous iron(III) nitrate and 1 drop of solution cross on a piece of white paper Fig. 3.2 Step 6 records in Table 3.1 the time taken to the nearest 0.1 second. The student repeats the procedure four times. Each repeat has a drop of a different solution added in Step 3 as shown in Table 3.1. The results are shown in Table 3.1. Table 3.1 aqueous solution time taken for the cross to rate of reaction added in Step 3 become visible / s / per 100 s distilled water 75.2 1.3 copper(II) ions iron(II) ions 6.4 16 sodium ions 73.4 1.4 zinc ions Suggest why in Step 4 the student swirls the flask. ............................................................................................................................................. [1] (b) Fig. 3.3 shows the readings on the stop-watch when the cross becomes visible for aqueous copper(II) ions and aqueous zinc ions. min s min s aqueous copper(II) ions aqueous zinc ions Fig. 3.3 Record in Table 3.1 these times in seconds to the nearest 0.1 s. [2] (c) (i) Calculate the rate of the reaction with aqueous copper(II) ions and with aqueous zinc ions. Use the equation shown. 100 rate of reaction = time taken Record in Table 3.1 your values to two significant figures. [2] (ii) Distilled water is not a catalyst for this reaction. The experiment with distilled water is a control for the investigation. Explain why a control is used. ........................................................................................................................................... ..................................................................................................................................... [1] (iii) Use the values in Table 3.1 to place the aqueous copper(II) ions, aqueous iron(II) ions, aqueous sodium ions and aqueous zinc ions in order of the rates of reaction. highest rate (best catalyst) ............................................................... ............................................................... ............................................................... lowest rate ............................................................... [1] (d) Two values of time are considered to be the same if they are within 10% of each other. Consider the times for distilled water and for aqueous sodium ions. Deduce if sodium ions are a catalyst for this reaction. Include a calculation in your answer. ................................................................................................................................................... ............................................................................................................................................. [2] (e) (i) The student repeats the procedure in (a) but adds 5 drops of aqueous copper(II) ions instead of 1 drop. The time taken for the cross to become visible is 0.6 seconds. Suggest why 5 drops of aqueous copper(II) ions are not used in the procedure in (a). ........................................................................................................................................... ..................................................................................................................................... [1] (ii) The student repeats the experiment at a higher temperature which increases the rate of reaction. Suggest how the results of this experiment differ from those in Table 3.1. ........................................................................................................................................... ..................................................................................................................................... [1] (iii) Another student repeats the procedure in (a). The results show the time for the cross to become visible for aqueous copper(II) ions is 72.3 seconds. All the other times are similar to the results in Table 3.1. Suggest an error in this student’s procedure that produces this reading. ........................................................................................................................................... ..................................................................................................................................... [1] [Total: 12]
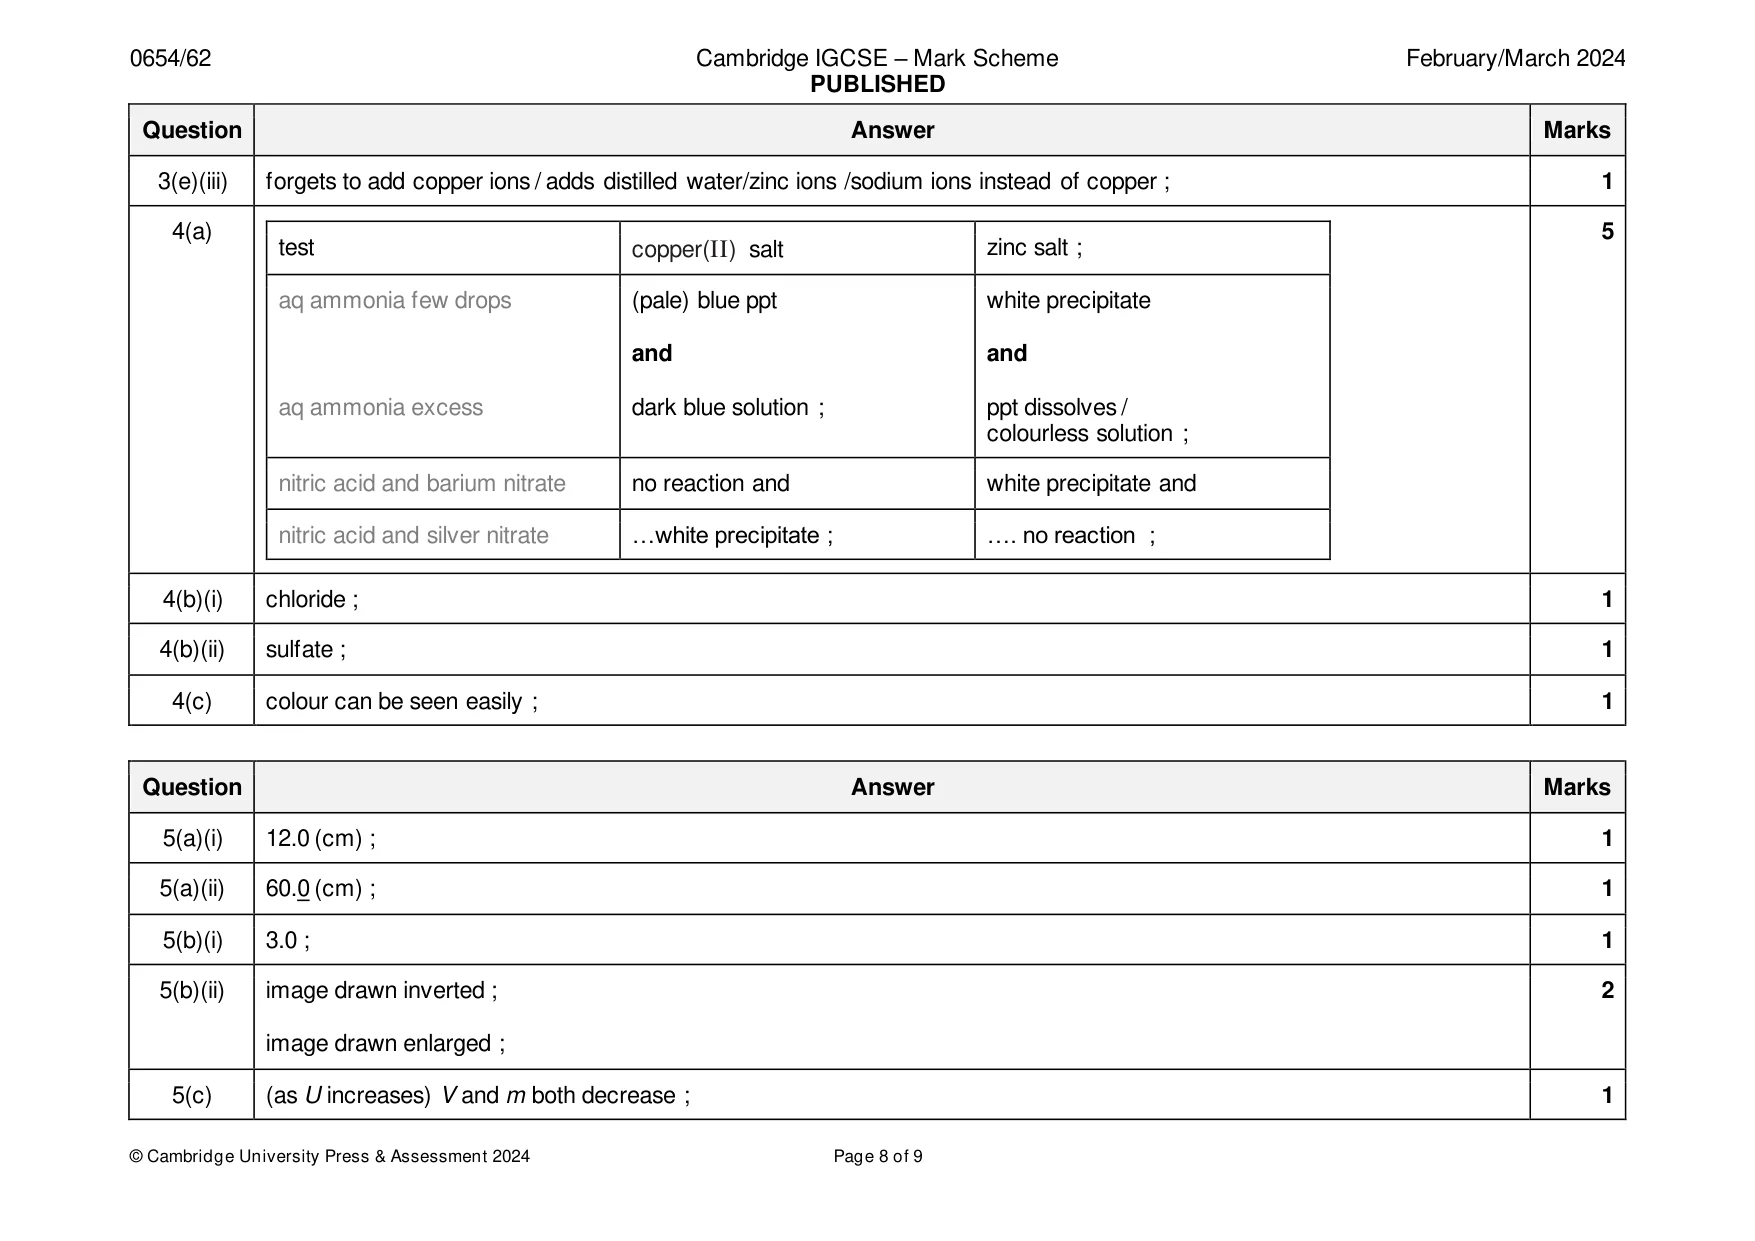
Mark scheme: 3(a) to distribute (reagents) equally; 1 3(b) 7.8; 2 70.1 ; 3(c)(i) 12.82051282 and 1.426533524 ; 2 13 and 1.4 ; 3(c)(ii) to get time without a catalyst so can compare the other solution / catalyst / ions to it ; 1 3(c)(iii) iron(II) 1 copper zinc sodium ; 3(d) a 10% calculation; 2 use of the 10% calculation to show that it is not a catalyst ; or a 110% or 90% calculation ; use of value to show that it is not a catalyst ; or ratio as percentage ; use value to show that it is not a catalyst ; e.g. 10 % of 75.2 = 7.52 75.2 – 7.52 = 67.68 / 73.4 + 7.52 = 80.92 and within 10% so not a catalyst ; OR 10% of 73.4 = 7.34 ; 73.4 + 7.34 = 80.74 / 75.2 – 7.34 = 67.86 and within 10% so not a catalyst ; 3(e)(i) too fast to measure / instantaneous ; 1 3(e)(ii) times will be smaller ; 1 3(e)(iii) forgets to add copper ions / adds distilled water/zinc ions /sodium ions instead of copper ; 1
Q4 · A student investigates some reactions of an aqueous copper(II) salt and an aqueous zinc…
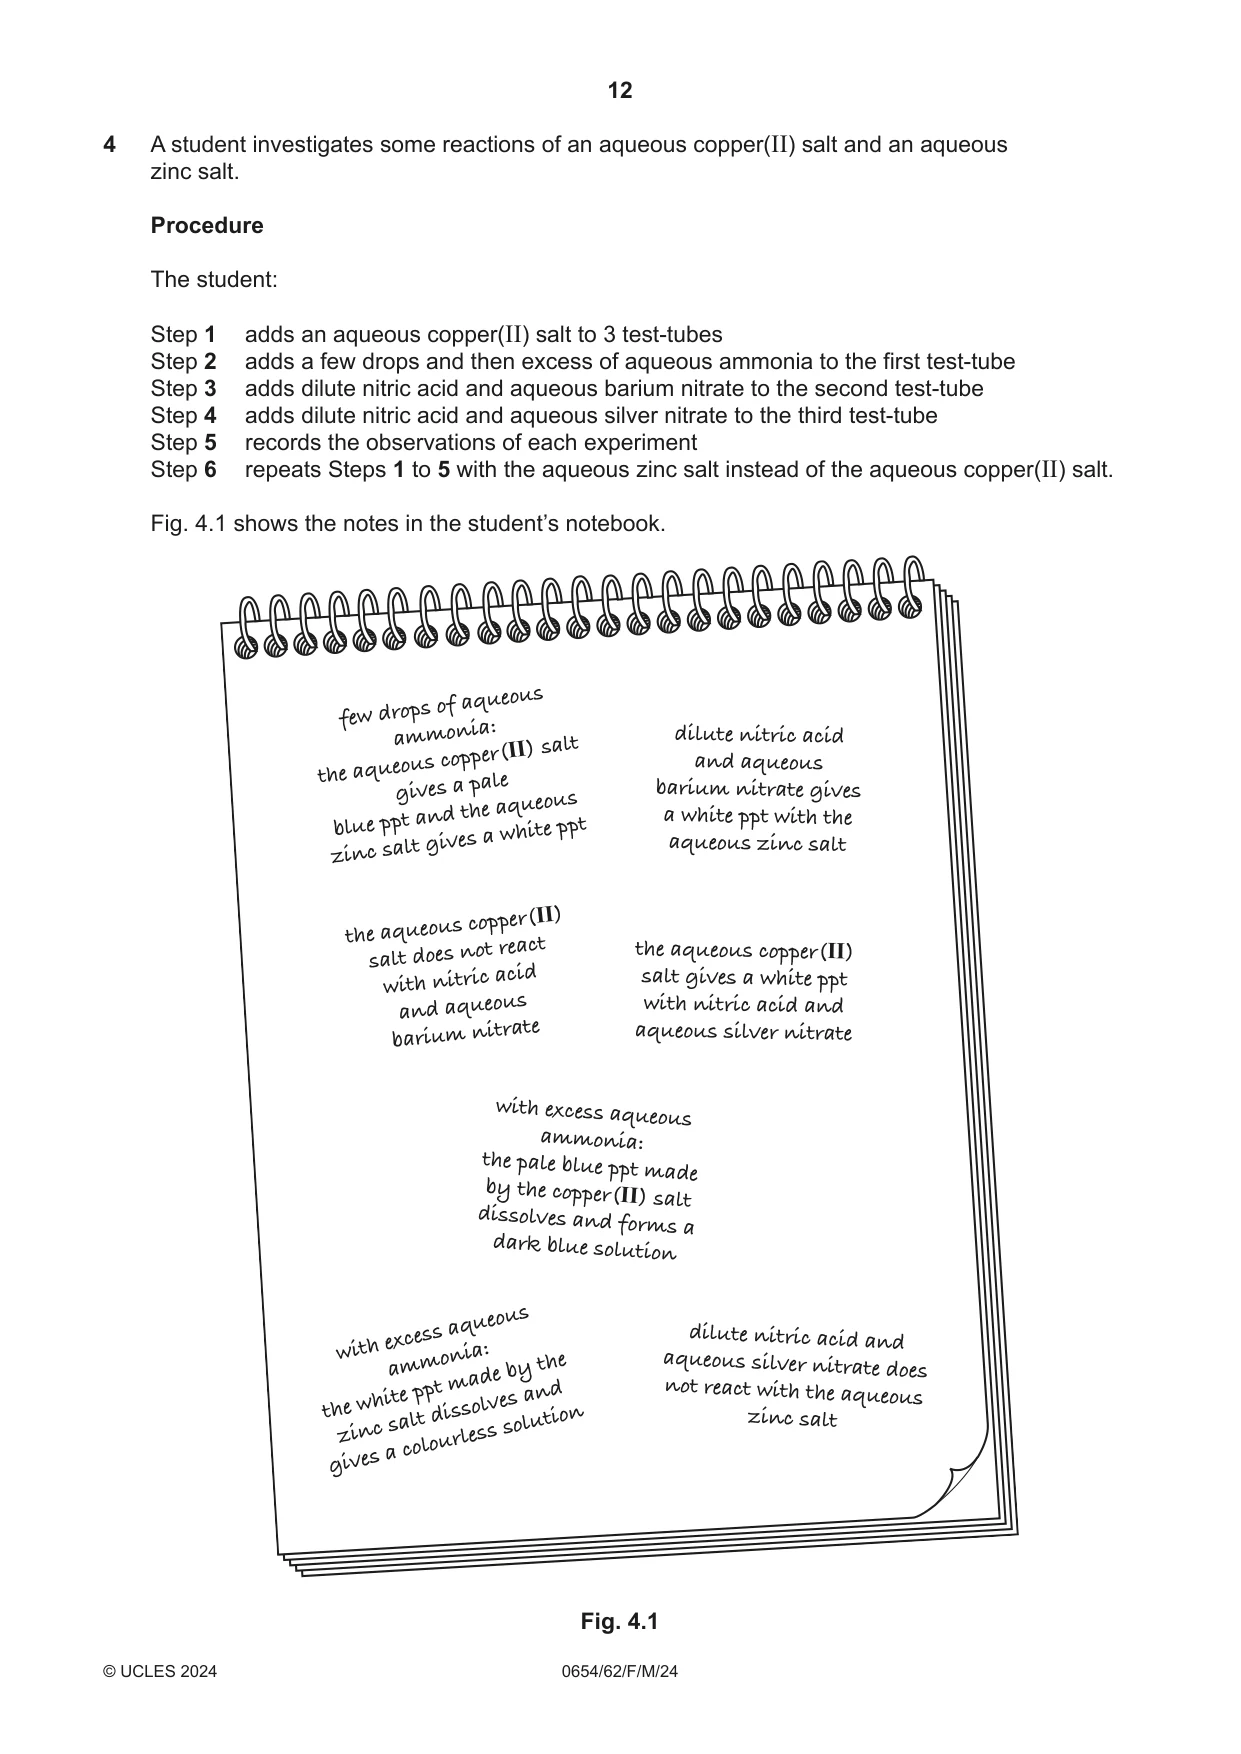
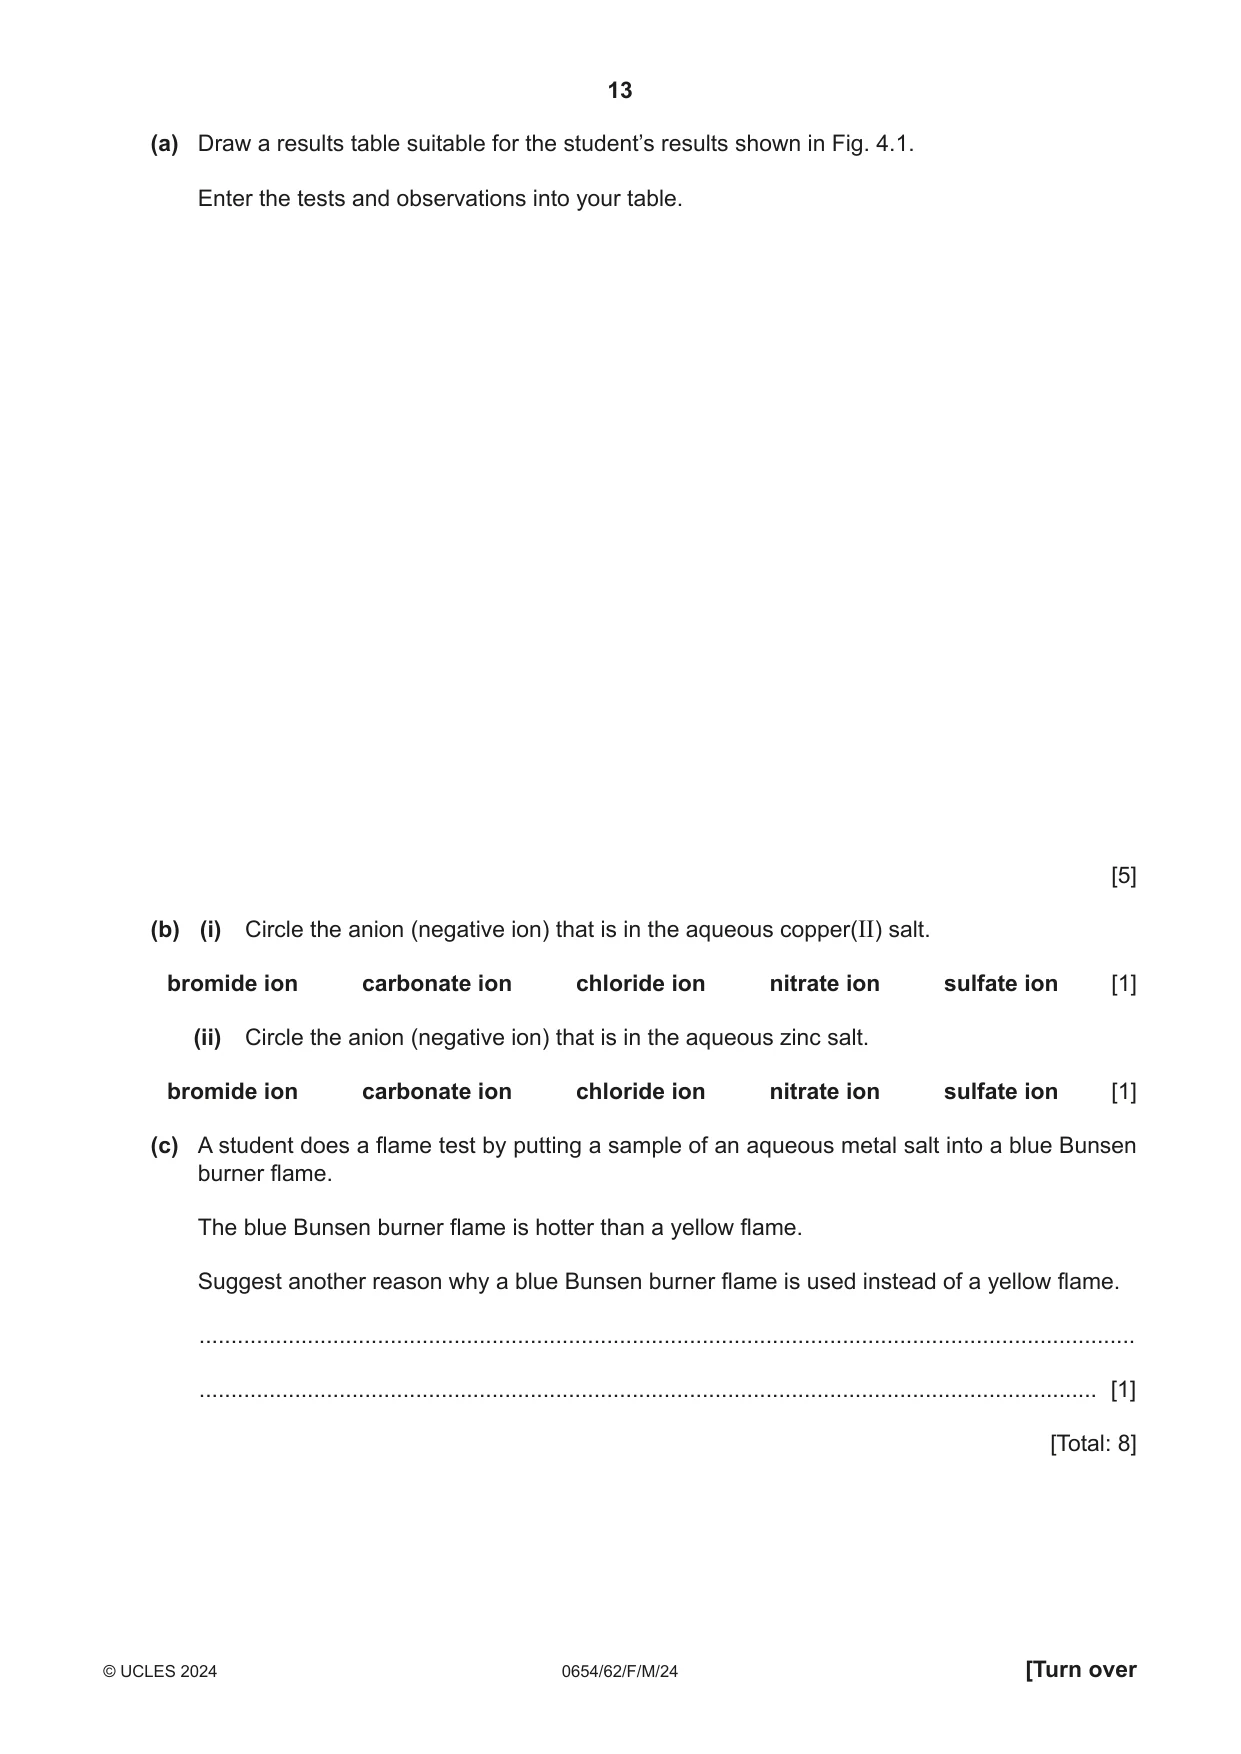
4 A student investigates some reactions of an aqueous copper(II) salt and an aqueous zinc salt. Procedure The student: Step 1 adds an aqueous copper(II) salt to 3 test-tubes Step 2 adds a few drops and then excess of aqueous ammonia to the first test-tube Step 3 adds dilute nitric acid and aqueous barium nitrate to the second test-tube Step 4 adds dilute nitric acid and aqueous silver nitrate to the third test-tube Step 5 records the observations of each experiment Step 6 repeats Steps 1 to 5 with the aqueous zinc salt instead of the aqueous copper(II) salt. Fig. 4.1 shows the notes in the student’s notebook. of aqueous few drops ammonia: dilute nitric acid copper(II) salt and aqueous the aqueous gives a pale barium nitrate gives aqueous a white ppt with the blue ppt and the white ppt a salt gives aqueous zinc salt zinc copper(II) the aqueous aqueous copper(II) salt does not react the a white ppt with nitric acid salt gives and aqueous with nitric acid and nitrate aqueous silver nitrate barium with excess aqueous ammonia: the pale blue ppt made by the copper(II) salt dissolves and forms a dark blue solution excess aqueous dilute nitric acid and with ammonia: by the aqueous silver nitrate does made ppt and not react with the aqueous white the dissolves salt salt solution zinc zinc acolourless gives Fig. 4.1 (a) Draw a results table suitable for the student’s results shown in Fig. 4.1. Enter the tests and observations into your table. [5] (b) (i) Circle the anion (negative ion) that is in the aqueous copper(II) salt. bromide ion carbonate ion chloride ion nitrate ion sulfate ion [1] (ii) Circle the anion (negative ion) that is in the aqueous zinc salt. bromide ion carbonate ion chloride ion nitrate ion sulfate ion [1] (c) A student does a flame test by putting a sample of an aqueous metal salt into a blue Bunsen burner flame. The blue Bunsen burner flame is hotter than a yellow flame. Suggest another reason why a blue Bunsen burner flame is used instead of a yellow flame. ................................................................................................................................................... ............................................................................................................................................. [1] [Total: 8]
Mark scheme: 4(a) 5 test copper(II) salt zinc salt ; aq ammonia few drops (pale) blue ppt white precipitate and and aq ammonia excess dark blue solution ; ppt dissolves / colourless solution ; nitric acid and barium nitrate no reaction and white precipitate and nitric acid and silver nitrate …white precipitate ; …. no reaction ; 4(b)(i) chloride ; 1 4(b)(ii) sulfate ; 1 4(c) colour can be seen easily ; 1
Q5 · A student measures the focal length f of a converging lens
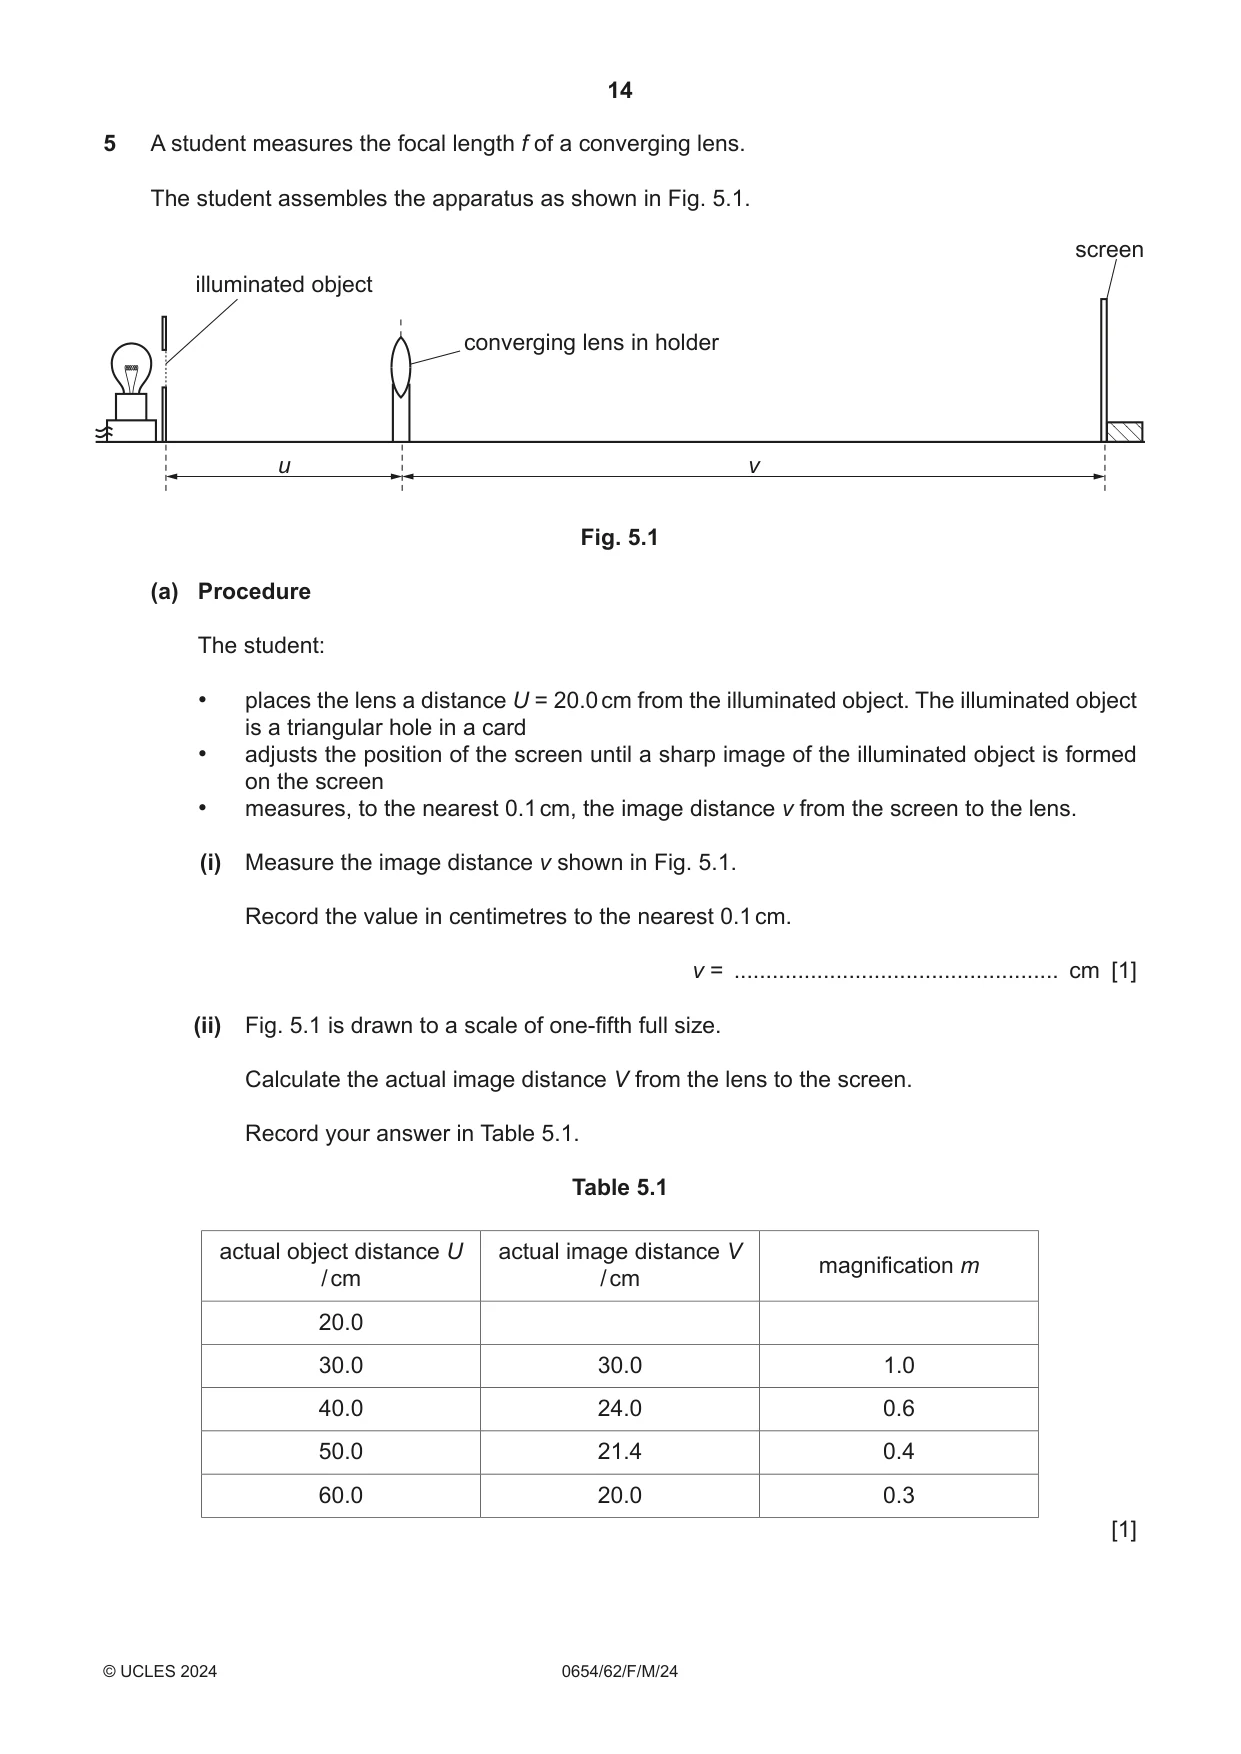
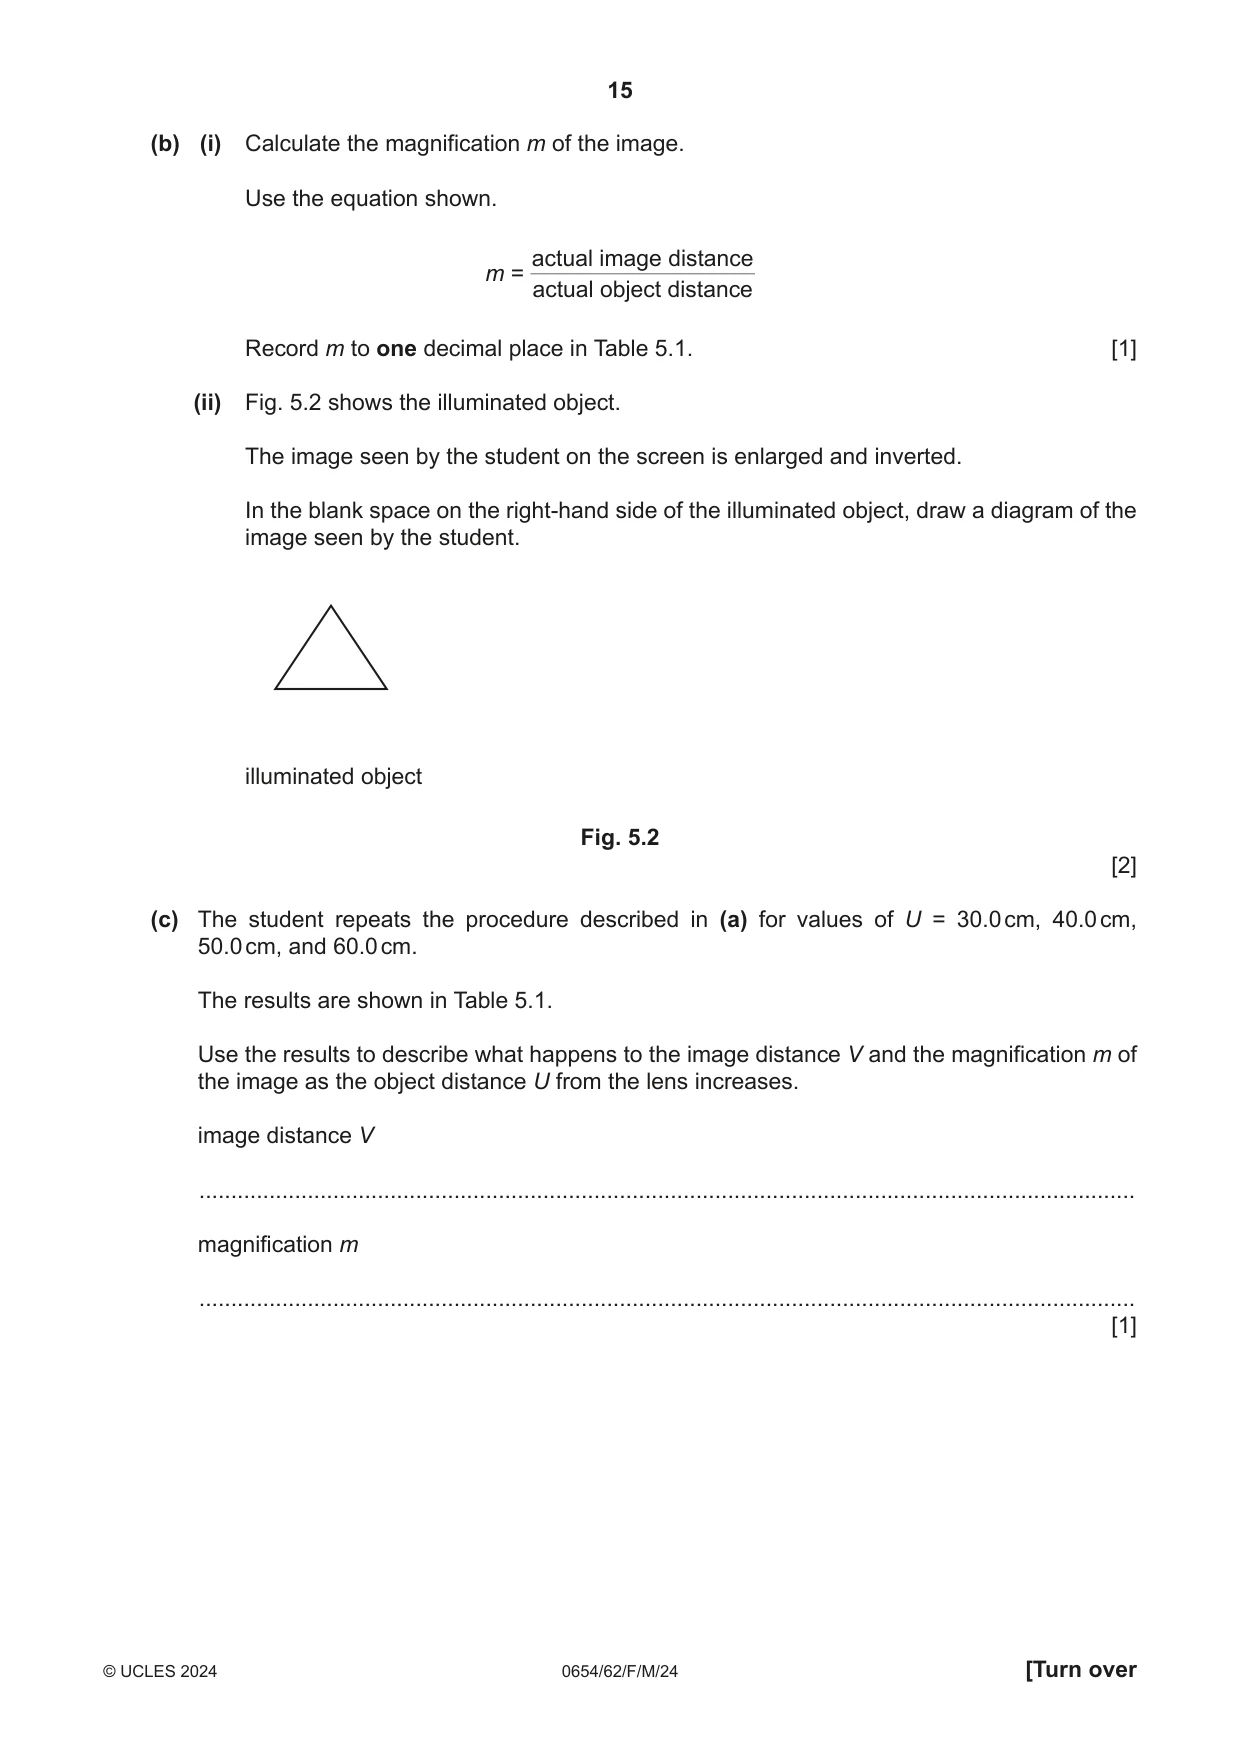
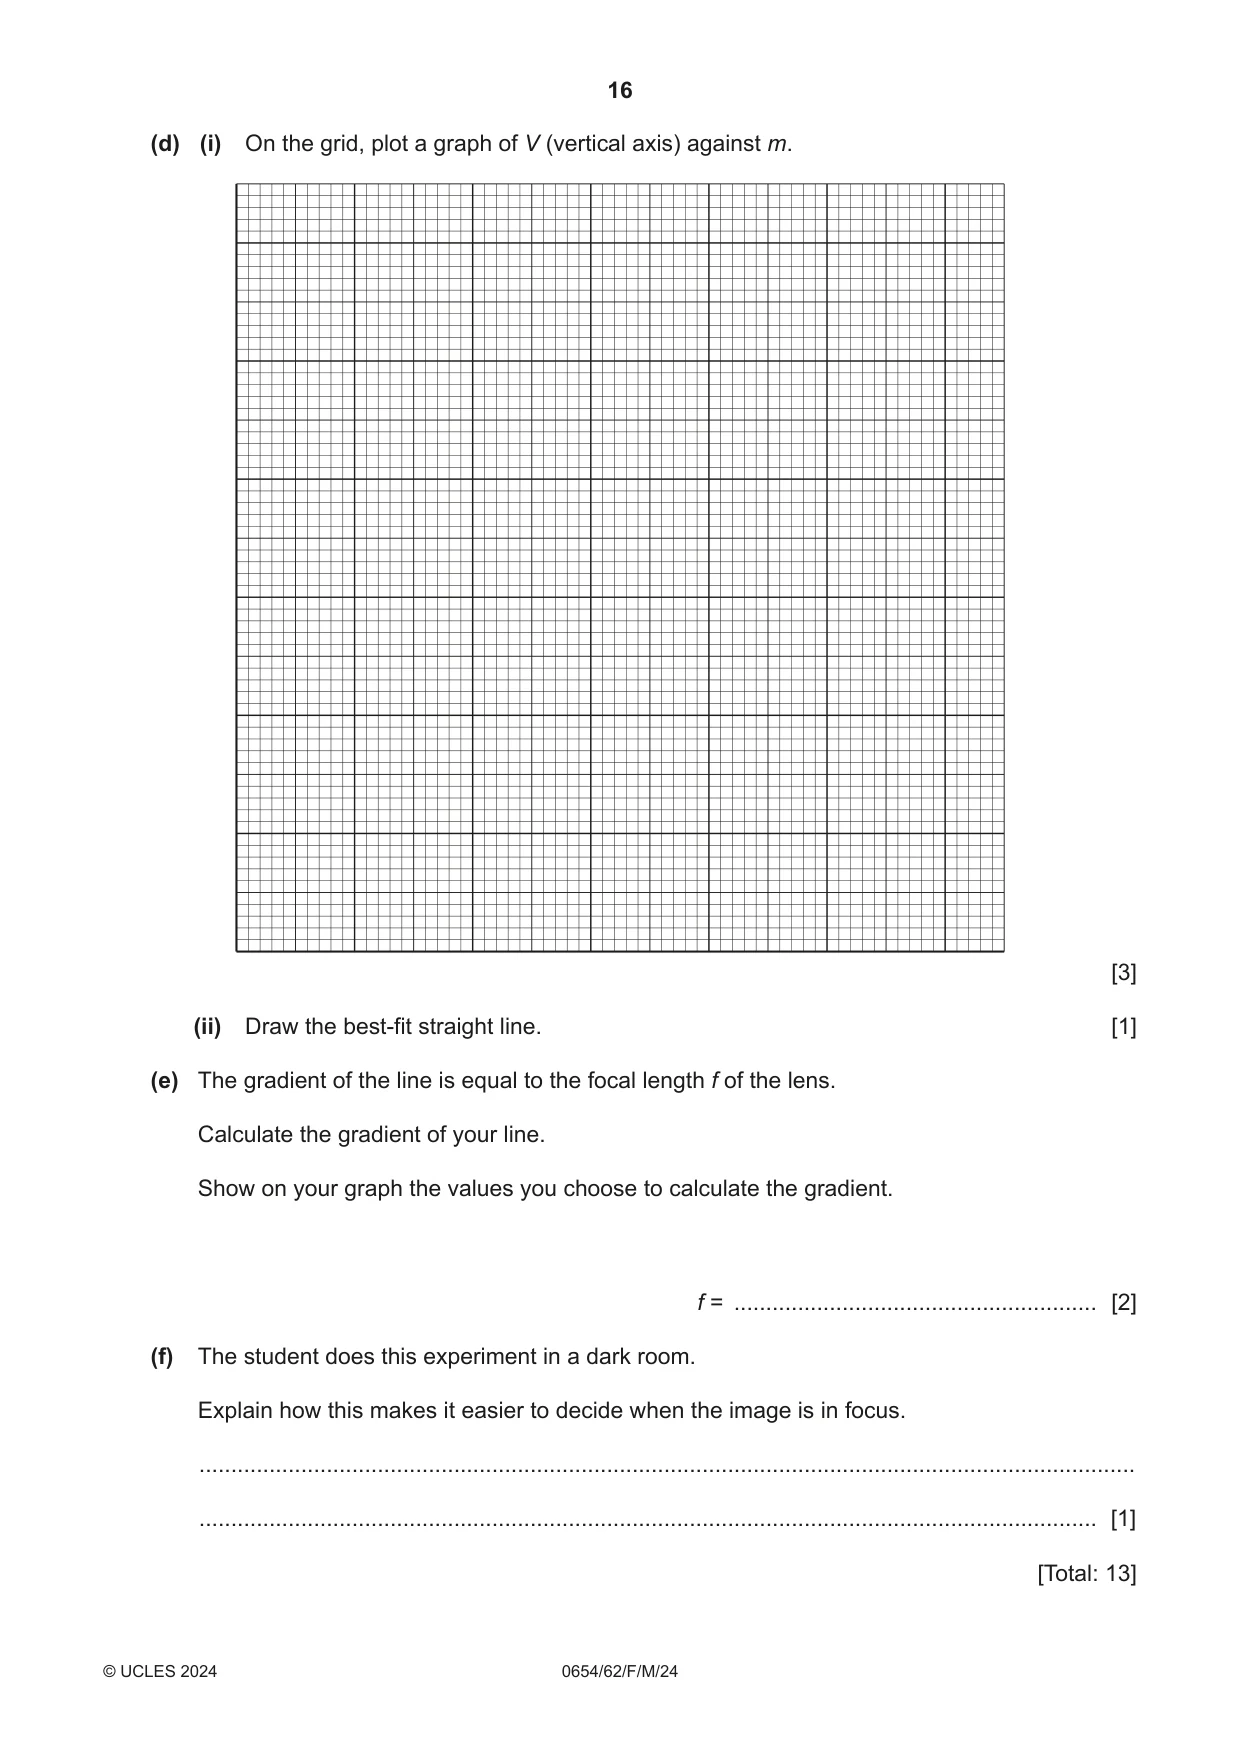
5 A student measures the focal length f of a converging lens. The student assembles the apparatus as shown in Fig. 5.1. screen illuminated object converging lens in holder u v Fig. 5.1 (a) Procedure The student: • places the lens a distance U = 20.0 cm from the illuminated object. The illuminated object is a triangular hole in a card • adjusts the position of the screen until a sharp image of the illuminated object is formed on the screen • measures, to the nearest 0.1 cm, the image distance v from the screen to the lens. (i) Measure the image distance v shown in Fig. 5.1. Record the value in centimetres to the nearest 0.1 cm. v = ................................................... cm [1] (ii) Fig. 5.1 is drawn to a scale of one-fifth full size. Calculate the actual image distance V from the lens to the screen. Record your answer in Table 5.1. Table 5.1 actual object distance U actual image distance V magnification m / cm / cm 20.0 30.0 30.0 1.0 40.0 24.0 0.6 50.0 21.4 0.4 60.0 20.0 0.3 [1] (b) (i) Calculate the magnification m of the image. Use the equation shown. actual image distance m = actual object distance Record m to one decimal place in Table 5.1. [1] (ii) Fig. 5.2 shows the illuminated object. The image seen by the student on the screen is enlarged and inverted. In the blank space on the right-hand side of the illuminated object, draw a diagram of the image seen by the student. illuminated object Fig. 5.2 [2] (c) The student repeats the procedure described in (a) for values of U = 30.0 cm, 40.0 cm, 50.0 cm, and 60.0 cm. The results are shown in Table 5.1. Use the results to describe what happens to the image distance V and the magnification m of the image as the object distance U from the lens increases. image distance V ................................................................................................................................................... magnification m ................................................................................................................................................... [1] (d) (i) On the grid, plot a graph of V (vertical axis) against m. [3] (ii) Draw the best-fit straight line. [1] (e) The gradient of the line is equal to the focal length f of the lens. Calculate the gradient of your line. Show on your graph the values you choose to calculate the gradient. f = ......................................................... [2] (f) The student does this experiment in a dark room. Explain how this makes it easier to decide when the image is in focus. ................................................................................................................................................... ............................................................................................................................................. [1] [Total: 13]
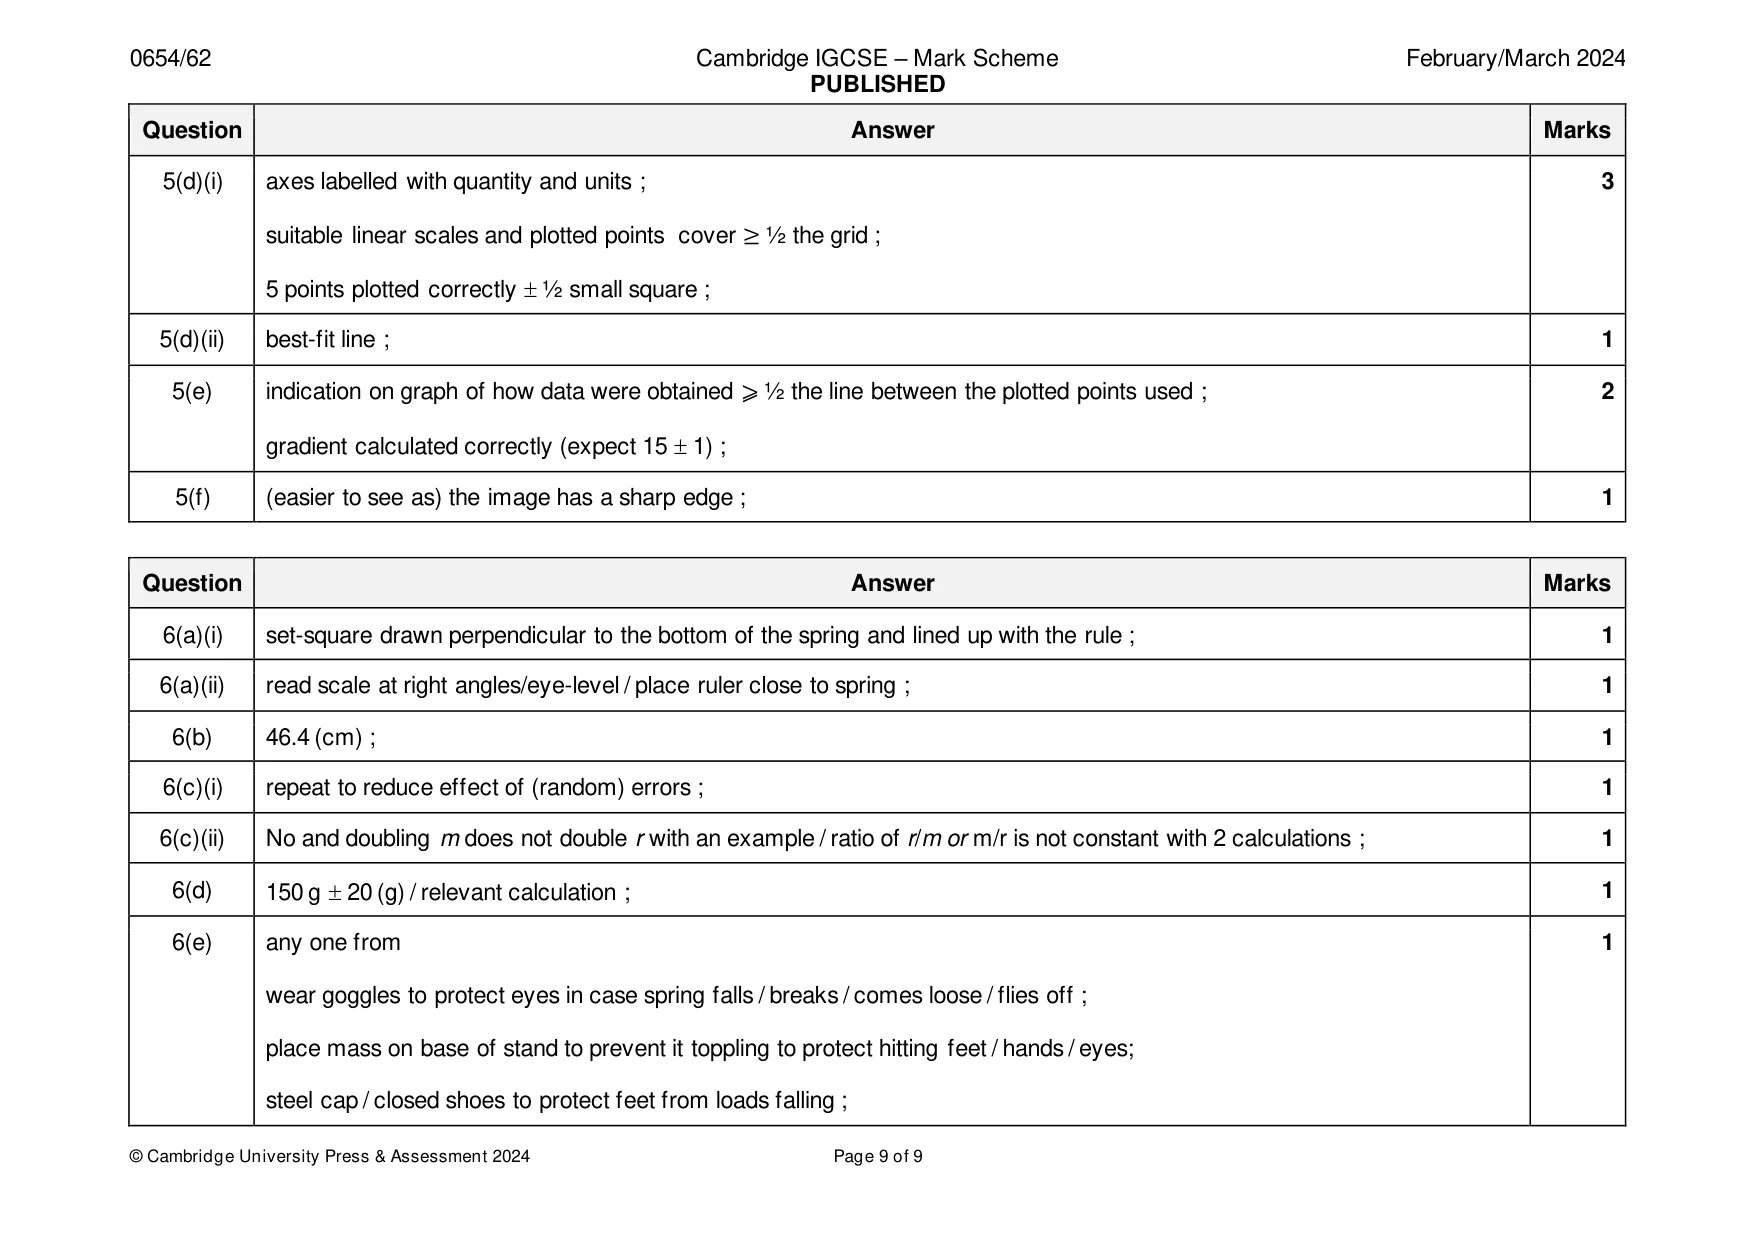
Mark scheme: 5(a)(i) 12.0 (cm) ; 1 5(a)(ii) 60.0 (cm) ; 1 5(b)(i) 3.0 ; 1 5(b)(ii) image drawn inverted ; 2 image drawn enlarged ; 5(c) (as U increases) V and m both decrease ; 1 5(d)(i) axes labelled with quantity and units ; 3 suitable linear scales and plotted points cover ≥ ½ the grid ; 5 points plotted correctly ½ small square ; 5(d)(ii) best-fit line ; 1 5(e) indication on graph of how data were obtained ⩾ ½ the line between the plotted points used ; 2 gradient calculated correctly (expect 15 1) ; 5(f) (easier to see as) the image has a sharp edge ; 1
Q6 · A student investigates the stretching of a spring
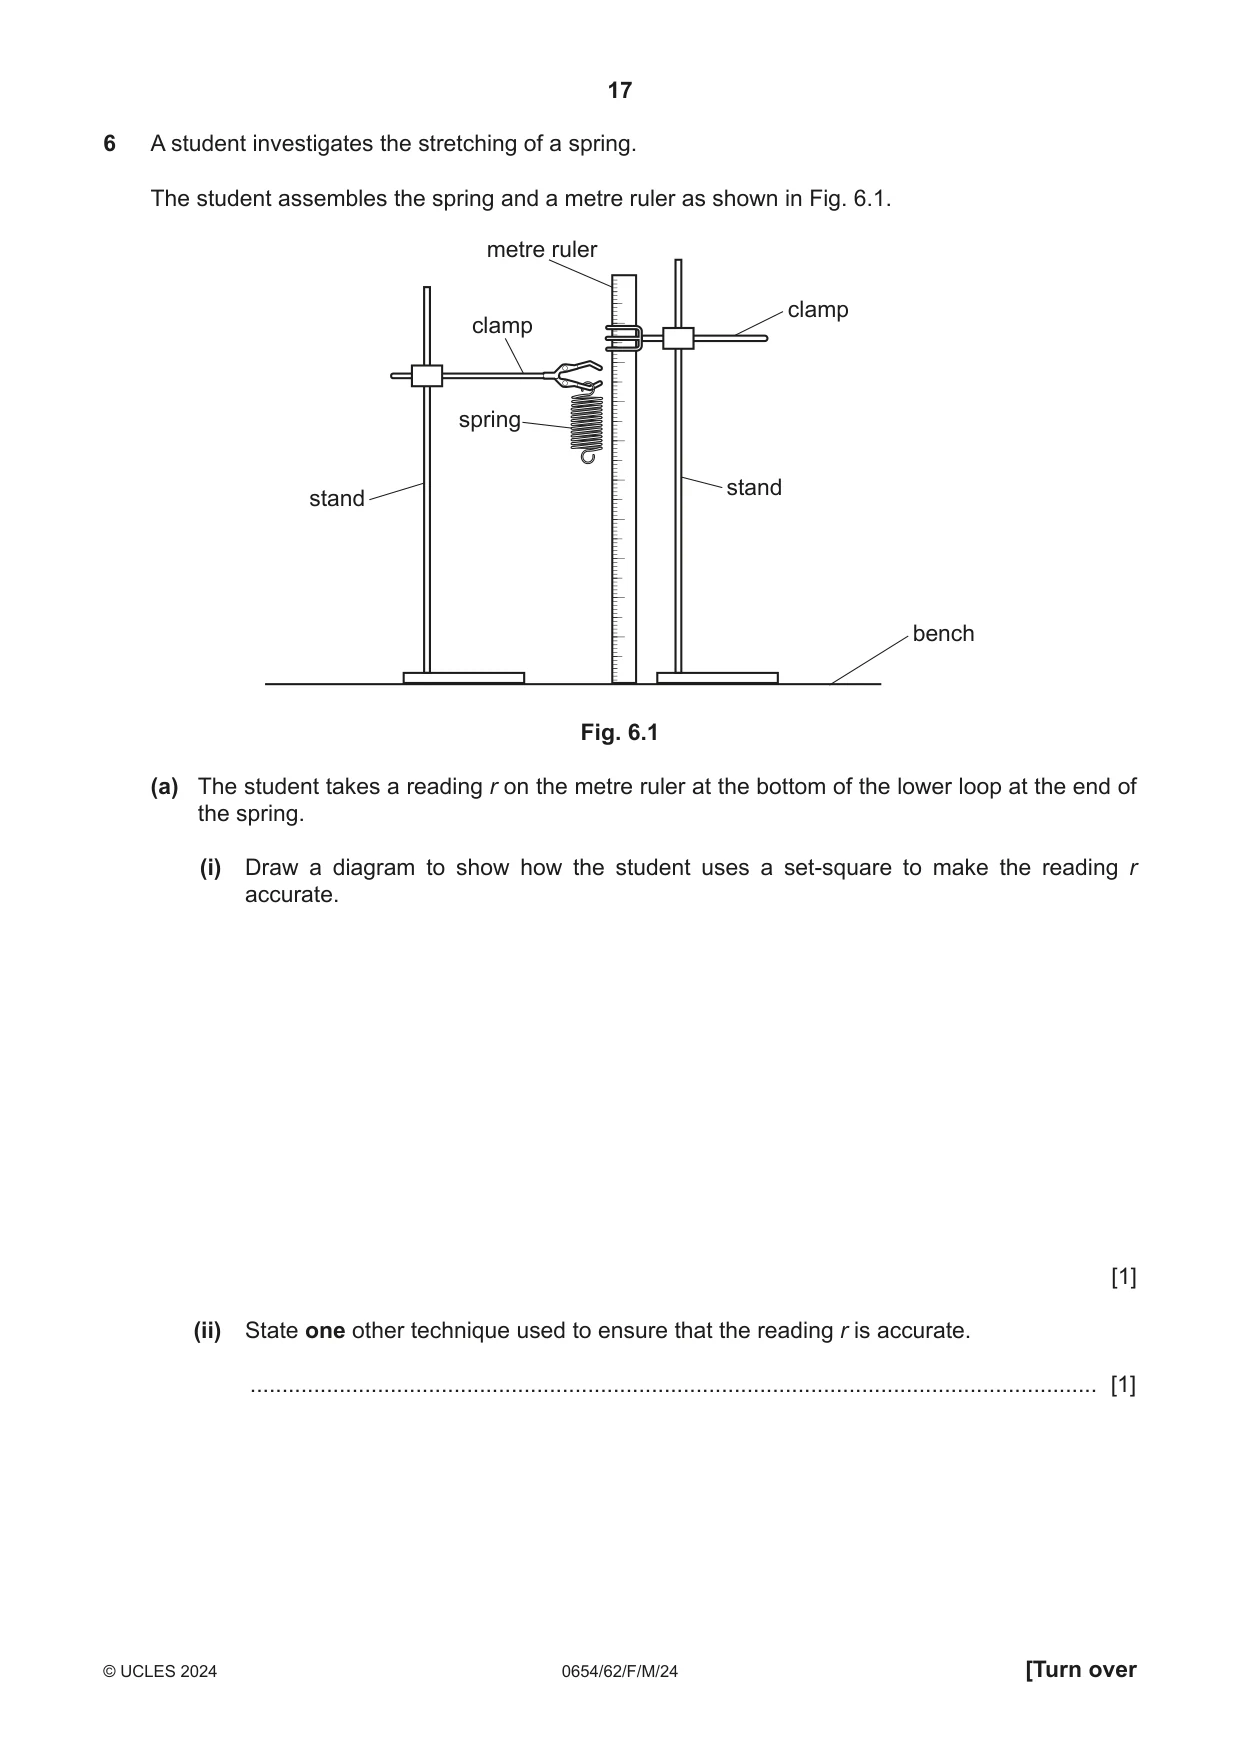
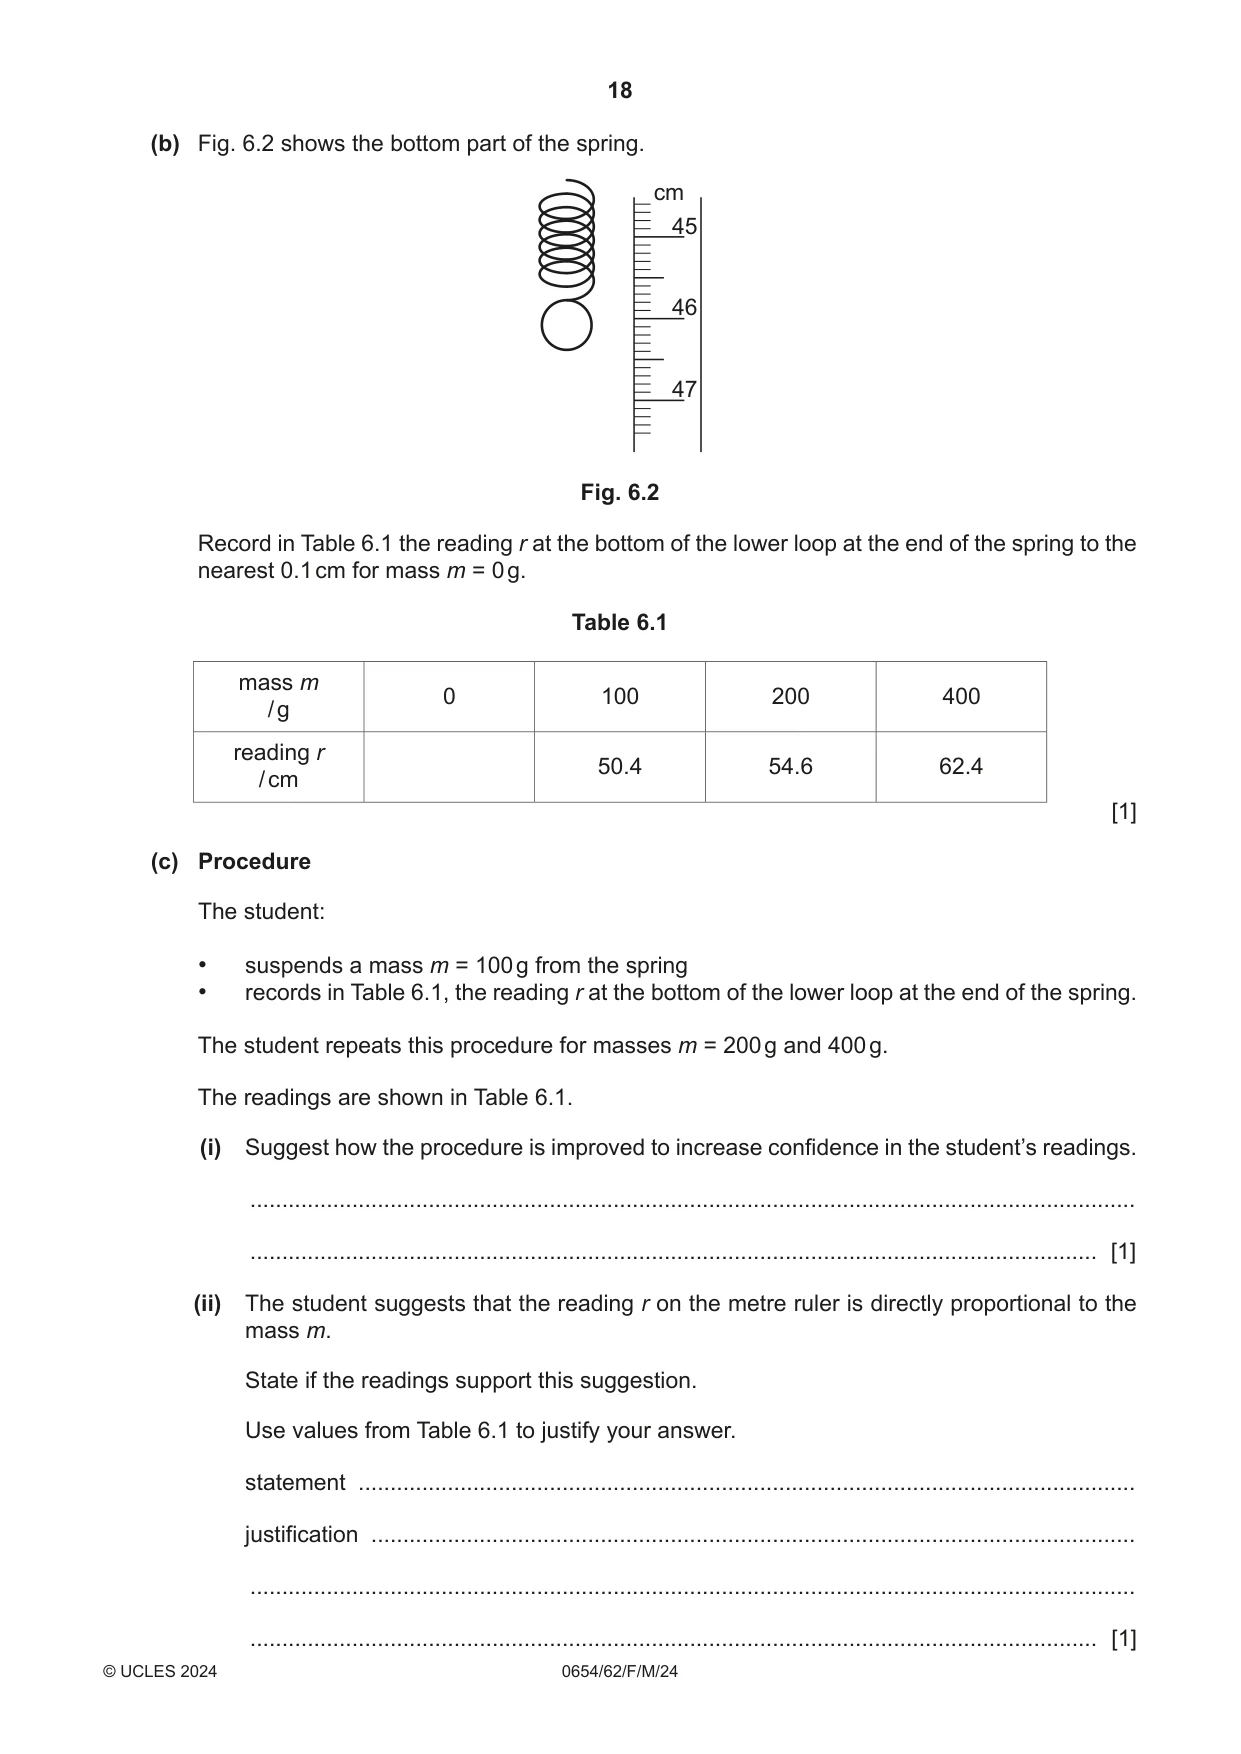
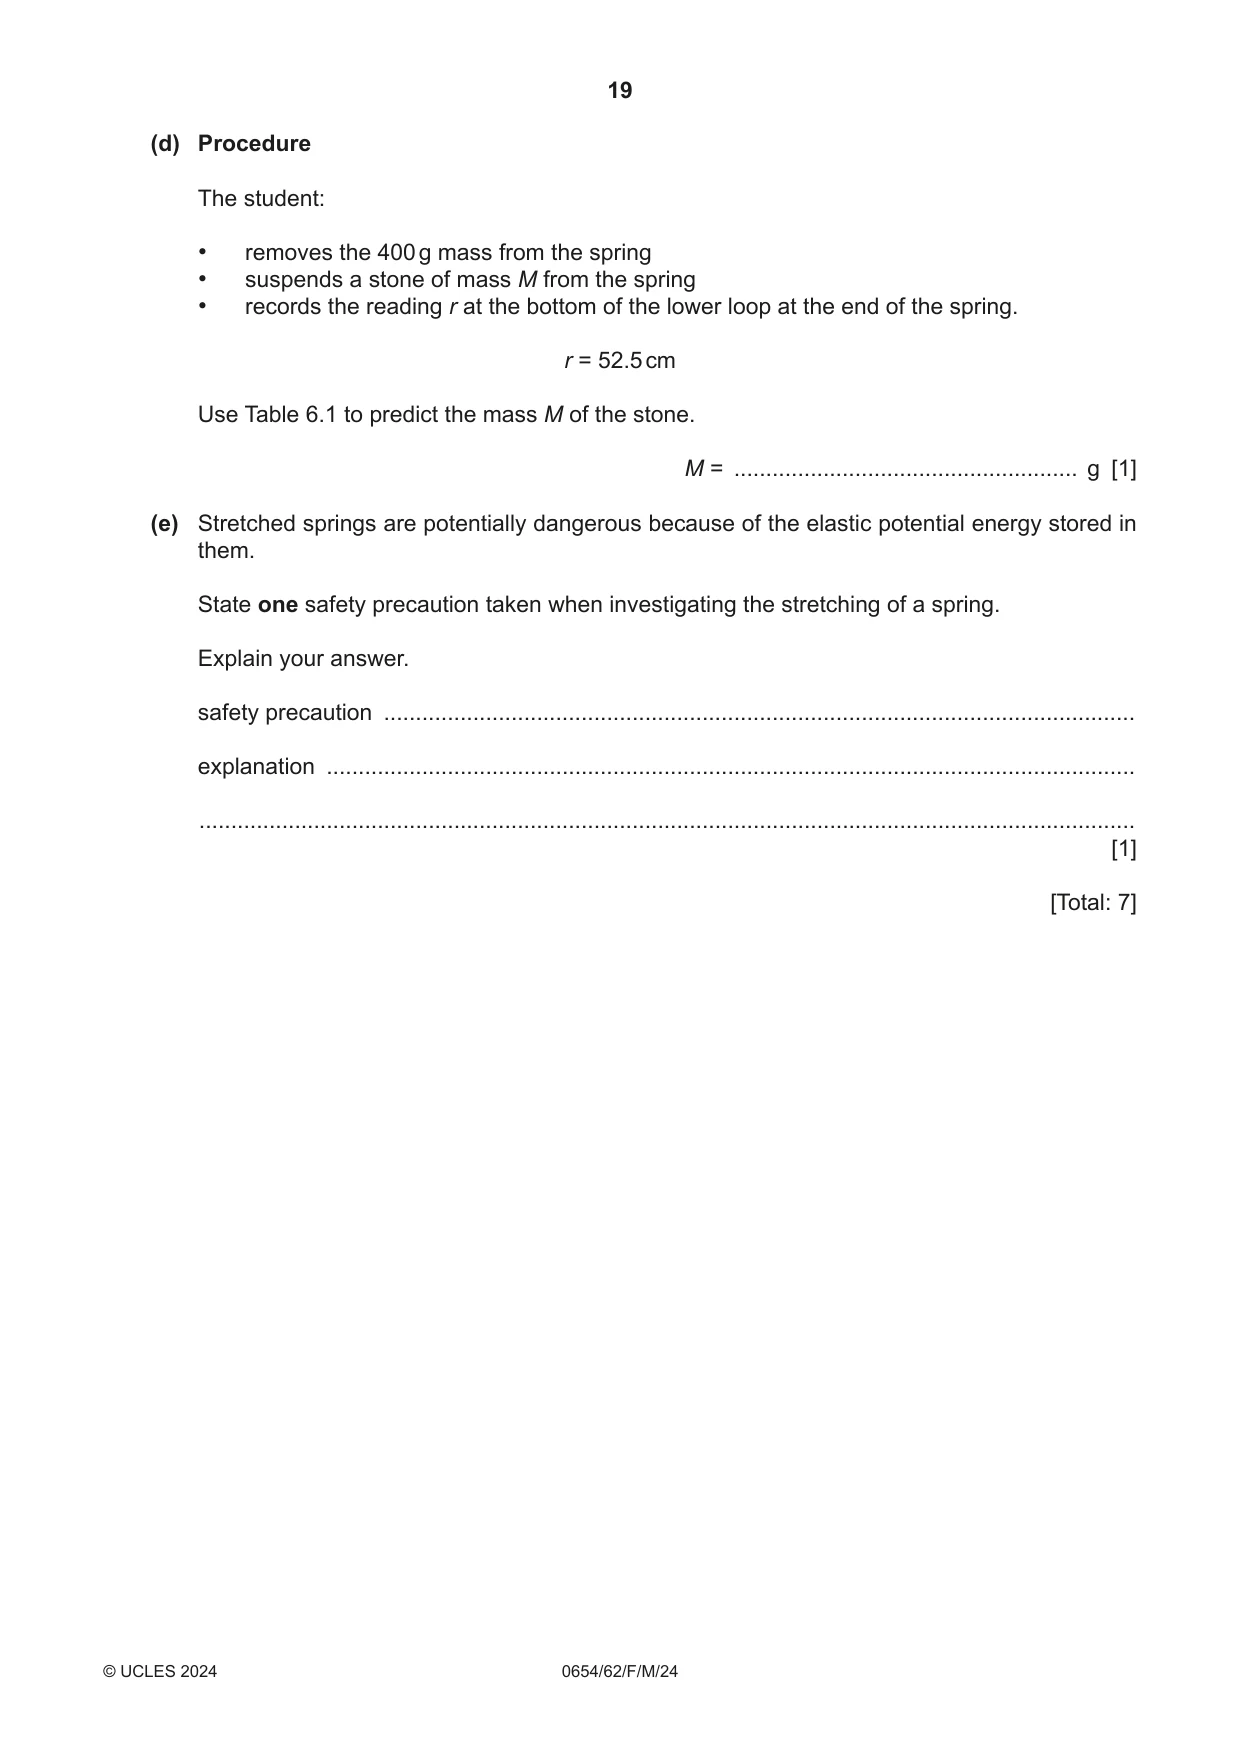
6 A student investigates the stretching of a spring. The student assembles the spring and a metre ruler as shown in Fig. 6.1. metre ruler clamp clamp spring stand stand bench Fig. 6.1 (a) The student takes a reading r on the metre ruler at the bottom of the lower loop at the end of the spring. (i) Draw a diagram to show how the student uses a set-square to make the reading r accurate. [1] (ii) State one other technique used to ensure that the reading r is accurate. ..................................................................................................................................... [1] (b) Fig. 6.2 shows the bottom part of the spring. cm 45 46 47 Fig. 6.2 Record in Table 6.1 the reading r at the bottom of the lower loop at the end of the spring to the nearest 0.1 cm for mass m = 0 g. Table 6.1 mass m 0 100 200 400 / g reading r 50.4 54.6 62.4 / cm [1] (c) Procedure The student: • suspends a mass m = 100 g from the spring • records in Table 6.1, the reading r at the bottom of the lower loop at the end of the spring. The student repeats this procedure for masses m = 200 g and 400 g. The readings are shown in Table 6.1. (i) Suggest how the procedure is improved to increase confidence in the student’s readings. ........................................................................................................................................... ..................................................................................................................................... [1] (ii) The student suggests that the reading r on the metre ruler is directly proportional to the mass m. State if the readings support this suggestion. Use values from Table 6.1 to justify your answer. statement .......................................................................................................................... justification ........................................................................................................................ ........................................................................................................................................... ..................................................................................................................................... [1] (d) Procedure The student: • removes the 400 g mass from the spring • suspends a stone of mass M from the spring • records the reading r at the bottom of the lower loop at the end of the spring. r = 52.5 cm Use Table 6.1 to predict the mass M of the stone. M = ...................................................... g [1] (e) Stretched springs are potentially dangerous because of the elastic potential energy stored in them. State one safety precaution taken when investigating the stretching of a spring. Explain your answer. safety precaution ...................................................................................................................... explanation ............................................................................................................................... ................................................................................................................................................... [1] [Total: 7]
Mark scheme: 6(a)(i) set-square drawn perpendicular to the bottom of the spring and lined up with the rule ; 1 6(a)(ii) read scale at right angles/eye-level / place ruler close to spring ; 1 6(b) 46.4 (cm) ; 1 6(c)(i) repeat to reduce effect of (random) errors ; 1 6(c)(ii) No and doubling m does not double r with an example / ratio of r/m or m/r is not constant with 2 calculations ; 1 6(d) 150 g 20 (g) / relevant calculation ; 1 6(e) any one from 1 wear goggles to protect eyes in case spring falls / breaks / comes loose / flies off ; place mass on base of stand to prevent it toppling to protect hitting feet / hands / eyes; steel cap / closed shoes to protect feet from loads falling ;
More questions on Physical quantities and measurement techniques
What was in this paper
The subtopics covered by these 6 questions, and how many questions each got. Open one in a new tab to see every Cambridge question on it.
What you needed in this session
Cambridge’s own grade thresholds for 2024 Feb/March, Paper 6 · Variant 2. A higher threshold means an easier paper — the bar moves with how the cohort did.