Cambridge IGCSE Sciences - Co-ordinated (Double) 0654 — 2024 Oct/Nov Paper 6 · Variant 2
0654/62/O/N/24 · 6 questions · 60 marks · ≈68 min
The question paper and its mark scheme, free to read here and free to download. This is Cambridge’s own paper, exactly as it was sat.
Question paper24 pages
Mark scheme9 pages
Answers below. Sit the paper first if you are practising.
Questions as text
Q1 · A photograph of a shark’s tooth
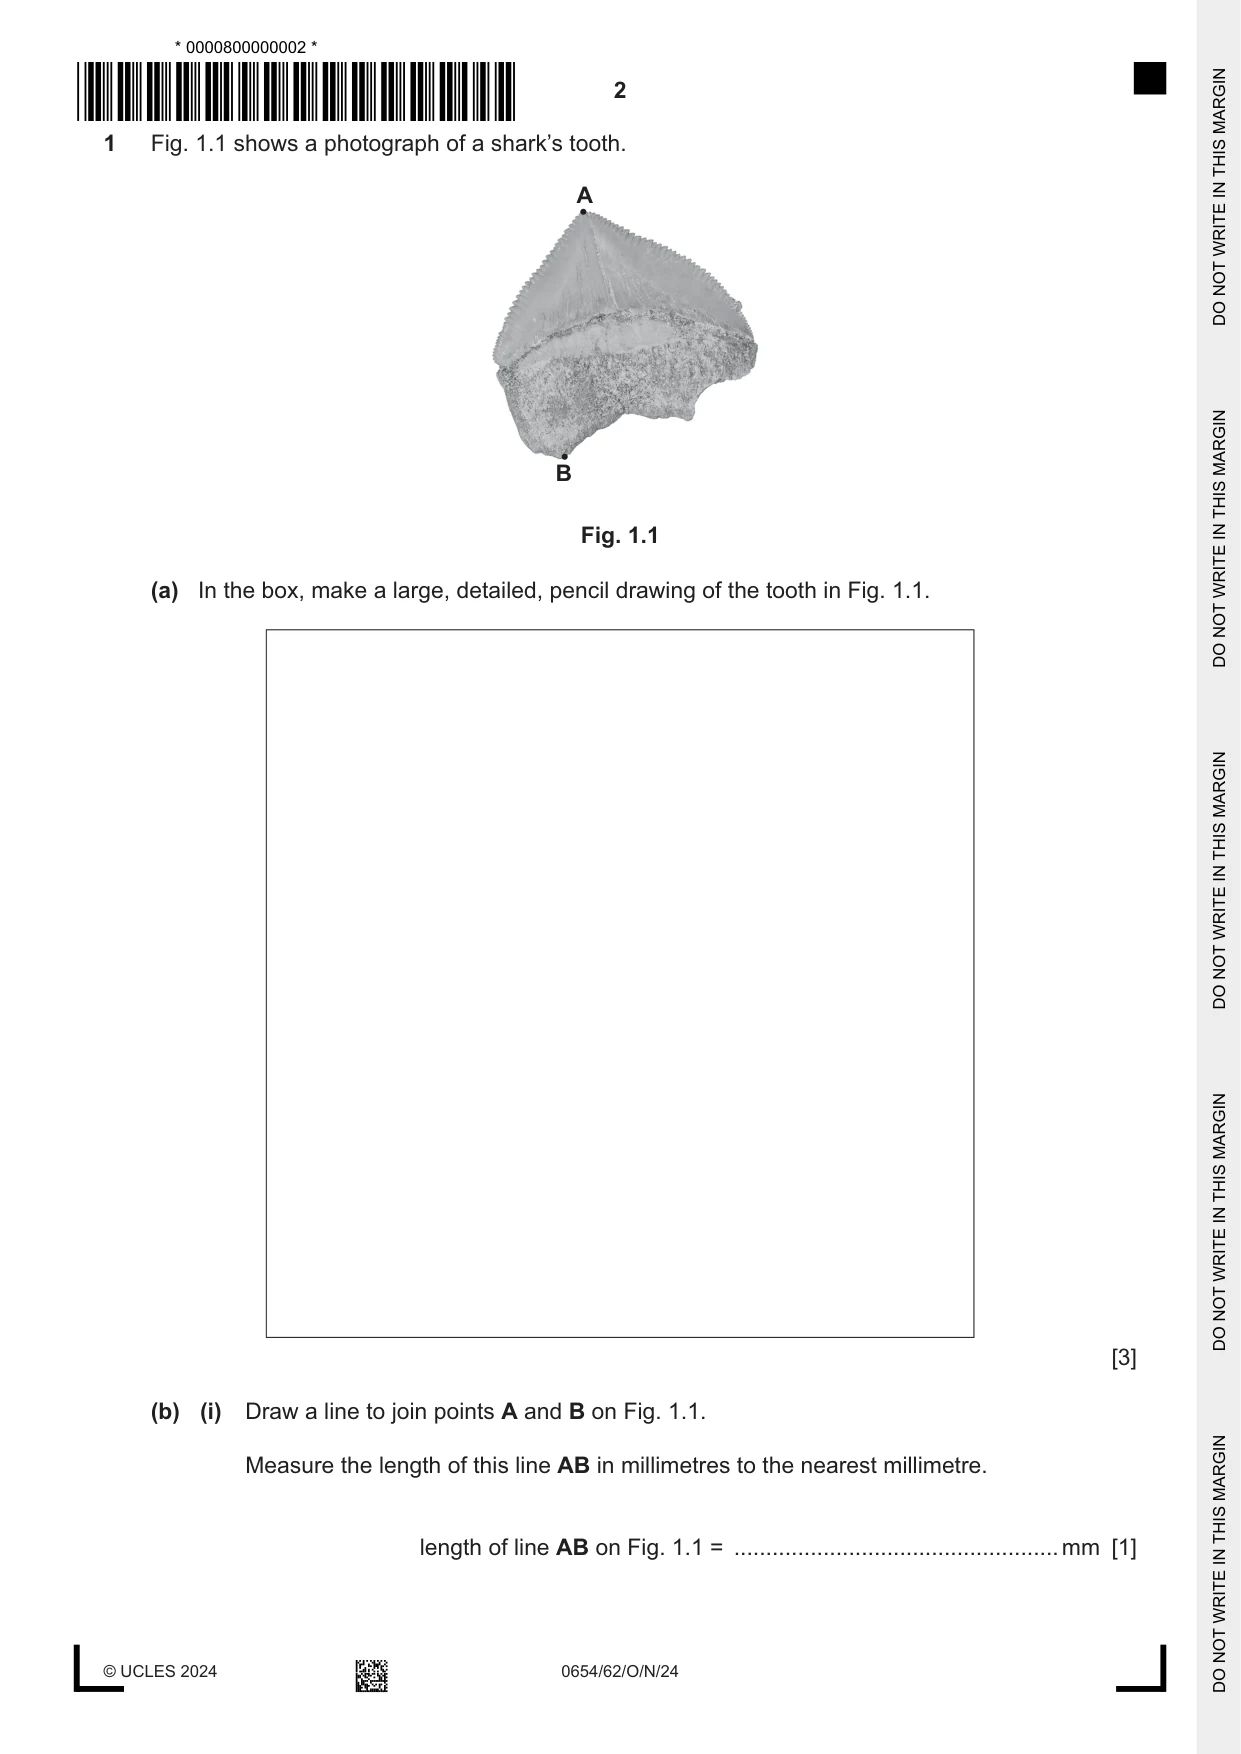
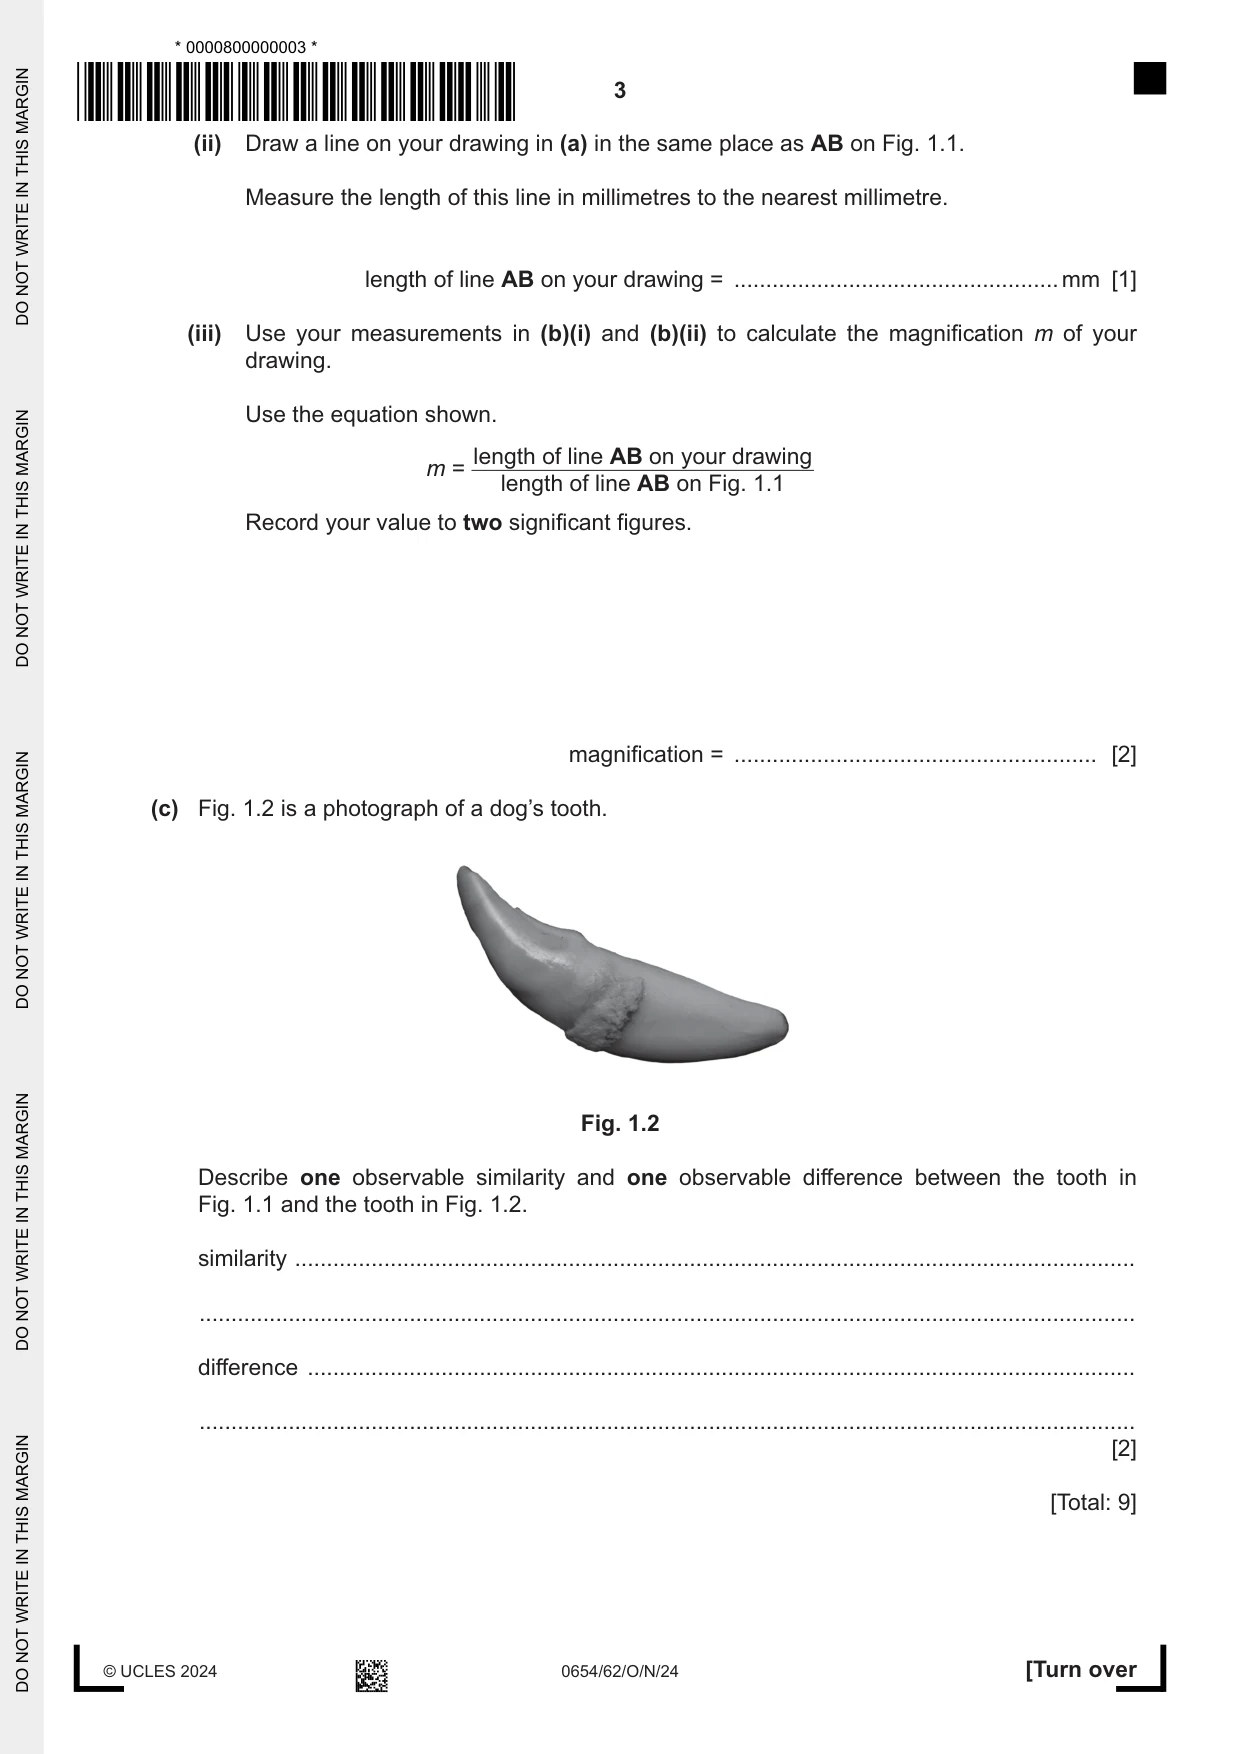
1 Fig. 1.1 shows a photograph of a shark’s tooth. A B Fig. 1.1 (a) In the box, make a large, detailed, pencil drawing of the tooth in Fig. 1.1. [3] (b) (i) Draw a line to join points A and B on Fig. 1.1. Measure the length of this line AB in millimetres to the nearest millimetre. length of line AB on Fig. 1.1 = ................................................... mm [1] (ii) Draw a line on your drawing in (a) in the same place as AB on Fig. 1.1. Measure the length of this line in millimetres to the nearest millimetre. length of line AB on your drawing = ................................................... mm [1] (iii) Use your measurements in (b)(i) and (b)(ii) to calculate the magnification m of your drawing. Use the equation shown. length of line AB on your drawing m = length of line AB on Fig. 1.1 Record your value to two significant figures. magnification = ......................................................... [2] (c) Fig. 1.2 is a photograph of a dog’s tooth. Fig. 1.2 Describe one observable similarity and one observable difference between the tooth in Fig. 1.1 and the tooth in Fig. 1.2. similarity .................................................................................................................................... ................................................................................................................................................... difference .................................................................................................................................. ................................................................................................................................................... [2] [Total: 9]
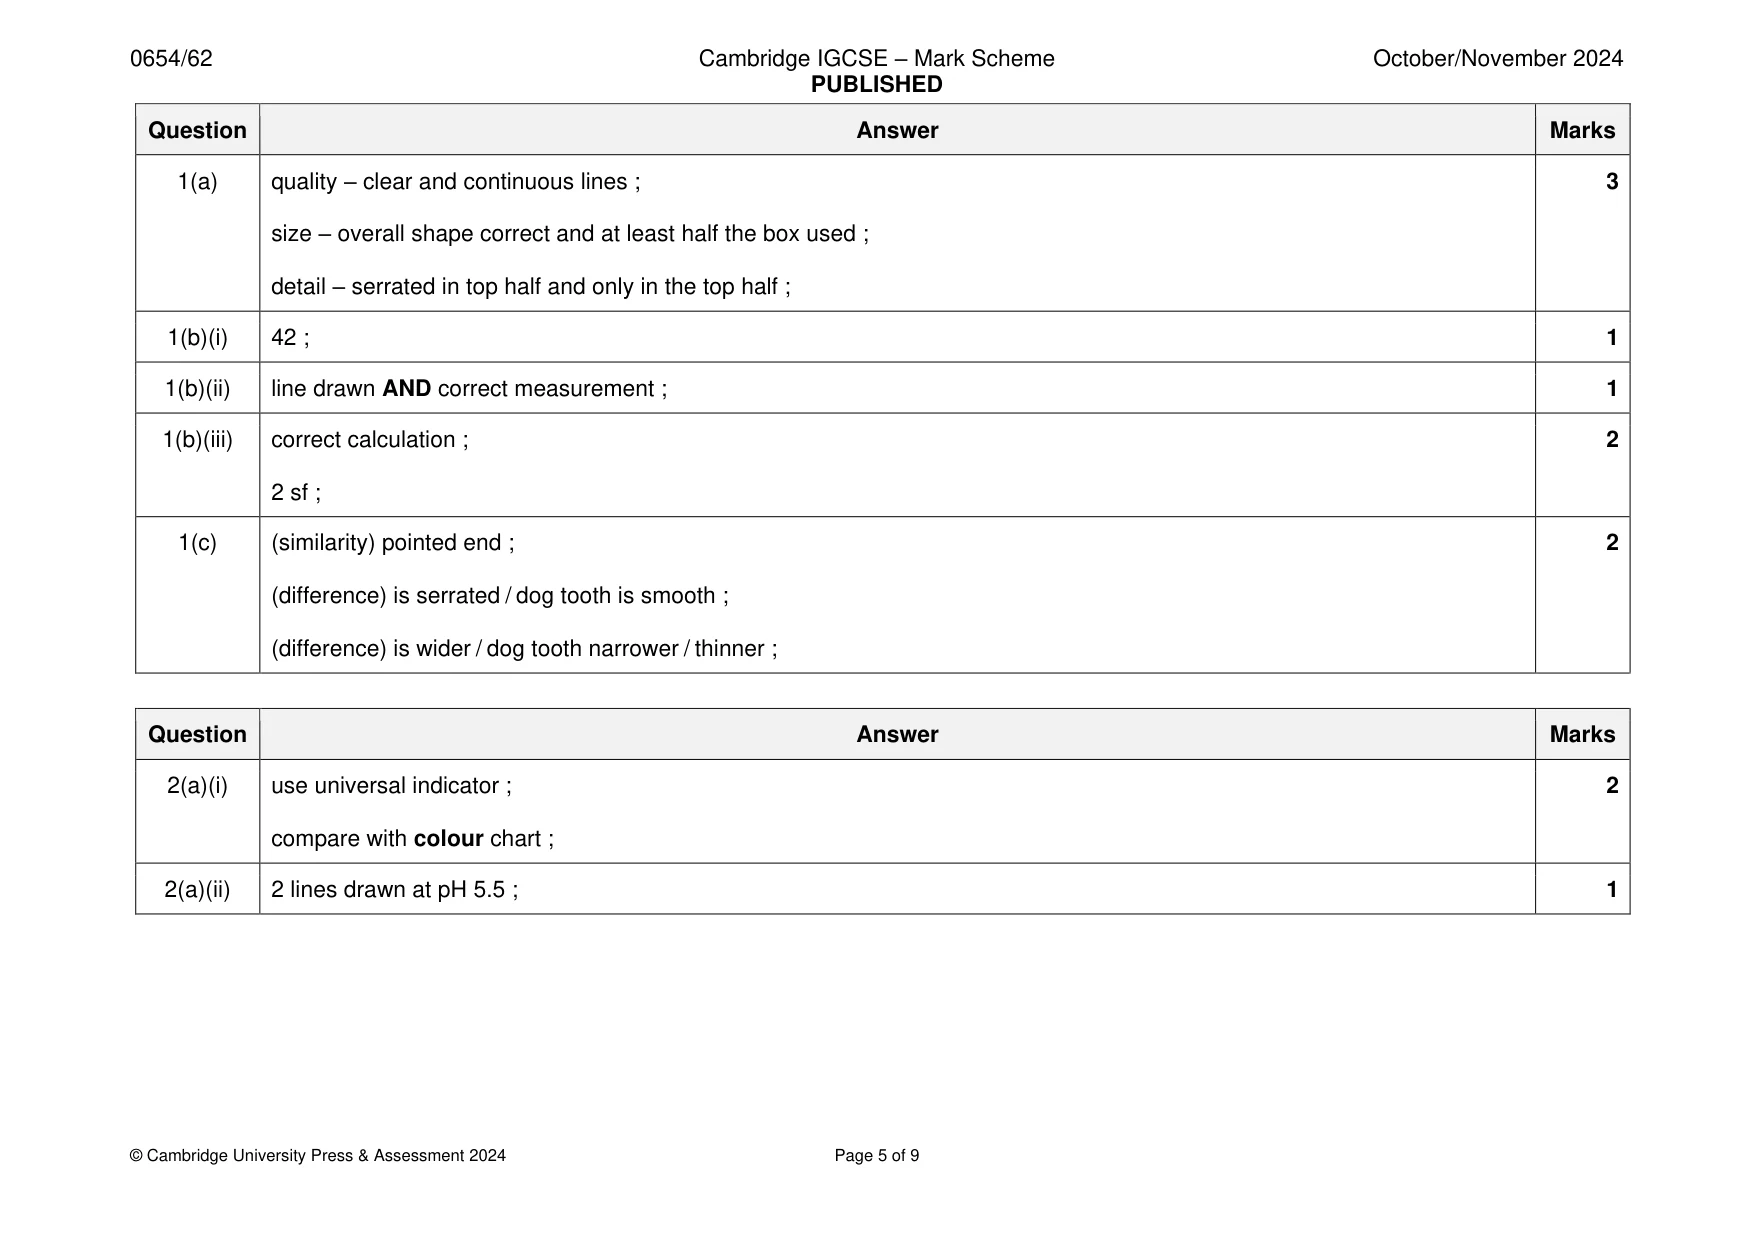
Mark scheme: Question Answer Marks 1(a) quality – clear and continuous lines ; 3 size – overall shape correct and at least half the box used ; detail – serrated in top half and only in the top half ; 1(b)(i) 42 ; 1 1(b)(ii) line drawn AND correct measurement ; 1 1(b)(iii) correct calculation ; 2 2 sf ; 1(c) (similarity) pointed end ; 2 (difference) is serrated / dog tooth is smooth ; (difference) is wider / dog tooth narrower / thinner ;
Q2 · Plaque is a layer of bacteria which forms on teeth
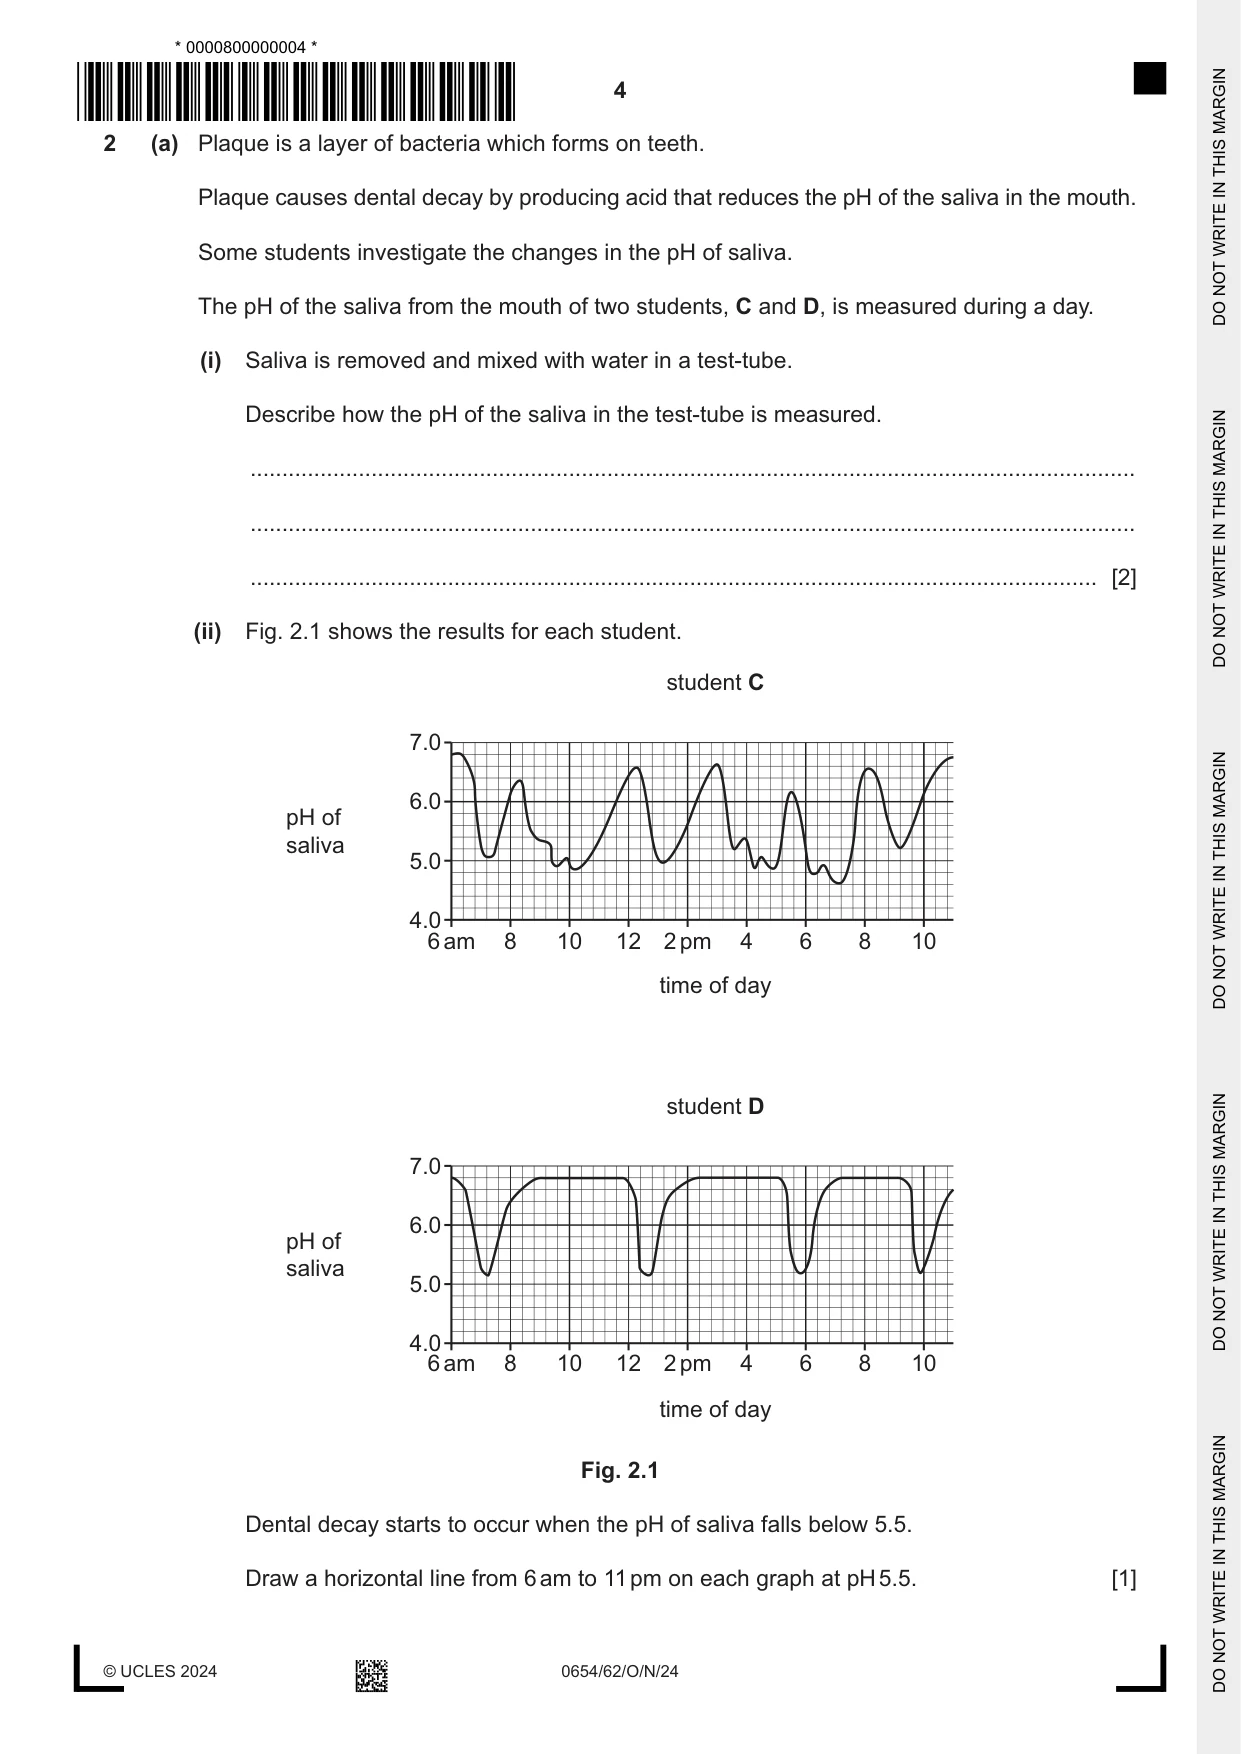
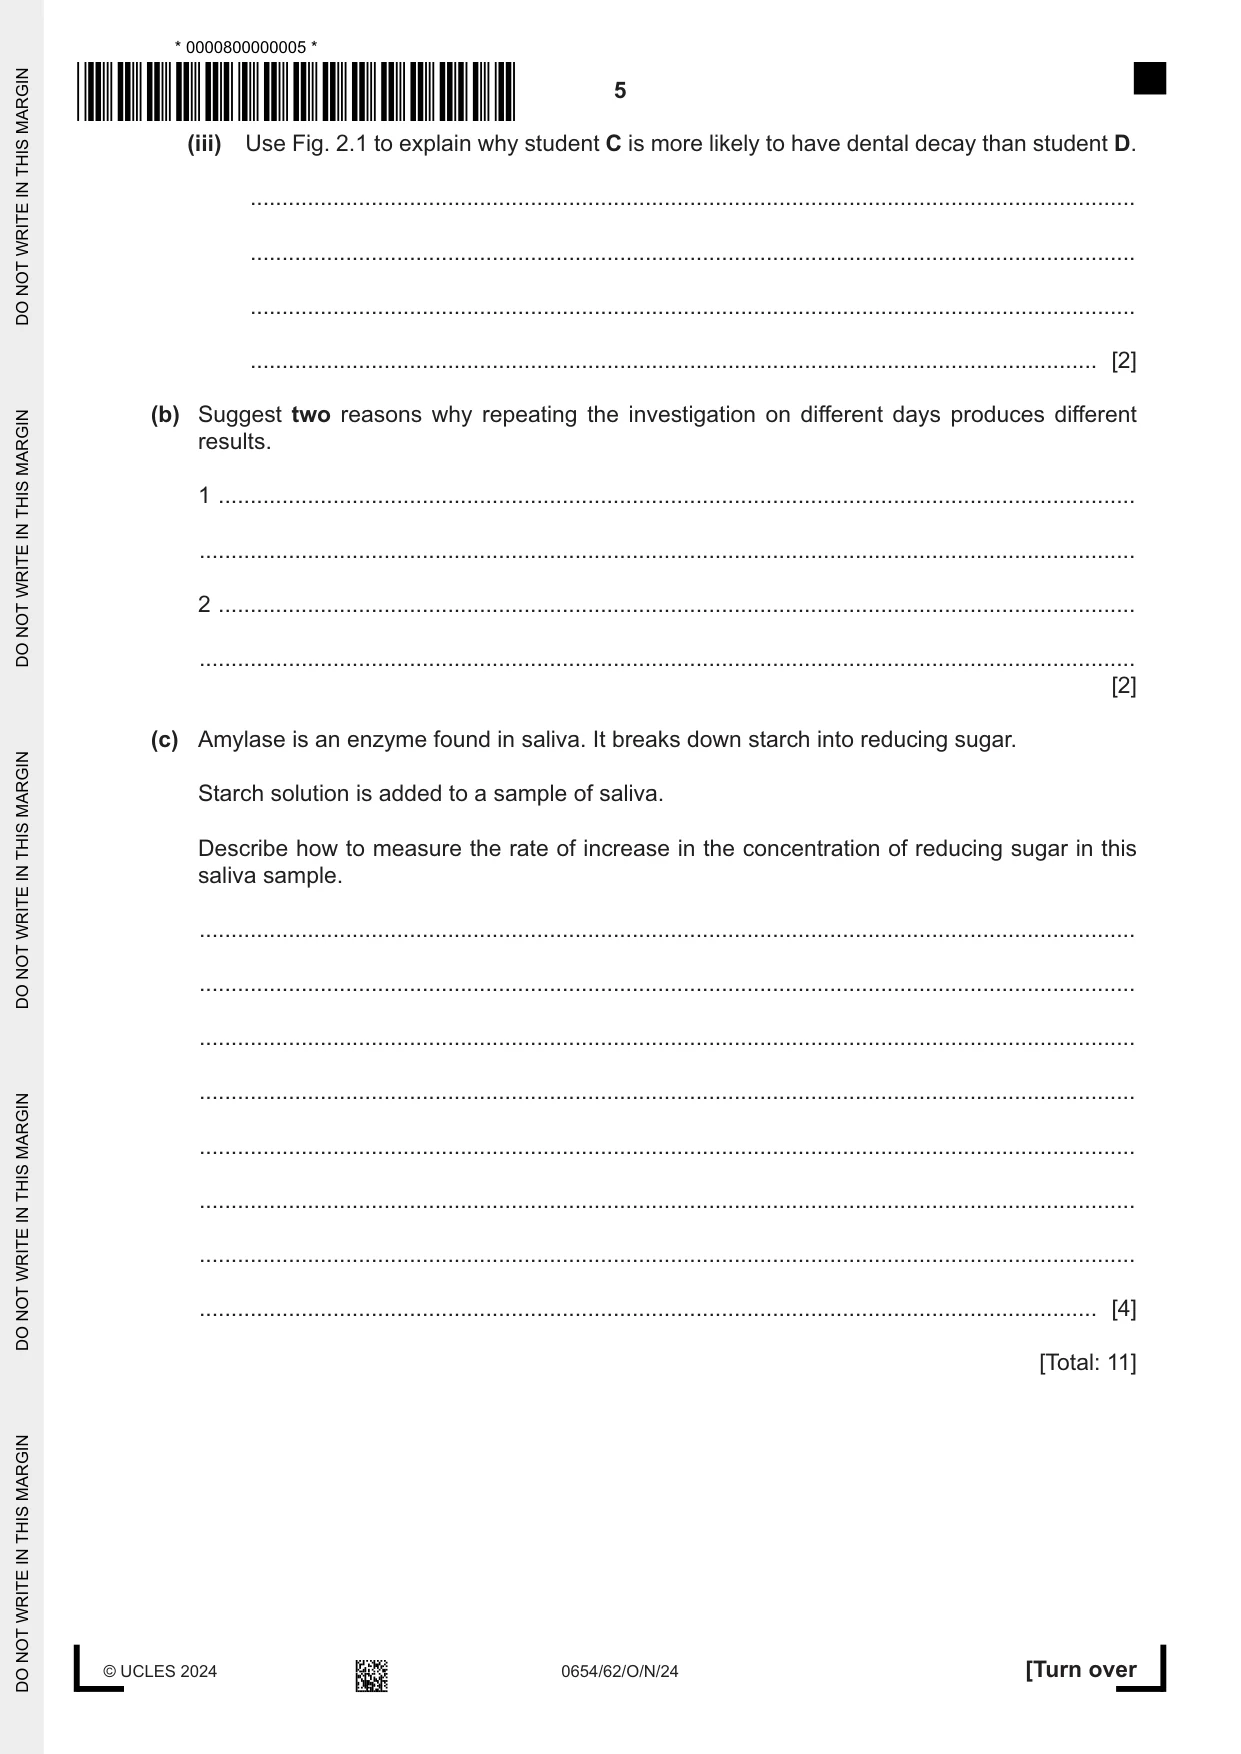
2 (a) Plaque is a layer of bacteria which forms on teeth. Plaque causes dental decay by producing acid that reduces the pH of the saliva in the mouth. Some students investigate the changes in the pH of saliva. The pH of the saliva from the mouth of two students, C and D, is measured during a day. (i) Saliva is removed and mixed with water in a test-tube. Describe how the pH of the saliva in the test-tube is measured. ........................................................................................................................................... ........................................................................................................................................... ..................................................................................................................................... [2] (ii) Fig. 2.1 shows the results for each student. student C 7.0 6.0 pH of saliva 5.0 4.0 6 am 8 10 12 2 pm 4 6 8 10 time of day student D 7.0 6.0 pH of saliva 5.0 4.0 6 am 8 10 12 2 pm 4 6 8 10 time of day Fig. 2.1 Dental decay starts to occur when the pH of saliva falls below 5.5. Draw a horizontal line from 6 am to 11 pm on each graph at pH 5.5. [1] (iii) Use Fig. 2.1 to explain why student C is more likely to have dental decay than student D. ........................................................................................................................................... ........................................................................................................................................... ........................................................................................................................................... ..................................................................................................................................... [2] (b) Suggest two reasons why repeating the investigation on different days produces different results. 1 ................................................................................................................................................ ................................................................................................................................................... 2 ................................................................................................................................................ ................................................................................................................................................... [2] (c) Amylase is an enzyme found in saliva. It breaks down starch into reducing sugar. Starch solution is added to a sample of saliva. Describe how to measure the rate of increase in the concentration of reducing sugar in this saliva sample. ................................................................................................................................................... ................................................................................................................................................... ................................................................................................................................................... ................................................................................................................................................... ................................................................................................................................................... ................................................................................................................................................... ................................................................................................................................................... ............................................................................................................................................. [4] [Total: 11]
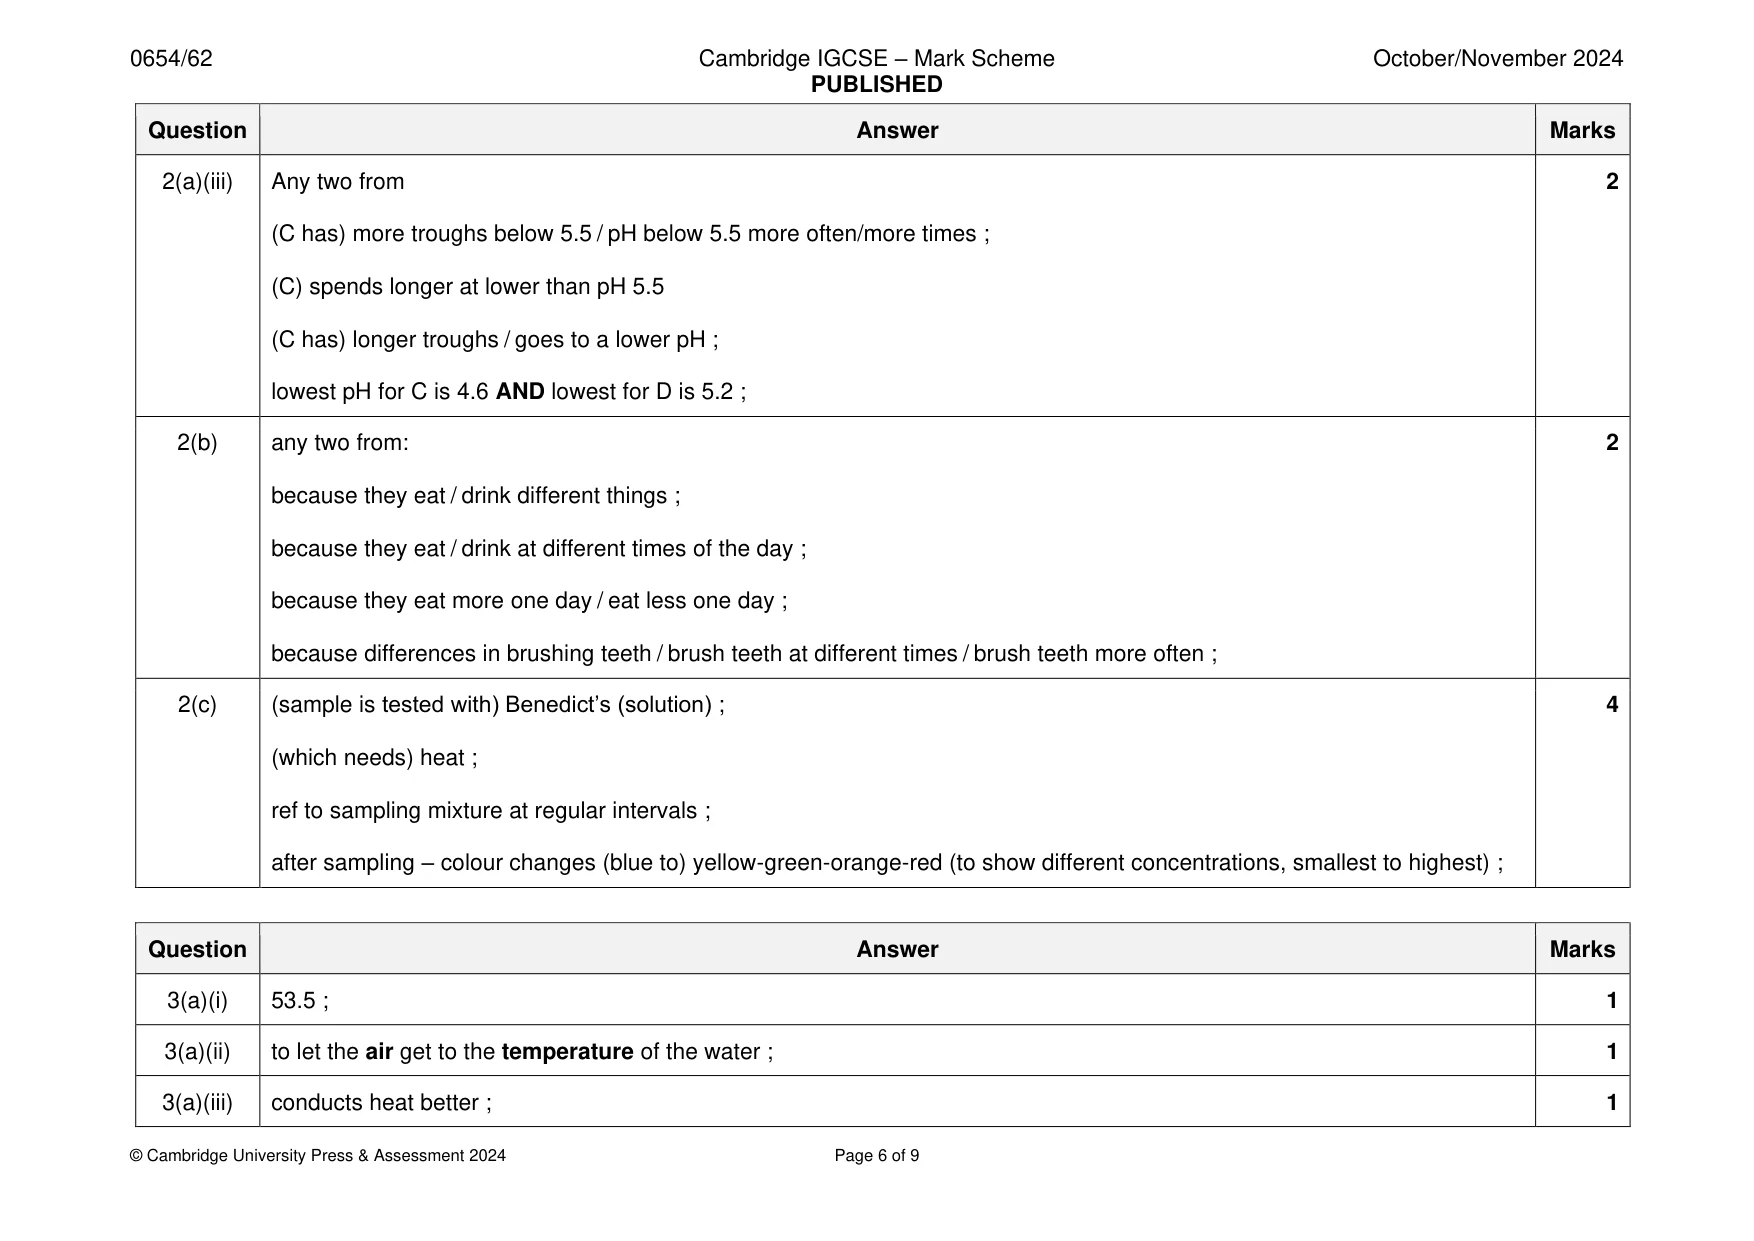
Mark scheme: 2(a)(i) use universal indicator ; 2 compare with colour chart ; 2(a)(ii) 2 lines drawn at pH 5.5 ; 1 2(a)(iii) Any two from 2 (C has) more troughs below 5.5 / pH below 5.5 more often/more times ; (C) spends longer at lower than pH 5.5 (C has) longer troughs / goes to a lower pH ; lowest pH for C is 4.6 AND lowest for D is 5.2 ; 2(b) any two from: 2 because they eat / drink different things ; because they eat / drink at different times of the day ; because they eat more one day / eat less one day ; because differences in brushing teeth / brush teeth at different times / brush teeth more often ; 2(c) (sample is tested with) Benedict’s (solution) ; 4 (which needs) heat ; ref to sampling mixture at regular intervals ; after sampling – colour changes (blue to) yellow-green-orange-red (to show different concentrations, smallest to highest) ;
Q3 · A student investigates the effect of temperature on the volume of a gas
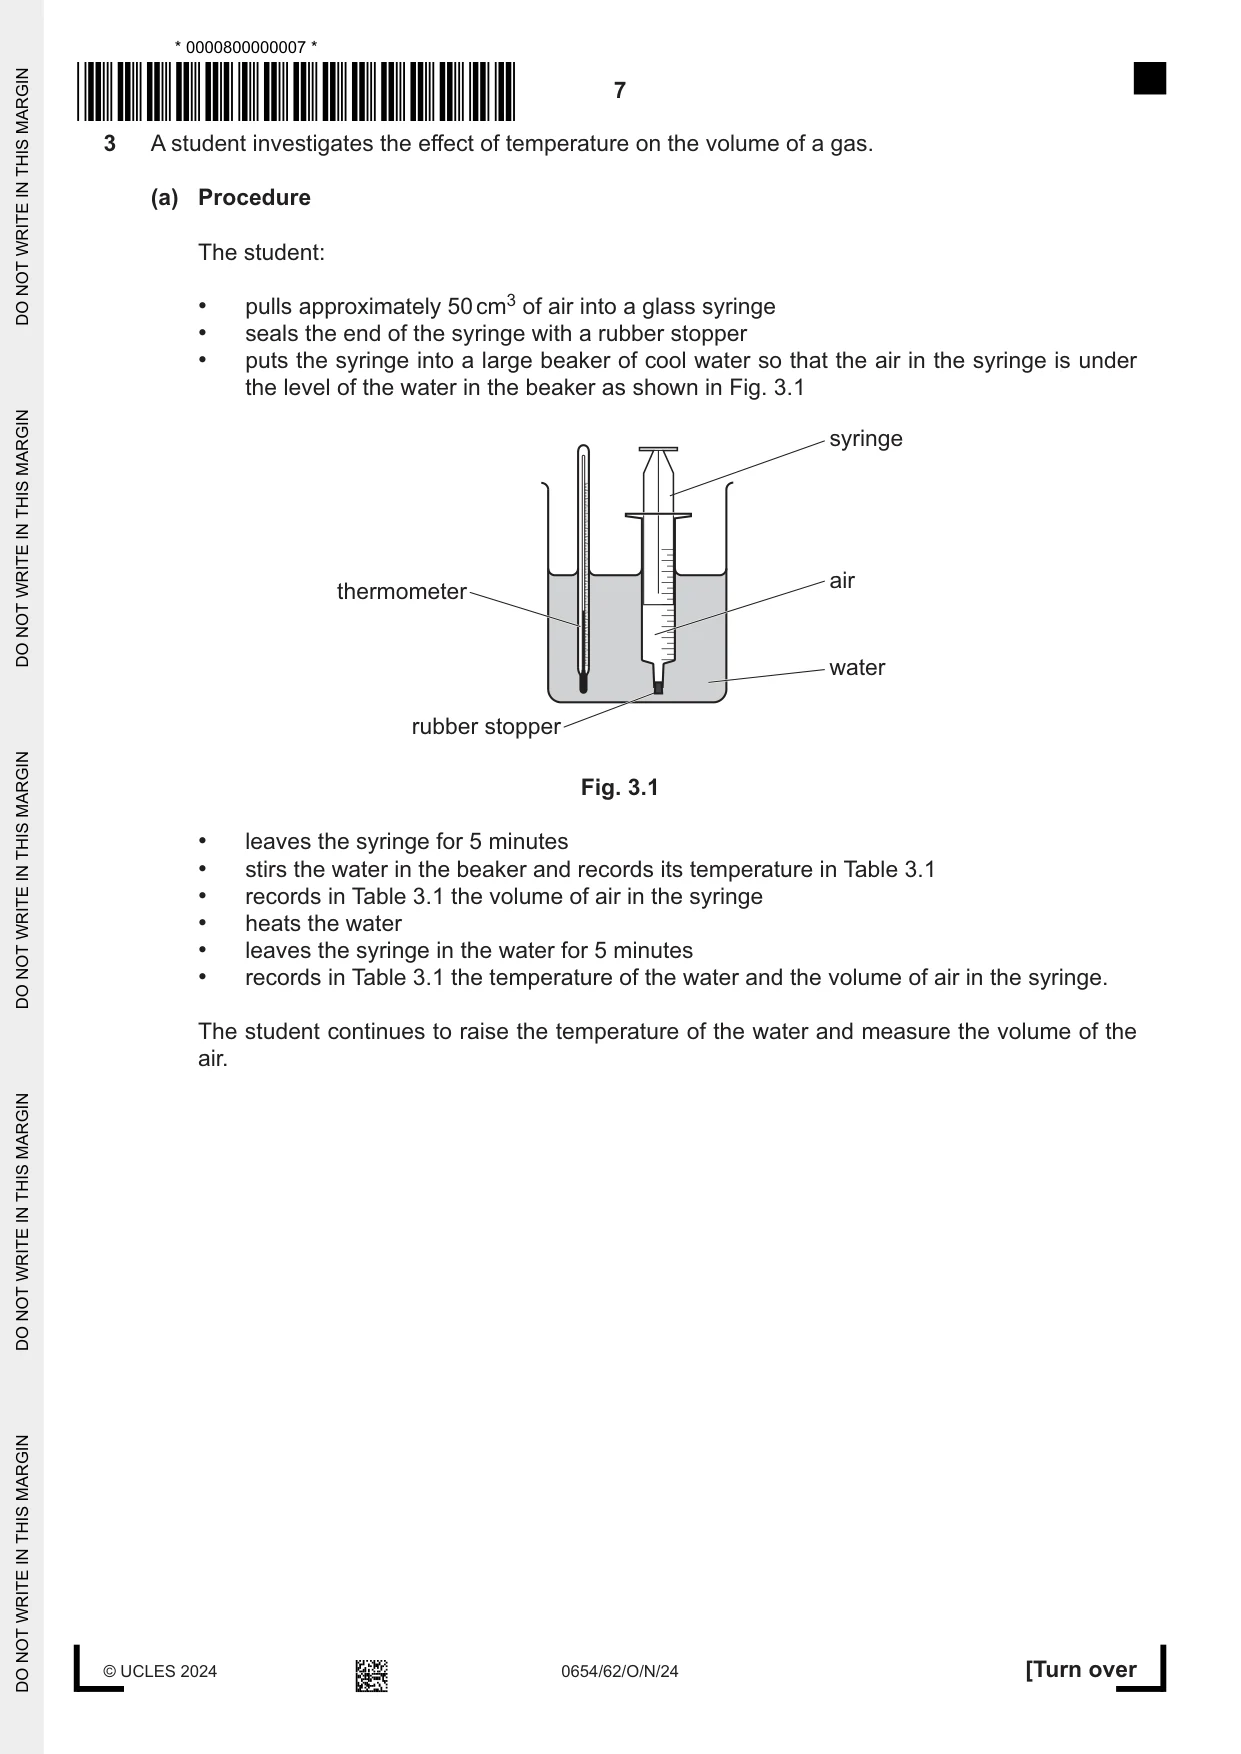
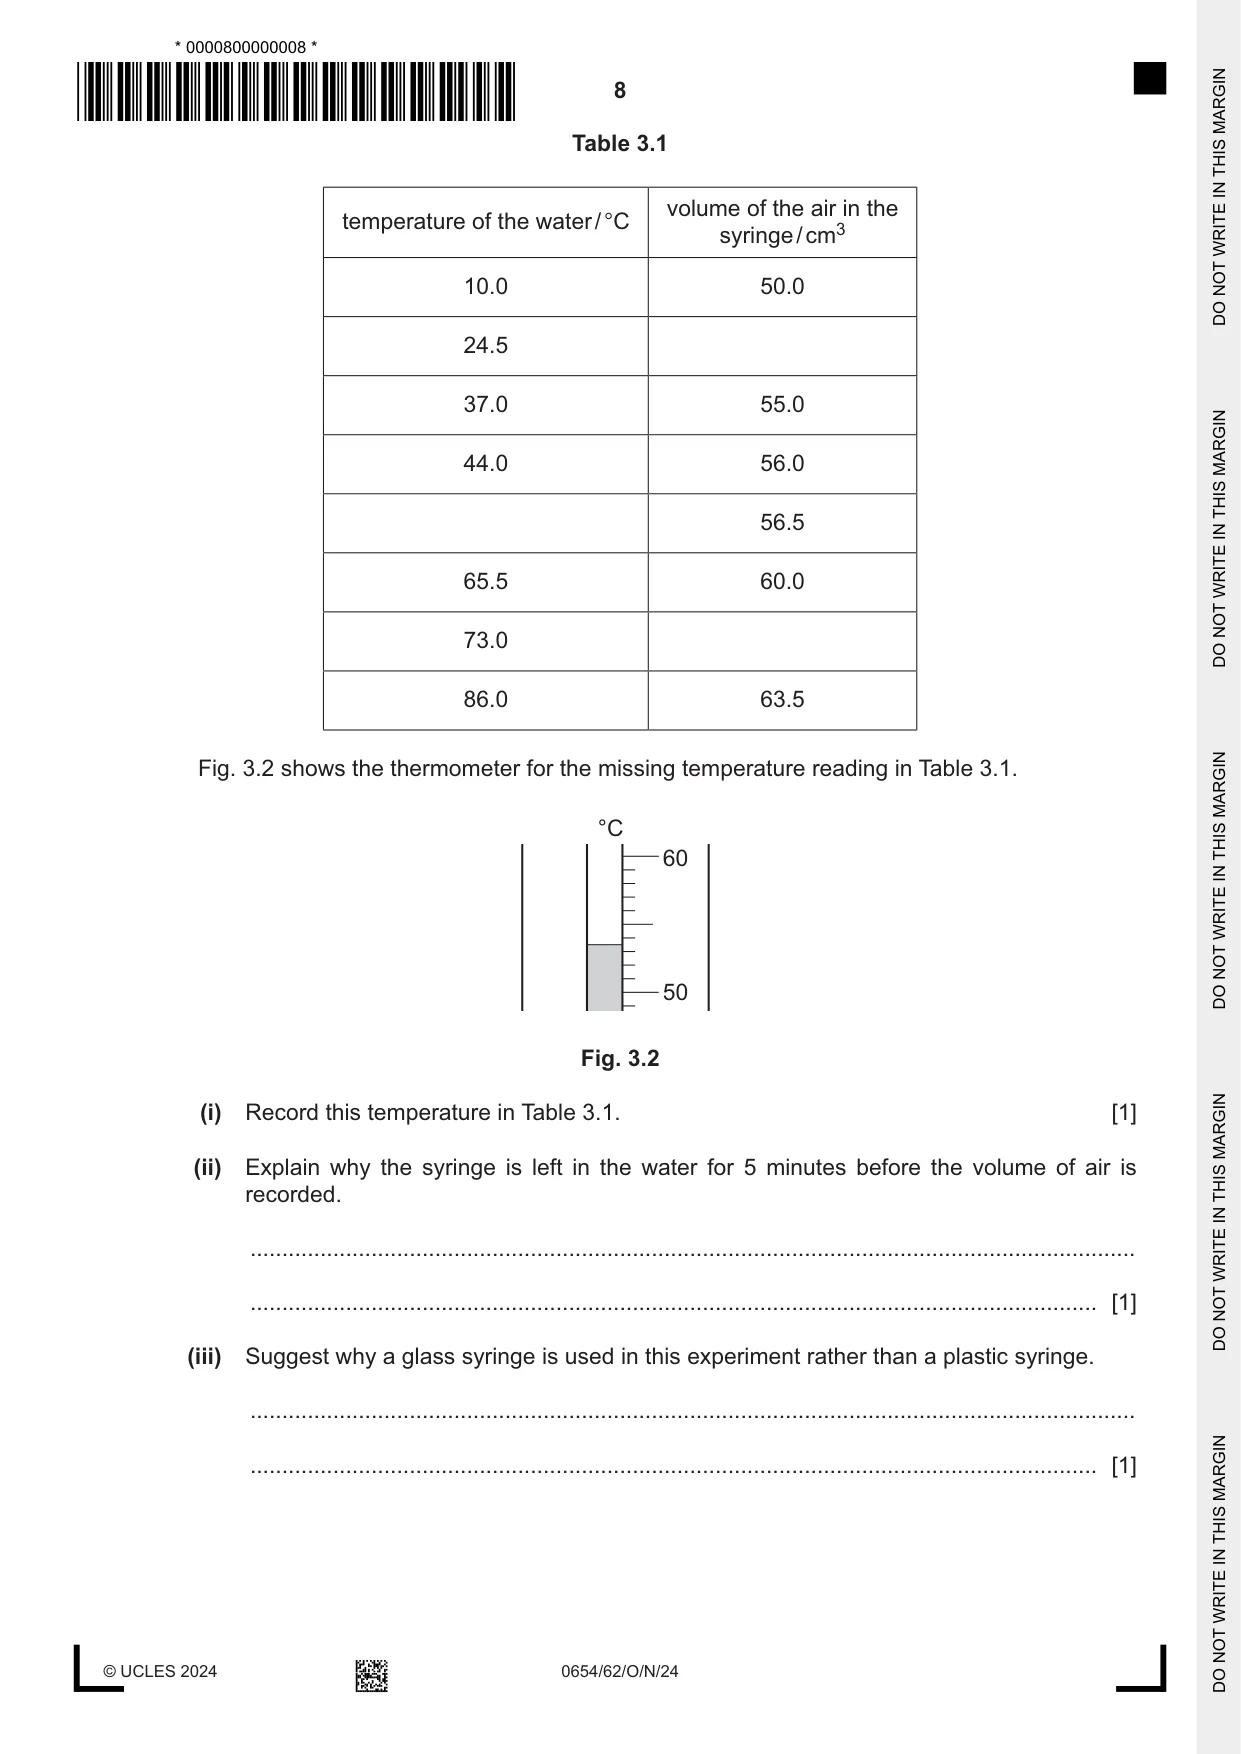
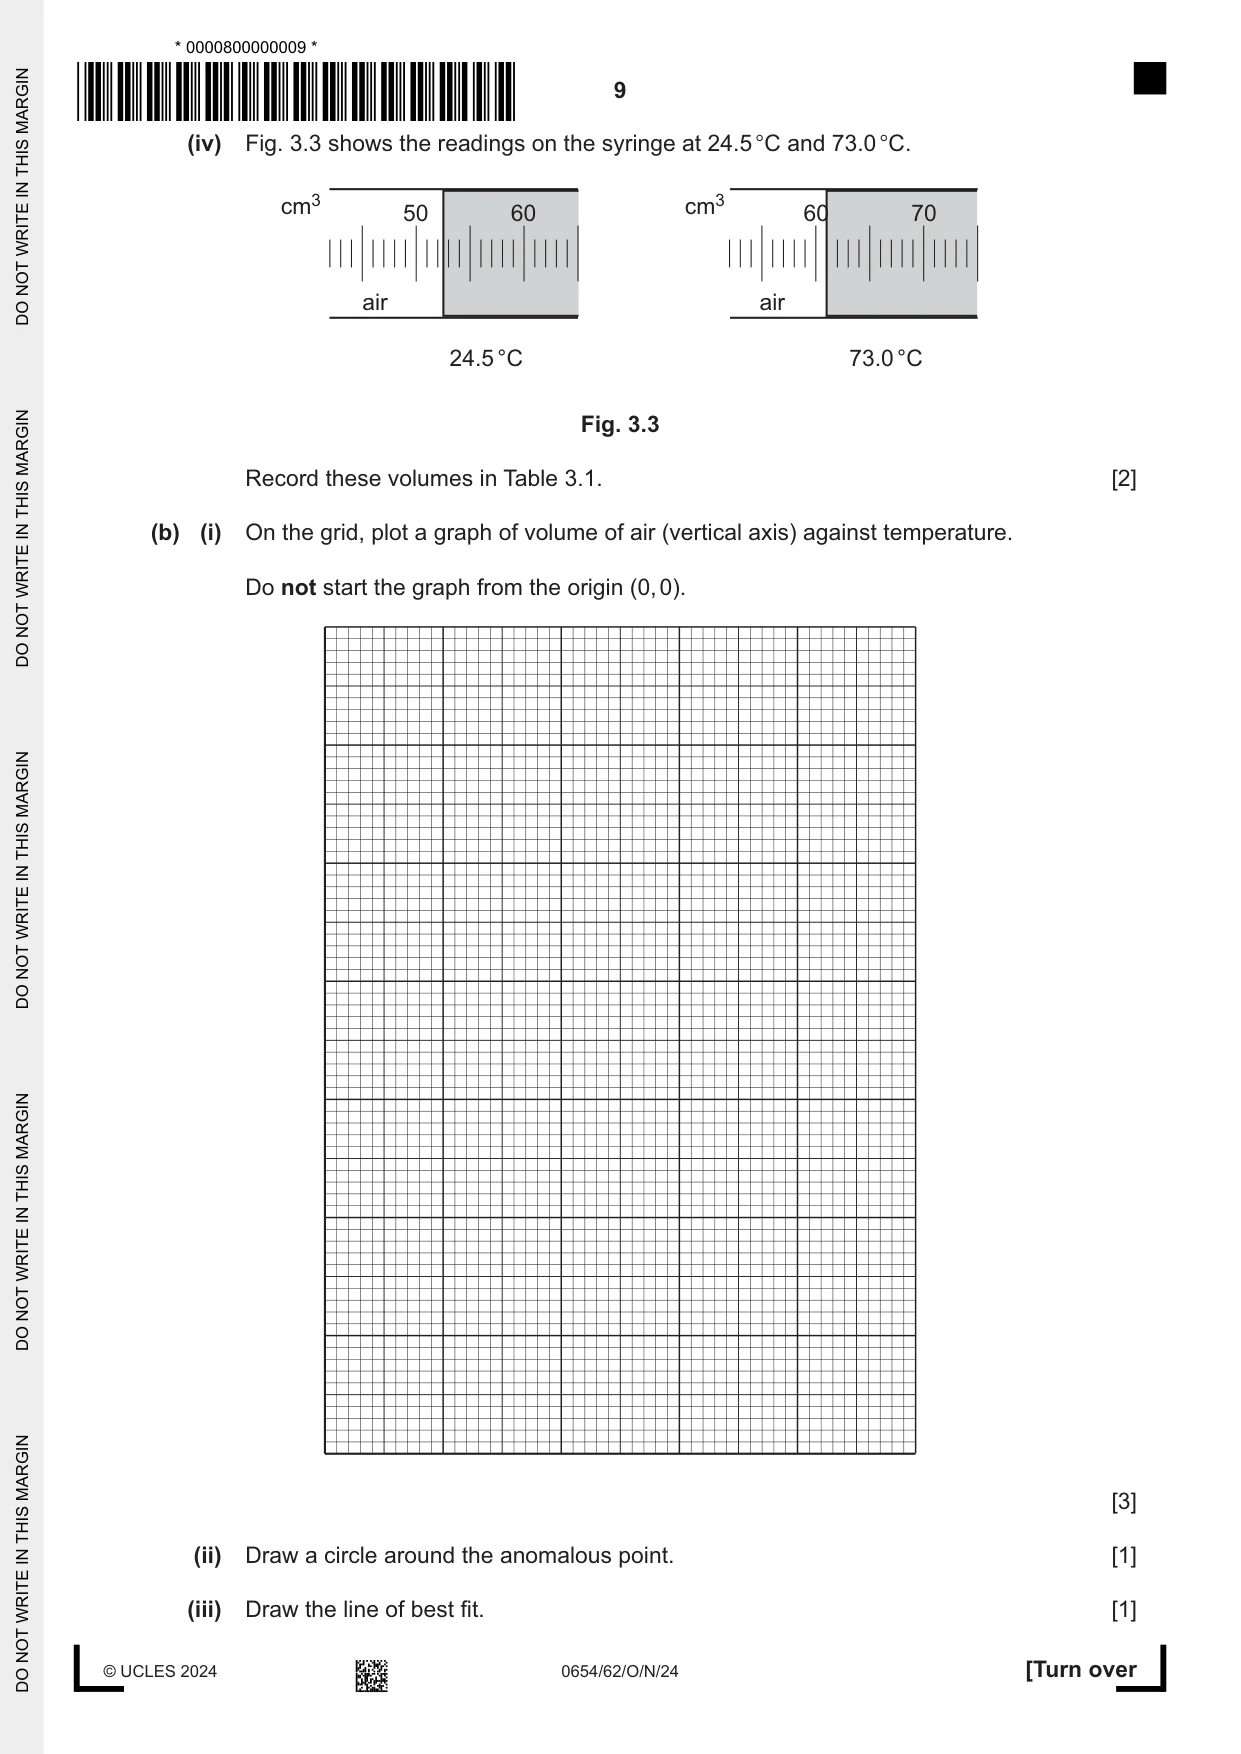
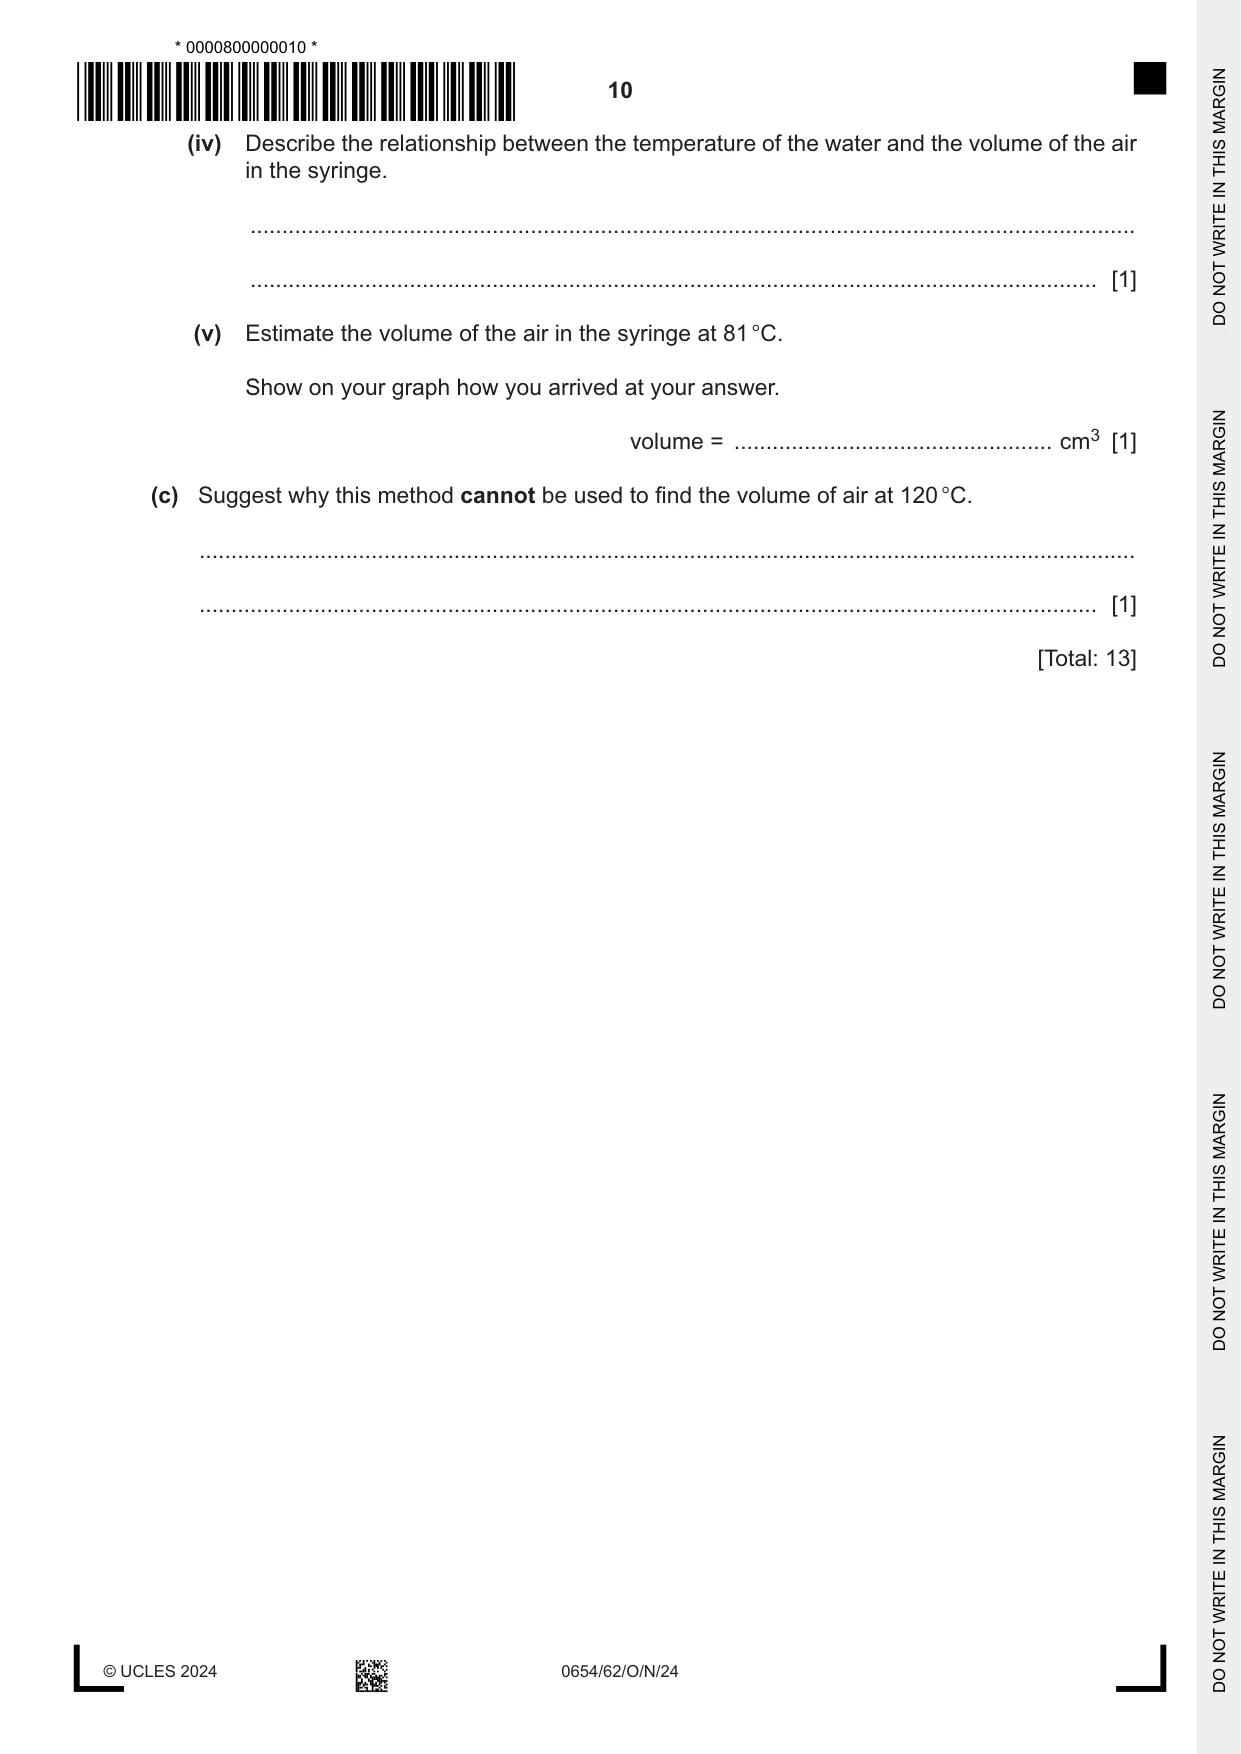
3 A student investigates the effect of temperature on the volume of a gas. (a) Procedure The student: • pulls approximately 50 cm3 of air into a glass syringe • seals the end of the syringe with a rubber stopper • puts the syringe into a large beaker of cool water so that the air in the syringe is under the level of the water in the beaker as shown in Fig. 3.1 syringe air thermometer water rubber stopper Fig. 3.1 • leaves the syringe for 5 minutes • stirs the water in the beaker and records its temperature in Table 3.1 • records in Table 3.1 the volume of air in the syringe • heats the water • leaves the syringe in the water for 5 minutes • records in Table 3.1 the temperature of the water and the volume of air in the syringe. The student continues to raise the temperature of the water and measure the volume of the air. Table 3.1 volume of the air in the temperature of the water / °C syringe / cm3 10.0 50.0 24.5 37.0 55.0 44.0 56.0 56.5 65.5 60.0 73.0 86.0 63.5 Fig. 3.2 shows the thermometer for the missing temperature reading in Table 3.1. °C 60 50 Fig. 3.2 (i) Record this temperature in Table 3.1. [1] (ii) Explain why the syringe is left in the water for 5 minutes before the volume of air is recorded. ........................................................................................................................................... ..................................................................................................................................... [1] (iii) Suggest why a glass syringe is used in this experiment rather than a plastic syringe. ........................................................................................................................................... ..................................................................................................................................... [1] (iv) Fig. 3.3 shows the readings on the syringe at 24.5 °C and 73.0 °C. cm3 cm3 50 60 60 70 air air 24.5 °C 73.0 °C Fig. 3.3 Record these volumes in Table 3.1. [2] (b) (i) On the grid, plot a graph of volume of air (vertical axis) against temperature. Do not start the graph from the origin (0, 0). [3] (ii) Draw a circle around the anomalous point. [1] (iii) Draw the line of best fit. [1] (iv) Describe the relationship between the temperature of the water and the volume of the air in the syringe. ........................................................................................................................................... ..................................................................................................................................... [1] (v) Estimate the volume of the air in the syringe at 81 °C. Show on your graph how you arrived at your answer. volume = .................................................. cm3 [1] (c) Suggest why this method cannot be used to find the volume of air at 120 °C. ................................................................................................................................................... ............................................................................................................................................. [1] [Total: 13]
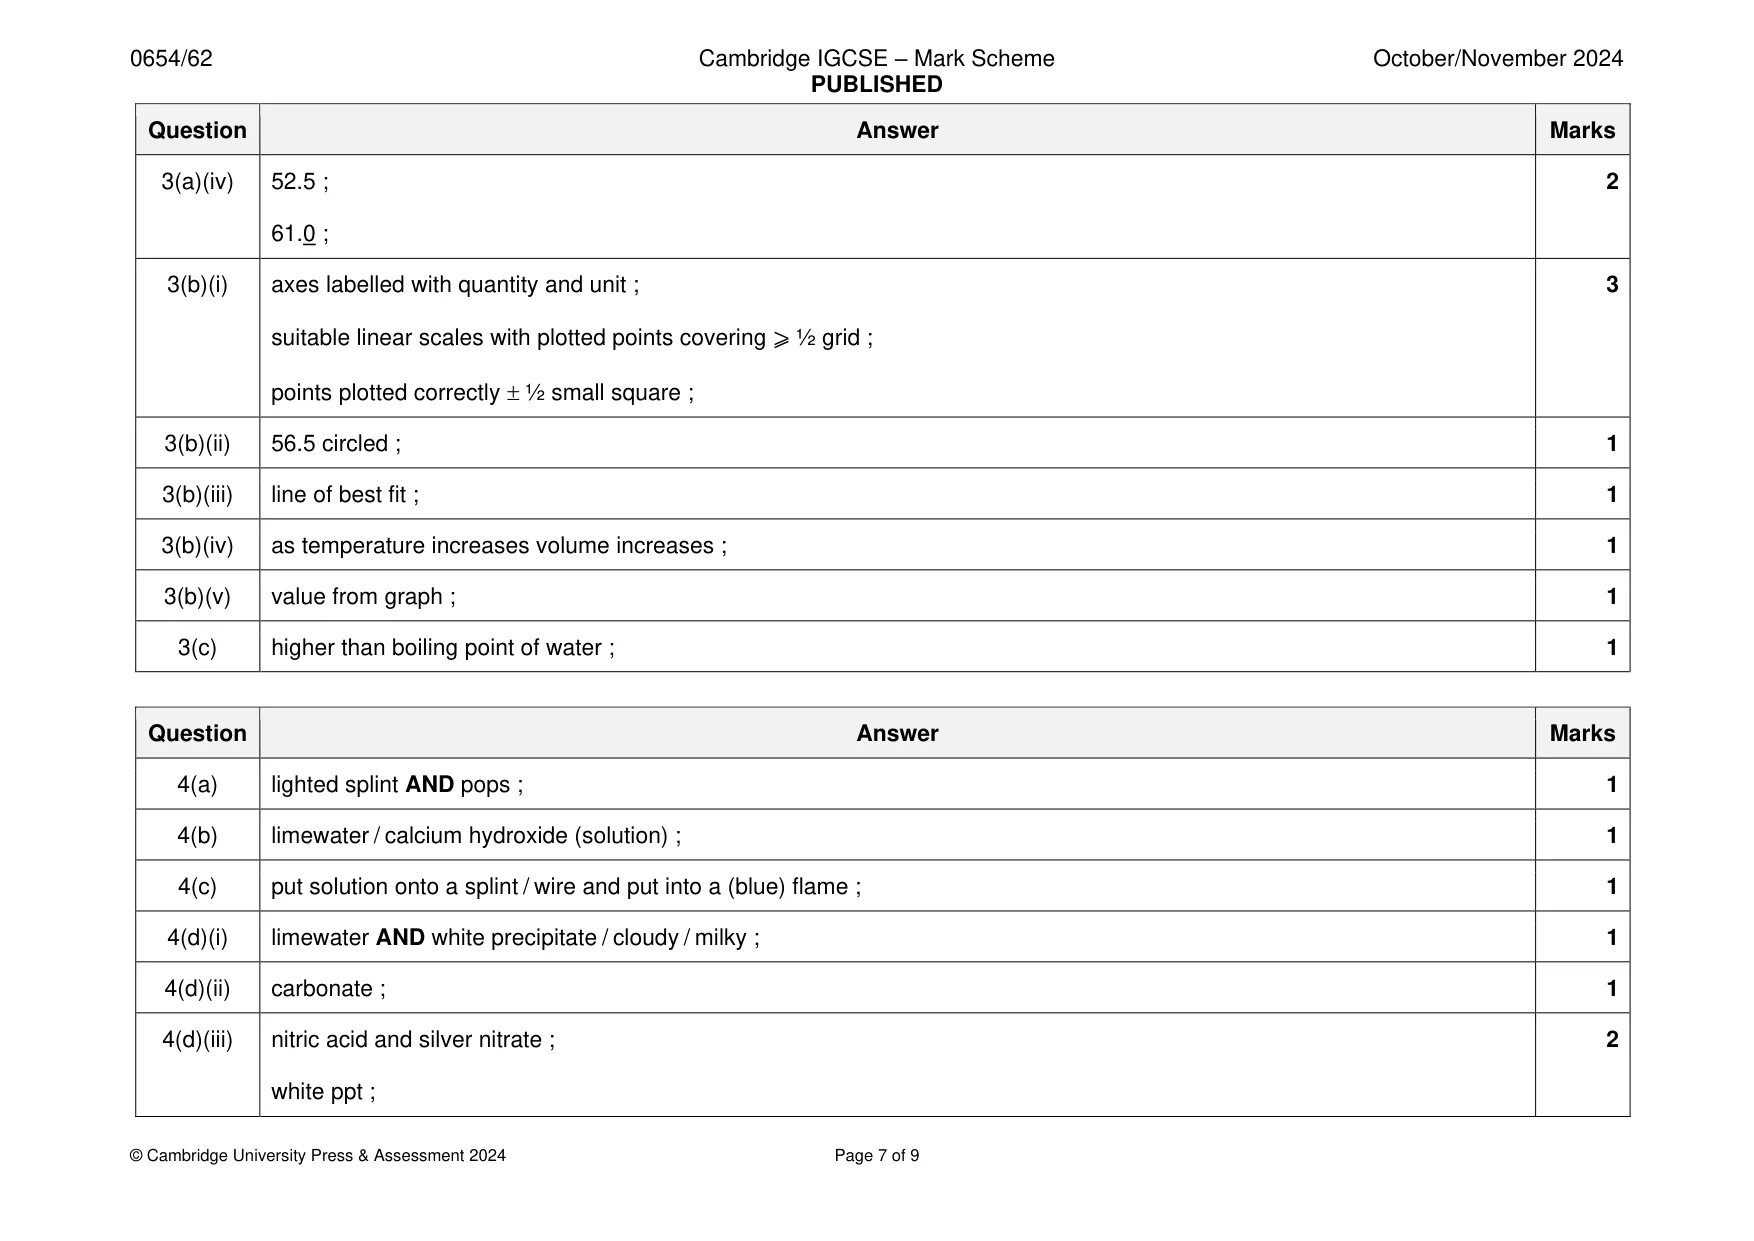
Mark scheme: 3(a)(i) 53.5 ; 1 3(a)(ii) to let the air get to the temperature of the water ; 1 3(a)(iii) conducts heat better ; 1 3(a)(iv) 52.5 ; 2 61.0 ; 3(b)(i) axes labelled with quantity and unit ; 3 suitable linear scales with plotted points covering ⩾ ½ grid ; points plotted correctly ½ small square ; 3(b)(ii) 56.5 circled ; 1 3(b)(iii) line of best fit ; 1 3(b)(iv) as temperature increases volume increases ; 1 3(b)(v) value from graph ; 1 3(c) higher than boiling point of water ; 1
Q4 · A student investigates the identity of a metal H
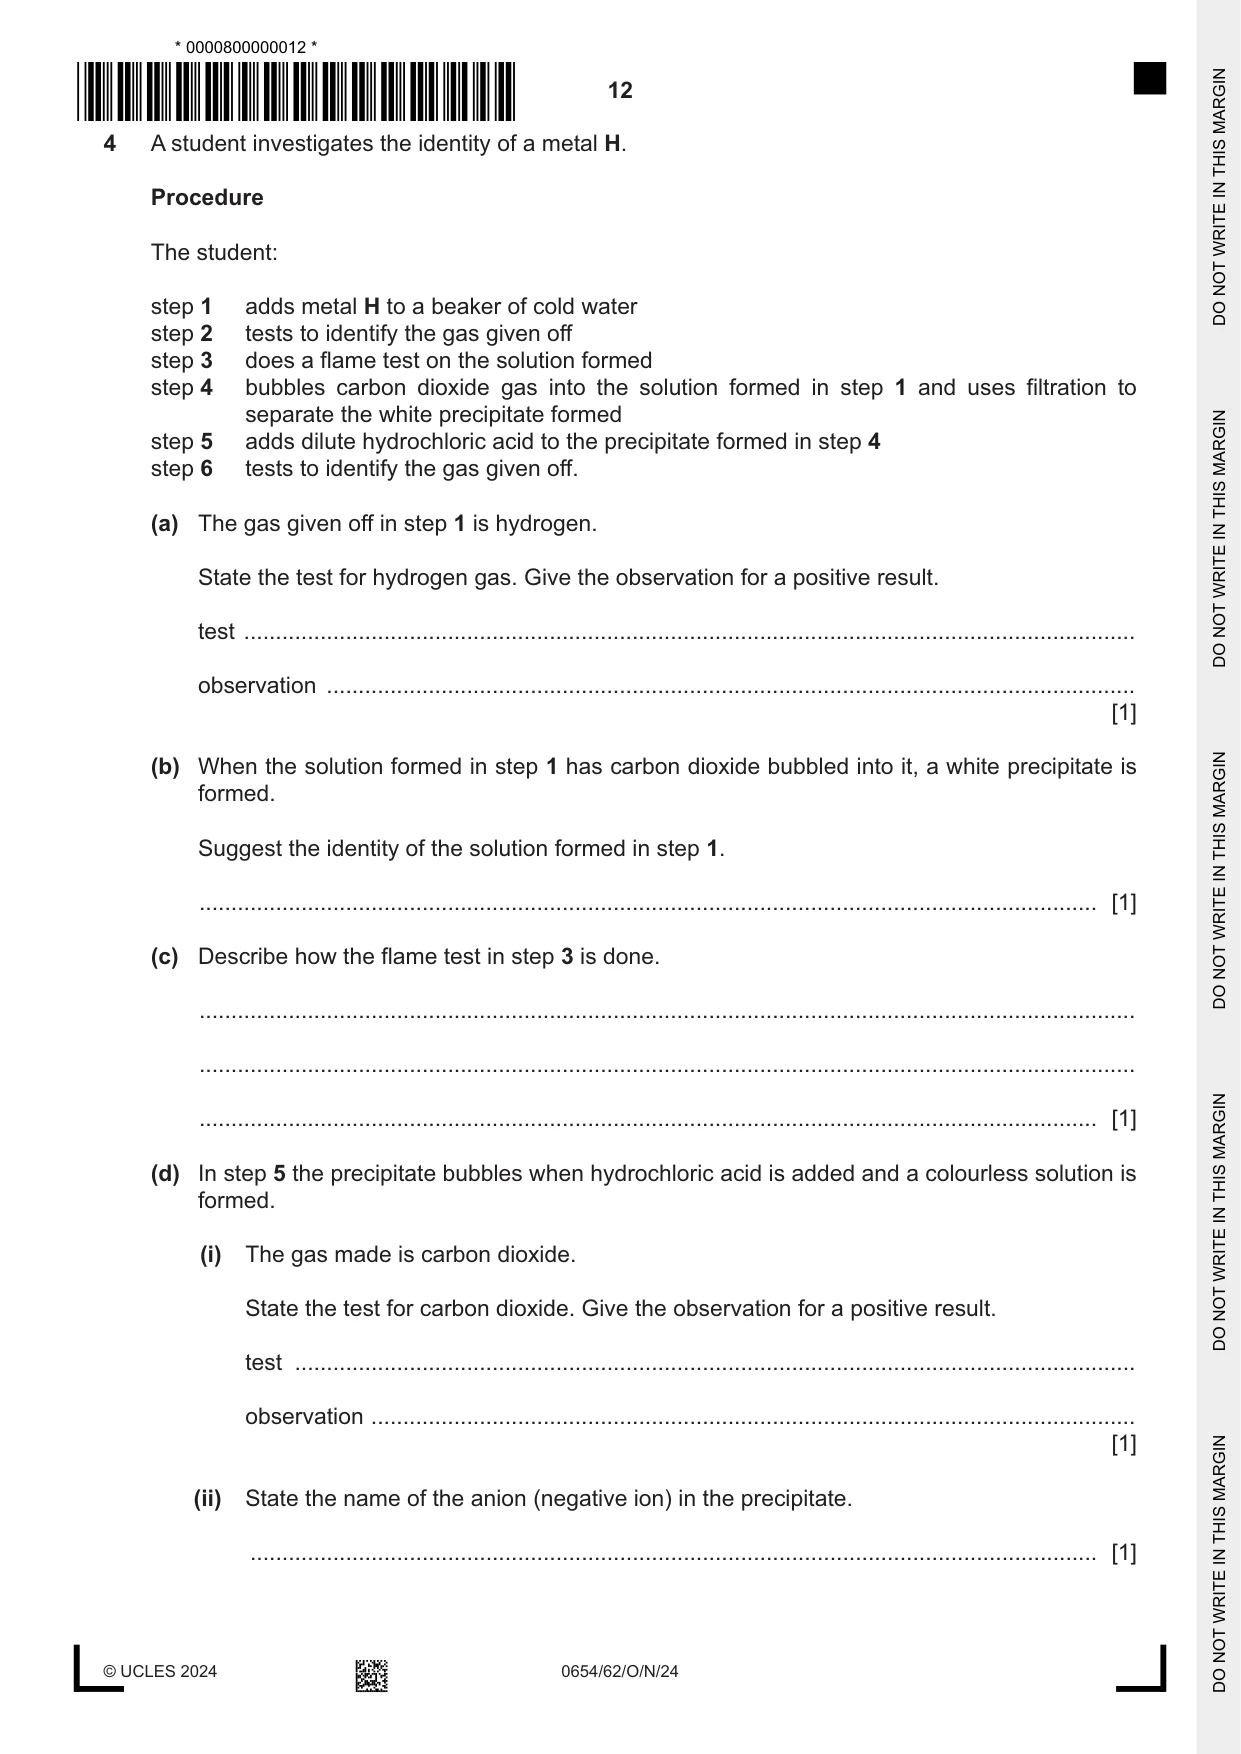
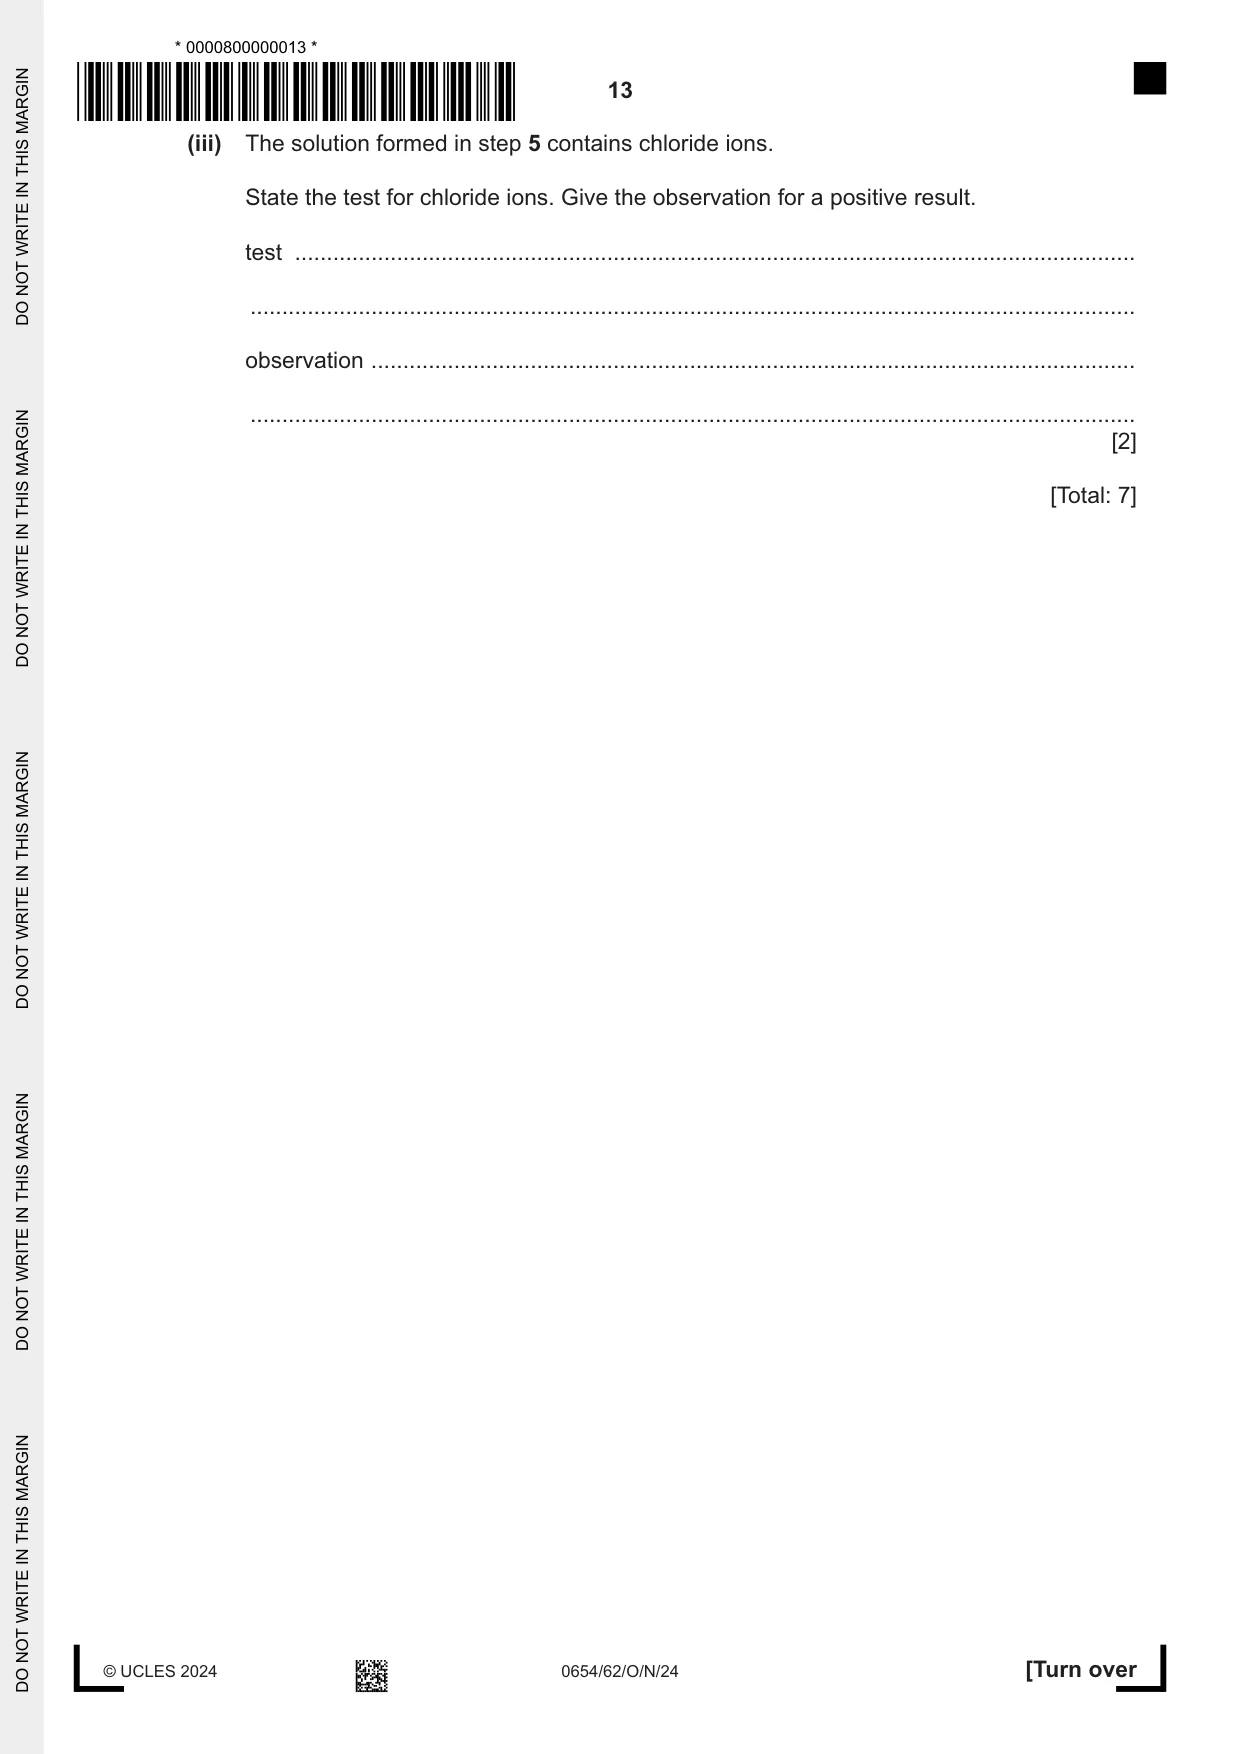
4 A student investigates the identity of a metal H. Procedure The student: step 1 adds metal H to a beaker of cold water step 2 tests to identify the gas given off step 3 does a flame test on the solution formed step 4 bubbles carbon dioxide gas into the solution formed in step 1 and uses filtration to separate the white precipitate formed step 5 adds dilute hydrochloric acid to the precipitate formed in step 4 step 6 tests to identify the gas given off. (a) The gas given off in step 1 is hydrogen. State the test for hydrogen gas. Give the observation for a positive result. test ............................................................................................................................................ observation ............................................................................................................................... [1] (b) When the solution formed in step 1 has carbon dioxide bubbled into it, a white precipitate is formed. Suggest the identity of the solution formed in step 1. ............................................................................................................................................. [1] (c) Describe how the flame test in step 3 is done. ................................................................................................................................................... ................................................................................................................................................... ............................................................................................................................................. [1] (d) In step 5 the precipitate bubbles when hydrochloric acid is added and a colourless solution is formed. (i) The gas made is carbon dioxide. State the test for carbon dioxide. Give the observation for a positive result. test .................................................................................................................................... observation ........................................................................................................................ [1] (ii) State the name of the anion (negative ion) in the precipitate. ..................................................................................................................................... [1] (iii) The solution formed in step 5 contains chloride ions. State the test for chloride ions. Give the observation for a positive result. test .................................................................................................................................... ........................................................................................................................................... observation ........................................................................................................................ ........................................................................................................................................... [2] [Total: 7]
Mark scheme: 4(a) lighted splint AND pops ; 1 4(b) limewater / calcium hydroxide (solution) ; 1 4(c) put solution onto a splint / wire and put into a (blue) flame ; 1 4(d)(i) limewater AND white precipitate / cloudy / milky ; 1 4(d)(ii) carbonate ; 1 4(d)(iii) nitric acid and silver nitrate ; 2 white ppt ;
Q5 · A student investigates the combined resistance of different combinations of identical…
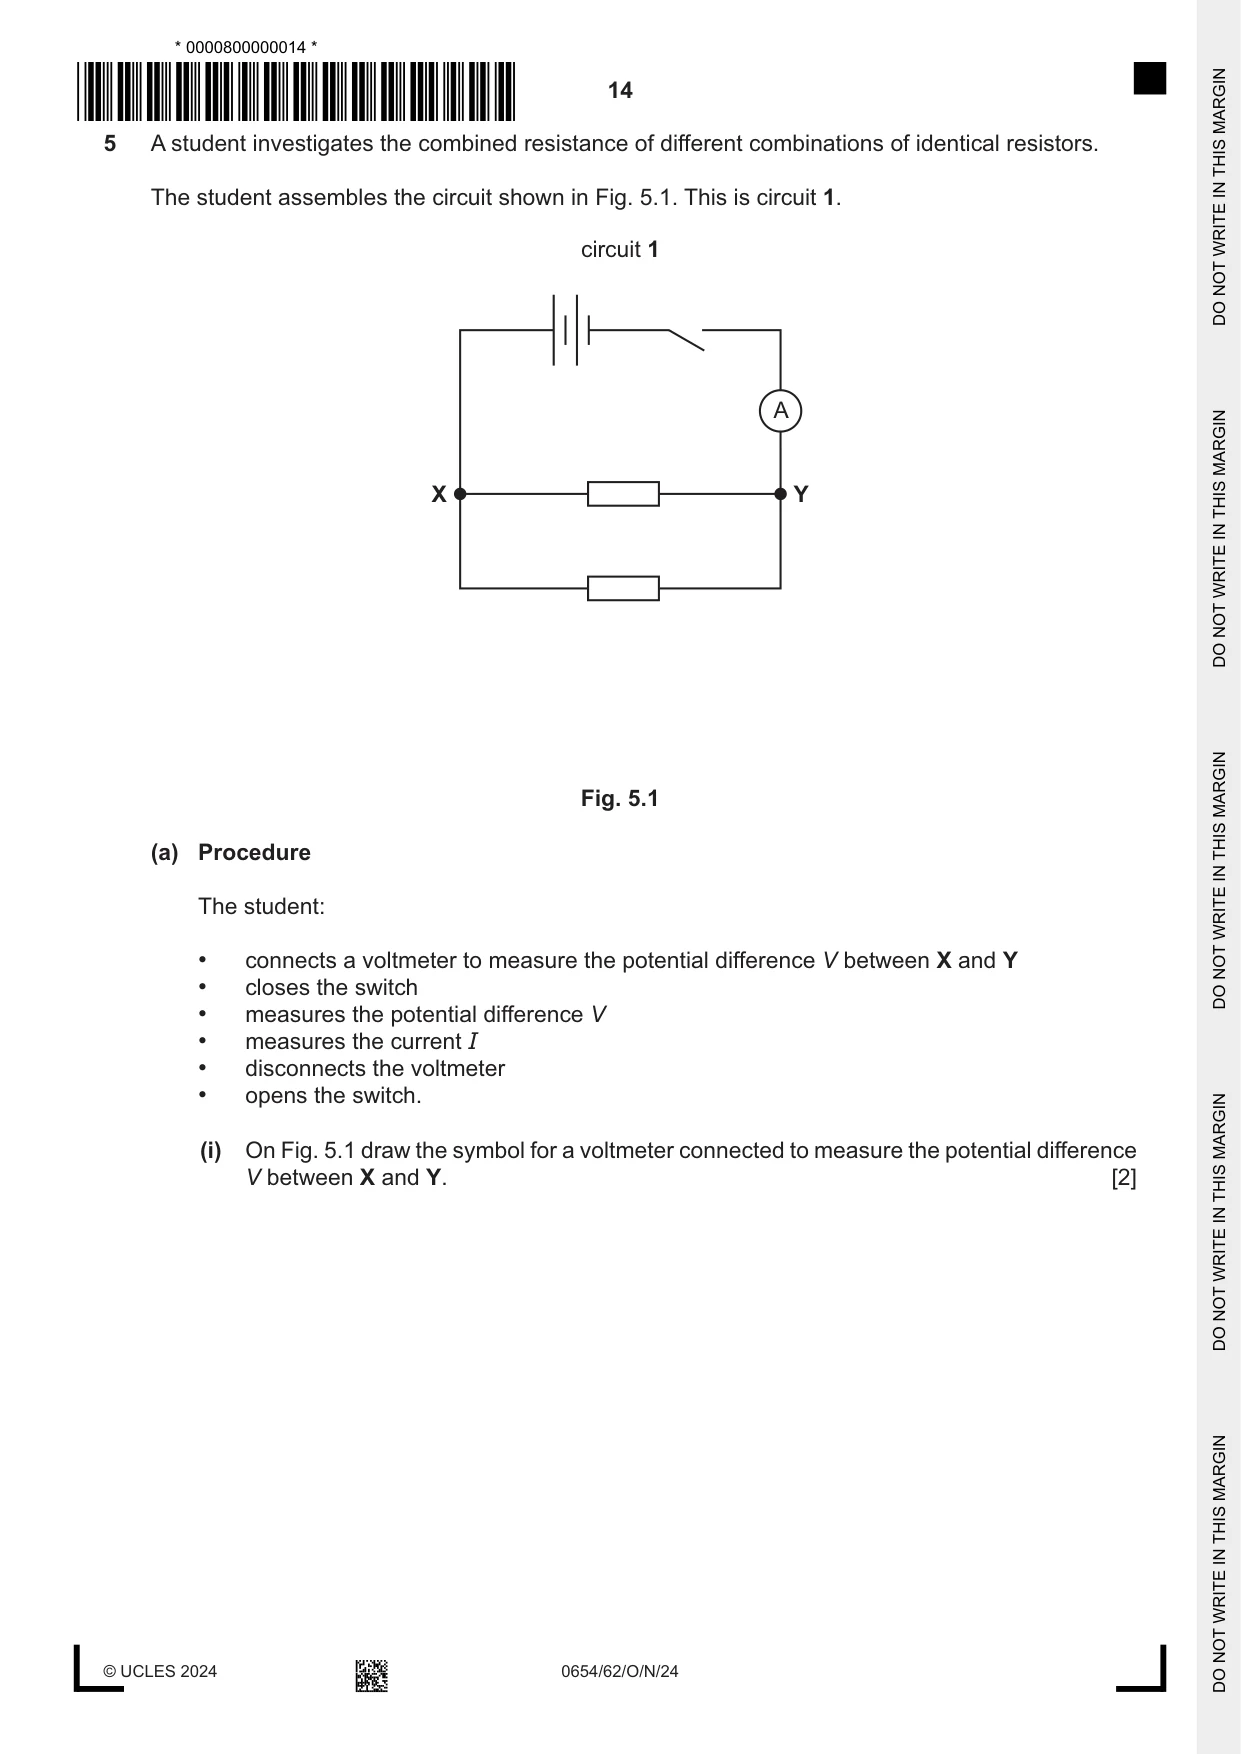
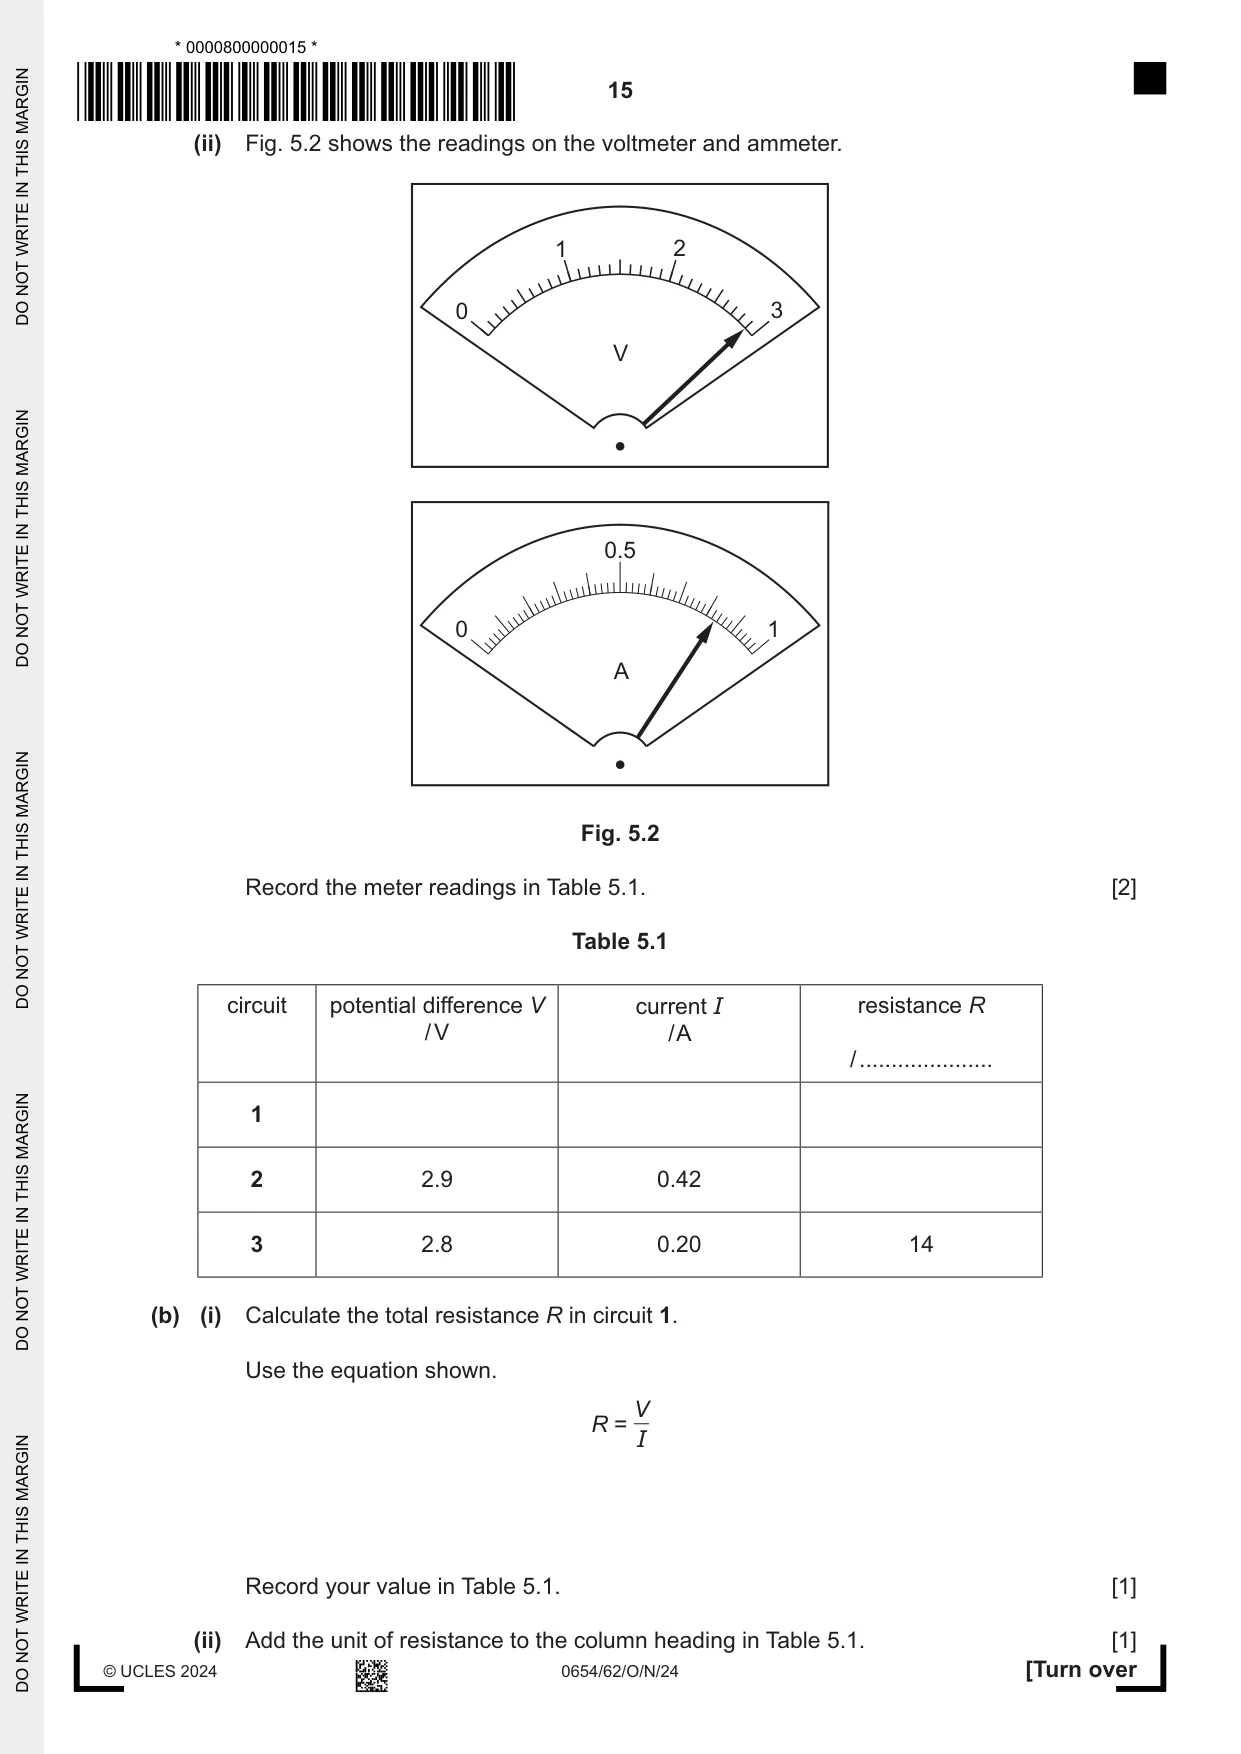
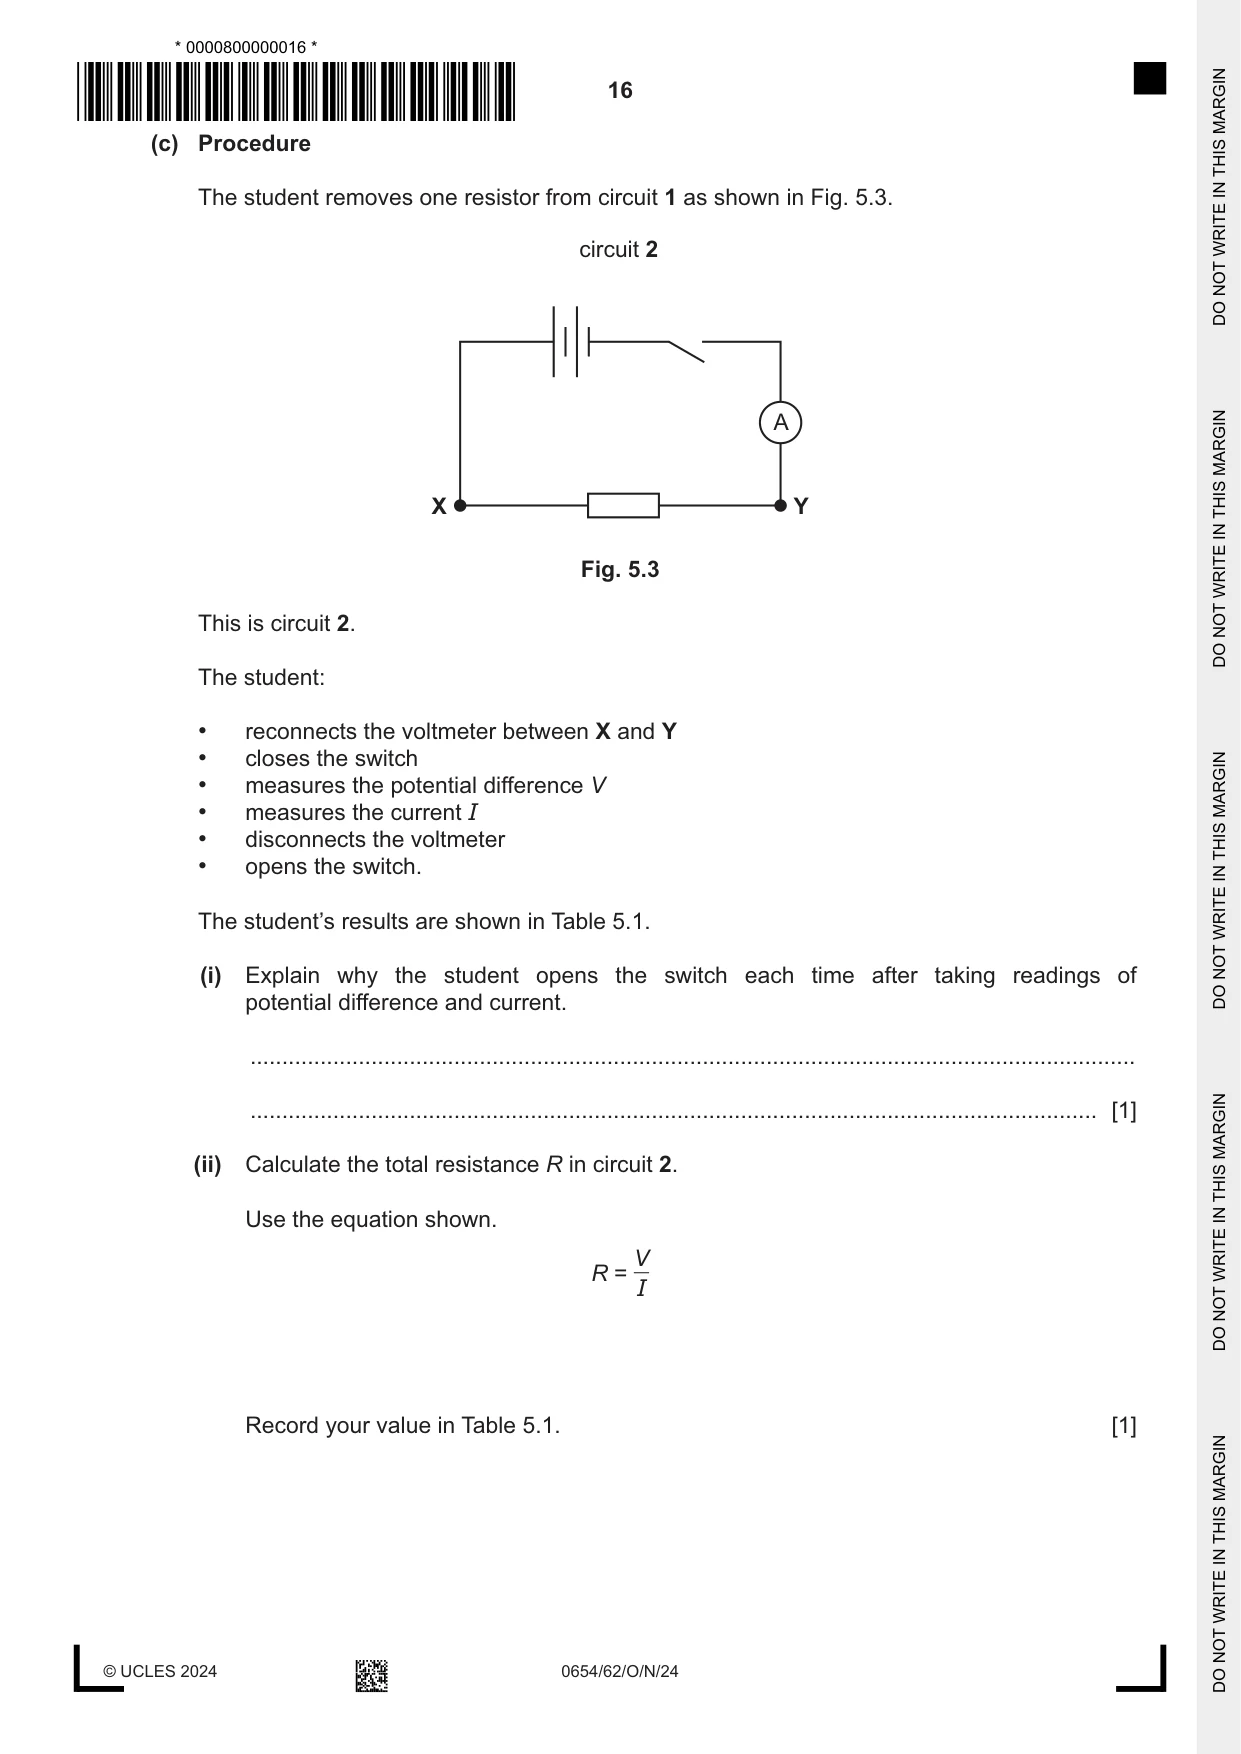
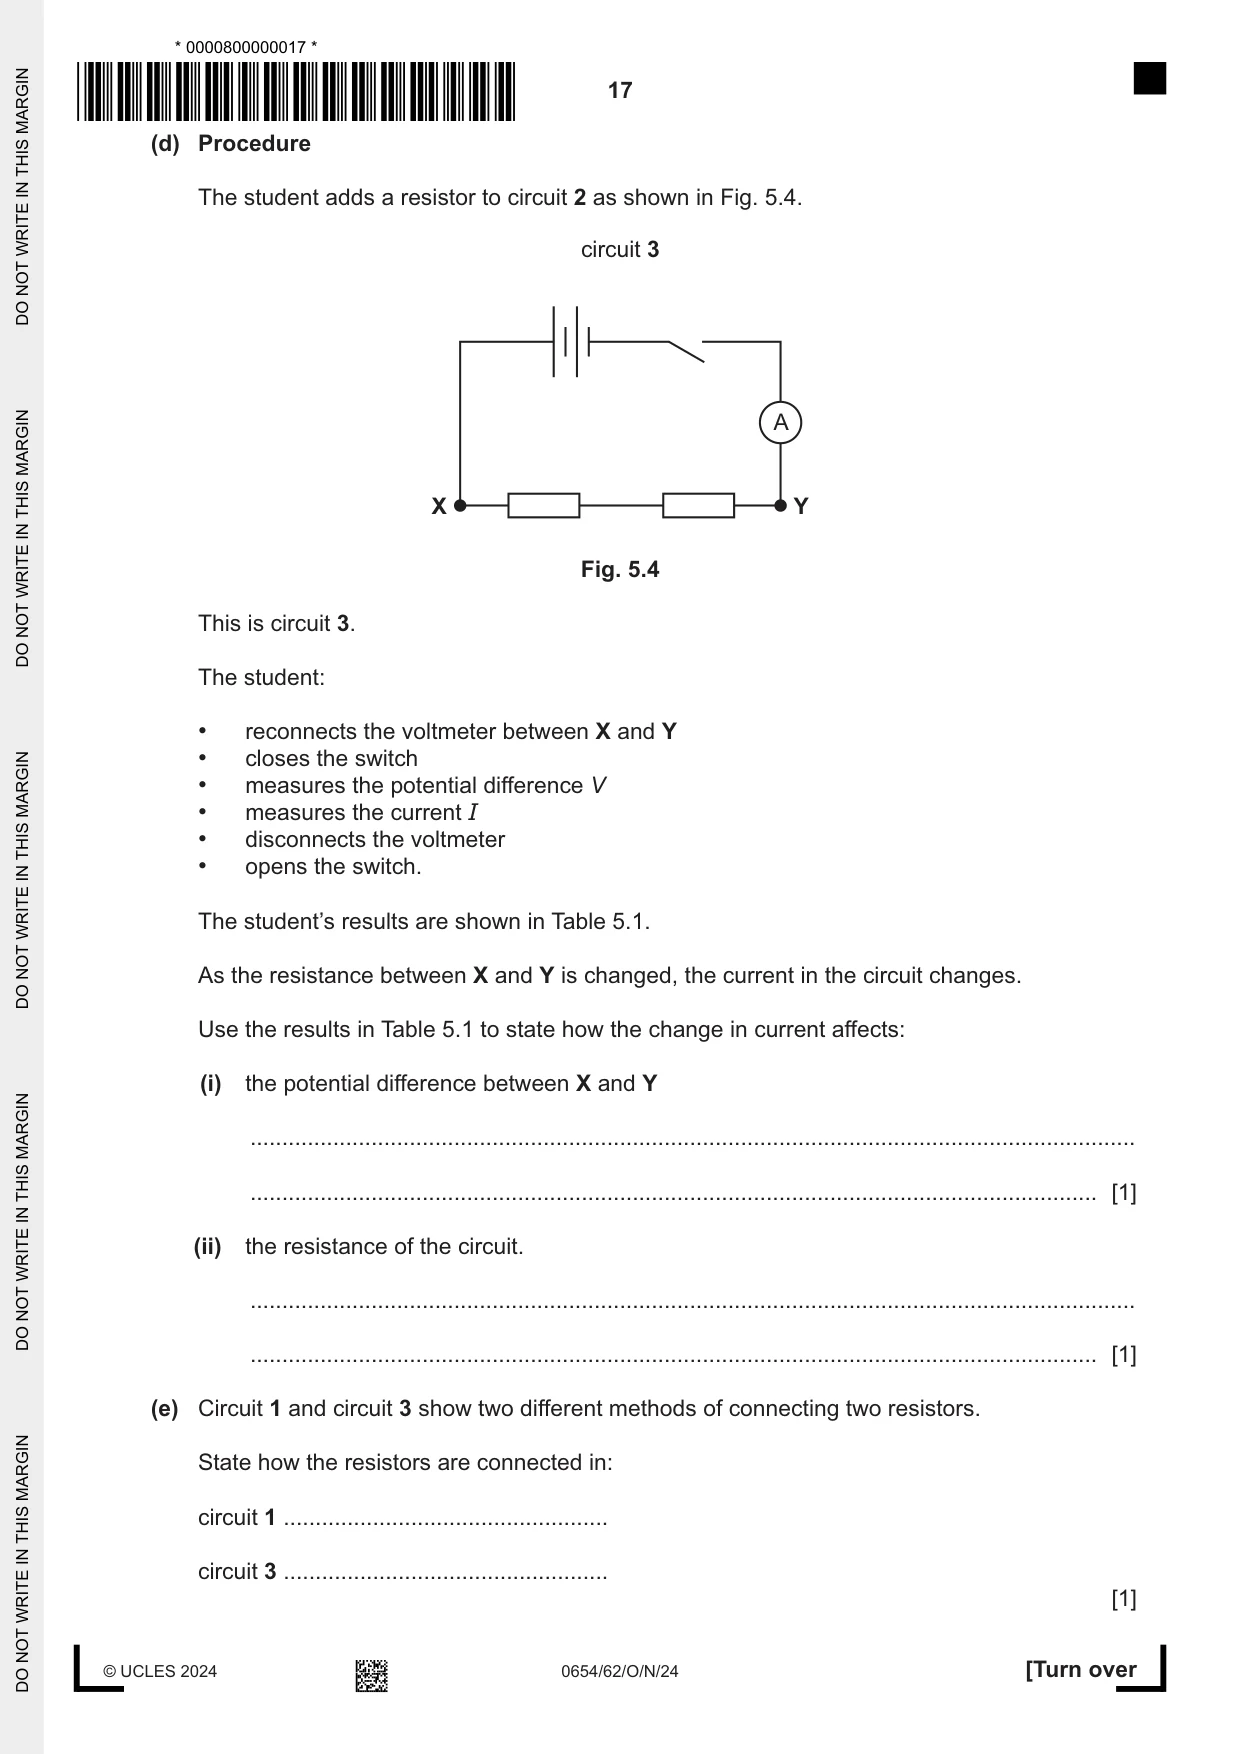
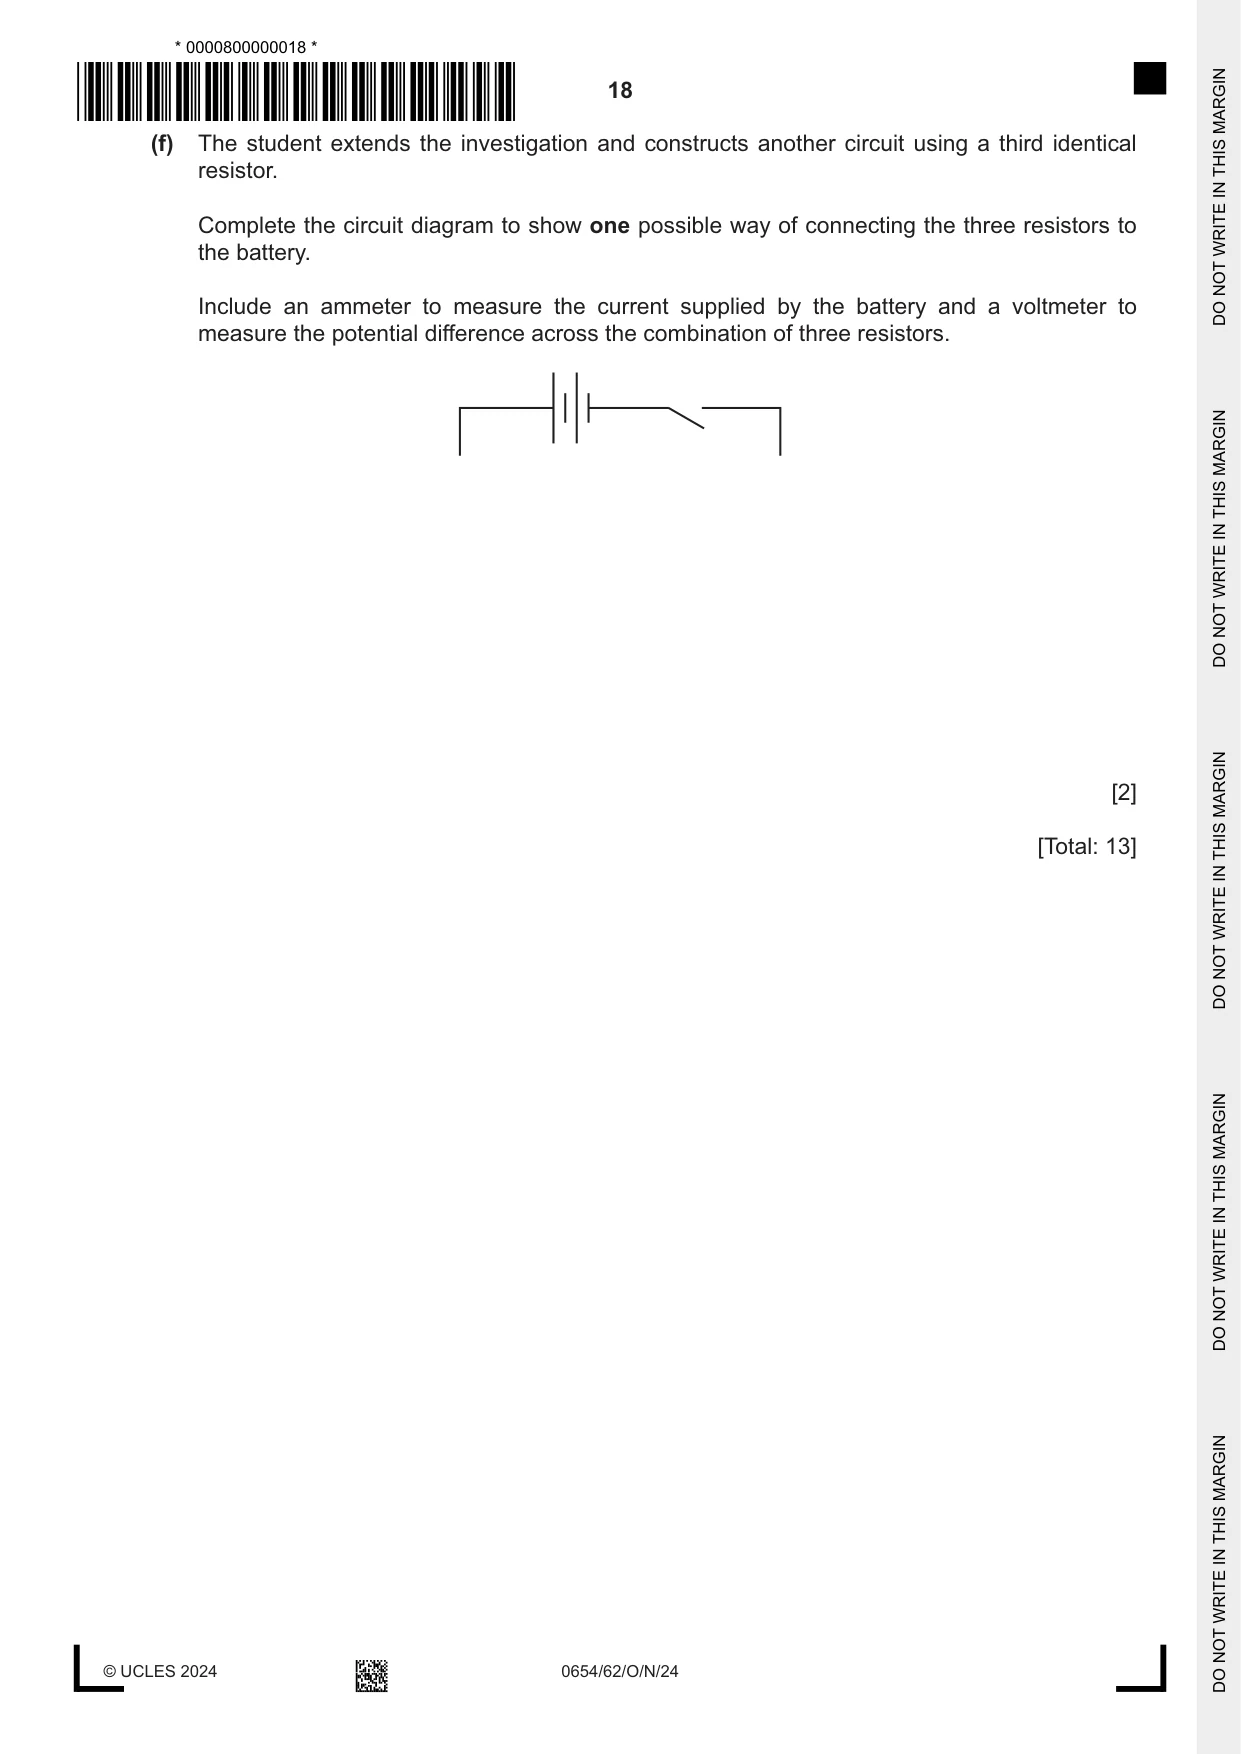
5 A student investigates the combined resistance of different combinations of identical resistors. The student assembles the circuit shown in Fig. 5.1. This is circuit 1. circuit 1 A X Y Fig. 5.1 (a) Procedure The student: • connects a voltmeter to measure the potential difference V between X and Y • closes the switch • measures the potential difference V • measures the current I • disconnects the voltmeter • opens the switch. (i) On Fig. 5.1 draw the symbol for a voltmeter connected to measure the potential difference V between X and Y. [2] (ii) Fig. 5.2 shows the readings on the voltmeter and ammeter. 1 2 0 3 V 0.5 0 1 A Fig. 5.2 Record the meter readings in Table 5.1. [2] Table 5.1 circuit potential difference V current I resistance R / V / A / ..................... 1 2 2.9 0.42 3 2.8 0.20 14 (b) (i) Calculate the total resistance R in circuit 1. Use the equation shown. V R = I Record your value in Table 5.1. [1] (ii) Add the unit of resistance to the column heading in Table 5.1. [1] (c) Procedure The student removes one resistor from circuit 1 as shown in Fig. 5.3. circuit 2 A X Y Fig. 5.3 This is circuit 2. The student: • reconnects the voltmeter between X and Y • closes the switch • measures the potential difference V • measures the current I • disconnects the voltmeter • opens the switch. The student’s results are shown in Table 5.1. (i) Explain why the student opens the switch each time after taking readings of potential difference and current. ........................................................................................................................................... ..................................................................................................................................... [1] (ii) Calculate the total resistance R in circuit 2. Use the equation shown. V R = I Record your value in Table 5.1. [1] (d) Procedure The student adds a resistor to circuit 2 as shown in Fig. 5.4. circuit 3 A X Y Fig. 5.4 This is circuit 3. The student: • reconnects the voltmeter between X and Y • closes the switch • measures the potential difference V • measures the current I • disconnects the voltmeter • opens the switch. The student’s results are shown in Table 5.1. As the resistance between X and Y is changed, the current in the circuit changes. Use the results in Table 5.1 to state how the change in current affects: (i) the potential difference between X and Y ........................................................................................................................................... ..................................................................................................................................... [1] (ii) the resistance of the circuit. ........................................................................................................................................... ..................................................................................................................................... [1] (e) Circuit 1 and circuit 3 show two different methods of connecting two resistors. State how the resistors are connected in: circuit 1 ................................................... circuit 3 ................................................... [1] (f) The student extends the investigation and constructs another circuit using a third identical resistor. Complete the circuit diagram to show one possible way of connecting the three resistors to the battery. Include an ammeter to measure the current supplied by the battery and a voltmeter to measure the potential difference across the combination of three resistors. [2] [Total: 13]
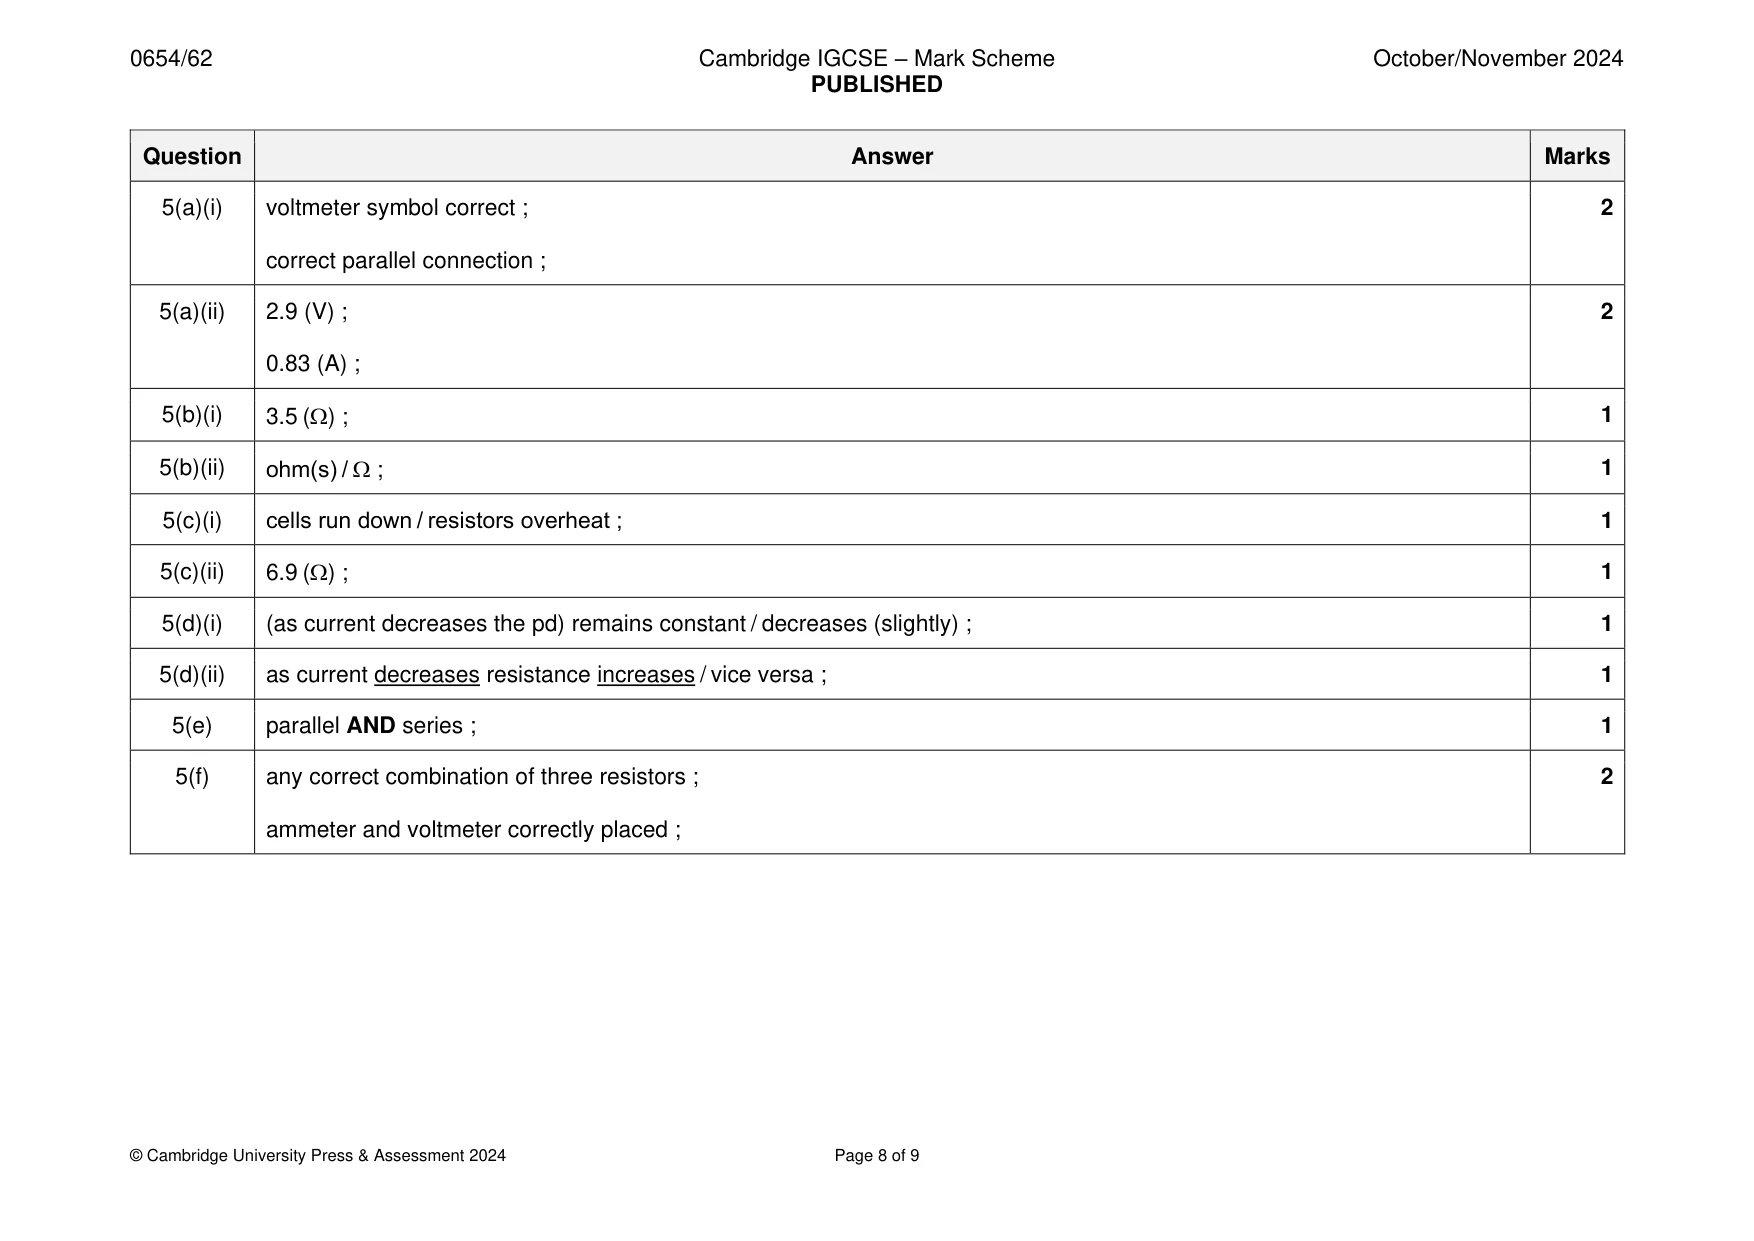
Mark scheme: 5(a)(i) voltmeter symbol correct ; 2 correct parallel connection ; 5(a)(ii) 2.9 (V) ; 2 0.83 (A) ; 5(b)(i) 3.5 () ; 1 5(b)(ii) ohm(s) / ; 1 5(c)(i) cells run down / resistors overheat ; 1 5(c)(ii) 6.9 () ; 1 5(d)(i) (as current decreases the pd) remains constant / decreases (slightly) ; 1 5(d)(ii) as current decreases resistance increases / vice versa ; 1 5(e) parallel AND series ; 1 5(f) any correct combination of three resistors ; 2 ammeter and voltmeter correctly placed ;
Q6 · A student investigates the oscillations (swings) of a pendulum
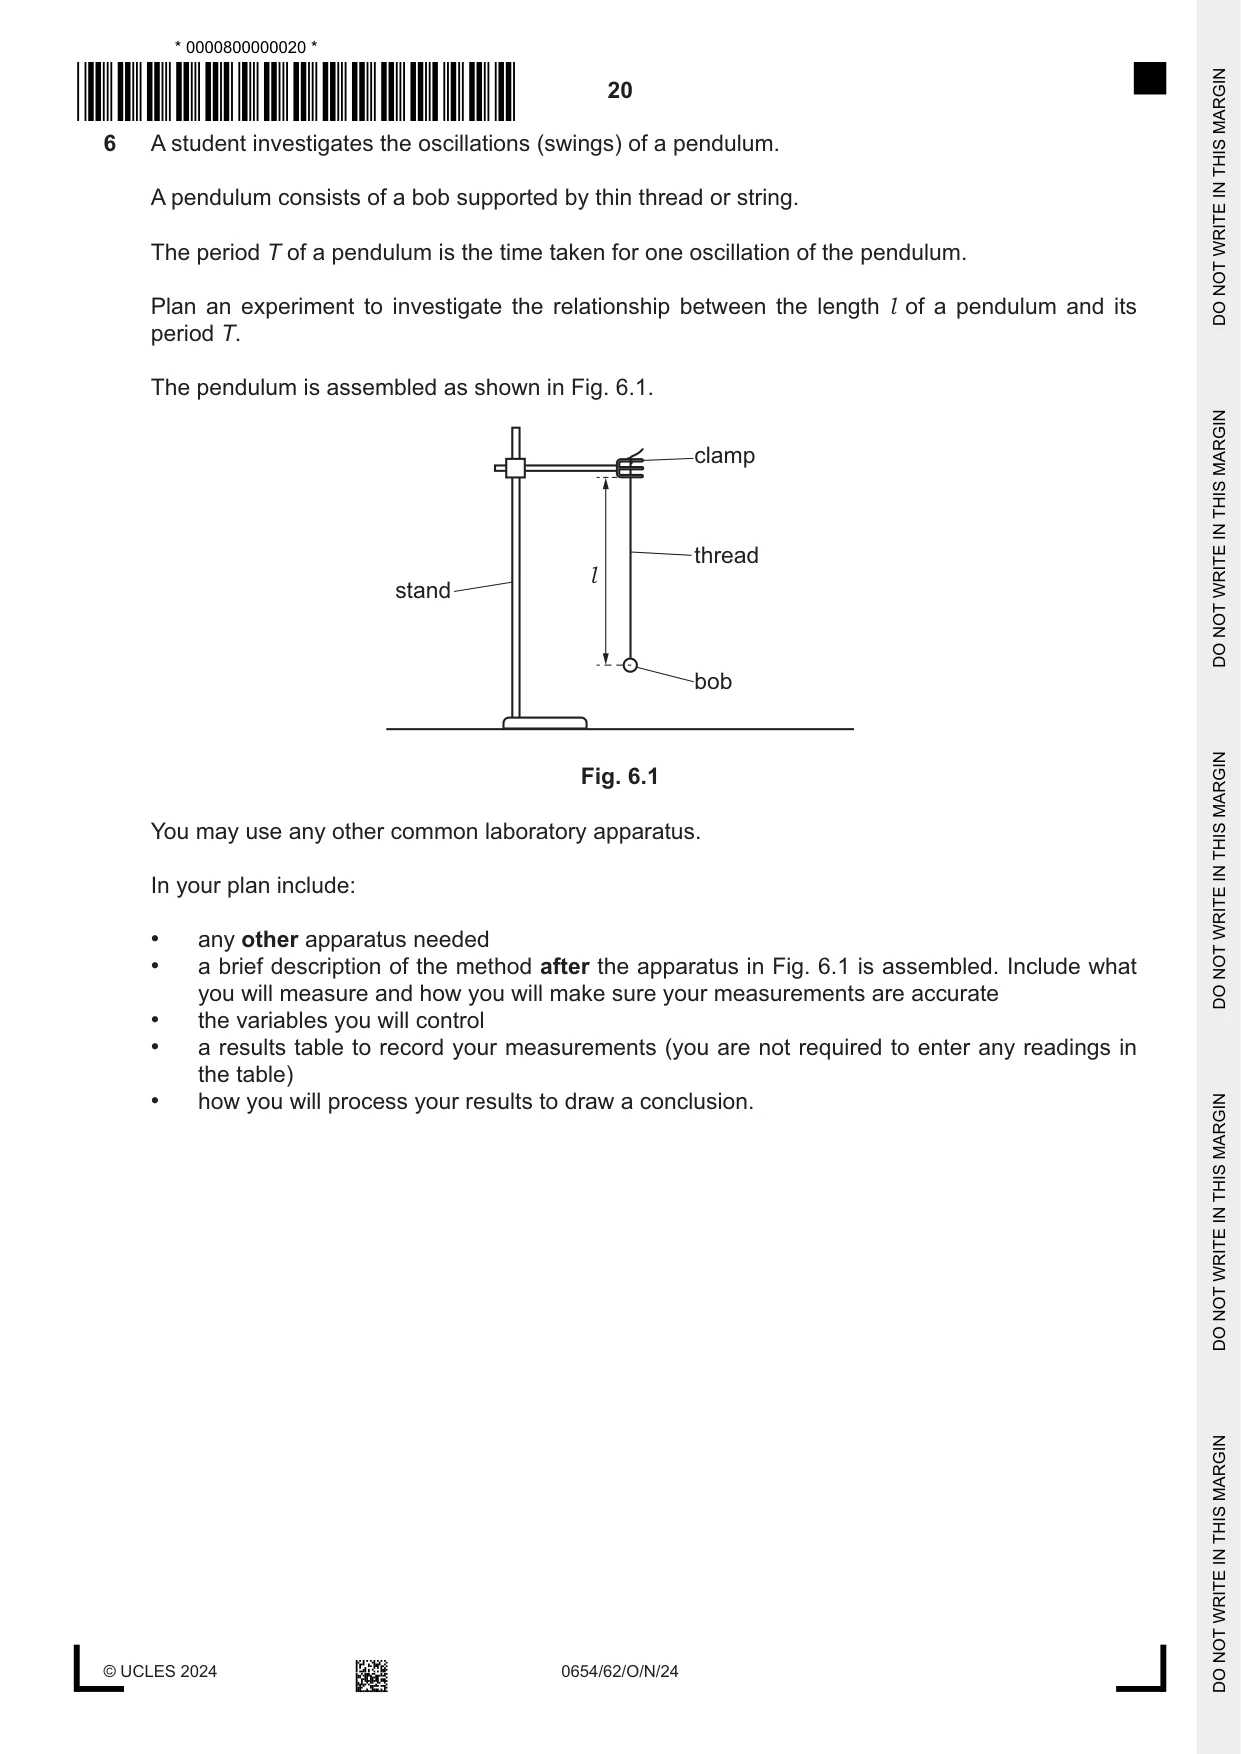
6 A student investigates the oscillations (swings) of a pendulum. A pendulum consists of a bob supported by thin thread or string. The period T of a pendulum is the time taken for one oscillation of the pendulum. Plan an experiment to investigate the relationship between the length l of a pendulum and its period T. The pendulum is assembled as shown in Fig. 6.1. clamp thread l stand bob Fig. 6.1 You may use any other common laboratory apparatus. In your plan include: • any other apparatus needed • a brief description of the method after the apparatus in Fig. 6.1 is assembled. Include what you will measure and how you will make sure your measurements are accurate • the variables you will control • a results table to record your measurements (you are not required to enter any readings in the table) • how you will process your results to draw a conclusion. .......................................................................................................................................................... .......................................................................................................................................................... .......................................................................................................................................................... .......................................................................................................................................................... .......................................................................................................................................................... .......................................................................................................................................................... .......................................................................................................................................................... .......................................................................................................................................................... .......................................................................................................................................................... .......................................................................................................................................................... .......................................................................................................................................................... .......................................................................................................................................................... .......................................................................................................................................................... .......................................................................................................................................................... .......................................................................................................................................................... .......................................................................................................................................................... .......................................................................................................................................................... .......................................................................................................................................................... .......................................................................................................................................................... .......................................................................................................................................................... .......................................................................................................................................................... .......................................................................................................................................................... .......................................................................................................................................................... .......................................................................................................................................................... .......................................................................................................................................................... .......................................................................................................................................................... .................................................................................................................................................... [7]
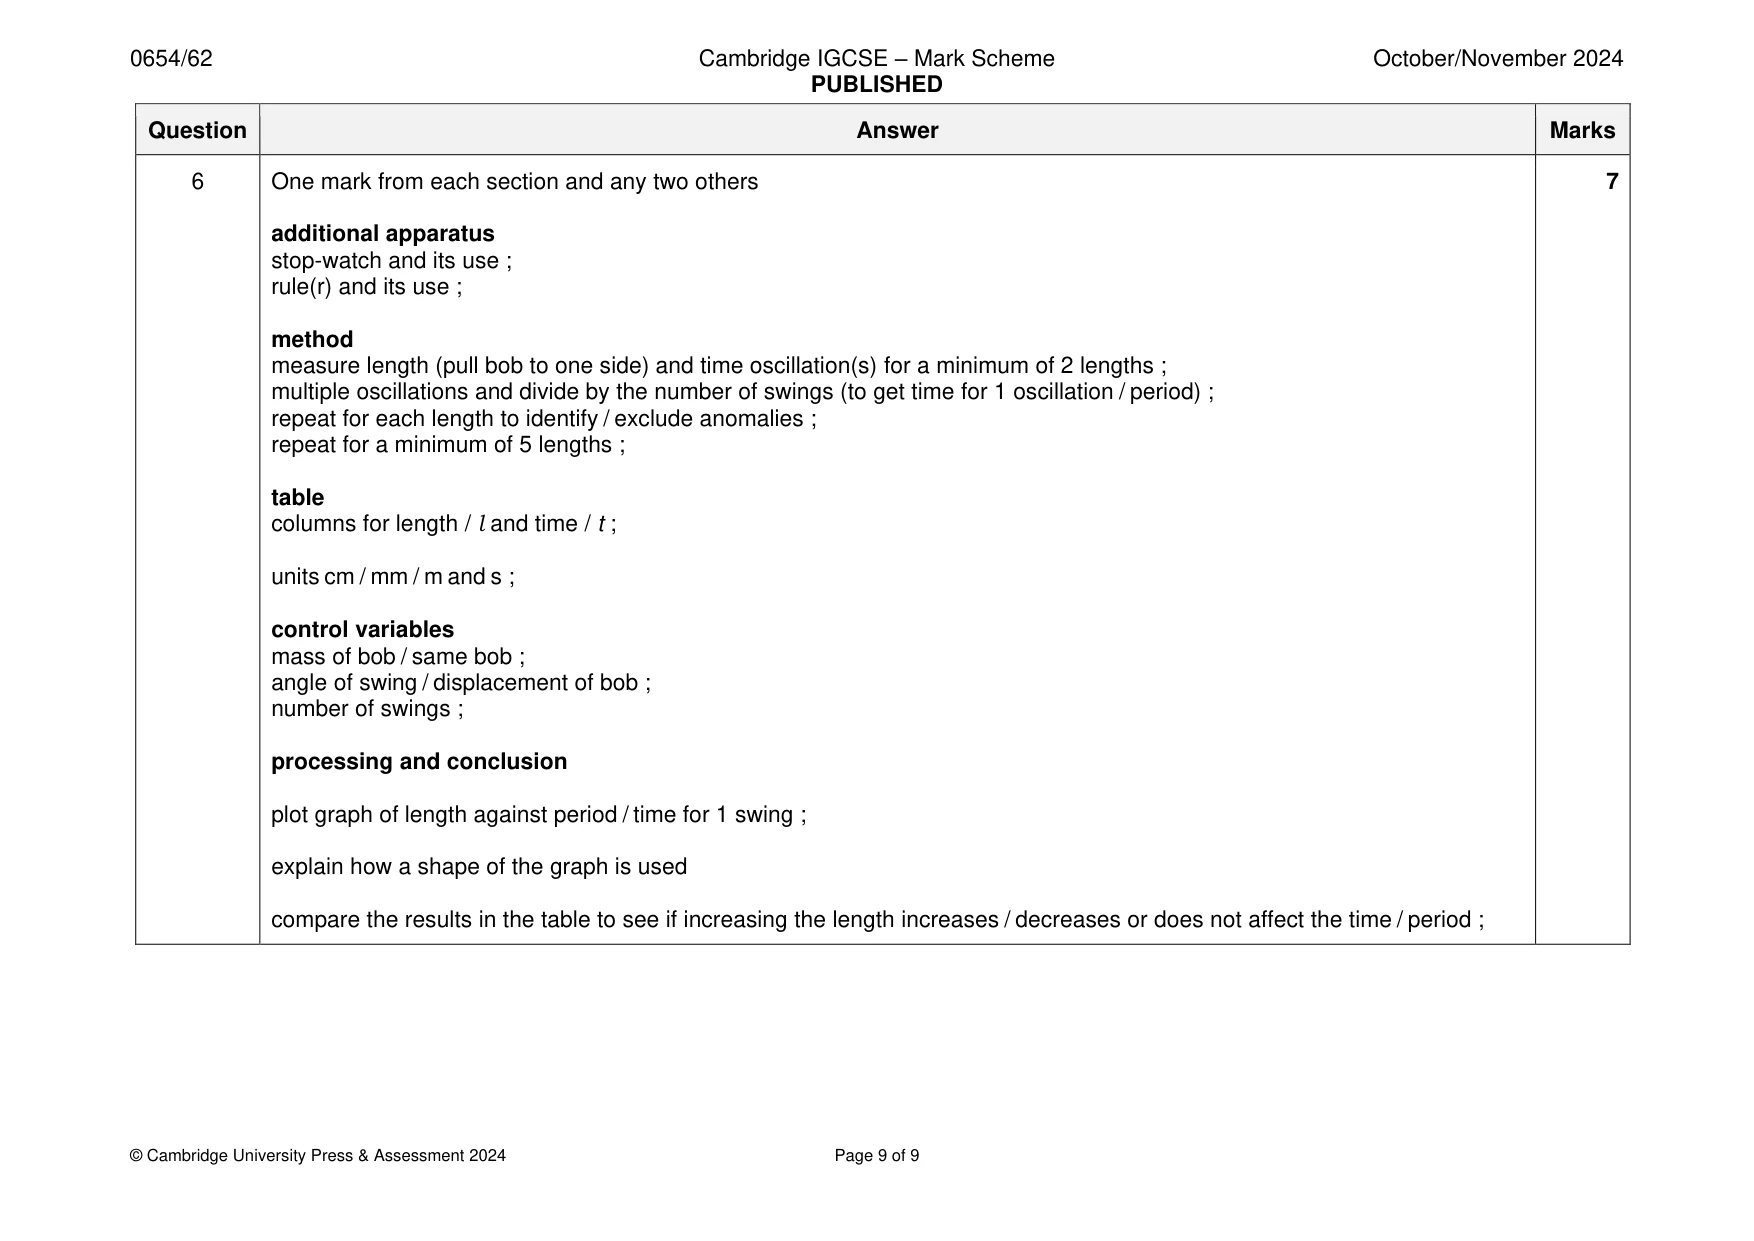
Mark scheme: 6 One mark from each section and any two others 7 additional apparatus stop-watch and its use ; rule(r) and its use ; method measure length (pull bob to one side) and time oscillation(s) for a minimum of 2 lengths ; multiple oscillations and divide by the number of swings (to get time for 1 oscillation / period) ; repeat for each length to identify / exclude anomalies ; repeat for a minimum of 5 lengths ; table columns for length / l and time / t ; units cm / mm / m and s ; control variables mass of bob / same bob ; angle of swing / displacement of bob ; number of swings ; processing and conclusion plot graph of length against period / time for 1 swing ; explain how a shape of the graph is used compare the results in the table to see if increasing the length increases / decreases or does not affect the time / period ;
More questions on Physical quantities and measurement techniques
What was in this paper
The subtopics covered by these 6 questions, and how many questions each got. Open one in a new tab to see every Cambridge question on it.
What you needed in this session
Cambridge’s own grade thresholds for 2024 Oct/Nov, Paper 6 · Variant 2. A higher threshold means an easier paper — the bar moves with how the cohort did.