Cambridge IGCSE Sciences - Co-ordinated (Double) 0654 — 2025 May/June Paper 6 · Variant 2
0654/62/M/J/25 · 6 questions · 60 marks · 90 min
The question paper and its mark scheme, free to read here and free to download. This is Cambridge’s own paper, exactly as it was sat.
Question paper20 pages



Mark scheme12 pages
Answers below. Sit the paper first if you are practising.
Questions as text
Q1 · A photograph of a flower
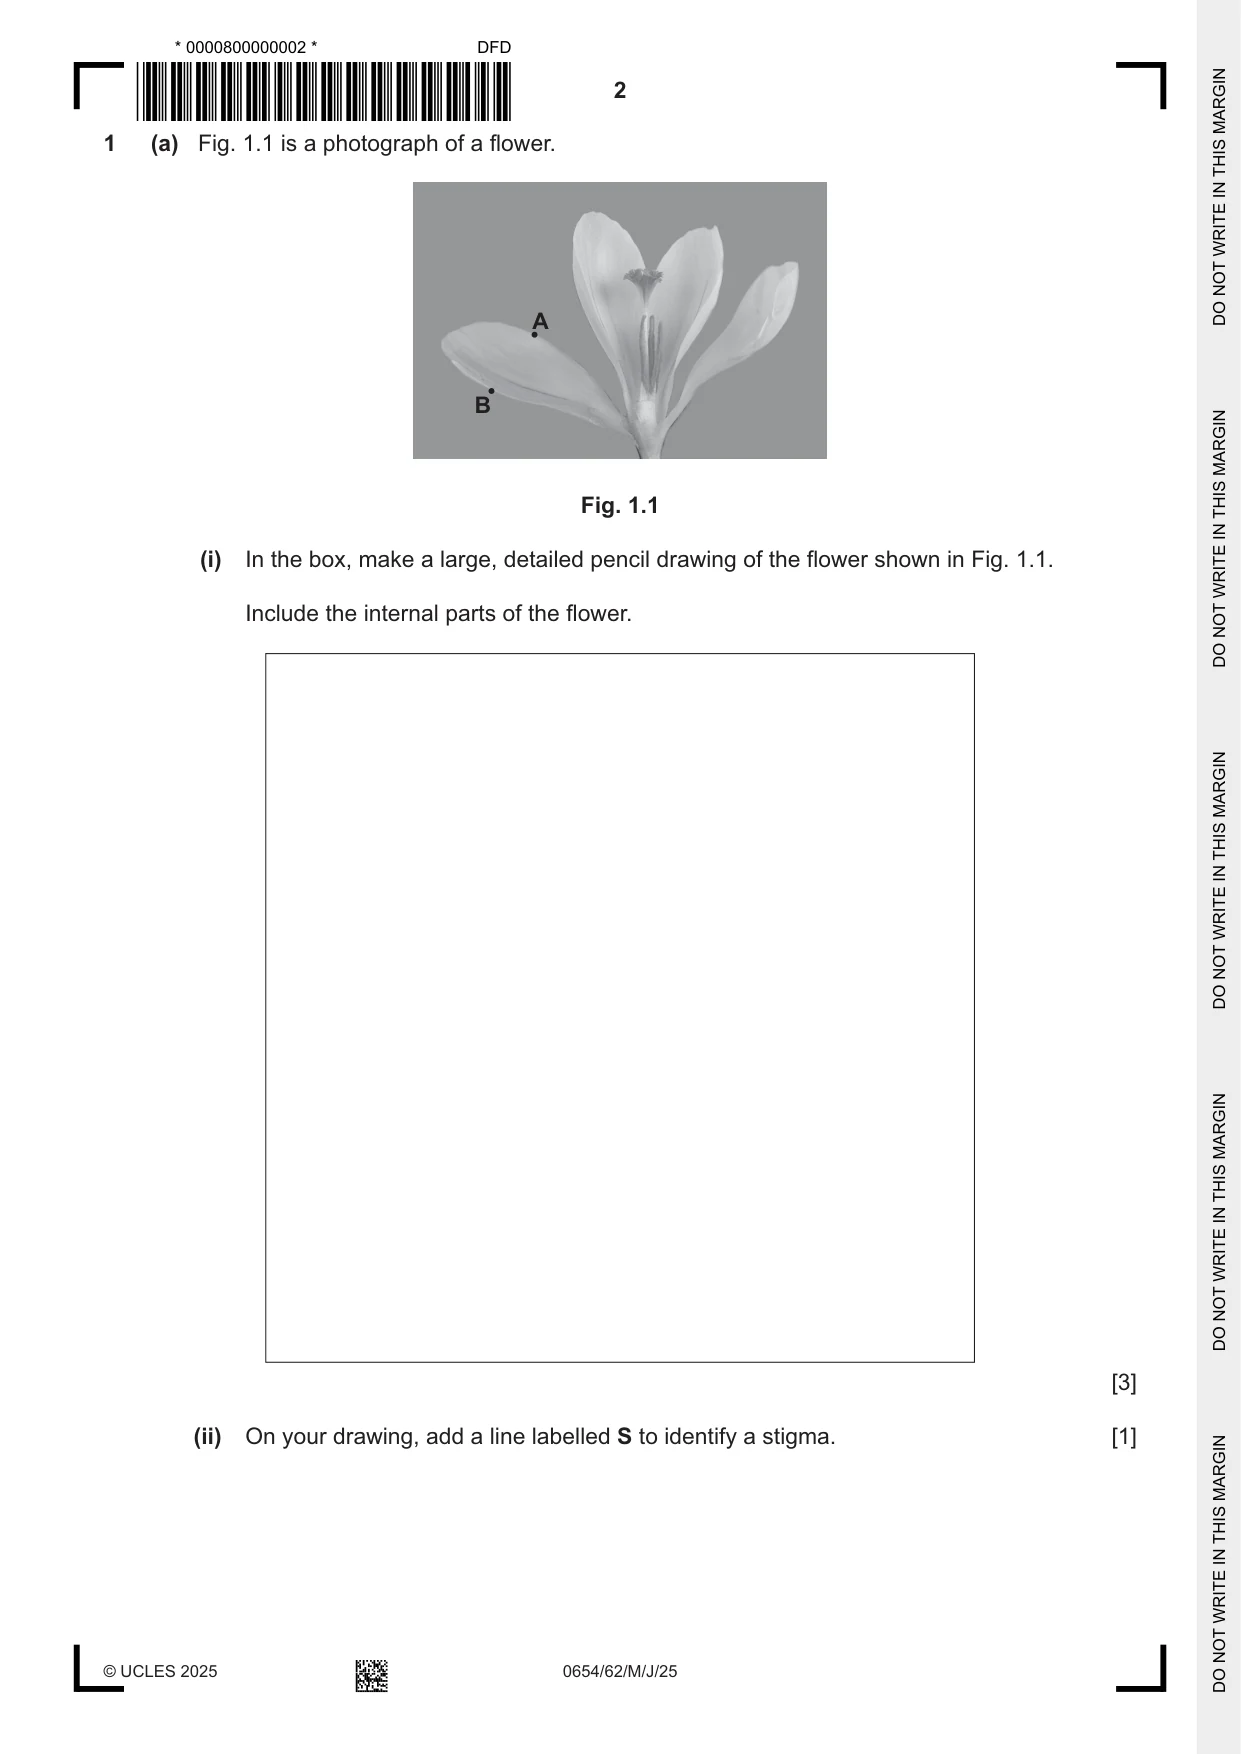
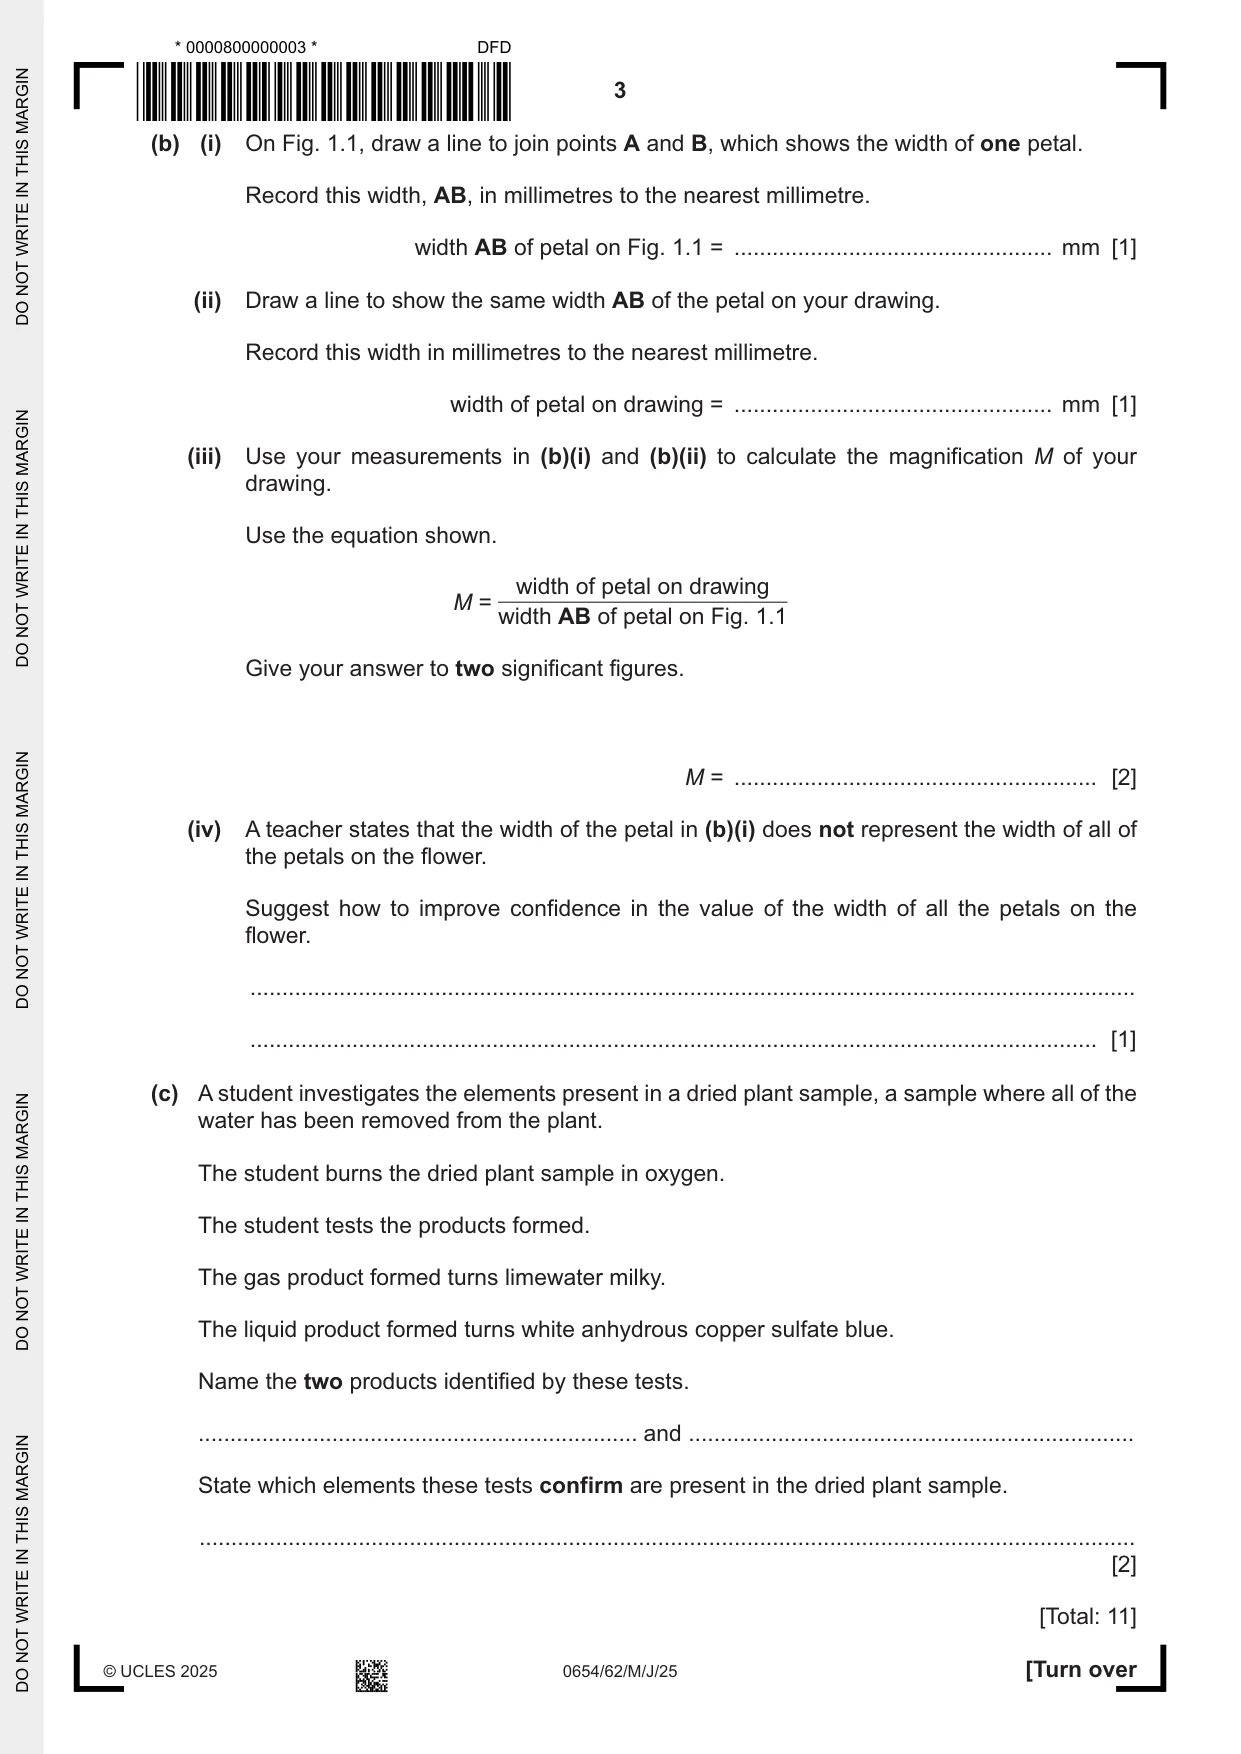
1 (a) Fig. 1.1 is a photograph of a flower. A B Fig. 1.1 (i) In the box, make a large, detailed pencil drawing of the flower shown in Fig. 1.1. Include the internal parts of the flower. [3] (ii) On your drawing, add a line labelled S to identify a stigma. [1] (b) (i) On Fig. 1.1, draw a line to join points A and B, which shows the width of one petal. Record this width, AB, in millimetres to the nearest millimetre. width AB of petal on Fig. 1.1 = .................................................. mm [1] (ii) Draw a line to show the same width AB of the petal on your drawing. Record this width in millimetres to the nearest millimetre. width of petal on drawing = .................................................. mm [1] (iii) Use your measurements in (b)(i) and (b)(ii) to calculate the magnification M of your drawing. Use the equation shown. width of petal on drawing M = width AB of petal on Fig. 1.1 Give your answer to two significant figures. M = ......................................................... [2] (iv) A teacher states that the width of the petal in (b)(i) does not represent the width of all of the petals on the flower. Suggest how to improve confidence in the value of the width of all the petals on the flower. ........................................................................................................................................... ..................................................................................................................................... [1] (c) A student investigates the elements present in a dried plant sample, a sample where all of the water has been removed from the plant. The student burns the dried plant sample in oxygen. The student tests the products formed. The gas product formed turns limewater milky. The liquid product formed turns white anhydrous copper sulfate blue. Name the two products identified by these tests. ..................................................................... and ...................................................................... State which elements these tests confirm are present in the dried plant sample. ................................................................................................................................................... [2] [Total: 11]
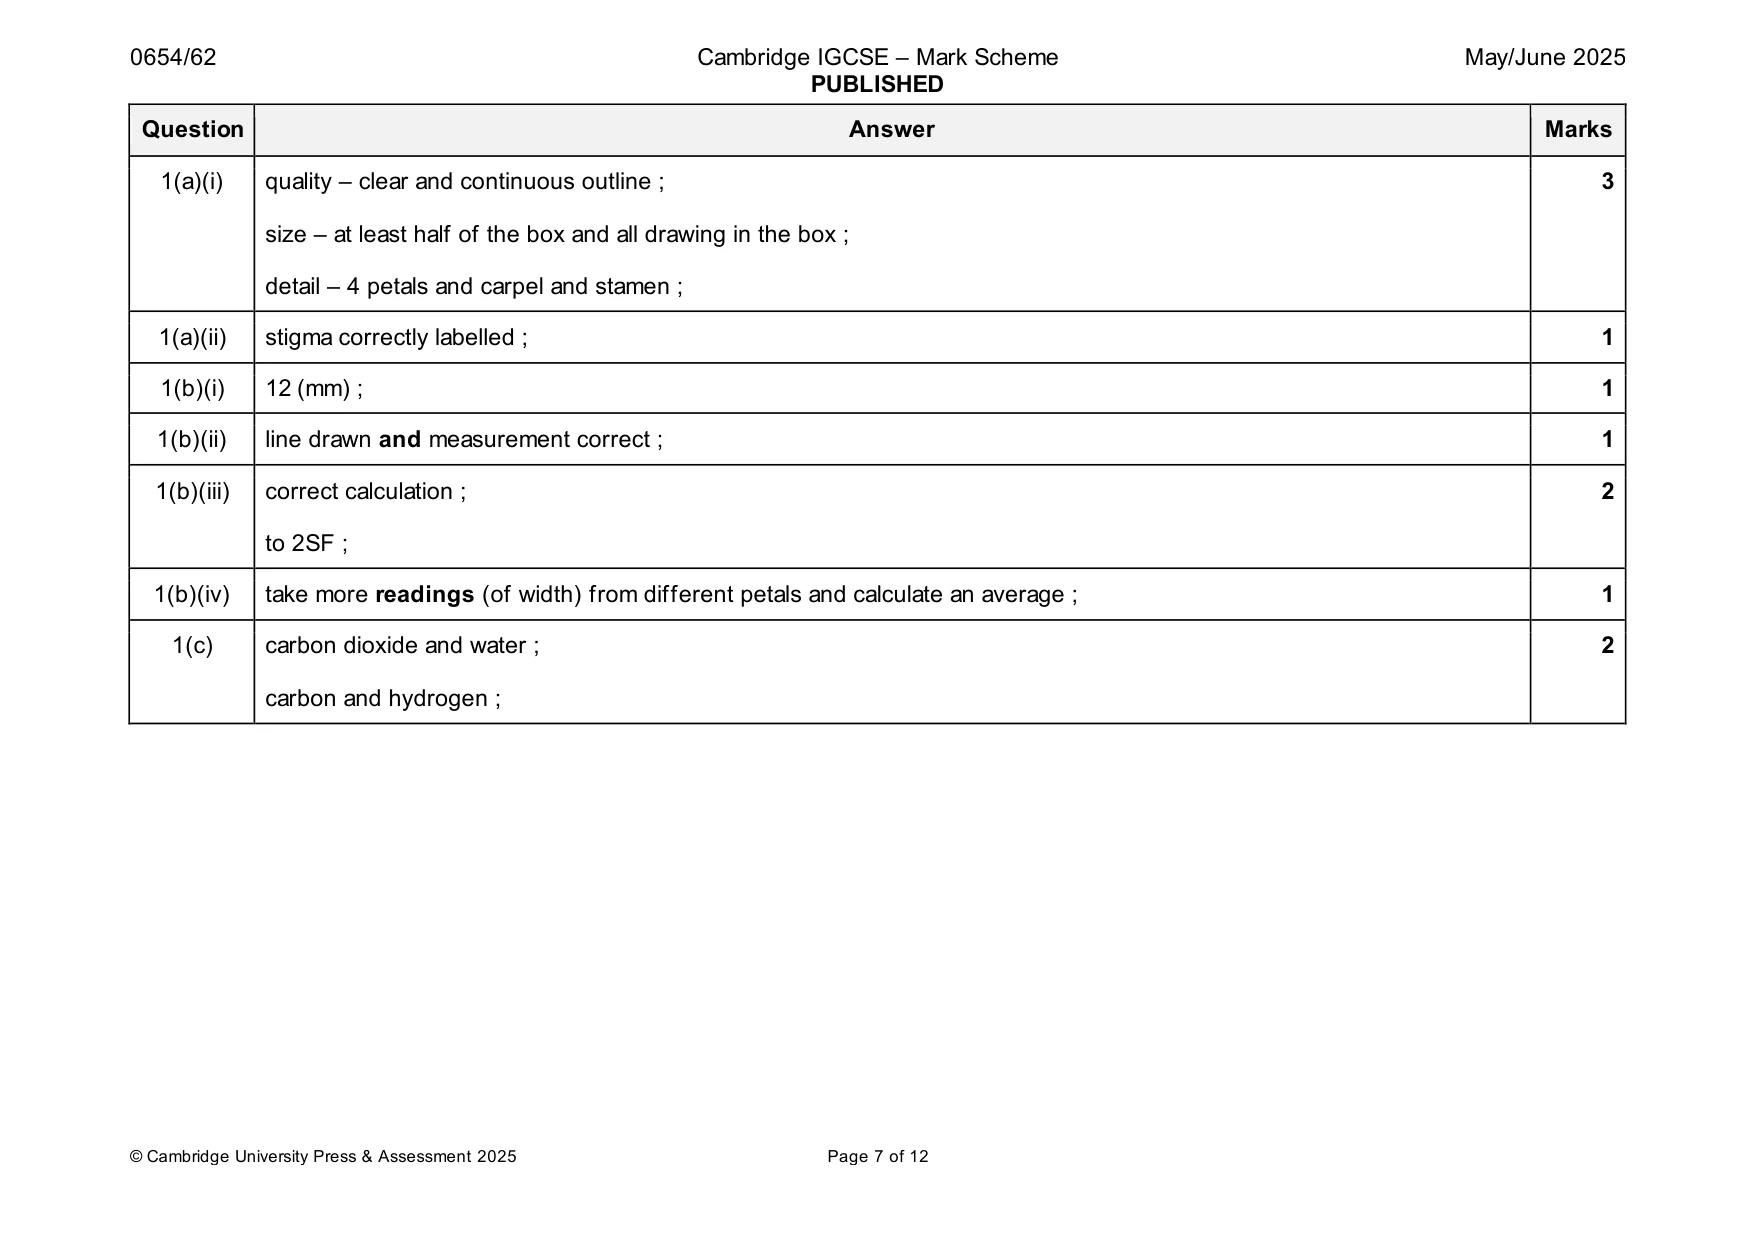
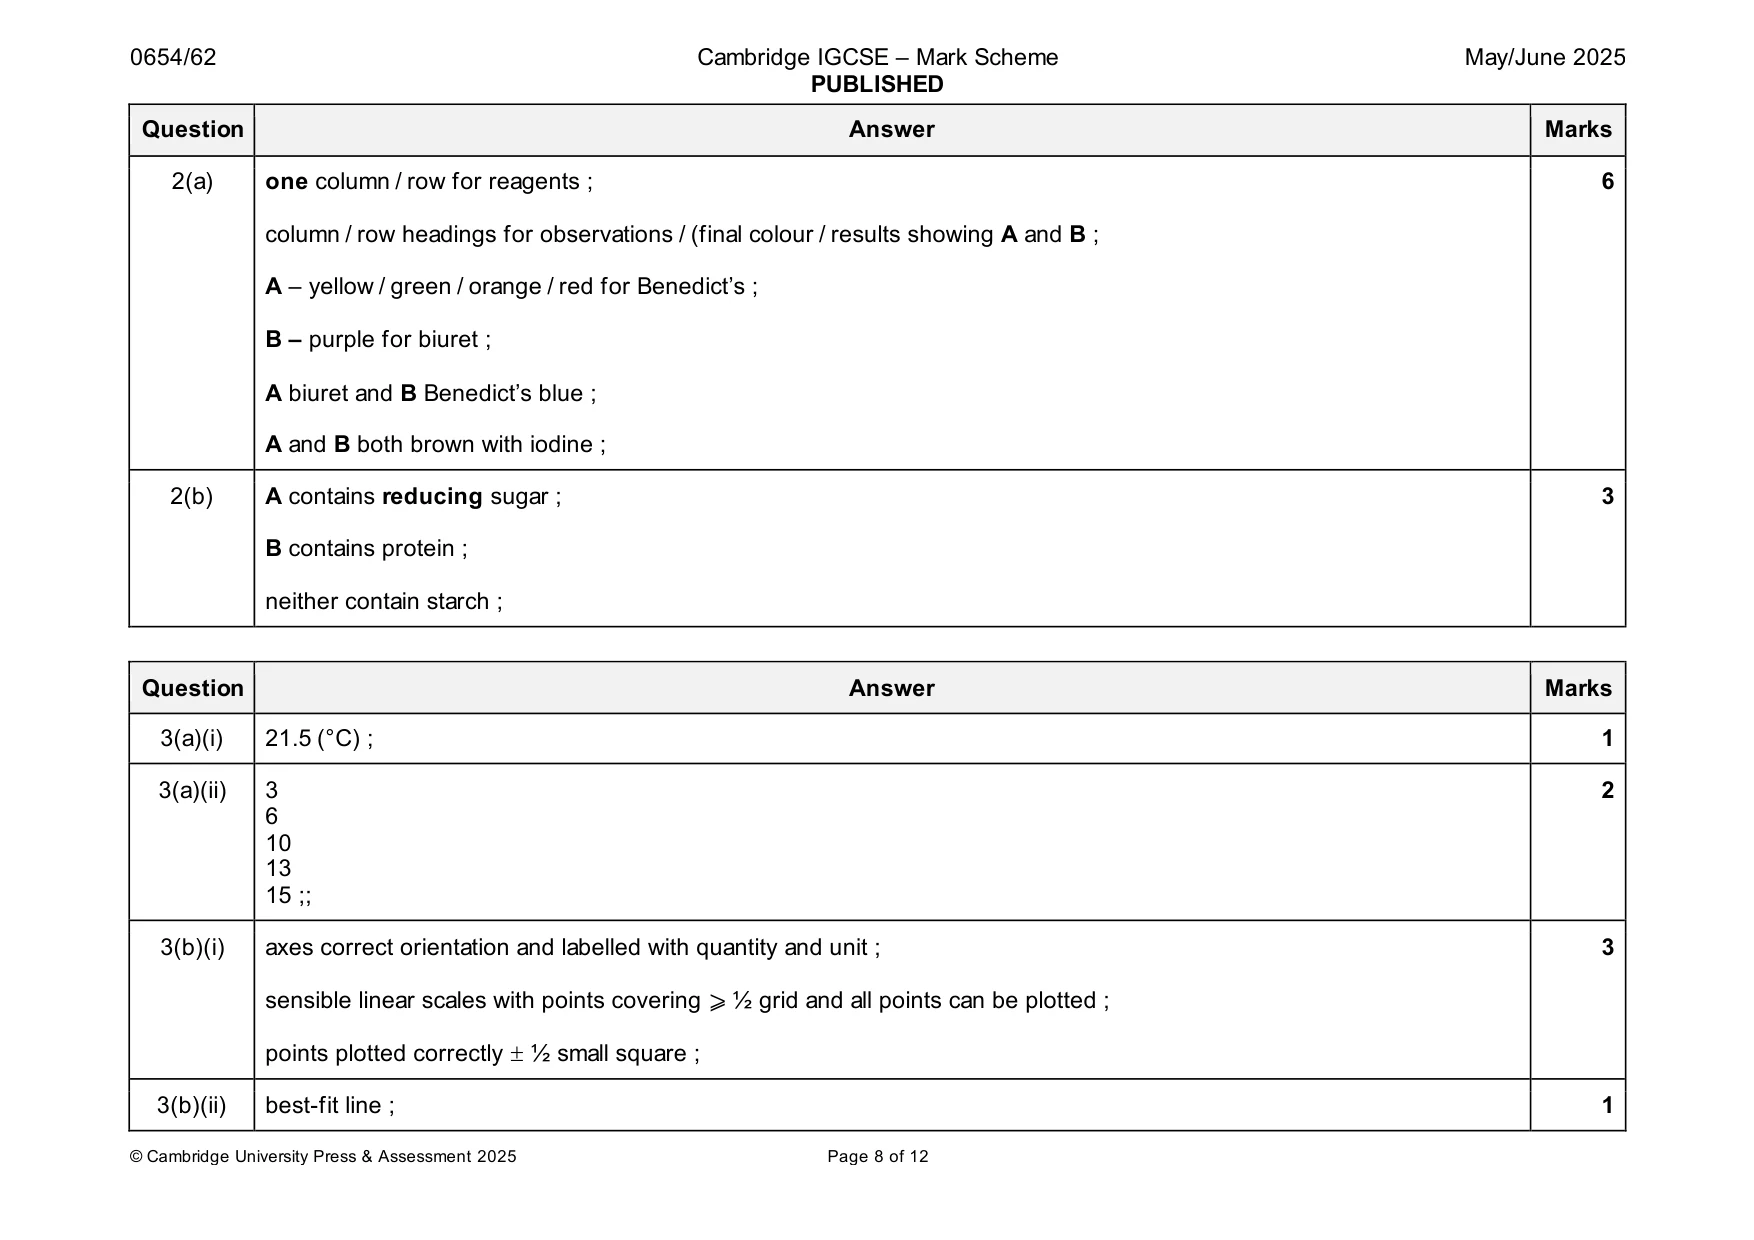
Mark scheme: Question Answer Marks 1(a)(i) quality – clear and continuous outline ; 3 size – at least half of the box and all drawing in the box ; detail – 4 petals and carpel and stamen ; 1(a)(ii) stigma correctly labelled ; 1 1(b)(i) 12 (mm) ; 1 1(b)(ii) line drawn and measurement correct ; 1 1(b)(iii) correct calculation ; 2 to 2SF ; 1(b)(iv) take more readings (of width) from different petals and calculate an average ; 1 1(c) carbon dioxide and water ; 2 carbon and hydrogen ;
Q2 · A student investigates the nutrient content of two solutions, A and B, made from two…
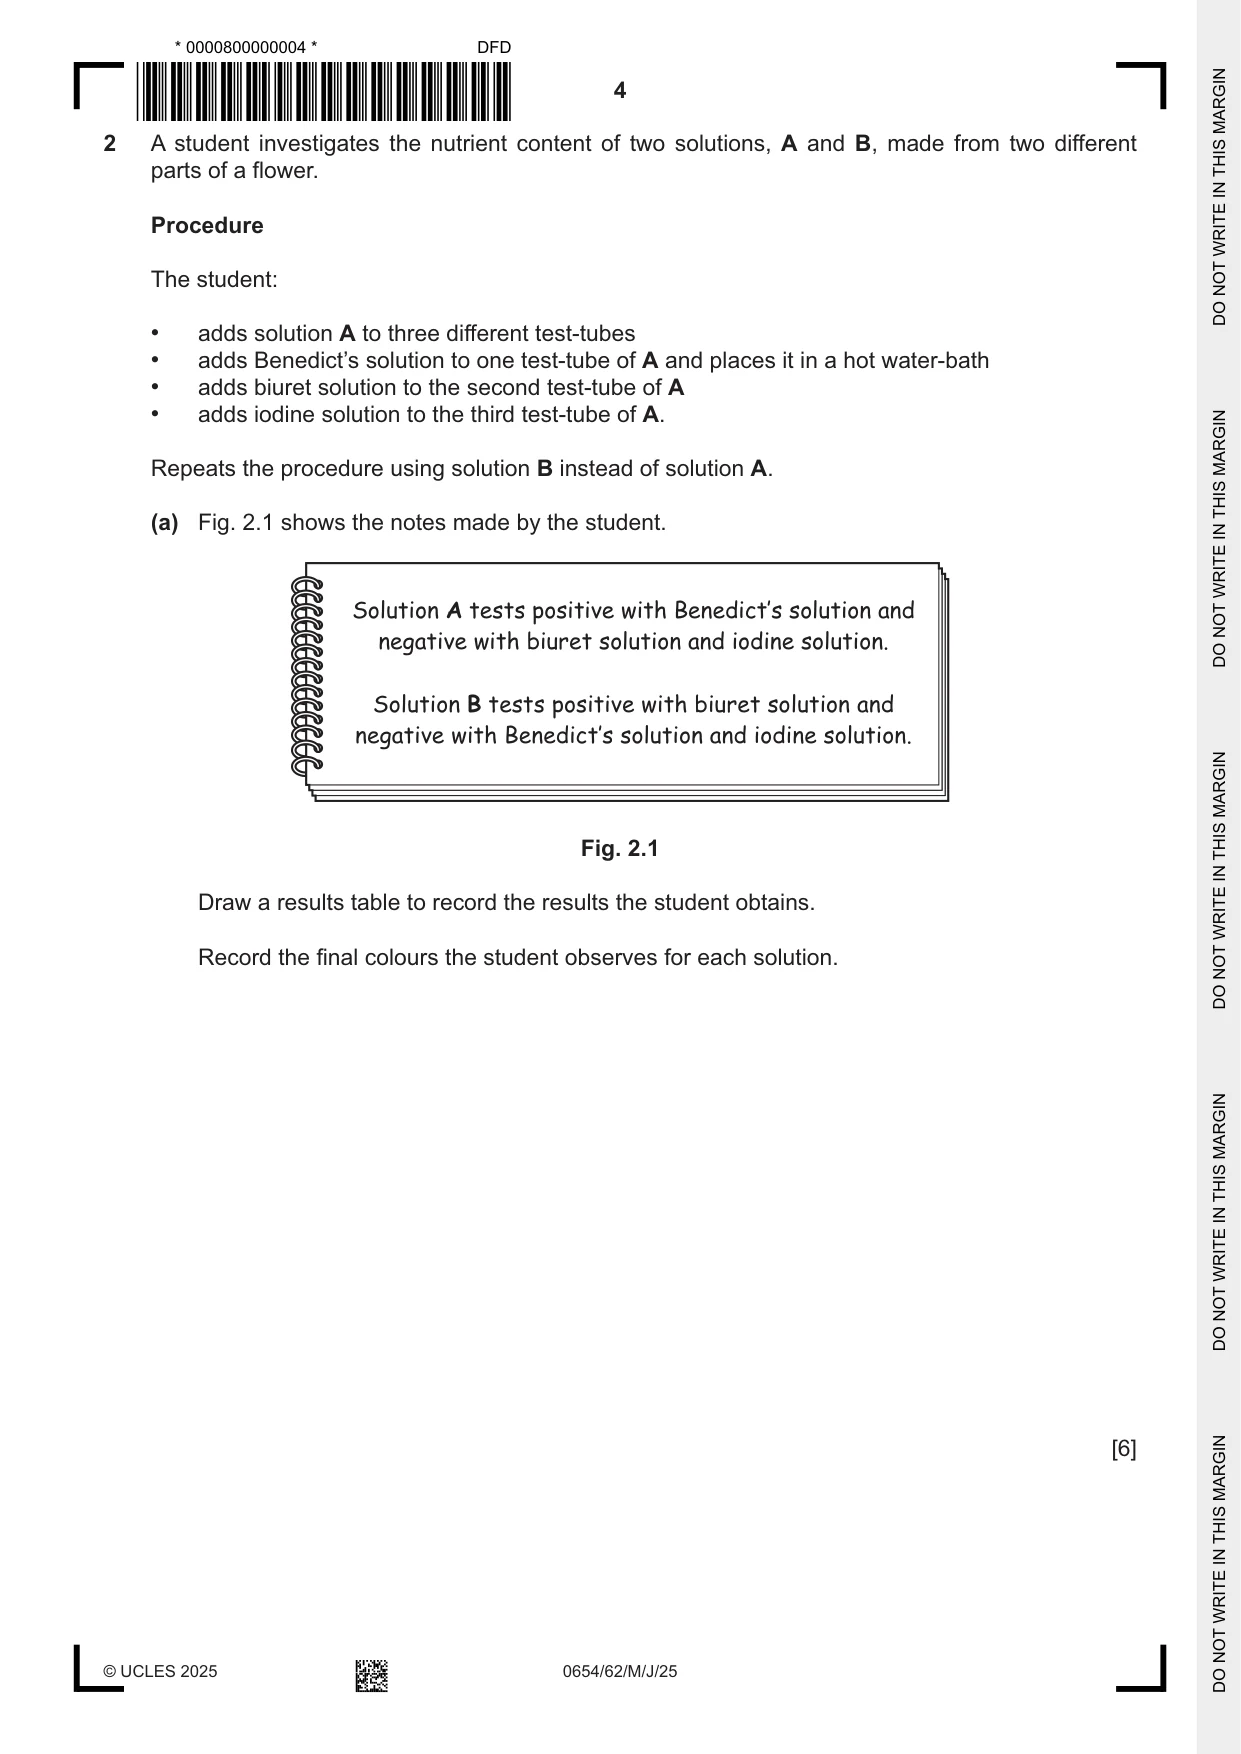
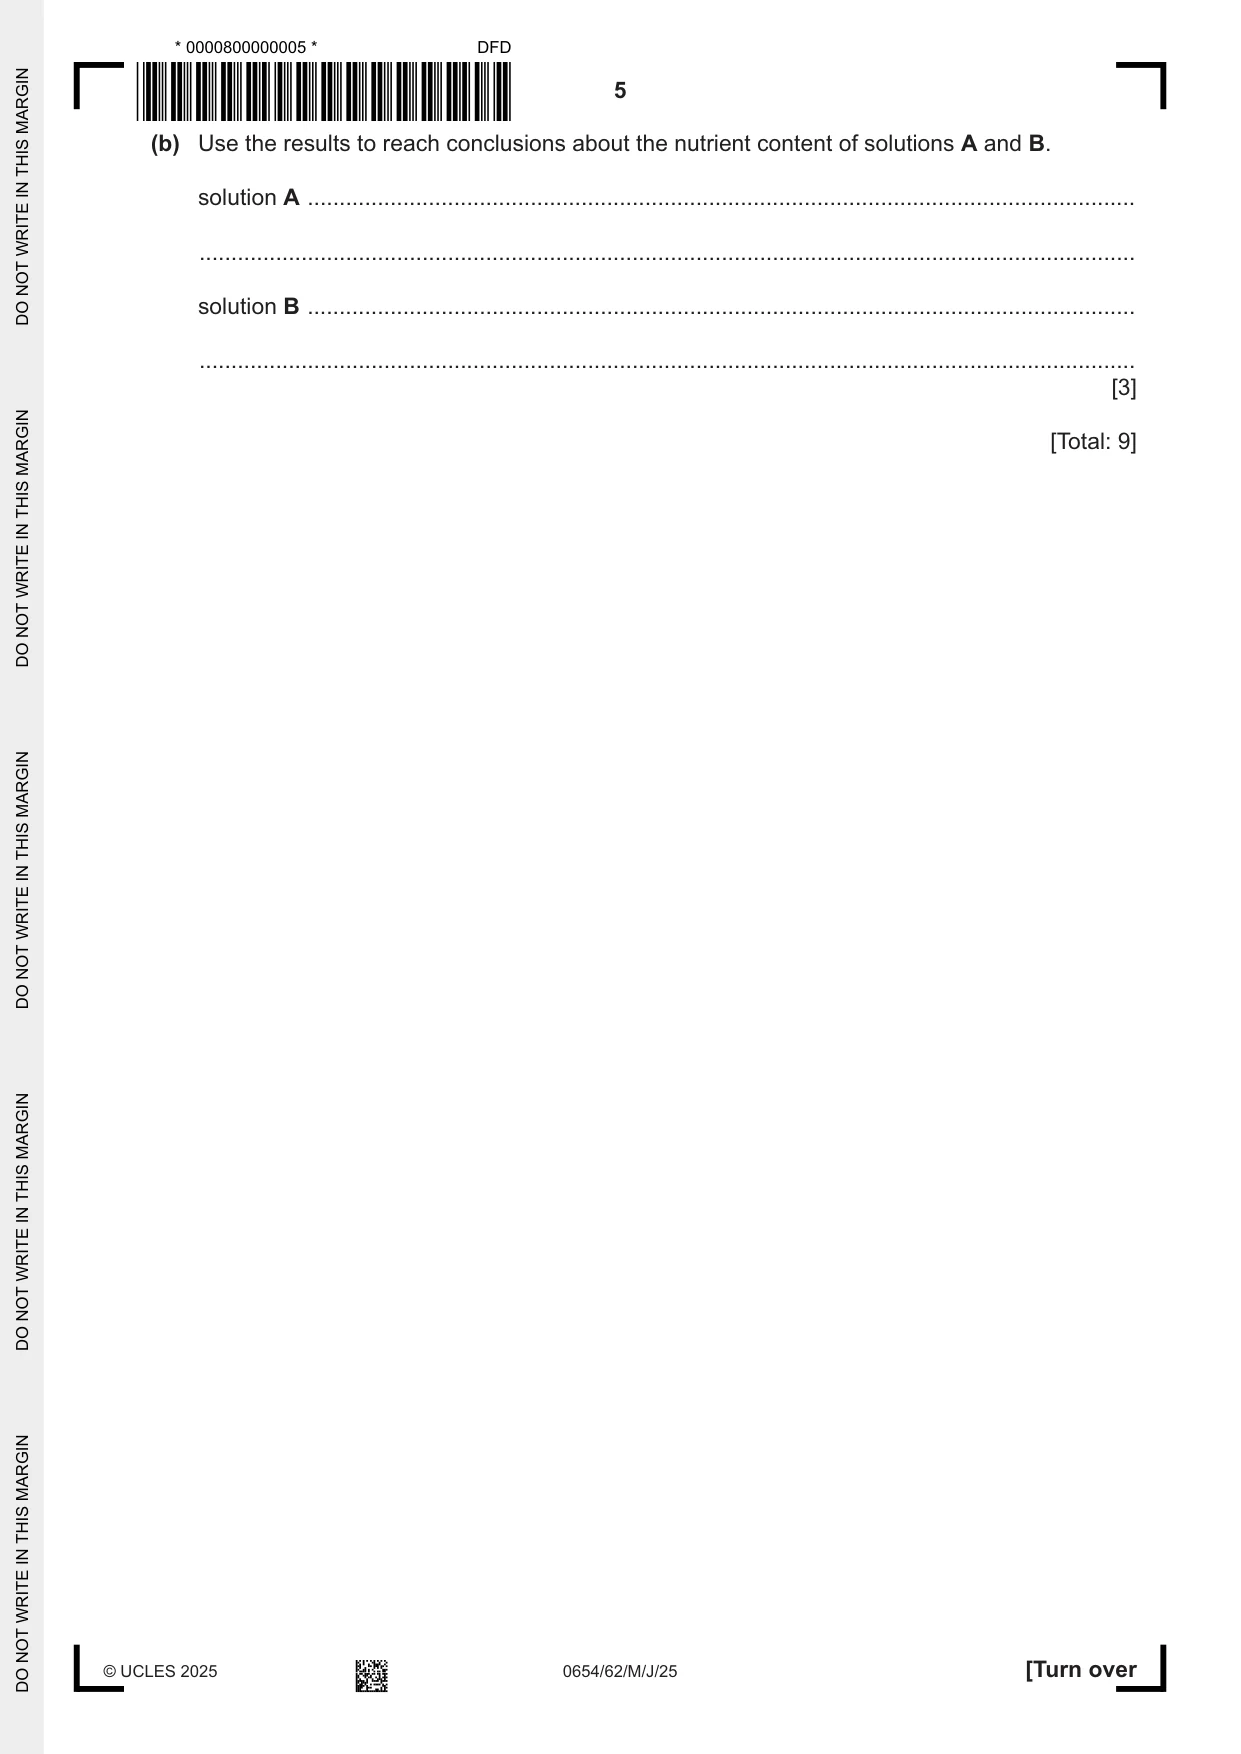
2 A student investigates the nutrient content of two solutions, A and B, made from two different parts of a flower. Procedure The student: • adds solution A to three different test-tubes • adds Benedict’s solution to one test-tube of A and places it in a hot water-bath • adds biuret solution to the second test-tube of A • adds iodine solution to the third test-tube of A. Repeats the procedure using solution B instead of solution A. (a) Fig. 2.1 shows the notes made by the student. Solution A tests positive with Benedict’s solution and negative with biuret solution and iodine solution. Solution B tests positive with biuret solution and negative with Benedict’s solution and iodine solution. Fig. 2.1 Draw a results table to record the results the student obtains. Record the final colours the student observes for each solution. [6] (b) Use the results to reach conclusions about the nutrient content of solutions A and B. solution A .................................................................................................................................. ................................................................................................................................................... solution B .................................................................................................................................. ................................................................................................................................................... [3] [Total: 9]
Mark scheme: 2(a) one column / row for reagents ; 6 column / row headings for observations / (final colour / results showing A and B ; A – yellow / green / orange / red for Benedict’s ; B – purple for biuret ; A biuret and B Benedict’s blue ; A and B both brown with iodine ; 2(b) A contains reducing sugar ; 3 B contains protein ; neither contain starch ;
Q3 · A student investigates how the solubility of potassium sulfate changes with the volume of…
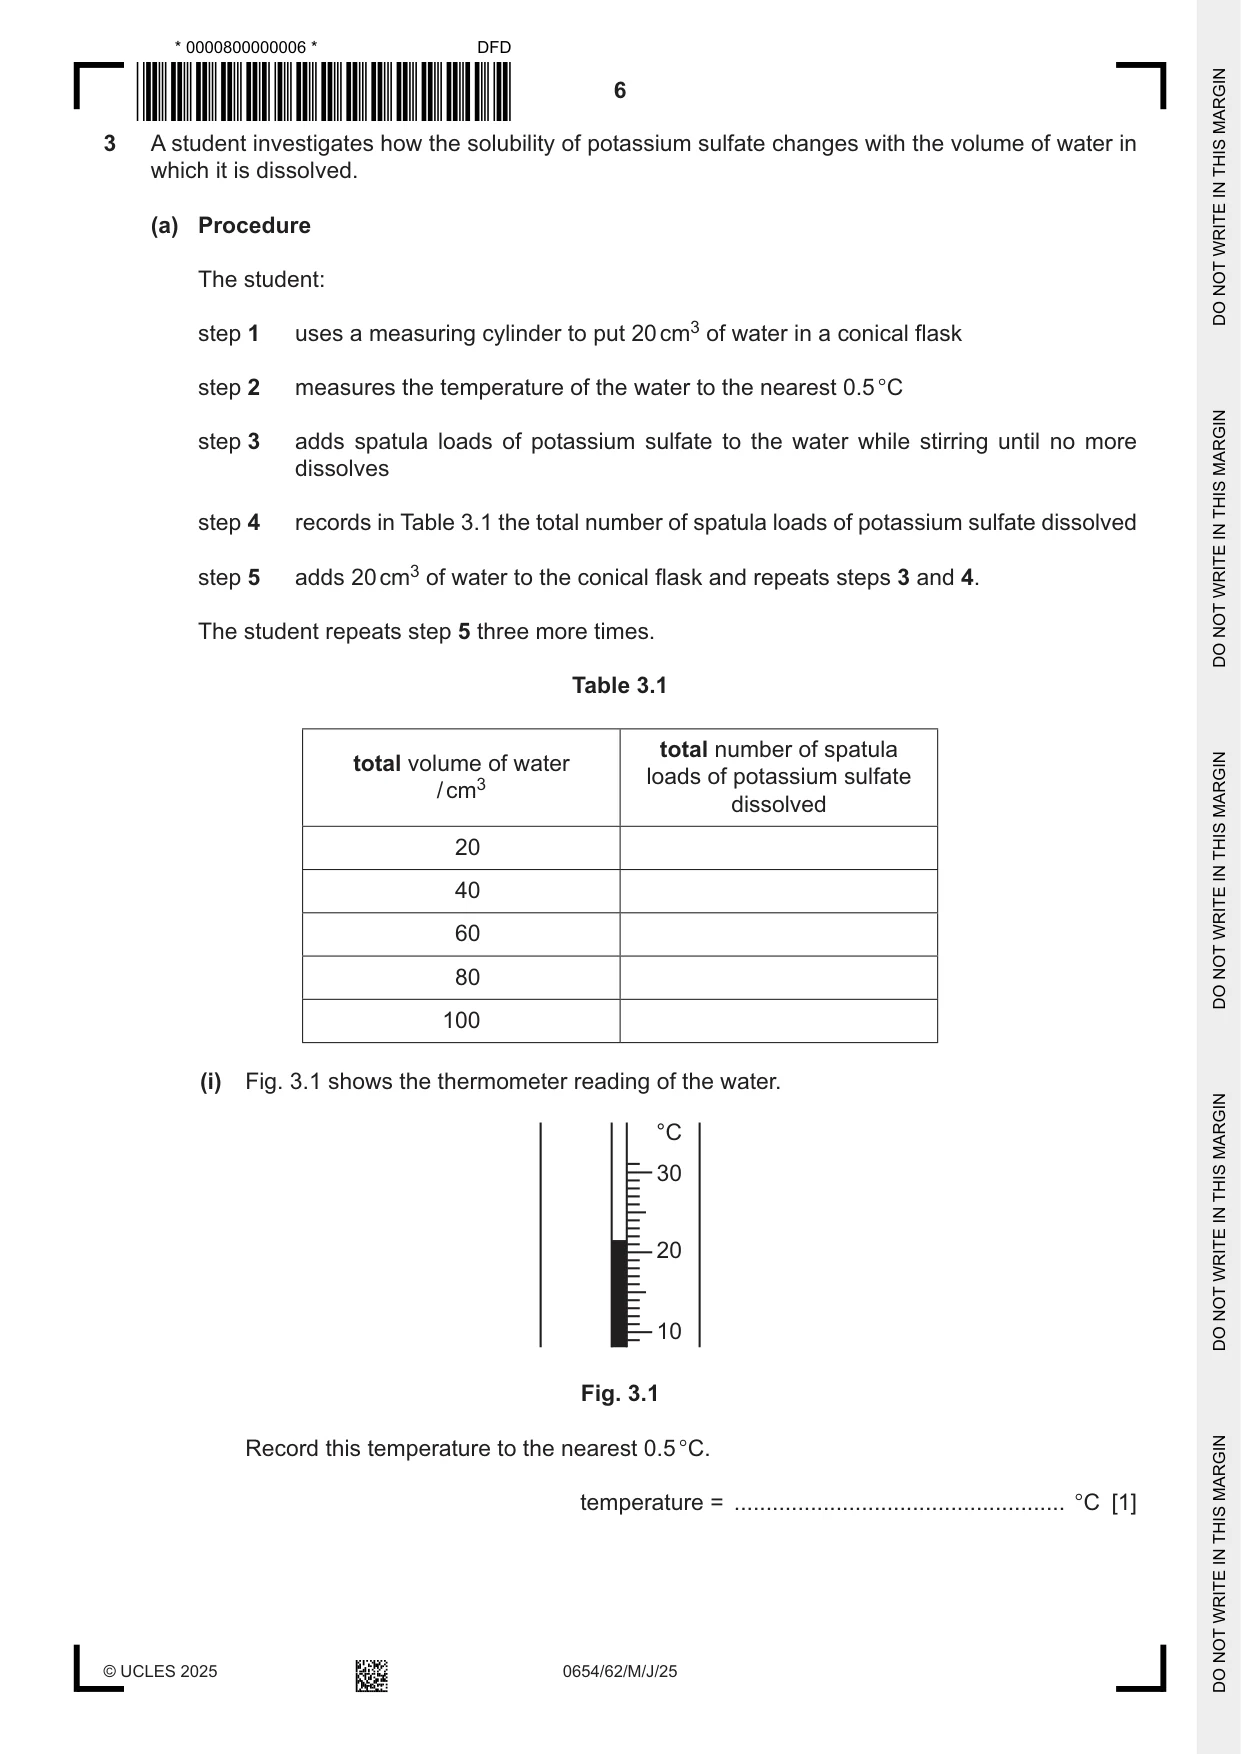
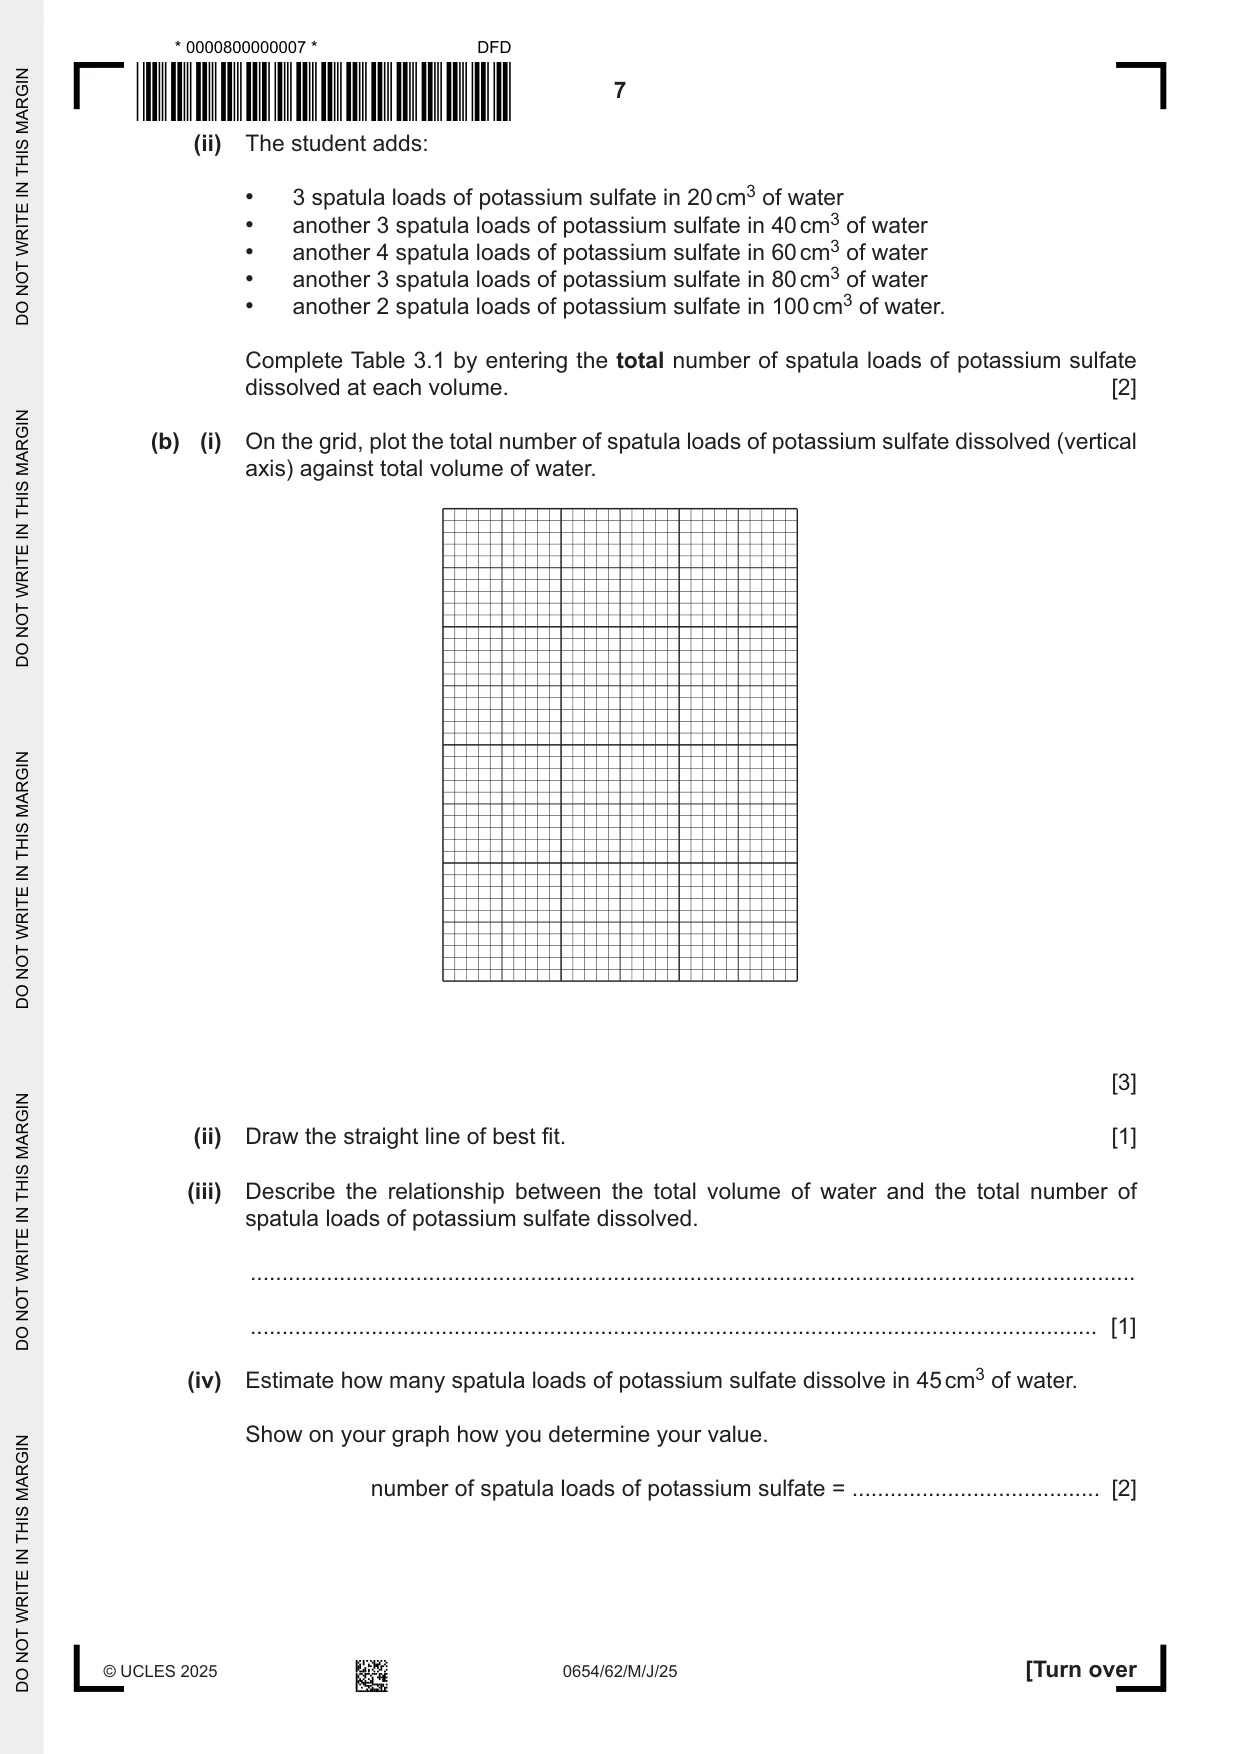
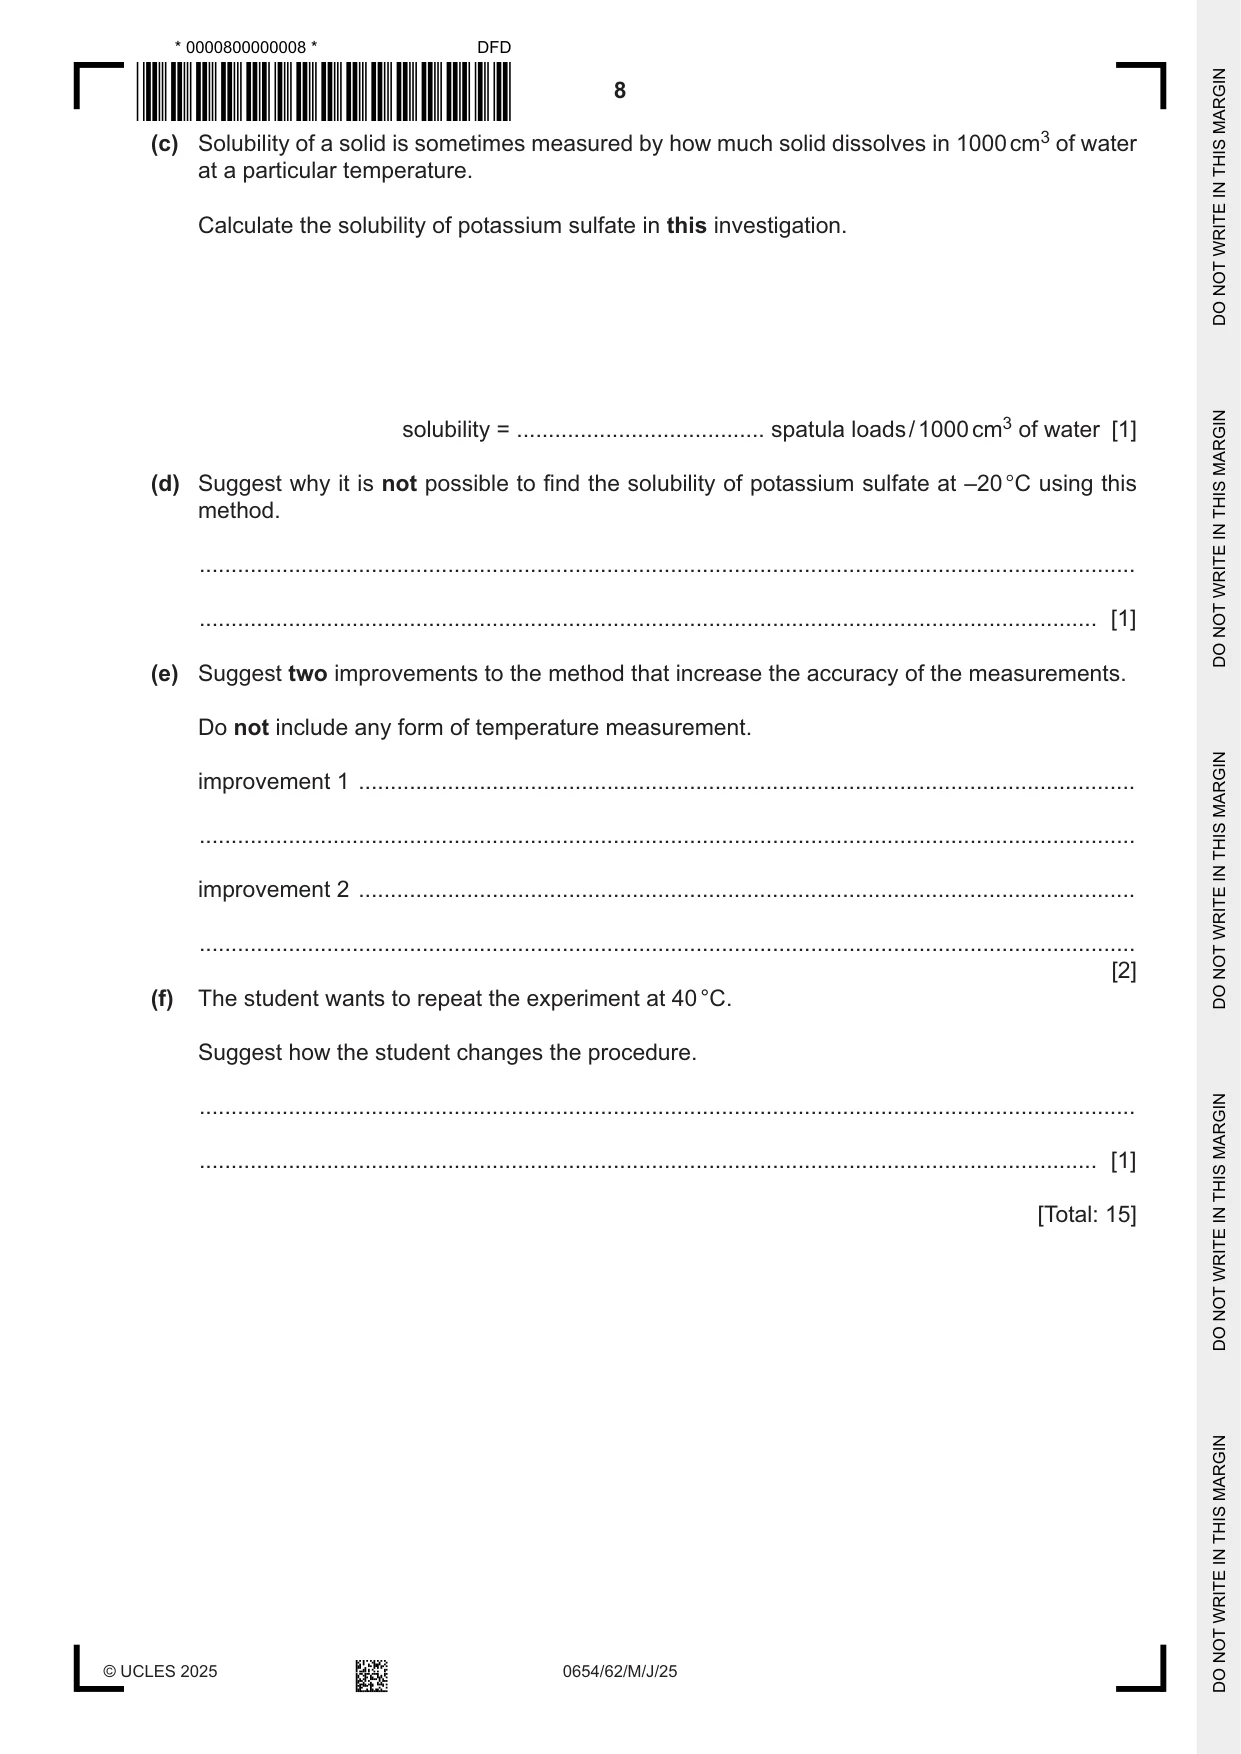
3 A student investigates how the solubility of potassium sulfate changes with the volume of water in which it is dissolved. (a) Procedure The student: step 1 uses a measuring cylinder to put 20 cm3 of water in a conical flask step 2 measures the temperature of the water to the nearest 0.5 °C step 3 adds spatula loads of potassium sulfate to the water while stirring until no more dissolves step 4 records in Table 3.1 the total number of spatula loads of potassium sulfate dissolved step 5 adds 20 cm3 of water to the conical flask and repeats steps 3 and 4. The student repeats step 5 three more times. Table 3.1 total number of spatula total volume of water loads of potassium sulfate / cm3 dissolved 20 40 60 80 100 (i) Fig. 3.1 shows the thermometer reading of the water. °C 30 20 10 Fig. 3.1 Record this temperature to the nearest 0.5 °C. temperature = .................................................... °C [1] (ii) The student adds: • 3 spatula loads of potassium sulfate in 20 cm3 of water • another 3 spatula loads of potassium sulfate in 40 cm3 of water • another 4 spatula loads of potassium sulfate in 60 cm3 of water • another 3 spatula loads of potassium sulfate in 80 cm3 of water • another 2 spatula loads of potassium sulfate in 100 cm3 of water. Complete Table 3.1 by entering the total number of spatula loads of potassium sulfate dissolved at each volume. [2] (b) (i) On the grid, plot the total number of spatula loads of potassium sulfate dissolved (vertical axis) against total volume of water. [3] (ii) Draw the straight line of best fit. [1] (iii) Describe the relationship between the total volume of water and the total number of spatula loads of potassium sulfate dissolved. ........................................................................................................................................... ..................................................................................................................................... [1] (iv) Estimate how many spatula loads of potassium sulfate dissolve in 45 cm3 of water. Show on your graph how you determine your value. number of spatula loads of potassium sulfate = ....................................... [2] (c) Solubility of a solid is sometimes measured by how much solid dissolves in 1000 cm3 of water at a particular temperature. Calculate the solubility of potassium sulfate in this investigation. solubility = ....................................... spatula loads / 1000 cm3 of water [1] (d) Suggest why it is not possible to find the solubility of potassium sulfate at –20 °C using this method. ................................................................................................................................................... ............................................................................................................................................. [1] (e) Suggest two improvements to the method that increase the accuracy of the measurements. Do not include any form of temperature measurement. improvement 1 .......................................................................................................................... ................................................................................................................................................... improvement 2 .......................................................................................................................... ................................................................................................................................................... [2] (f) The student wants to repeat the experiment at 40 °C. Suggest how the student changes the procedure. ................................................................................................................................................... ............................................................................................................................................. [1] [Total: 15]
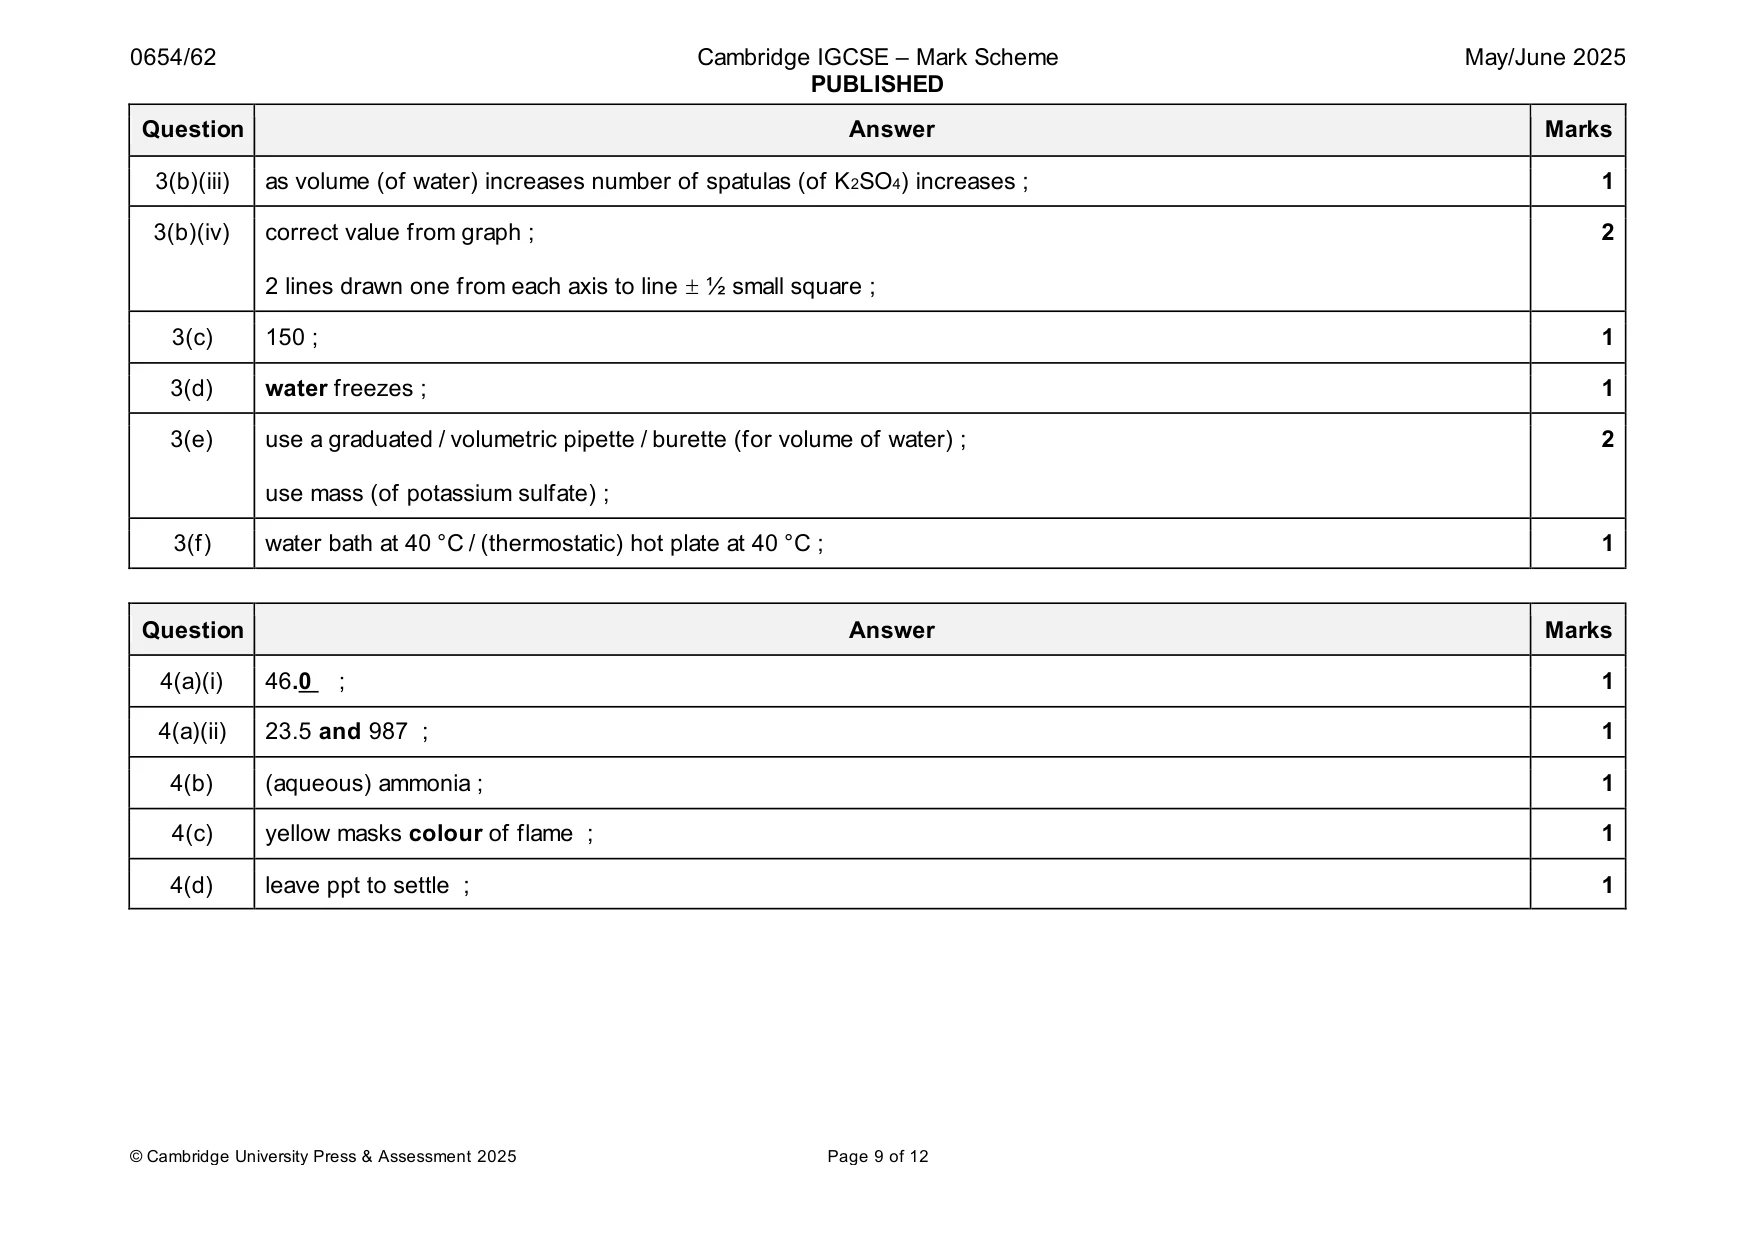
Mark scheme: 3(a)(i) 21.5 (°C) ; 1 3(a)(ii) 3 2 6 10 13 15 ;; 3(b)(i) axes correct orientation and labelled with quantity and unit ; 3 sensible linear scales with points covering ⩾ ½ grid and all points can be plotted ; points plotted correctly ½ small square ; 3(b)(ii) best-fit line ; 1 3(b)(iii) as volume (of water) increases number of spatulas (of K2SO4) increases ; 1 3(b)(iv) correct value from graph ; 2 2 lines drawn one from each axis to line ½ small square ; 3(c) 150 ; 1 3(d) water freezes ; 1 3(e) use a graduated / volumetric pipette / burette (for volume of water) ; 2 use mass (of potassium sulfate) ; 3(f) water bath at 40 °C / (thermostatic) hot plate at 40 °C ; 1
Q4 · A student investigates copper sulfate
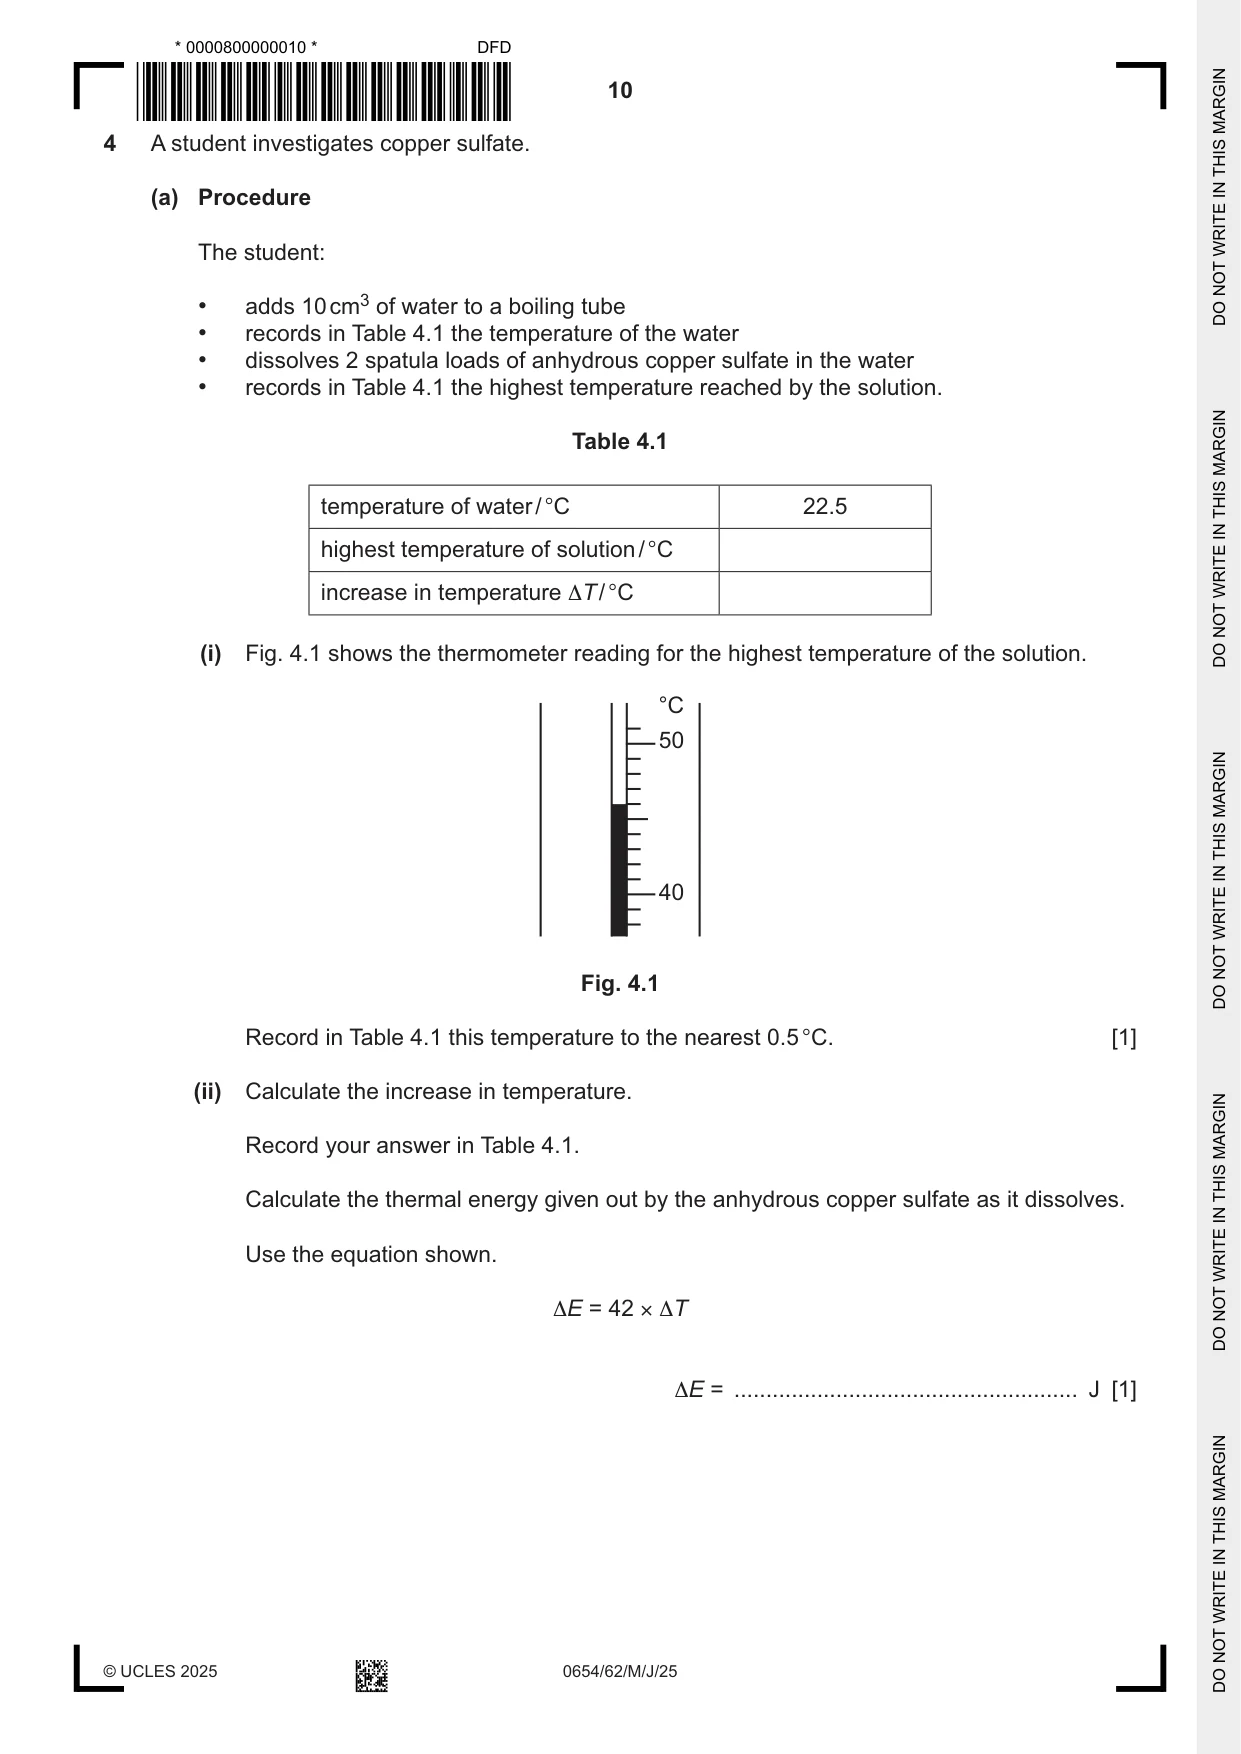
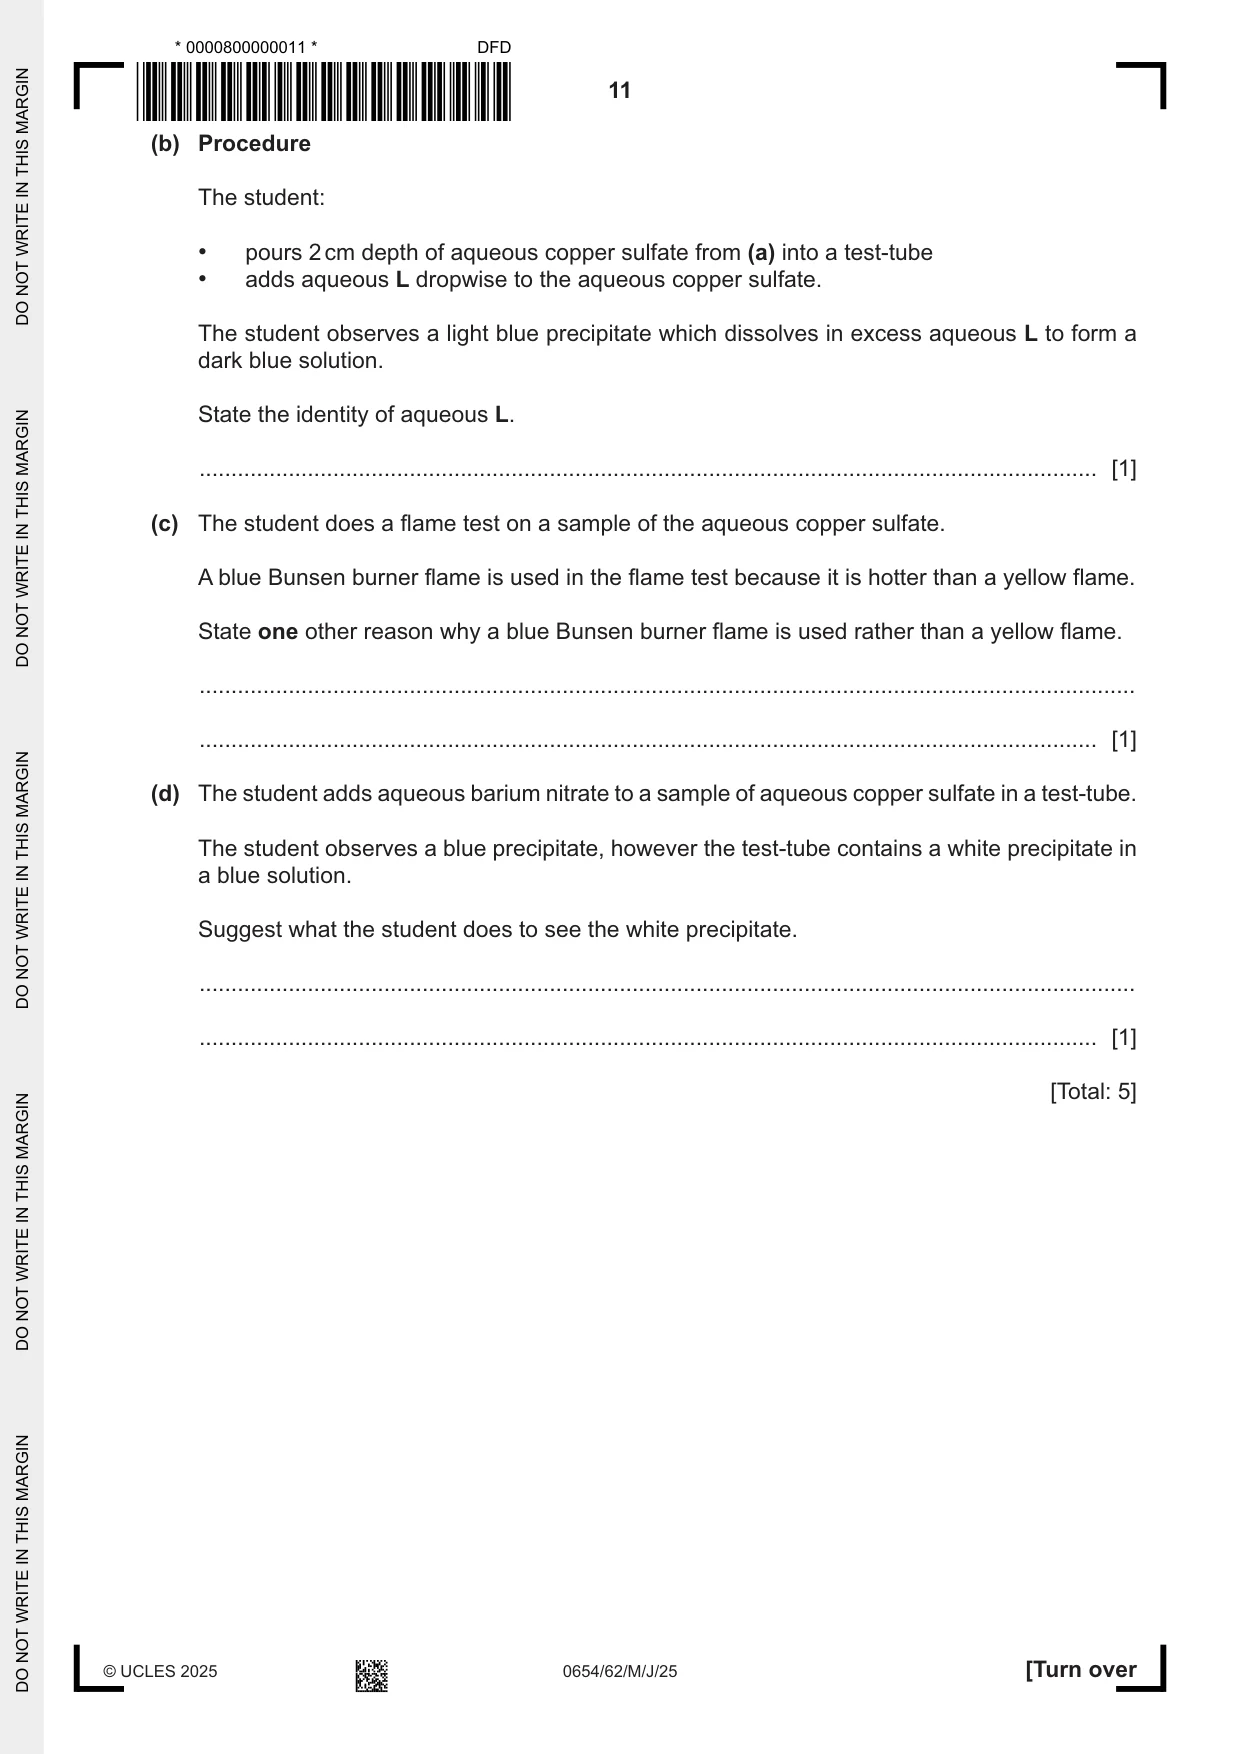
4 A student investigates copper sulfate. (a) Procedure The student: • adds 10 cm3 of water to a boiling tube • records in Table 4.1 the temperature of the water • dissolves 2 spatula loads of anhydrous copper sulfate in the water • records in Table 4.1 the highest temperature reached by the solution. Table 4.1 temperature of water / °C 22.5 highest temperature of solution / °C increase in temperature ΔT / °C (i) Fig. 4.1 shows the thermometer reading for the highest temperature of the solution. °C 50 40 Fig. 4.1 Record in Table 4.1 this temperature to the nearest 0.5 °C. [1] (ii) Calculate the increase in temperature. Record your answer in Table 4.1. Calculate the thermal energy given out by the anhydrous copper sulfate as it dissolves. Use the equation shown. ΔE = 42 × ΔT ΔE = ...................................................... J [1] (b) Procedure The student: • pours 2 cm depth of aqueous copper sulfate from (a) into a test-tube • adds aqueous L dropwise to the aqueous copper sulfate. The student observes a light blue precipitate which dissolves in excess aqueous L to form a dark blue solution. State the identity of aqueous L. ............................................................................................................................................. [1] (c) The student does a flame test on a sample of the aqueous copper sulfate. A blue Bunsen burner flame is used in the flame test because it is hotter than a yellow flame. State one other reason why a blue Bunsen burner flame is used rather than a yellow flame. ................................................................................................................................................... ............................................................................................................................................. [1] (d) The student adds aqueous barium nitrate to a sample of aqueous copper sulfate in a test-tube. The student observes a blue precipitate, however the test-tube contains a white precipitate in a blue solution. Suggest what the student does to see the white precipitate. ................................................................................................................................................... ............................................................................................................................................. [1] [Total: 5]
Mark scheme: 4(a)(i) 46.0 ; 1 4(a)(ii) 23.5 and 987 ; 1 4(b) (aqueous) ammonia ; 1 4(c) yellow masks colour of flame ; 1 4(d) leave ppt to settle ; 1
Q5 · When a metal ball drops into sand, it will form a small crater (hole)
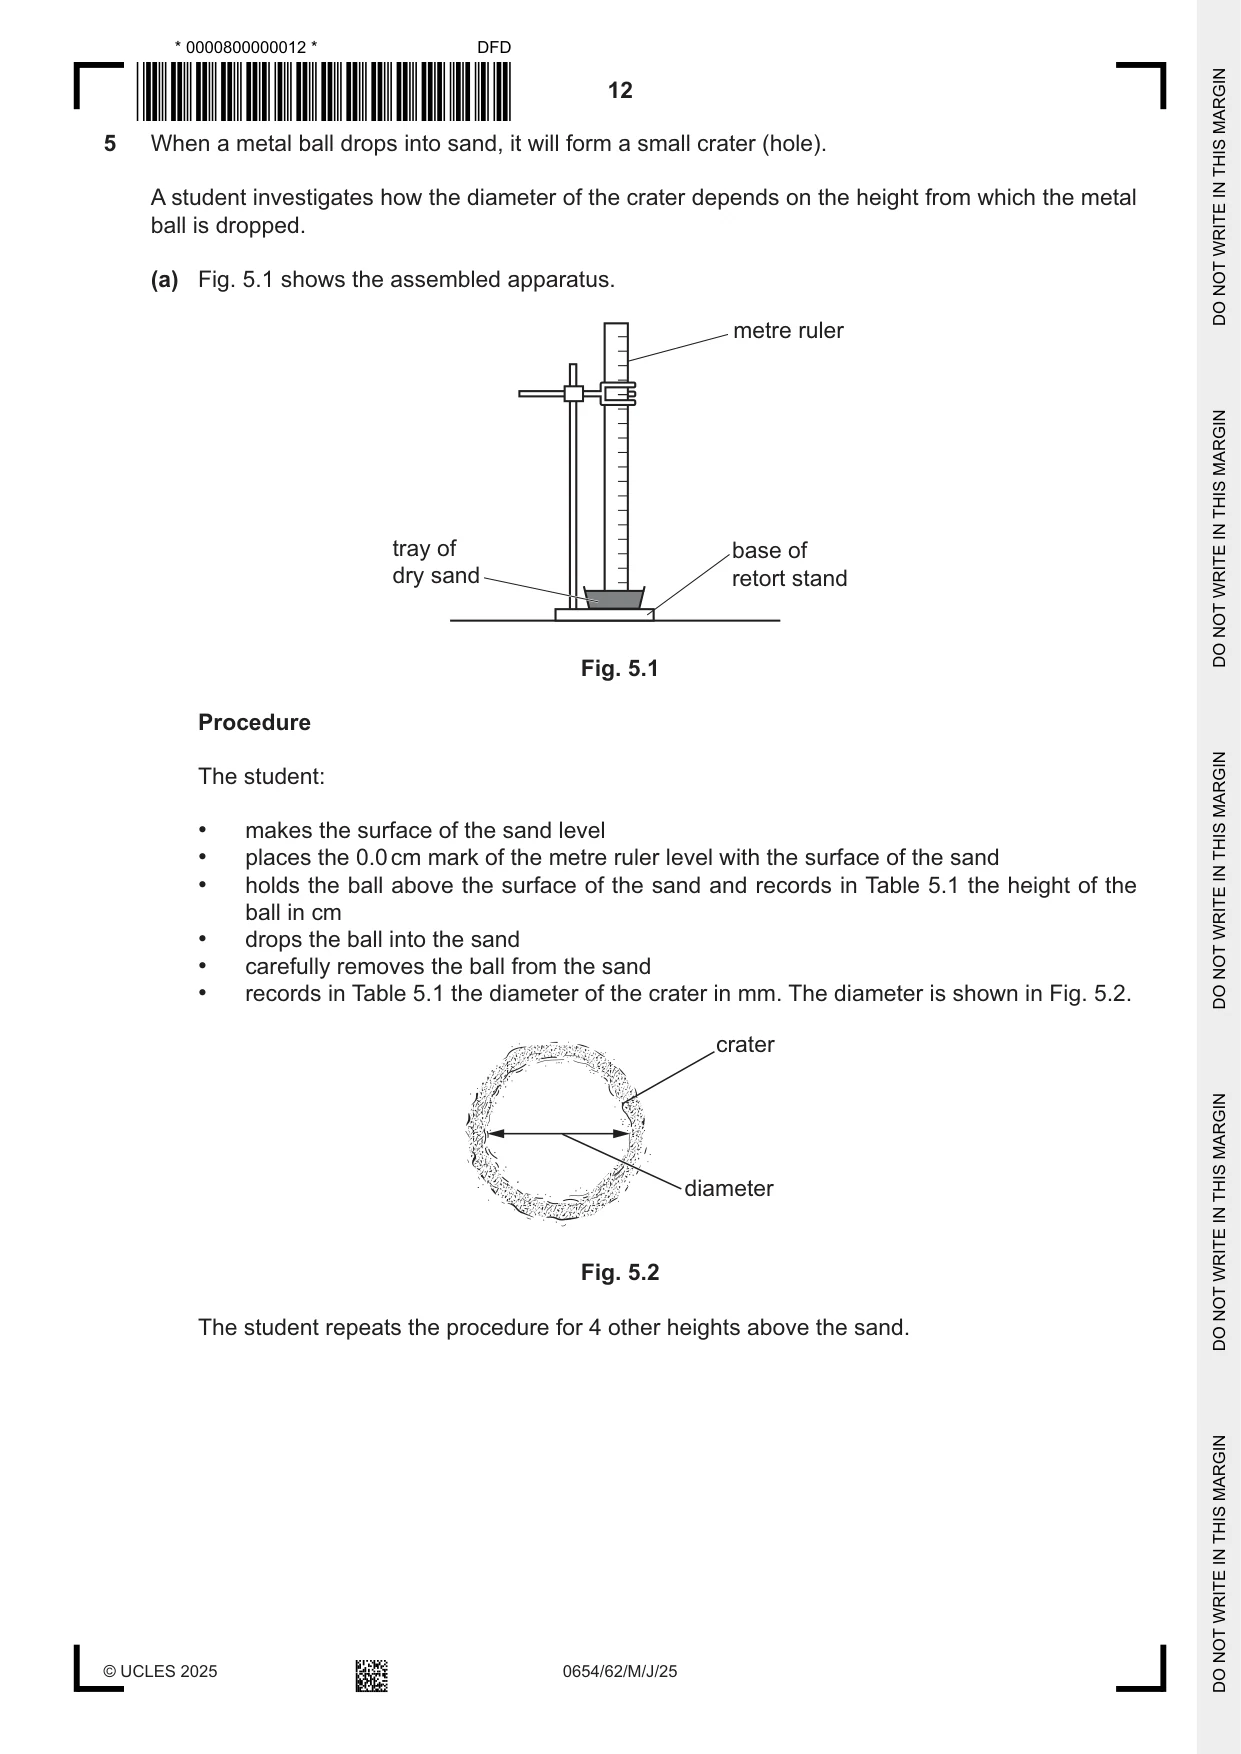
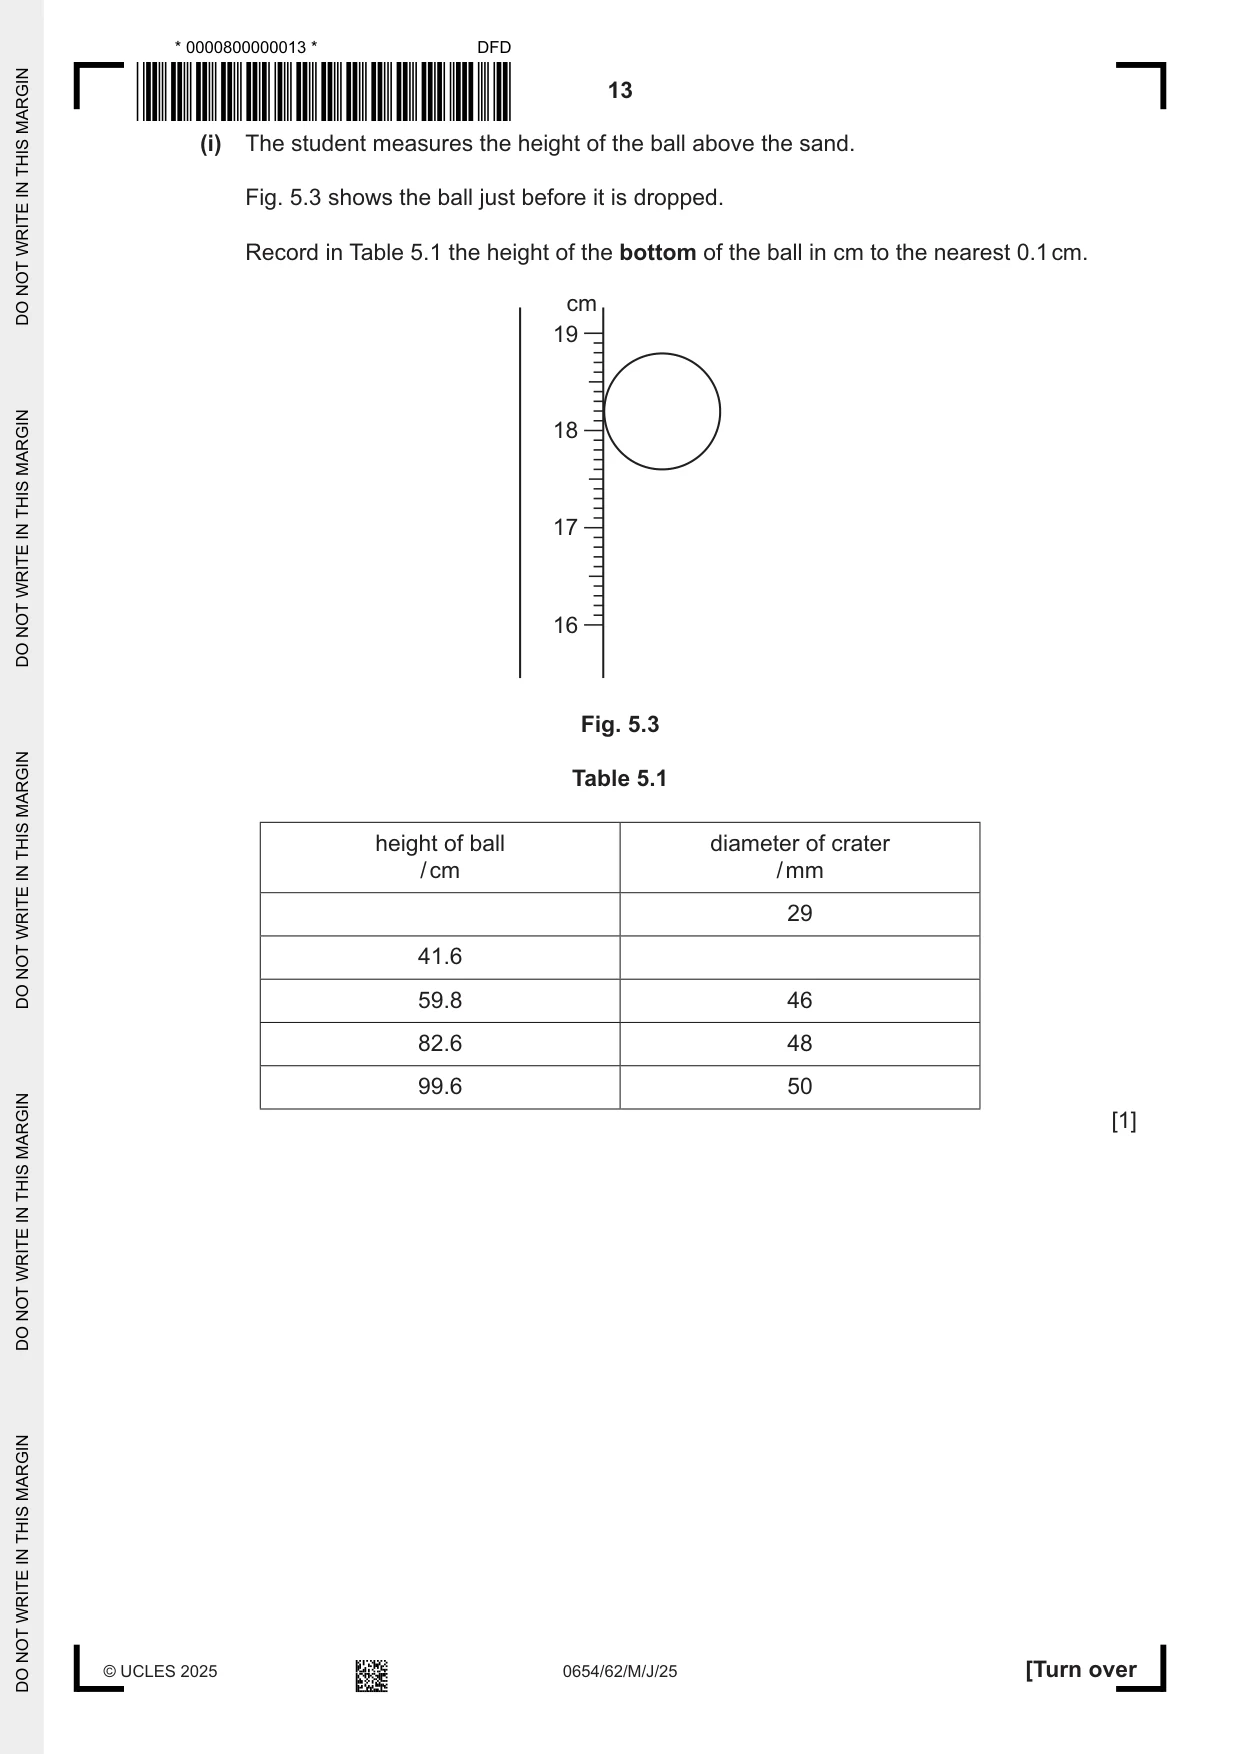
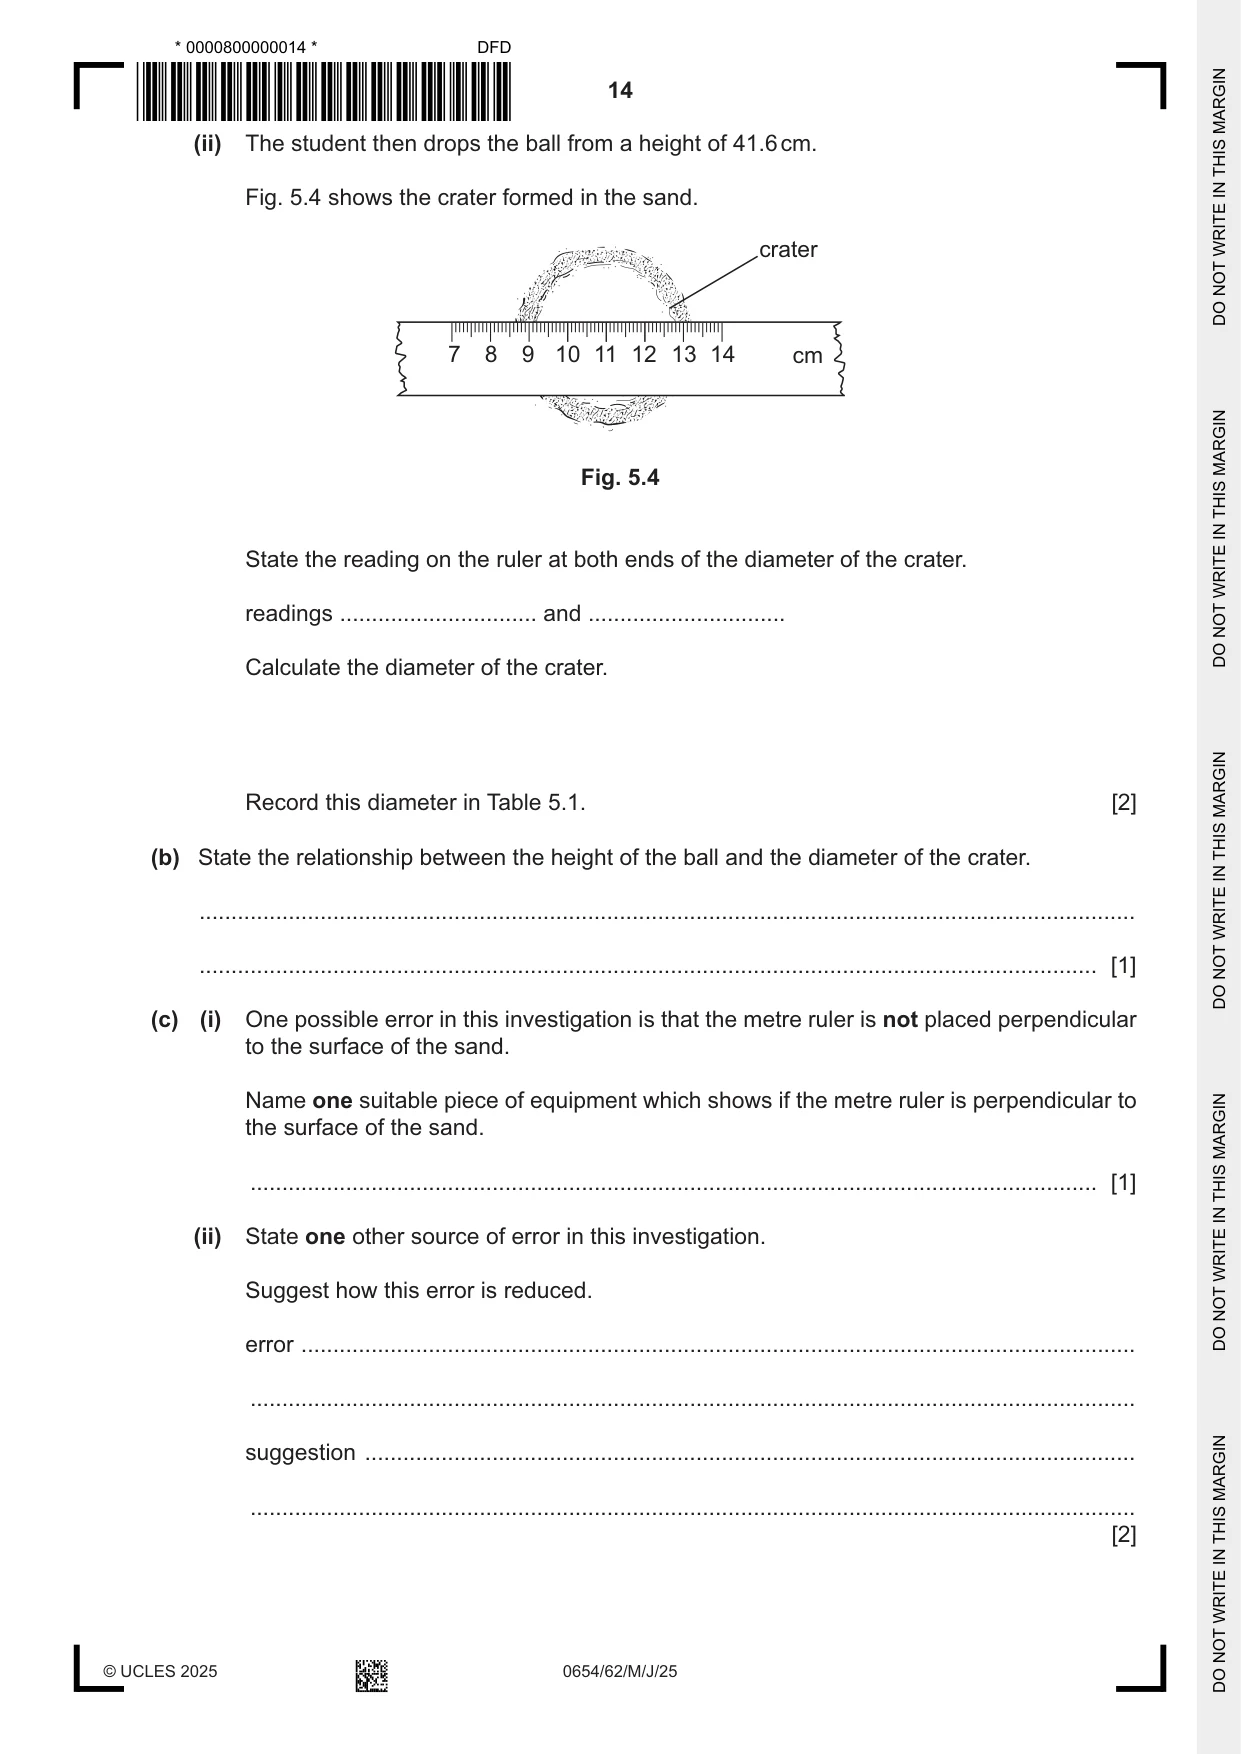
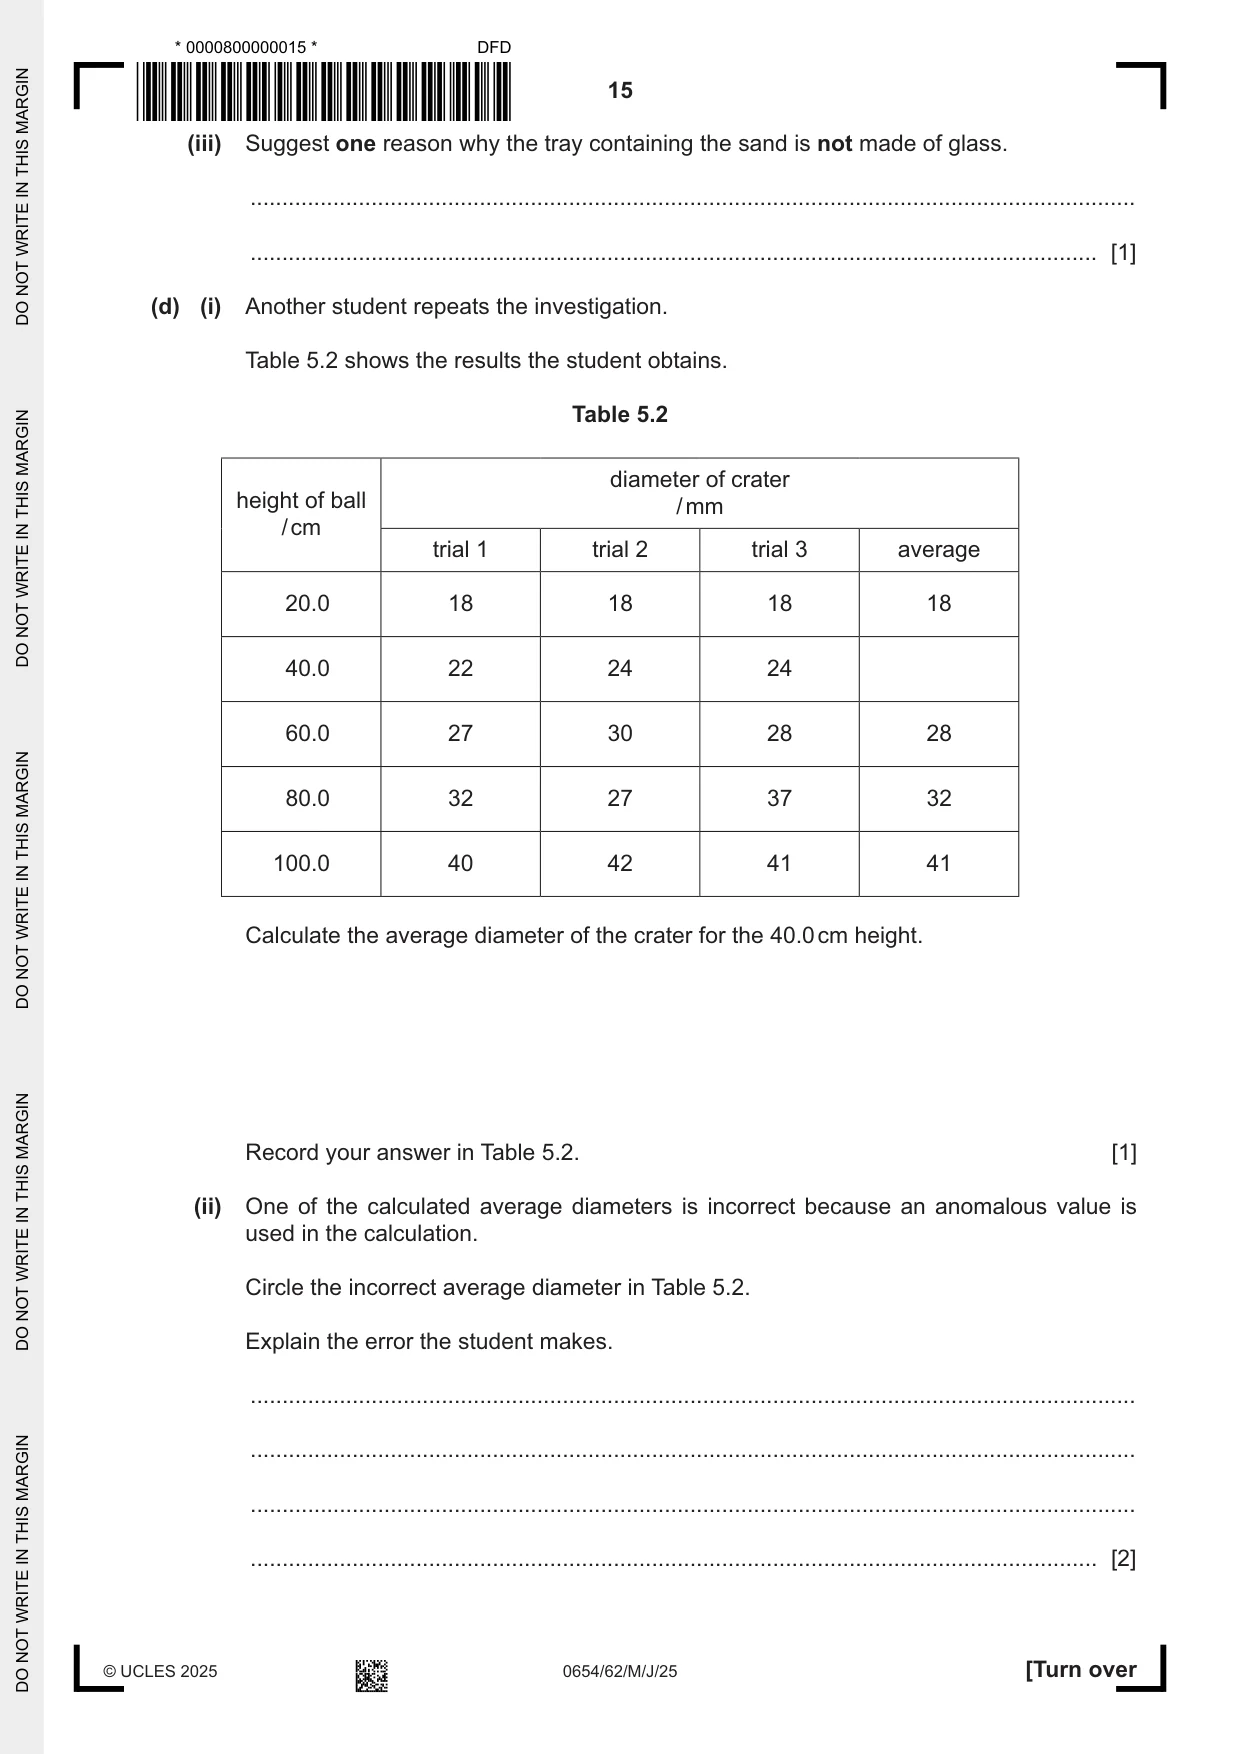
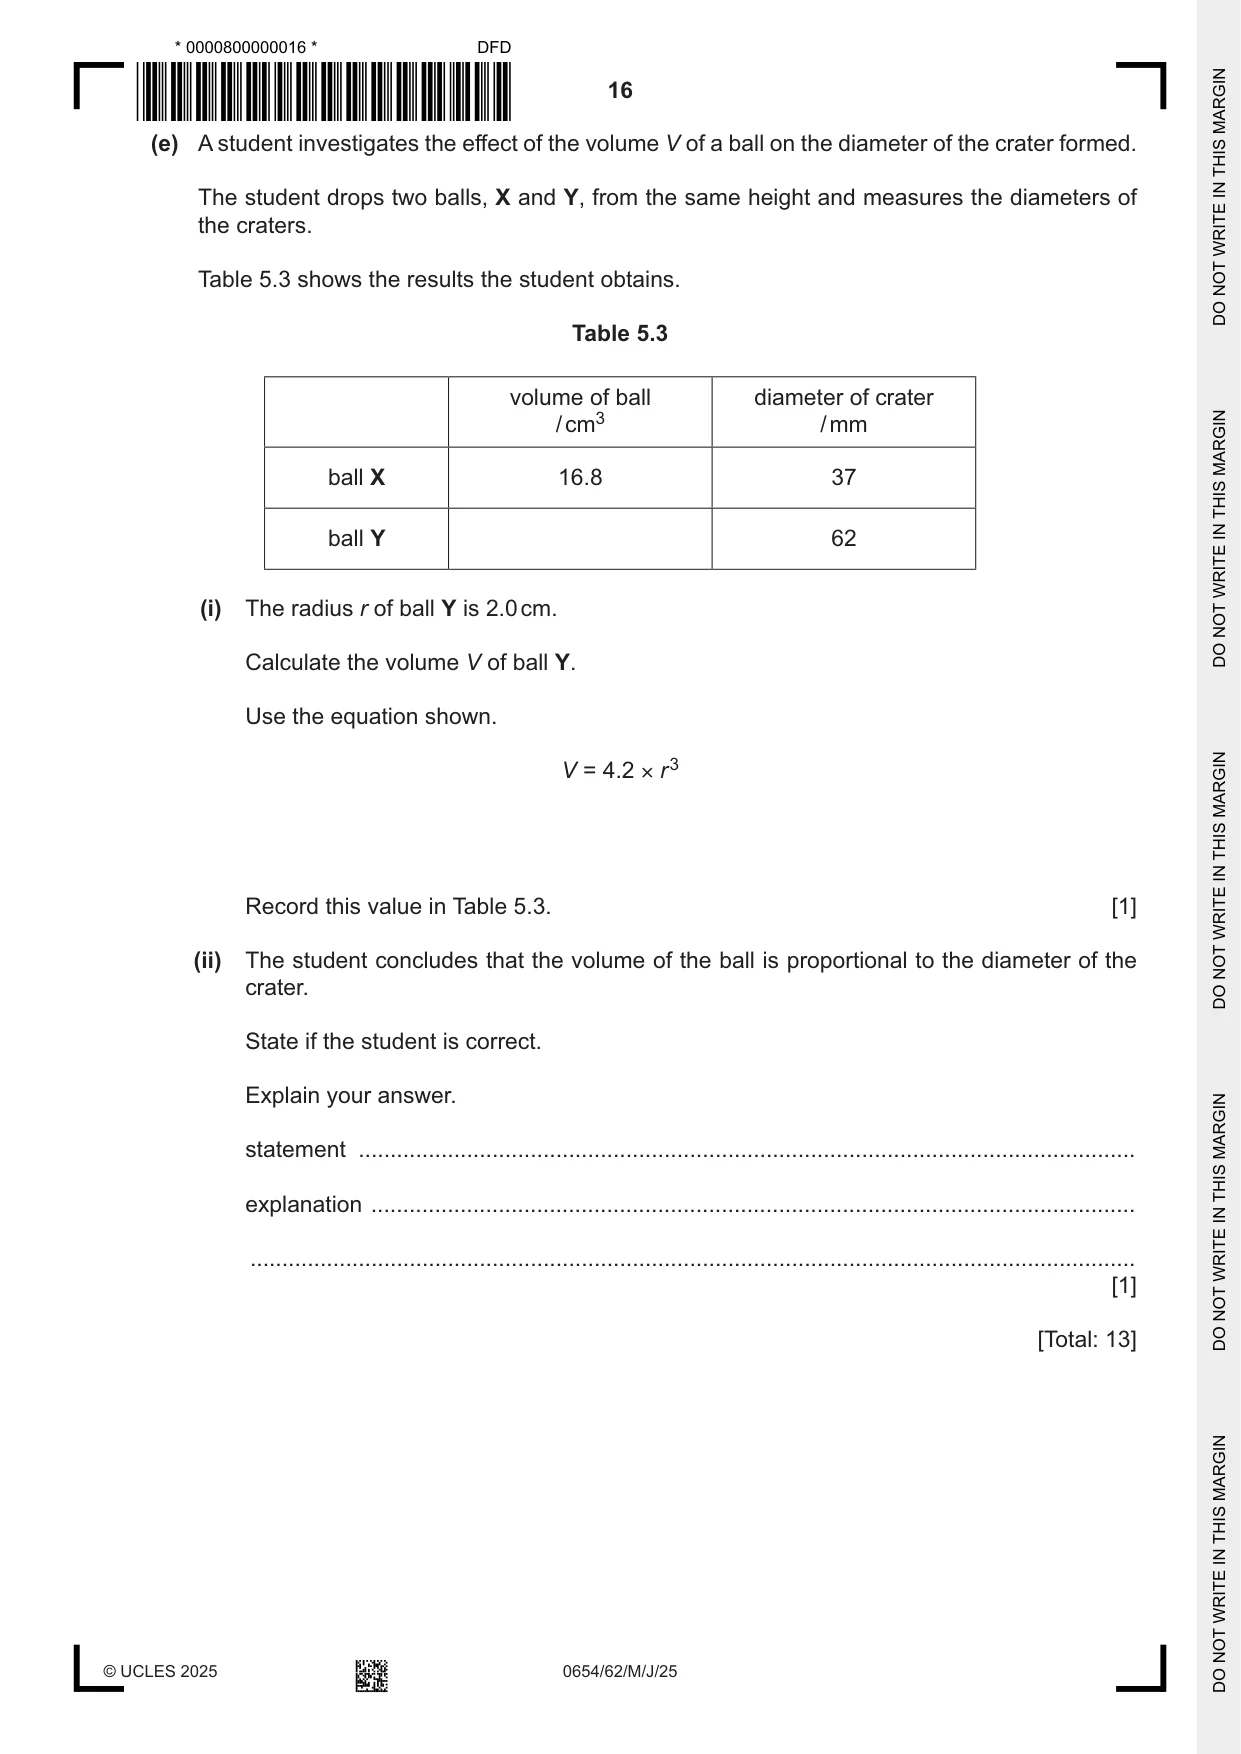
5 When a metal ball drops into sand, it will form a small crater (hole). A student investigates how the diameter of the crater depends on the height from which the metal ball is dropped. (a) Fig. 5.1 shows the assembled apparatus. metre ruler tray of base of dry sand retort stand Fig. 5.1 Procedure The student: • makes the surface of the sand level • places the 0.0 cm mark of the metre ruler level with the surface of the sand • holds the ball above the surface of the sand and records in Table 5.1 the height of the ball in cm • drops the ball into the sand • carefully removes the ball from the sand • records in Table 5.1 the diameter of the crater in mm. The diameter is shown in Fig. 5.2. crater diameter Fig. 5.2 The student repeats the procedure for 4 other heights above the sand. (i) The student measures the height of the ball above the sand. Fig. 5.3 shows the ball just before it is dropped. Record in Table 5.1 the height of the bottom of the ball in cm to the nearest 0.1 cm. cm 19 18 17 16 Fig. 5.3 Table 5.1 height of ball diameter of crater / cm / mm 29 41.6 59.8 46 82.6 48 99.6 50 [1] (ii) The student then drops the ball from a height of 41.6 cm. Fig. 5.4 shows the crater formed in the sand. crater 7 8 9 10 11 12 13 14 cm Fig. 5.4 State the reading on the ruler at both ends of the diameter of the crater. readings ............................... and ............................... Calculate the diameter of the crater. Record this diameter in Table 5.1. [2] (b) State the relationship between the height of the ball and the diameter of the crater. ................................................................................................................................................... ............................................................................................................................................. [1] (c) (i) One possible error in this investigation is that the metre ruler is not placed perpendicular to the surface of the sand. Name one suitable piece of equipment which shows if the metre ruler is perpendicular to the surface of the sand. ..................................................................................................................................... [1] (ii) State one other source of error in this investigation. Suggest how this error is reduced. error ................................................................................................................................... ........................................................................................................................................... suggestion ......................................................................................................................... ........................................................................................................................................... [2] (iii) Suggest one reason why the tray containing the sand is not made of glass. ........................................................................................................................................... ..................................................................................................................................... [1] (d) (i) Another student repeats the investigation. Table 5.2 shows the results the student obtains. Table 5.2 diameter of crater height of ball / mm / cm trial 1 trial 2 trial 3 average 20.0 18 18 18 18 40.0 22 24 24 60.0 27 30 28 28 80.0 32 27 37 32 100.0 40 42 41 41 Calculate the average diameter of the crater for the 40.0 cm height. Record your answer in Table 5.2. [1] (ii) One of the calculated average diameters is incorrect because an anomalous value is used in the calculation. Circle the incorrect average diameter in Table 5.2. Explain the error the student makes. ........................................................................................................................................... ........................................................................................................................................... ........................................................................................................................................... ..................................................................................................................................... [2] (e) A student investigates the effect of the volume V of a ball on the diameter of the crater formed. The student drops two balls, X and Y, from the same height and measures the diameters of the craters. Table 5.3 shows the results the student obtains. Table 5.3 volume of ball diameter of crater / cm3 / mm ball X 16.8 37 ball Y 62 (i) The radius r of ball Y is 2.0 cm. Calculate the volume V of ball Y. Use the equation shown. V = 4.2 × r 3 Record this value in Table 5.3. [1] (ii) The student concludes that the volume of the ball is proportional to the diameter of the crater. State if the student is correct. Explain your answer. statement .......................................................................................................................... explanation ........................................................................................................................ ........................................................................................................................................... [1] [Total: 13]
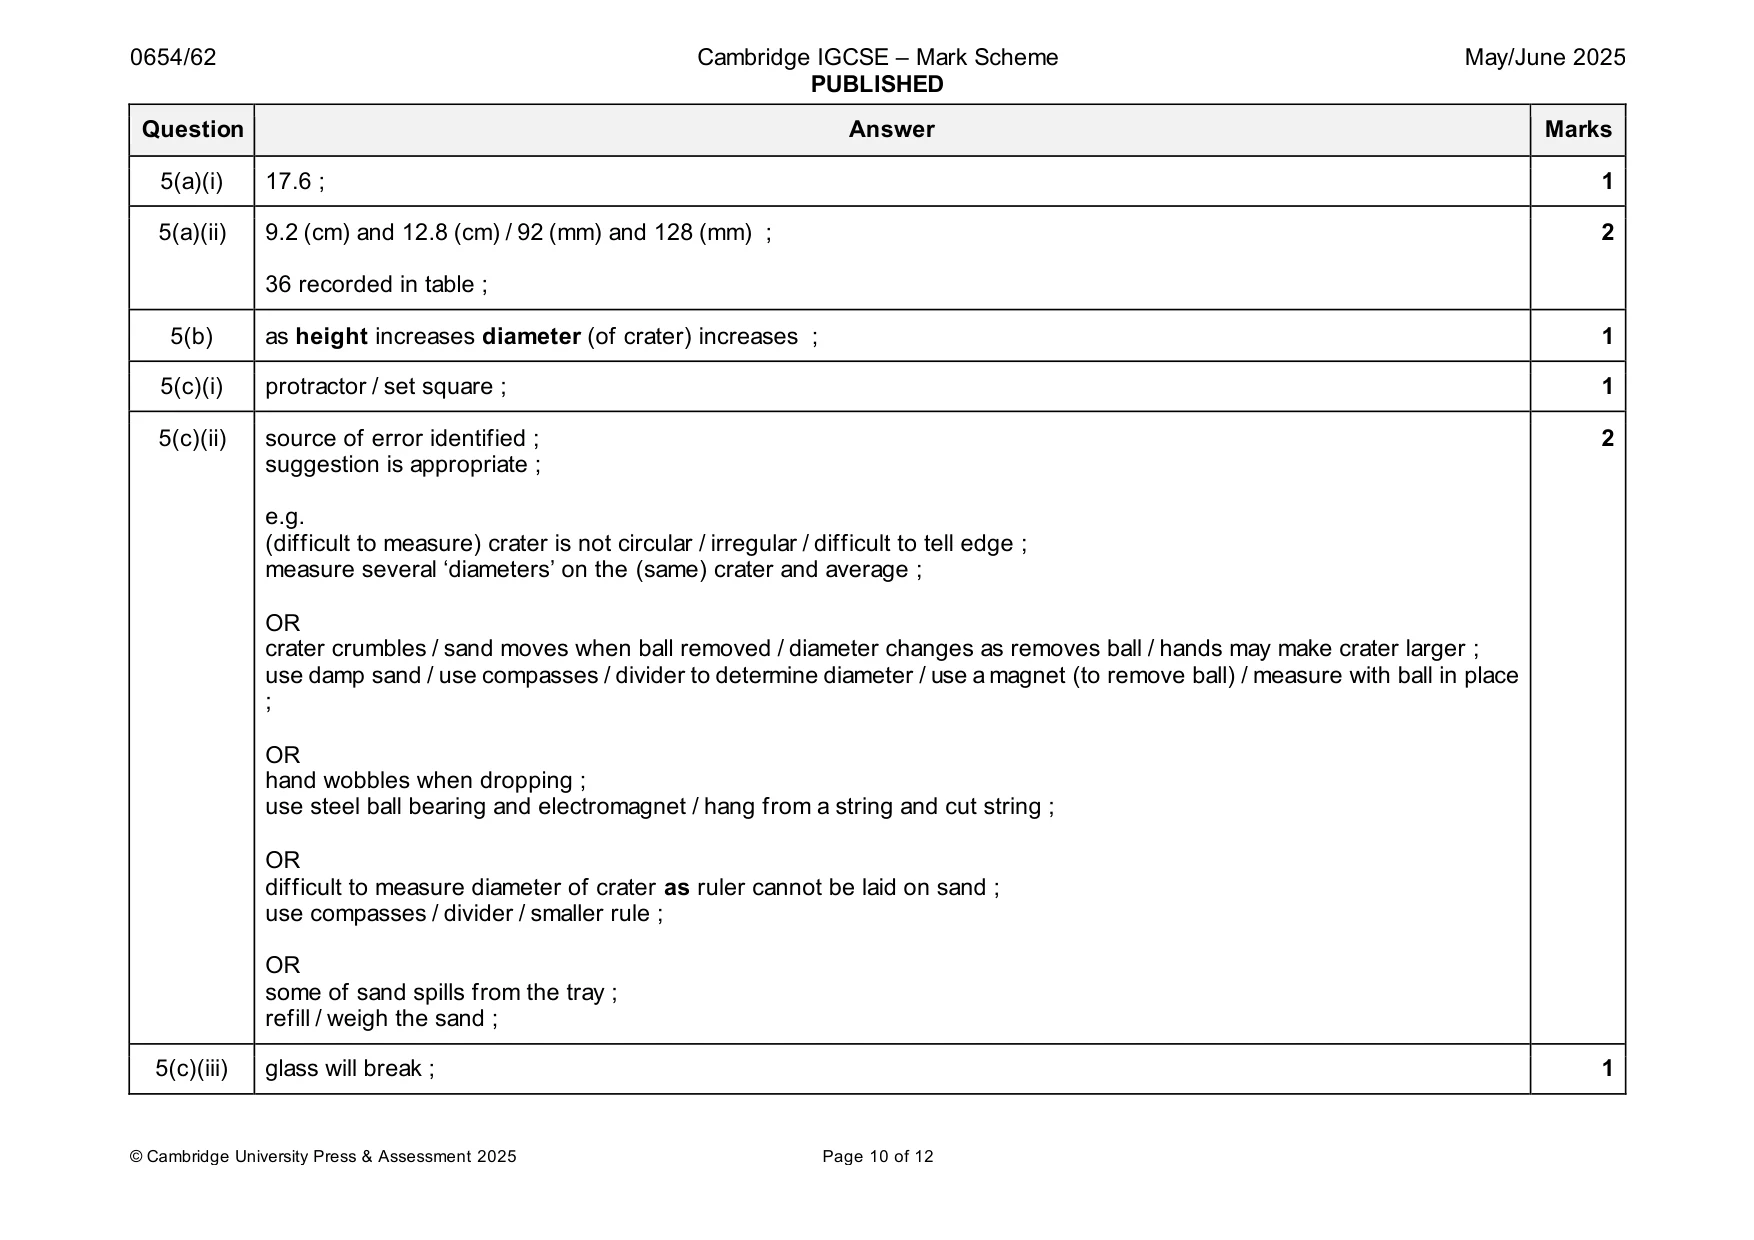
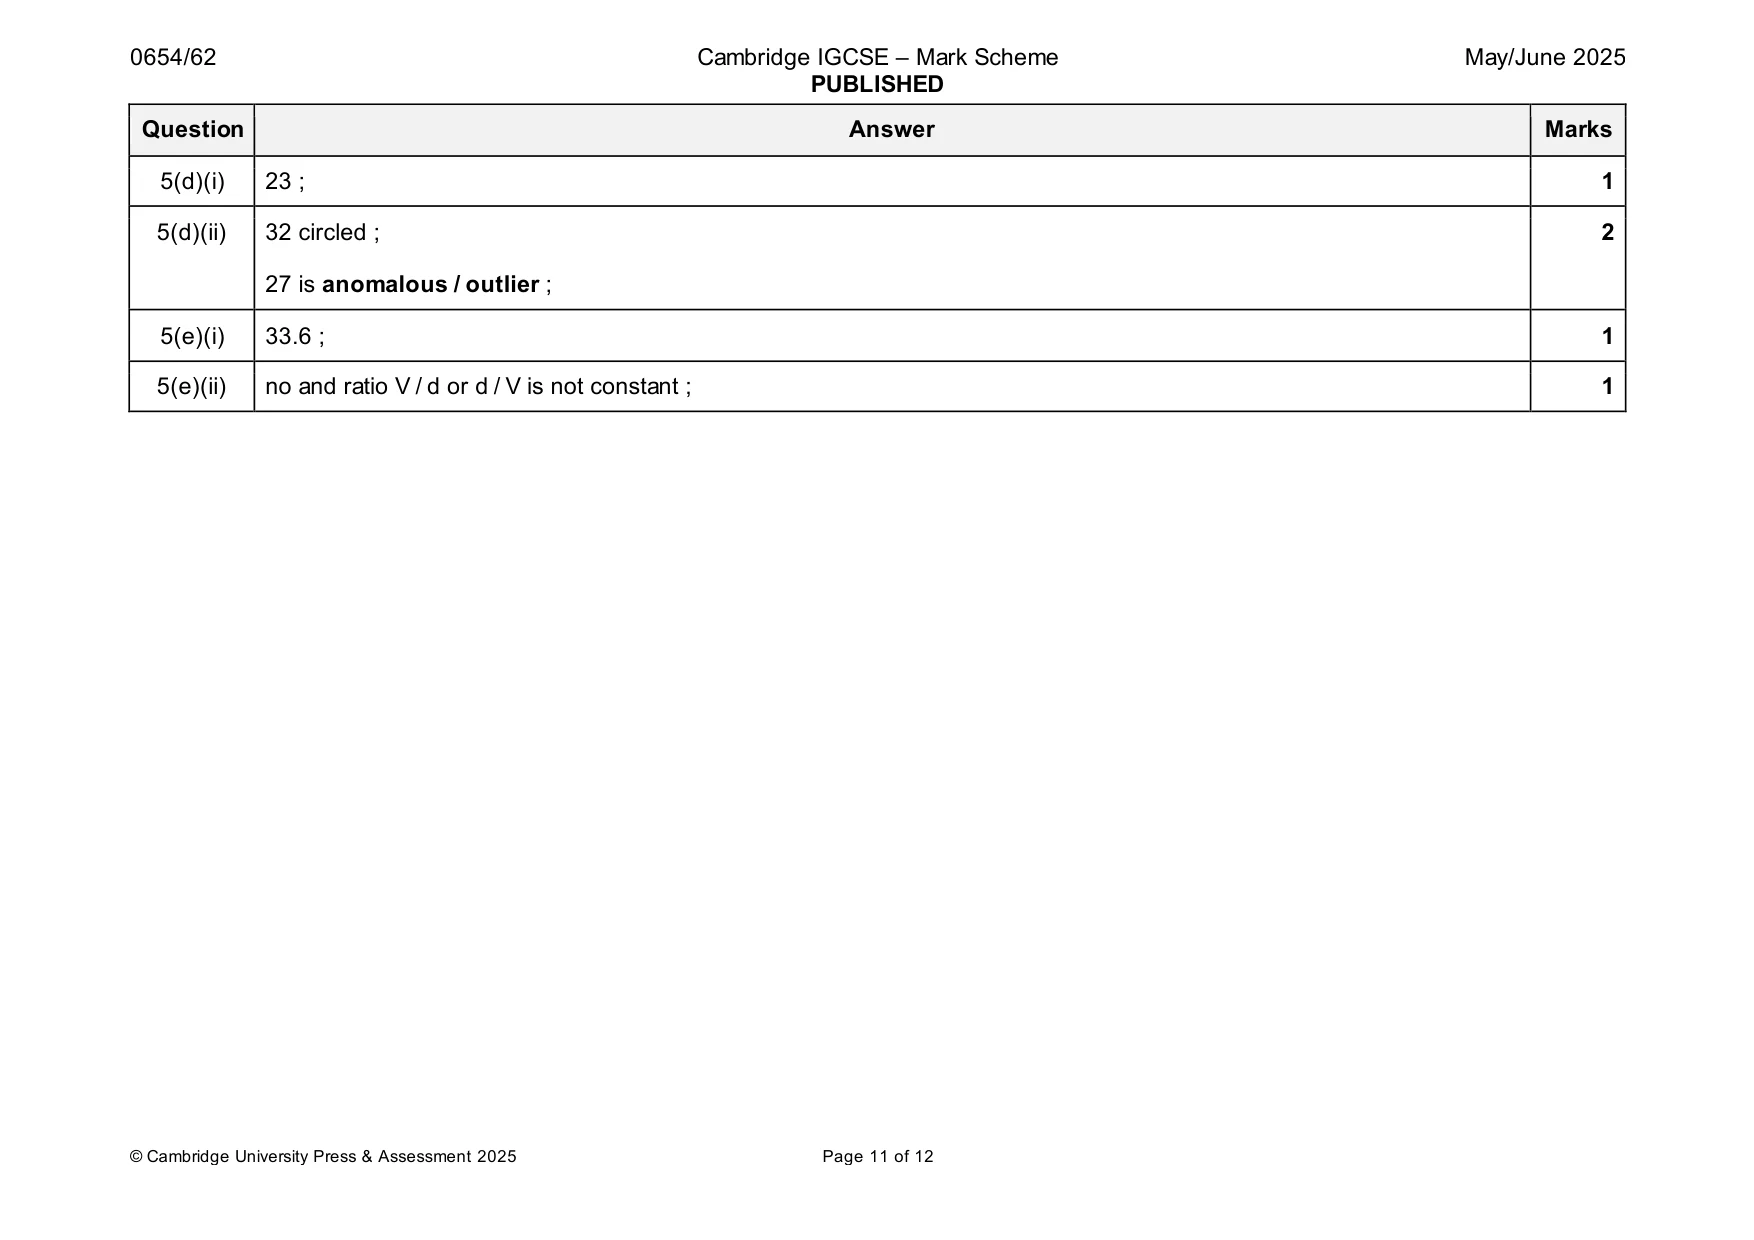
Mark scheme: 5(a)(i) 17.6 ; 1 5(a)(ii) 9.2 (cm) and 12.8 (cm) / 92 (mm) and 128 (mm) ; 2 36 recorded in table ; 5(b) as height increases diameter (of crater) increases ; 1 5(c)(i) protractor / set square ; 1 5(c)(ii) source of error identified ; 2 suggestion is appropriate ; e.g. (difficult to measure) crater is not circular / irregular / difficult to tell edge ; measure several ‘diameters’ on the (same) crater and average ; OR crater crumbles / sand moves when ball removed / diameter changes as removes ball / hands may make crater larger ; use damp sand / use compasses / divider to determine diameter / use a magnet (to remove ball) / measure with ball in place ; OR hand wobbles when dropping ; use steel ball bearing and electromagnet / hang from a string and cut string ; OR difficult to measure diameter of crater as ruler cannot be laid on sand ; use compasses / divider / smaller rule ; OR some of sand spills from the tray ; refill / weigh the sand ; 5(c)(iii) glass will break ; 1 5(d)(i) 23 ; 1 5(d)(ii) 32 circled ; 2 27 is anomalous / outlier ; 5(e)(i) 33.6 ; 1 5(e)(ii) no and ratio V / d or d / V is not constant ; 1
More questions on Physical quantities and measurement techniques
Q6 · The rate of cooling of hot water in a beaker depends upon the number of layers of…
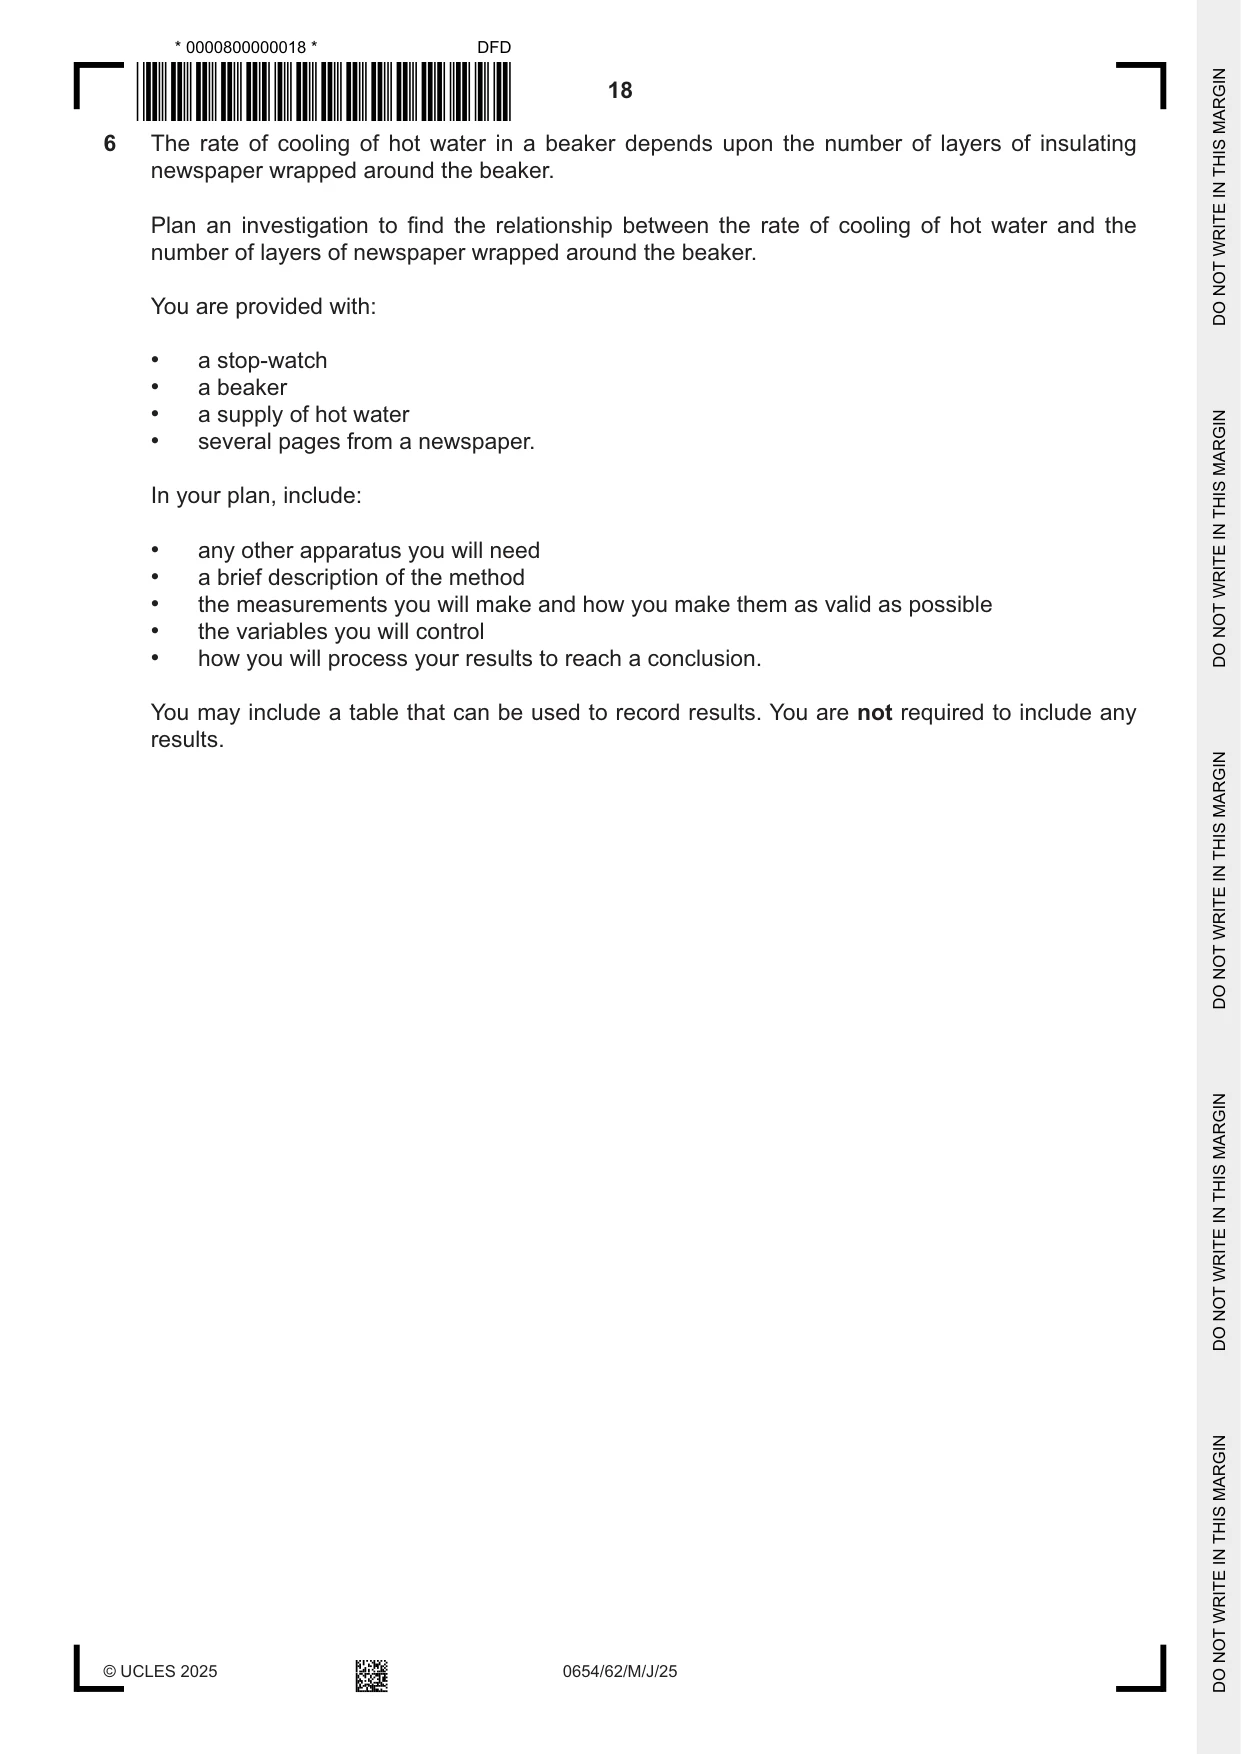
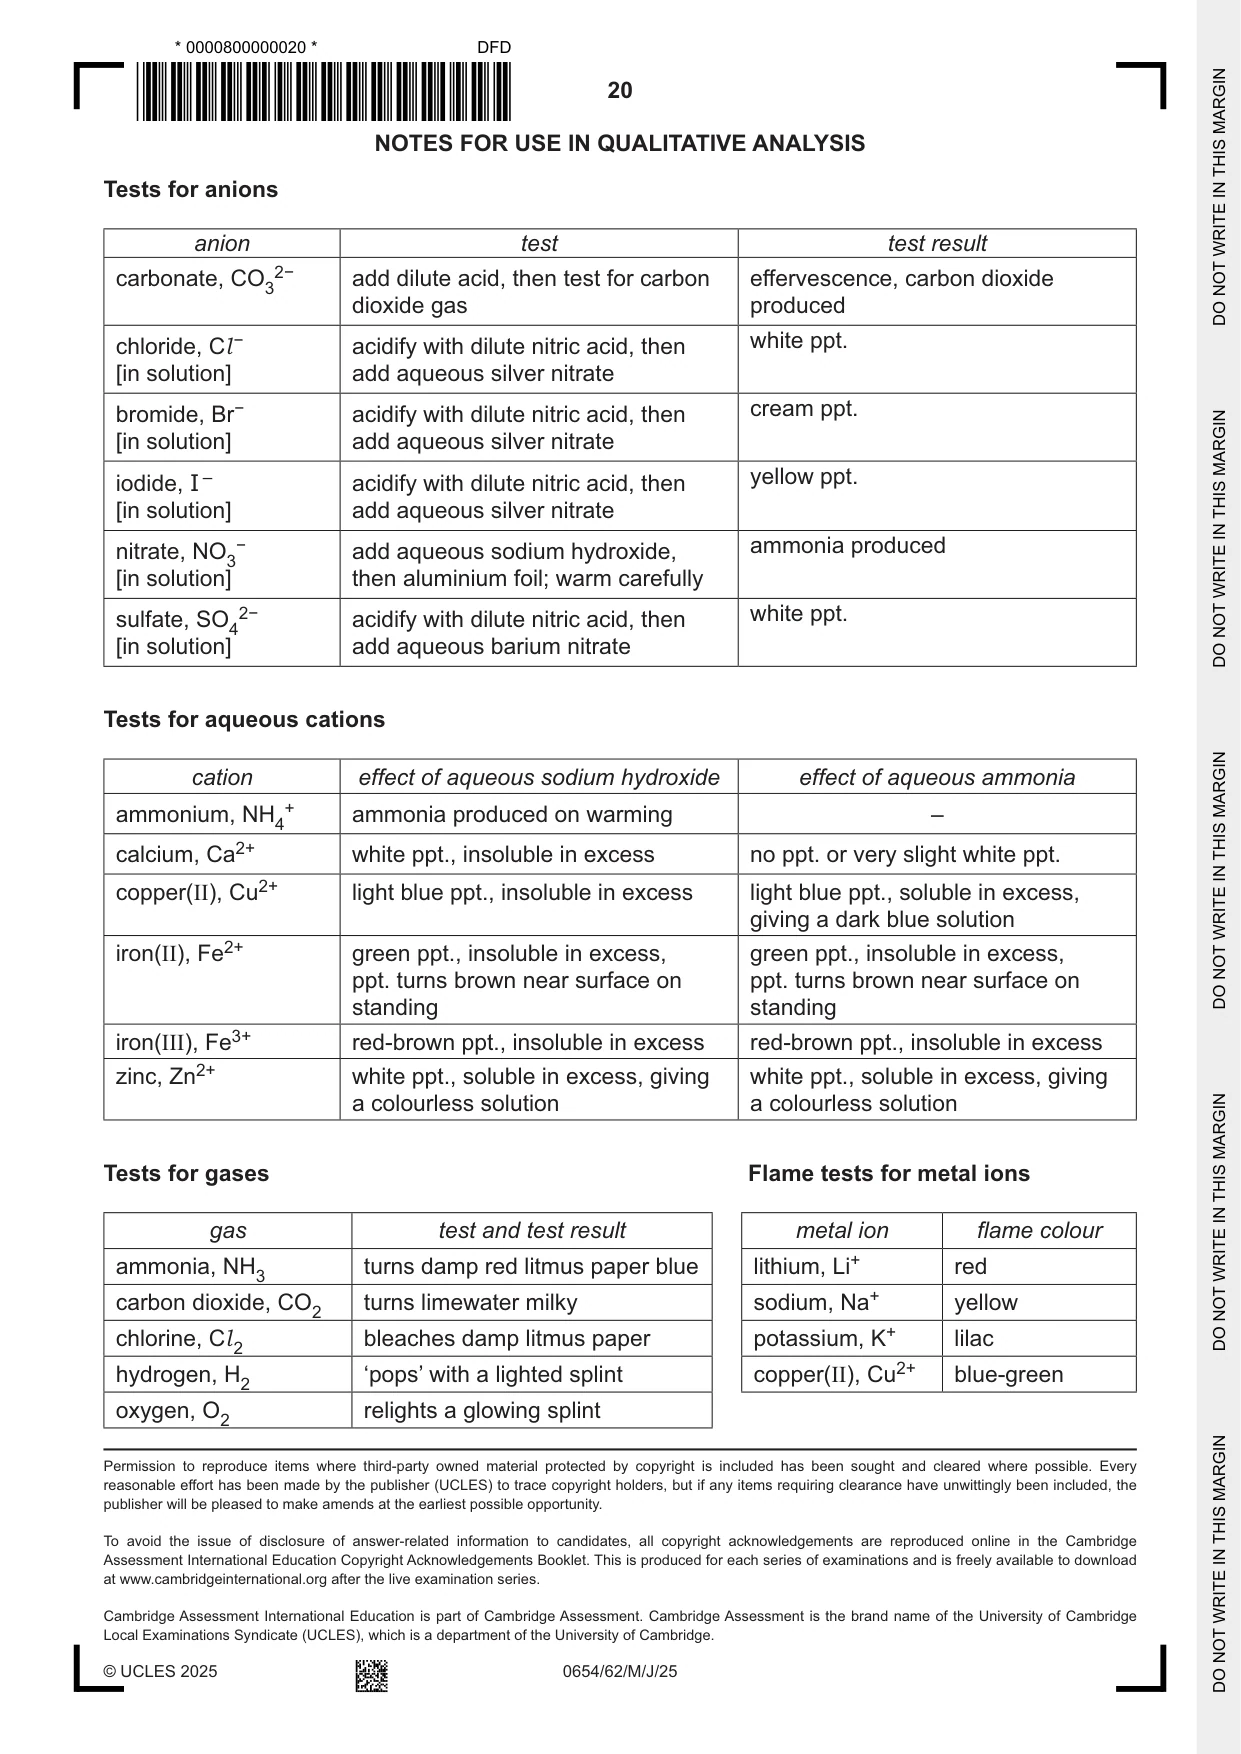
6 The rate of cooling of hot water in a beaker depends upon the number of layers of insulating newspaper wrapped around the beaker. Plan an investigation to find the relationship between the rate of cooling of hot water and the number of layers of newspaper wrapped around the beaker. You are provided with: • a stop-watch • a beaker • a supply of hot water • several pages from a newspaper. In your plan, include: • any other apparatus you will need • a brief description of the method • the measurements you will make and how you make them as valid as possible • the variables you will control • how you will process your results to reach a conclusion. You may include a table that can be used to record results. You are not required to include any results. .......................................................................................................................................................... .......................................................................................................................................................... .......................................................................................................................................................... .......................................................................................................................................................... .......................................................................................................................................................... .......................................................................................................................................................... .......................................................................................................................................................... .......................................................................................................................................................... .......................................................................................................................................................... .......................................................................................................................................................... .......................................................................................................................................................... .......................................................................................................................................................... .......................................................................................................................................................... .......................................................................................................................................................... .......................................................................................................................................................... .......................................................................................................................................................... .......................................................................................................................................................... .......................................................................................................................................................... .......................................................................................................................................................... .......................................................................................................................................................... .......................................................................................................................................................... .......................................................................................................................................................... .......................................................................................................................................................... .......................................................................................................................................................... .......................................................................................................................................................... .......................................................................................................................................................... .......................................................................................................................................................... .................................................................................................................................................... [7] NOTES FOR USE IN QUALITATIVE ANALYSIS Tests for anions anion test test result carbonate, CO32− add dilute acid, then test for carbon effervescence, carbon dioxide dioxide gas produced chloride, Cl − acidify with dilute nitric acid, then white ppt. [in solution] add aqueous silver nitrate bromide, Br− acidify with dilute nitric acid, then cream ppt. [in solution] add aqueous silver nitrate yellow ppt. iodide, I – acidify with dilute nitric acid, then [in solution] add aqueous silver nitrate nitrate, NO3− add aqueous sodium hydroxide, ammonia produced [in solution] then aluminium foil; warm carefully sulfate, SO42− acidify with dilute nitric acid, then white ppt. [in solution] add aqueous barium nitrate Tests for aqueous cations cation effect of aqueous sodium hydroxide effect of aqueous ammonia ammonium, NH4+ ammonia produced on warming – calcium, Ca2+ white ppt., insoluble in excess no ppt. or very slight white ppt. copper(II), Cu2+ light blue ppt., insoluble in excess light blue ppt., soluble in excess, giving a dark blue solution iron(II), Fe2+ green ppt., insoluble in excess, green ppt., insoluble in excess, ppt. turns brown near surface on ppt. turns brown near surface on standing standing iron(III), Fe3+ red-brown ppt., insoluble in excess red-brown ppt., insoluble in excess zinc, Zn2+ white ppt., soluble in excess, giving white ppt., soluble in excess, giving a colourless solution a colourless solution Tests for gases Flame tests for metal ions gas test and test result metal ion flame colour ammonia, NH3 turns damp red litmus paper blue lithium, Li+ red carbon dioxide, CO2 turns limewater milky sodium, Na+ yellow chlorine, Cl 2 bleaches damp litmus paper potassium, K+ lilac hydrogen, H2 ‘pops’ with a lighted splint copper(II), Cu2+ blue-green oxygen, O2 relights a glowing splint
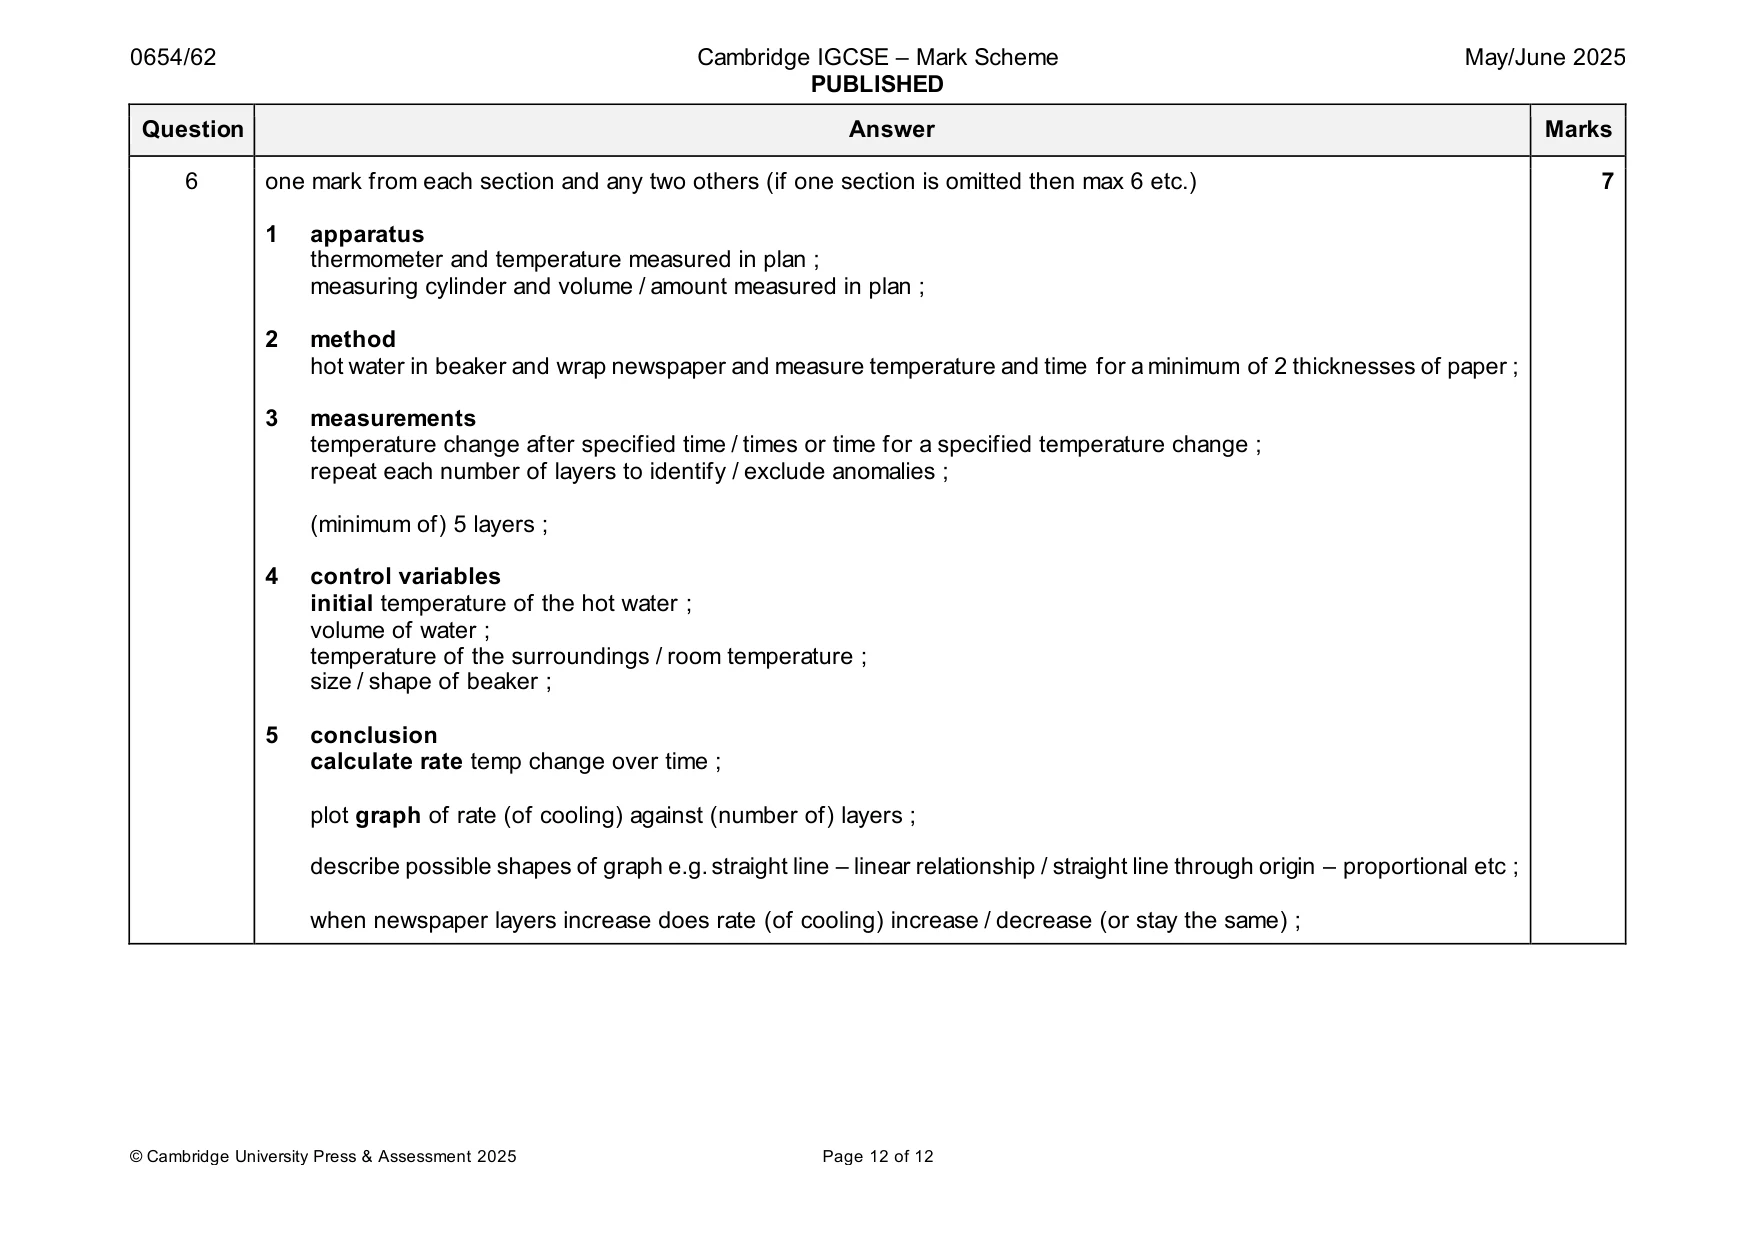
Mark scheme: 6 one mark from each section and any two others (if one section is omitted then max 6 etc.) 7 1 apparatus thermometer and temperature measured in plan ; measuring cylinder and volume / amount measured in plan ; 2 method hot water in beaker and wrap newspaper and measure temperature and time for a minimum of 2 thicknesses of paper ; 3 measurements temperature change after specified time / times or time for a specified temperature change ; repeat each number of layers to identify / exclude anomalies ; (minimum of) 5 layers ; 4 control variables initial temperature of the hot water ; volume of water ; temperature of the surroundings / room temperature ; size / shape of beaker ; 5 conclusion calculate rate temp change over time ; plot graph of rate (of cooling) against (number of) layers ; describe possible shapes of graph e.g. straight line – linear relationship / straight line through origin – proportional etc ; when newspaper layers increase does rate (of cooling) increase / decrease (or stay the same) ;
What was in this paper
The subtopics covered by these 6 questions, and how many questions each got. Open one in a new tab to see every Cambridge question on it.
What you needed in this session
Cambridge’s own grade thresholds for 2025 May/June, Paper 6 · Variant 2. A higher threshold means an easier paper — the bar moves with how the cohort did.