Cambridge IGCSE Sciences - Co-ordinated (Double) 0654 — 2025 Oct/Nov Paper 6 · Variant 2
0654/62/O/N/25 · 6 questions · 60 marks · 90 min
The question paper and its mark scheme, free to read here and free to download. This is Cambridge’s own paper, exactly as it was sat.
Question paper24 pages
Mark scheme11 pages
Answers below. Sit the paper first if you are practising.
Questions as text
Q1 · A student investigates the movement of water into and out of plant cells by osmosis
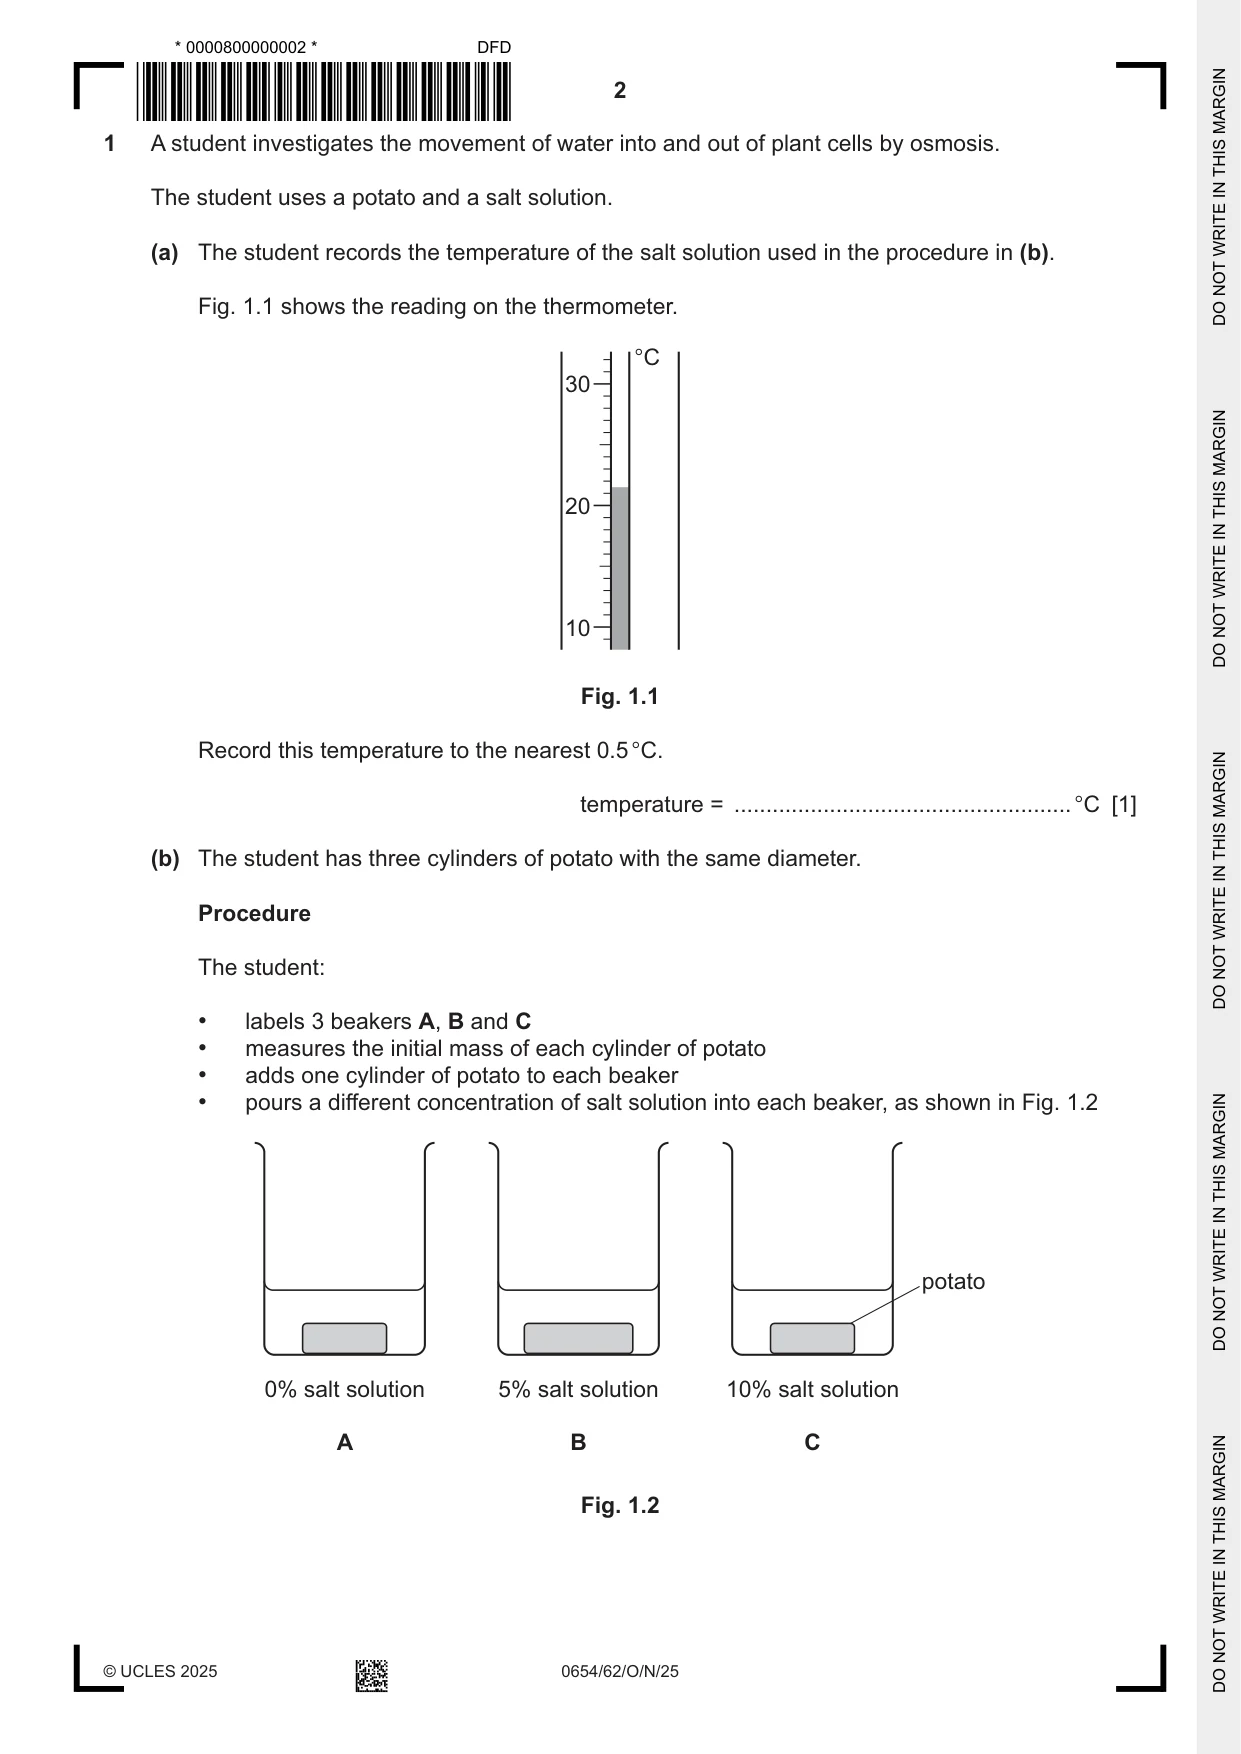
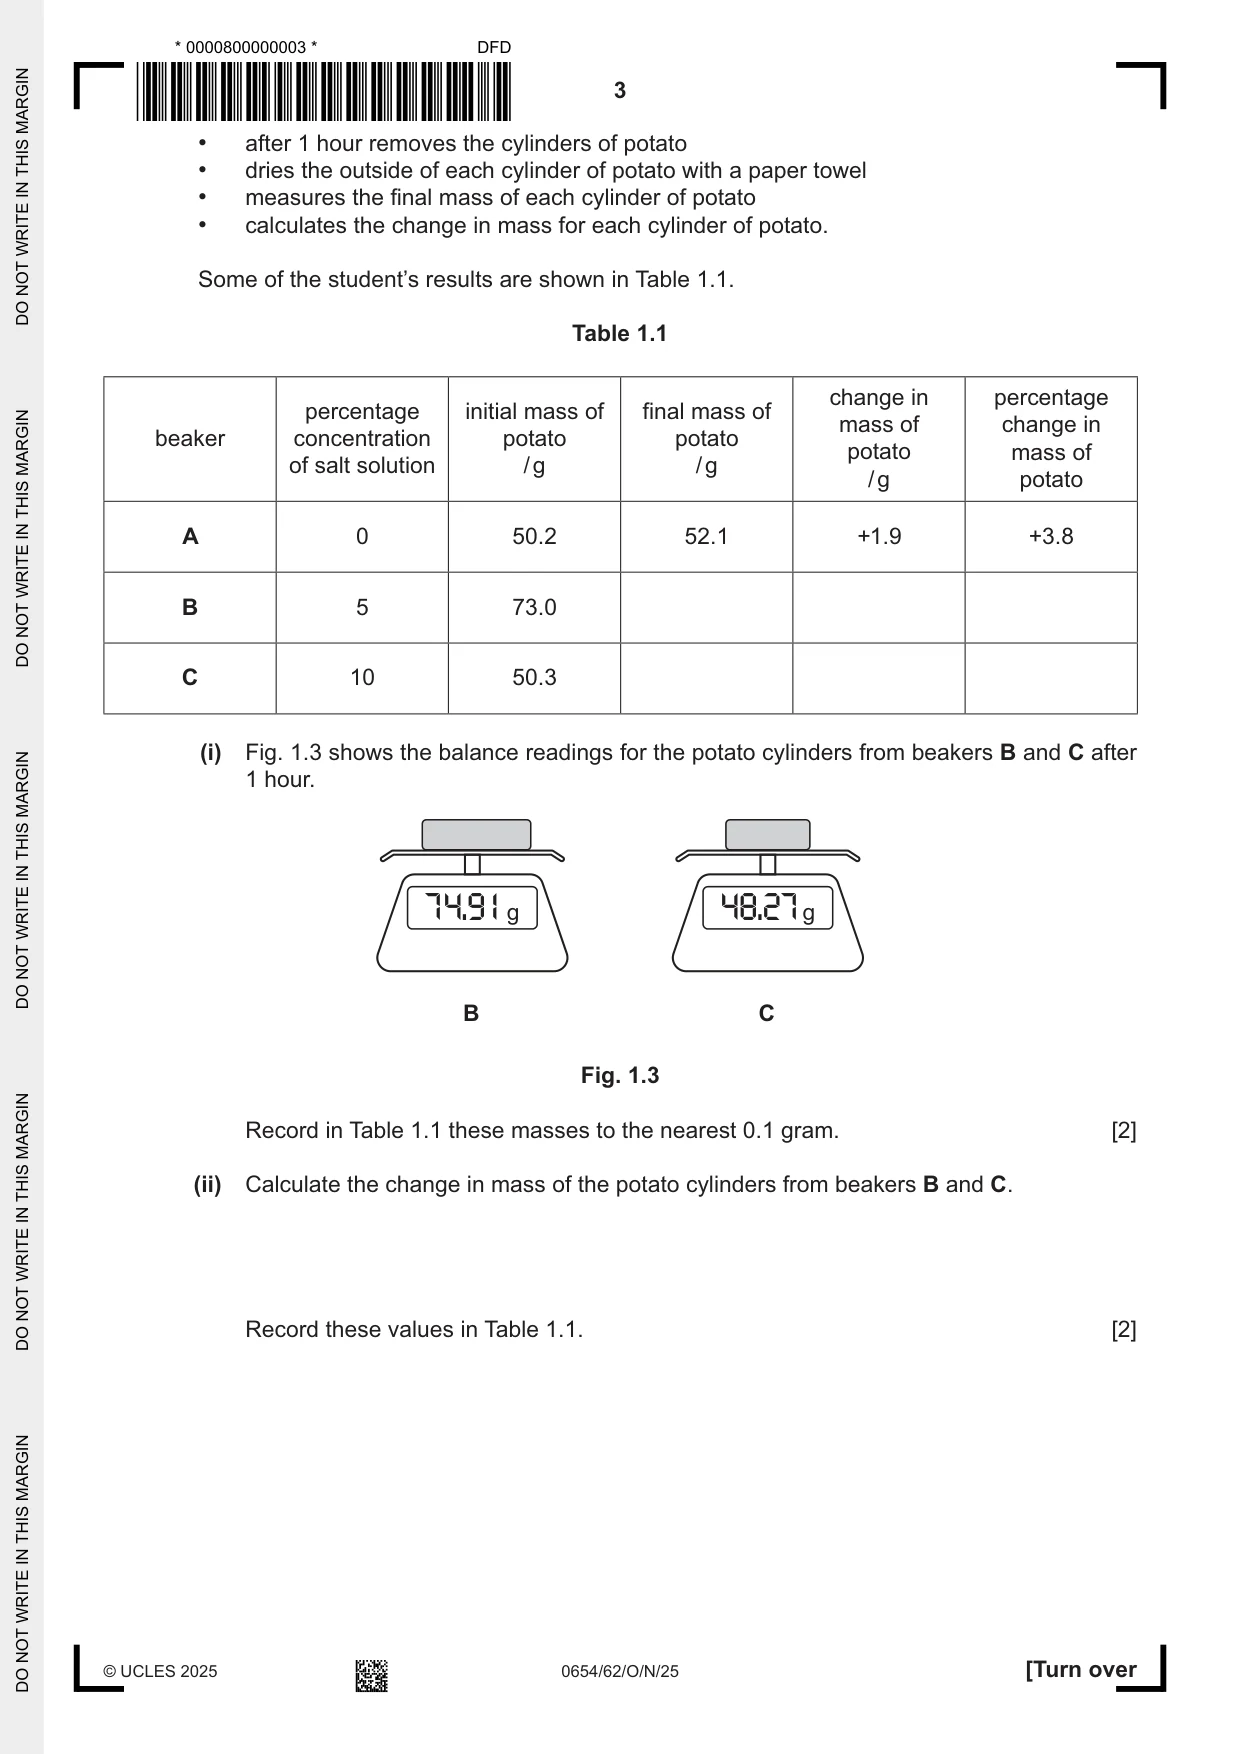
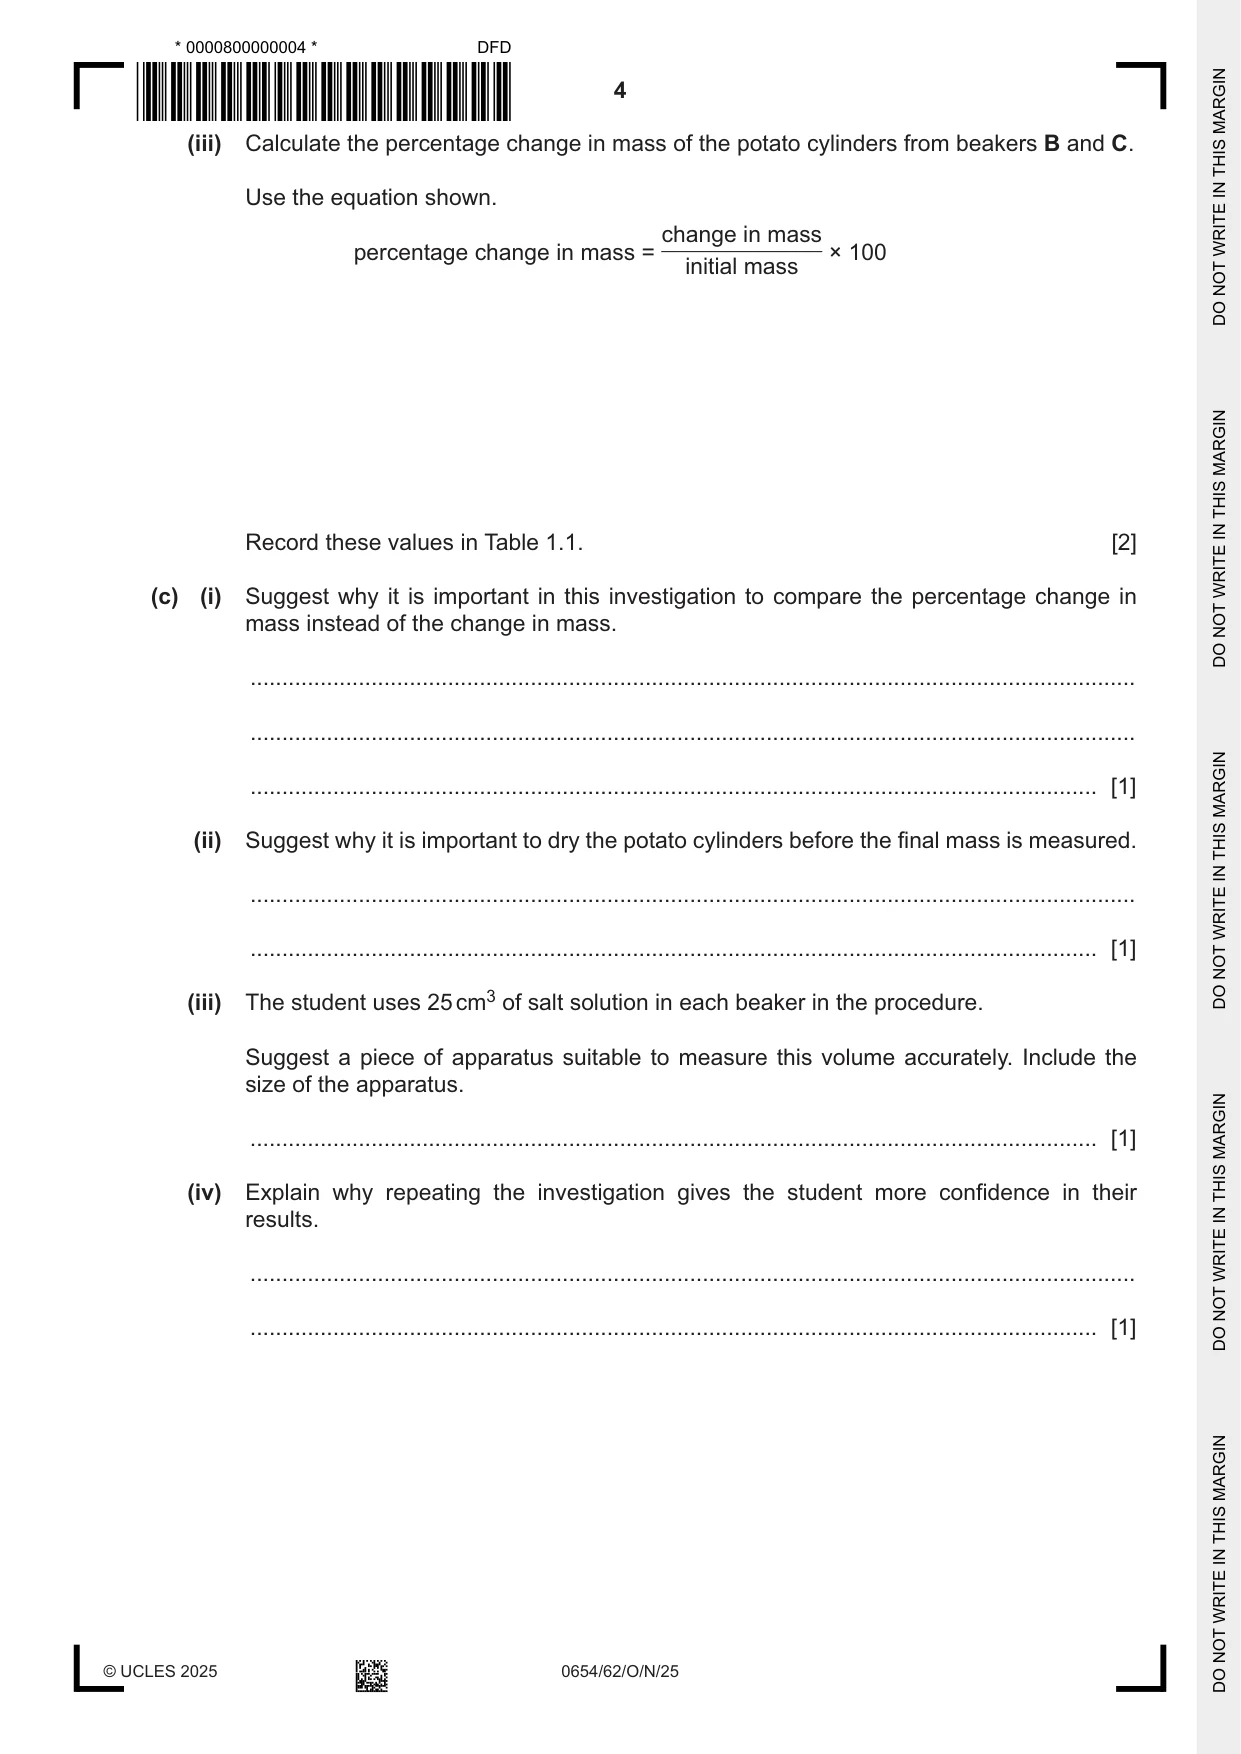
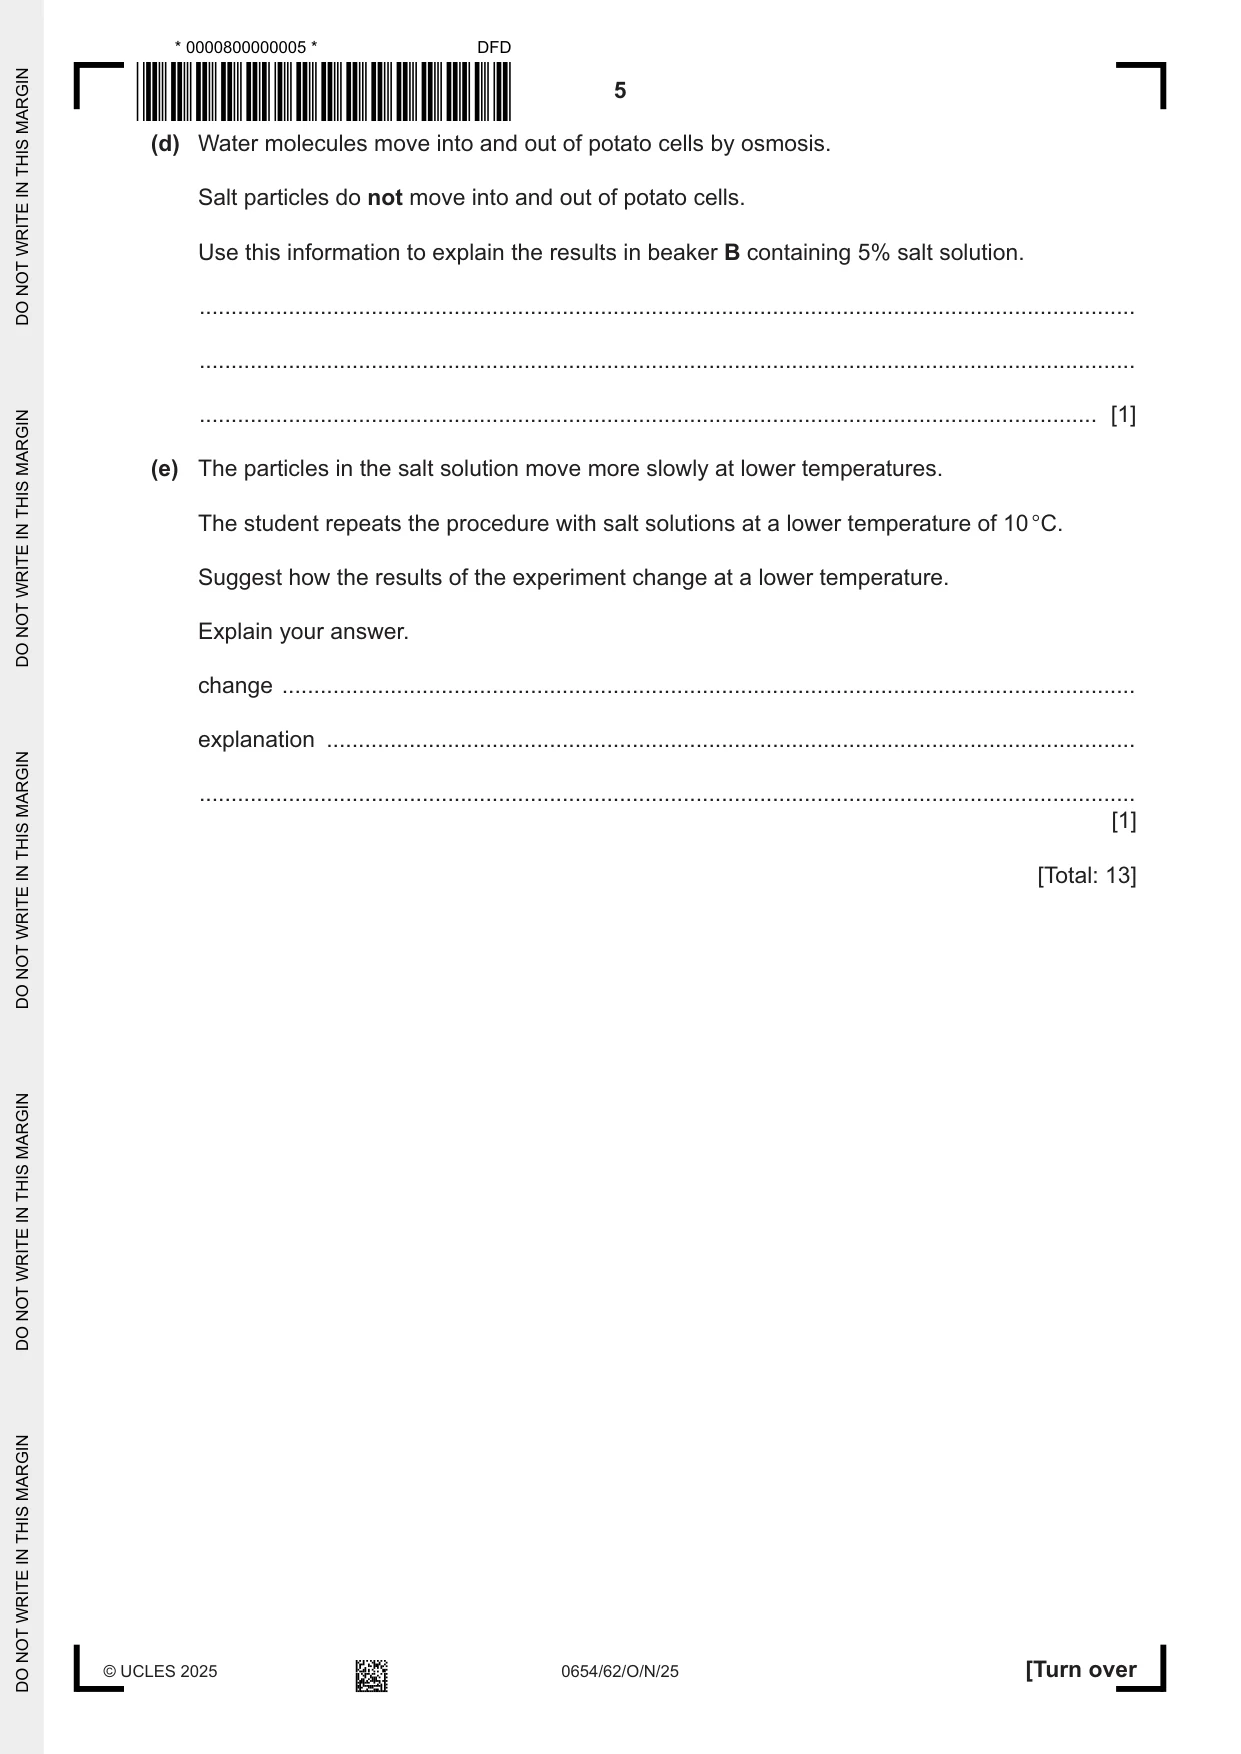
1 A student investigates the movement of water into and out of plant cells by osmosis. The student uses a potato and a salt solution. (a) The student records the temperature of the salt solution used in the procedure in (b). Fig. 1.1 shows the reading on the thermometer. °C 30 20 10 Fig. 1.1 Record this temperature to the nearest 0.5 °C. temperature = ..................................................... °C [1] (b) The student has three cylinders of potato with the same diameter. Procedure The student: • labels 3 beakers A, B and C • measures the initial mass of each cylinder of potato • adds one cylinder of potato to each beaker • pours a different concentration of salt solution into each beaker, as shown in Fig. 1.2 potato 0% salt solution 5% salt solution 10% salt solution A B C Fig. 1.2 • after 1 hour removes the cylinders of potato • dries the outside of each cylinder of potato with a paper towel • measures the final mass of each cylinder of potato • calculates the change in mass for each cylinder of potato. Some of the student’s results are shown in Table 1.1. Table 1.1 change in percentage percentage initial mass of final mass of mass of change in beaker concentration potato potato potato mass of of salt solution / g / g / g potato A 0 50.2 52.1 +1.9 +3.8 B 5 73.0 C 10 50.3 (i) Fig. 1.3 shows the balance readings for the potato cylinders from beakers B and C after 1 hour. 74.91 g 48.27 g B C Fig. 1.3 Record in Table 1.1 these masses to the nearest 0.1 gram. [2] (ii) Calculate the change in mass of the potato cylinders from beakers B and C. Record these values in Table 1.1. [2] (iii) Calculate the percentage change in mass of the potato cylinders from beakers B and C. Use the equation shown. change in mass percentage change in mass = × 100 initial mass Record these values in Table 1.1. [2] (c) (i) Suggest why it is important in this investigation to compare the percentage change in mass instead of the change in mass. ........................................................................................................................................... ........................................................................................................................................... ..................................................................................................................................... [1] (ii) Suggest why it is important to dry the potato cylinders before the final mass is measured. ........................................................................................................................................... ..................................................................................................................................... [1] (iii) The student uses 25 cm3 of salt solution in each beaker in the procedure. Suggest a piece of apparatus suitable to measure this volume accurately. Include the size of the apparatus. ..................................................................................................................................... [1] (iv) Explain why repeating the investigation gives the student more confidence in their results. ........................................................................................................................................... ..................................................................................................................................... [1] (d) Water molecules move into and out of potato cells by osmosis. Salt particles do not move into and out of potato cells. Use this information to explain the results in beaker B containing 5% salt solution. ................................................................................................................................................... ................................................................................................................................................... ............................................................................................................................................. [1] (e) The particles in the salt solution move more slowly at lower temperatures. The student repeats the procedure with salt solutions at a lower temperature of 10 °C. Suggest how the results of the experiment change at a lower temperature. Explain your answer. change ...................................................................................................................................... explanation ............................................................................................................................... ................................................................................................................................................... [1] [Total: 13]
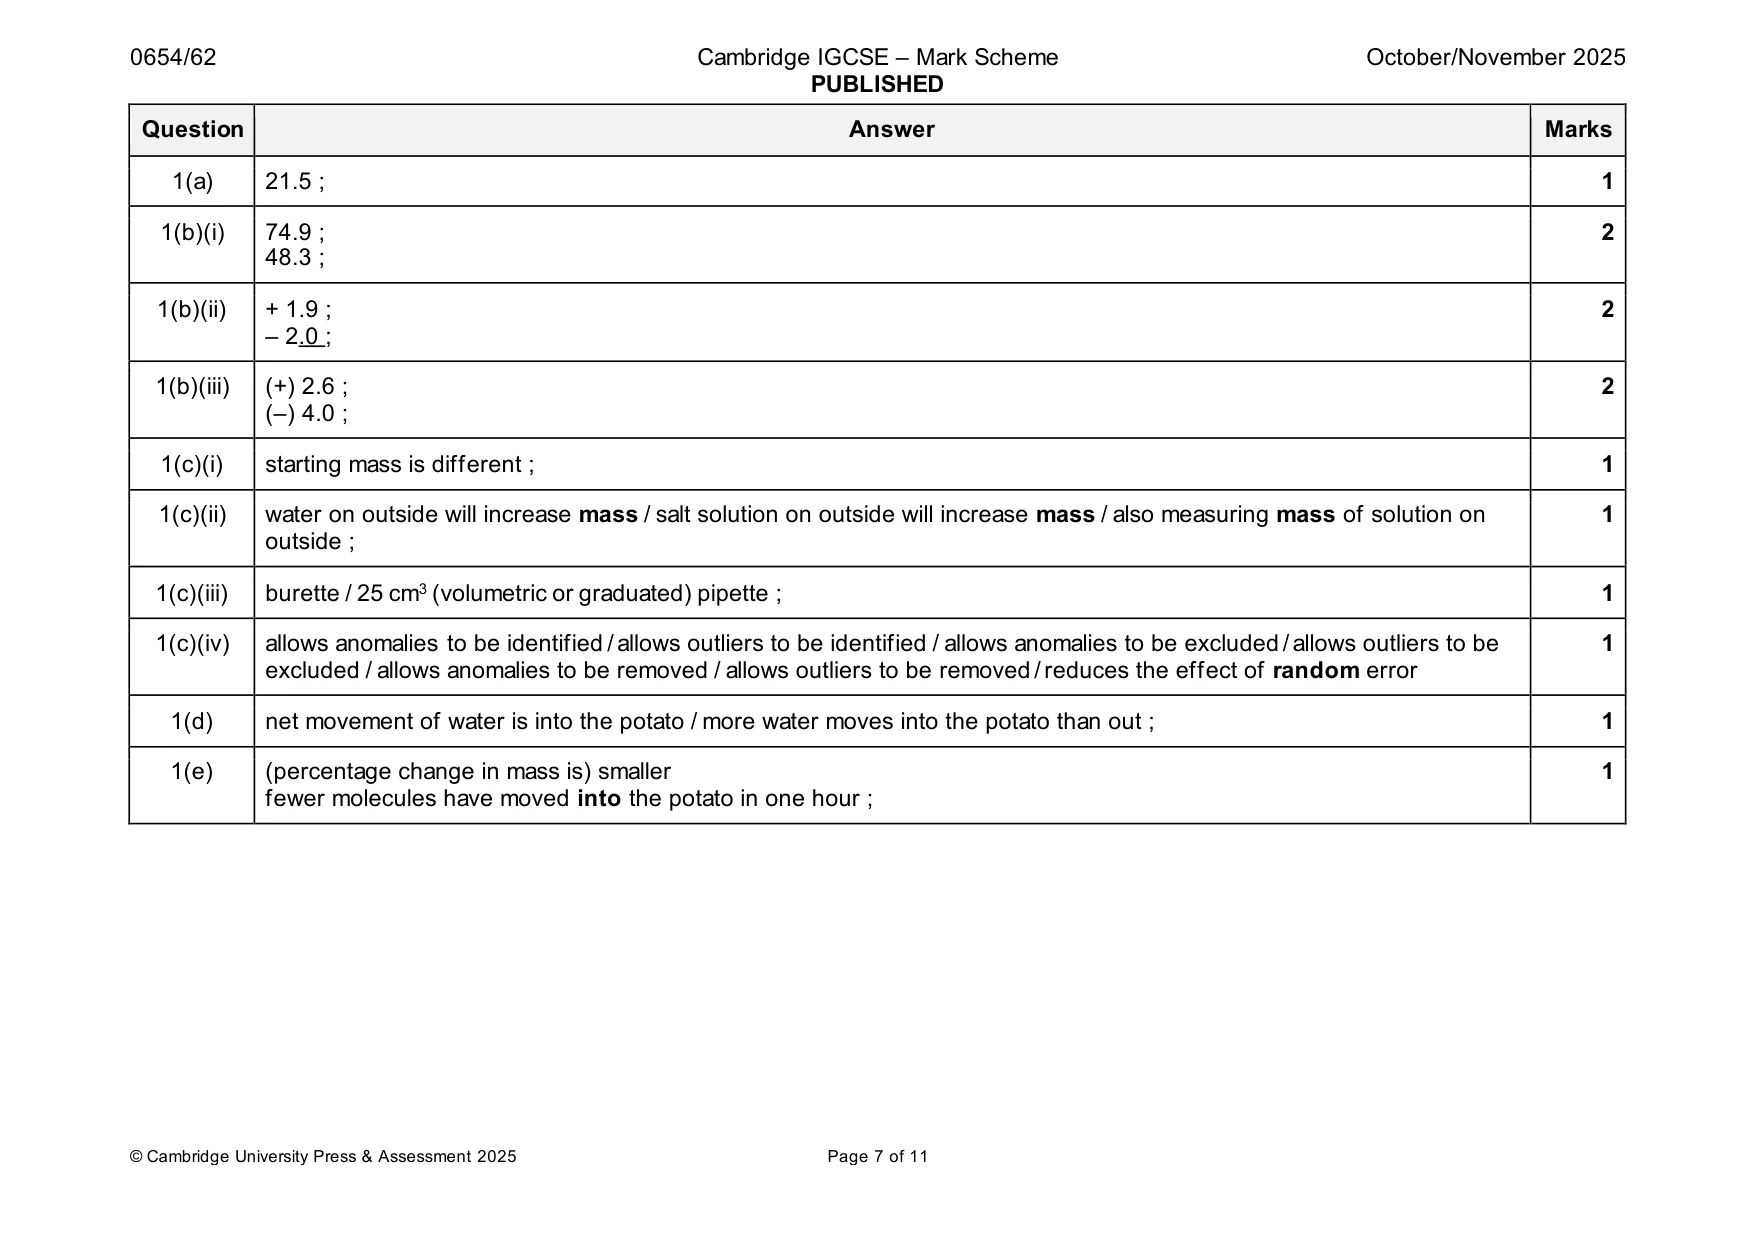
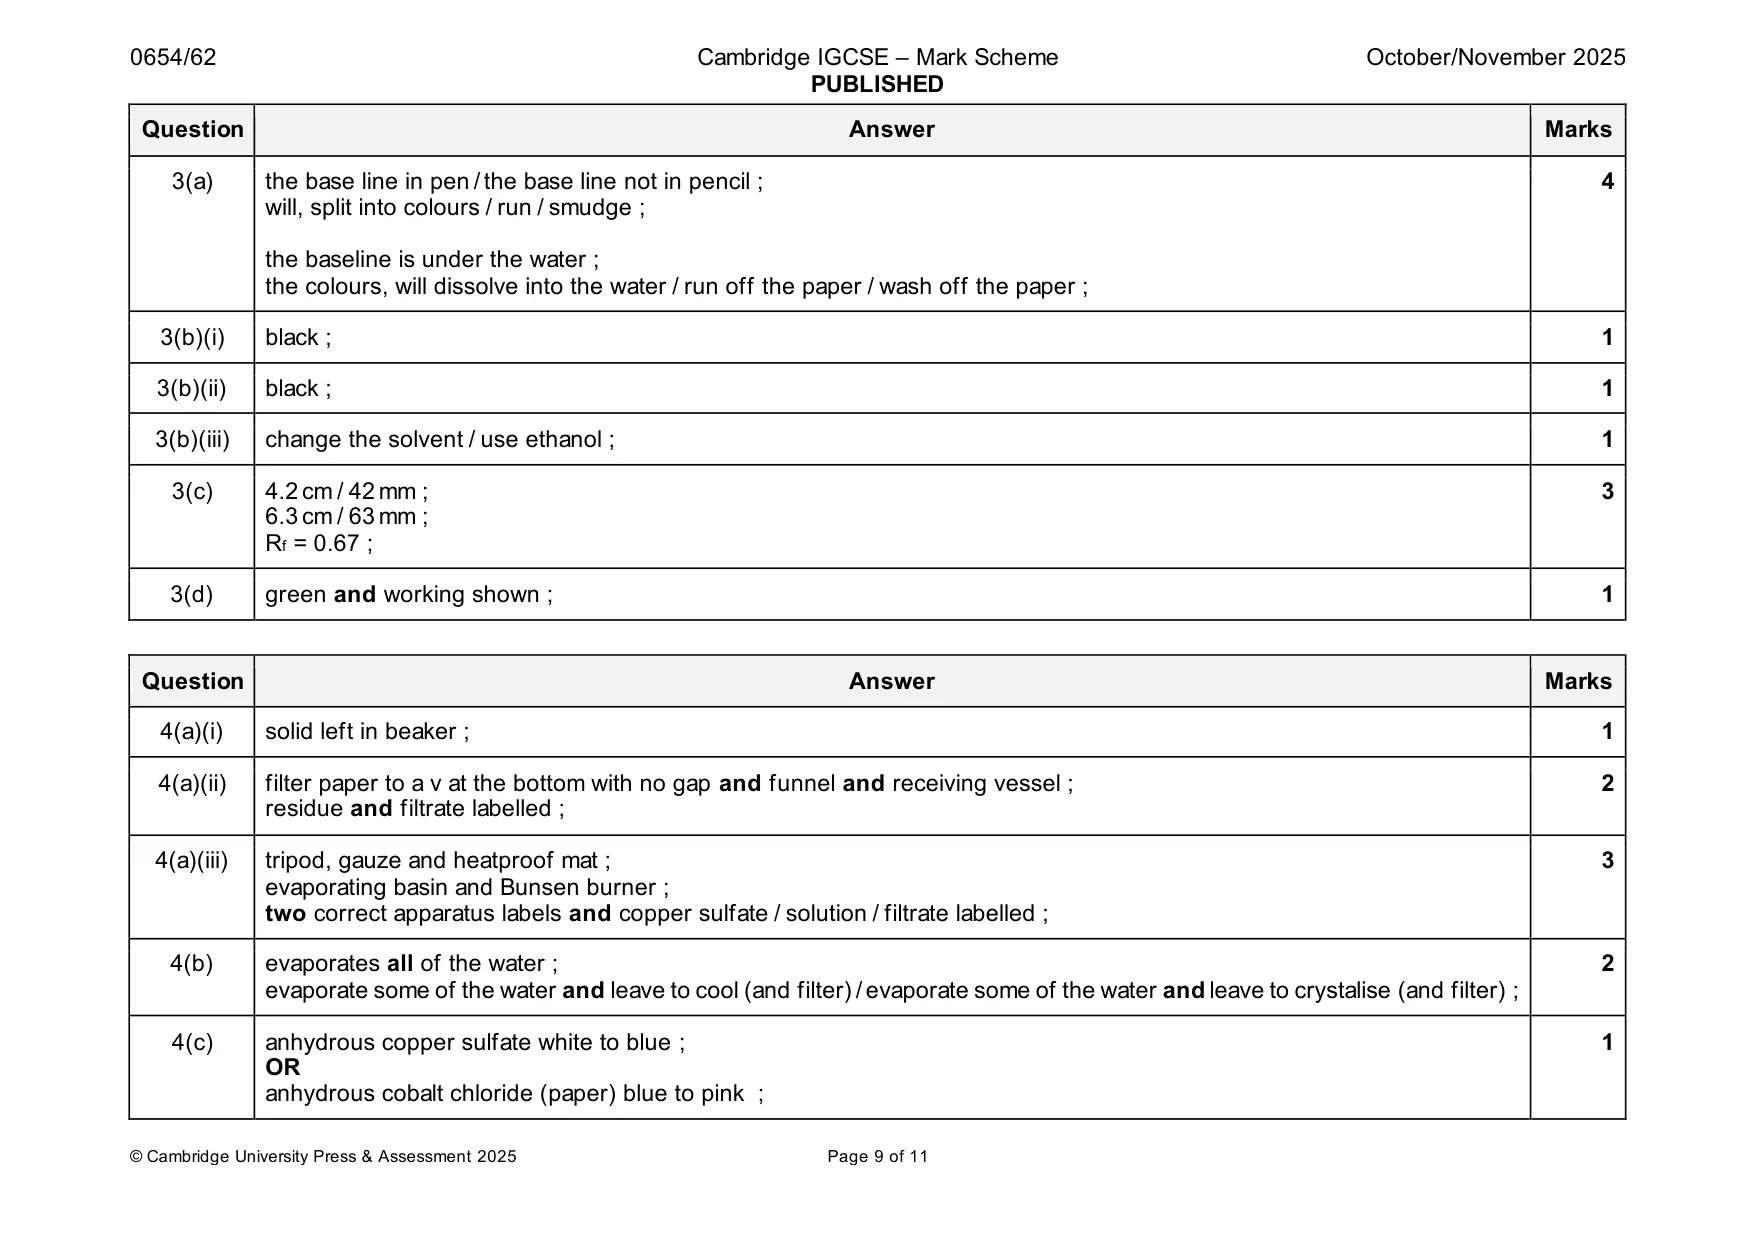
Mark scheme: Question Answer Marks 1(a) 21.5 ; 1 1(b)(i) 74.9 ; 2 48.3 ; 1(b)(ii) + 1.9 ; 2 – 2.0 ; 1(b)(iii) (+) 2.6 ; 2 (–) 4.0 ; 1(c)(i) starting mass is different ; 1 1(c)(ii) water on outside will increase mass / salt solution on outside will increase mass / also measuring mass of solution on 1 outside ; 1(c)(iii) burette / 25 cm3 (volumetric or graduated) pipette ; 1 1(c)(iv) allows anomalies to be identified / allows outliers to be identified / allows anomalies to be excluded / allows outliers to be 1 excluded / allows anomalies to be removed / allows outliers to be removed / reduces the effect of random error 1(d) net movement of water is into the potato / more water moves into the potato than out ; 1 1(e) (percentage change in mass is) smaller 1 fewer molecules have moved into the potato in one hour ;
Q2 · Yeast is a unicellular organism that respires
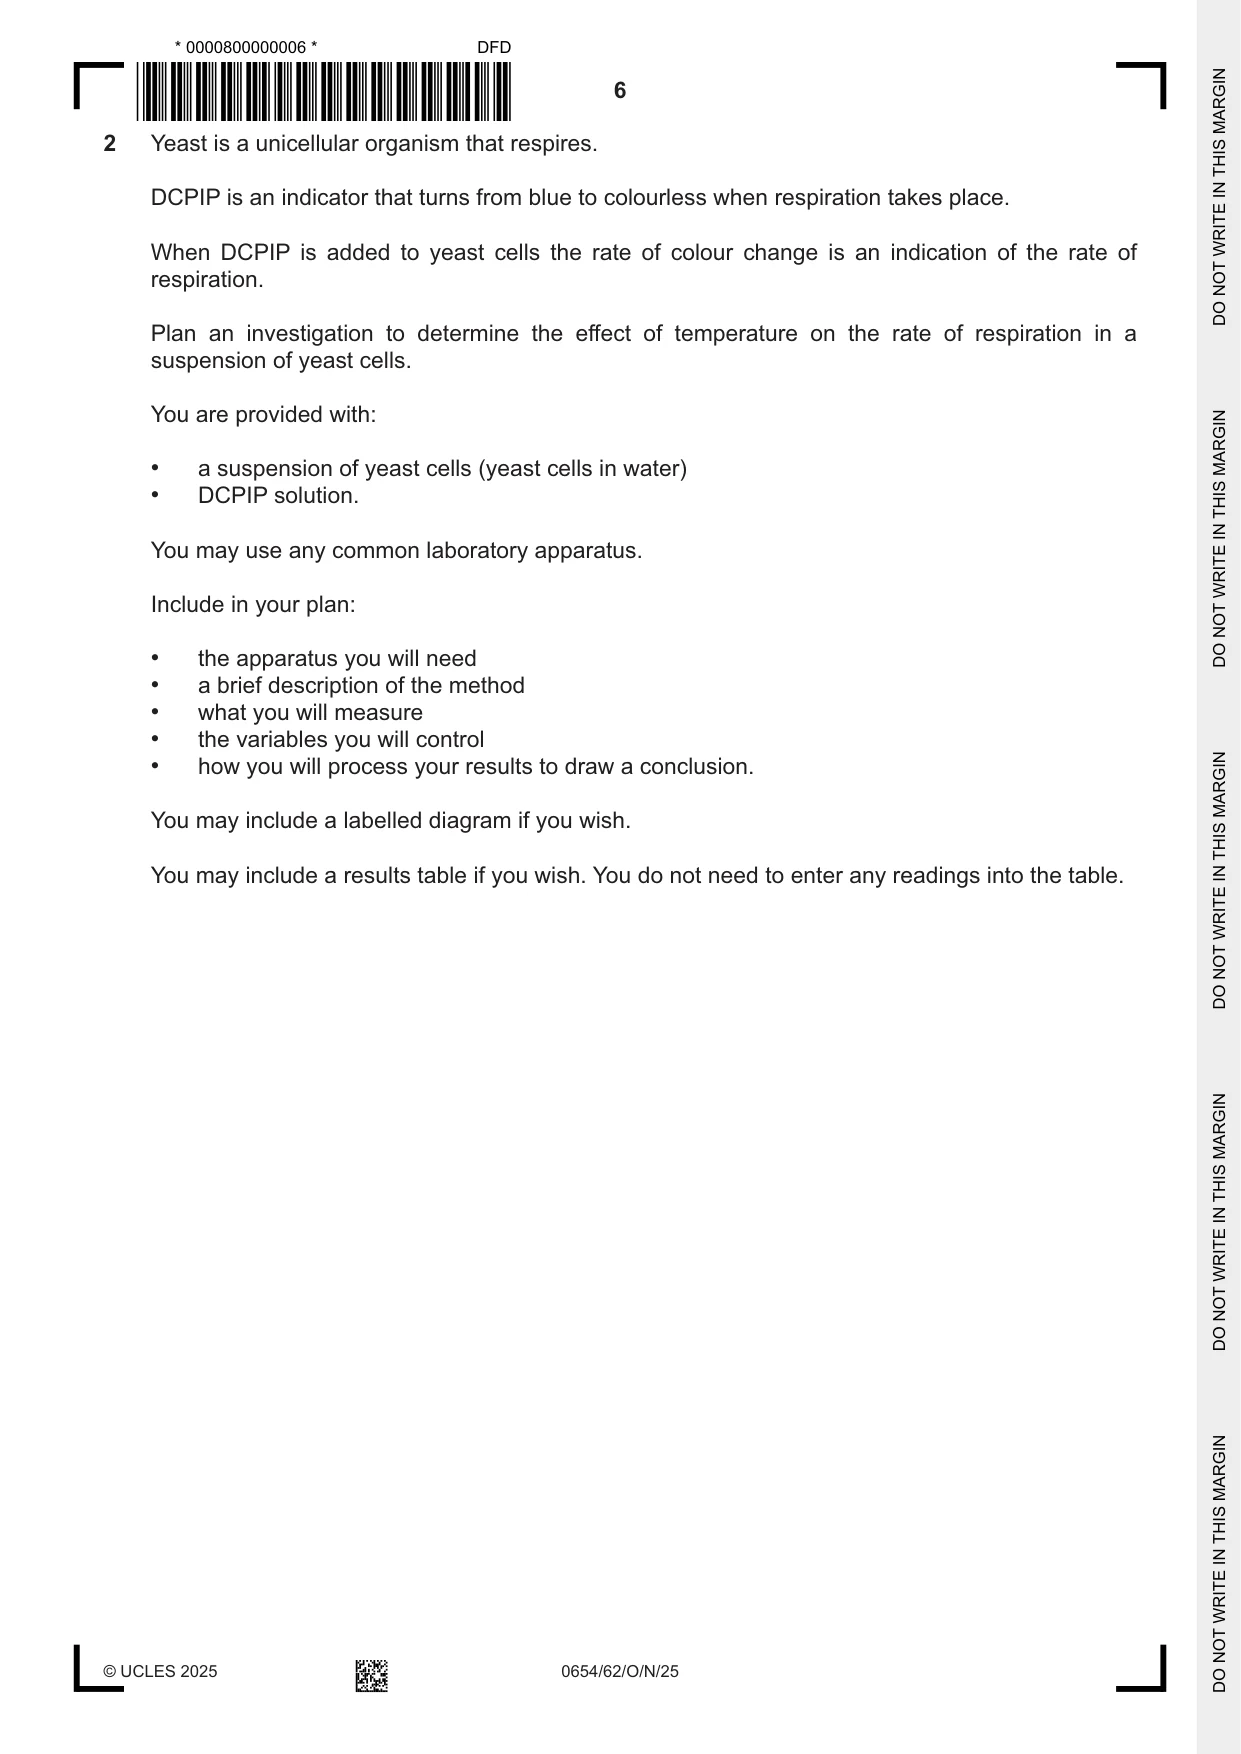
2 Yeast is a unicellular organism that respires. DCPIP is an indicator that turns from blue to colourless when respiration takes place. When DCPIP is added to yeast cells the rate of colour change is an indication of the rate of respiration. Plan an investigation to determine the effect of temperature on the rate of respiration in a suspension of yeast cells. You are provided with: • a suspension of yeast cells (yeast cells in water) • DCPIP solution. You may use any common laboratory apparatus. Include in your plan: • the apparatus you will need • a brief description of the method • what you will measure • the variables you will control • how you will process your results to draw a conclusion. You may include a labelled diagram if you wish. You may include a results table if you wish. You do not need to enter any readings into the table. .......................................................................................................................................................... .......................................................................................................................................................... .......................................................................................................................................................... .......................................................................................................................................................... .......................................................................................................................................................... .......................................................................................................................................................... .......................................................................................................................................................... .......................................................................................................................................................... .......................................................................................................................................................... .......................................................................................................................................................... .......................................................................................................................................................... .......................................................................................................................................................... .......................................................................................................................................................... .......................................................................................................................................................... .......................................................................................................................................................... .......................................................................................................................................................... .......................................................................................................................................................... .......................................................................................................................................................... .......................................................................................................................................................... .......................................................................................................................................................... .................................................................................................................................................... [7] Question 3 starts on page 9.
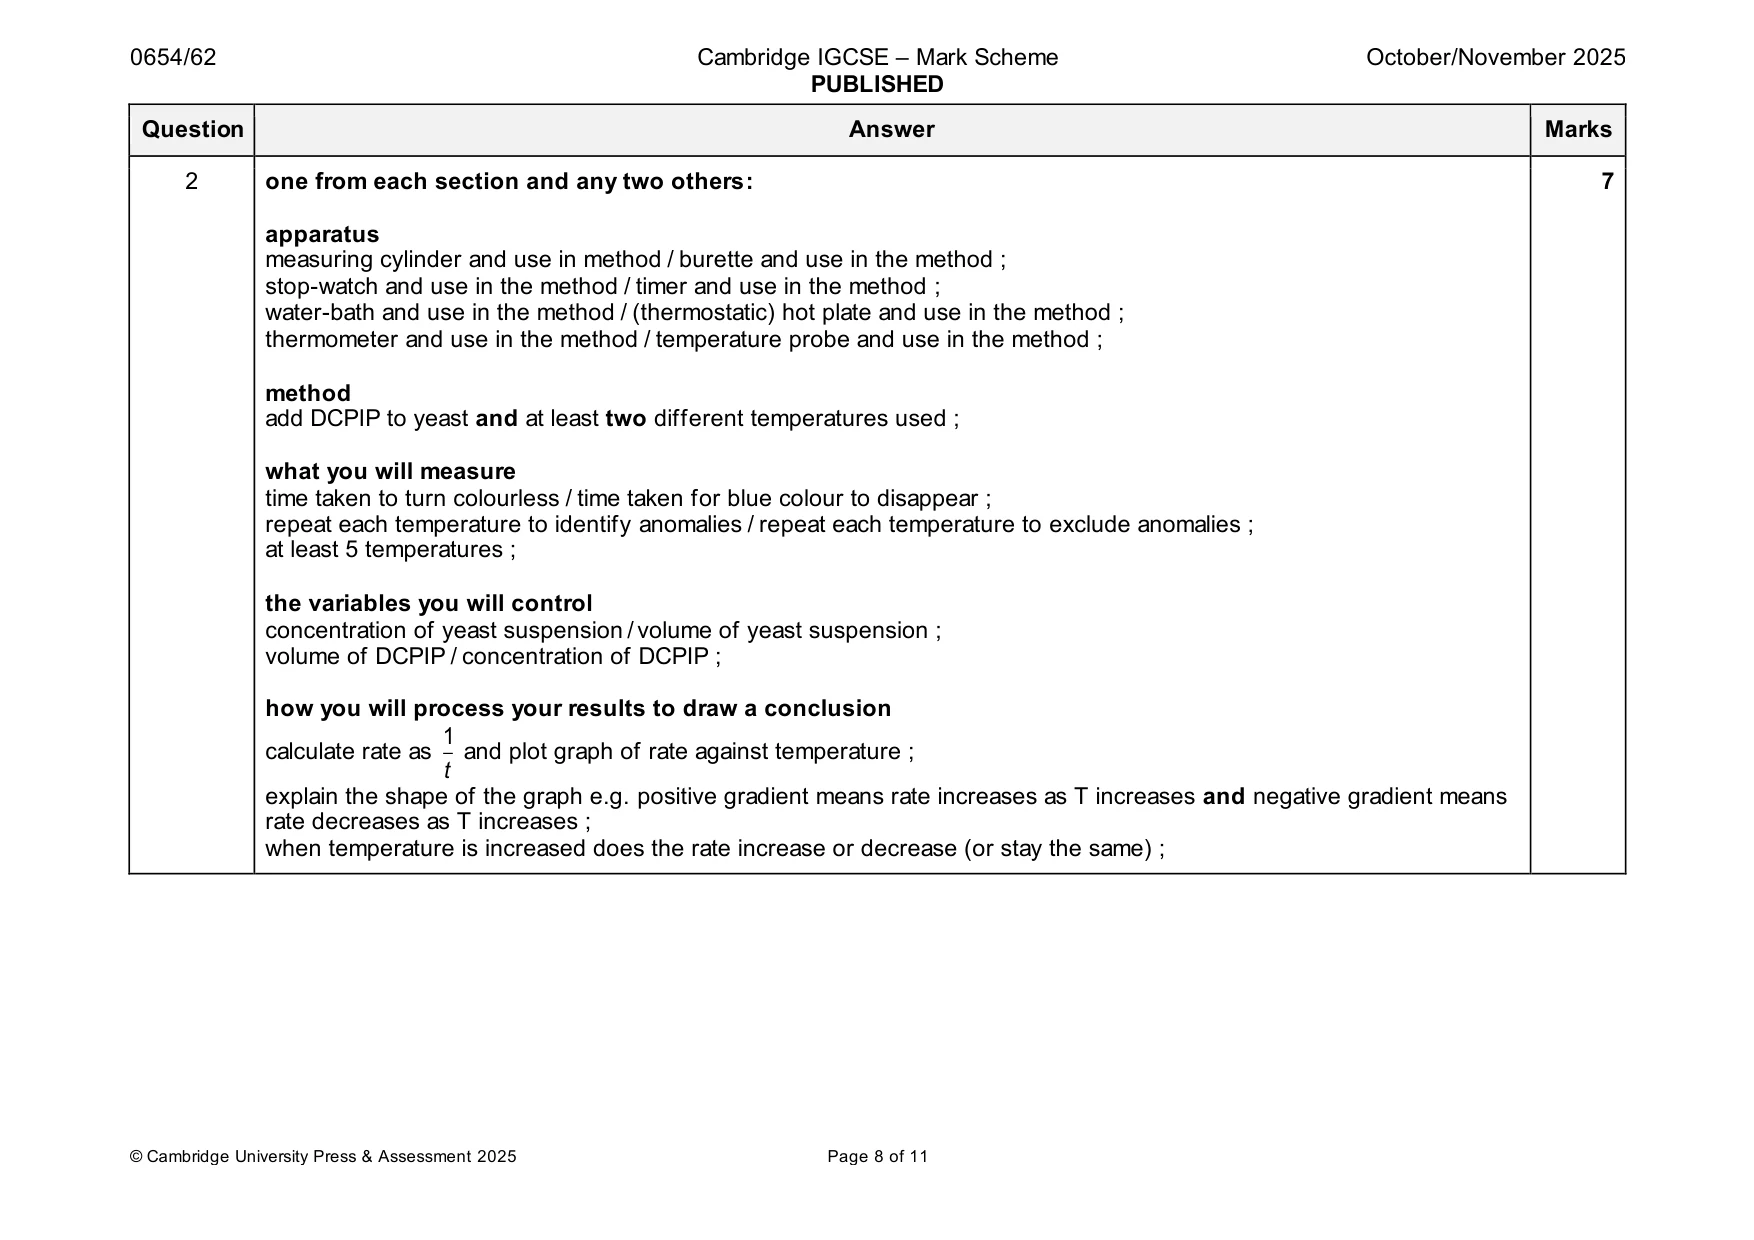
Mark scheme: 2 one from each section and any two others: 7 apparatus measuring cylinder and use in method / burette and use in the method ; stop-watch and use in the method / timer and use in the method ; water-bath and use in the method / (thermostatic) hot plate and use in the method ; thermometer and use in the method / temperature probe and use in the method ; method add DCPIP to yeast and at least two different temperatures used ; what you will measure time taken to turn colourless / time taken for blue colour to disappear ; repeat each temperature to identify anomalies / repeat each temperature to exclude anomalies ; at least 5 temperatures ; the variables you will control concentration of yeast suspension / volume of yeast suspension ; volume of DCPIP / concentration of DCPIP ; how you will process your results to draw a conclusion 1 calculate rate as and plot graph of rate against temperature ; t explain the shape of the graph e.g. positive gradient means rate increases as T increases and negative gradient means rate decreases as T increases ; when temperature is increased does the rate increase or decrease (or stay the same) ;
Q3 · A student investigates the dyes contained in several food colourings using chromatography
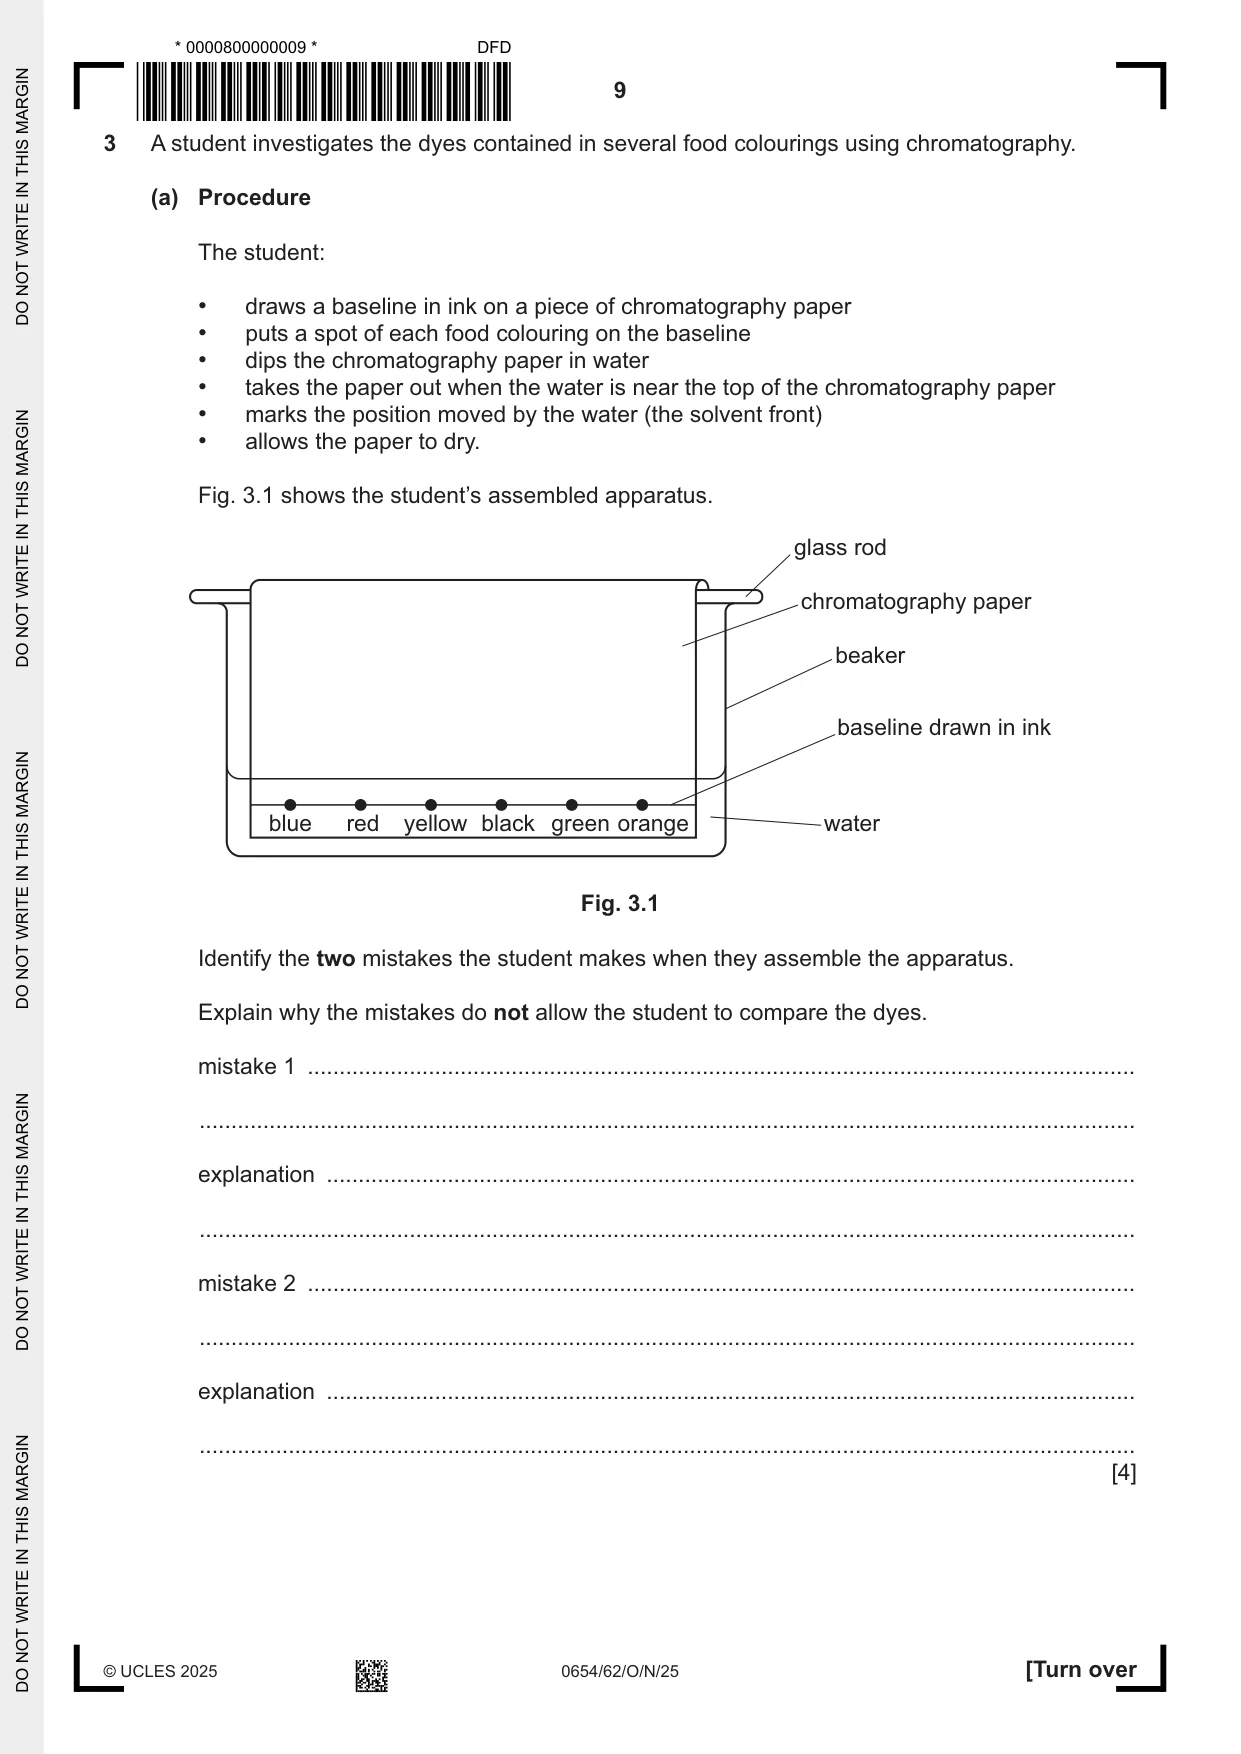
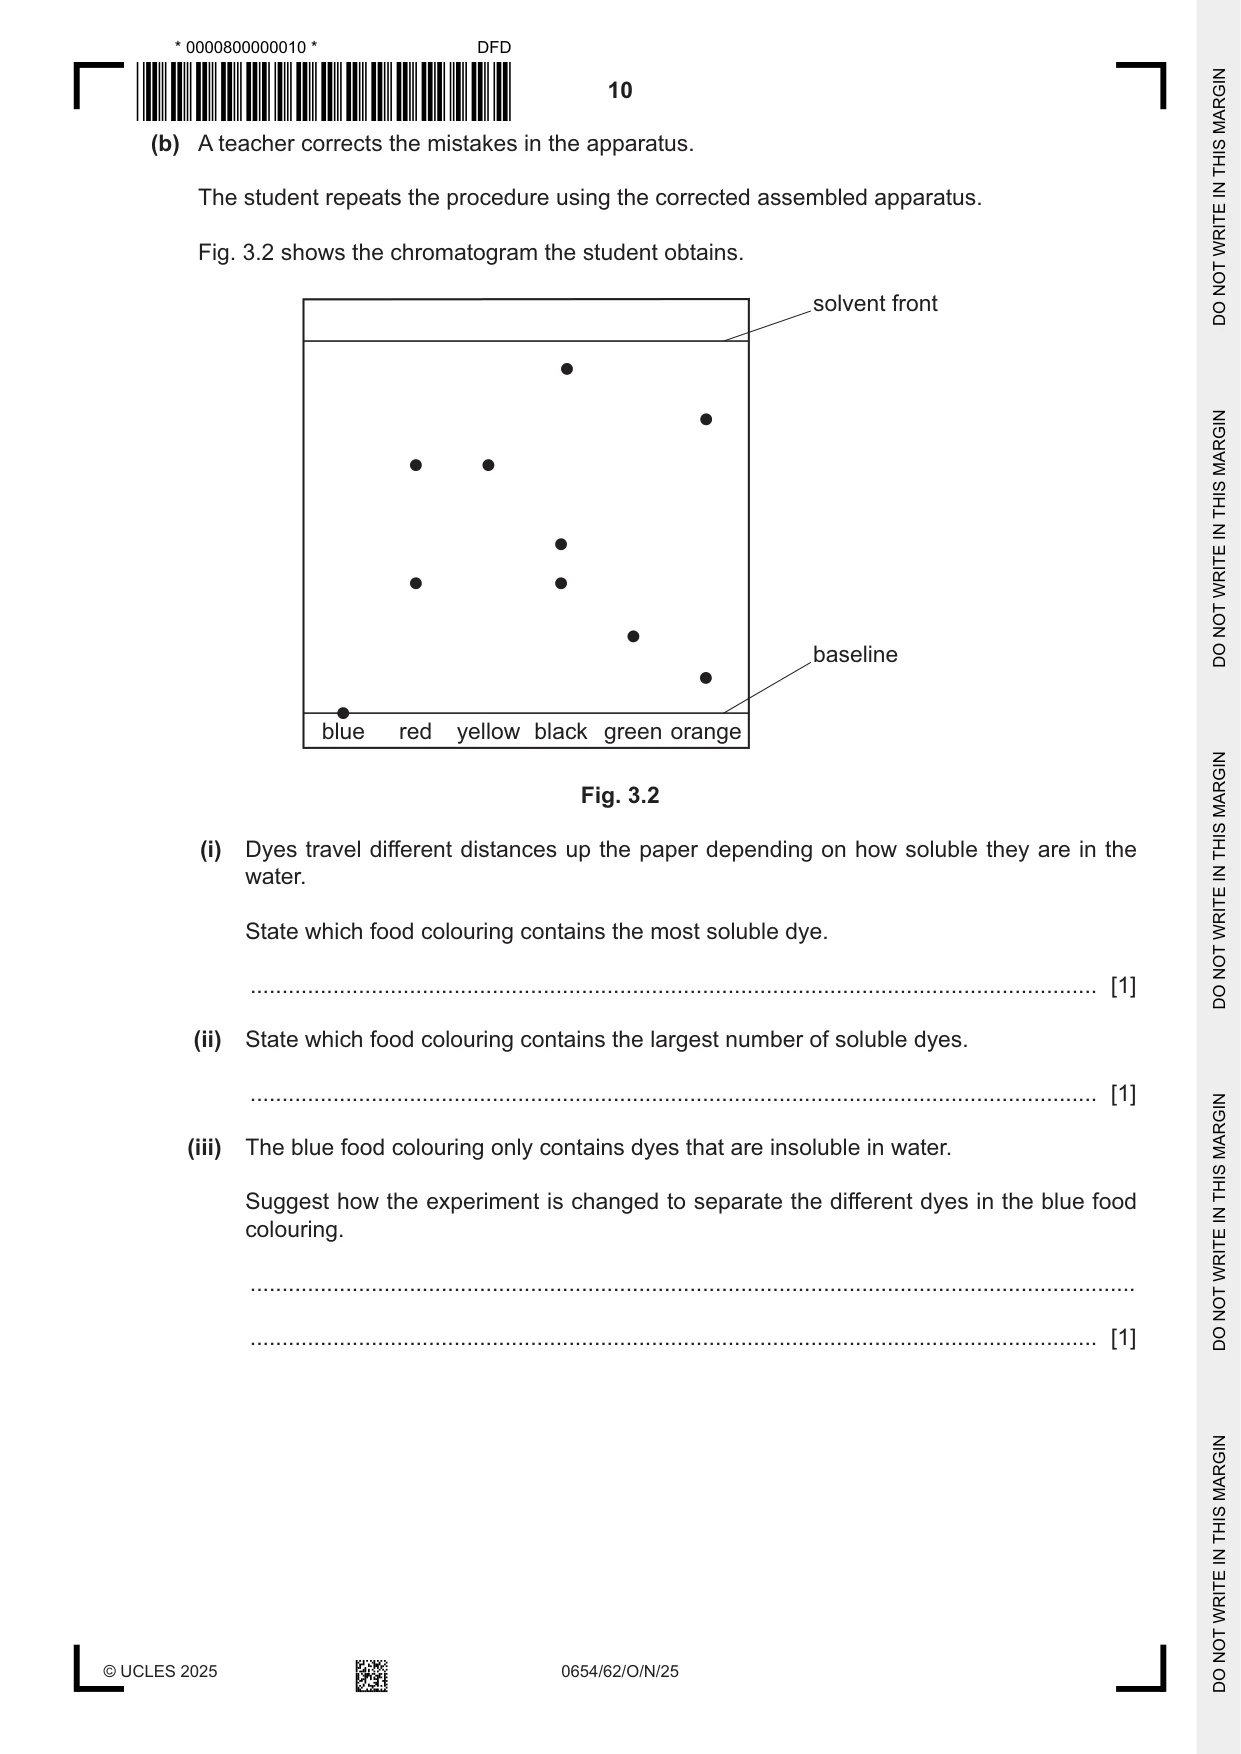
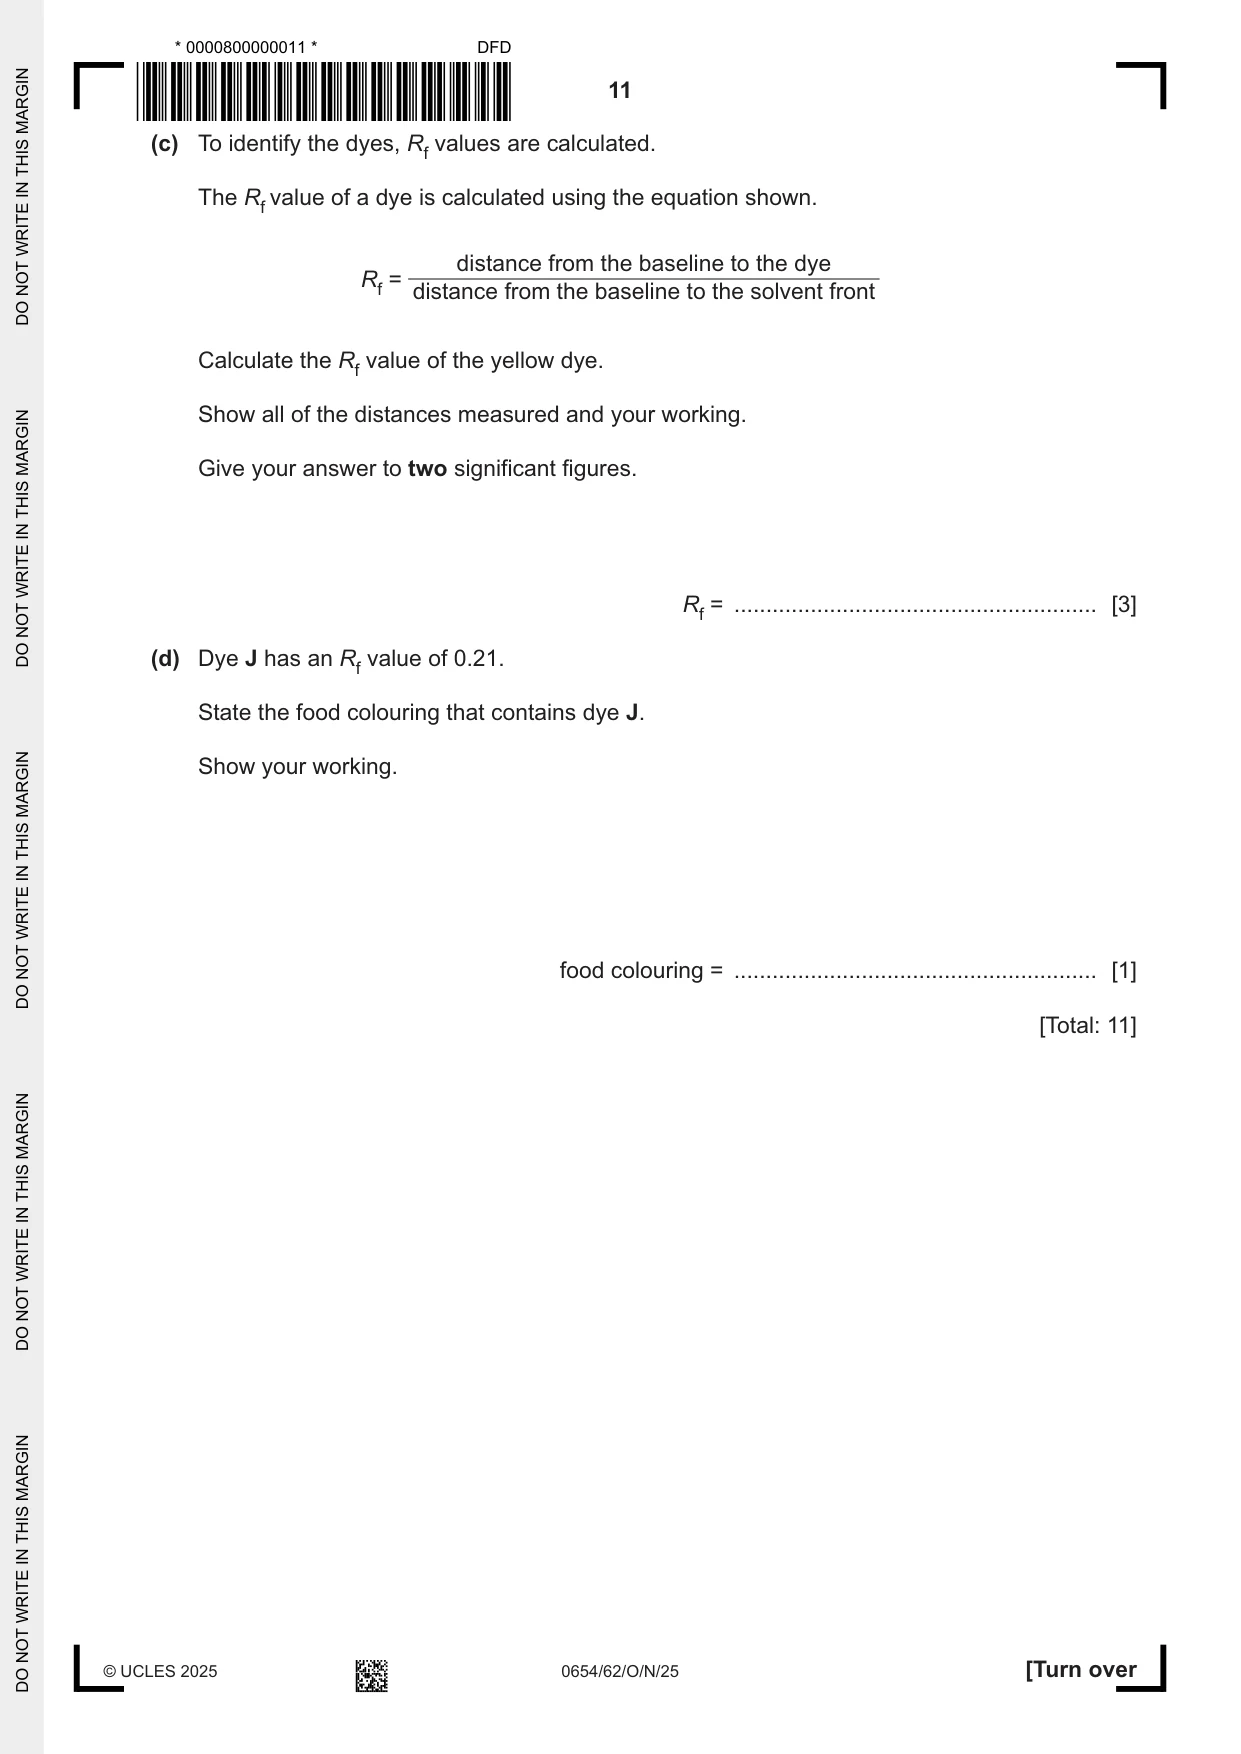
3 A student investigates the dyes contained in several food colourings using chromatography. (a) Procedure The student: • draws a baseline in ink on a piece of chromatography paper • puts a spot of each food colouring on the baseline • dips the chromatography paper in water • takes the paper out when the water is near the top of the chromatography paper • marks the position moved by the water (the solvent front) • allows the paper to dry. Fig. 3.1 shows the student’s assembled apparatus. glass rod chromatography paper beaker baseline drawn in ink blue red yellow black green orange water Fig. 3.1 Identify the two mistakes the student makes when they assemble the apparatus. Explain why the mistakes do not allow the student to compare the dyes. mistake 1 .................................................................................................................................. ................................................................................................................................................... explanation ............................................................................................................................... ................................................................................................................................................... mistake 2 .................................................................................................................................. ................................................................................................................................................... explanation ............................................................................................................................... ................................................................................................................................................... [4] (b) A teacher corrects the mistakes in the apparatus. The student repeats the procedure using the corrected assembled apparatus. Fig. 3.2 shows the chromatogram the student obtains. solvent front baseline blue red yellow black green orange Fig. 3.2 (i) Dyes travel different distances up the paper depending on how soluble they are in the water. State which food colouring contains the most soluble dye. ..................................................................................................................................... [1] (ii) State which food colouring contains the largest number of soluble dyes. ..................................................................................................................................... [1] (iii) The blue food colouring only contains dyes that are insoluble in water. Suggest how the experiment is changed to separate the different dyes in the blue food colouring. ........................................................................................................................................... ..................................................................................................................................... [1] (c) To identify the dyes, Rf values are calculated. The Rf value of a dye is calculated using the equation shown. distance from the baseline to the dye Rf = distance from the baseline to the solvent front Calculate the Rf value of the yellow dye. Show all of the distances measured and your working. Give your answer to two significant figures. Rf = ......................................................... [3] (d) Dye J has an Rf value of 0.21. State the food colouring that contains dye J. Show your working. food colouring = ......................................................... [1] [Total: 11]
Mark scheme: 3(a) the base line in pen / the base line not in pencil ; 4 will, split into colours / run / smudge ; the baseline is under the water ; the colours, will dissolve into the water / run off the paper / wash off the paper ; 3(b)(i) black ; 1 3(b)(ii) black ; 1 3(b)(iii) change the solvent / use ethanol ; 1 3(c) 4.2 cm / 42 mm ; 3 6.3 cm / 63 mm ; Rf = 0.67 ; 3(d) green and working shown ; 1
Q4 · A student investigates the reaction between copper carbonate and dilute sulfuric acid to…
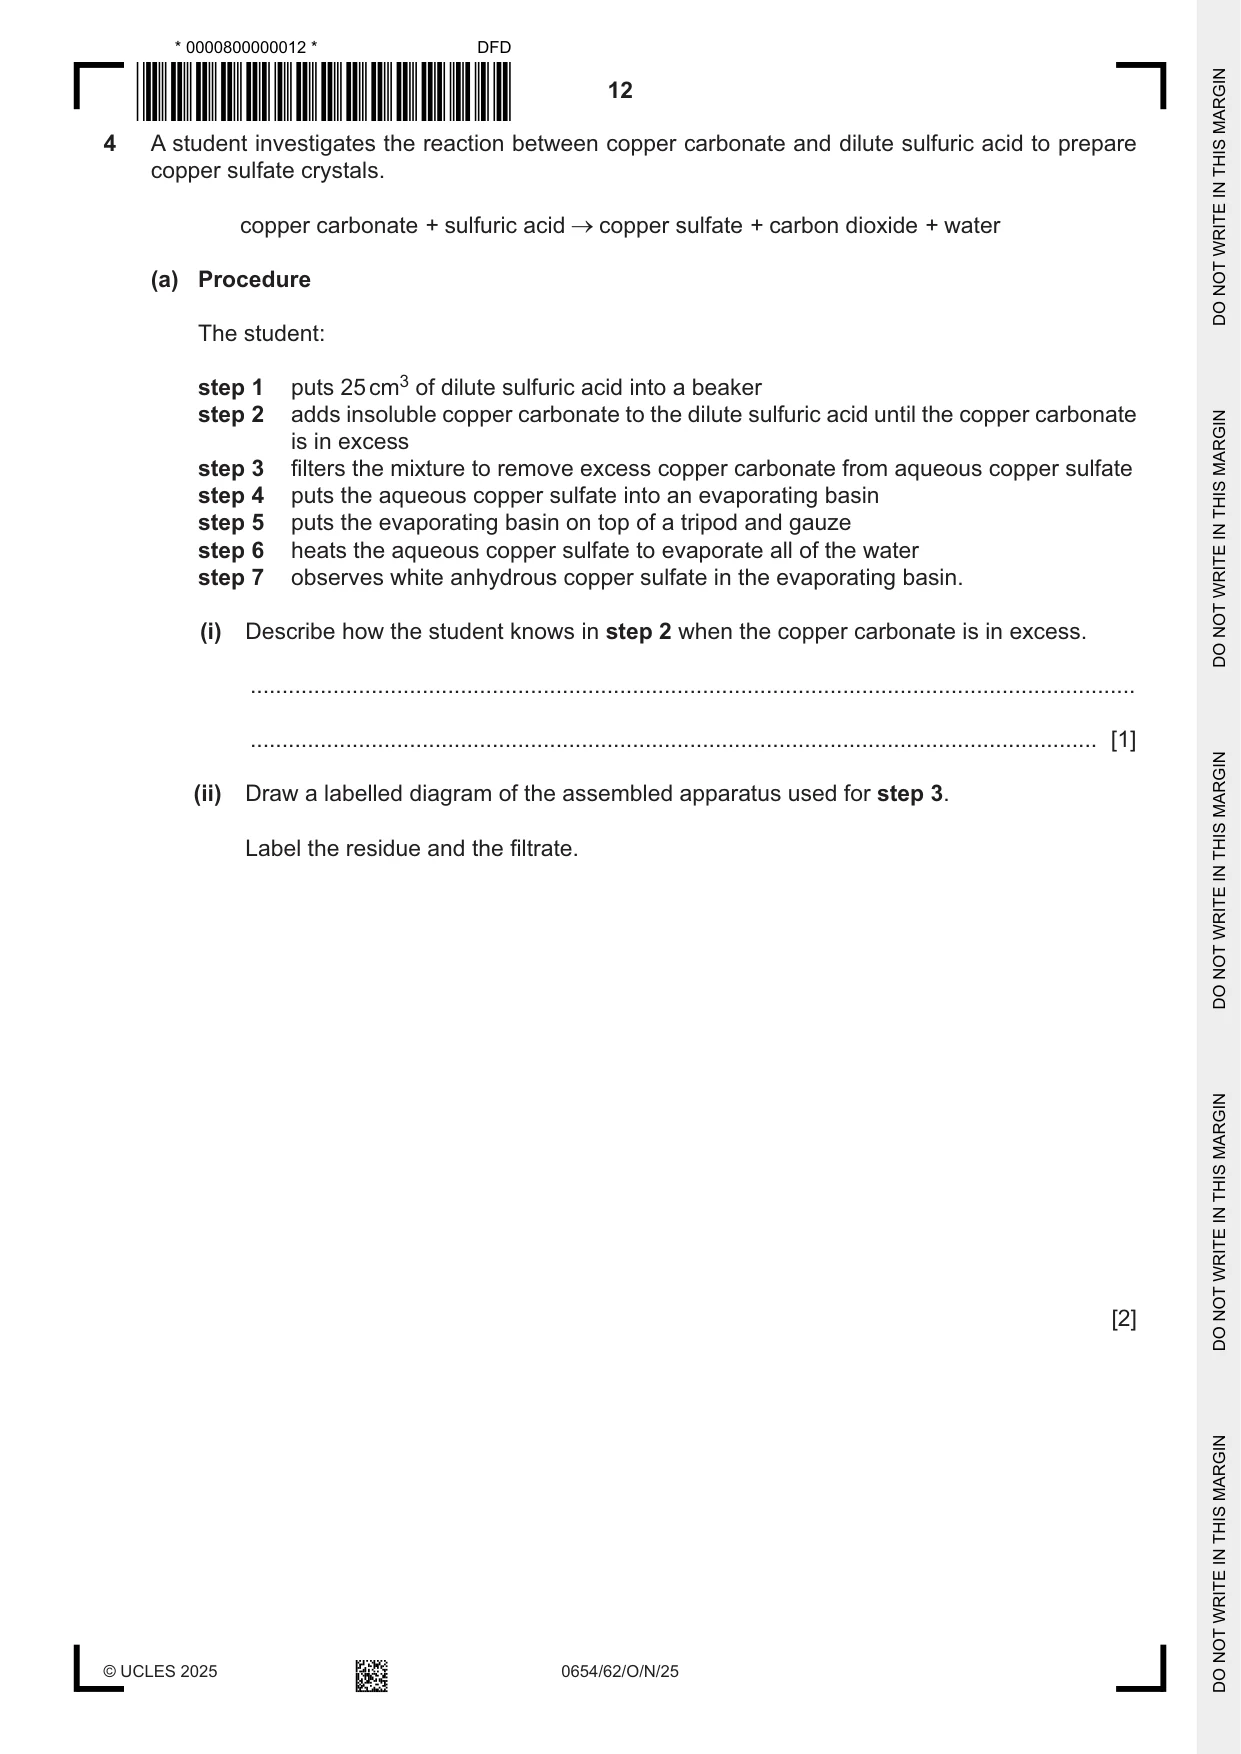
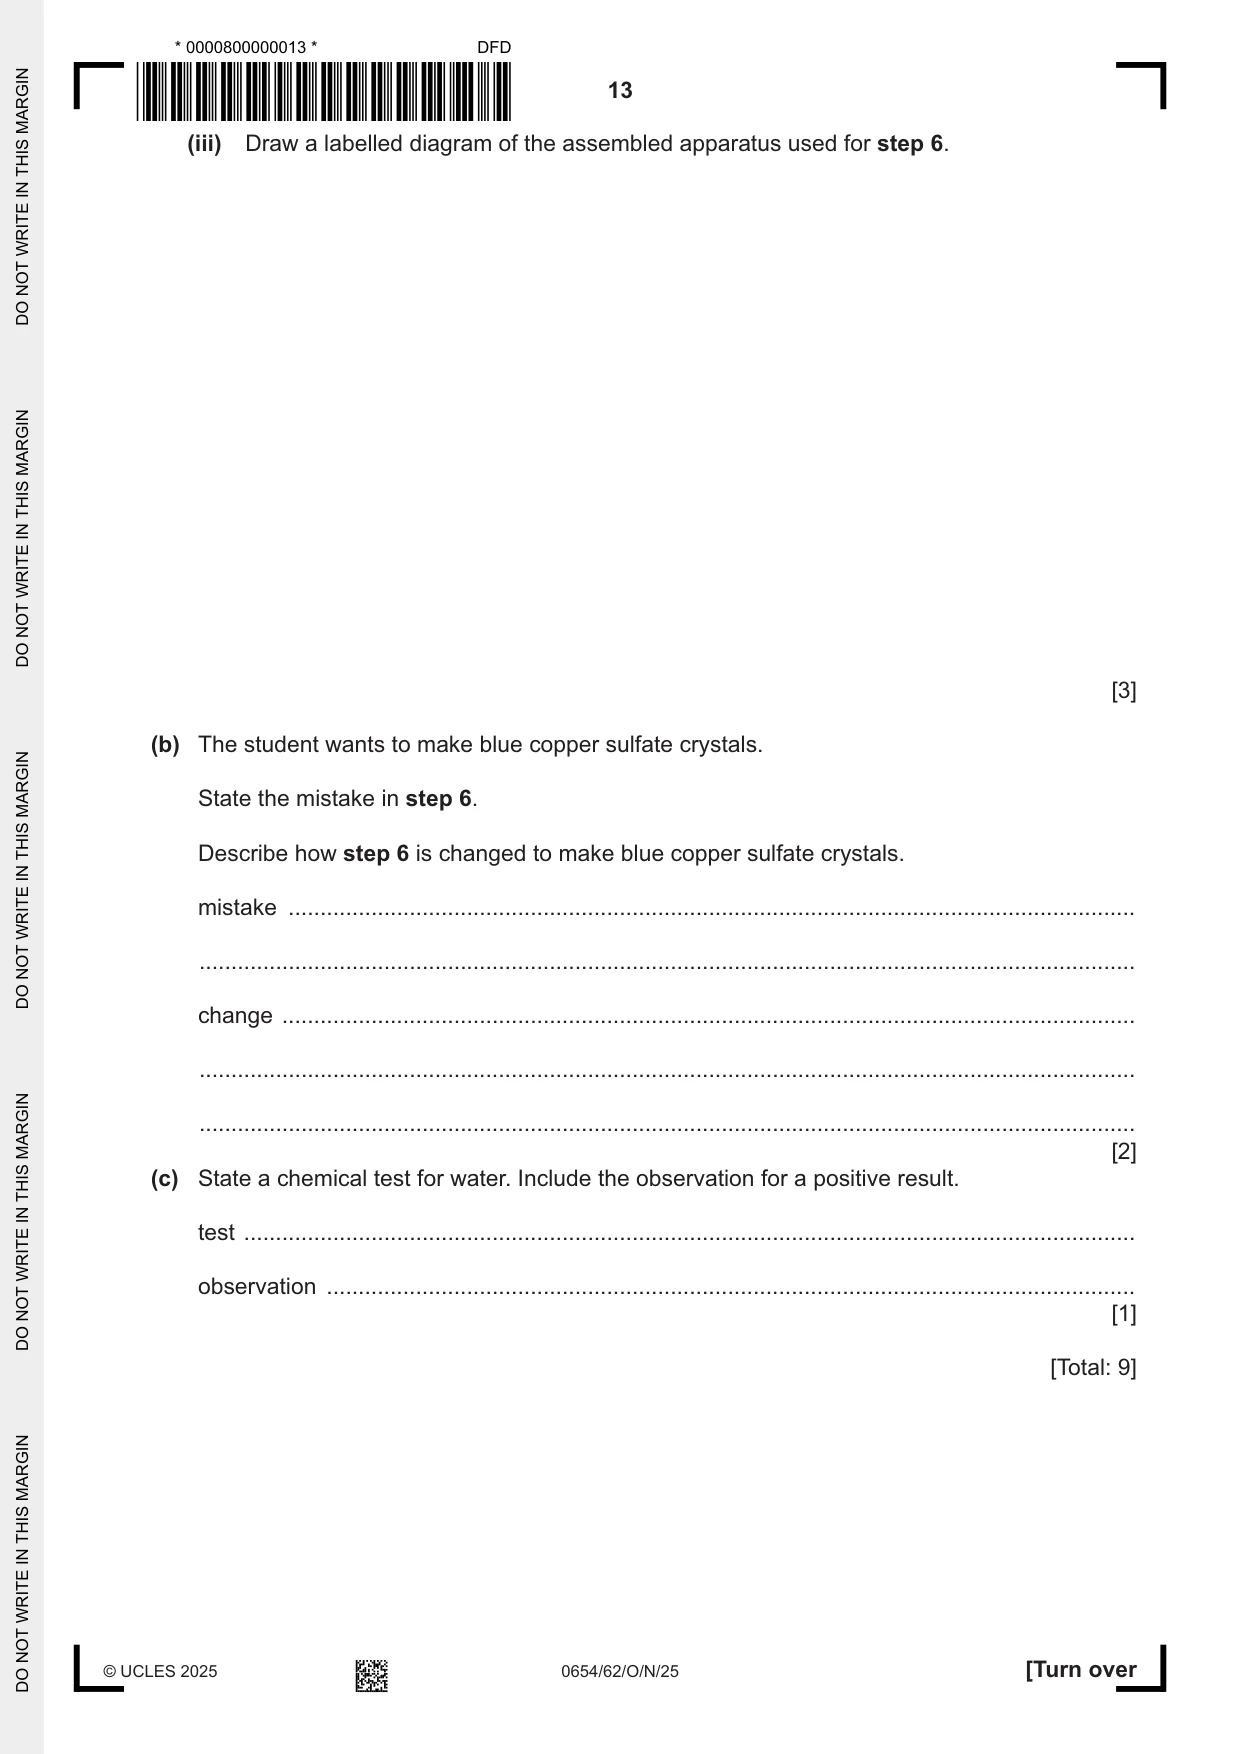
4 A student investigates the reaction between copper carbonate and dilute sulfuric acid to prepare copper sulfate crystals. copper carbonate + sulfuric acid copper sulfate + carbon dioxide + water (a) Procedure The student: step 1 puts 25 cm3 of dilute sulfuric acid into a beaker step 2 adds insoluble copper carbonate to the dilute sulfuric acid until the copper carbonate is in excess step 3 filters the mixture to remove excess copper carbonate from aqueous copper sulfate step 4 puts the aqueous copper sulfate into an evaporating basin step 5 puts the evaporating basin on top of a tripod and gauze step 6 heats the aqueous copper sulfate to evaporate all of the water step 7 observes white anhydrous copper sulfate in the evaporating basin. (i) Describe how the student knows in step 2 when the copper carbonate is in excess. ........................................................................................................................................... ..................................................................................................................................... [1] (ii) Draw a labelled diagram of the assembled apparatus used for step 3. Label the residue and the filtrate. [2] (iii) Draw a labelled diagram of the assembled apparatus used for step 6. [3] (b) The student wants to make blue copper sulfate crystals. State the mistake in step 6. Describe how step 6 is changed to make blue copper sulfate crystals. mistake ..................................................................................................................................... ................................................................................................................................................... change ...................................................................................................................................... ................................................................................................................................................... ................................................................................................................................................... [2] (c) State a chemical test for water. Include the observation for a positive result. test ............................................................................................................................................ observation ............................................................................................................................... [1] [Total: 9]
Mark scheme: 4(a)(i) solid left in beaker ; 1 4(a)(ii) filter paper to a v at the bottom with no gap and funnel and receiving vessel ; 2 residue and filtrate labelled ; 4(a)(iii) tripod, gauze and heatproof mat ; 3 evaporating basin and Bunsen burner ; two correct apparatus labels and copper sulfate / solution / filtrate labelled ; 4(b) evaporates all of the water ; 2 evaporate some of the water and leave to cool (and filter) / evaporate some of the water and leave to crystalise (and filter) ; 4(c) anhydrous copper sulfate white to blue ; 1 OR anhydrous cobalt chloride (paper) blue to pink ;
Q5 · A student investigates the percentage efficiency of the energy transfers for a ball…
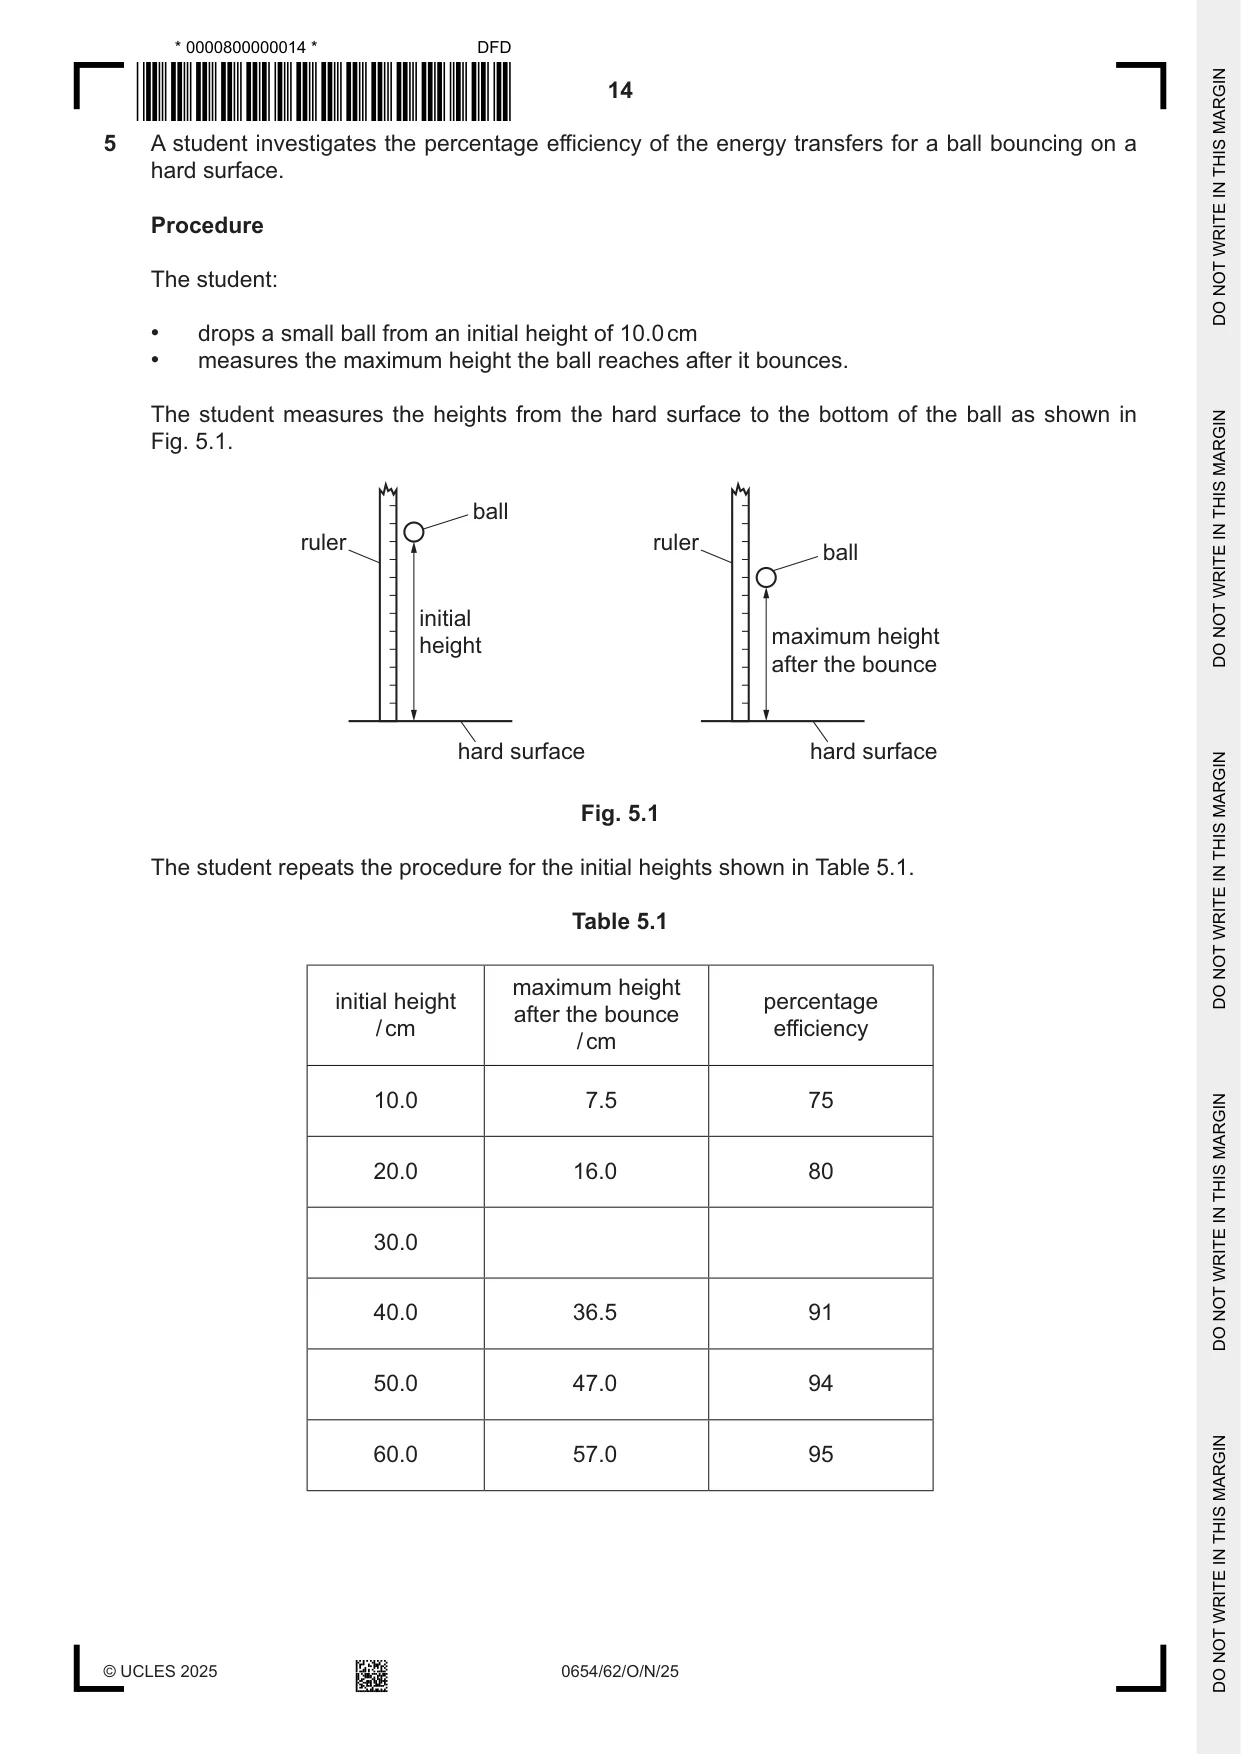
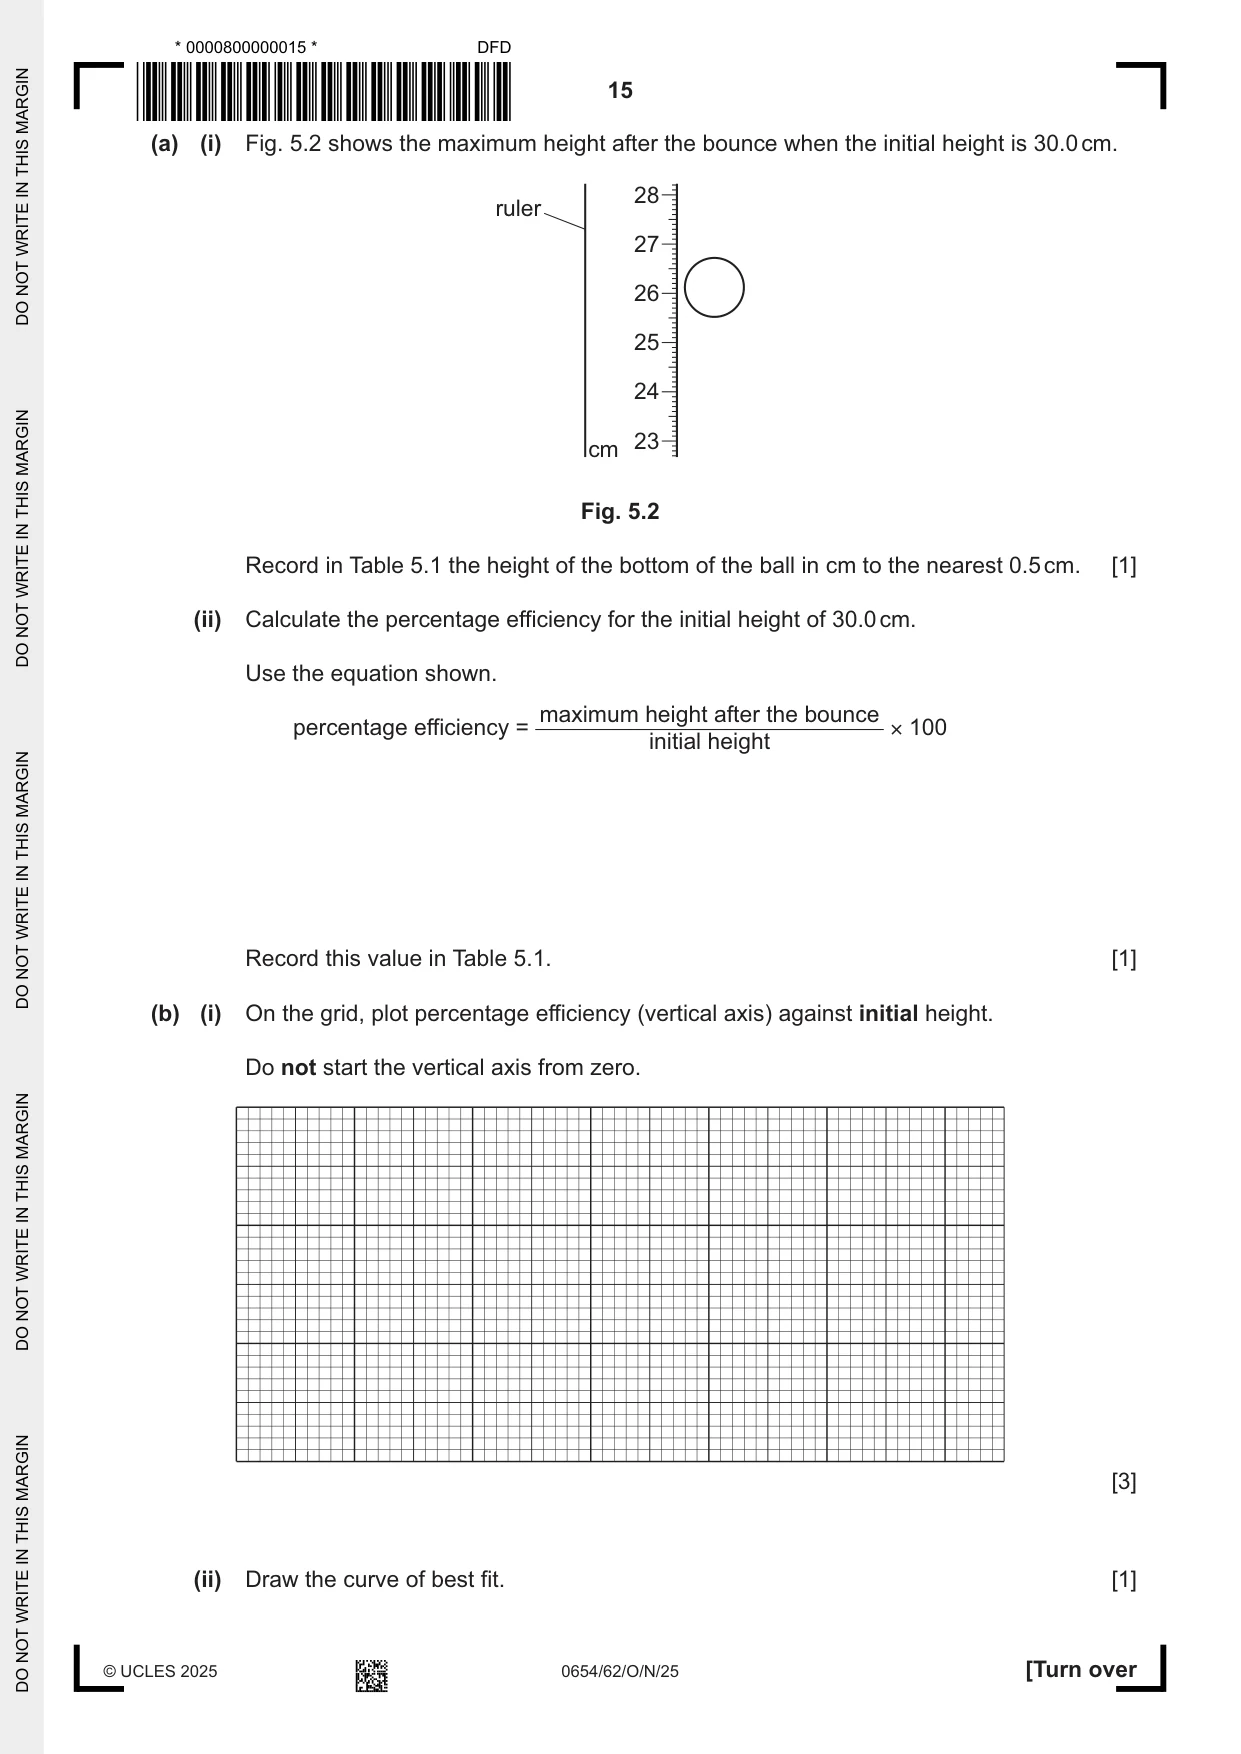
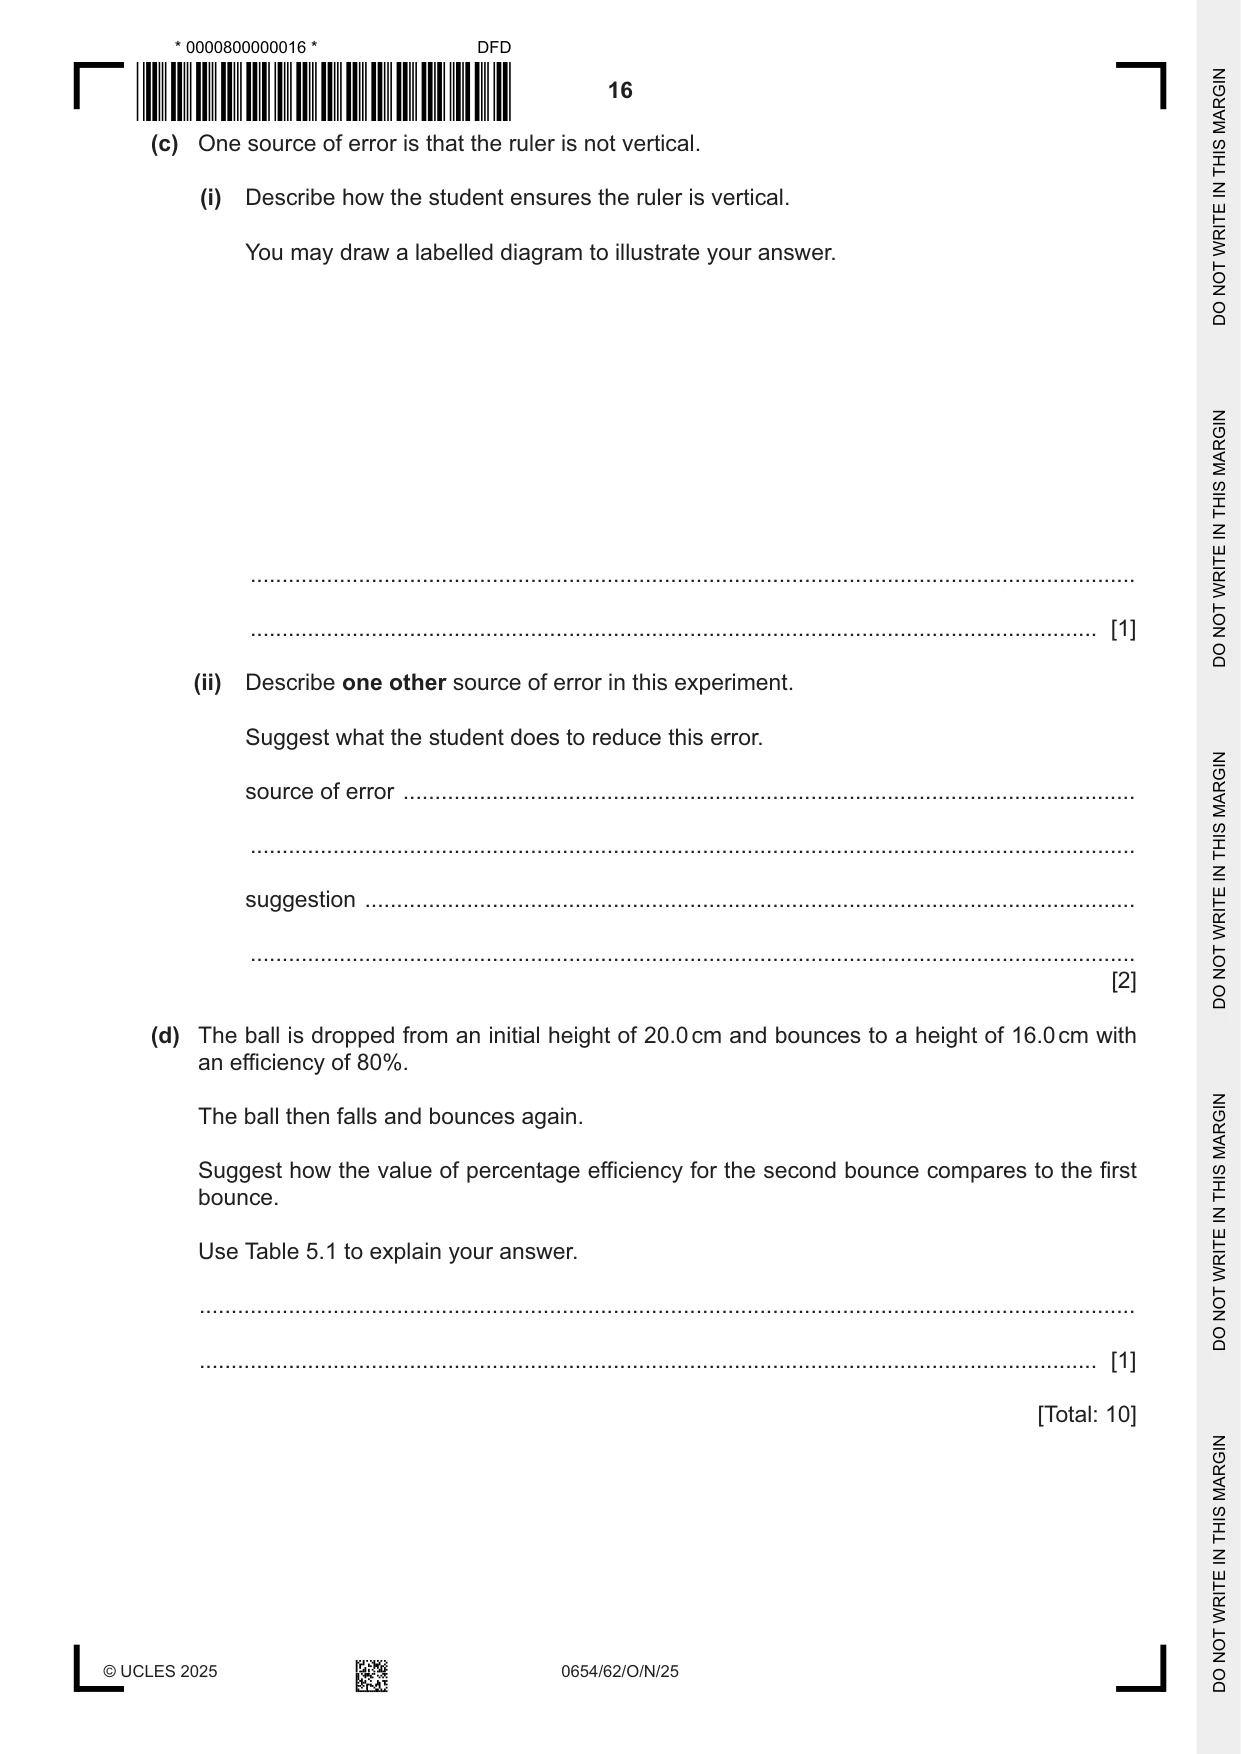
5 A student investigates the percentage efficiency of the energy transfers for a ball bouncing on a hard surface. Procedure The student: • drops a small ball from an initial height of 10.0 cm • measures the maximum height the ball reaches after it bounces. The student measures the heights from the hard surface to the bottom of the ball as shown in Fig. 5.1. ball ruler ruler ball initial maximum height height after the bounce hard surface hard surface Fig. 5.1 The student repeats the procedure for the initial heights shown in Table 5.1. Table 5.1 maximum height initial height percentage after the bounce / cm efficiency / cm 10.0 7.5 75 20.0 16.0 80 30.0 40.0 36.5 91 50.0 47.0 94 60.0 57.0 95 (a) (i) Fig. 5.2 shows the maximum height after the bounce when the initial height is 30.0 cm. 28 ruler 27 26 25 24 23 cm Fig. 5.2 Record in Table 5.1 the height of the bottom of the ball in cm to the nearest 0.5 cm. [1] (ii) Calculate the percentage efficiency for the initial height of 30.0 cm. Use the equation shown. maximum height after the bounce percentage efficiency = × 100 initial height Record this value in Table 5.1. [1] (b) (i) On the grid, plot percentage efficiency (vertical axis) against initial height. Do not start the vertical axis from zero. [3] (ii) Draw the curve of best fit. [1] (c) One source of error is that the ruler is not vertical. (i) Describe how the student ensures the ruler is vertical. You may draw a labelled diagram to illustrate your answer. ........................................................................................................................................... ..................................................................................................................................... [1] (ii) Describe one other source of error in this experiment. Suggest what the student does to reduce this error. source of error ................................................................................................................... ........................................................................................................................................... suggestion ......................................................................................................................... ........................................................................................................................................... [2] (d) The ball is dropped from an initial height of 20.0 cm and bounces to a height of 16.0 cm with an efficiency of 80%. The ball then falls and bounces again. Suggest how the value of percentage efficiency for the second bounce compares to the first bounce. Use Table 5.1 to explain your answer. ................................................................................................................................................... ............................................................................................................................................. [1] [Total: 10] Question 6 starts on page 18.
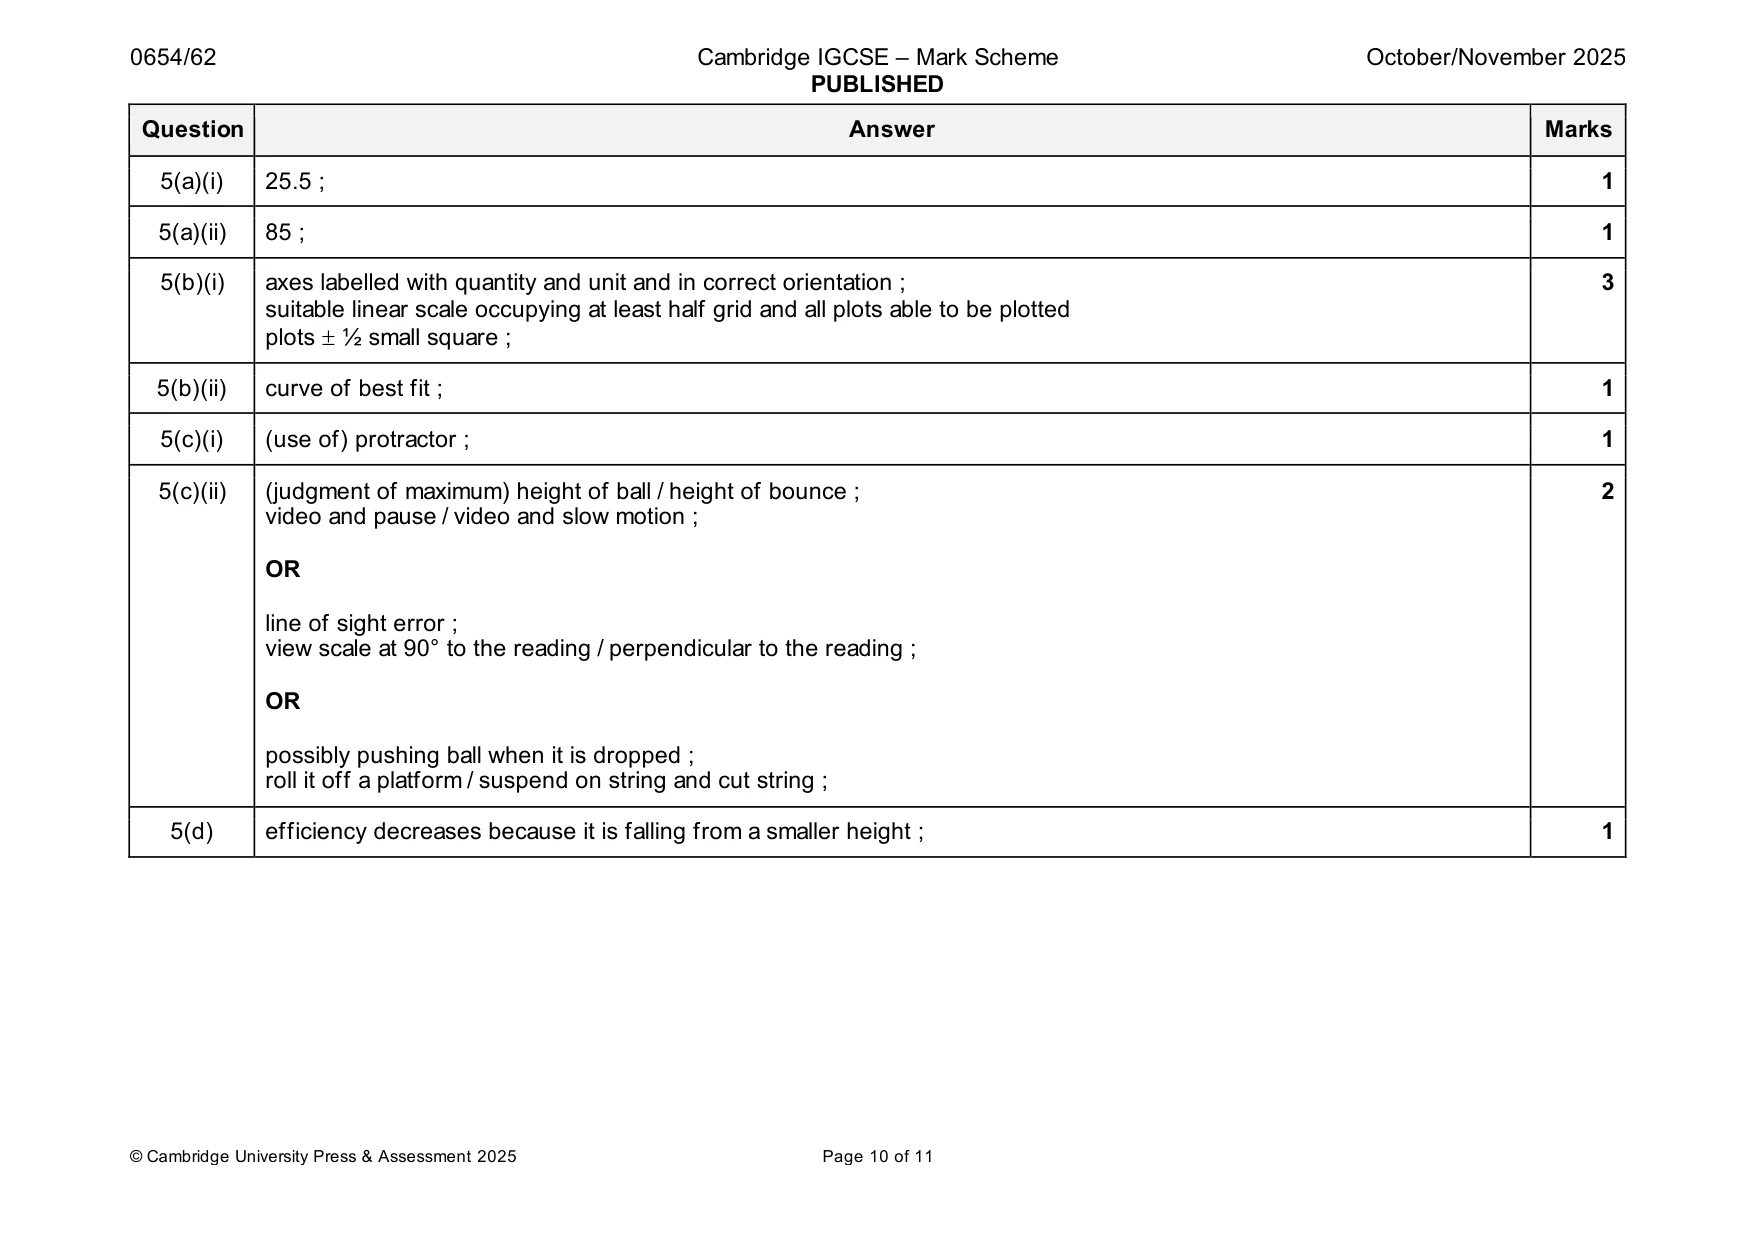
Mark scheme: 5(a)(i) 25.5 ; 1 5(a)(ii) 85 ; 1 5(b)(i) axes labelled with quantity and unit and in correct orientation ; 3 suitable linear scale occupying at least half grid and all plots able to be plotted plots ½ small square ; 5(b)(ii) curve of best fit ; 1 5(c)(i) (use of) protractor ; 1 5(c)(ii) (judgment of maximum) height of ball / height of bounce ; 2 video and pause / video and slow motion ; OR line of sight error ; view scale at 90° to the reading / perpendicular to the reading ; OR possibly pushing ball when it is dropped ; roll it off a platform / suspend on string and cut string ; 5(d) efficiency decreases because it is falling from a smaller height ; 1
More questions on Physical quantities and measurement techniques
Q6 · A student determines the resistance of 1 metre of resistance wire
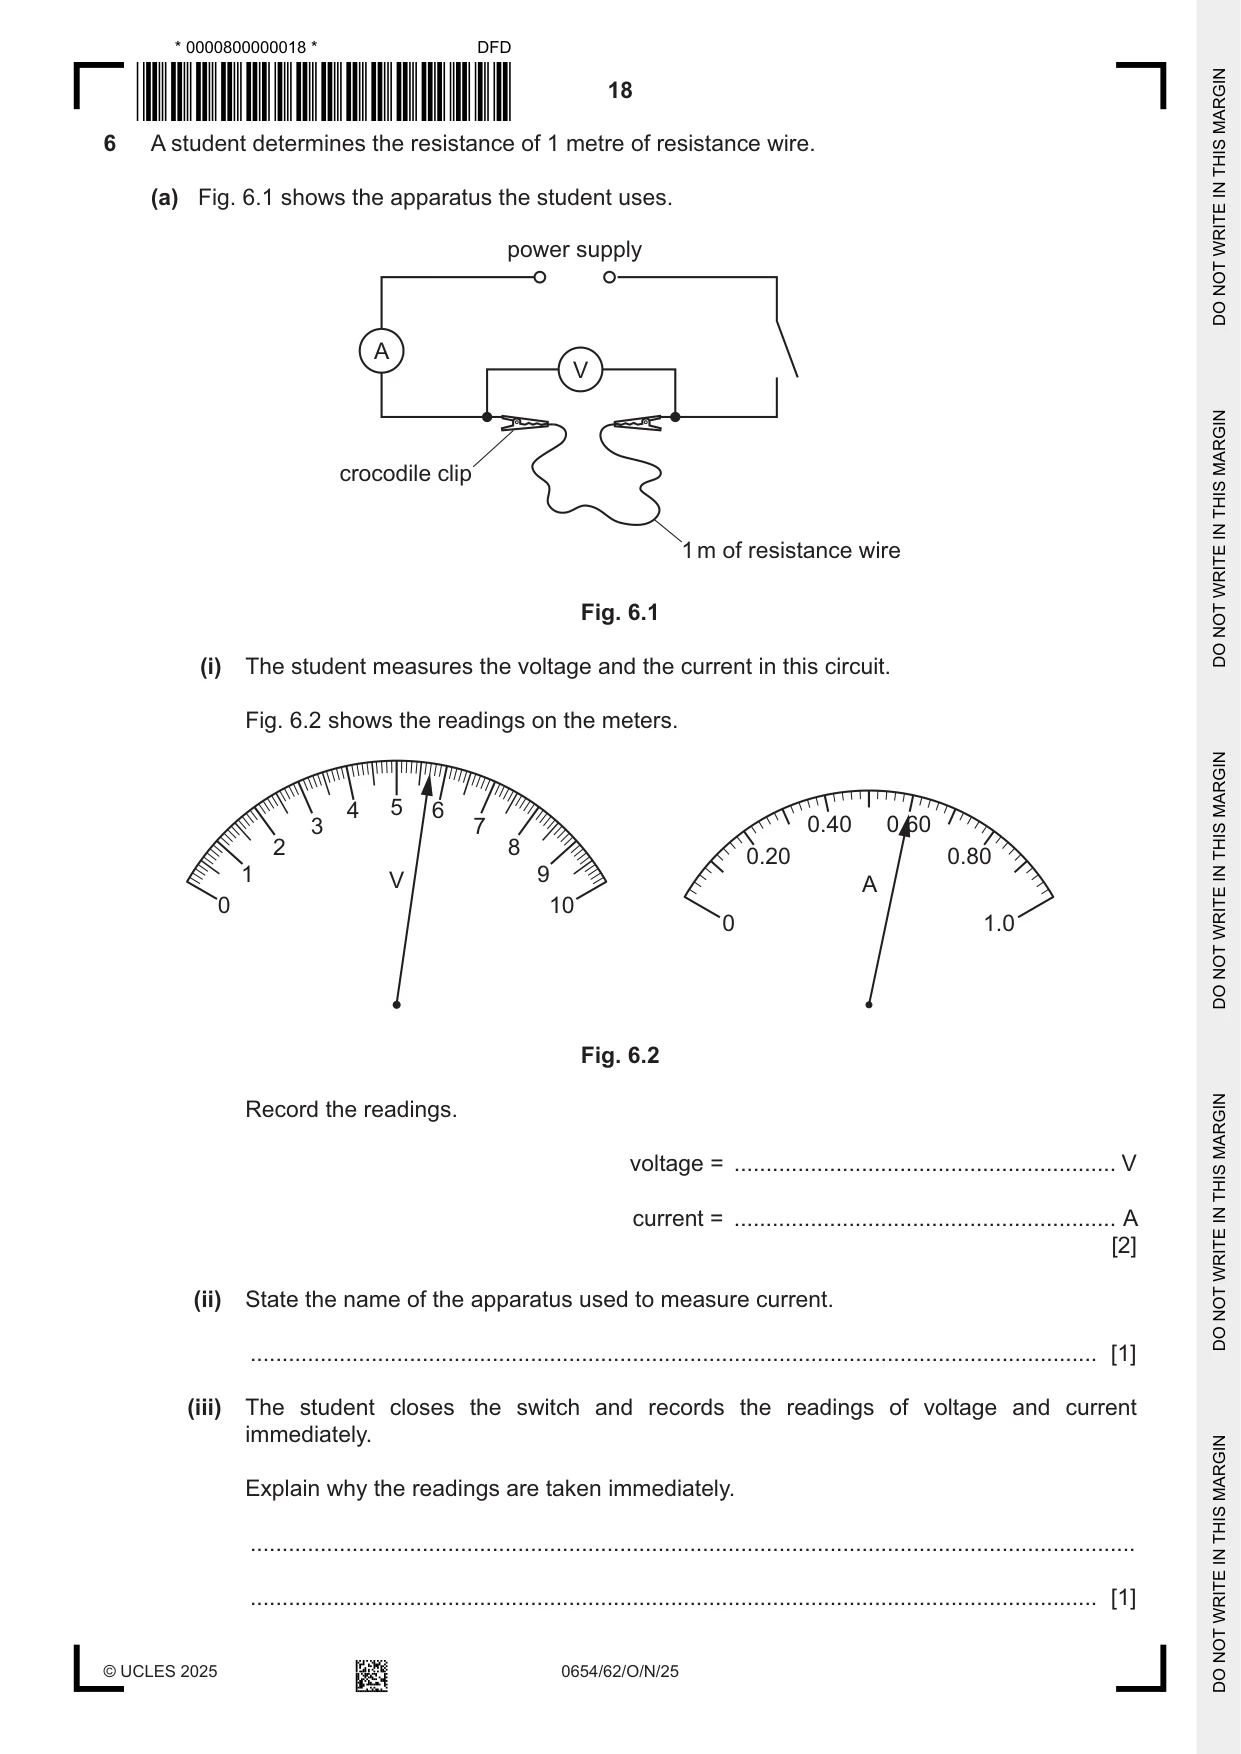
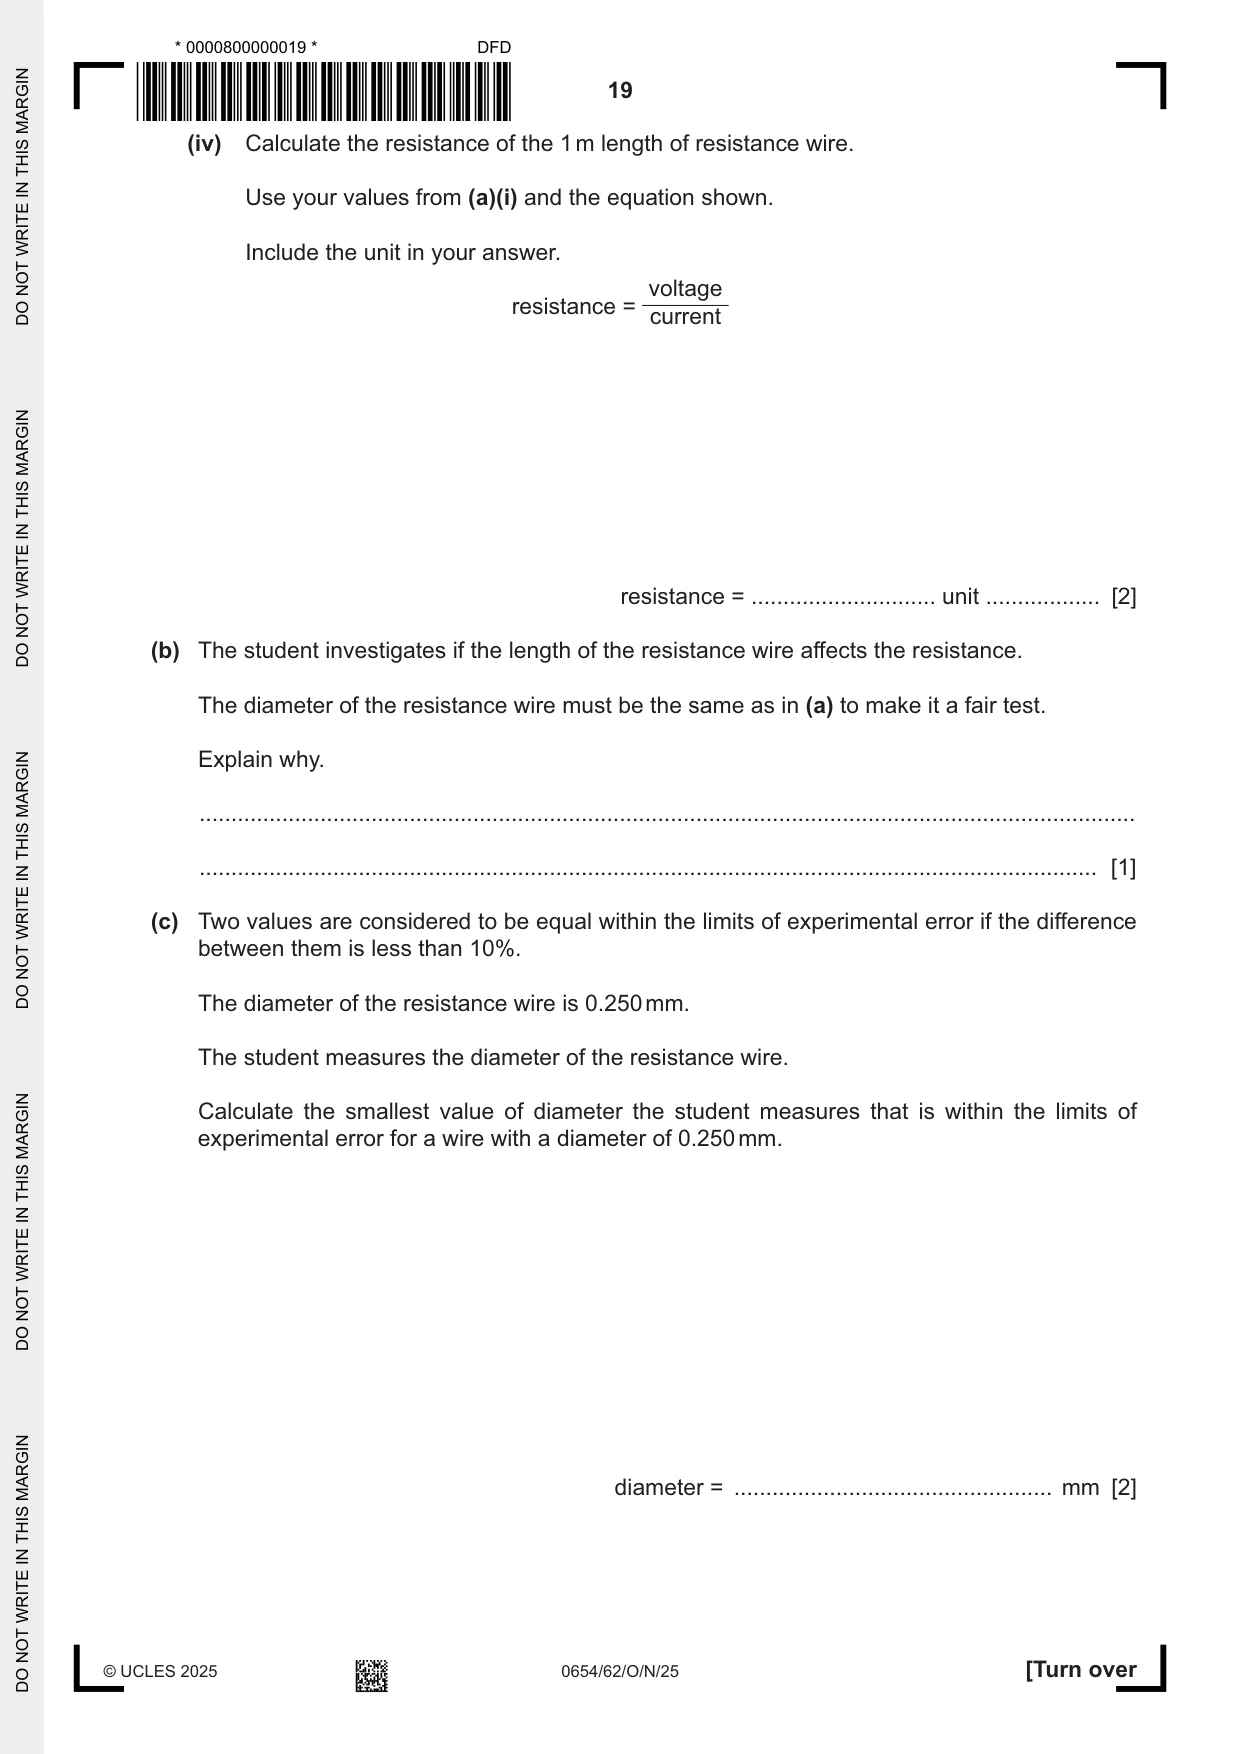
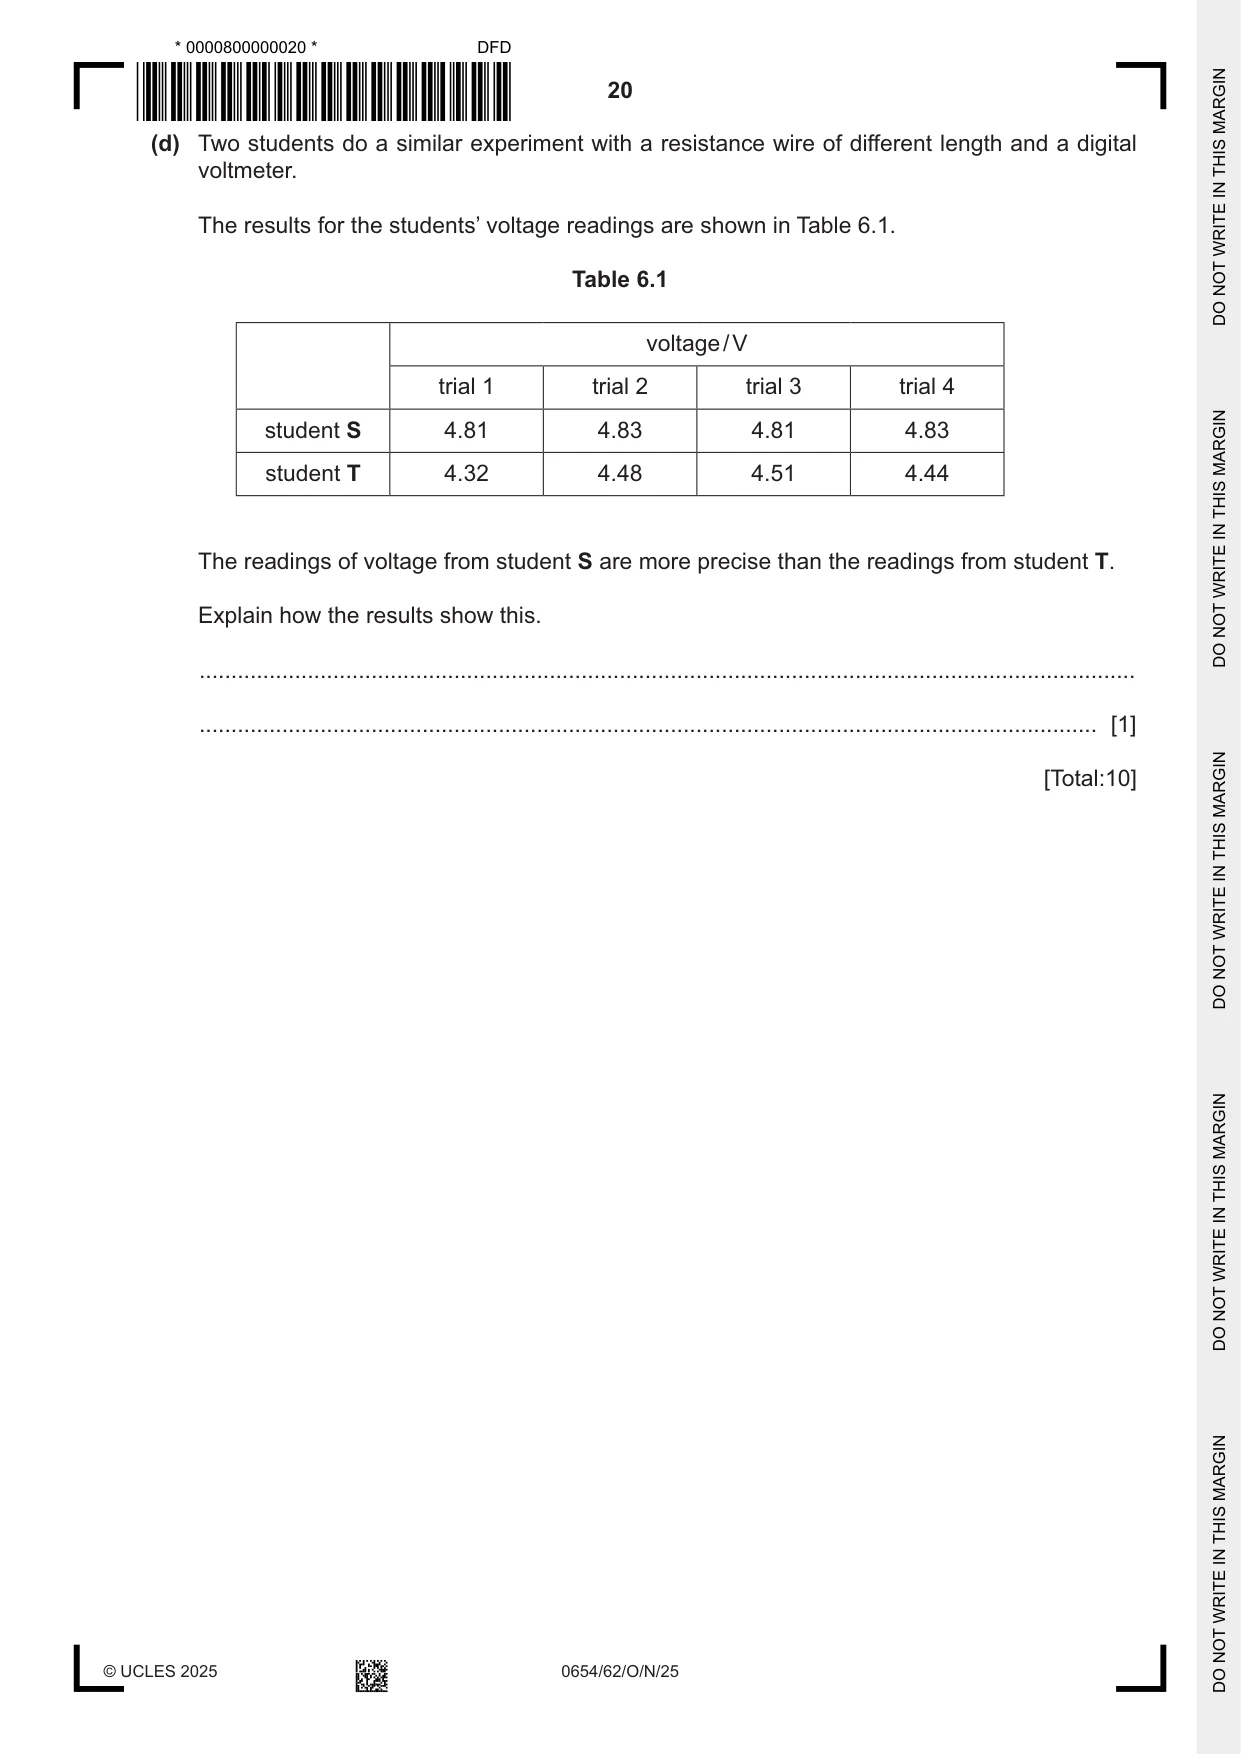
6 A student determines the resistance of 1 metre of resistance wire. (a) Fig. 6.1 shows the apparatus the student uses. power supply A V crocodile clip 1 m of resistance wire Fig. 6.1 (i) The student measures the voltage and the current in this circuit. Fig. 6.2 shows the readings on the meters. 4 5 6 3 7 0.40 0.60 2 8 0.20 0.80 1 9 V A 0 10 0 1.0 Fig. 6.2 Record the readings. voltage = ............................................................ V current = ............................................................ A [2] (ii) State the name of the apparatus used to measure current. ..................................................................................................................................... [1] (iii) The student closes the switch and records the readings of voltage and current immediately. Explain why the readings are taken immediately. ........................................................................................................................................... ..................................................................................................................................... [1] (iv) Calculate the resistance of the 1 m length of resistance wire. Use your values from (a)(i) and the equation shown. Include the unit in your answer. voltage resistance = current resistance = ............................. unit .................. [2] (b) The student investigates if the length of the resistance wire affects the resistance. The diameter of the resistance wire must be the same as in (a) to make it a fair test. Explain why. ................................................................................................................................................... ............................................................................................................................................. [1] (c) Two values are considered to be equal within the limits of experimental error if the difference between them is less than 10%. The diameter of the resistance wire is 0.250 mm. The student measures the diameter of the resistance wire. Calculate the smallest value of diameter the student measures that is within the limits of experimental error for a wire with a diameter of 0.250 mm. diameter = .................................................. mm [2] (d) Two students do a similar experiment with a resistance wire of different length and a digital voltmeter. The results for the students’ voltage readings are shown in Table 6.1. Table 6.1 voltage / V trial 1 trial 2 trial 3 trial 4 student S 4.81 4.83 4.81 4.83 student T 4.32 4.48 4.51 4.44 The readings of voltage from student S are more precise than the readings from student T. Explain how the results show this. ................................................................................................................................................... ............................................................................................................................................. [1] [Total:10]
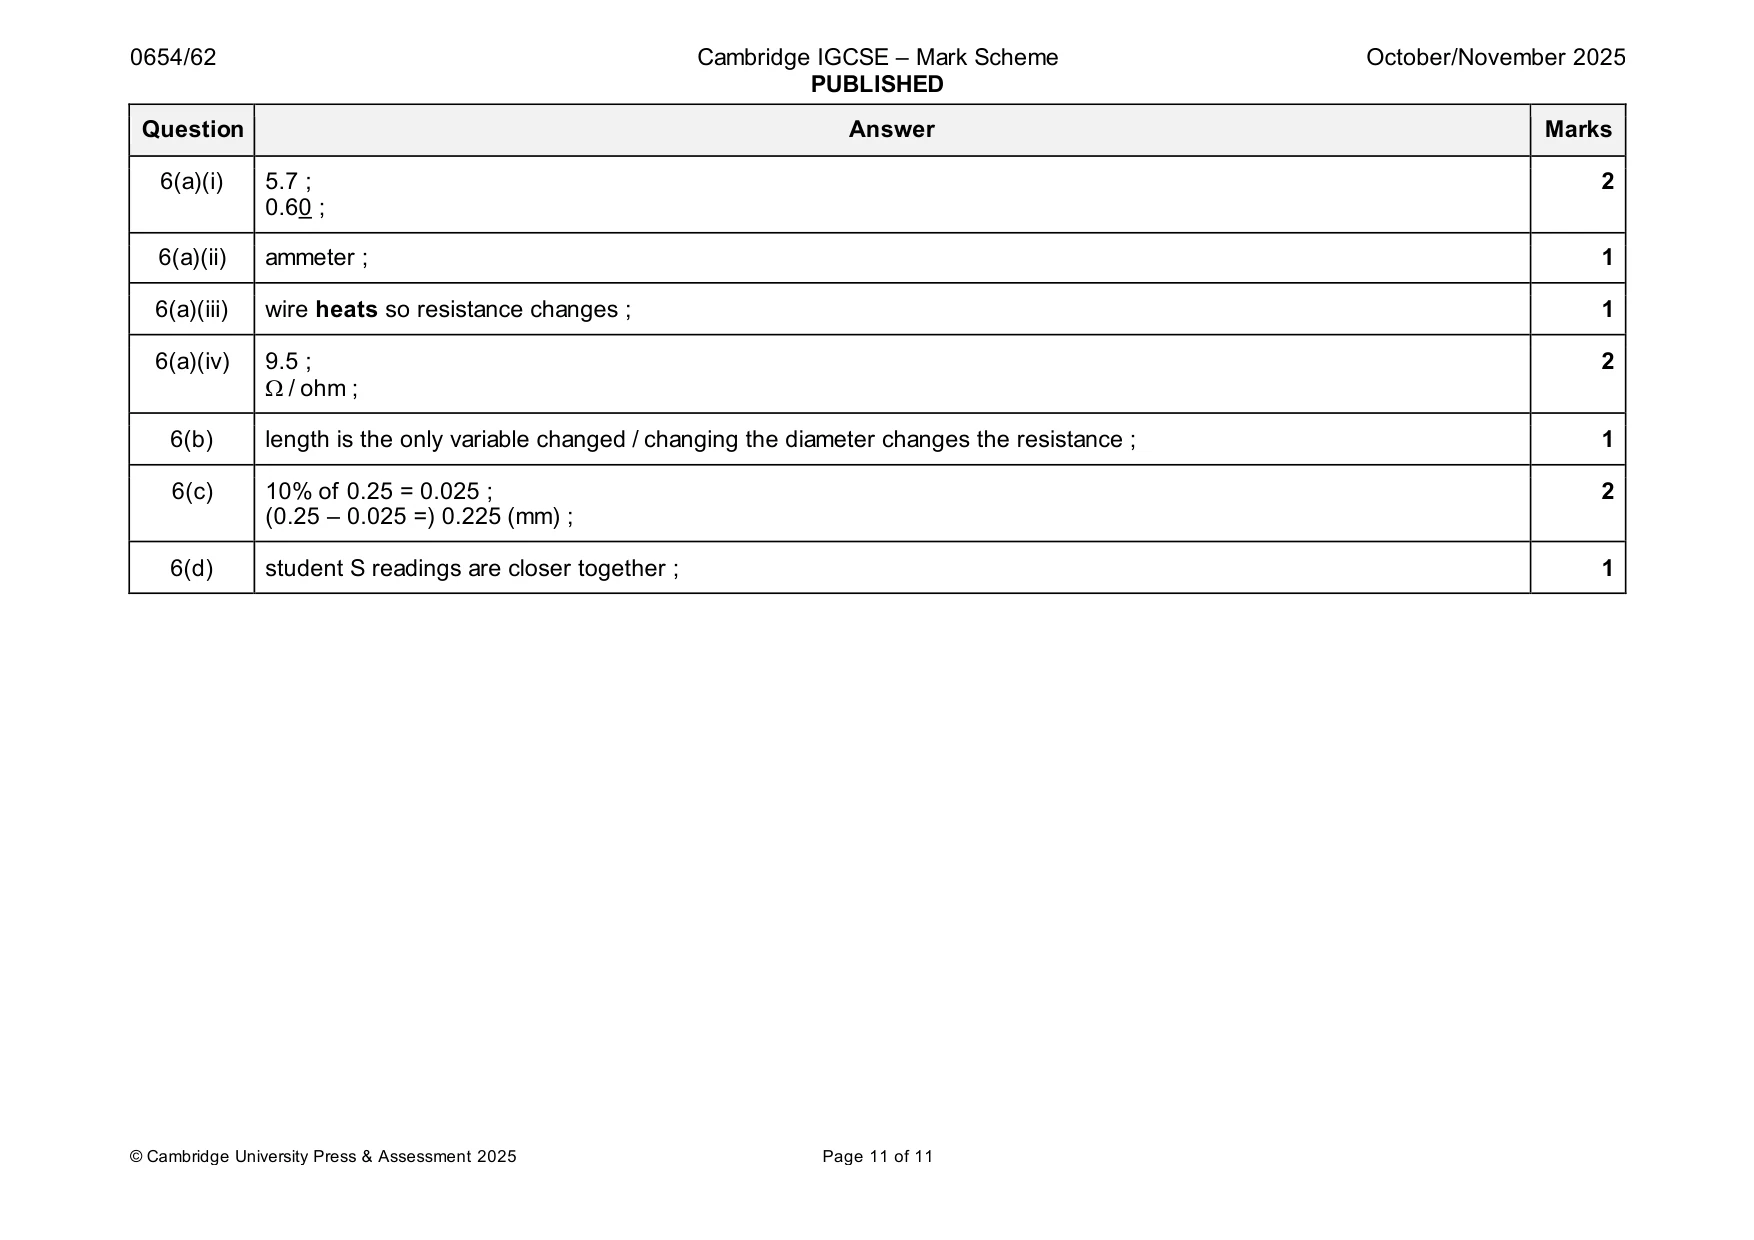
Mark scheme: 6(a)(i) 5.7 ; 2 0.60 ; 6(a)(ii) ammeter ; 1 6(a)(iii) wire heats so resistance changes ; 1 6(a)(iv) 9.5 ; 2 / ohm ; 6(b) length is the only variable changed / changing the diameter changes the resistance ; 1 6(c) 10% of 0.25 = 0.025 ; 2 (0.25 – 0.025 =) 0.225 (mm) ; 6(d) student S readings are closer together ; 1
What was in this paper
The subtopics covered by these 6 questions, and how many questions each got. Open one in a new tab to see every Cambridge question on it.
What you needed in this session
Cambridge’s own grade thresholds for 2025 Oct/Nov, Paper 6 · Variant 2. A higher threshold means an easier paper — the bar moves with how the cohort did.