Cambridge IGCSE Sciences - Co-ordinated (Double) 0654 — 2017 May/June Paper 6 · Variant 2
0654/62/M/J/17 · 6 questions · 60 marks · ≈68 min
The question paper and its mark scheme, free to read here and free to download. This is Cambridge’s own paper, exactly as it was sat.
Question paper20 pages



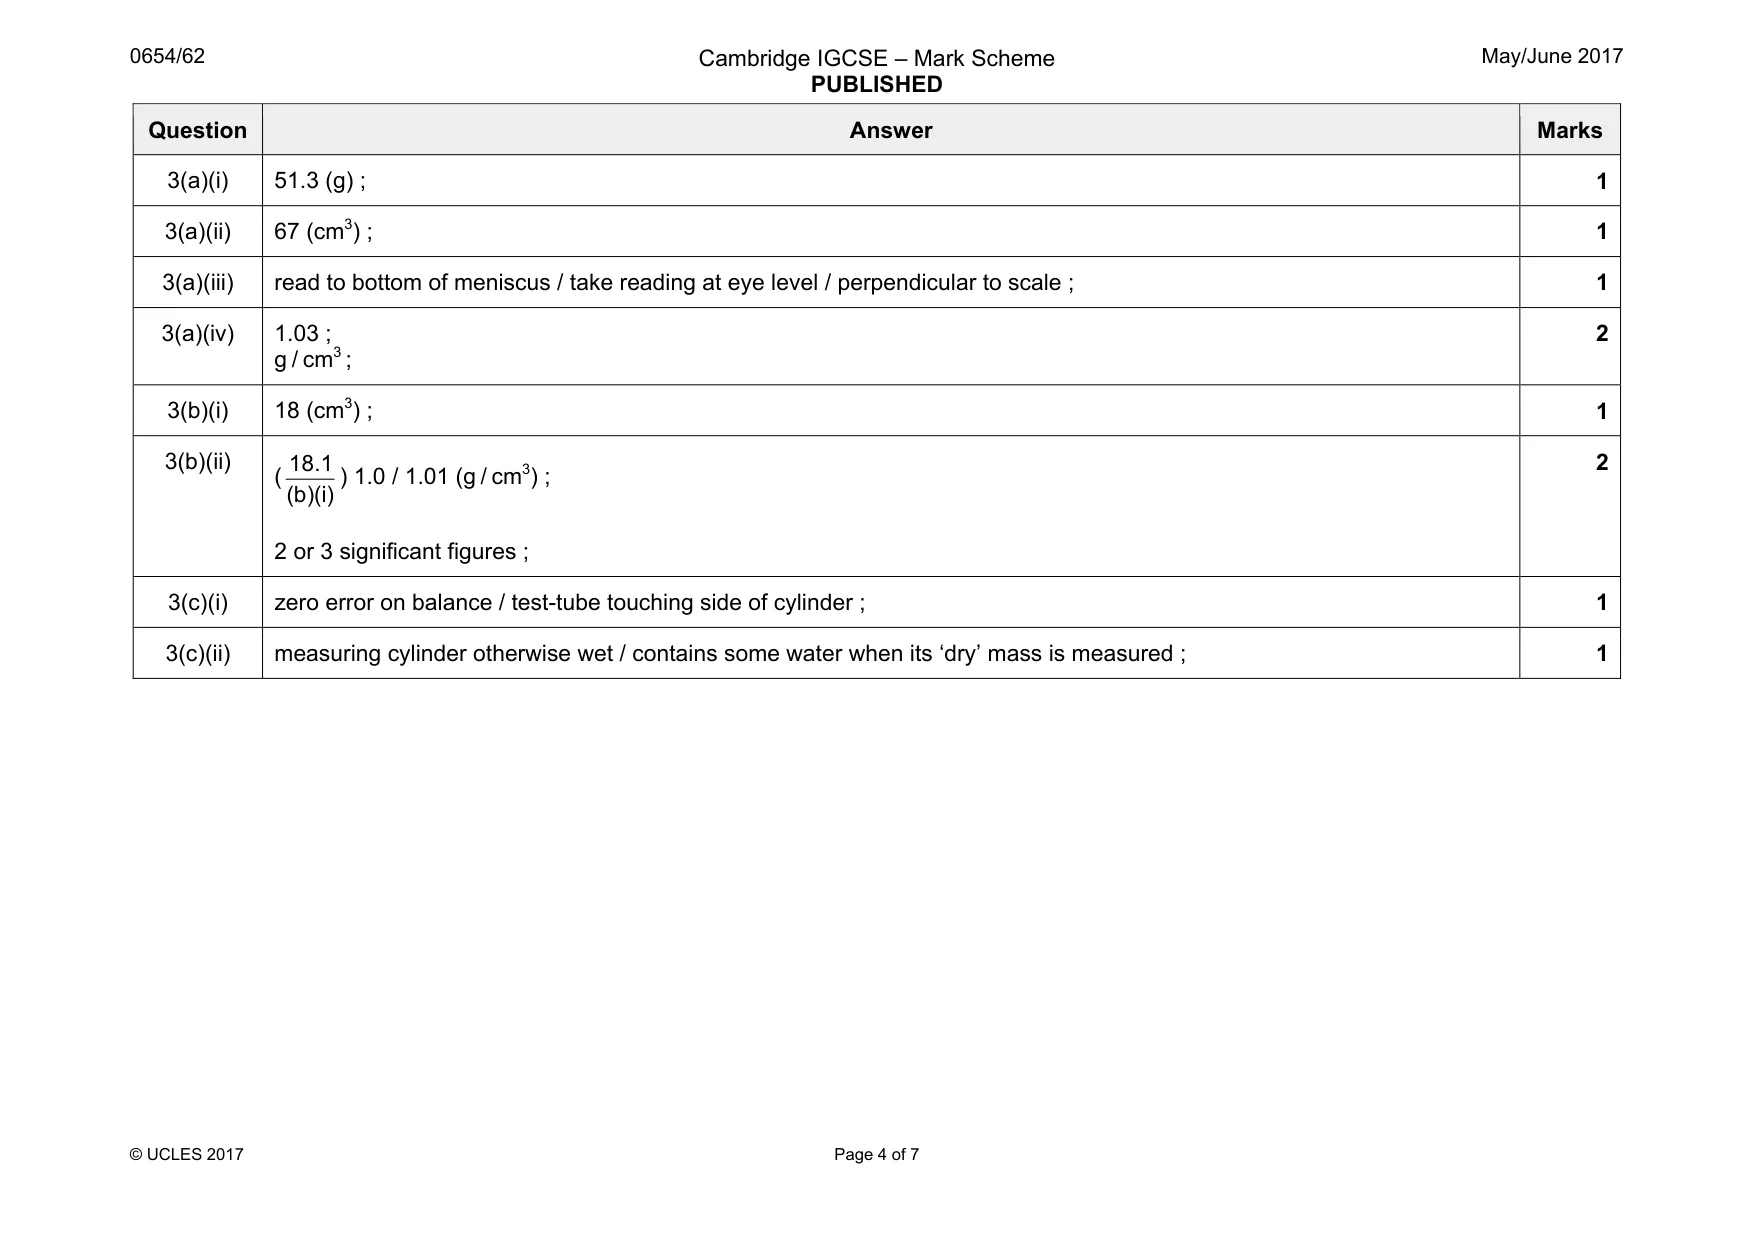
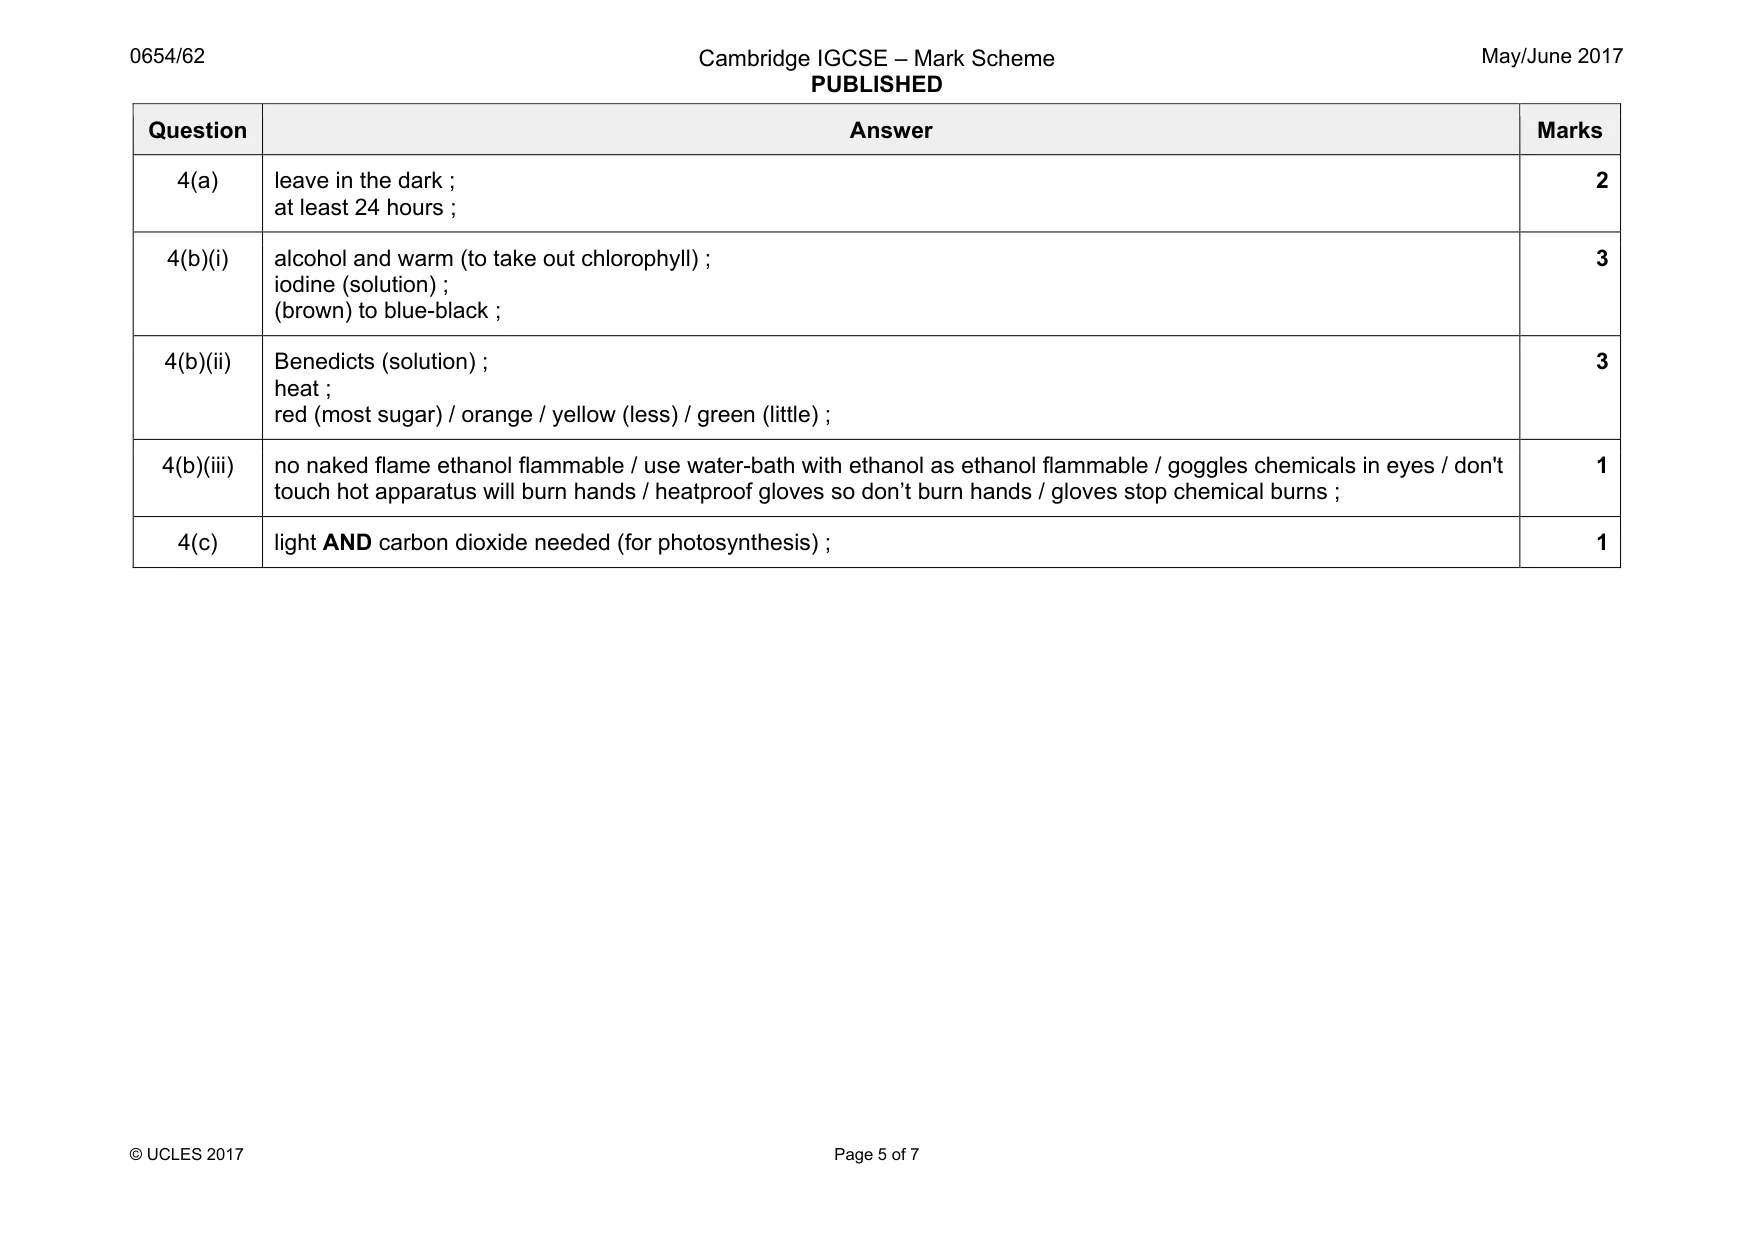
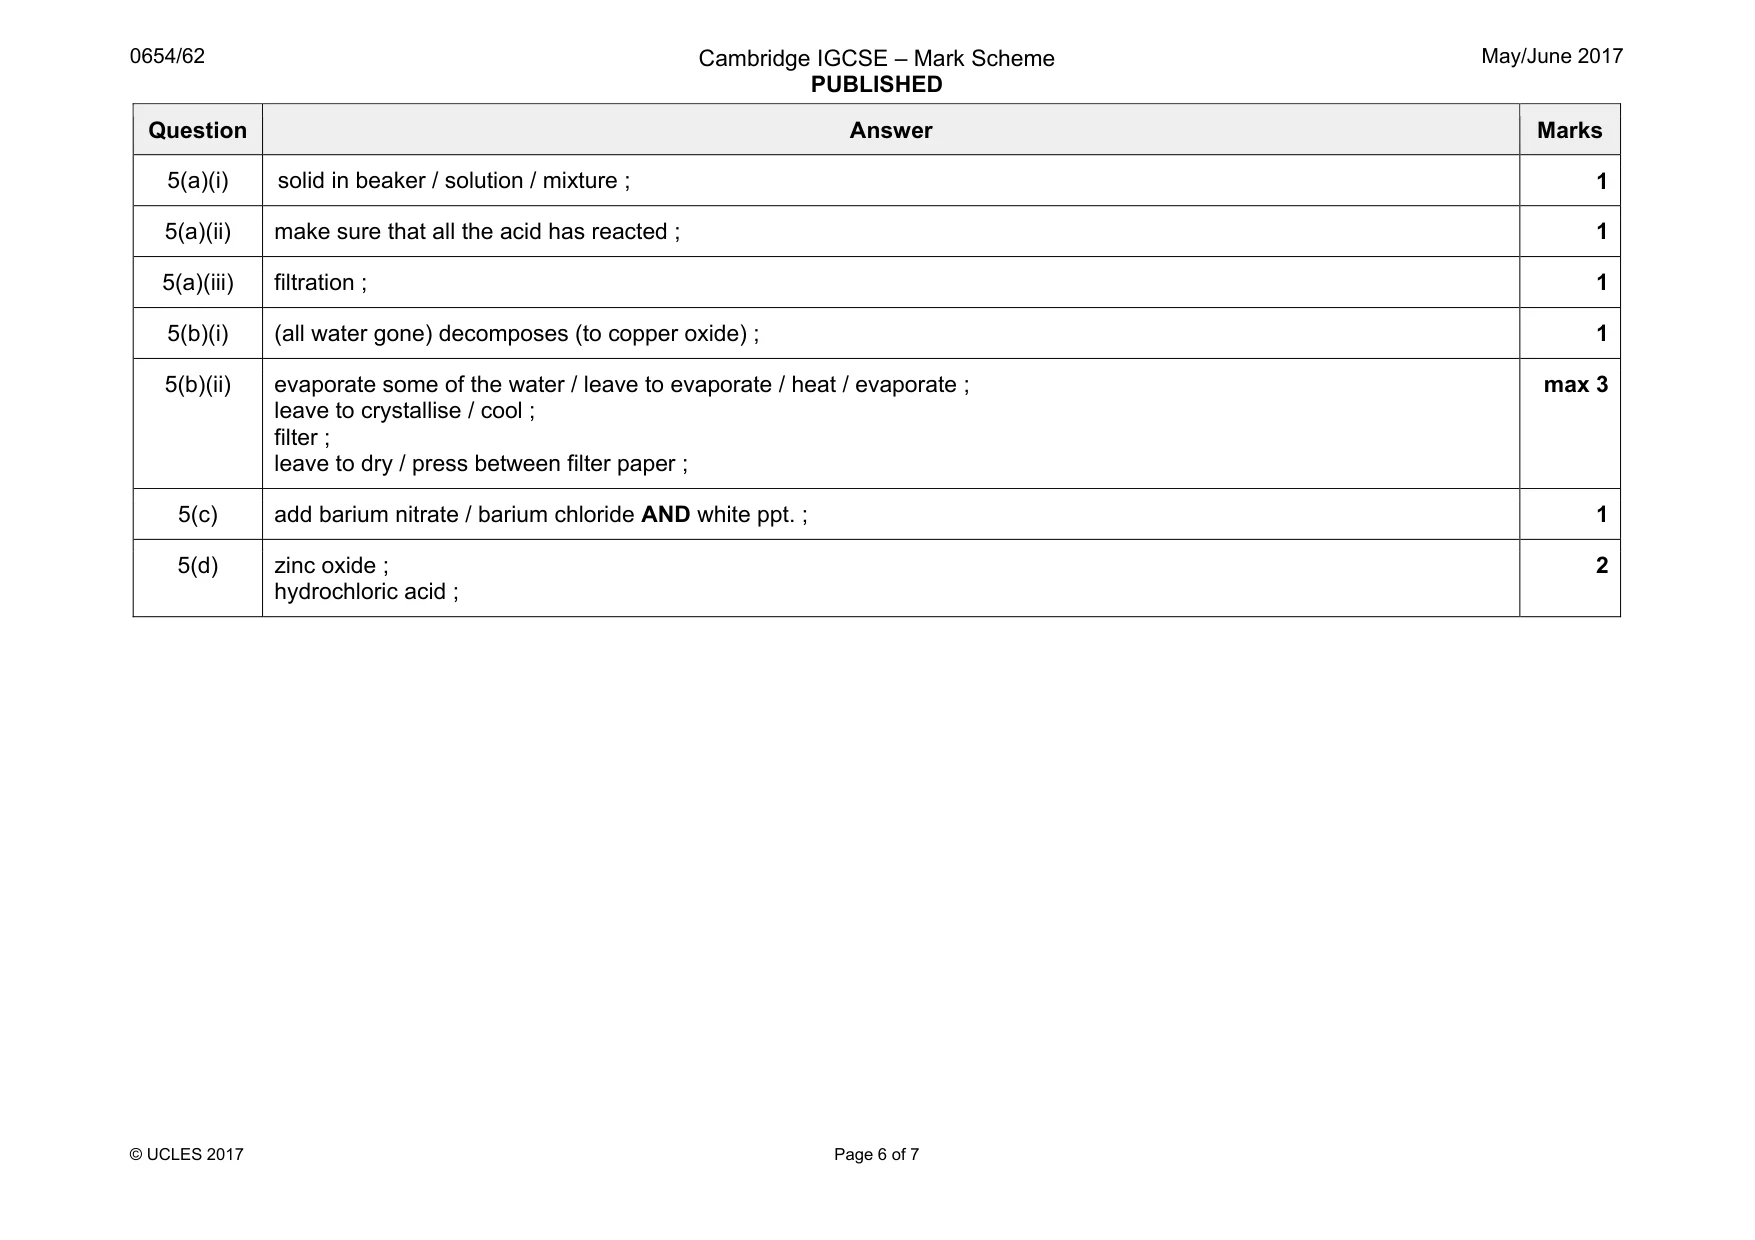
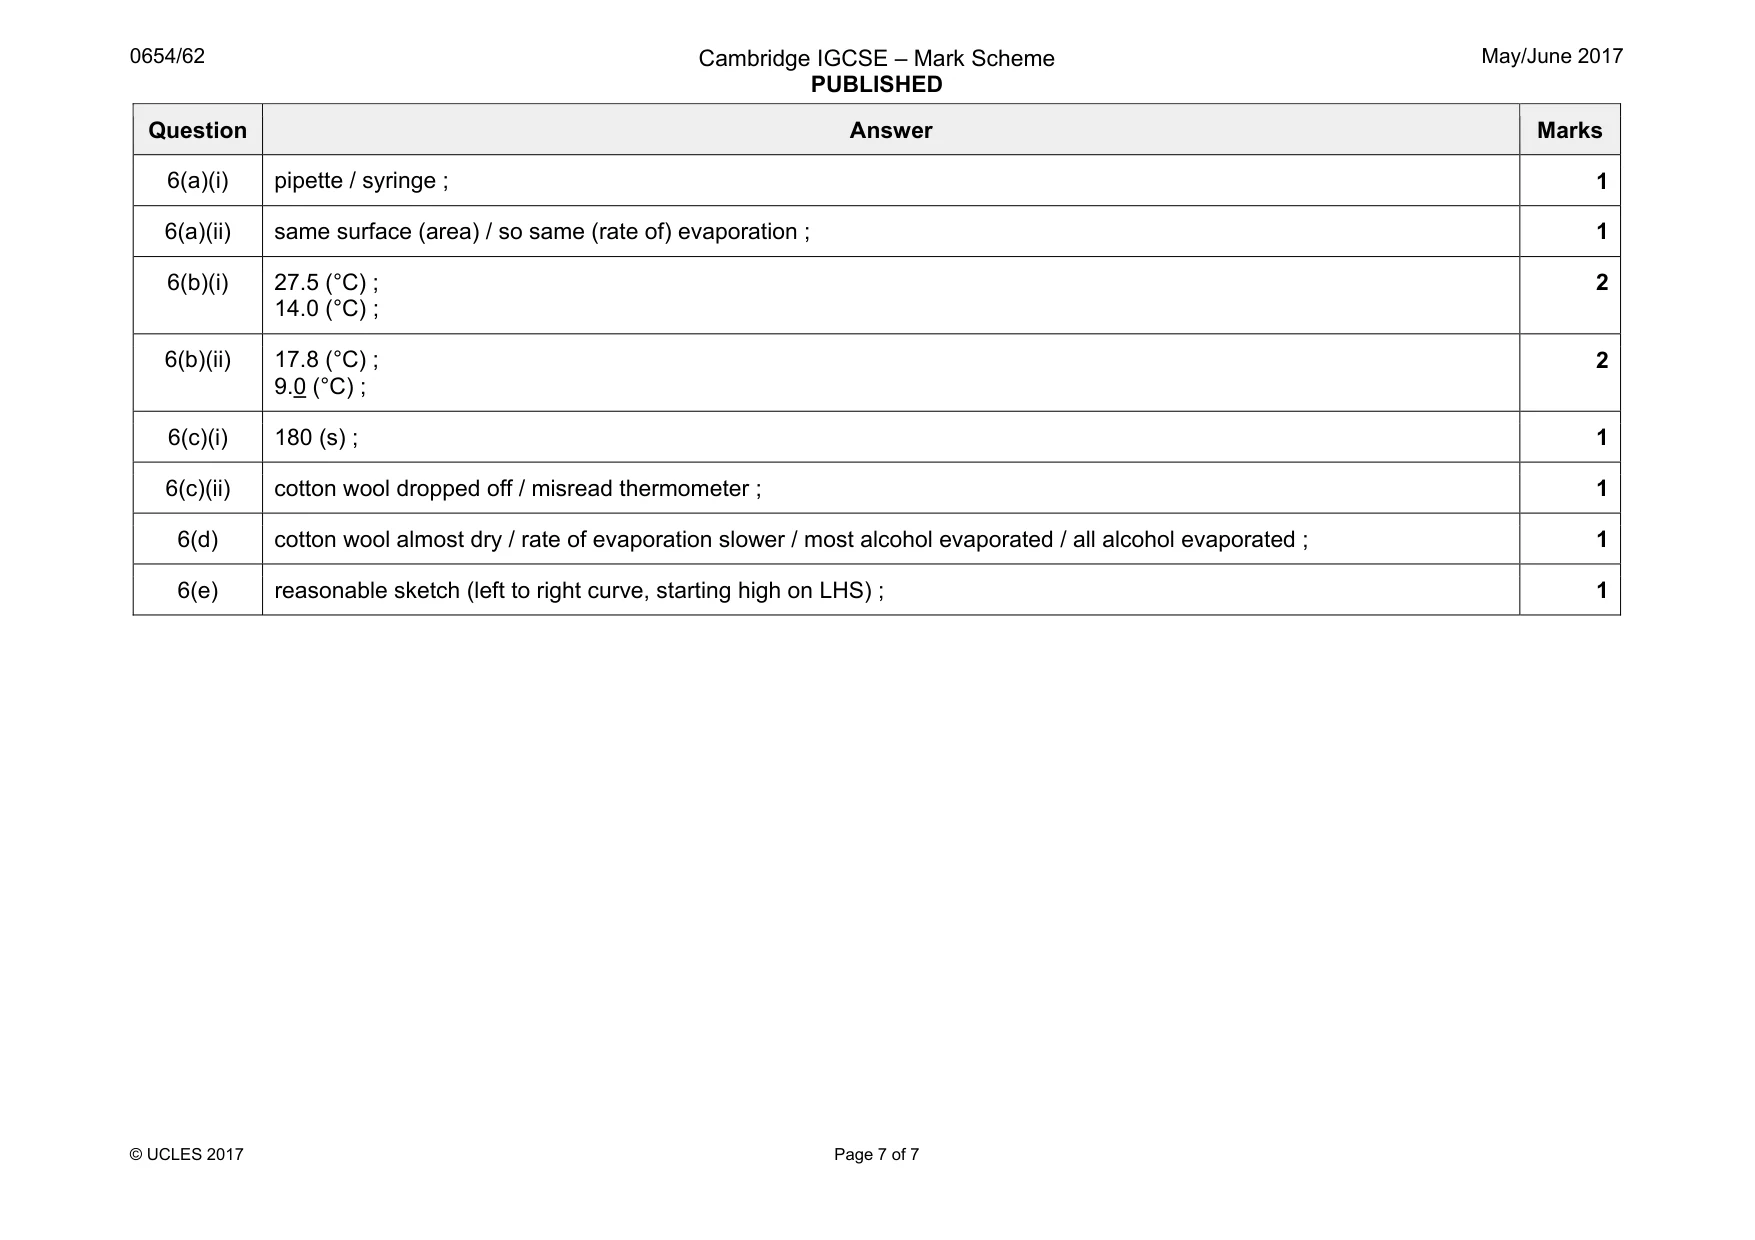
Mark scheme7 pages
Answers below. Sit the paper first if you are practising.
Questions as text
Q1 · A flower that has been cut in half lengthways
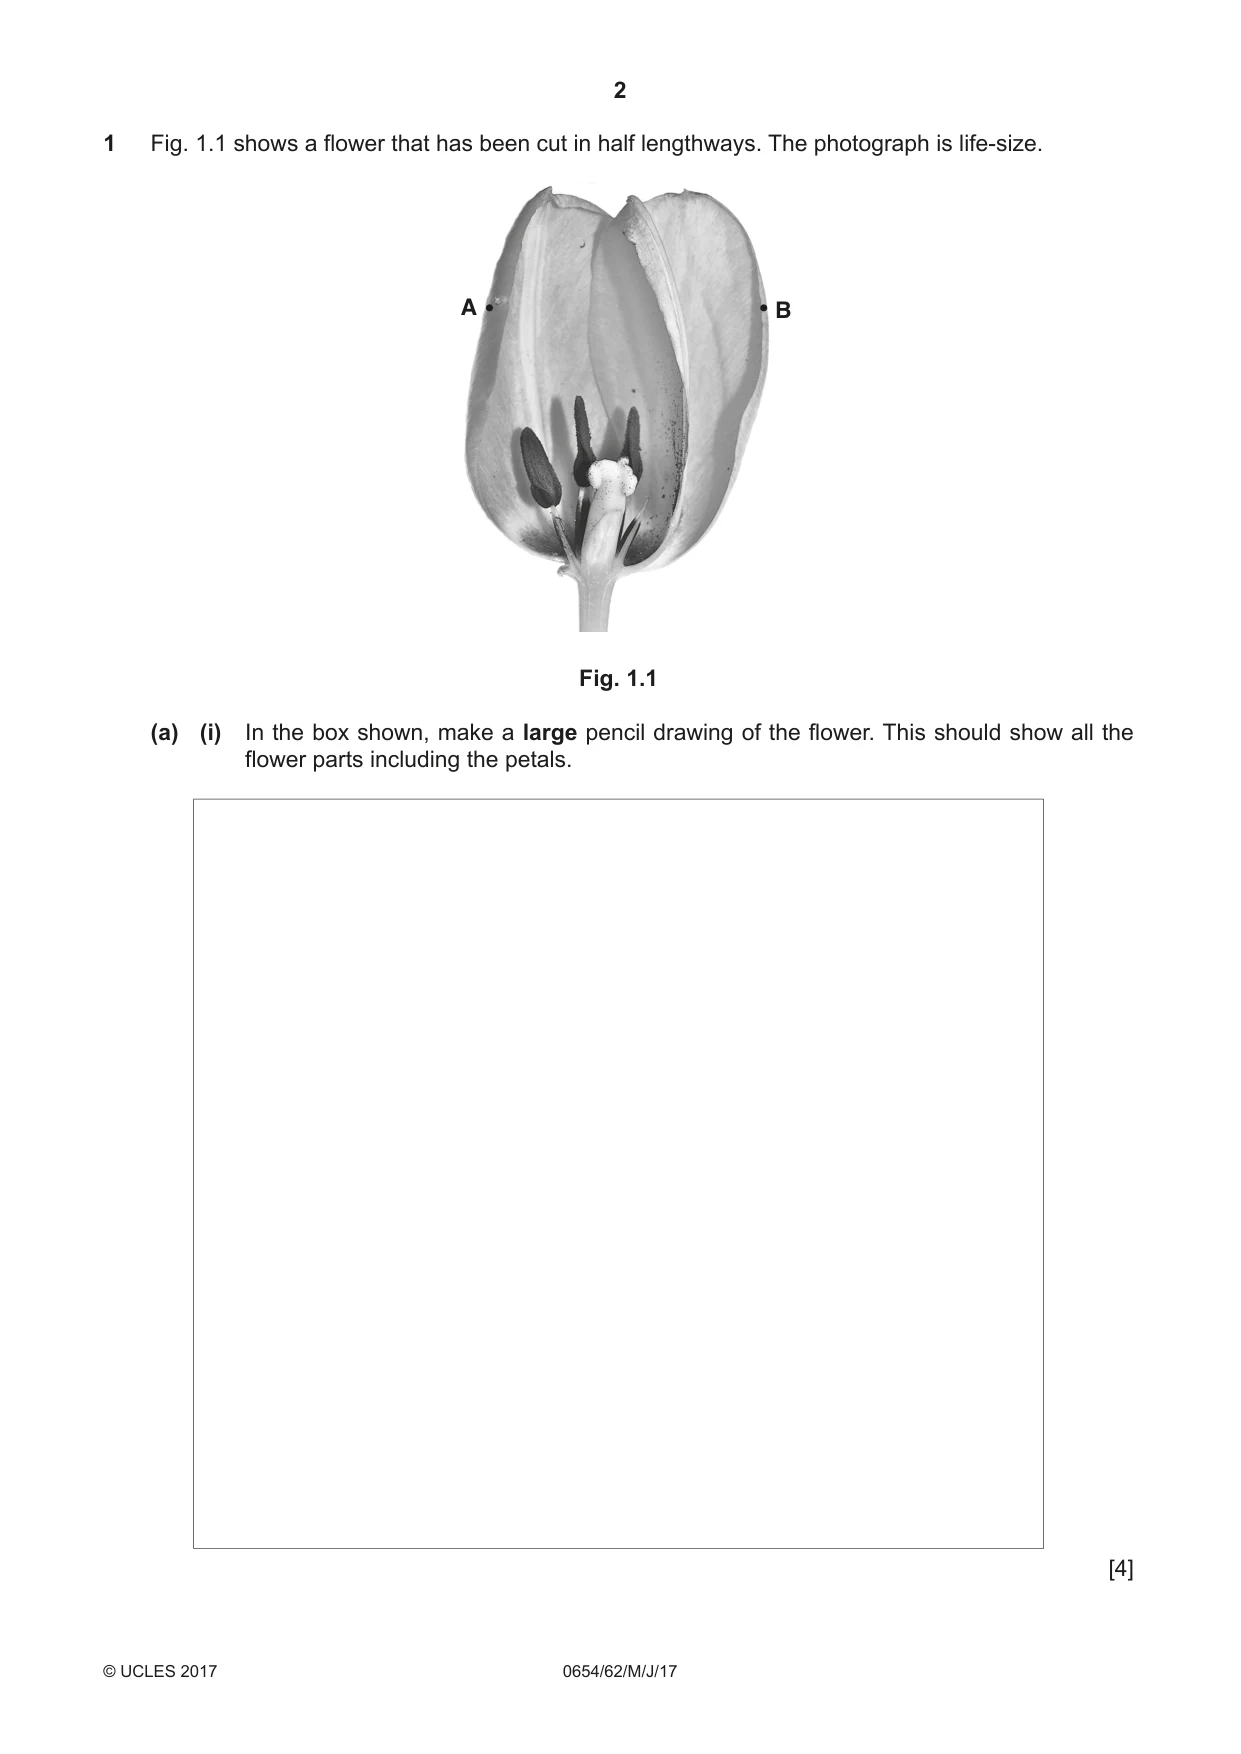
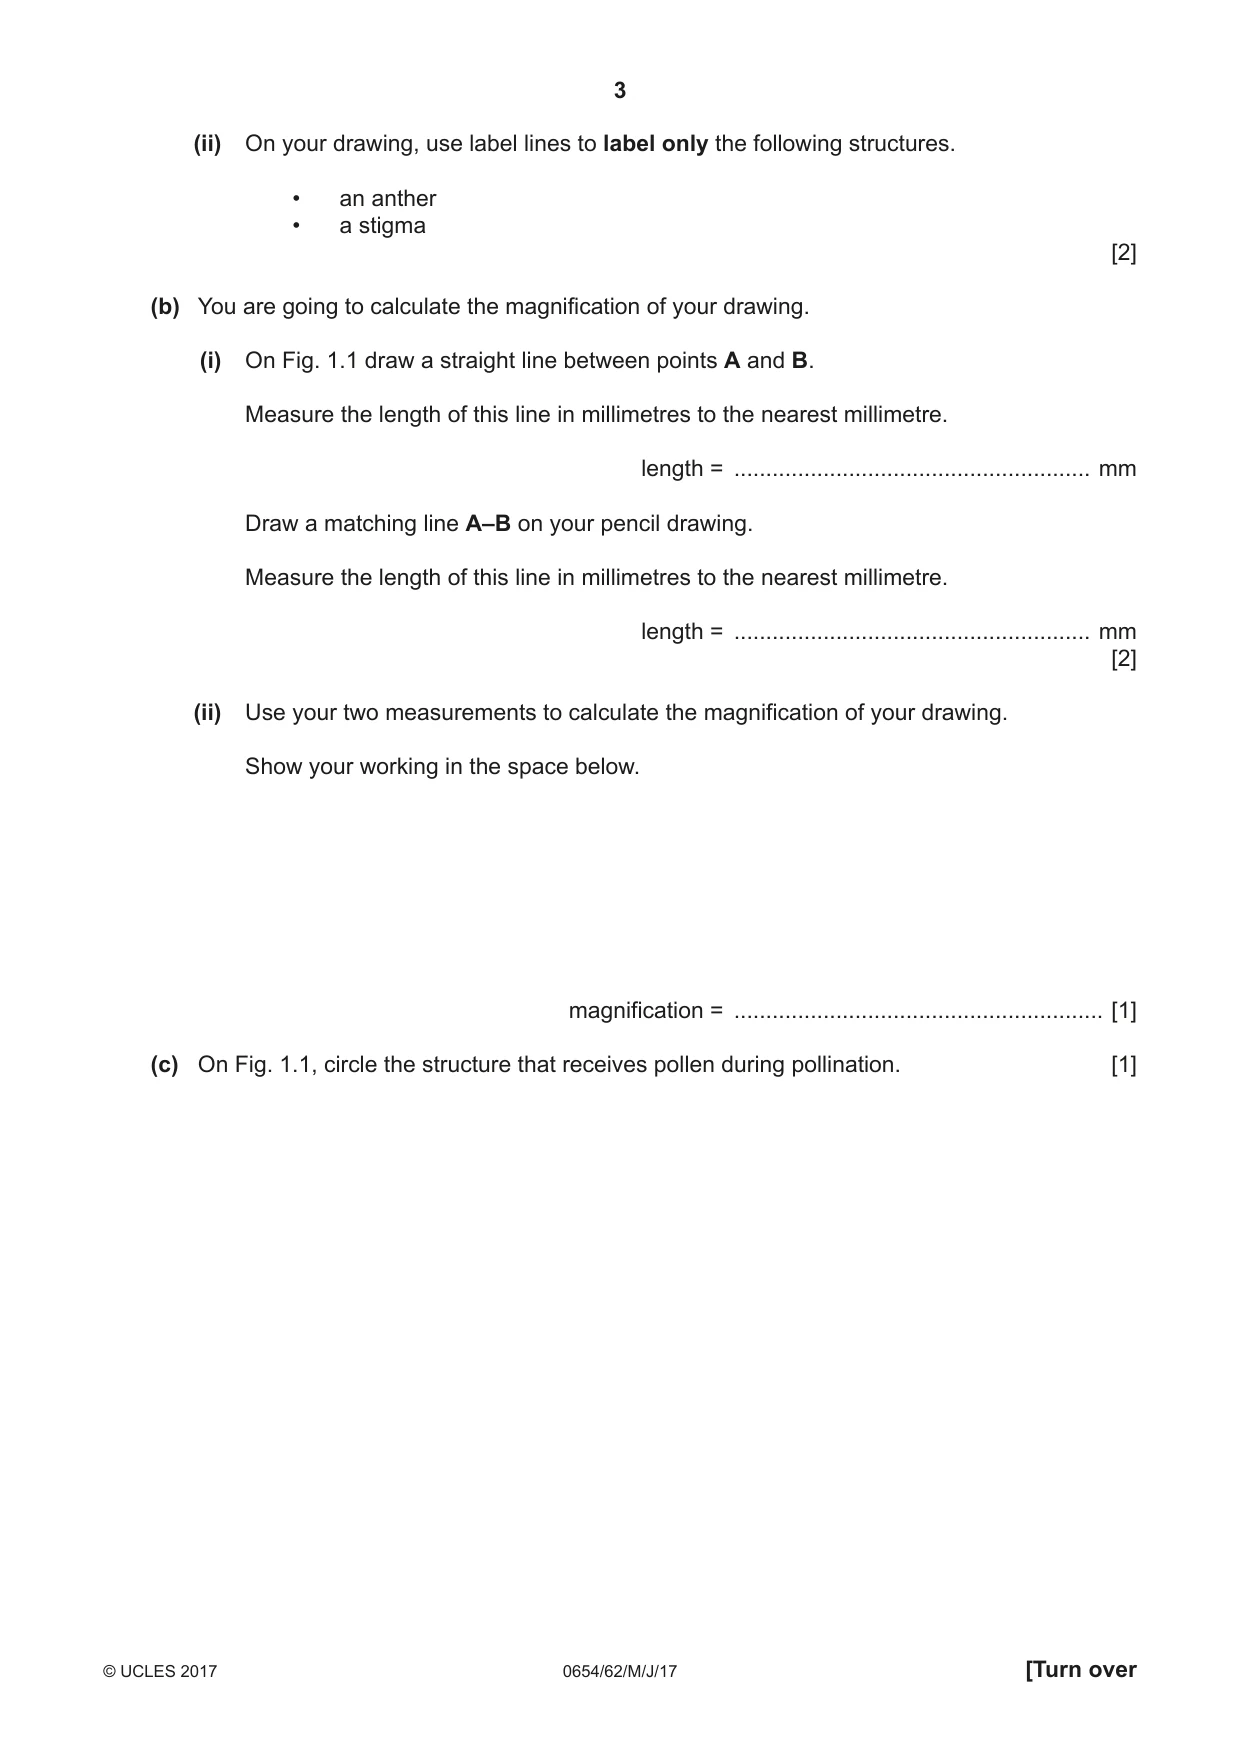
1 Fig. 1.1 shows a flower that has been cut in half lengthways. The photograph is life-size. A B Fig. 1.1 (a) (i) In the box shown, make a large pencil drawing of the flower. This should show all the flower parts including the petals. [4] (ii) On your drawing, use label lines to label only the following structures. • an anther • a stigma [2] (b) You are going to calculate the magnification of your drawing. (i) On Fig. 1.1 draw a straight line between points A and B. Measure the length of this line in millimetres to the nearest millimetre. length = ........................................................ mm Draw a matching line A–B on your pencil drawing. Measure the length of this line in millimetres to the nearest millimetre. length = ........................................................ mm [2] (ii) Use your two measurements to calculate the magnification of your drawing. Show your working in the space below. magnification = .......................................................... [1] (c) On Fig. 1.1, circle the structure that receives pollen during pollination. [1]
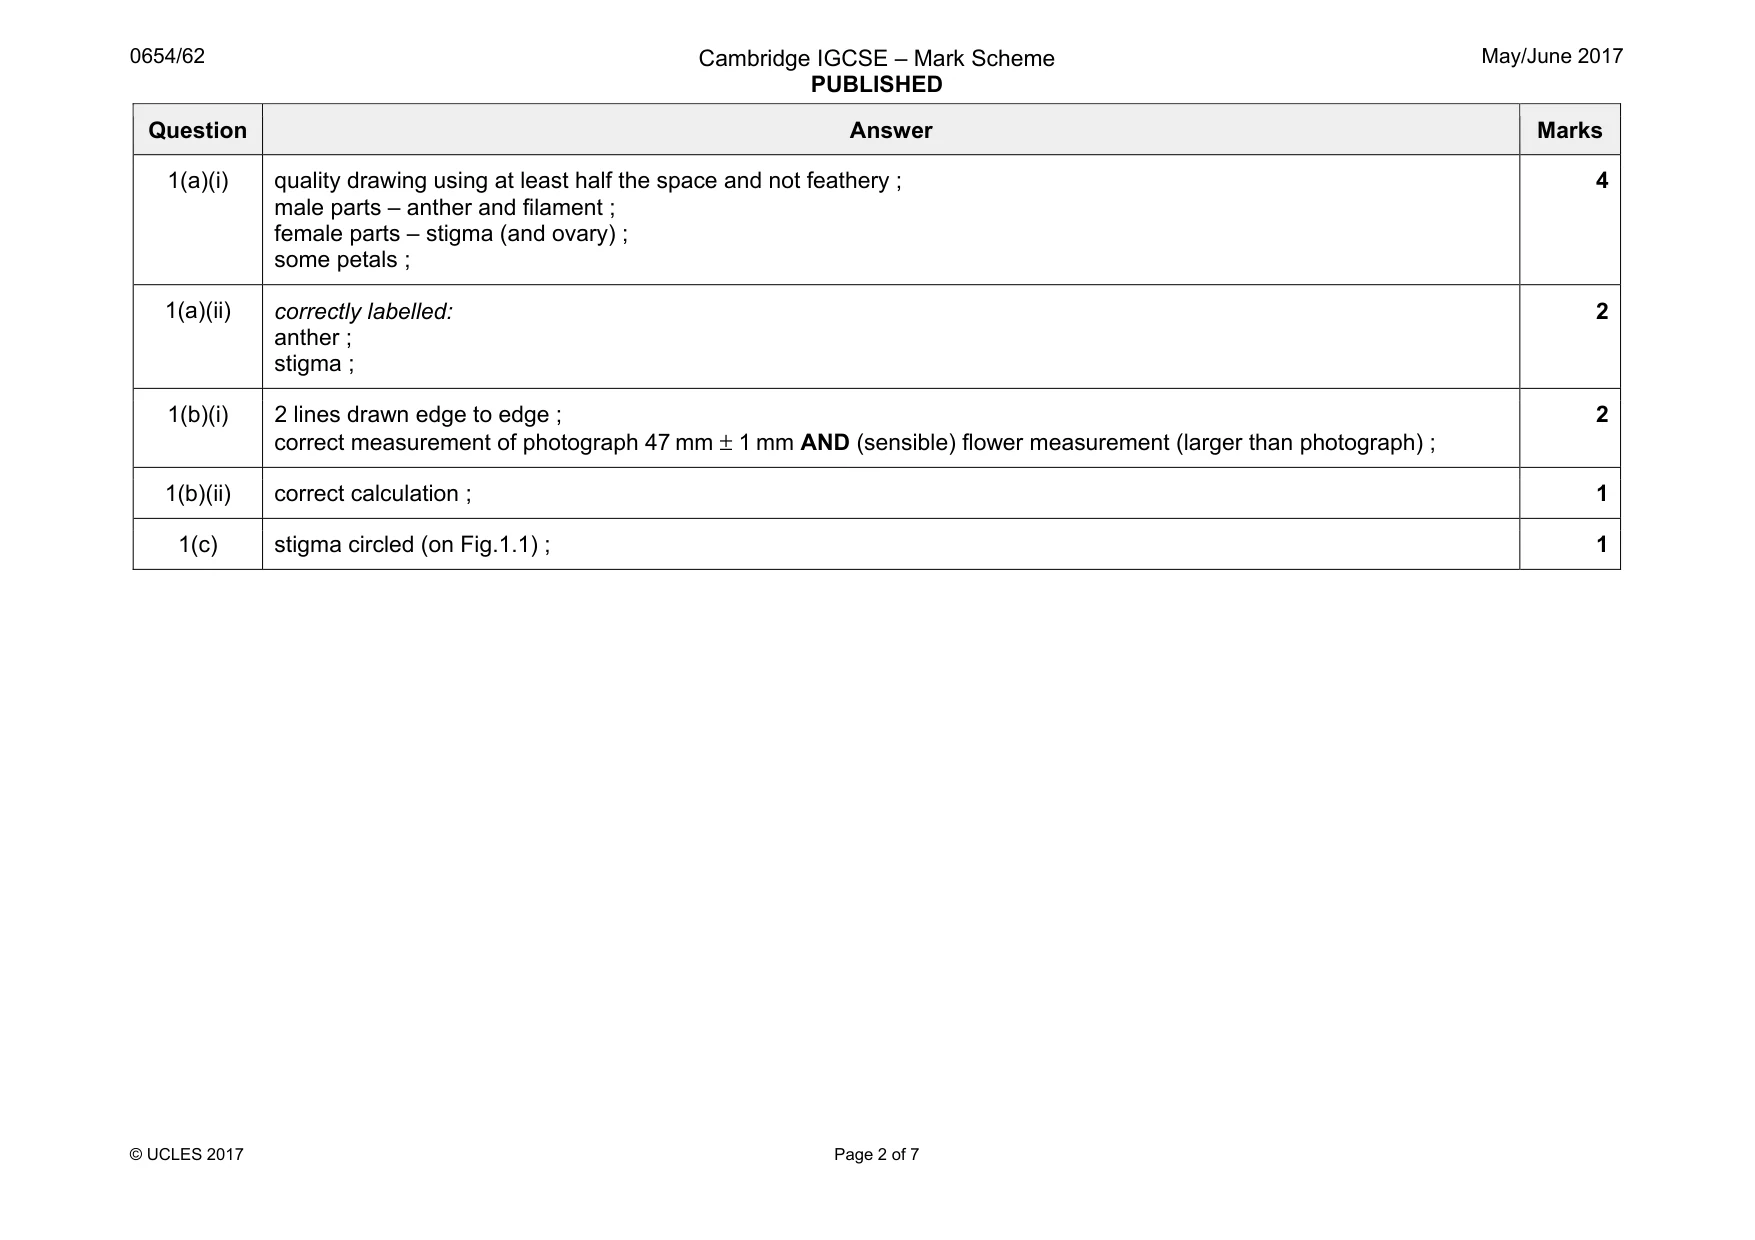
Mark scheme: 1(a)(i) quality drawing using at least half the space and not feathery ; male parts – anther and filament ; female parts – stigma (and ovary) ; some petals ; 4 1(a)(ii) correctly labelled: anther ; stigma ; 2 1(b)(i) 2 lines drawn edge to edge ; correct measurement of photograph 47 mm ± 1 mm AND (sensible) flower measurement (larger than photograph) ; 2 1(b)(ii) correct calculation ; 1 1(c) stigma circled (on Fig.1.1) ; 1
Q2 · A student investigates how the temperature of a reactant affects the rate of reaction…
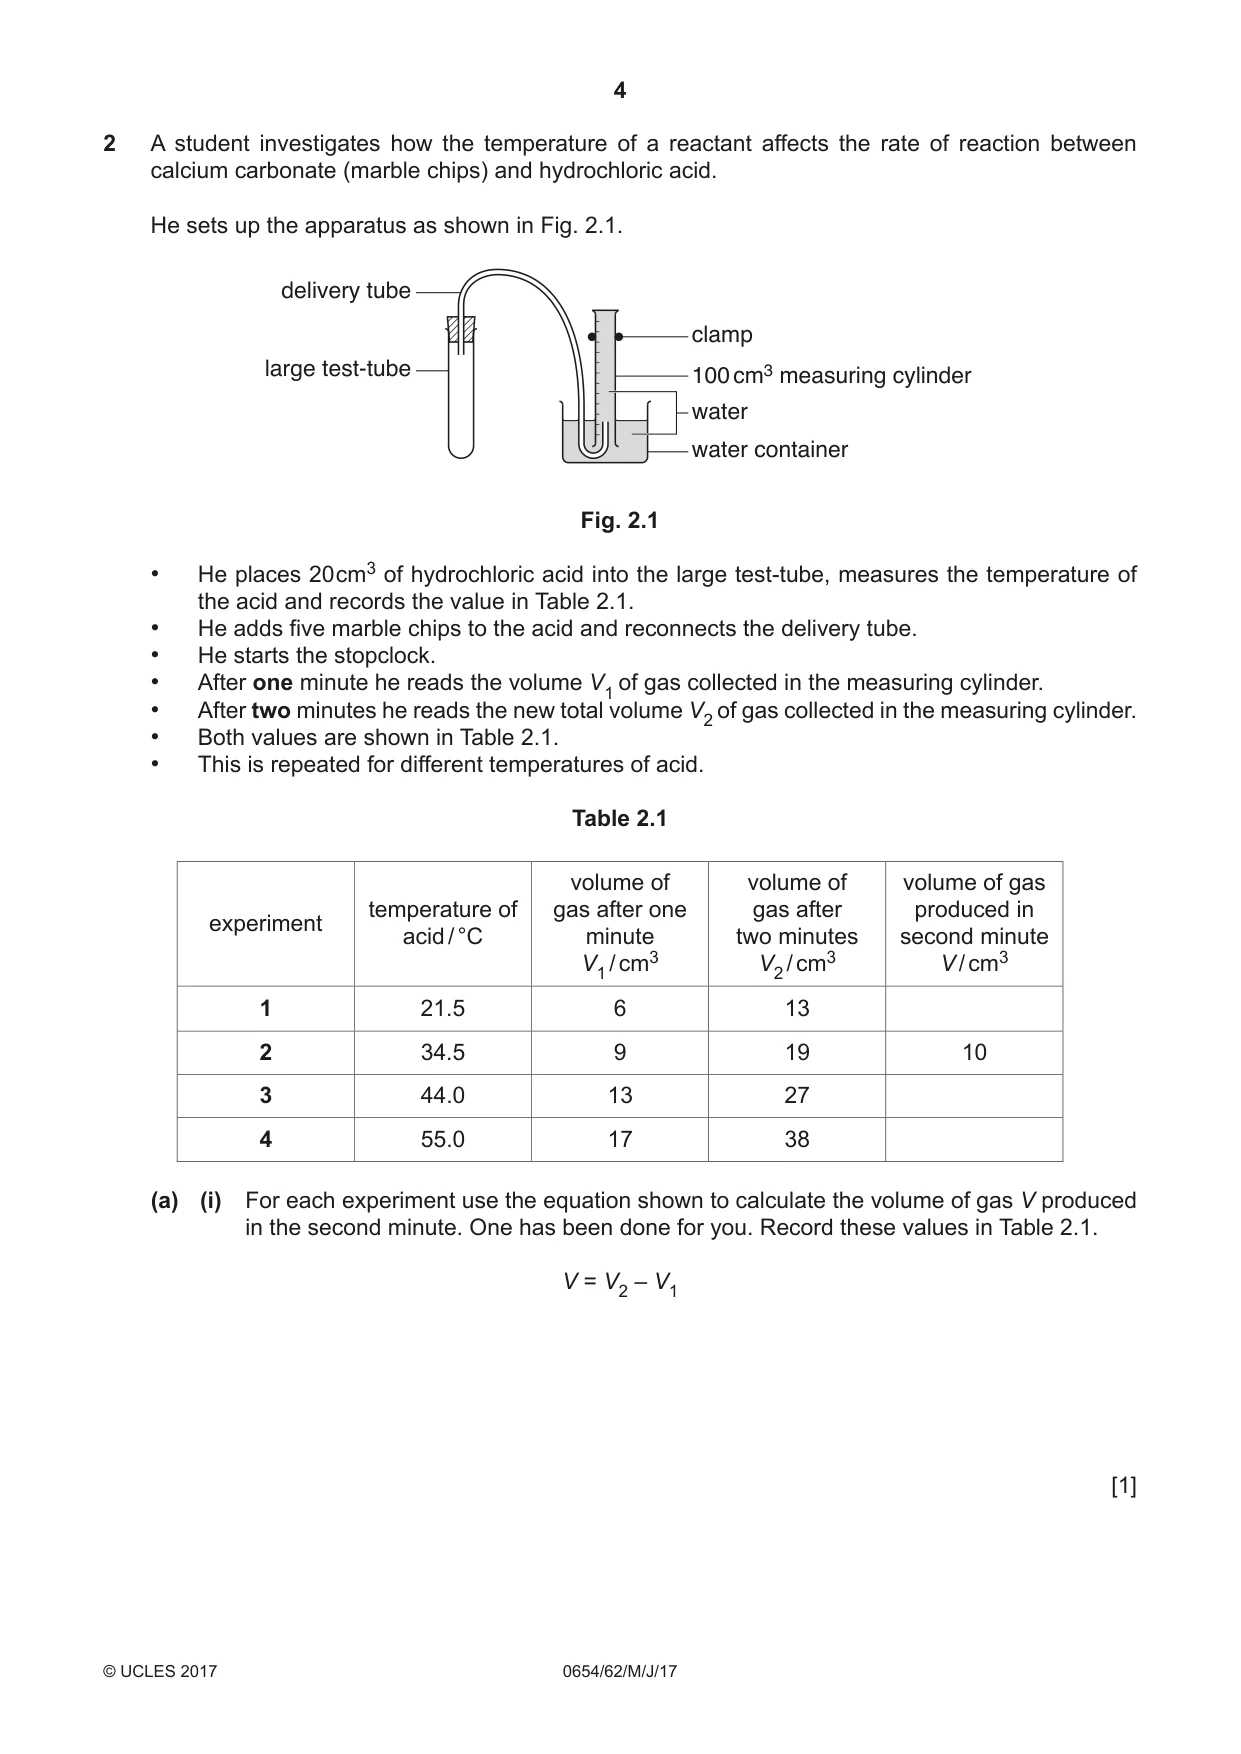
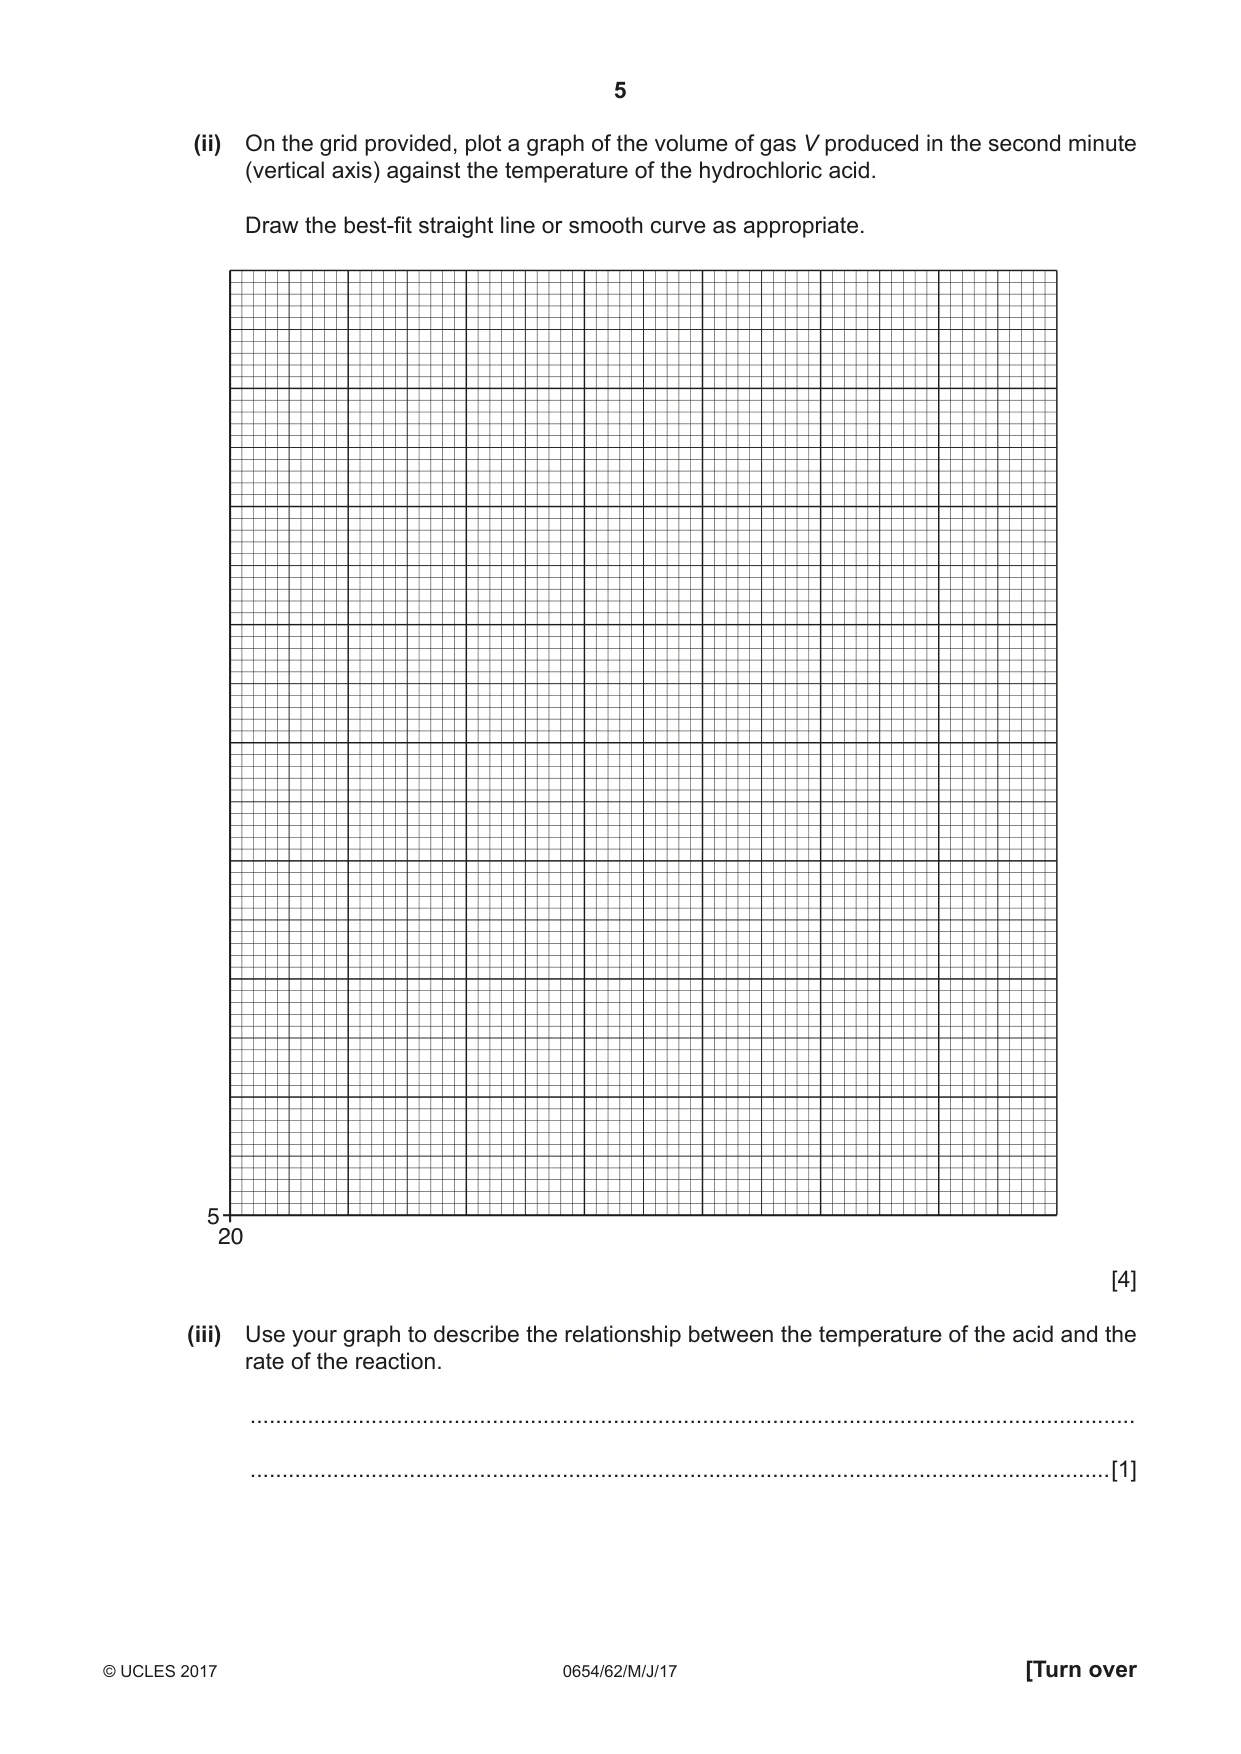
2 A student investigates how the temperature of a reactant affects the rate of reaction between calcium carbonate (marble chips) and hydrochloric acid. He sets up the apparatus as shown in Fig. 2.1. delivery tube clamp large test-tube 100 cm3 measuring cylinder water water container Fig. 2.1 • He places 20 cm3 of hydrochloric acid into the large test-tube, measures the temperature of the acid and records the value in Table 2.1. • He adds five marble chips to the acid and reconnects the delivery tube. • He starts the stopclock. • After one minute he reads the volume V1 of gas collected in the measuring cylinder. • After two minutes he reads the new total volume V2 of gas collected in the measuring cylinder. • Both values are shown in Table 2.1. • This is repeated for different temperatures of acid. Table 2.1 volume of volume of volume of gas temperature of gas after one gas after produced in experiment acid / °C minute two minutes second minute V1 / cm3 V2 / cm3 V / cm3 1 21.5 6 13 2 34.5 9 19 10 3 44.0 13 27 4 55.0 17 38 (a) (i) For each experiment use the equation shown to calculate the volume of gas V produced in the second minute. One has been done for you. Record these values in Table 2.1. V = V2 – V1 [1] (ii) On the grid provided, plot a graph of the volume of gas V produced in the second minute (vertical axis) against the temperature of the hydrochloric acid. Draw the best-fit straight line or smooth curve as appropriate. 5 20 [4] (iii) Use your graph to describe the relationship between the temperature of the acid and the rate of the reaction. ........................................................................................................................................... .......................................................................................................................................[1] (b) (i) Suggest one reason why it is more accurate to compare the volumes of gas produced in the second minute rather than in the first minute. ........................................................................................................................................... .......................................................................................................................................[1] (ii) Another student does not change the marble chips for each new temperature of acid. His results are significantly different from those of the first student. Suggest why this happens. ........................................................................................................................................... .......................................................................................................................................[1] (iii) Suggest an alternative method for measuring the rate of reaction between marble chips and acid. You may draw a labelled diagram but you must state what is being measured. ........................................................................................................................................... ........................................................................................................................................... ........................................................................................................................................... .......................................................................................................................................[2] Please turn over for Question 3.
Mark scheme: 2(a)(i) all values of V correct 7, (10), 14, 21 ; 1 2(a)(ii) axes labelled with units ; linear scales using at least half of grid in each direction ; at least three points plotted correctly within half a small square ; best straight line or best curve ; 4 2(a)(iii) the higher the temperature the higher the rate of the reaction ; 1 2(b)(i) removes timing error associated with starting the stopclock and connecting apparatus / could be too fast in first minute due to powder on chips / air in measuring cylinder ; 1 2(b)(ii) the surface area (of the chips) is reduced / reaction slowed by smaller chips ; 1 2(b)(iii) bubble into water ; count bubbles in a certain time / time for certain number of bubbles ; OR connect delivery tube to a gas syringe ; measure volume in a certain time / time for a certain volume ; OR place reaction flask on a balance ; measure mass in a certain time / time for certain drop in mass ; max 2
Q3 · A student measures the density of water by two different methods
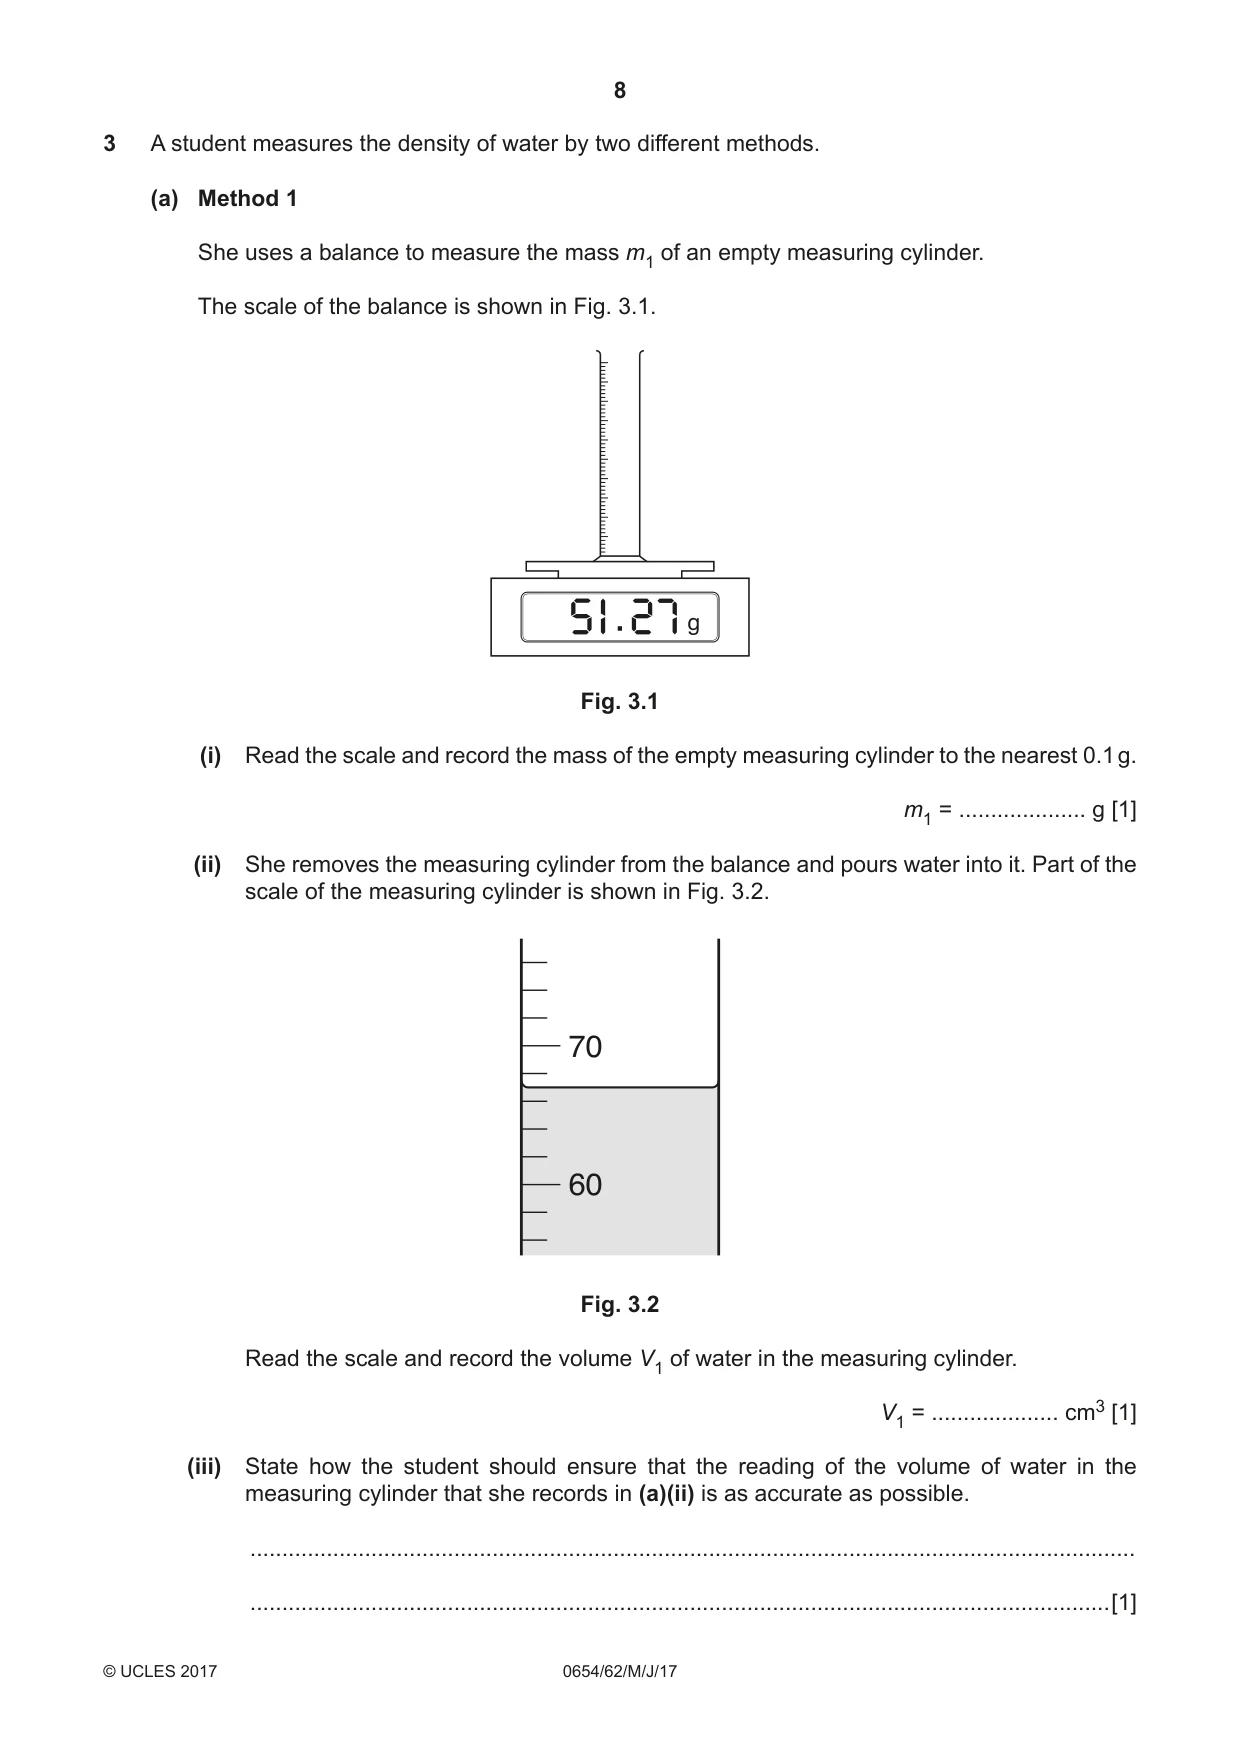
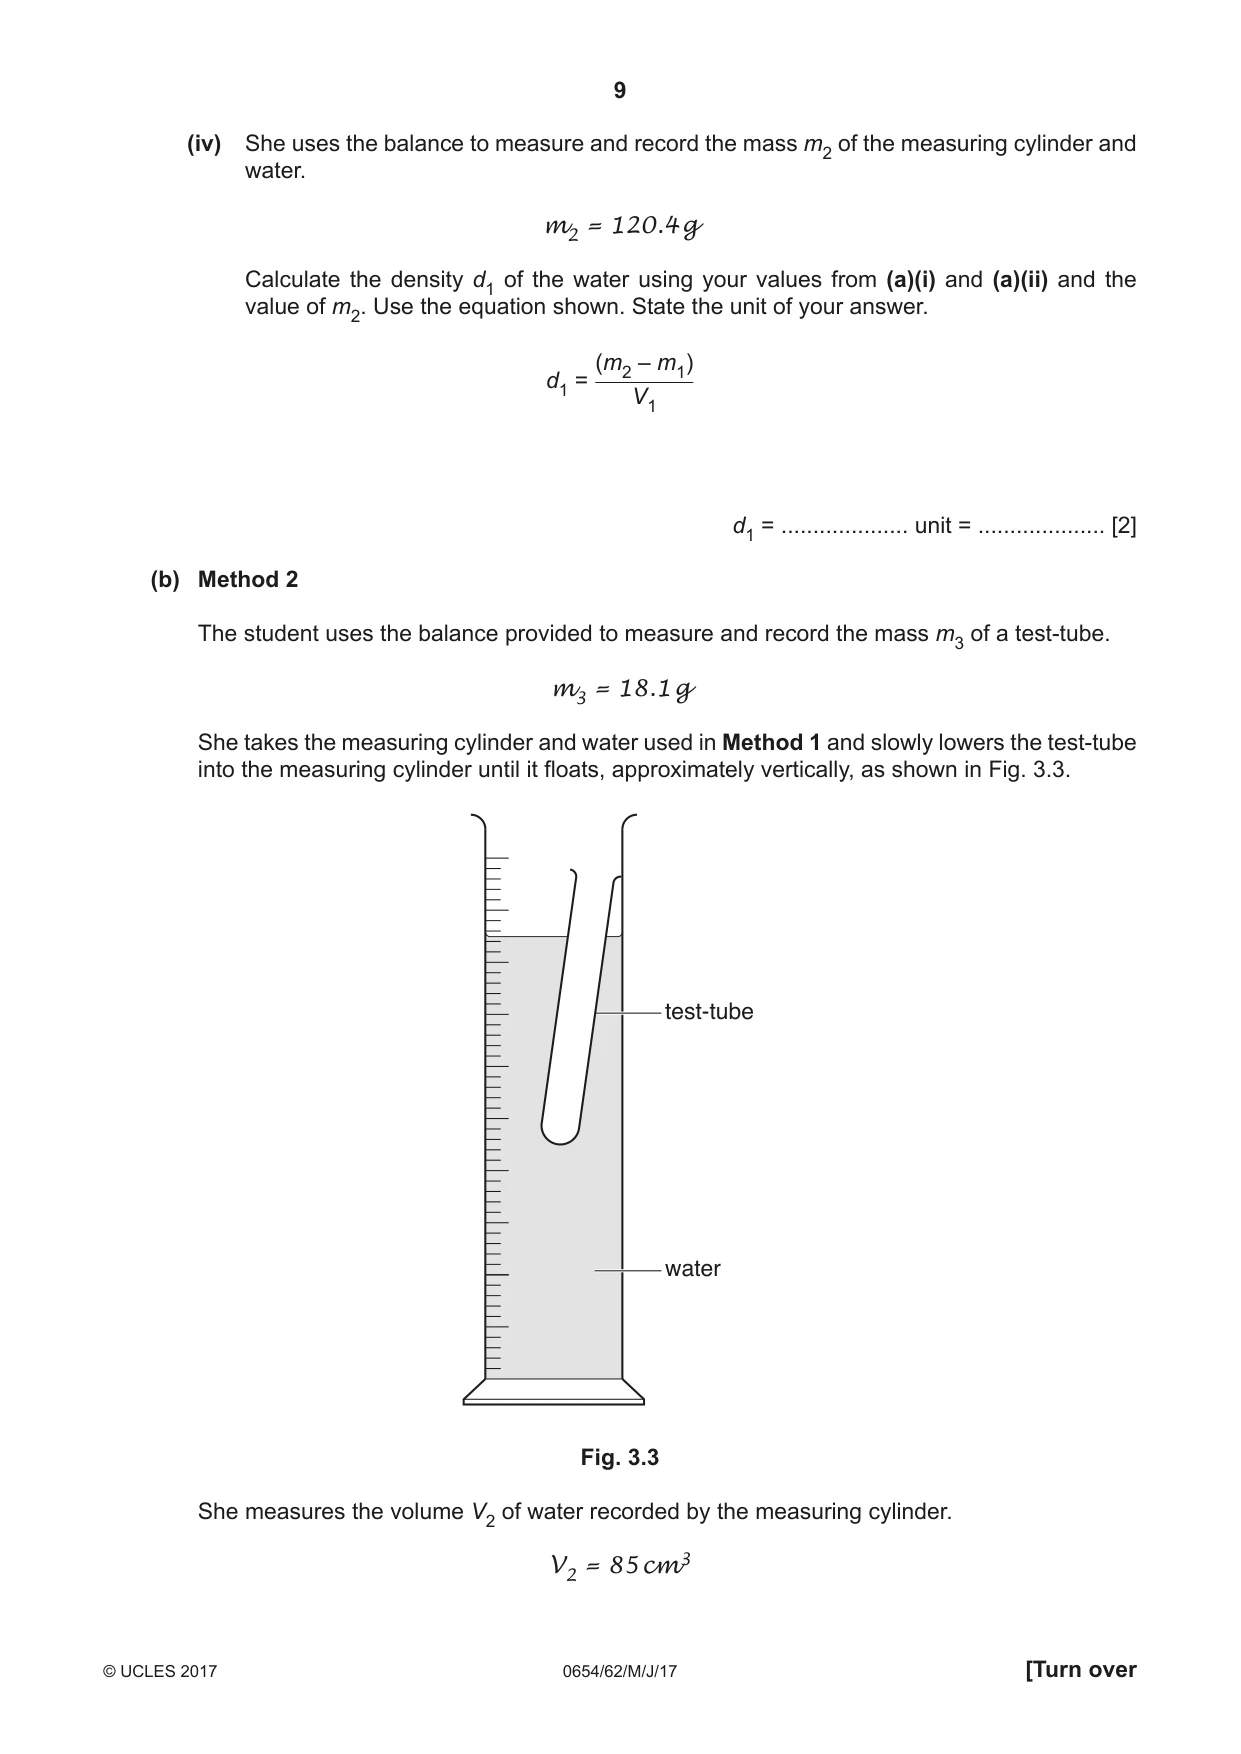
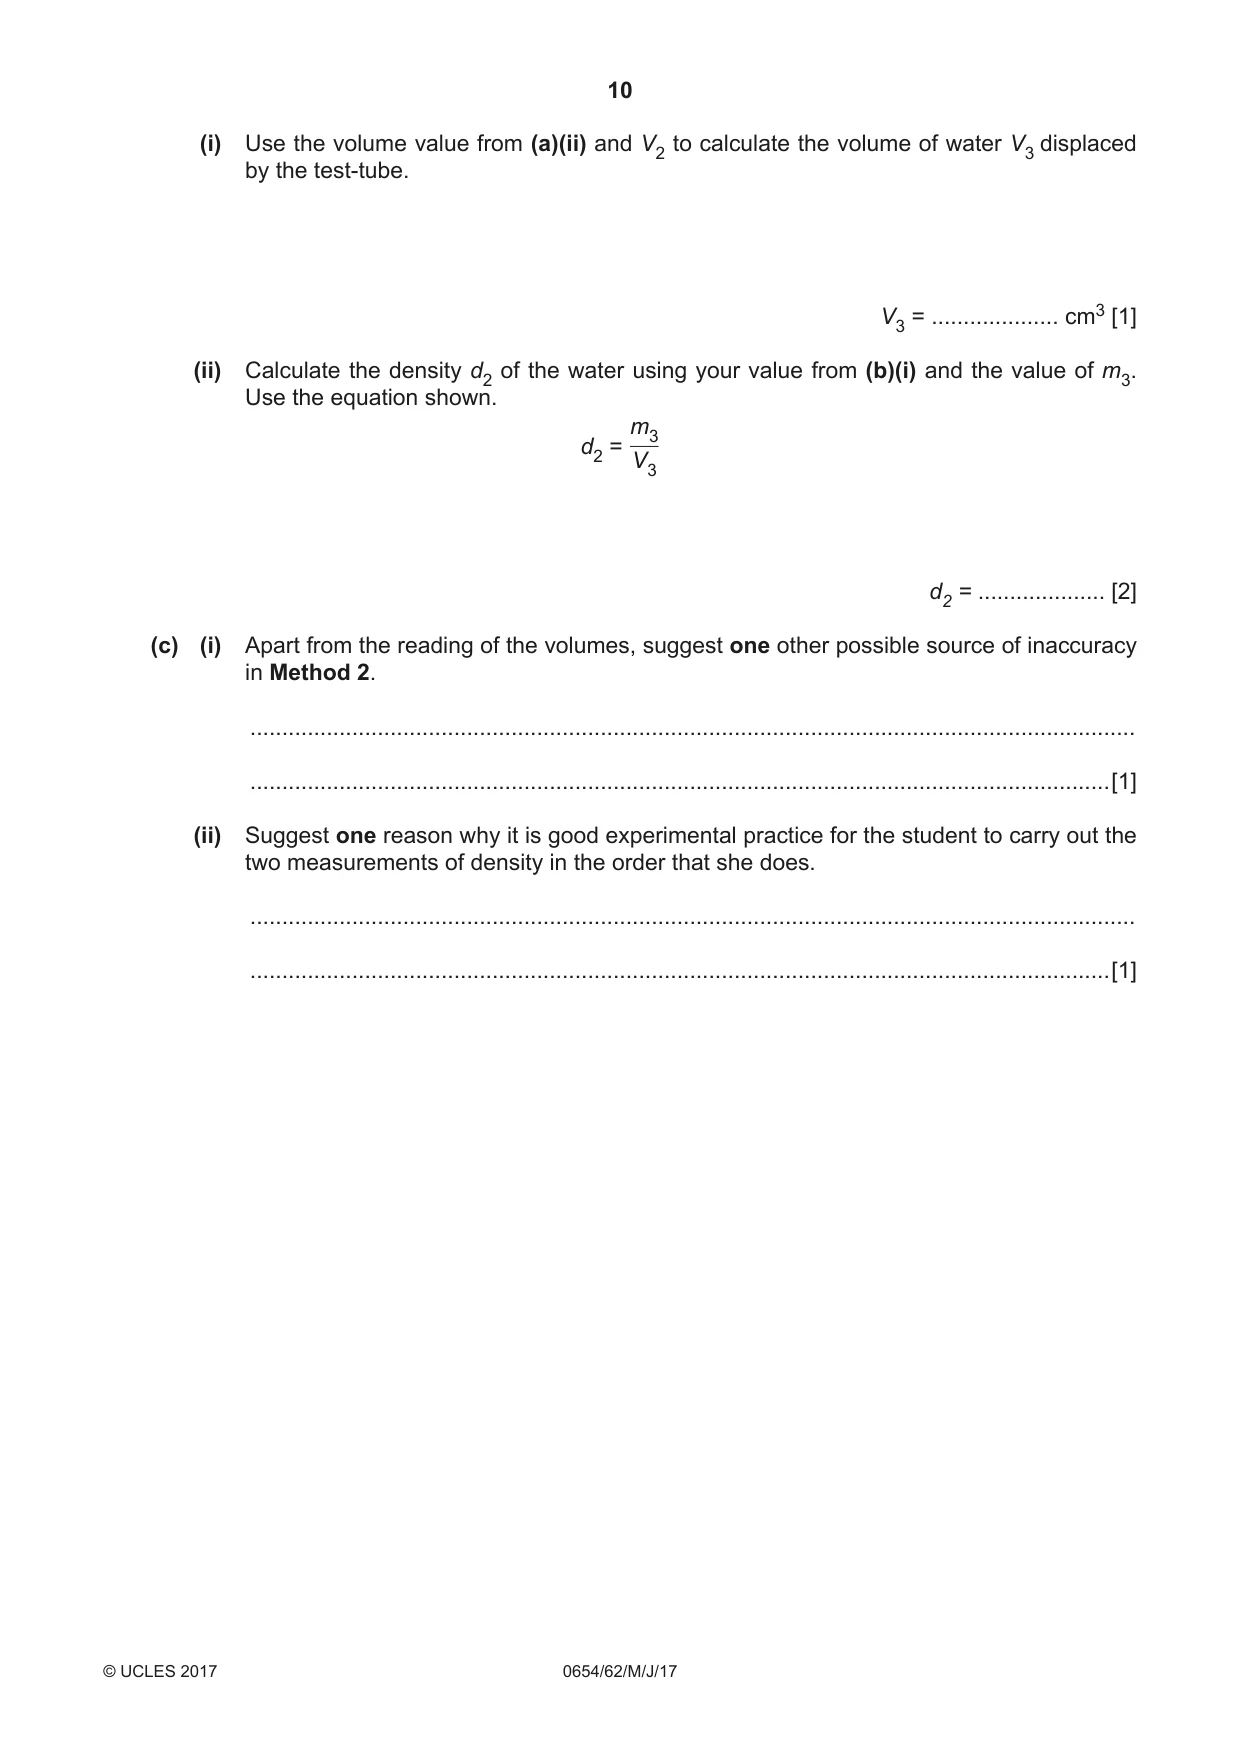
3 A student measures the density of water by two different methods. (a) Method 1 She uses a balance to measure the mass m1 of an empty measuring cylinder. The scale of the balance is shown in Fig. 3.1. g Fig. 3.1 (i) Read the scale and record the mass of the empty measuring cylinder to the nearest 0.1 g. m1 = .................... g [1] (ii) She removes the measuring cylinder from the balance and pours water into it. Part of the scale of the measuring cylinder is shown in Fig. 3.2. 70 60 Fig. 3.2 Read the scale and record the volume V1 of water in the measuring cylinder. V1 = .................... cm3 [1] (iii) State how the student should ensure that the reading of the volume of water in the measuring cylinder that she records in (a)(ii) is as accurate as possible. ........................................................................................................................................... .......................................................................................................................................[1] (iv) She uses the balance to measure and record the mass m2 of the measuring cylinder and water. m2 = 120.4 g Calculate the density d1 of the water using your values from (a)(i) and (a)(ii) and the value of m2. Use the equation shown. State the unit of your answer. (m2 – m1) d1 = V1 d1 = .................... unit = .................... [2] (b) Method 2 The student uses the balance provided to measure and record the mass m3 of a test-tube. m3 = 18.1 g She takes the measuring cylinder and water used in Method 1 and slowly lowers the test-tube into the measuring cylinder until it floats, approximately vertically, as shown in Fig. 3.3. test-tube water Fig. 3.3 She measures the volume V2 of water recorded by the measuring cylinder. V2 = 85 cm3 (i) Use the volume value from (a)(ii) and V2 to calculate the volume of water V3 displaced by the test-tube. V3 = .................... cm3 [1] (ii) Calculate the density d2 of the water using your value from (b)(i) and the value of m3. Use the equation shown. m3 d2 = V3 d2 = .................... [2] (c) (i) Apart from the reading of the volumes, suggest one other possible source of inaccuracy in Method 2. ........................................................................................................................................... .......................................................................................................................................[1] (ii) Suggest one reason why it is good experimental practice for the student to carry out the two measurements of density in the order that she does. ........................................................................................................................................... .......................................................................................................................................[1] Please turn over for Question 4.
Mark scheme: 3(a)(i) 51.3 (g) ; 1 3(a)(ii) 67 (cm3) ; 1 3(a)(iii) read to bottom of meniscus / take reading at eye level / perpendicular to scale ; 1 3(a)(iv) 1.03 ; g / cm3 ; 2 3(b)(i) 18 (cm3) ; 1 3(b)(ii) ( 18.1 (b)(i) ) 1.0 / 1.01 (g / cm3) ; 2 or 3 significant figures ; 2 3(c)(i) zero error on balance / test-tube touching side of cylinder ; 1 3(c)(ii) measuring cylinder otherwise wet / contains some water when its ‘dry’ mass is measured ; 1
Q4 · A student investigates the starch and sugar content of plants using four similar shoots
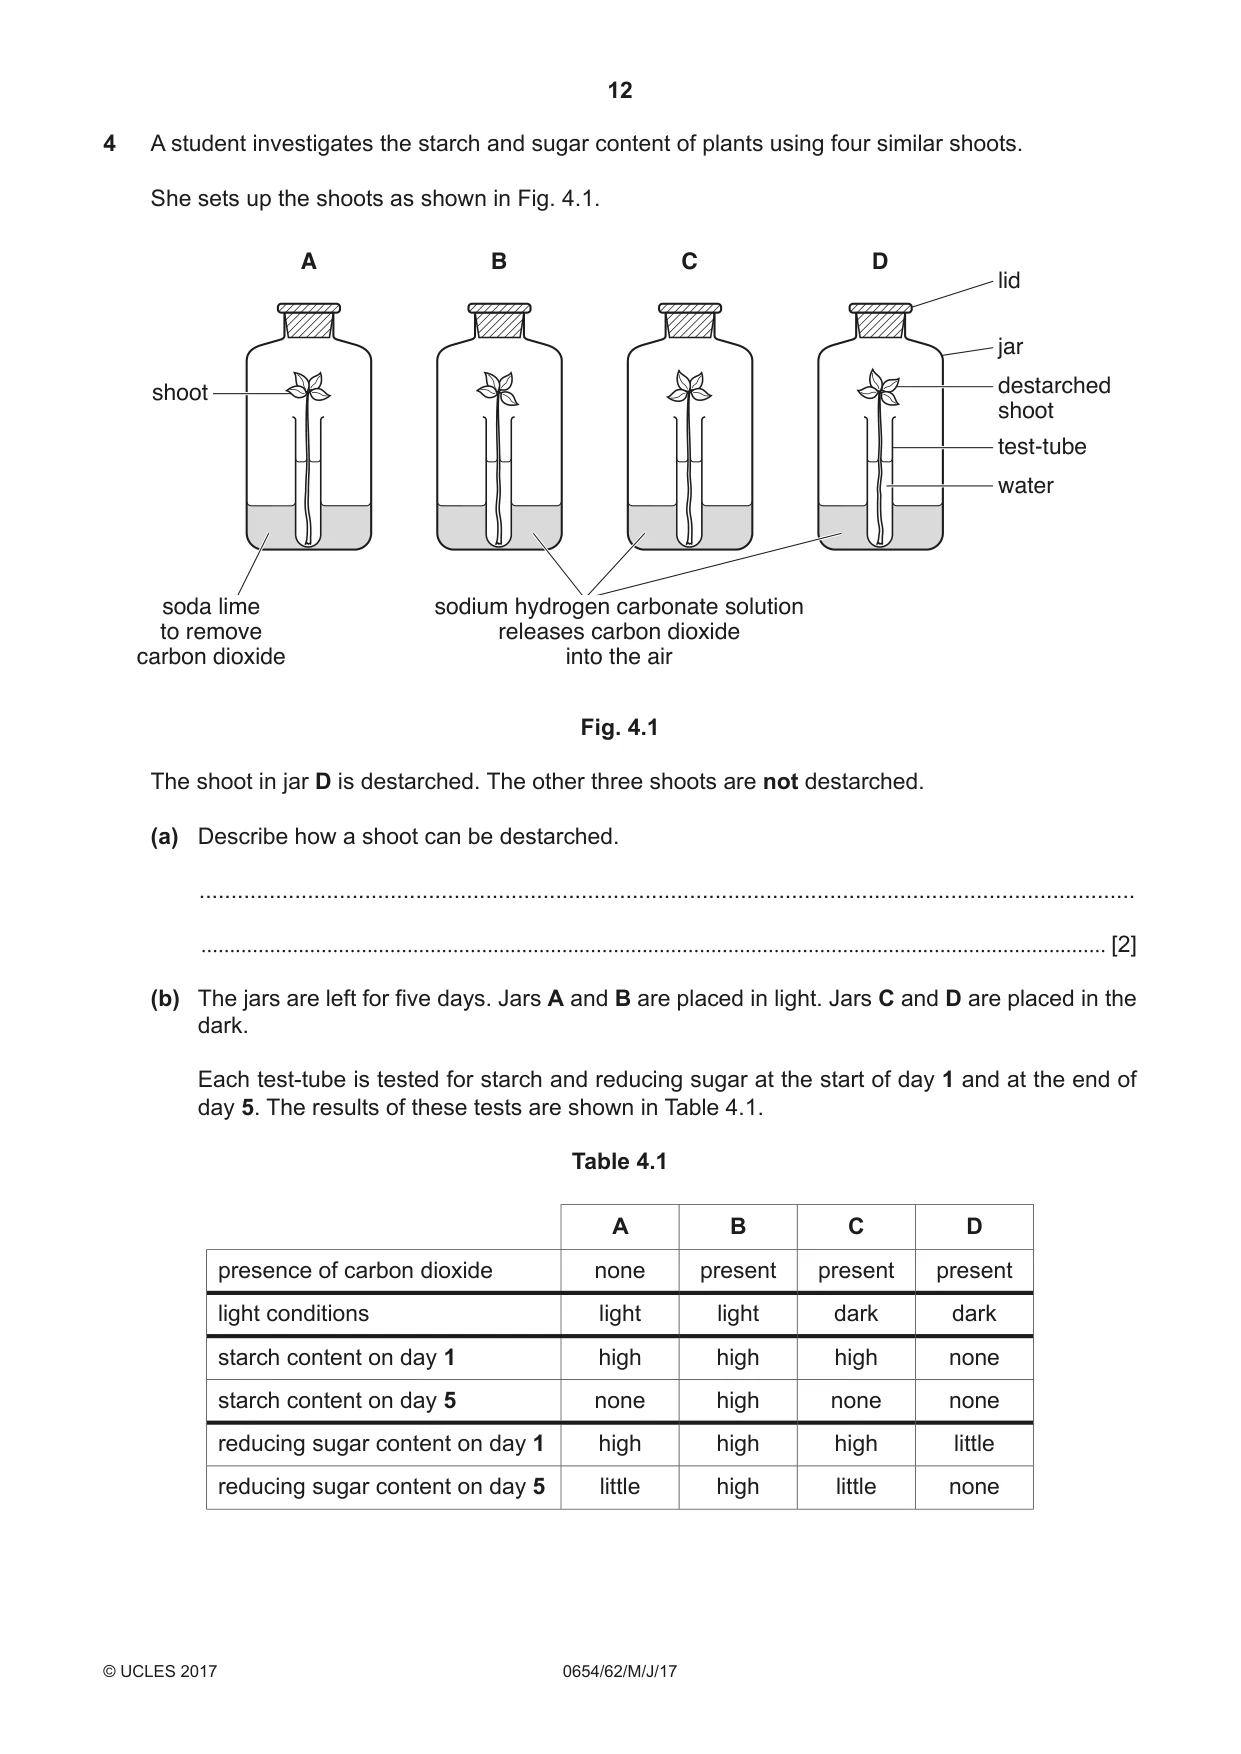
4 A student investigates the starch and sugar content of plants using four similar shoots. She sets up the shoots as shown in Fig. 4.1. A B C D lid jar destarched shoot shoot test-tube water soda lime sodium hydrogen carbonate solution to remove releases carbon dioxide carbon dioxide into the air Fig. 4.1 The shoot in jar D is destarched. The other three shoots are not destarched. (a) Describe how a shoot can be destarched. ................................................................................................................................................... .............................................................................................................................................................. [2] (b) The jars are left for five days. Jars A and B are placed in light. Jars C and D are placed in the dark. Each test-tube is tested for starch and reducing sugar at the start of day 1 and at the end of day 5. The results of these tests are shown in Table 4.1. Table 4.1 A B C D presence of carbon dioxide none present present present light conditions light light dark dark starch content on day 1 high high high none starch content on day 5 none high none none reducing sugar content on day 1 high high high little reducing sugar content on day 5 little high little none (i) Describe how the student can test a leaf for starch. Include the observation for a positive result. ........................................................................................................................................... ........................................................................................................................................... ........................................................................................................................................... .......................................................................................................................................[3] (ii) Describe how the student can test for reducing sugar. Include the observation for a positive result. ........................................................................................................................................................... ........................................................................................................................................................... ........................................................................................................................................................... ...................................................................................................................................................... [3] (iii) State and explain one important safety precaution that the student should take in either of the above tests. .......................................................................................................................................[1] (c) Use the results in Table 4.1 to state what the student can conclude from her investigation. ................................................................................................................................................... ...............................................................................................................................................[1]
Mark scheme: 4(a) leave in the dark ; at least 24 hours ; 2 4(b)(i) alcohol and warm (to take out chlorophyll) ; iodine (solution) ; (brown) to blue-black ; 3 4(b)(ii) Benedicts (solution) ; heat ; red (most sugar) / orange / yellow (less) / green (little) ; 3 4(b)(iii) no naked flame ethanol flammable / use water-bath with ethanol as ethanol flammable / goggles chemicals in eyes / don't touch hot apparatus will burn hands / heatproof gloves so don’t burn hands / gloves stop chemical burns ; 1 4(c) light AND carbon dioxide needed (for photosynthesis) ; 1
Q5 · A student prepares some pure blue crystals of copper sulfate
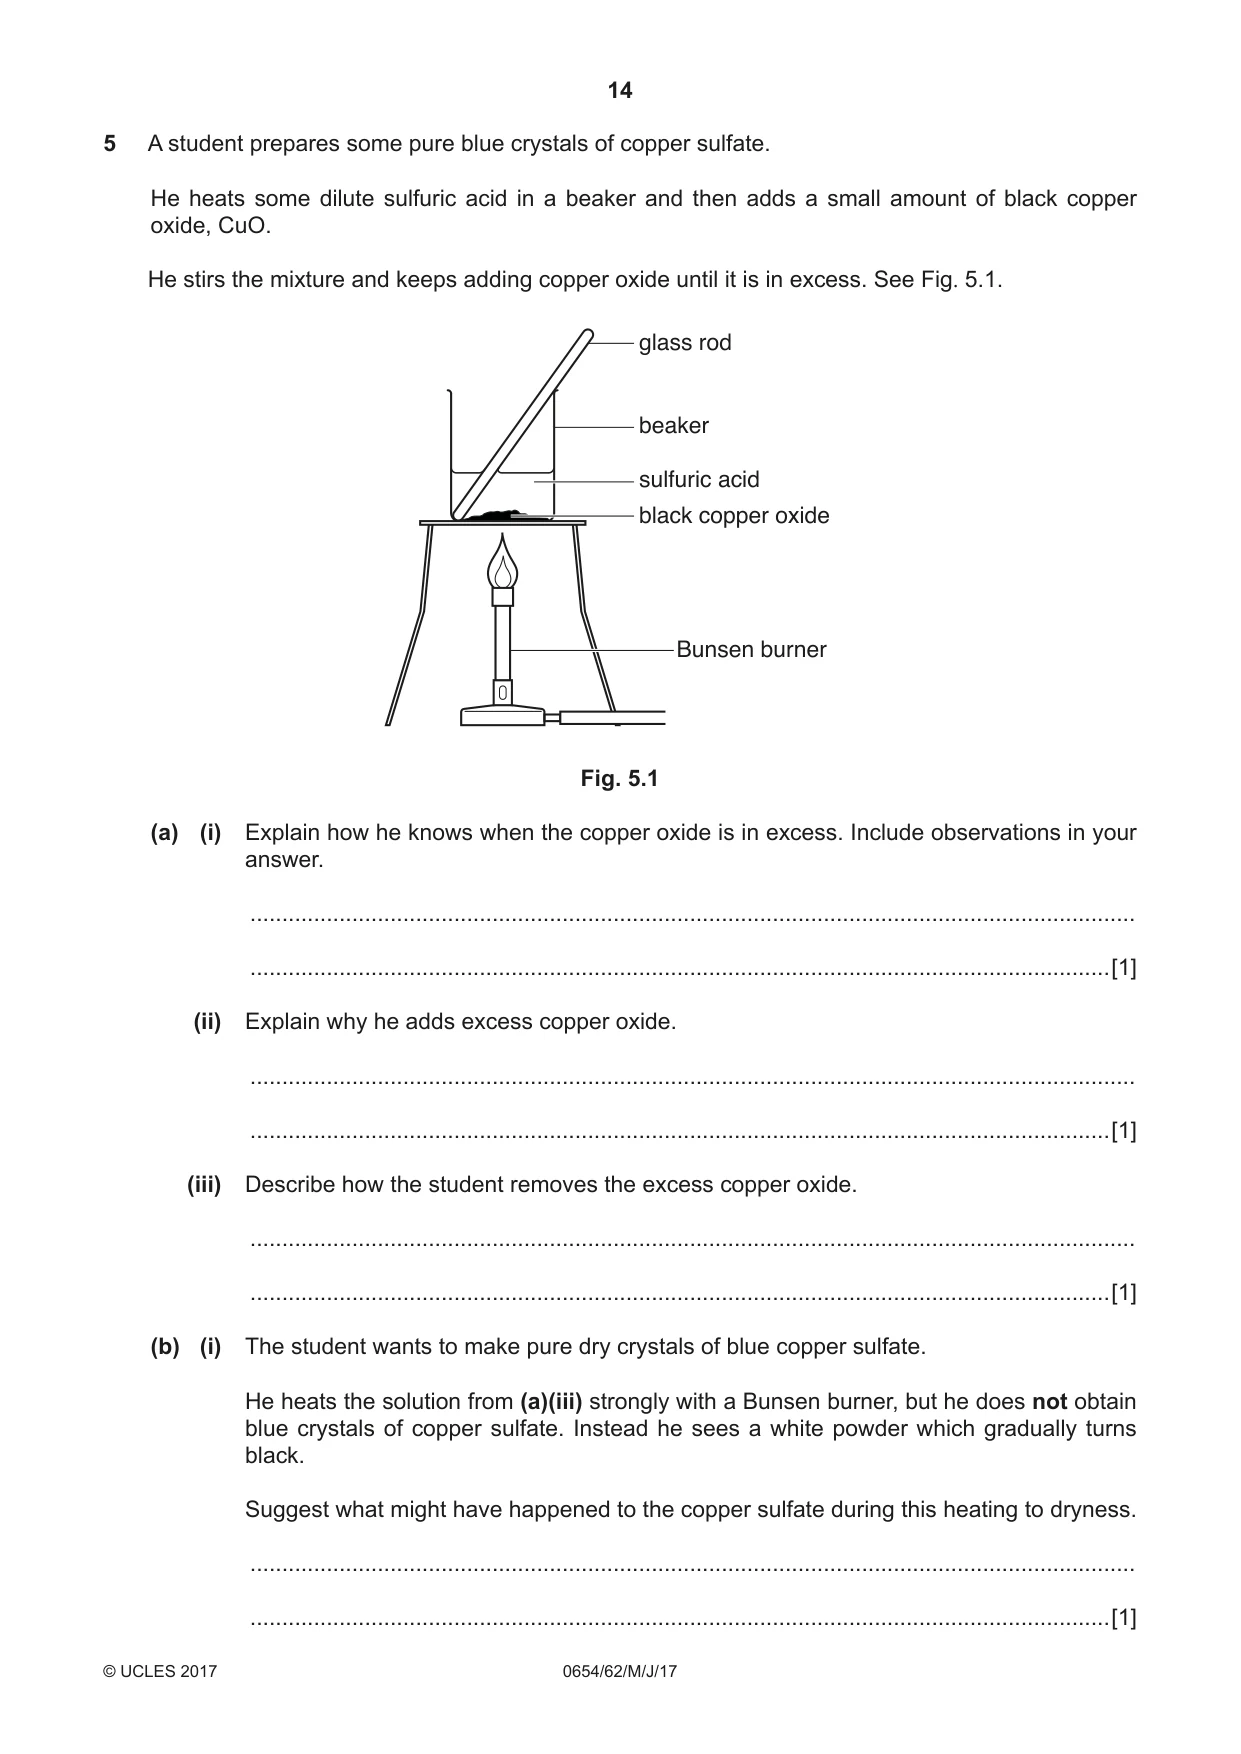
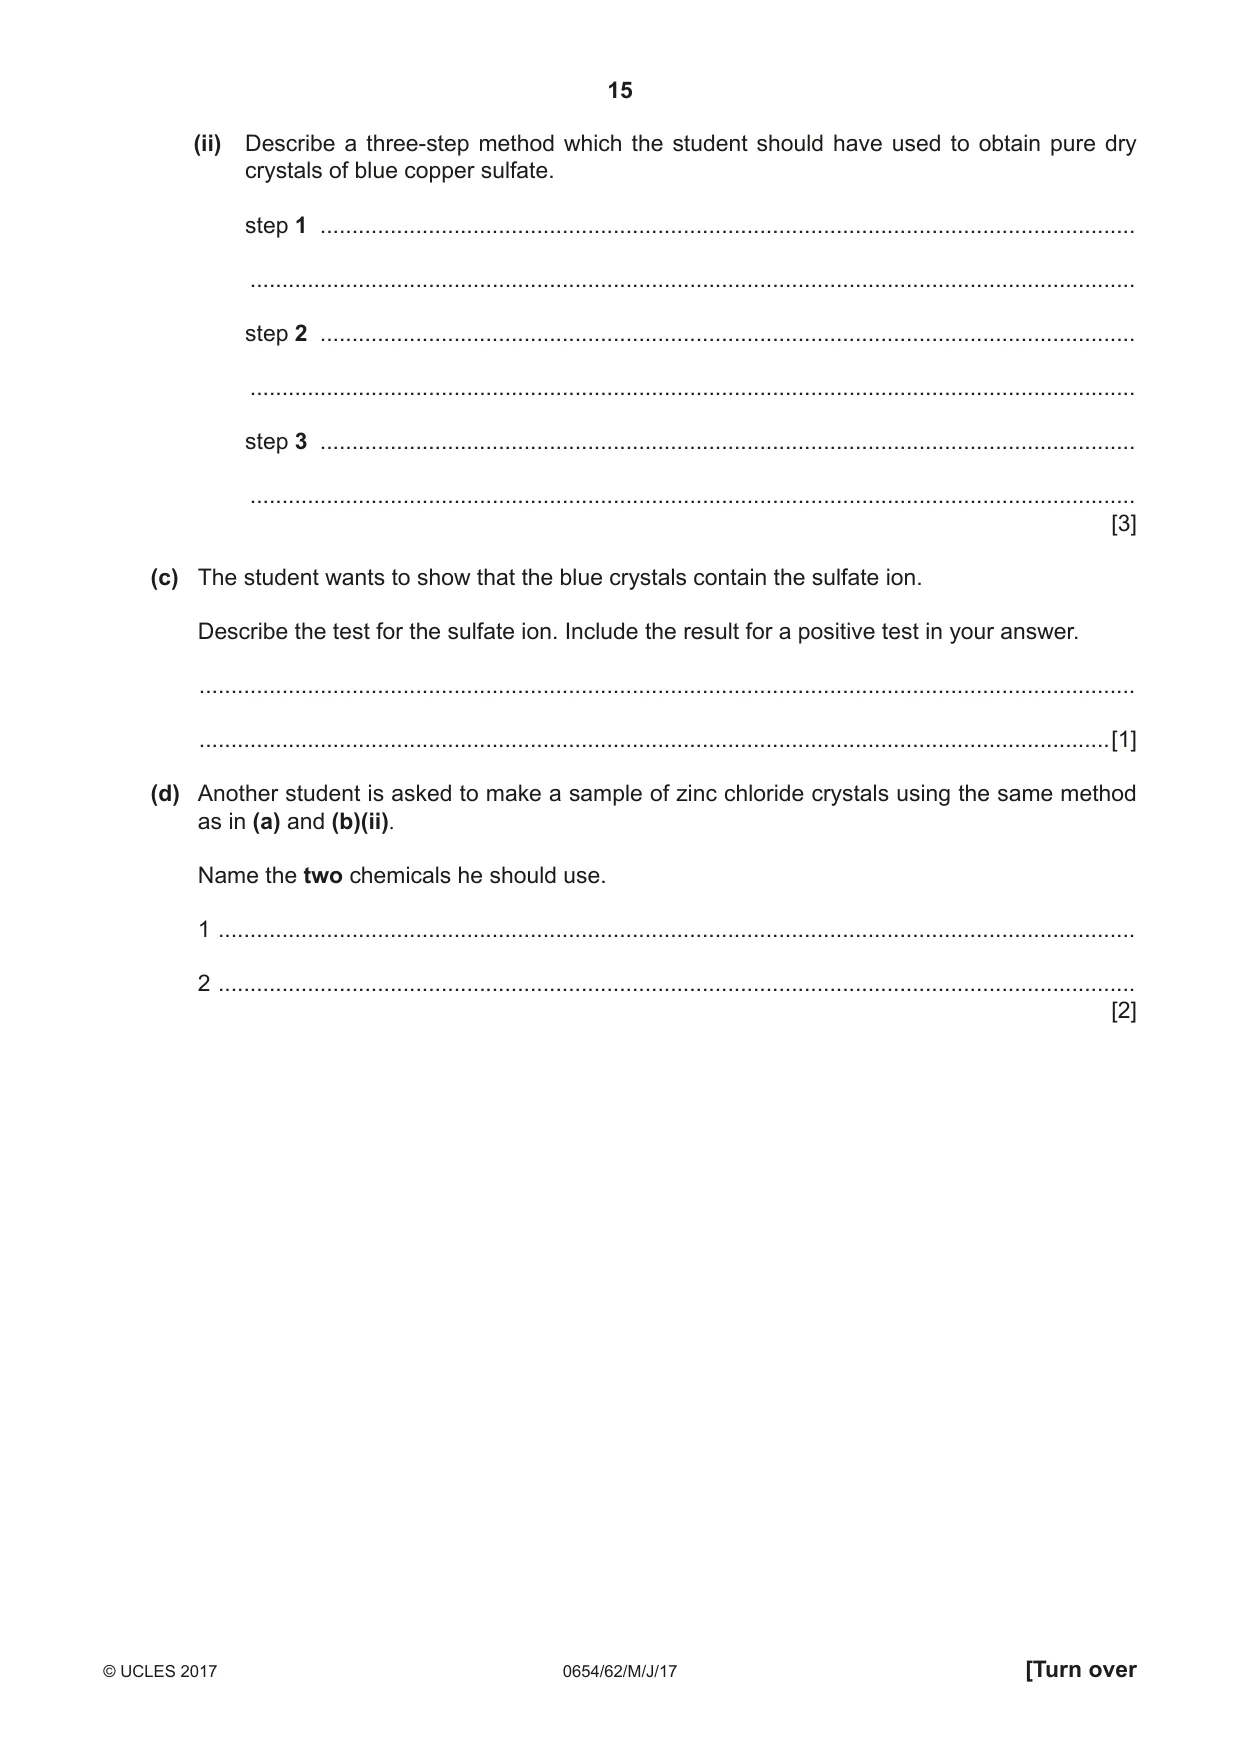
5 A student prepares some pure blue crystals of copper sulfate. He heats some dilute sulfuric acid in a beaker and then adds a small amount of black copper oxide, CuO. He stirs the mixture and keeps adding copper oxide until it is in excess. See Fig. 5.1. glass rod beaker sulfuric acid black copper oxide Bunsen burner Fig. 5.1 (a) (i) Explain how he knows when the copper oxide is in excess. Include observations in your answer. ........................................................................................................................................... .......................................................................................................................................[1] (ii) Explain why he adds excess copper oxide. ........................................................................................................................................... .......................................................................................................................................[1] (iii) Describe how the student removes the excess copper oxide. ........................................................................................................................................... .......................................................................................................................................[1] (b) (i) The student wants to make pure dry crystals of blue copper sulfate. He heats the solution from (a)(iii) strongly with a Bunsen burner, but he does not obtain blue crystals of copper sulfate. Instead he sees a white powder which gradually turns black. Suggest what might have happened to the copper sulfate during this heating to dryness. ........................................................................................................................................... .......................................................................................................................................[1] (ii) Describe a three-step method which the student should have used to obtain pure dry crystals of blue copper sulfate. step 1 ................................................................................................................................ ........................................................................................................................................... step 2 ................................................................................................................................ ........................................................................................................................................... step 3 ................................................................................................................................ ........................................................................................................................................... [3] (c) The student wants to show that the blue crystals contain the sulfate ion. Describe the test for the sulfate ion. Include the result for a positive test in your answer. ................................................................................................................................................... ...............................................................................................................................................[1] (d) Another student is asked to make a sample of zinc chloride crystals using the same method as in (a) and (b)(ii). Name the two chemicals he should use. 1 ................................................................................................................................................ 2 ................................................................................................................................................ [2]
Mark scheme: 5(a)(i) solid in beaker / solution / mixture ; 1 5(a)(ii) make sure that all the acid has reacted ; 1 5(a)(iii) filtration ; 1 5(b)(i) (all water gone) decomposes (to copper oxide) ; 1 5(b)(ii) evaporate some of the water / leave to evaporate / heat / evaporate ; leave to crystallise / cool ; filter ; leave to dry / press between filter paper ; max 3 5(c) add barium nitrate / barium chloride AND white ppt. ; 1 5(d) zinc oxide ; hydrochloric acid ; 2
Q6 · Five students, P, Q, R, S and T, investigate how temperature changes during the process…
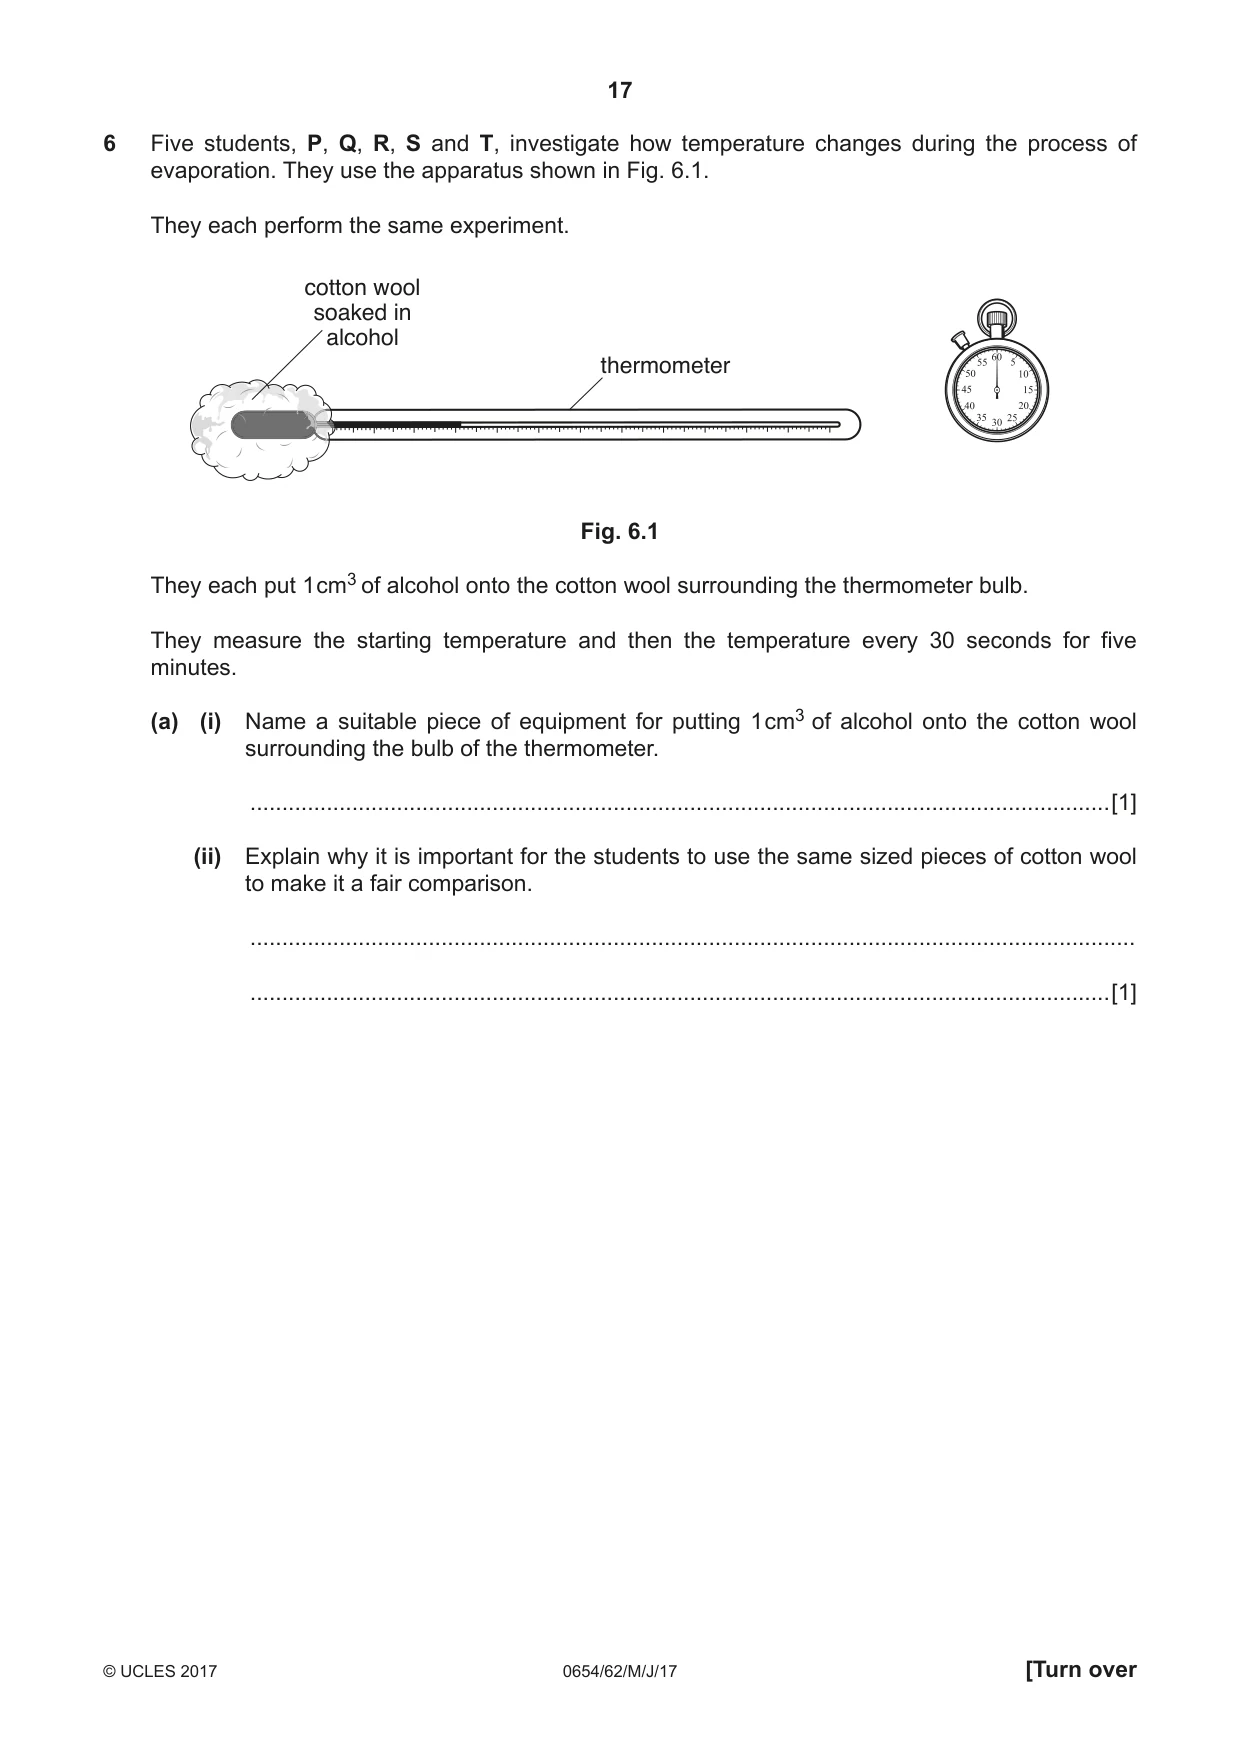
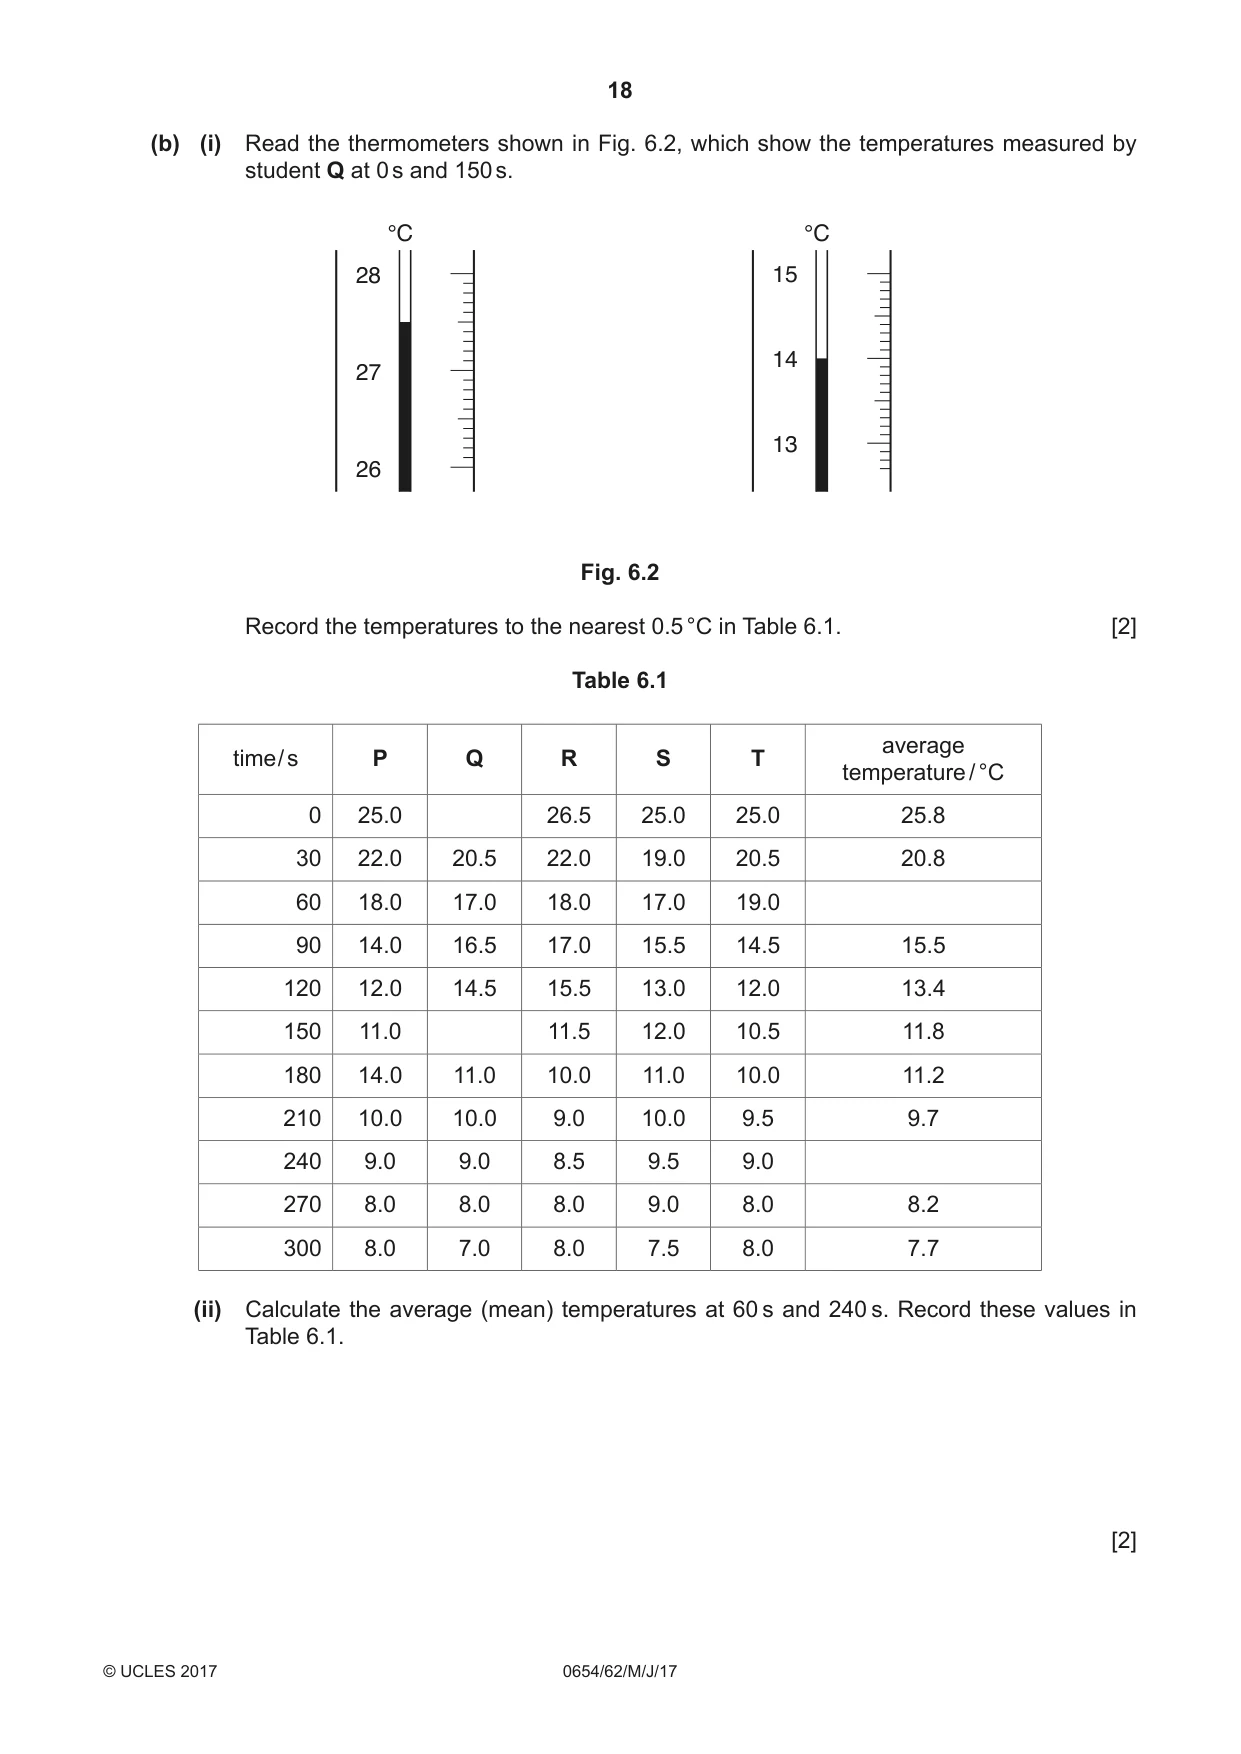
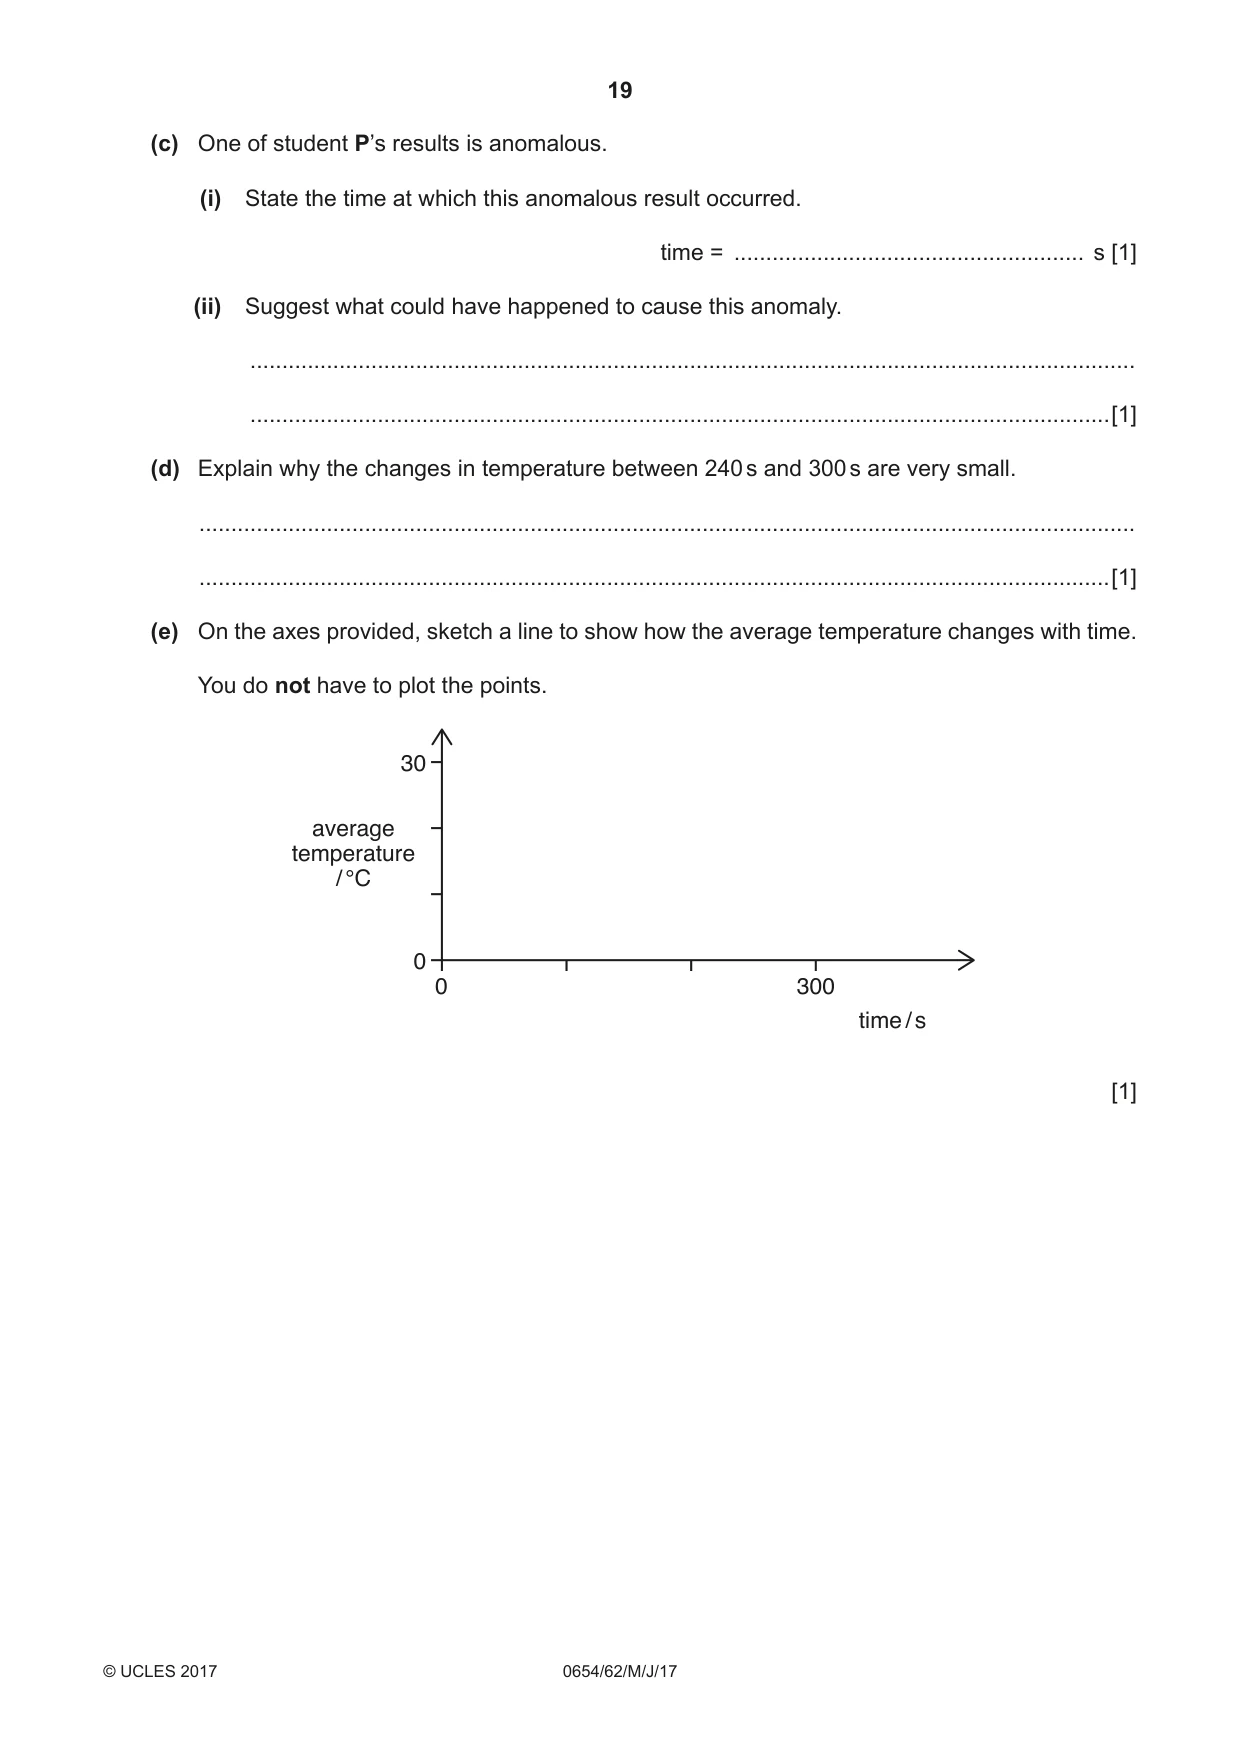
6 Five students, P, Q, R, S and T, investigate how temperature changes during the process of evaporation. They use the apparatus shown in Fig. 6.1. They each perform the same experiment. cotton wool soaked in alcohol thermometer Fig. 6.1 They each put 1 cm3 of alcohol onto the cotton wool surrounding the thermometer bulb. They measure the starting temperature and then the temperature every 30 seconds for five minutes. (a) (i) Name a suitable piece of equipment for putting 1 cm3 of alcohol onto the cotton wool surrounding the bulb of the thermometer. .......................................................................................................................................[1] (ii) Explain why it is important for the students to use the same sized pieces of cotton wool to make it a fair comparison. ........................................................................................................................................... .......................................................................................................................................[1] (b) (i) Read the thermometers shown in Fig. 6.2, which show the temperatures measured by student Q at 0 s and 150 s. °C °C 28 15 14 27 13 26 Fig. 6.2 Record the temperatures to the nearest 0.5 °C in Table 6.1. [2] Table 6.1 average time / s P Q R S T temperature / °C 0 25.0 26.5 25.0 25.0 25.8 30 22.0 20.5 22.0 19.0 20.5 20.8 60 18.0 17.0 18.0 17.0 19.0 90 14.0 16.5 17.0 15.5 14.5 15.5 120 12.0 14.5 15.5 13.0 12.0 13.4 150 11.0 11.5 12.0 10.5 11.8 180 14.0 11.0 10.0 11.0 10.0 11.2 210 10.0 10.0 9.0 10.0 9.5 9.7 240 9.0 9.0 8.5 9.5 9.0 270 8.0 8.0 8.0 9.0 8.0 8.2 300 8.0 7.0 8.0 7.5 8.0 7.7 (ii) Calculate the average (mean) temperatures at 60 s and 240 s. Record these values in Table 6.1. [2] (c) One of student P’s results is anomalous. (i) State the time at which this anomalous result occurred. time = ....................................................... s [1] (ii) Suggest what could have happened to cause this anomaly. ........................................................................................................................................... .......................................................................................................................................[1] (d) Explain why the changes in temperature between 240 s and 300 s are very small. ................................................................................................................................................... ...............................................................................................................................................[1] (e) On the axes provided, sketch a line to show how the average temperature changes with time. You do not have to plot the points. 30 average temperature / °C 0 0 300 time / s [1]
Mark scheme: 6(a)(i) pipette / syringe ; 1 6(a)(ii) same surface (area) / so same (rate of) evaporation ; 1 6(b)(i) 27.5 (°C) ; 14.0 (°C) ; 2 6(b)(ii) 17.8 (°C) ; 9.0 (°C) ; 2 6(c)(i) 180 (s) ; 1 6(c)(ii) cotton wool dropped off / misread thermometer ; 1 6(d) cotton wool almost dry / rate of evaporation slower / most alcohol evaporated / all alcohol evaporated ; 1 6(e) reasonable sketch (left to right curve, starting high on LHS) ; 1
What was in this paper
The subtopics covered by these 6 questions, and how many questions each got. Open one in a new tab to see every Cambridge question on it.
What you needed in this session
Cambridge’s own grade thresholds for 2017 May/June, Paper 6 · Variant 2. A higher threshold means an easier paper — the bar moves with how the cohort did.