Cambridge IGCSE Sciences - Co-ordinated (Double) 0654 — 2017 May/June Paper 6 · Variant 3
0654/63/M/J/17 · 6 questions · 60 marks · ≈68 min
The question paper and its mark scheme, free to read here and free to download. This is Cambridge’s own paper, exactly as it was sat.
Question paper20 pages



Mark scheme7 pages
Answers below. Sit the paper first if you are practising.
Questions as text
Q1 · A student investigates the production of gas by yeast cells
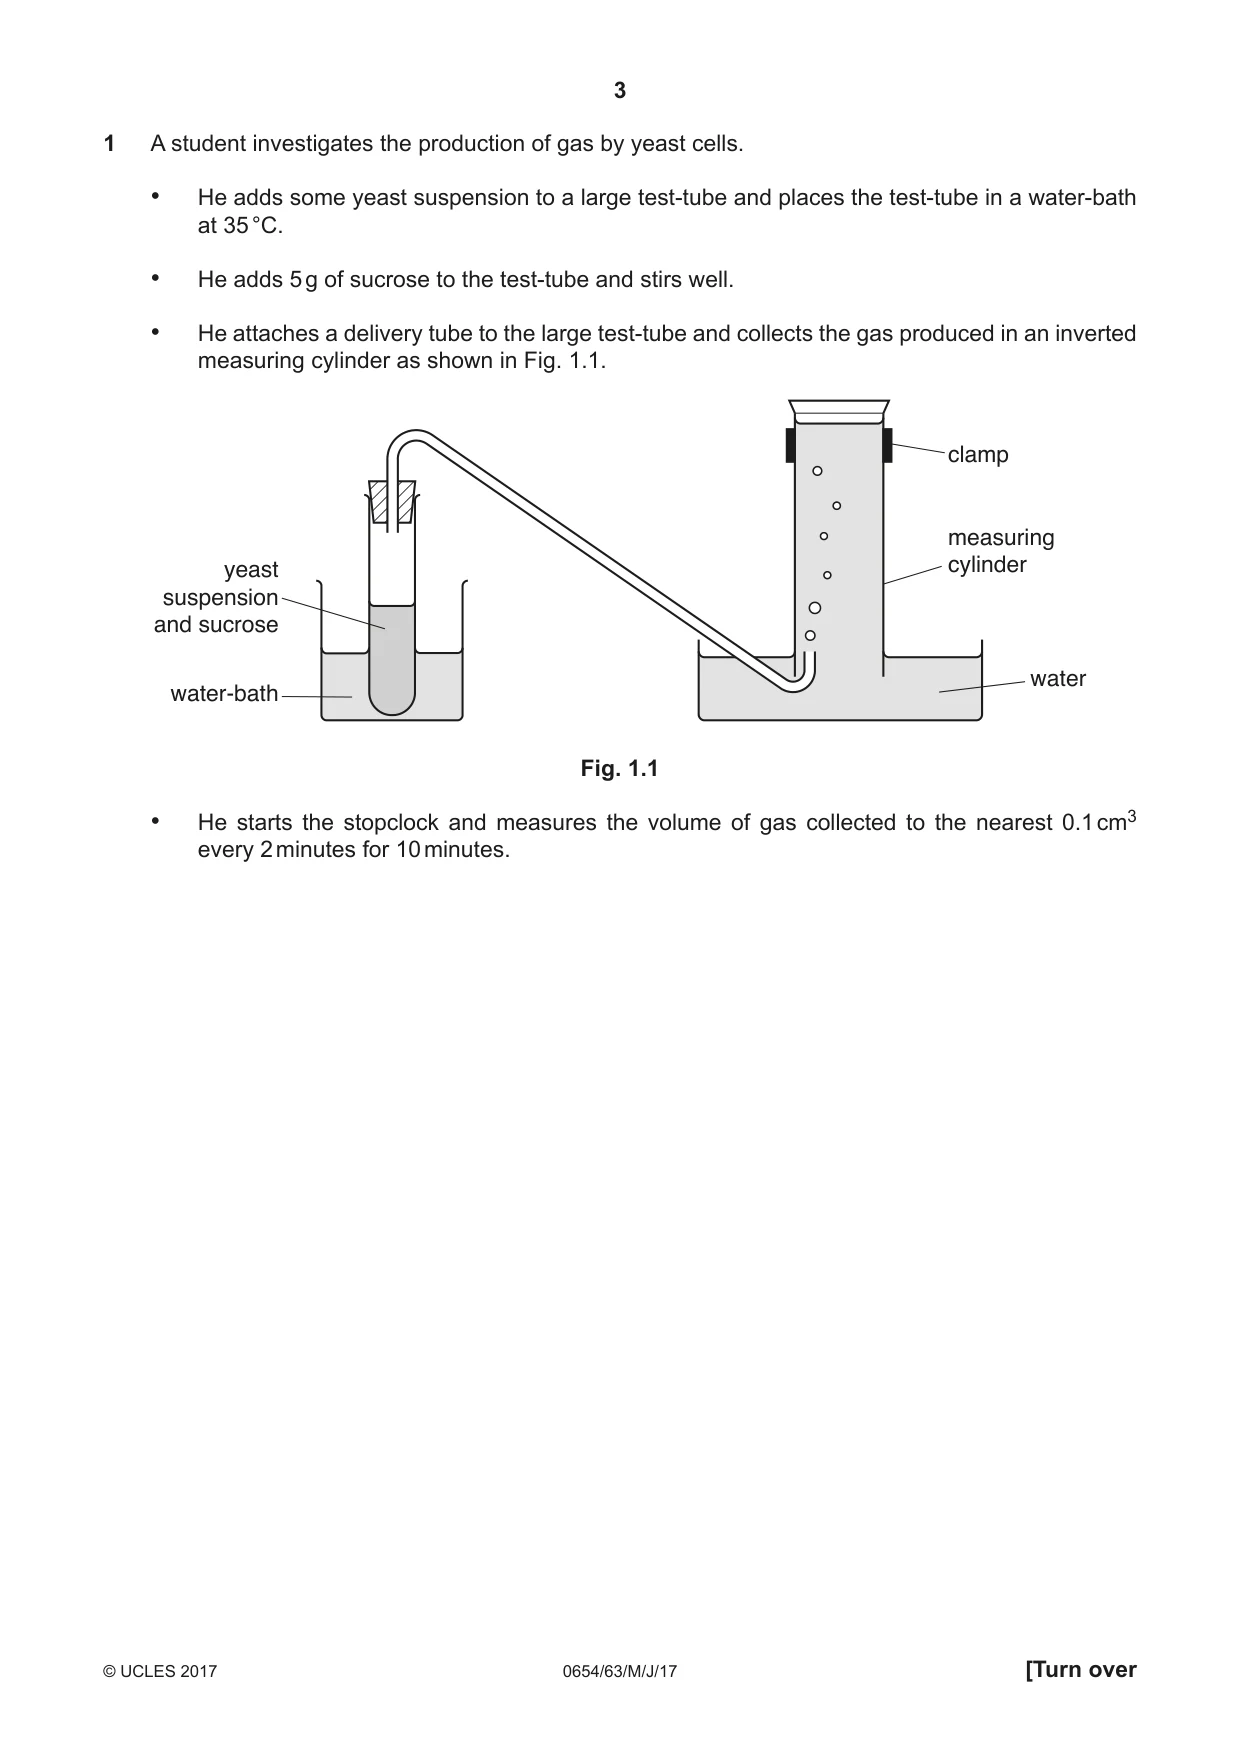
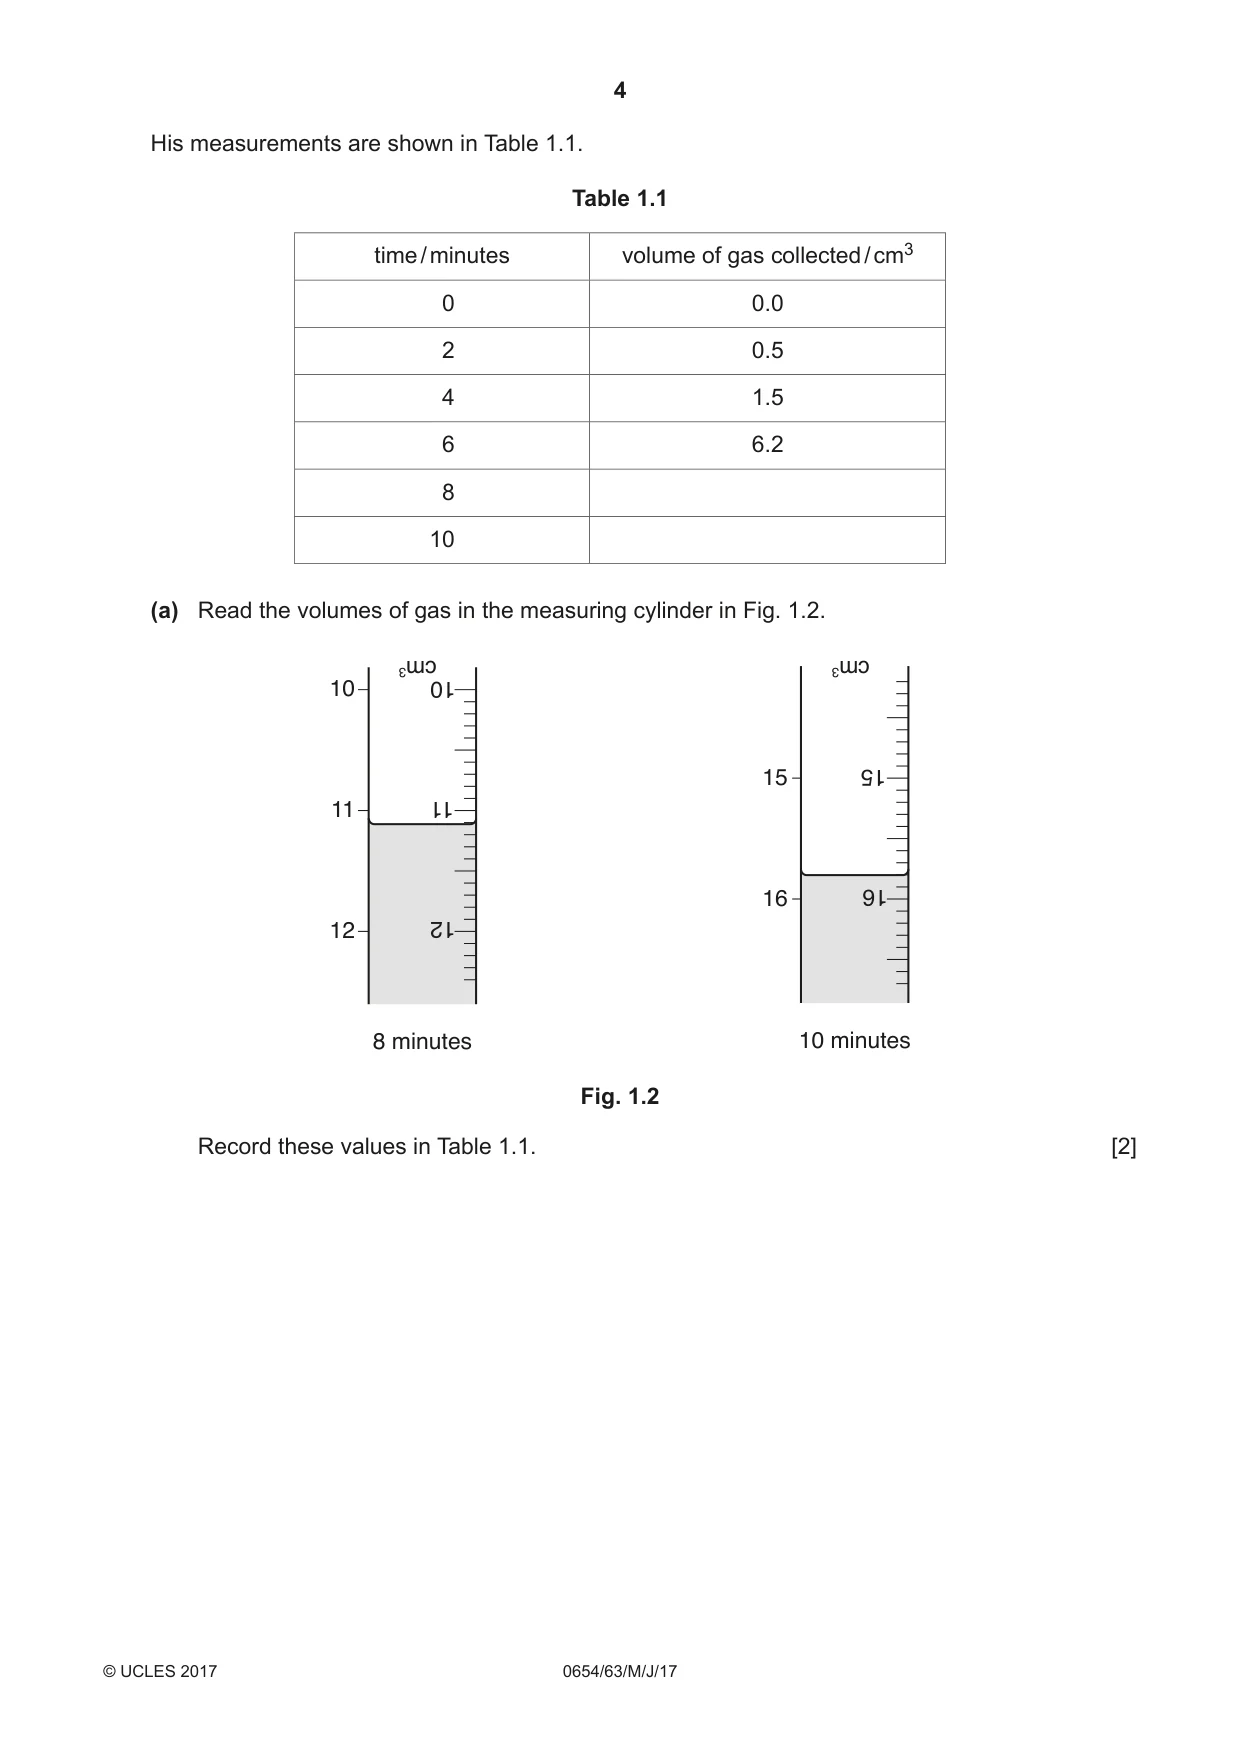
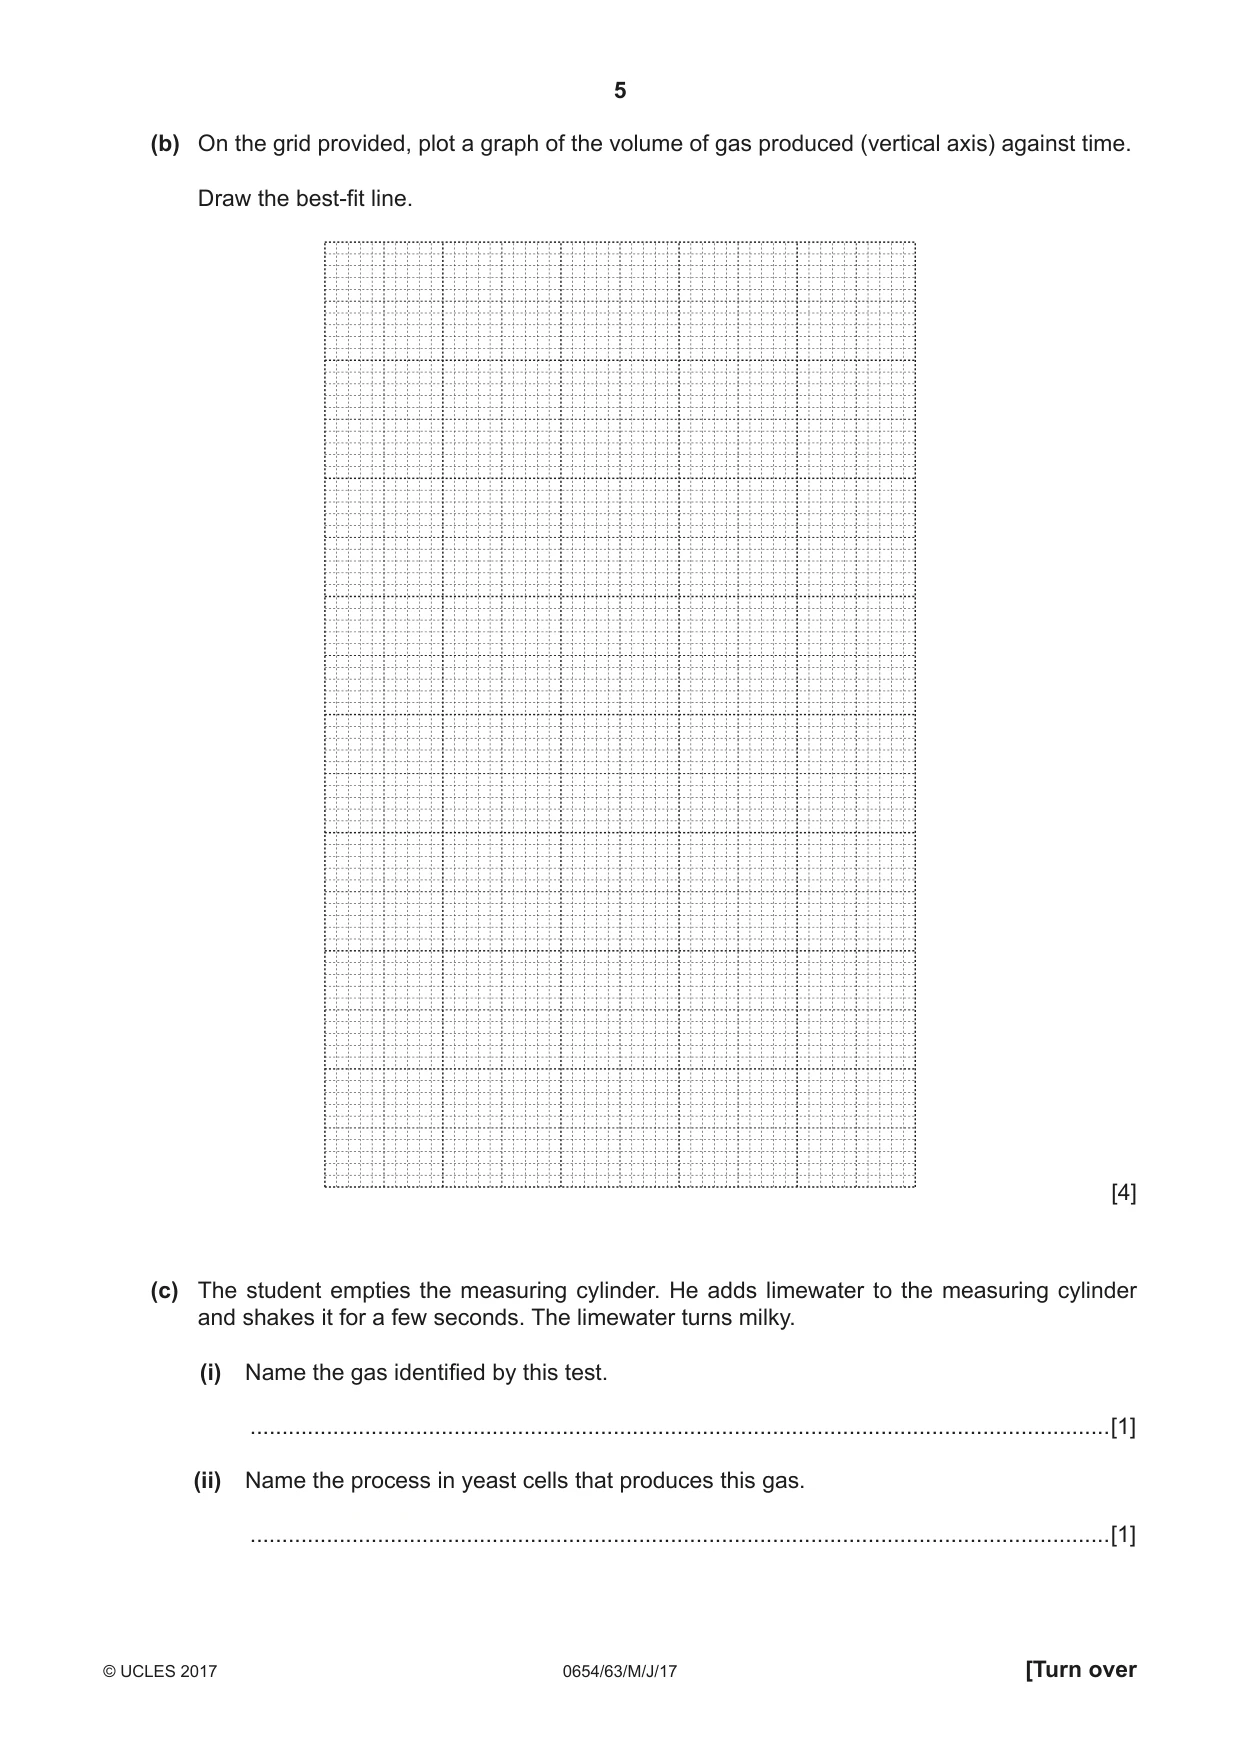
1 A student investigates the production of gas by yeast cells. • He adds some yeast suspension to a large test-tube and places the test-tube in a water-bath at 35 °C. • He adds 5 g of sucrose to the test-tube and stirs well. • He attaches a delivery tube to the large test-tube and collects the gas produced in an inverted measuring cylinder as shown in Fig. 1.1. clamp measuring yeast cylinder suspension and sucrose water water-bath Fig. 1.1 • He starts the stopclock and measures the volume of gas collected to the nearest 0.1 cm3 every 2 minutes for 10 minutes. His measurements are shown in Table 1.1. Table 1.1 time / minutes volume of gas collected / cm3 0 0.0 2 0.5 4 1.5 6 6.2 8 10 (a) Read the volumes of gas in the measuring cylinder in Fig. 1.2. cm3 cm3 10 10 15 15 11 11 16 16 12 12 8 minutes 10 minutes Fig. 1.2 Record these values in Table 1.1. [2] (b) On the grid provided, plot a graph of the volume of gas produced (vertical axis) against time. Draw the best-fit line. [4] (c) The student empties the measuring cylinder. He adds limewater to the measuring cylinder and shakes it for a few seconds. The limewater turns milky. (i) Name the gas identified by this test. .......................................................................................................................................[1] (ii) Name the process in yeast cells that produces this gas. .......................................................................................................................................[1] (d) Another student wants to investigate the effect of the amount of sucrose on the production of gas by yeast. She carries out the same experiment but uses only half the amount of sucrose. (i) Predict, by adding a new line to your graph in (b), how this would change the volume of gas collected. Label this new line S. [1] (ii) State one variable that the student needs to keep constant. .......................................................................................................................................[1] Please turn over for Question 2.
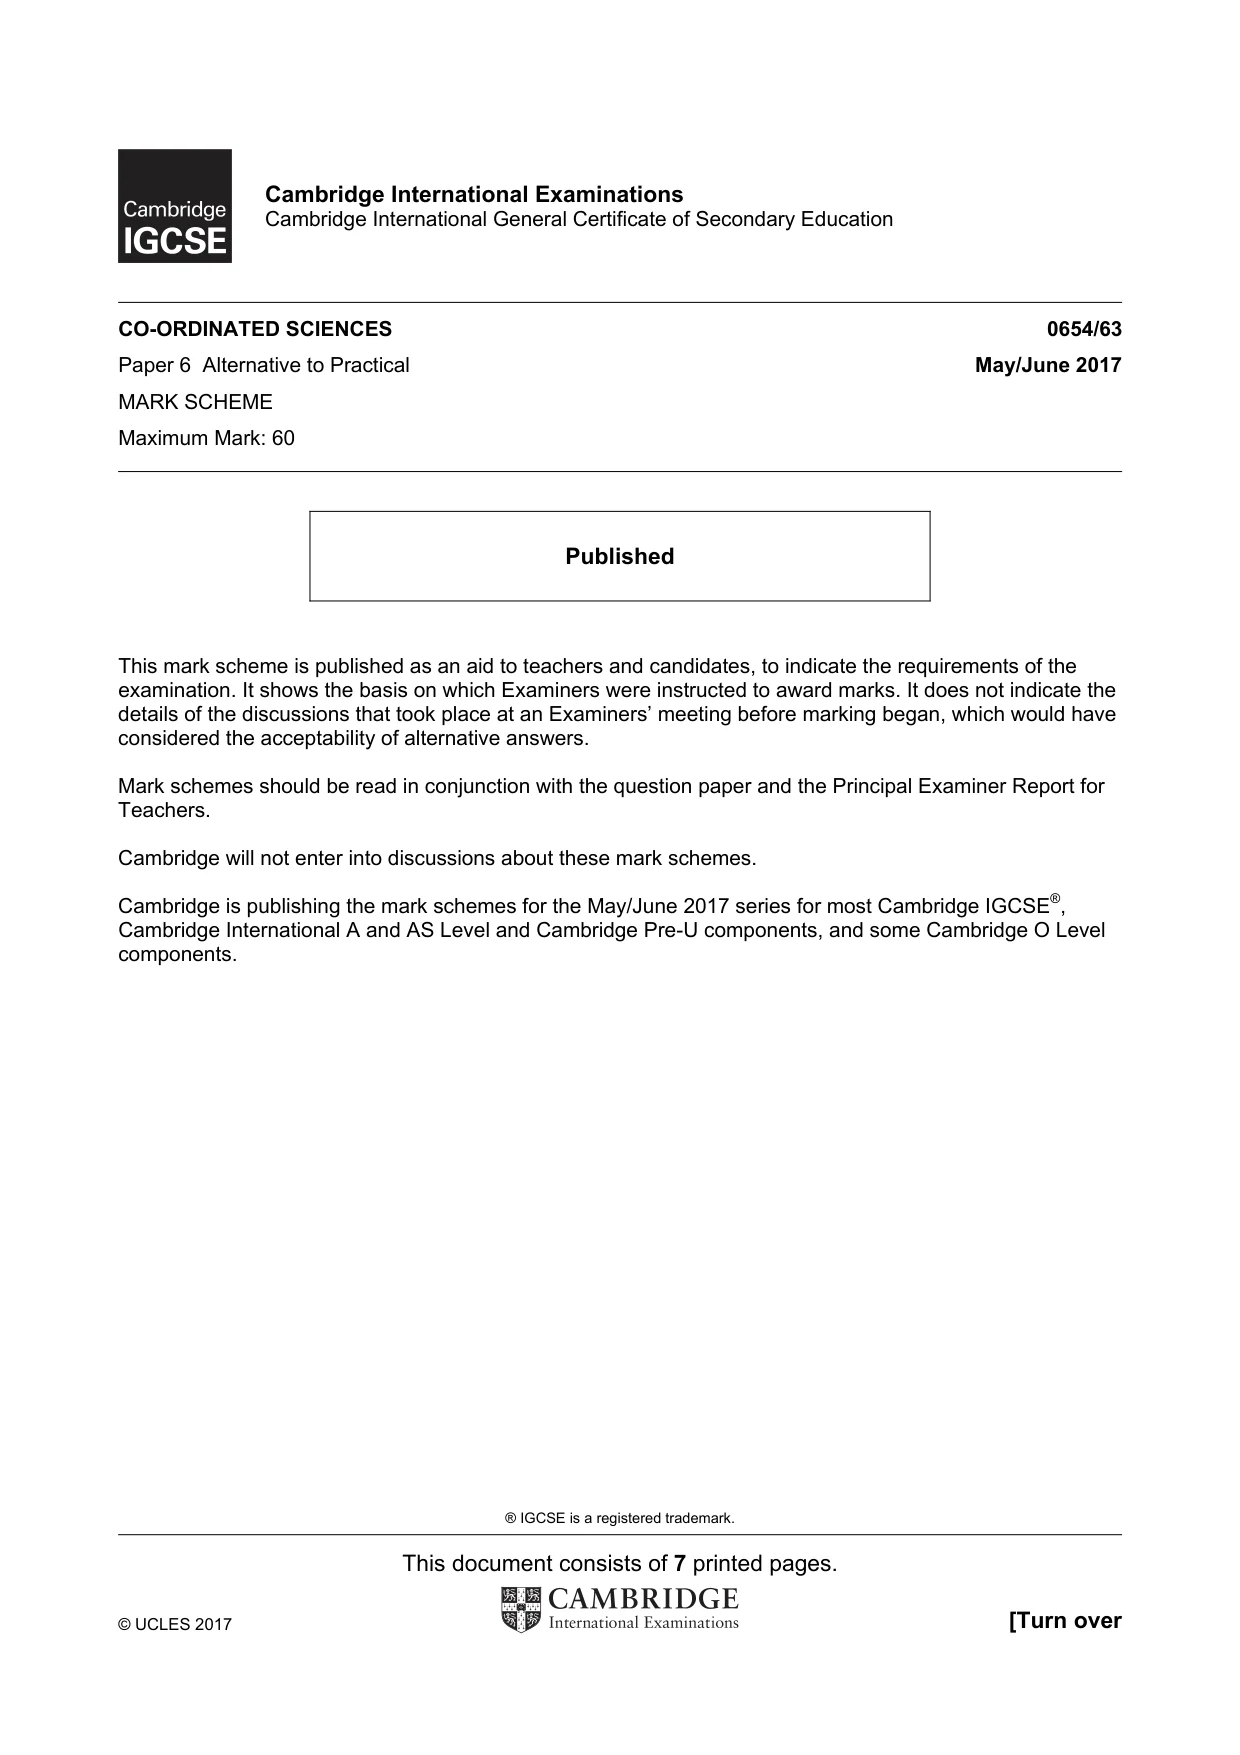
Mark scheme: 1(a) 15.8 (cm3) ; 2 1(b) axes labelled with units ; suitable linear scale using at least half the grid ; at least 4 points plotted ± half small square ; best-fit curve through origin ; 4 1(c)(i) carbon dioxide ; 1 1(c)(ii) respiration ; 1 1(d)(i) line below original line ; 1 1(d)(ii) volume of yeast / temperature ; 1
Q2 · A student has to identify compounds H and J
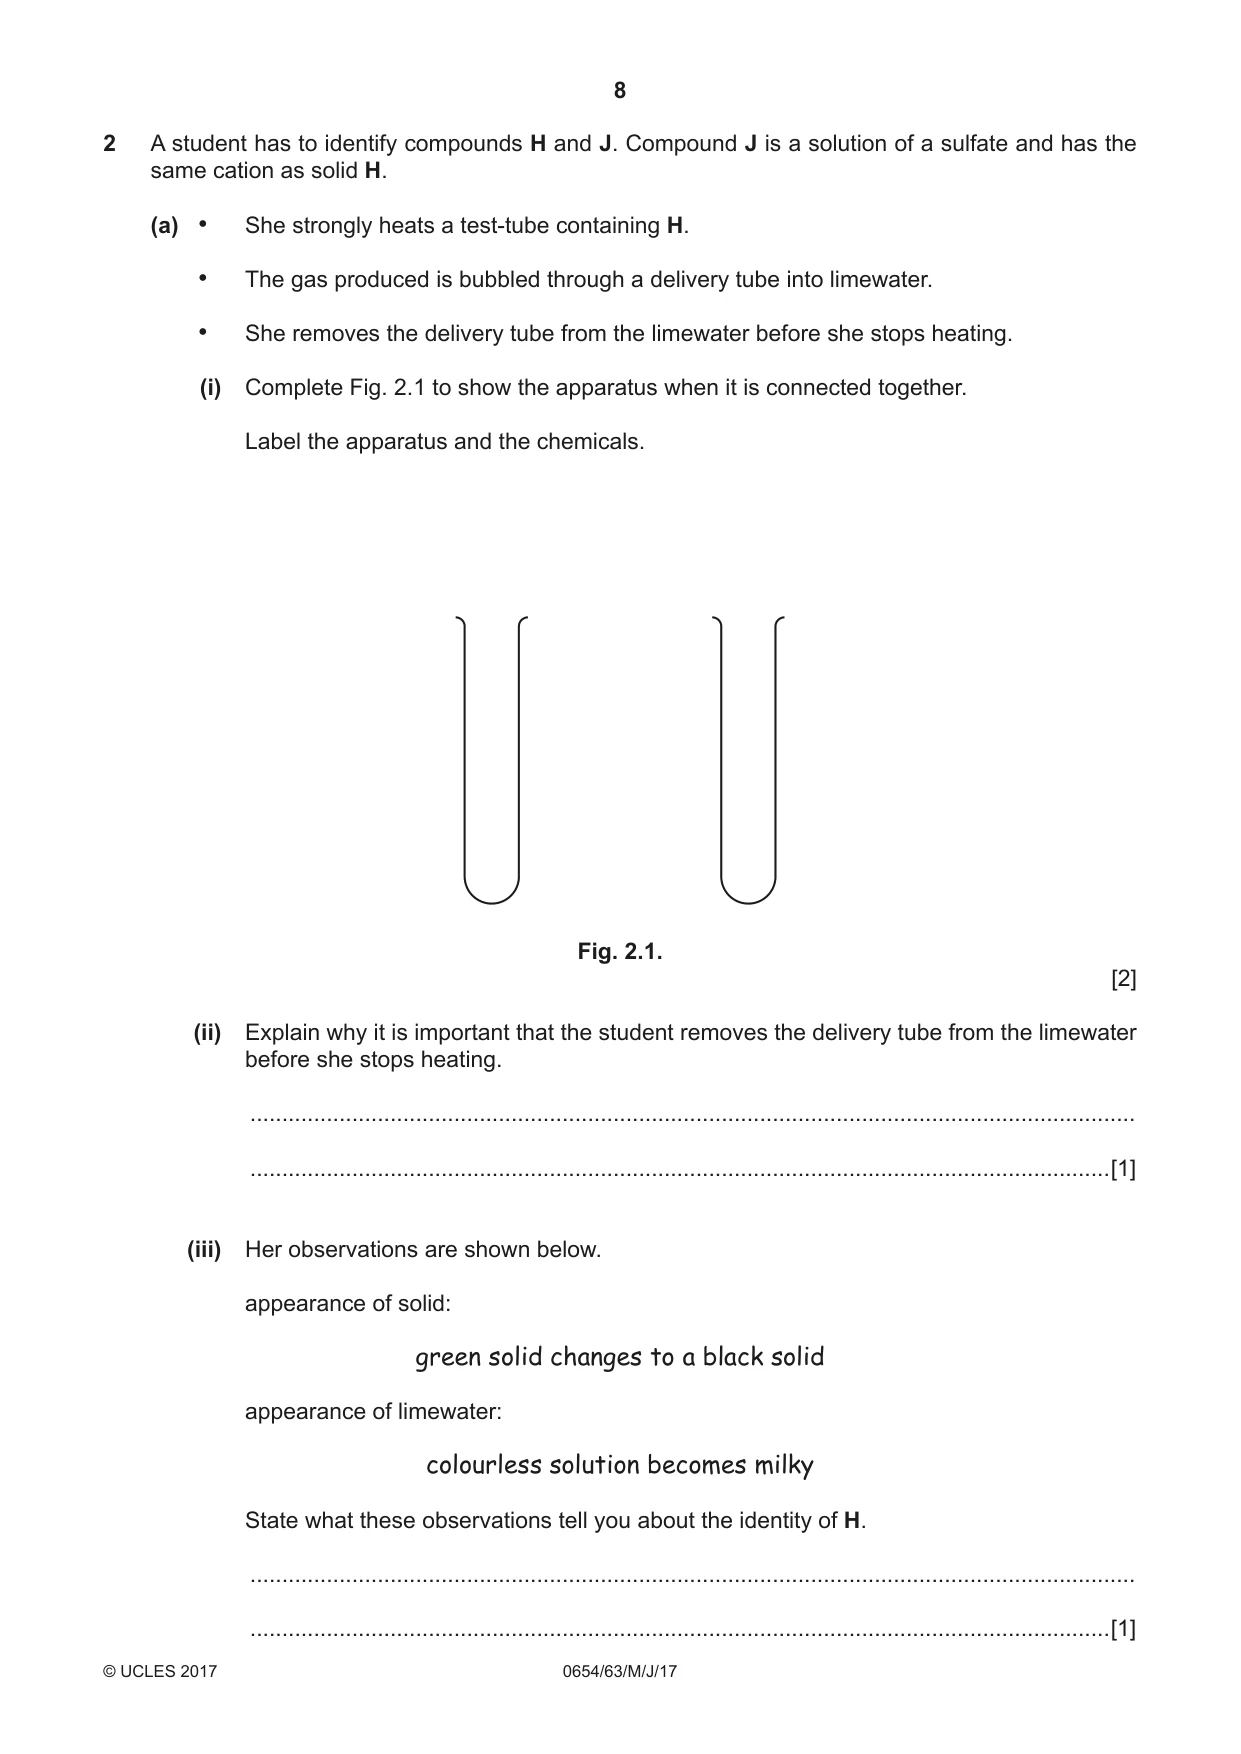
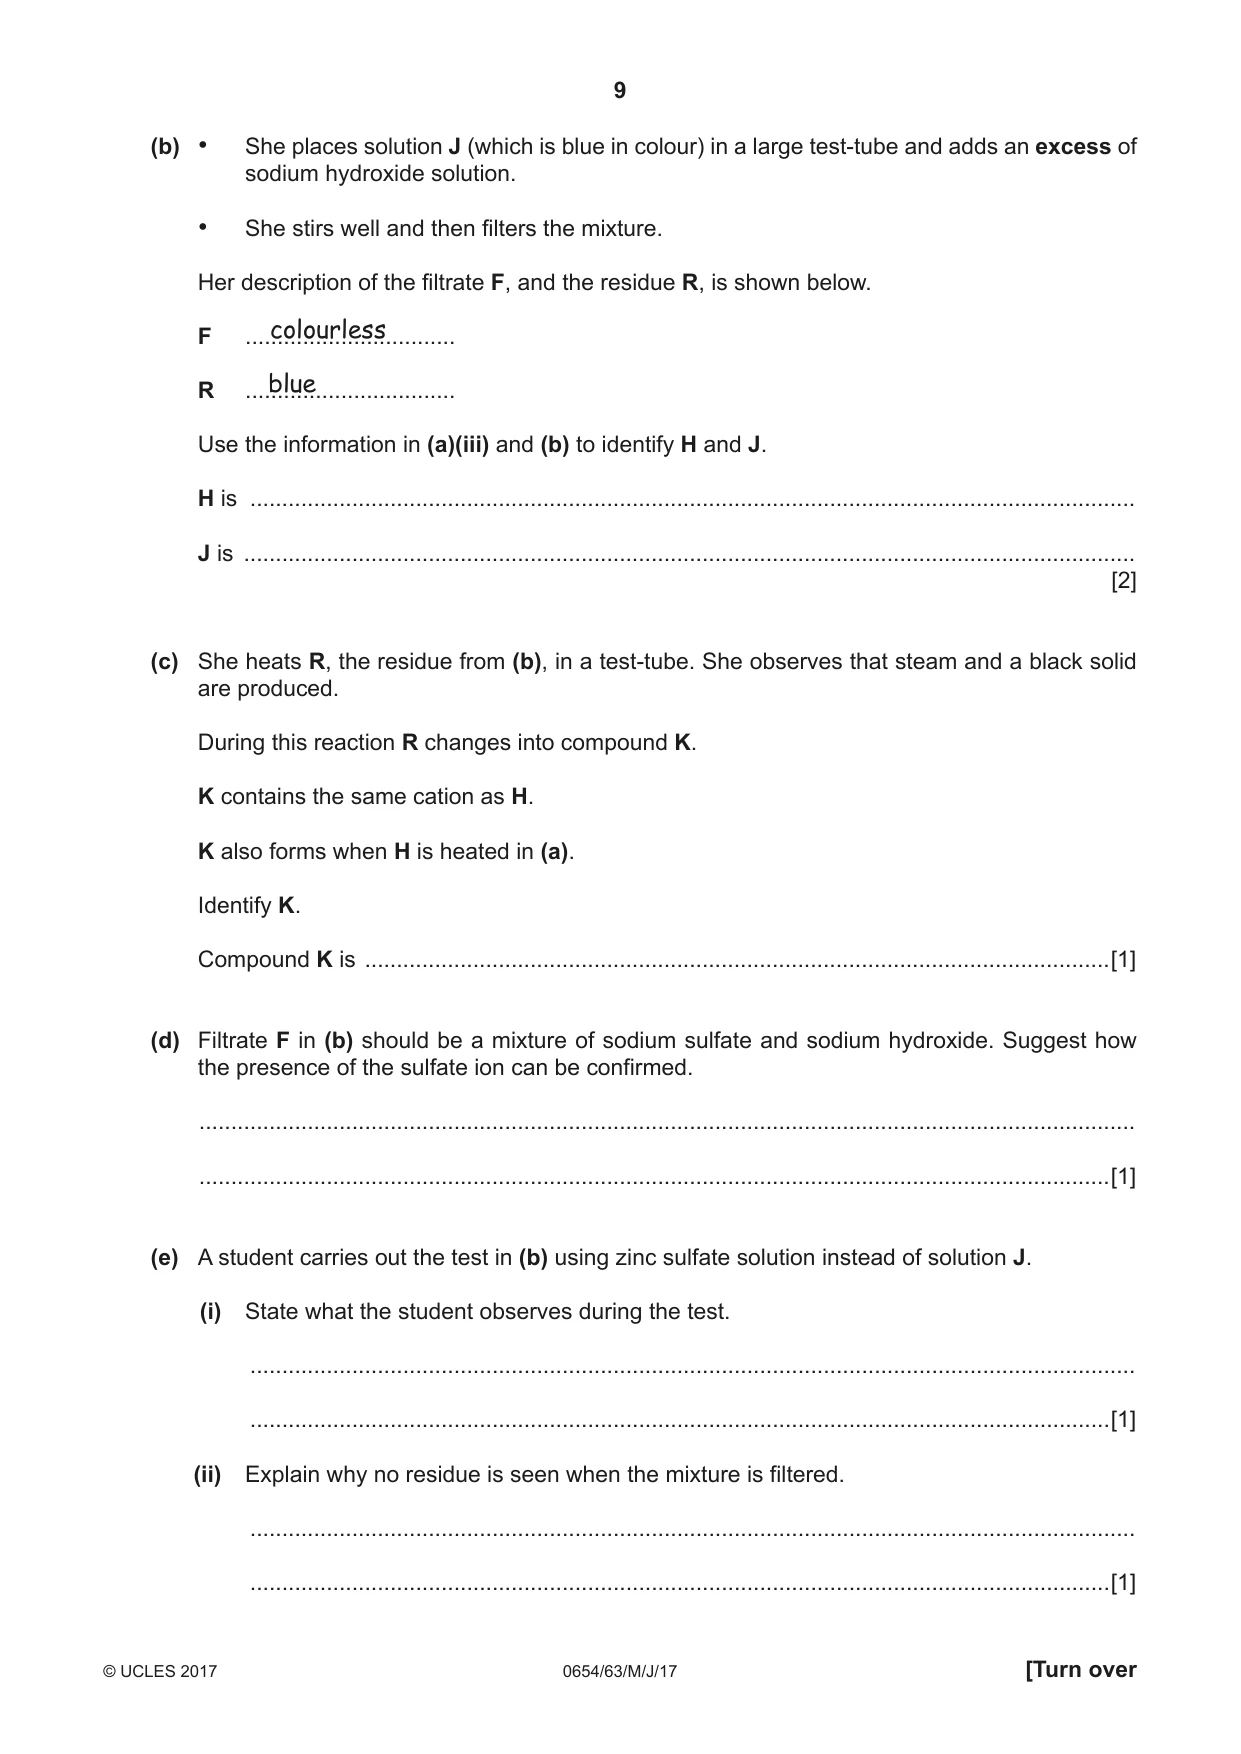
2 A student has to identify compounds H and J. Compound J is a solution of a sulfate and has the same cation as solid H. (a) • She strongly heats a test-tube containing H. • The gas produced is bubbled through a delivery tube into limewater. • She removes the delivery tube from the limewater before she stops heating. (i) Complete Fig. 2.1 to show the apparatus when it is connected together. Label the apparatus and the chemicals. Fig. 2.1. [2] (ii) Explain why it is important that the student removes the delivery tube from the limewater before she stops heating. ........................................................................................................................................... .......................................................................................................................................[1] (iii) Her observations are shown below. appearance of solid: green solid changes to a black solid appearance of limewater: colourless solution becomes milky State what these observations tell you about the identity of H. ........................................................................................................................................... .......................................................................................................................................[1] (b) • She places solution J (which is blue in colour) in a large test-tube and adds an excess of sodium hydroxide solution. • She stirs well and then filters the mixture. Her description of the filtrate F, and the residue R, is shown below. colourless F ................................. blue R ................................. Use the information in (a)(iii) and (b) to identify H and J. H is ........................................................................................................................................... J is ............................................................................................................................................ [2] (c) She heats R, the residue from (b), in a test-tube. She observes that steam and a black solid are produced. During this reaction R changes into compound K. K contains the same cation as H. K also forms when H is heated in (a). Identify K. Compound K is .....................................................................................................................[1] (d) Filtrate F in (b) should be a mixture of sodium sulfate and sodium hydroxide. Suggest how the presence of the sulfate ion can be confirmed. ................................................................................................................................................... ...............................................................................................................................................[1] (e) A student carries out the test in (b) using zinc sulfate solution instead of solution J. (i) State what the student observes during the test. ........................................................................................................................................... .......................................................................................................................................[1] (ii) Explain why no residue is seen when the mixture is filtered. ........................................................................................................................................... .......................................................................................................................................[1]
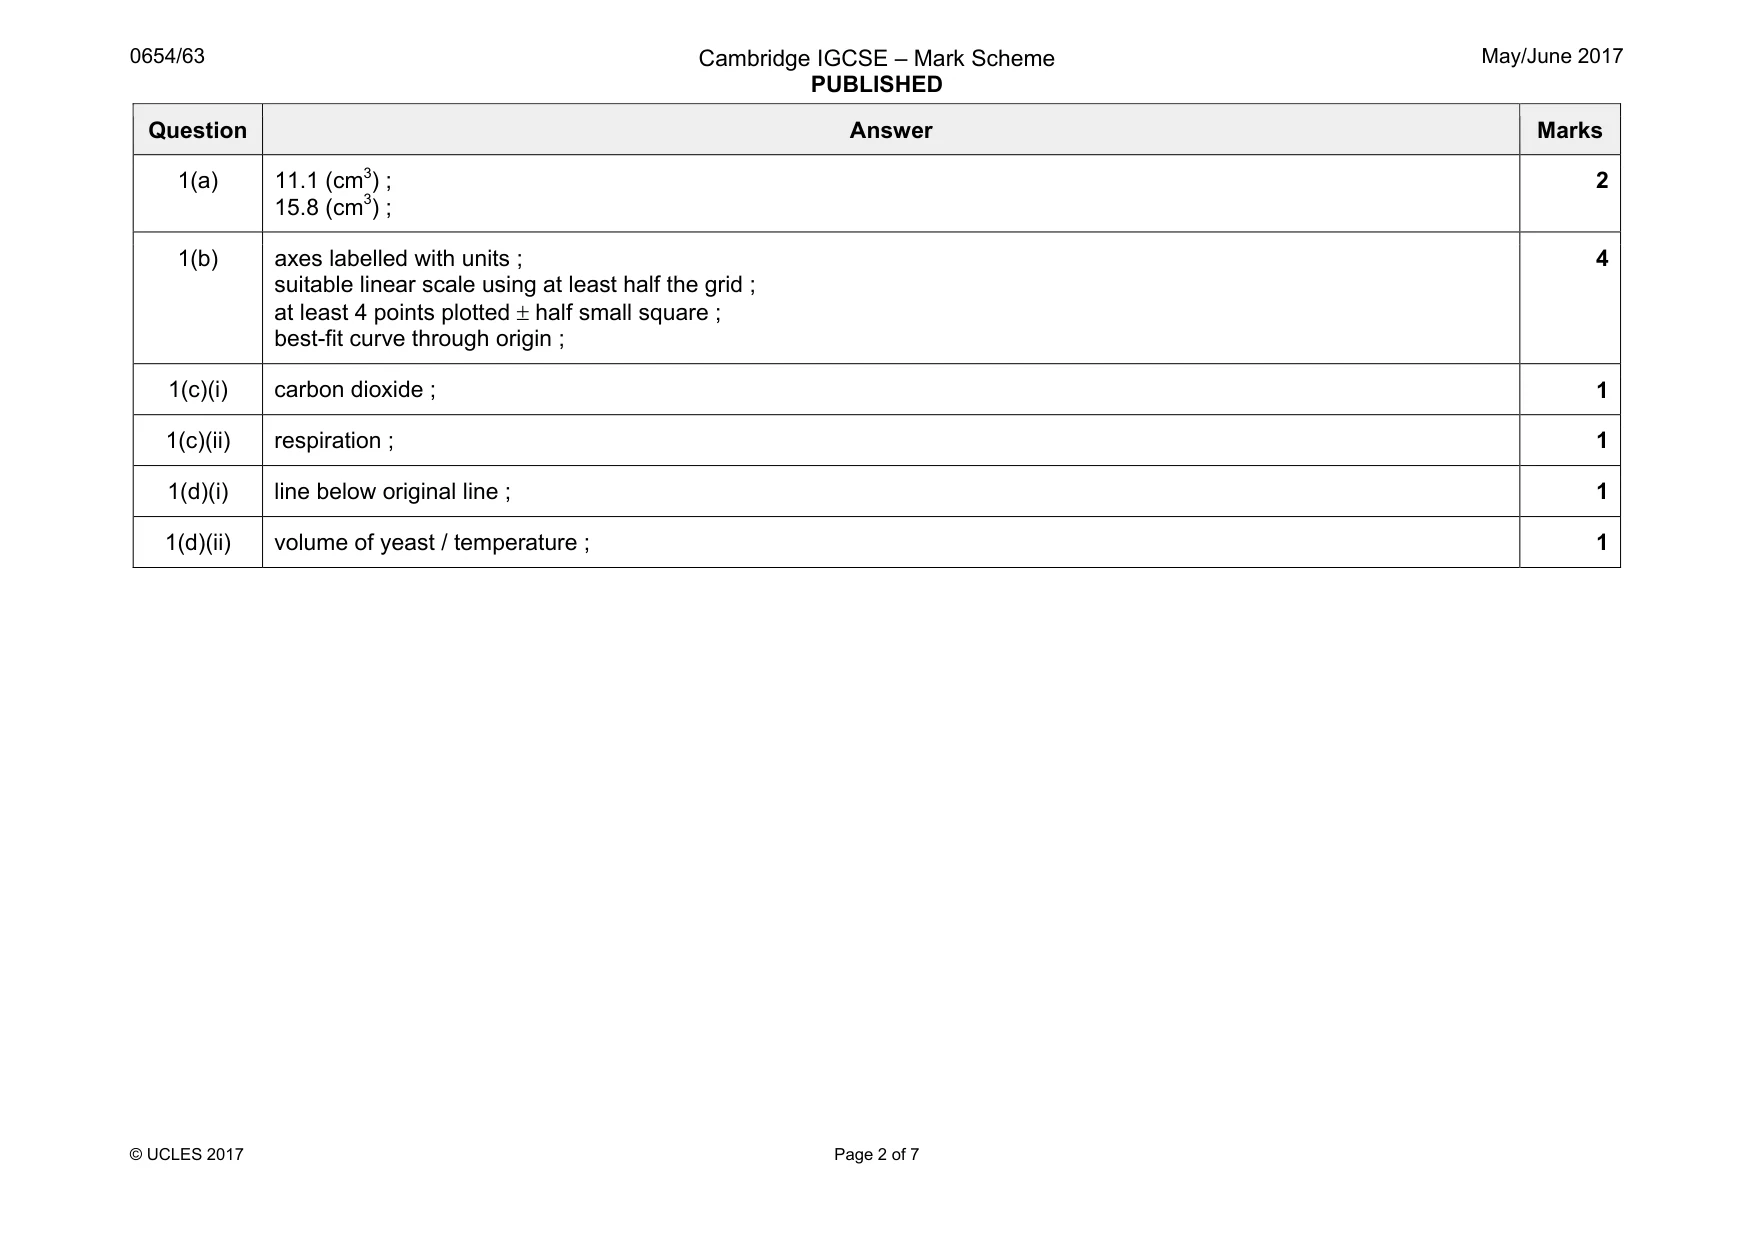
Mark scheme: 2(a)(i) completed apparatus with gas tight bung in one test-tube and delivery tube into other test-tube ; correct labels for delivery tube AND one chemical i.e. H or limewater ; 2 2(a)(ii) to avoid suck back / to prevent cold limewater hitting hot solid ; 1 2(a)(iii) H is a carbonate ; 1 2(b) H is copper carbonate ; J is copper sulfate ; OR two copper compounds ; a carbonate and a sulfate ; max 2 2(c) K is copper oxide / CuO ; 1 2(d) add barium nitrate AND white ppt. ; 1 2(e)(i) white ppt. / colourless solution / white ppt. which disappears ; 1 2(e)(ii) any ppt. has dissolved / no ppt. in excess ; 1
Q3 · A student measures the focal length, f, of a convex lens using the experimental set-up…
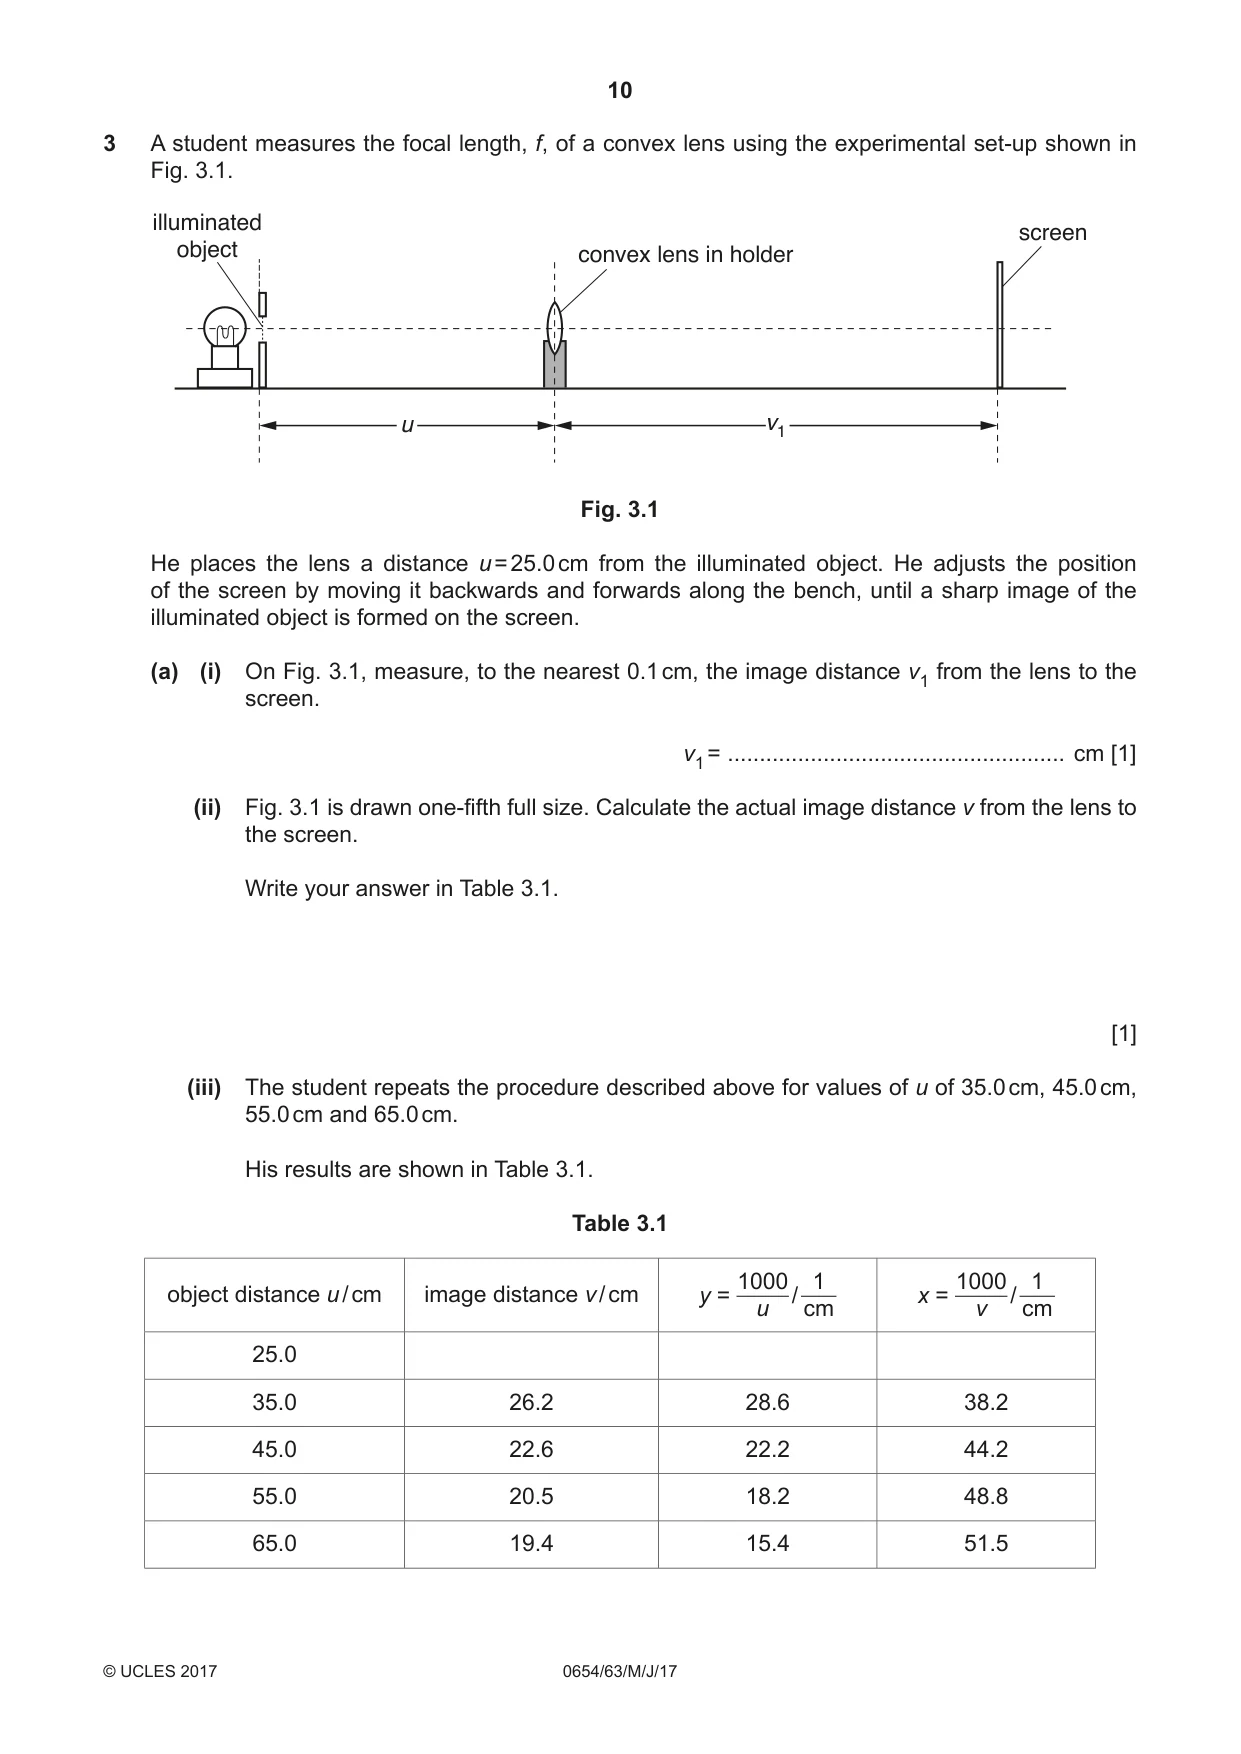
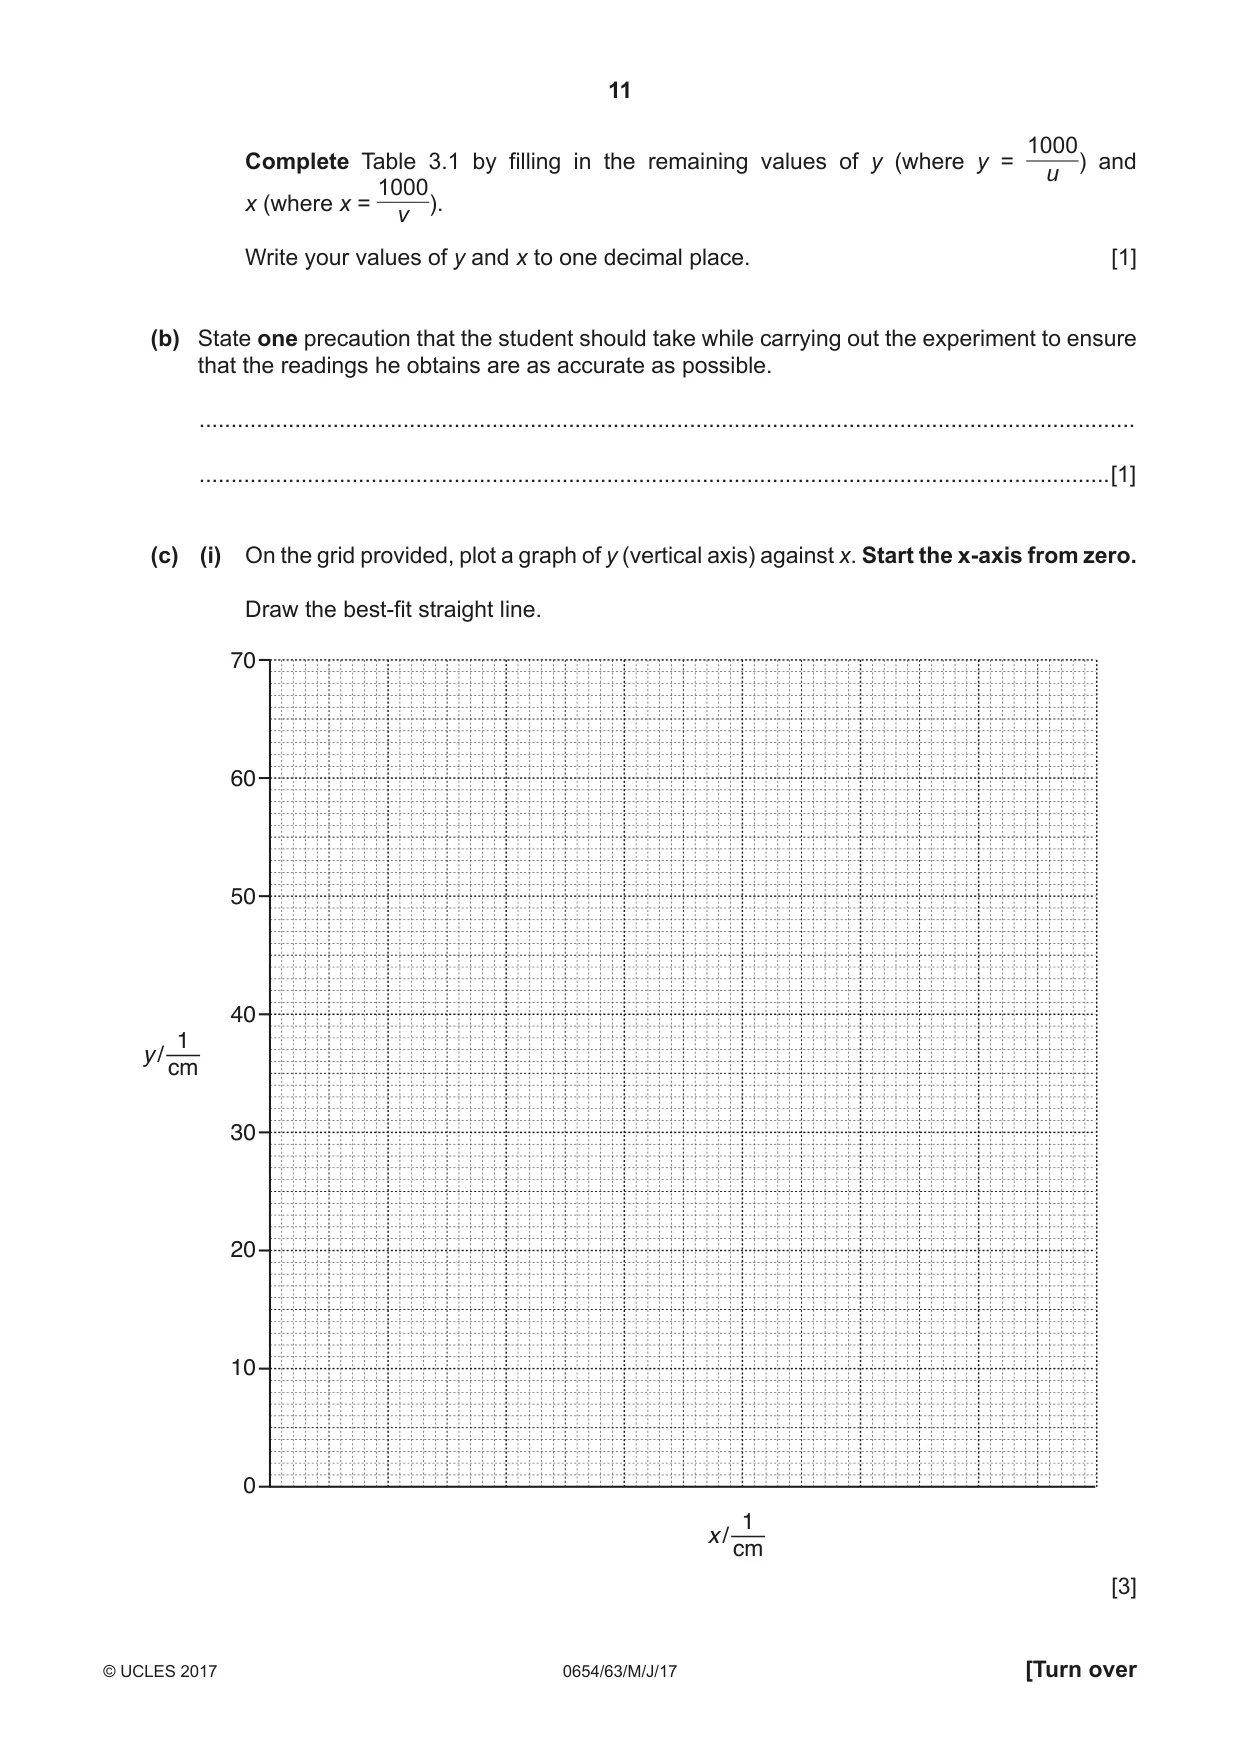
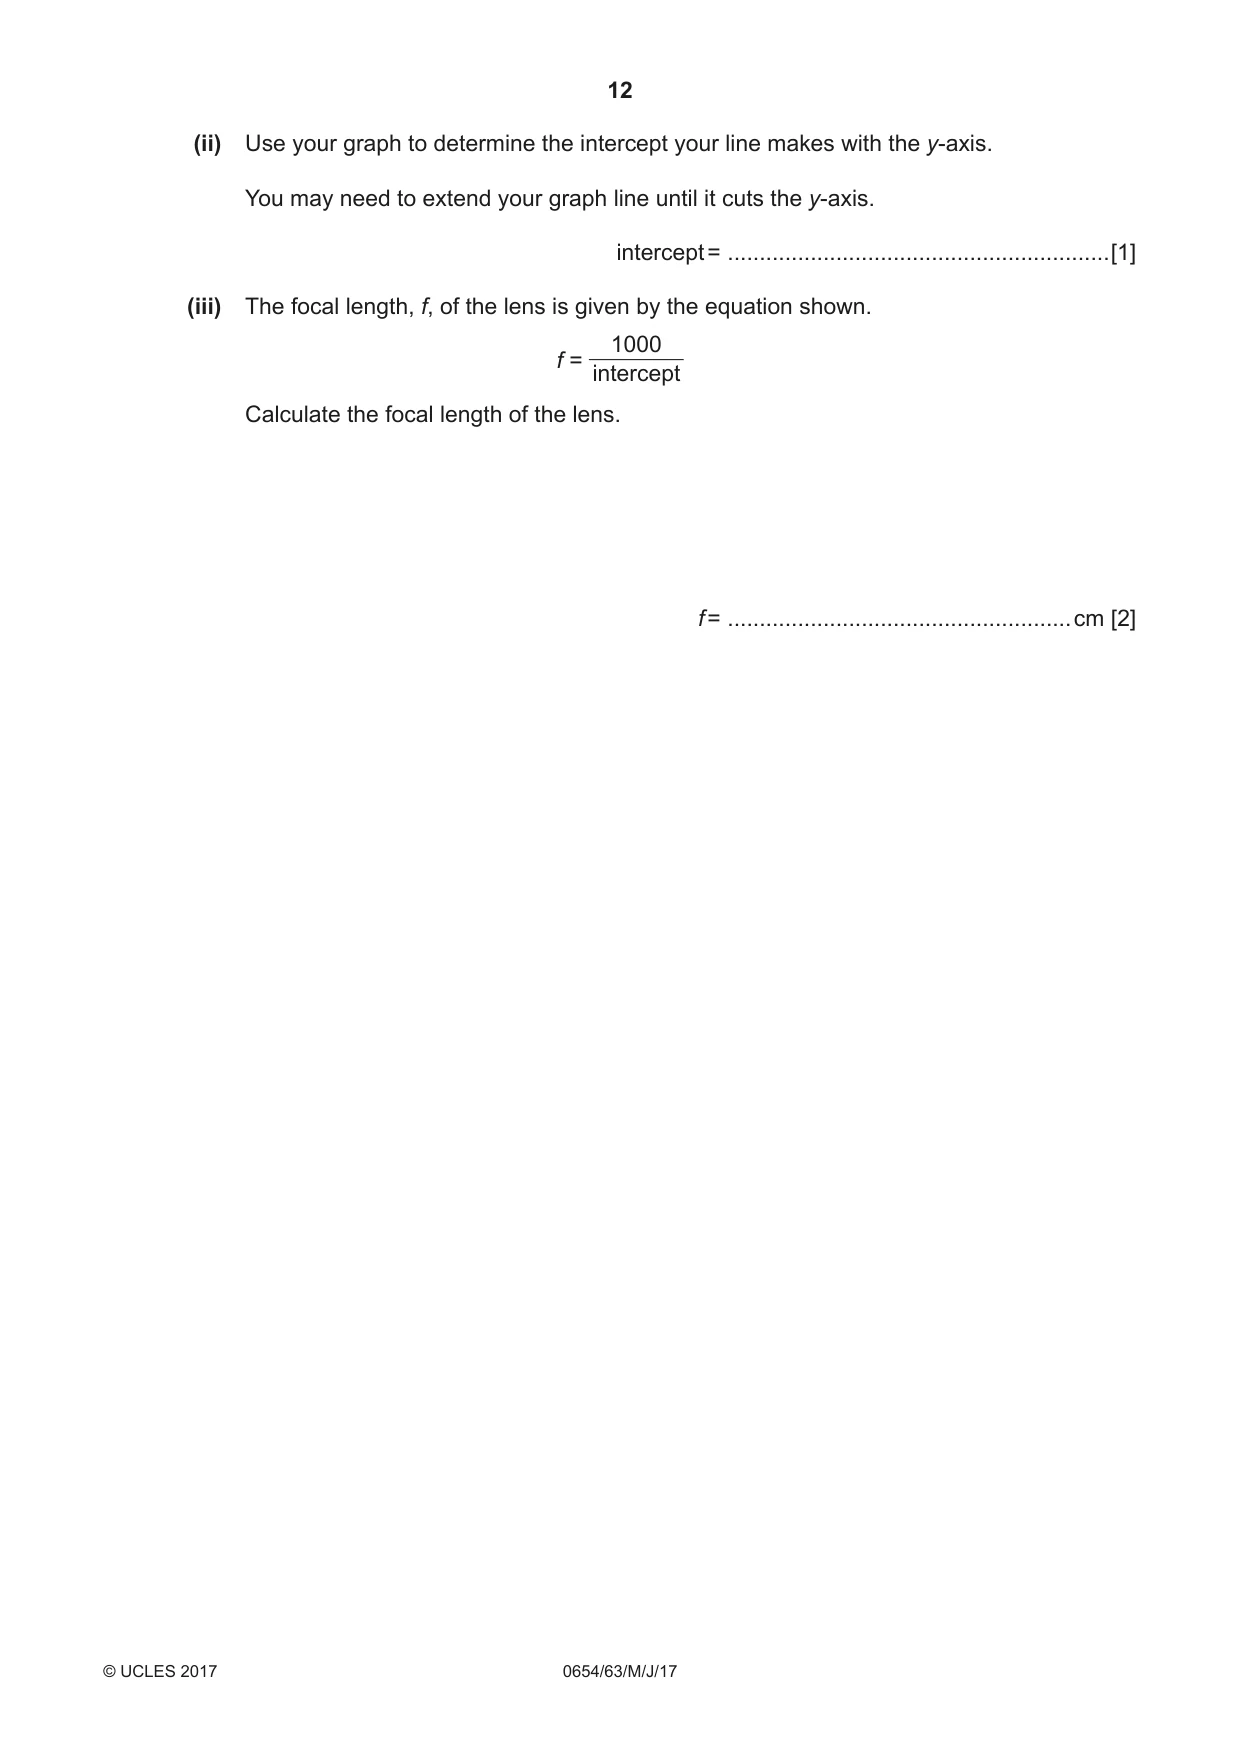
3 A student measures the focal length, f, of a convex lens using the experimental set-up shown in Fig. 3.1. illuminated screen object convex lens in holder u v1 Fig. 3.1 He places the lens a distance u = 25.0 cm from the illuminated object. He adjusts the position of the screen by moving it backwards and forwards along the bench, until a sharp image of the illuminated object is formed on the screen. (a) (i) On Fig. 3.1, measure, to the nearest 0.1 cm, the image distance v1 from the lens to the screen. v1 = ..................................................... cm [1] (ii) Fig. 3.1 is drawn one-fifth full size. Calculate the actual image distance v from the lens to the screen. Write your answer in Table 3.1. [1] (iii) The student repeats the procedure described above for values of u of 35.0 cm, 45.0 cm, 55.0 cm and 65.0 cm. His results are shown in Table 3.1. Table 3.1 1000 1 1000 1 object distance u / cm image distance v / cm y = / x = / u cm v cm 25.0 35.0 26.2 28.6 38.2 45.0 22.6 22.2 44.2 55.0 20.5 18.2 48.8 65.0 19.4 15.4 51.5 1000 Complete Table 3.1 by filling in the remaining values of y (where y = ) and u 1000 x (where x = ). v Write your values of y and x to one decimal place. [1] (b) State one precaution that the student should take while carrying out the experiment to ensure that the readings he obtains are as accurate as possible. ................................................................................................................................................... ...............................................................................................................................................[1] (c) (i) On the grid provided, plot a graph of y (vertical axis) against x. Start the x-axis from zero. Draw the best-fit straight line. 70 60 50 40 1y / cm 30 20 10 0 1 x / cm [3] (ii) Use your graph to determine the intercept your line makes with the y-axis. You may need to extend your graph line until it cuts the y-axis. intercept = ............................................................[1] (iii) The focal length, f, of the lens is given by the equation shown. 1000 f = intercept Calculate the focal length of the lens. f = ......................................................cm [2]
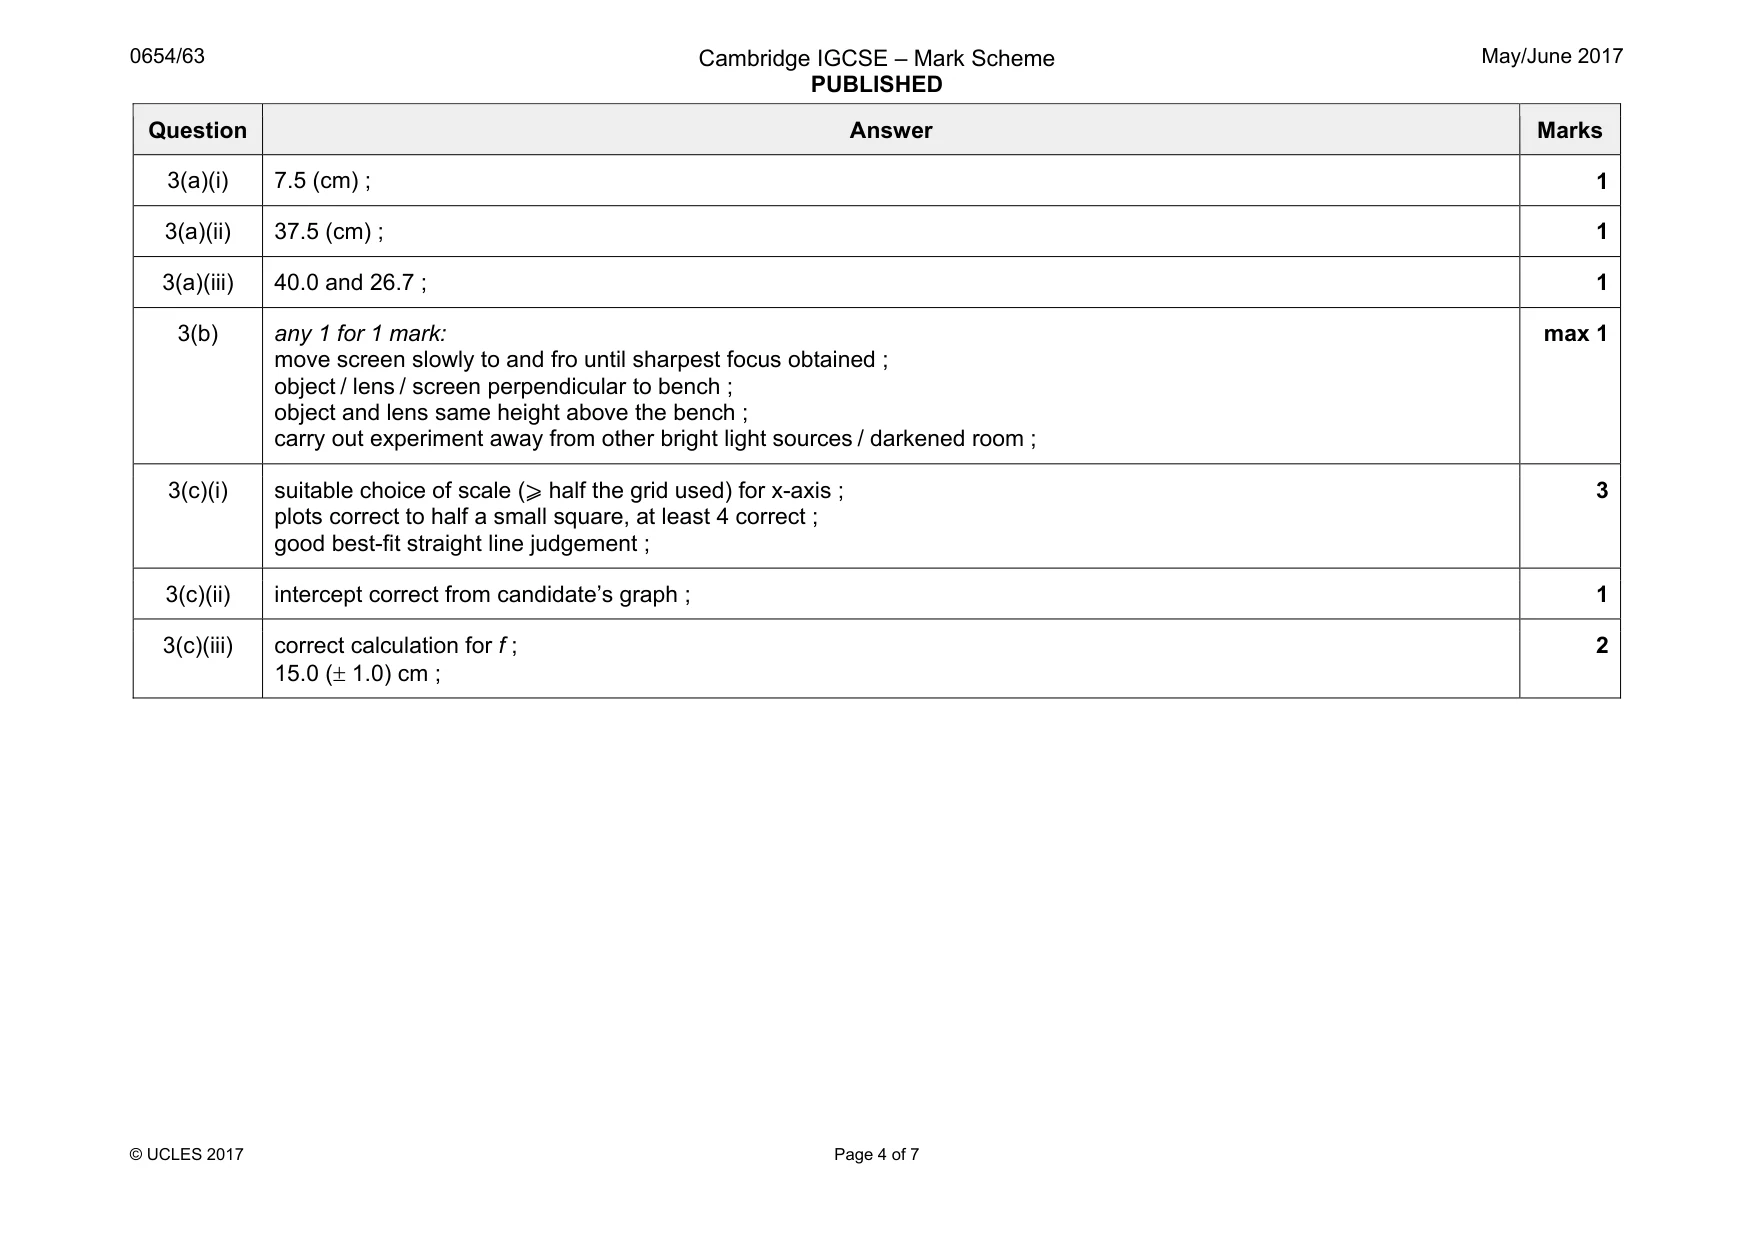
Mark scheme: 3(a)(i) 7.5 (cm) ; 1 3(a)(ii) 37.5 (cm) ; 1 3(a)(iii) 40.0 and 26.7 ; 1 3(b) any 1 for 1 mark: move screen slowly to and fro until sharpest focus obtained ; object / lens / screen perpendicular to bench ; object and lens same height above the bench ; carry out experiment away from other bright light sources / darkened room ; max 1 3(c)(i) suitable choice of scale (⩾ half the grid used) for x-axis ; plots correct to half a small square, at least 4 correct ; good best-fit straight line judgement ; 3 3(c)(ii) intercept correct from candidate’s graph ; 1 3(c)(iii) correct calculation for f ; 15.0 (± 1.0) cm ; 2
Q4 · A student investigates the effect of temperature on the growth of germinated seeds
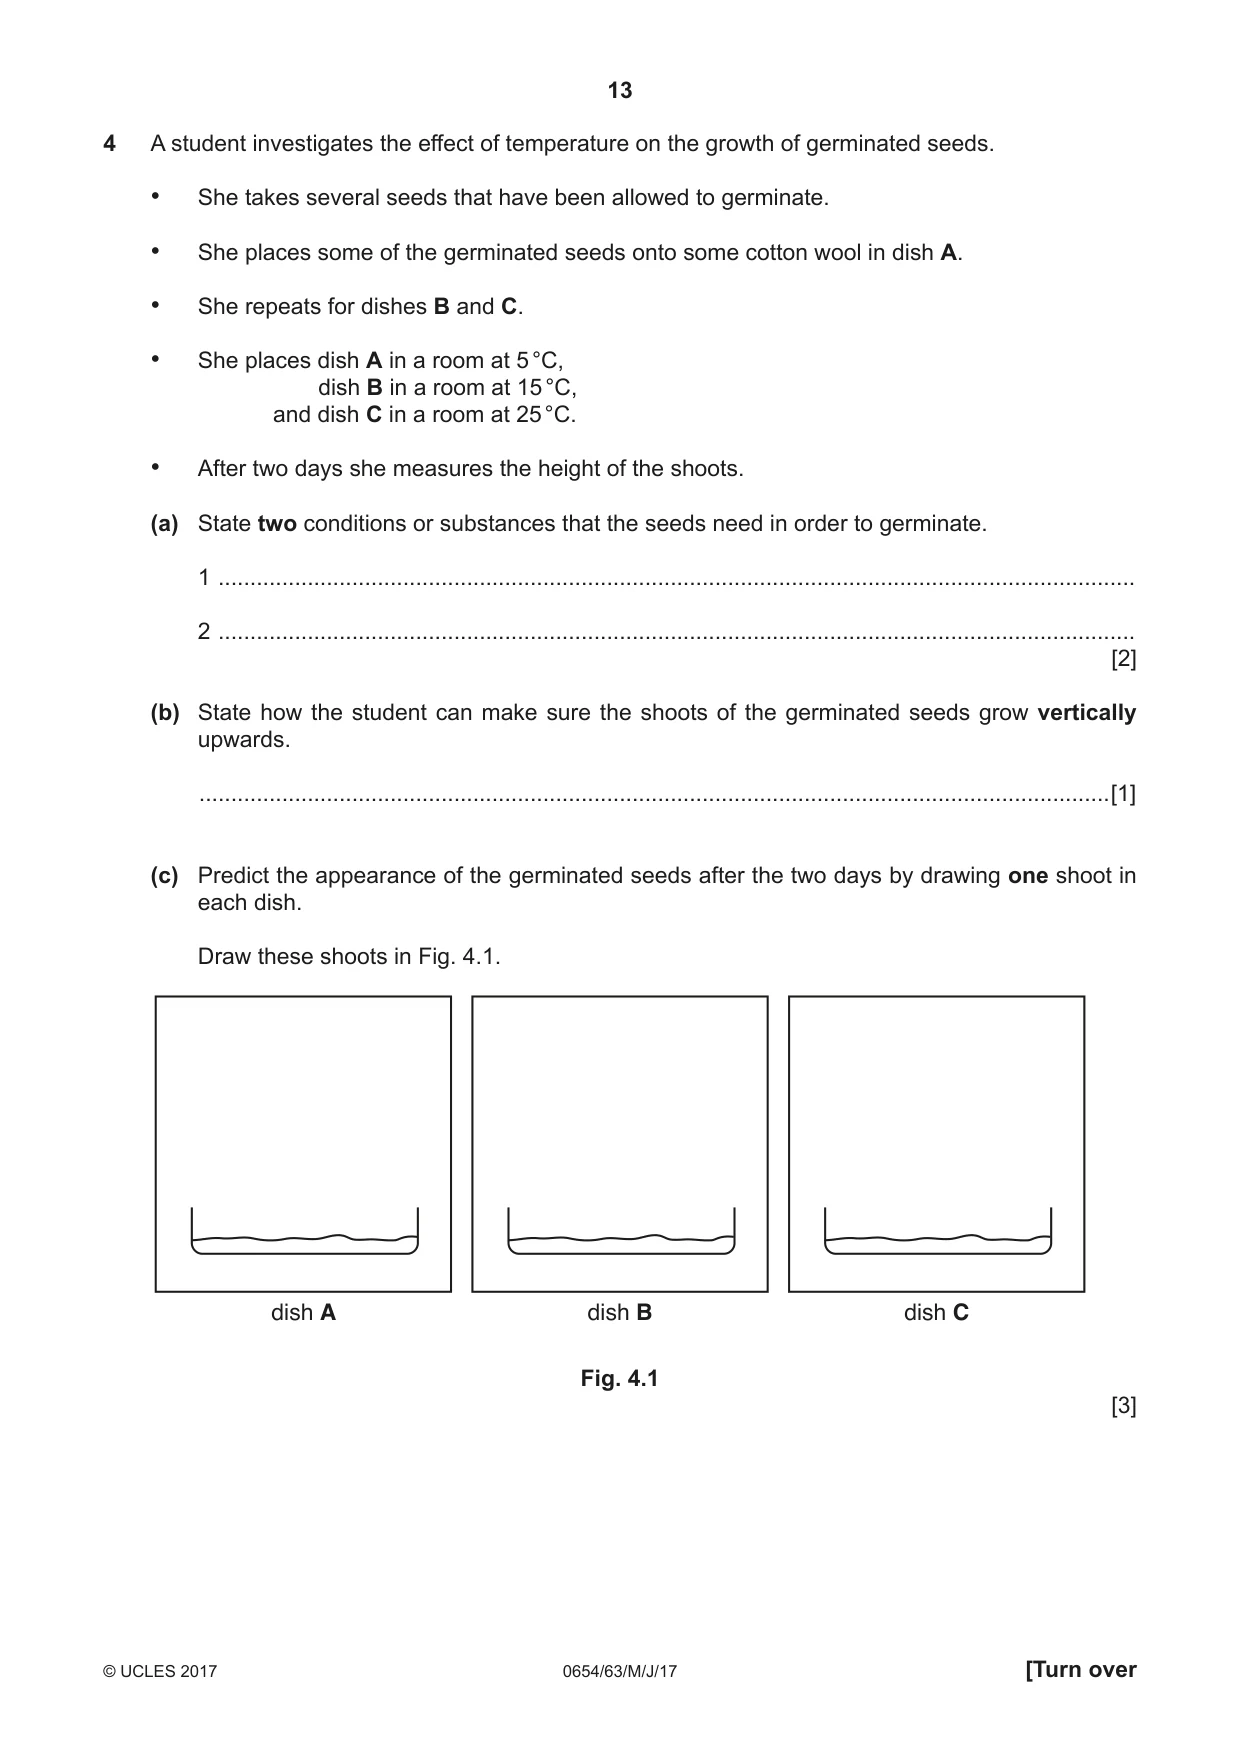
4 A student investigates the effect of temperature on the growth of germinated seeds. • She takes several seeds that have been allowed to germinate. • She places some of the germinated seeds onto some cotton wool in dish A. • She repeats for dishes B and C. • She places dish A in a room at 5 °C, dish B in a room at 15 °C, and dish C in a room at 25 °C. • After two days she measures the height of the shoots. (a) State two conditions or substances that the seeds need in order to germinate. 1 ................................................................................................................................................ 2 ................................................................................................................................................ [2] (b) State how the student can make sure the shoots of the germinated seeds grow vertically upwards. ...............................................................................................................................................[1] (c) Predict the appearance of the germinated seeds after the two days by drawing one shoot in each dish. Draw these shoots in Fig. 4.1. dish A dish B dish C Fig. 4.1 [3] (d) Describe how she could test for the presence of reducing sugar. Include the observation for a positive result. method ...................................................................................................................................... ................................................................................................................................................... ................................................................................................................................................... observation ............................................................................................................................... ................................................................................................................................................... [3] (e) Suggest why the student used more than one germinating seed in each dish. ...............................................................................................................................................[1]
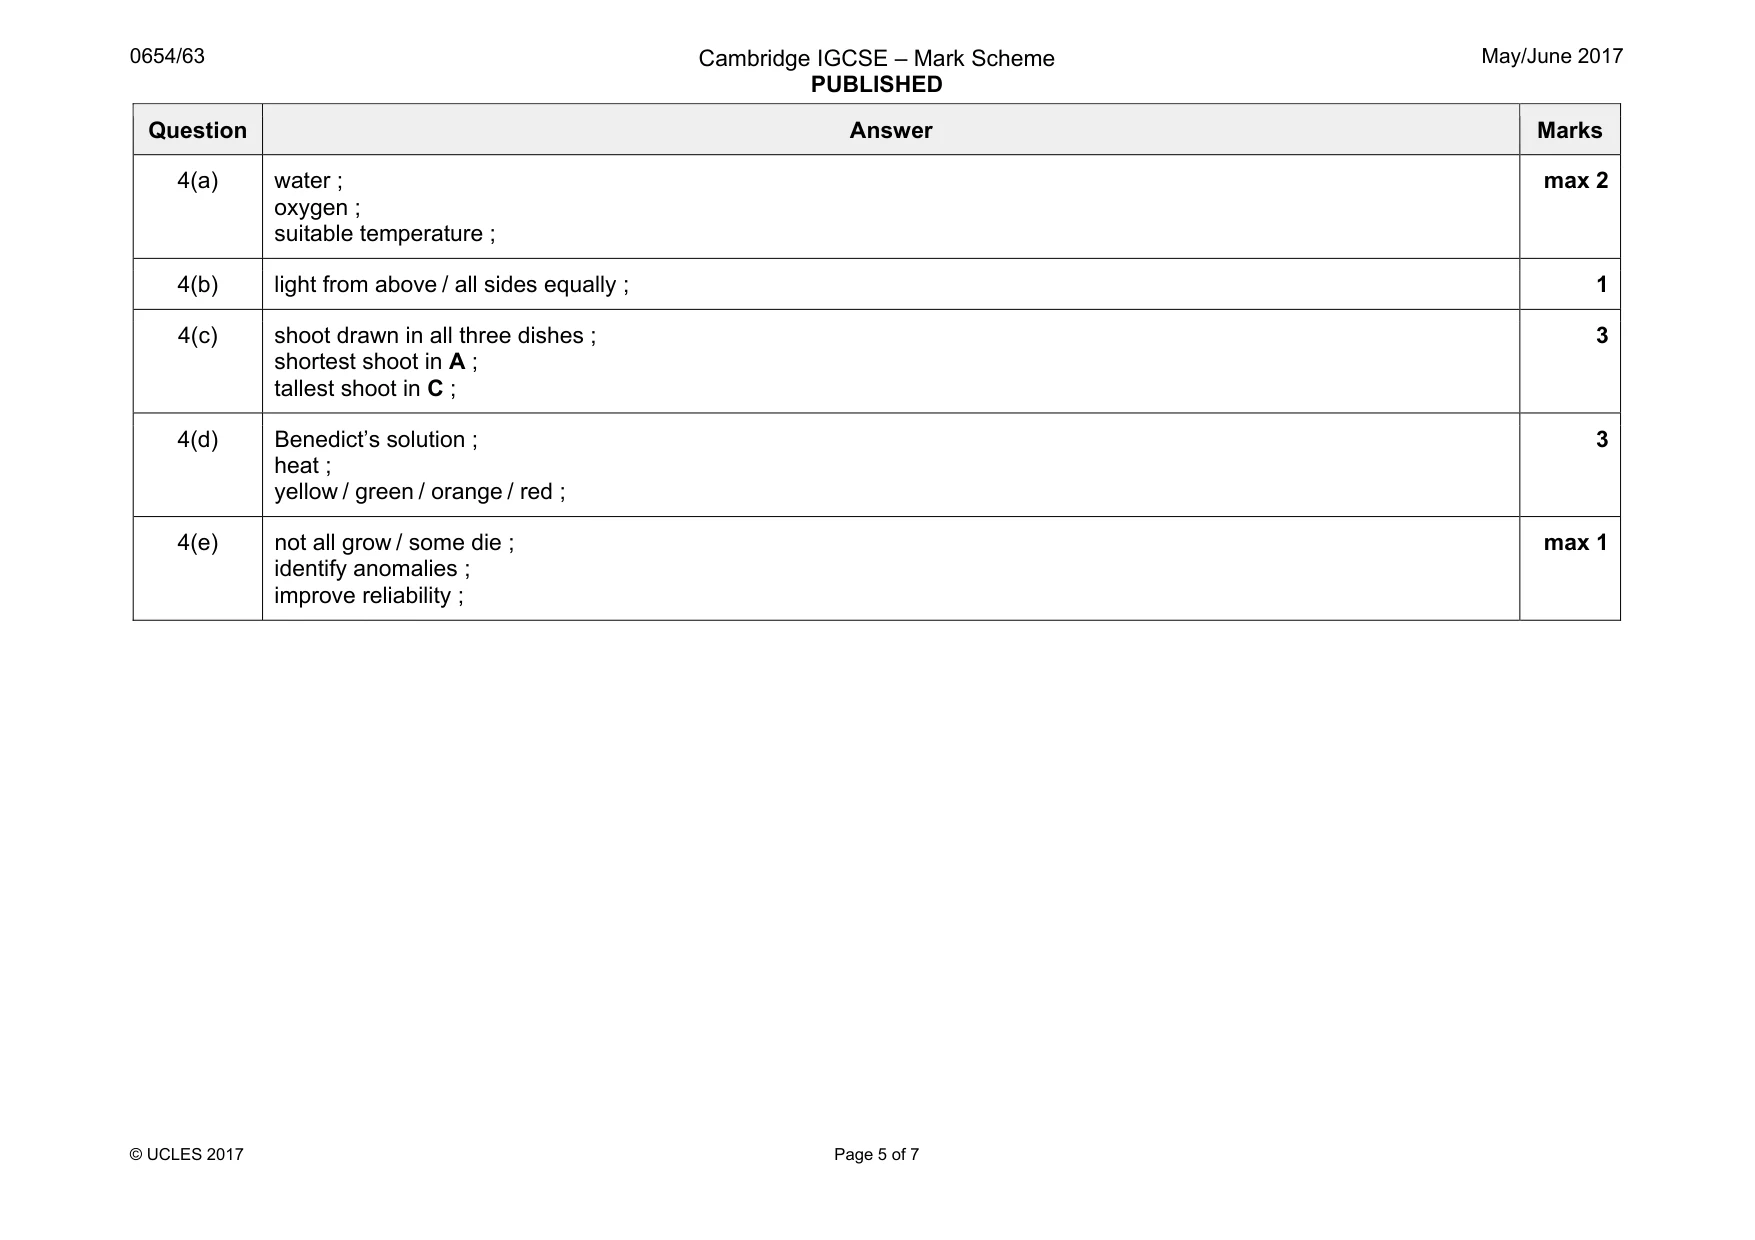
Mark scheme: 4(a) water ; oxygen ; suitable temperature ; max 2 4(b) light from above / all sides equally ; 1 4(c) shoot drawn in all three dishes ; shortest shoot in A ; tallest shoot in C ; 3 4(d) Benedict’s solution ; heat ; yellow / green / orange / red ; 3 4(e) not all grow / some die ; identify anomalies ; improve reliability ; max 1
Q5 · A student investigates the effect of surface area of a solid on the rate of reaction
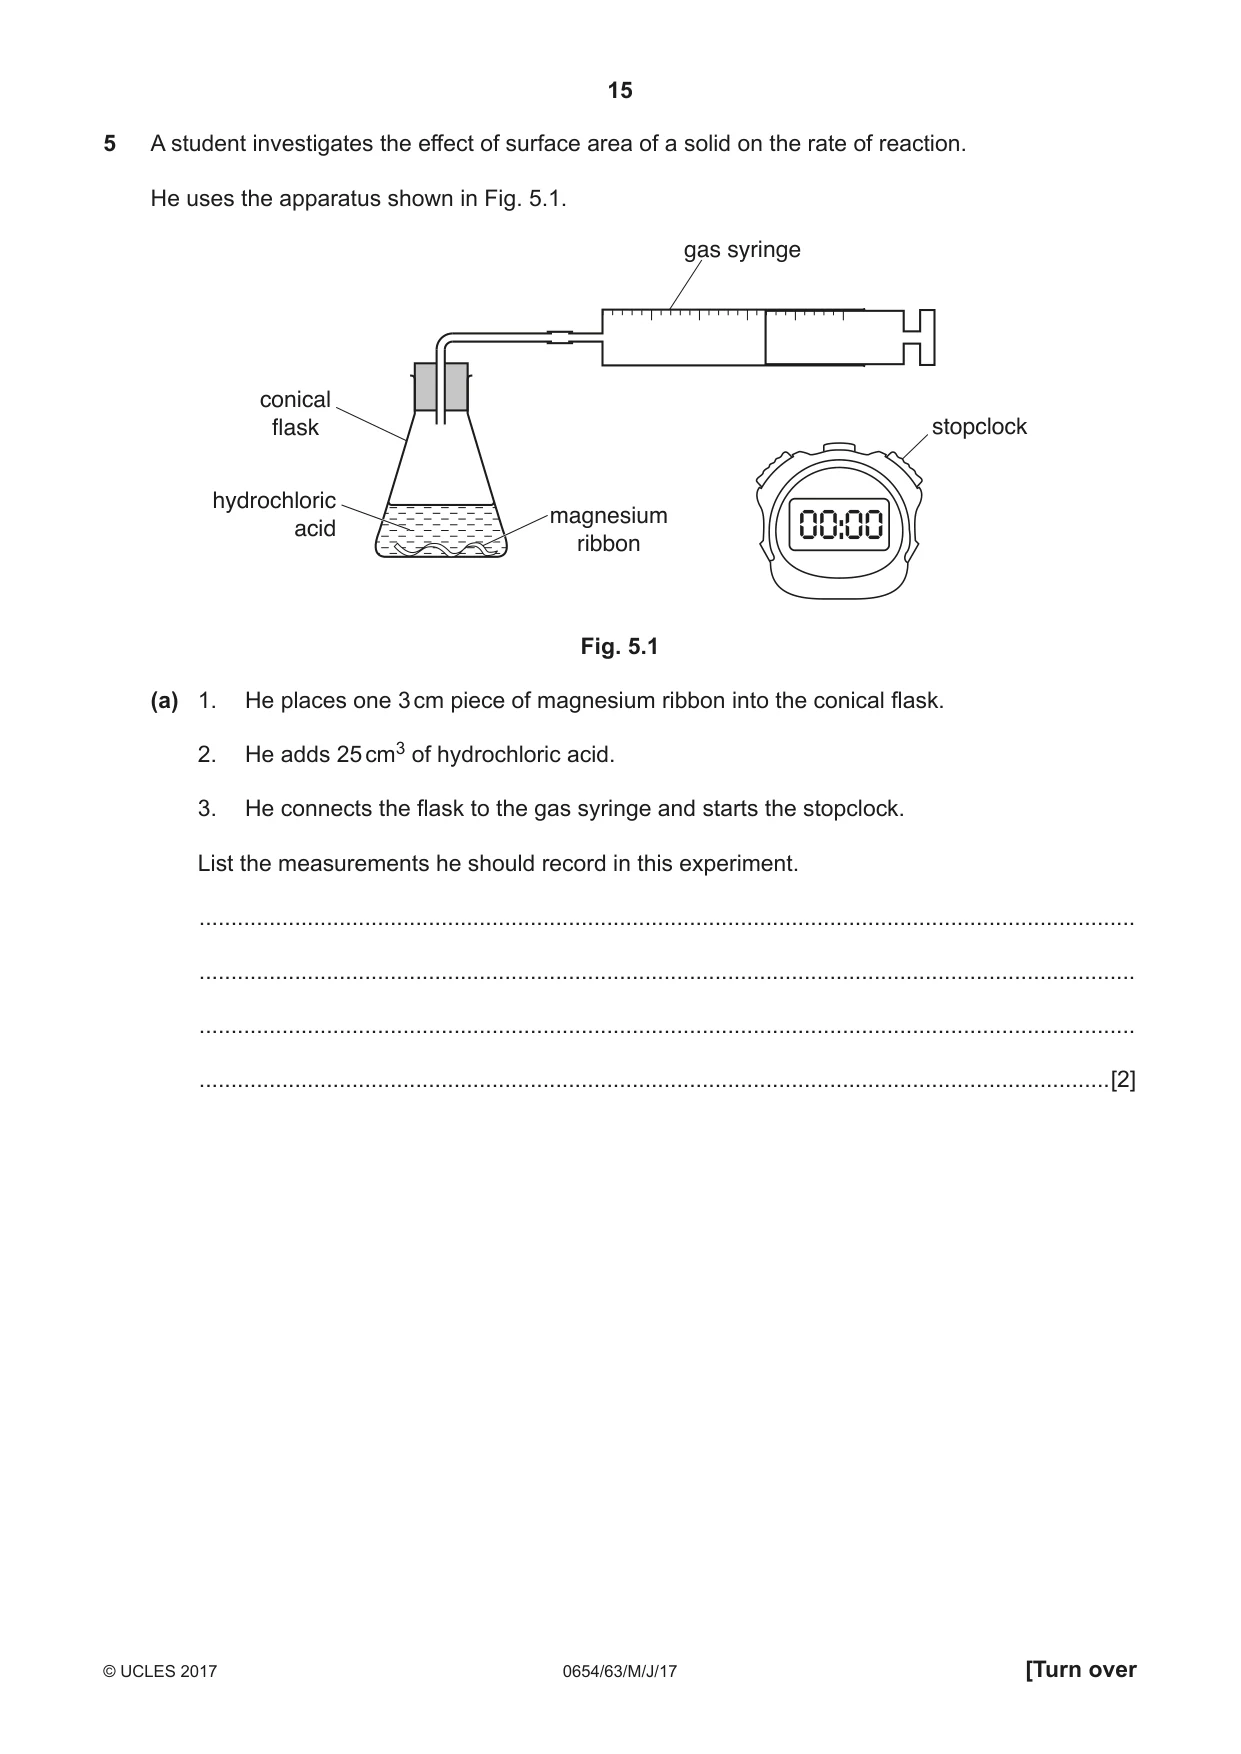
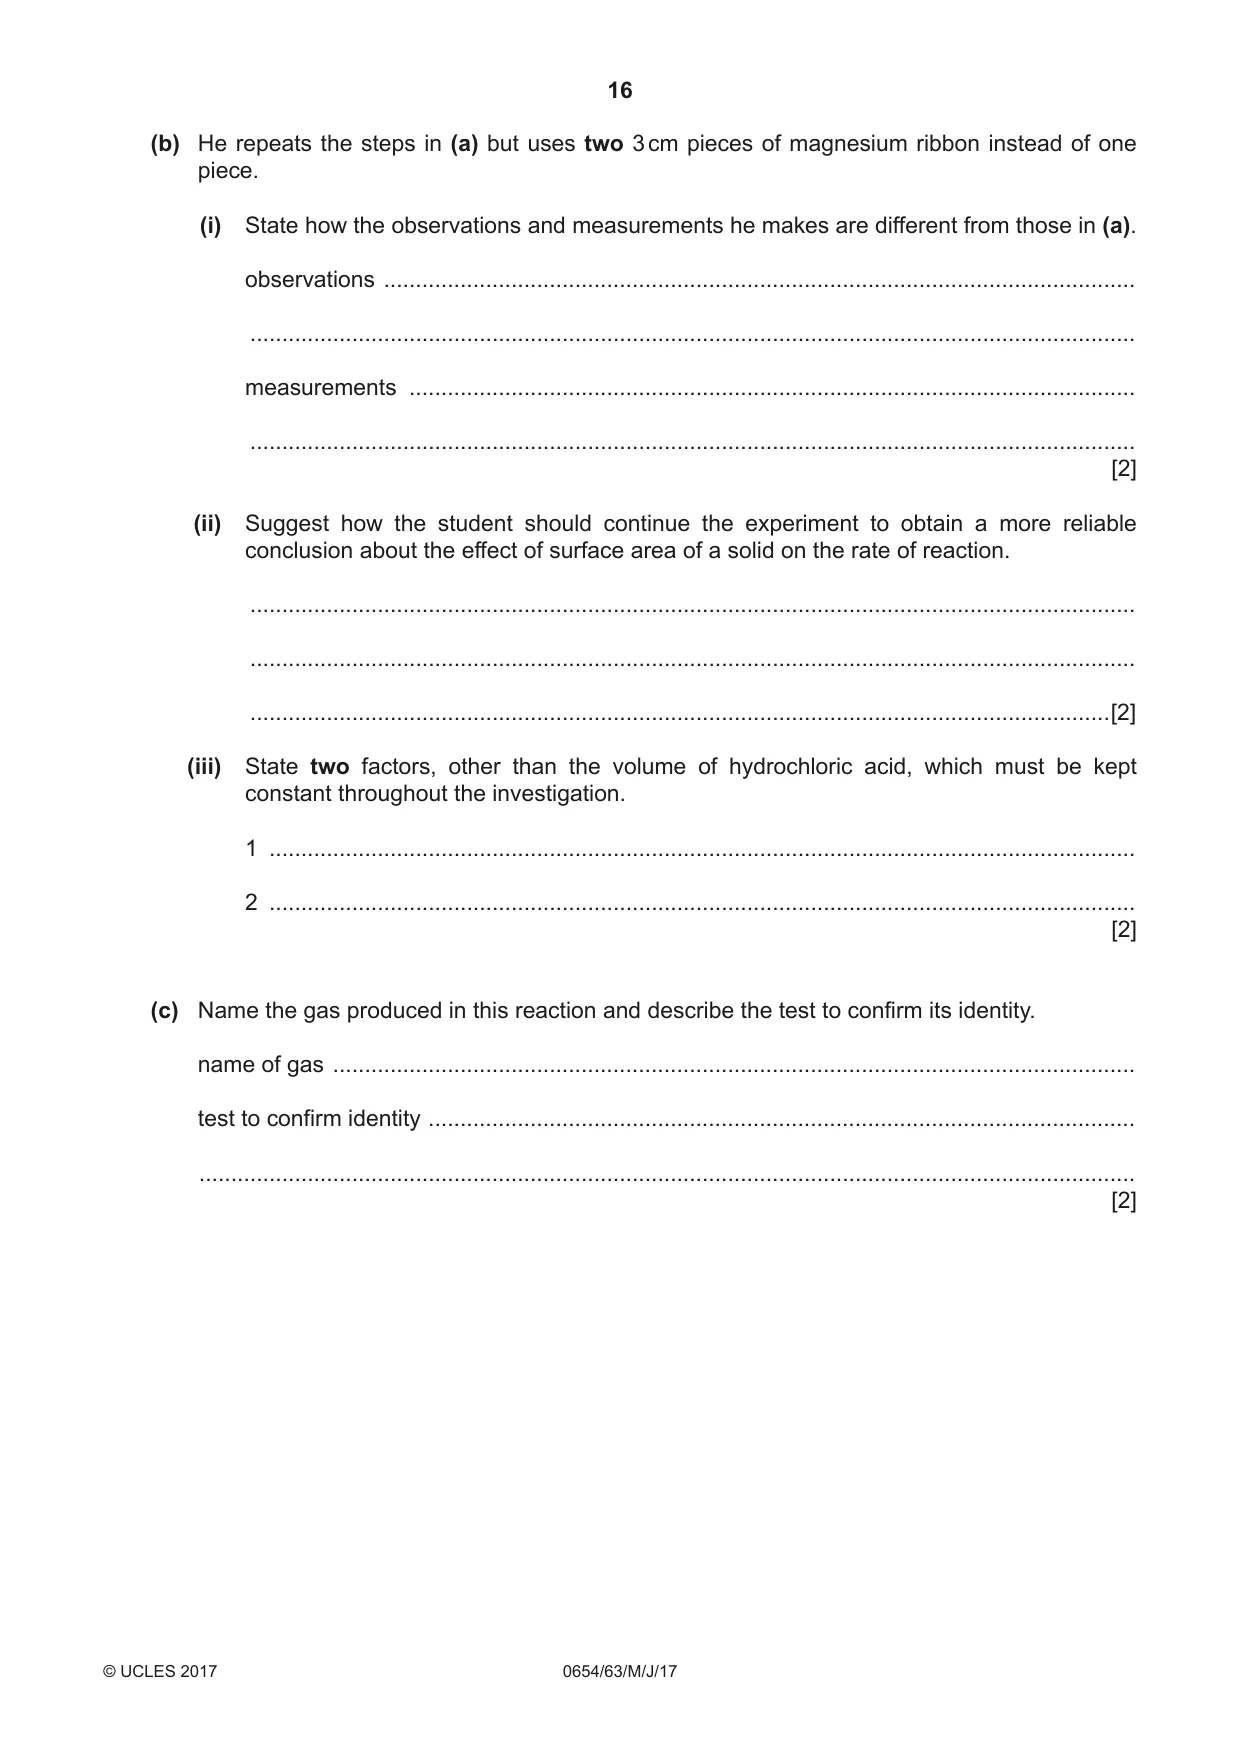
5 A student investigates the effect of surface area of a solid on the rate of reaction. He uses the apparatus shown in Fig. 5.1. gas syringe conical flask stopclock hydrochloric magnesium acid ribbon Fig. 5.1 (a) 1. He places one 3 cm piece of magnesium ribbon into the conical flask. 2. He adds 25 cm3 of hydrochloric acid. 3. He connects the flask to the gas syringe and starts the stopclock. List the measurements he should record in this experiment. ................................................................................................................................................... ................................................................................................................................................... ................................................................................................................................................... ...............................................................................................................................................[2] (b) He repeats the steps in (a) but uses two 3 cm pieces of magnesium ribbon instead of one piece. (i) State how the observations and measurements he makes are different from those in (a). observations ...................................................................................................................... ........................................................................................................................................... measurements .................................................................................................................. ........................................................................................................................................... [2] (ii) Suggest how the student should continue the experiment to obtain a more reliable conclusion about the effect of surface area of a solid on the rate of reaction. ........................................................................................................................................... ........................................................................................................................................... .......................................................................................................................................[2] (iii) State two factors, other than the volume of hydrochloric acid, which must be kept constant throughout the investigation. 1 ........................................................................................................................................ 2 ........................................................................................................................................ [2] (c) Name the gas produced in this reaction and describe the test to confirm its identity. name of gas .............................................................................................................................. test to confirm identity ............................................................................................................... ................................................................................................................................................... [2]
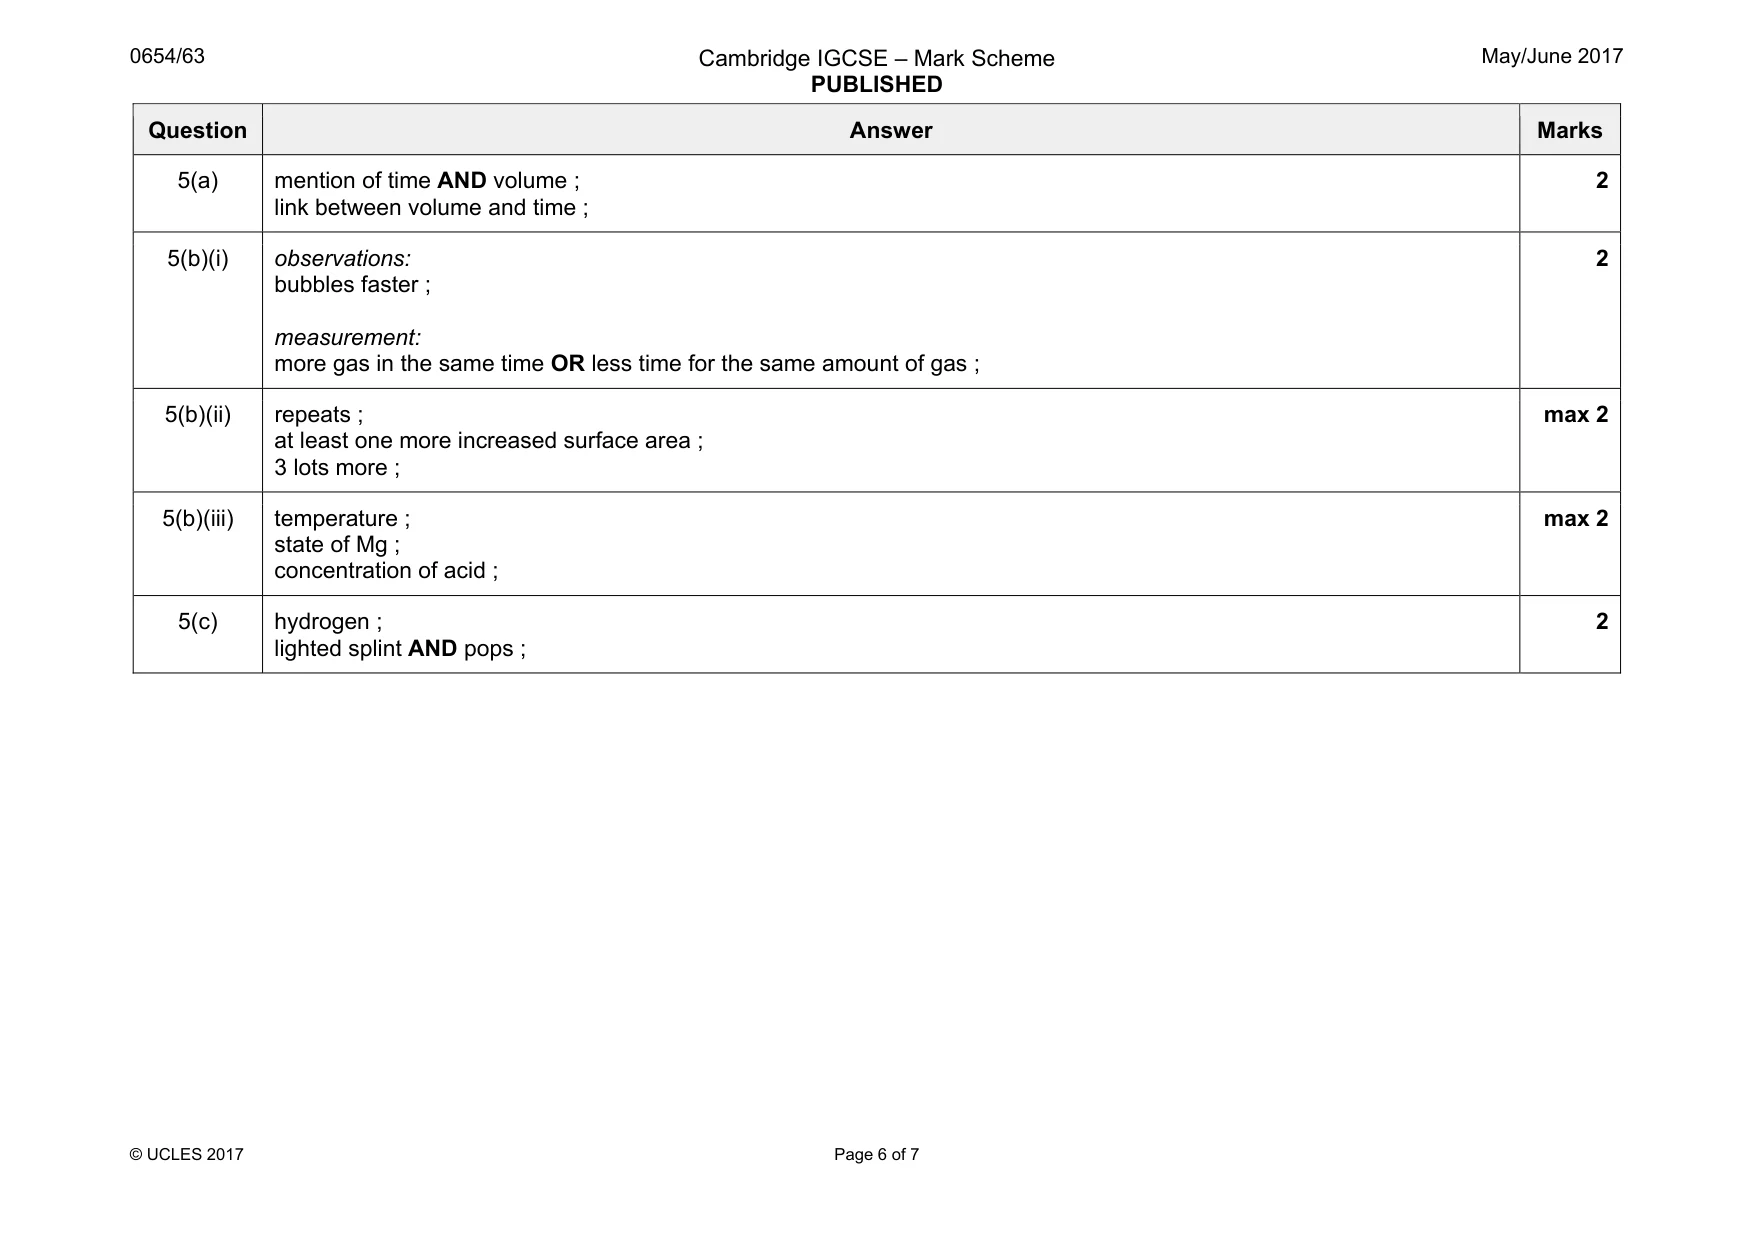
Mark scheme: 5(a) mention of time AND volume ; link between volume and time ; 2 5(b)(i) observations: bubbles faster ; measurement: more gas in the same time OR less time for the same amount of gas ; 2 5(b)(ii) repeats ; at least one more increased surface area ; 3 lots more ; max 2 5(b)(iii) temperature ; state of Mg ; concentration of acid ; max 2 5(c) hydrogen ; lighted splint AND pops ; 2
Q6 · A student investigates energy transfer
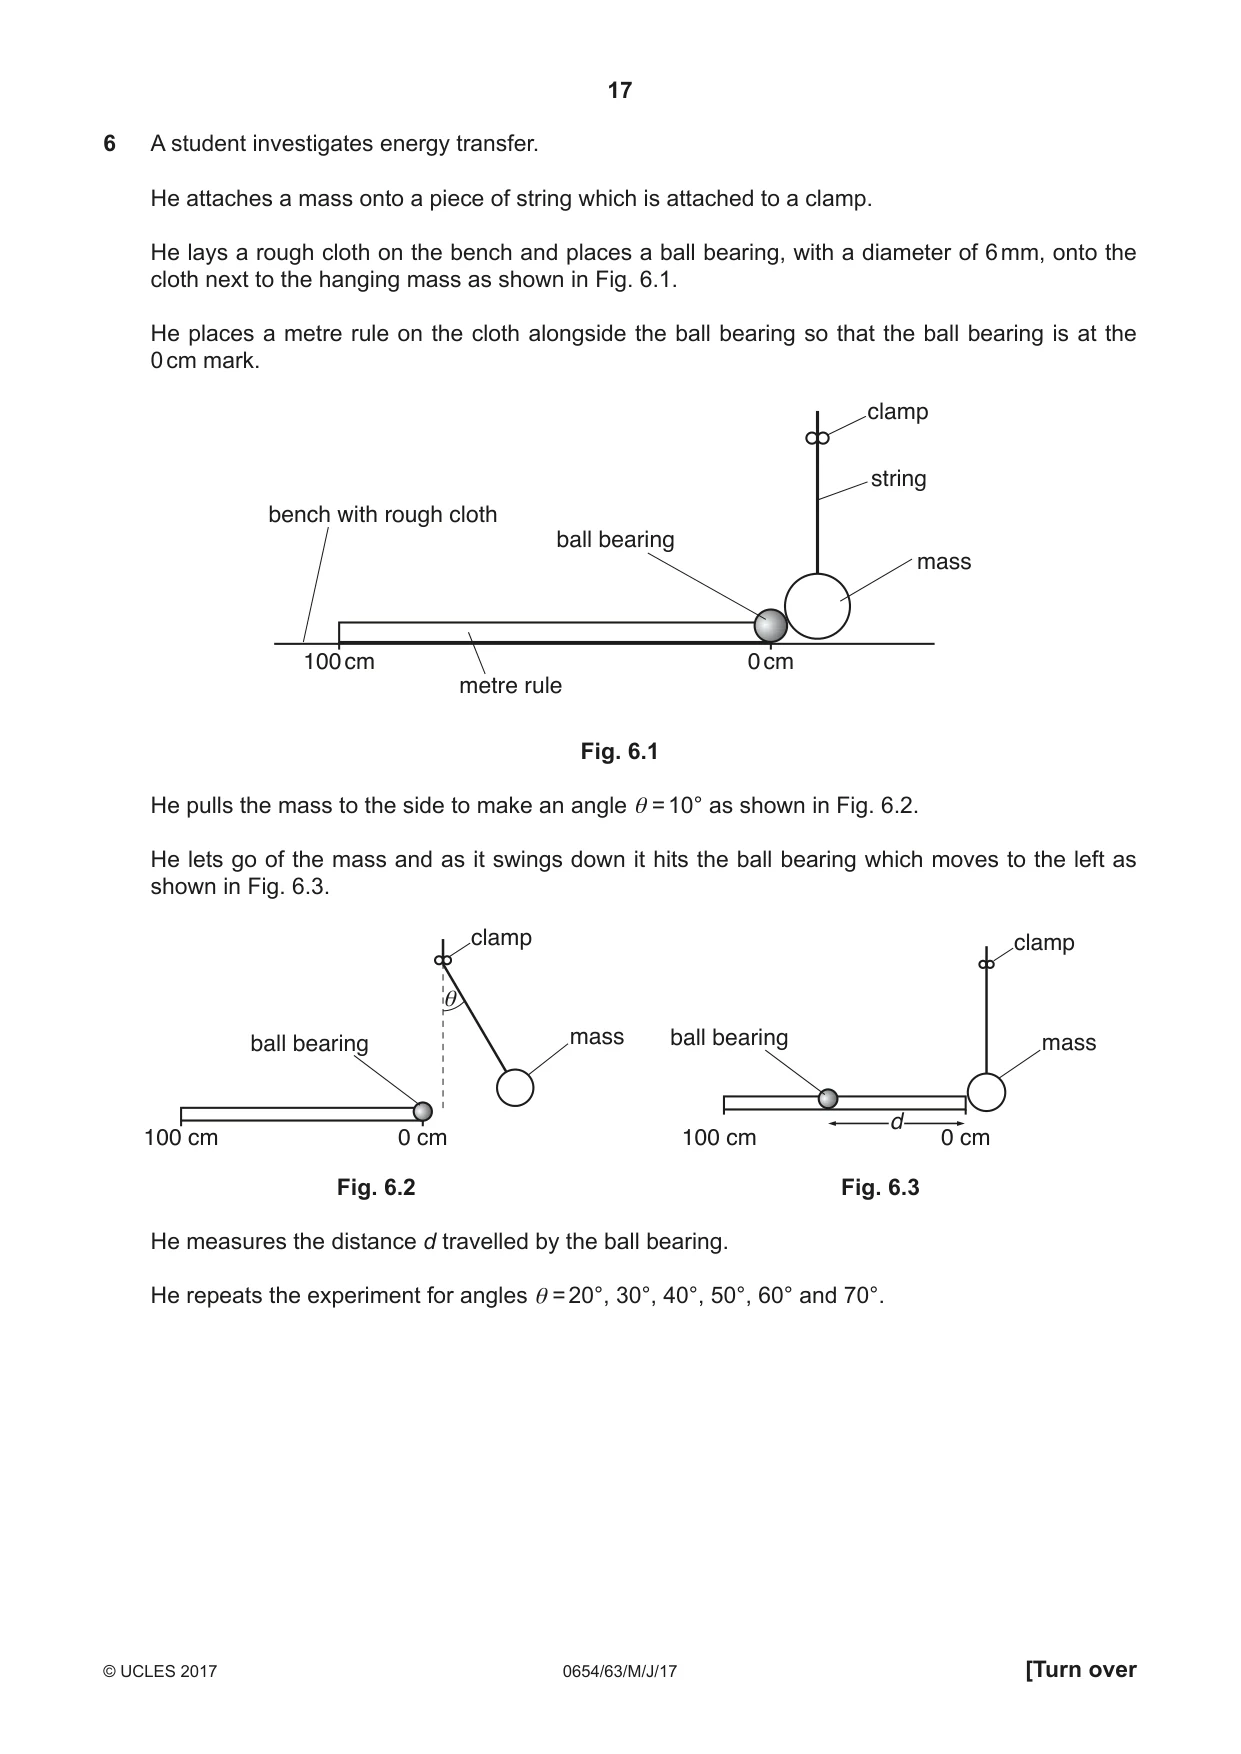
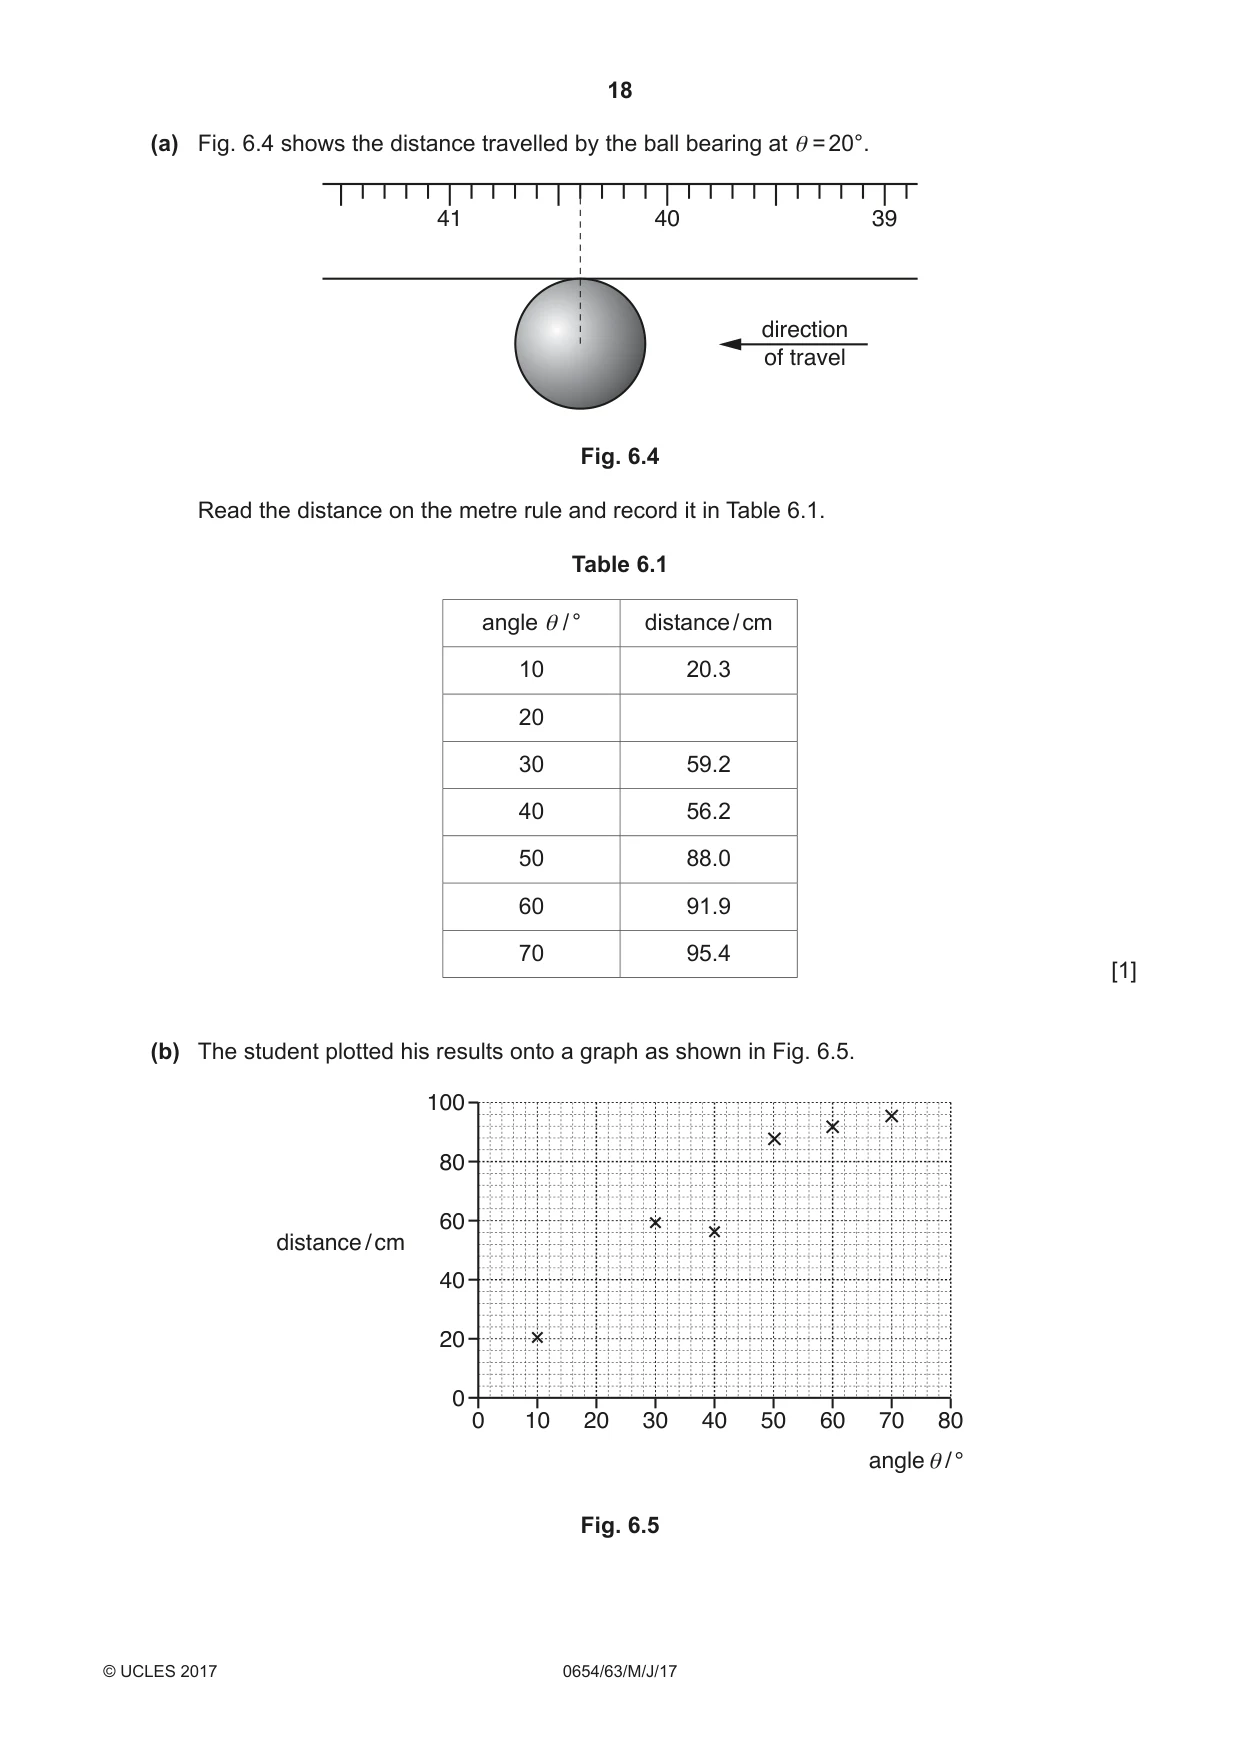
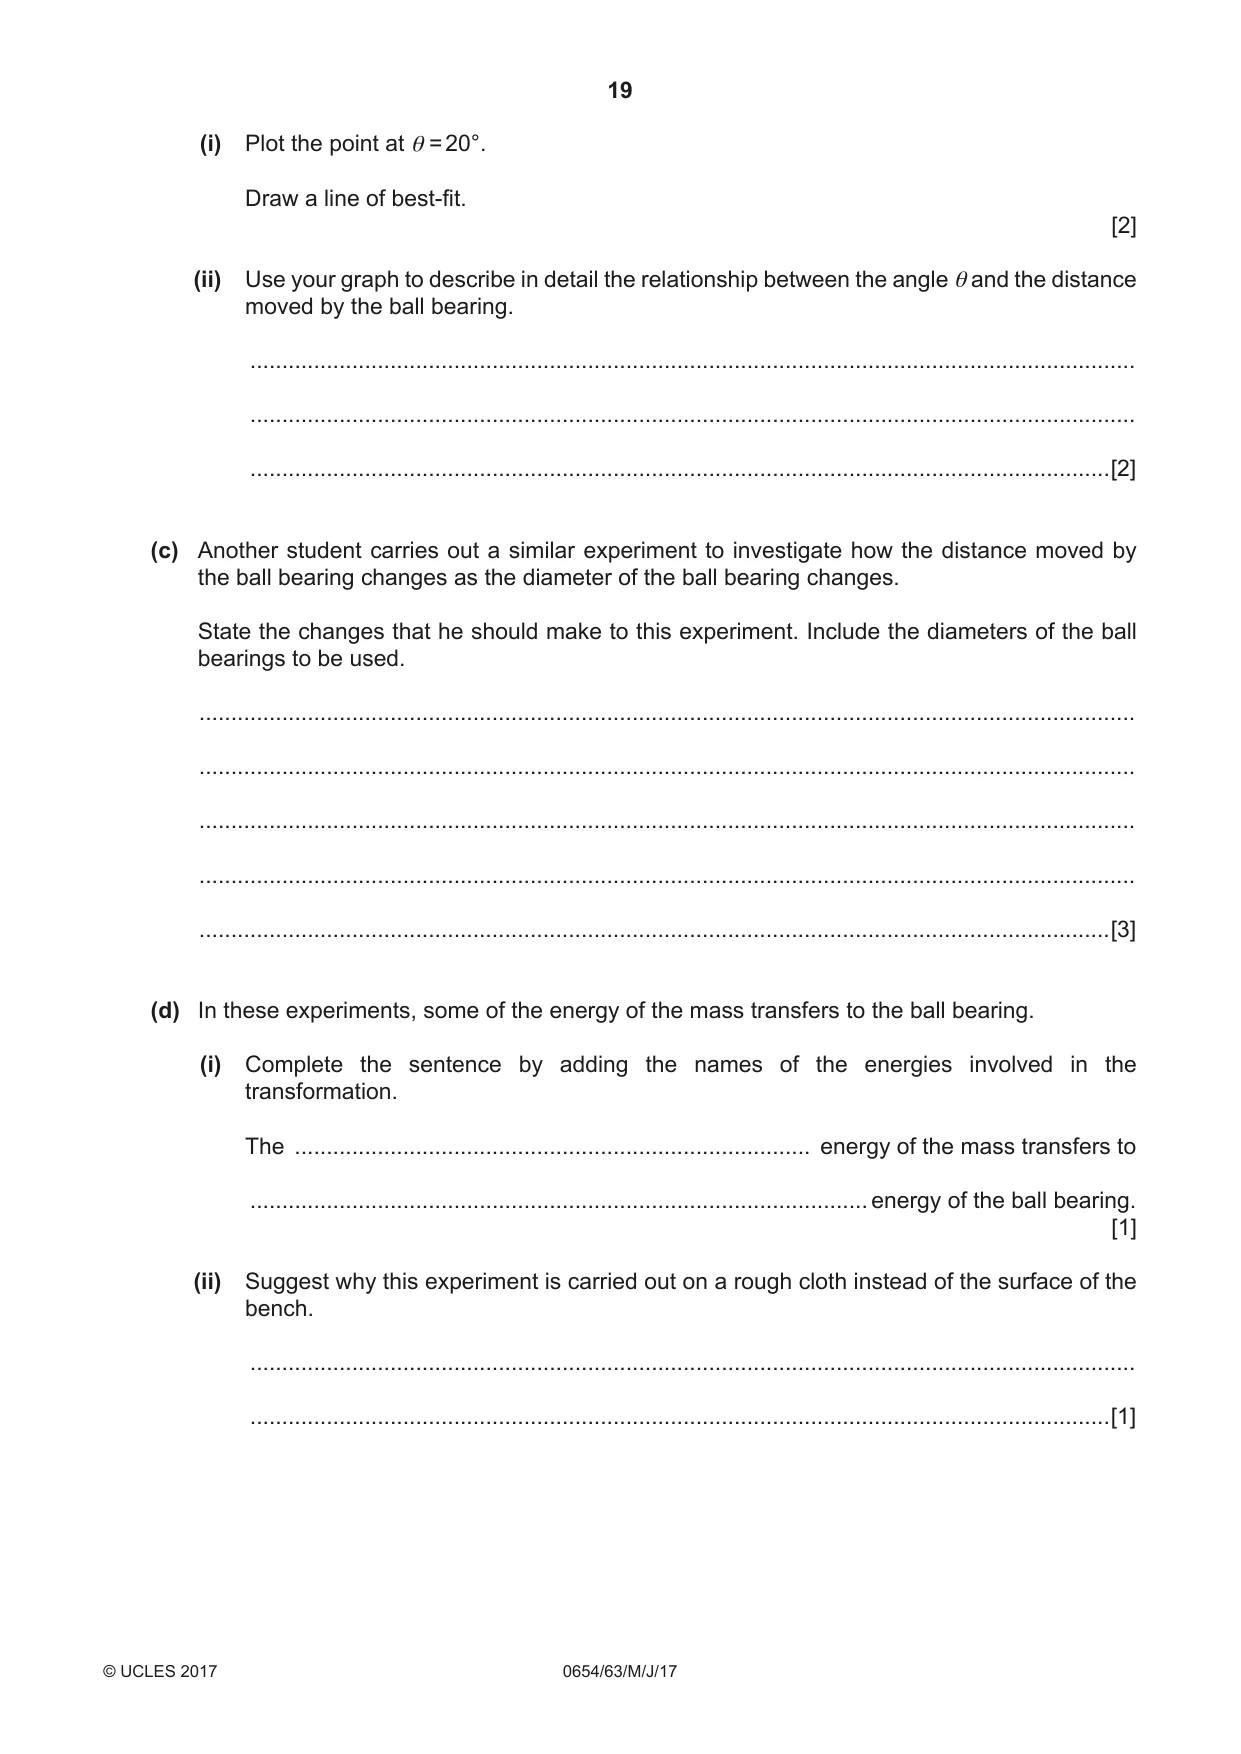
6 A student investigates energy transfer. He attaches a mass onto a piece of string which is attached to a clamp. He lays a rough cloth on the bench and places a ball bearing, with a diameter of 6 mm, onto the cloth next to the hanging mass as shown in Fig. 6.1. He places a metre rule on the cloth alongside the ball bearing so that the ball bearing is at the 0 cm mark. clamp string bench with rough cloth ball bearing mass 100 cm 0 cm metre rule Fig. 6.1 He pulls the mass to the side to make an angle θ = 10° as shown in Fig. 6.2. He lets go of the mass and as it swings down it hits the ball bearing which moves to the left as shown in Fig. 6.3. clamp clamp θ mass ball bearing mass ball bearing d 100 cm 0 cm 100 cm 0 cm Fig. 6.2 Fig. 6.3 He measures the distance d travelled by the ball bearing. He repeats the experiment for angles θ = 20°, 30°, 40°, 50°, 60° and 70°. (a) Fig. 6.4 shows the distance travelled by the ball bearing at θ = 20°. 41 40 39 direction of travel Fig. 6.4 Read the distance on the metre rule and record it in Table 6.1. Table 6.1 angle θ / ° distance / cm 10 20.3 20 30 59.2 40 56.2 50 88.0 60 91.9 70 95.4 [1] (b) The student plotted his results onto a graph as shown in Fig. 6.5. 100 80 60 distance / cm 40 20 0 0 10 20 30 40 50 60 70 80 angleθ / ° Fig. 6.5 (i) Plot the point at θ = 20°. Draw a line of best-fit. [2] (ii) Use your graph to describe in detail the relationship between the angle θ and the distance moved by the ball bearing. ........................................................................................................................................... ........................................................................................................................................... .......................................................................................................................................[2] (c) Another student carries out a similar experiment to investigate how the distance moved by the ball bearing changes as the diameter of the ball bearing changes. State the changes that he should make to this experiment. Include the diameters of the ball bearings to be used. ................................................................................................................................................... ................................................................................................................................................... ................................................................................................................................................... ................................................................................................................................................... ...............................................................................................................................................[3] (d) In these experiments, some of the energy of the mass transfers to the ball bearing. (i) Complete the sentence by adding the names of the energies involved in the transformation. The ................................................................................. energy of the mass transfers to ................................................................................................. energy of the ball bearing. [1] (ii) Suggest why this experiment is carried out on a rough cloth instead of the surface of the bench. ........................................................................................................................................... .......................................................................................................................................[1]
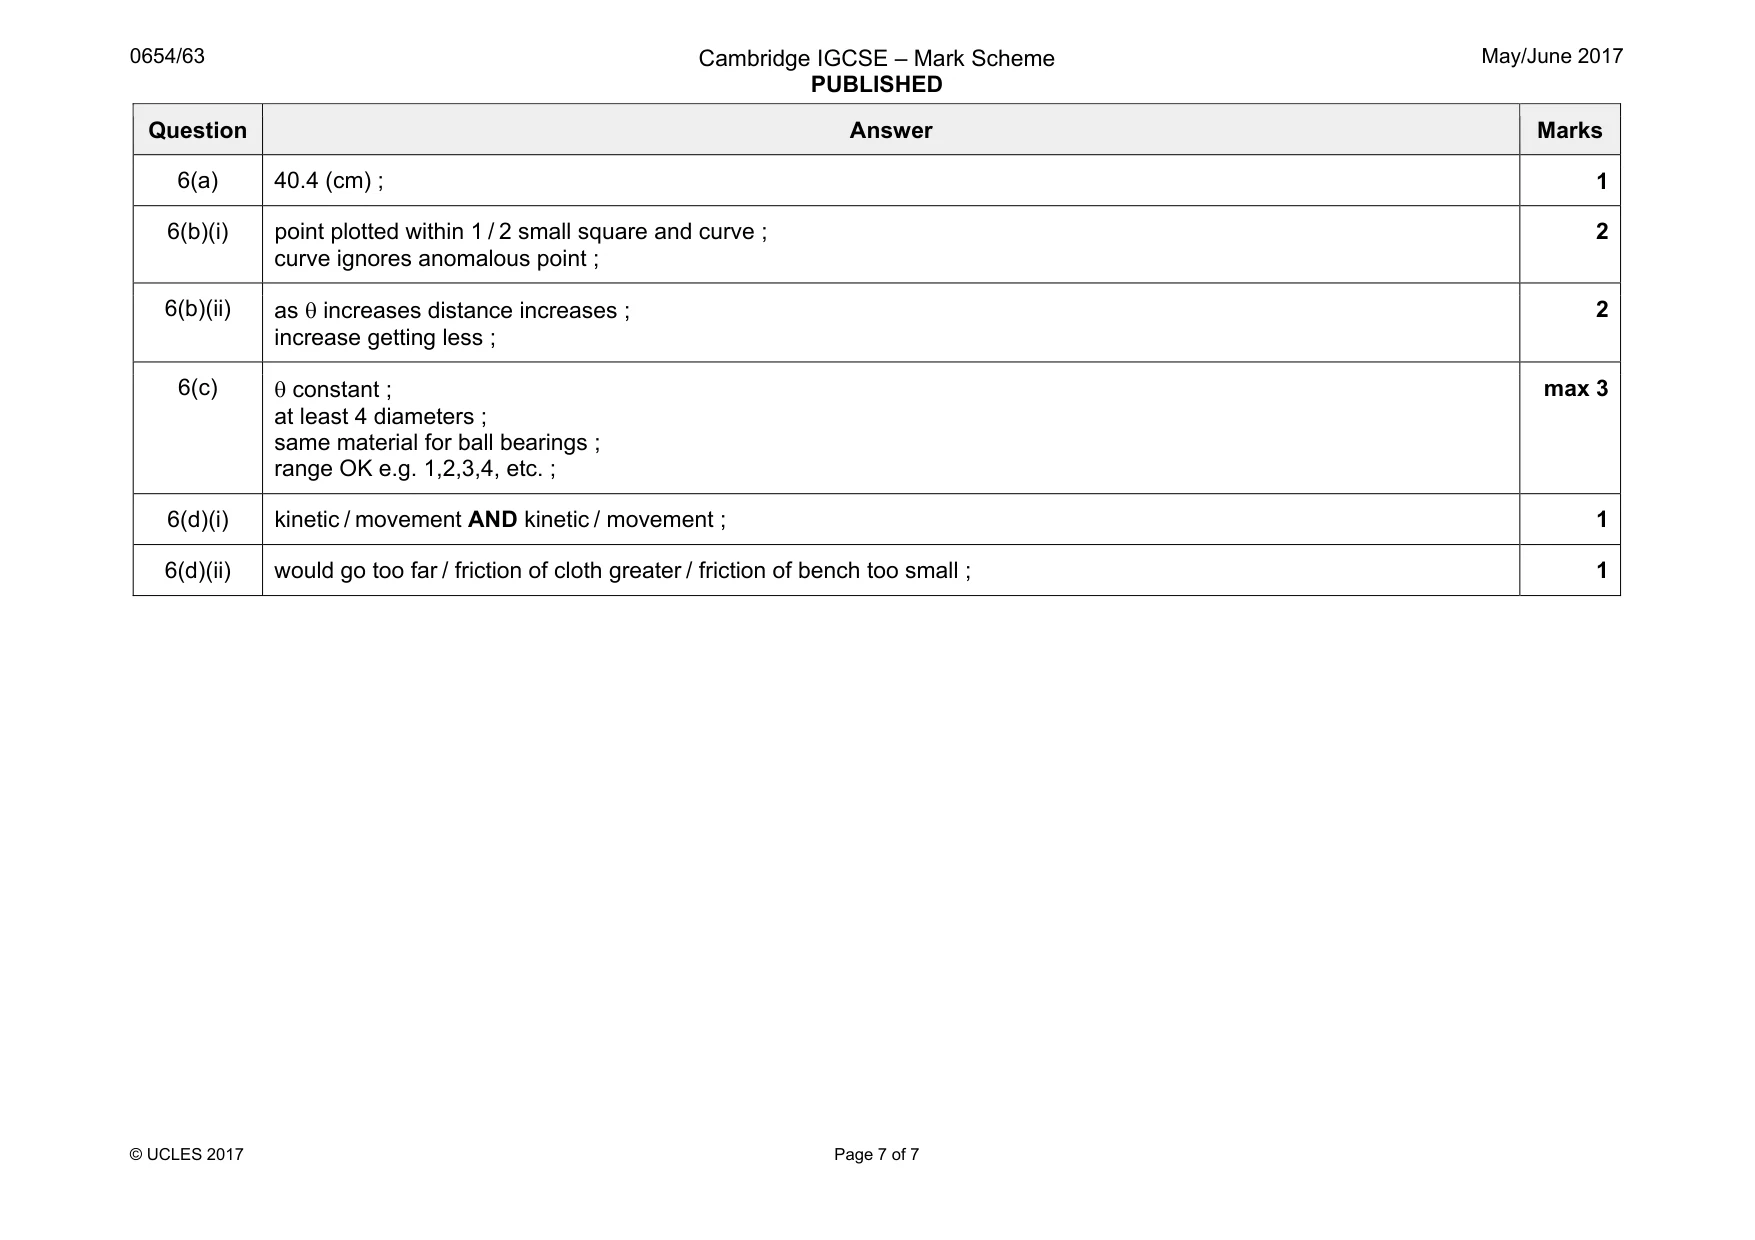
Mark scheme: 6(a) 40.4 (cm) ; 1 6(b)(i) point plotted within 1 / 2 small square and curve ; curve ignores anomalous point ; 2 6(b)(ii) as θ increases distance increases ; increase getting less ; 2 6(c) θ constant ; at least 4 diameters ; same material for ball bearings ; range OK e.g. 1,2,3,4, etc. ; max 3 6(d)(i) kinetic / movement AND kinetic / movement ; 1 6(d)(ii) would go too far / friction of cloth greater / friction of bench too small ; 1
More questions on Physical quantities and measurement techniques
What was in this paper
The subtopics covered by these 6 questions, and how many questions each got. Open one in a new tab to see every Cambridge question on it.
What you needed in this session
Cambridge’s own grade thresholds for 2017 May/June, Paper 6 · Variant 3. A higher threshold means an easier paper — the bar moves with how the cohort did.