Cambridge IGCSE Sciences - Co-ordinated (Double) 0654 — 2017 May/June Paper 6 · Variant 1
0654/61/M/J/17 · 6 questions · 60 marks · ≈68 min
The question paper and its mark scheme, free to read here and free to download. This is Cambridge’s own paper, exactly as it was sat.
Question paper16 pages


Mark scheme7 pages
Answers below. Sit the paper first if you are practising.
Questions as text
Q1 · A student investigates the nutrient content of banana, chickpea and egg white
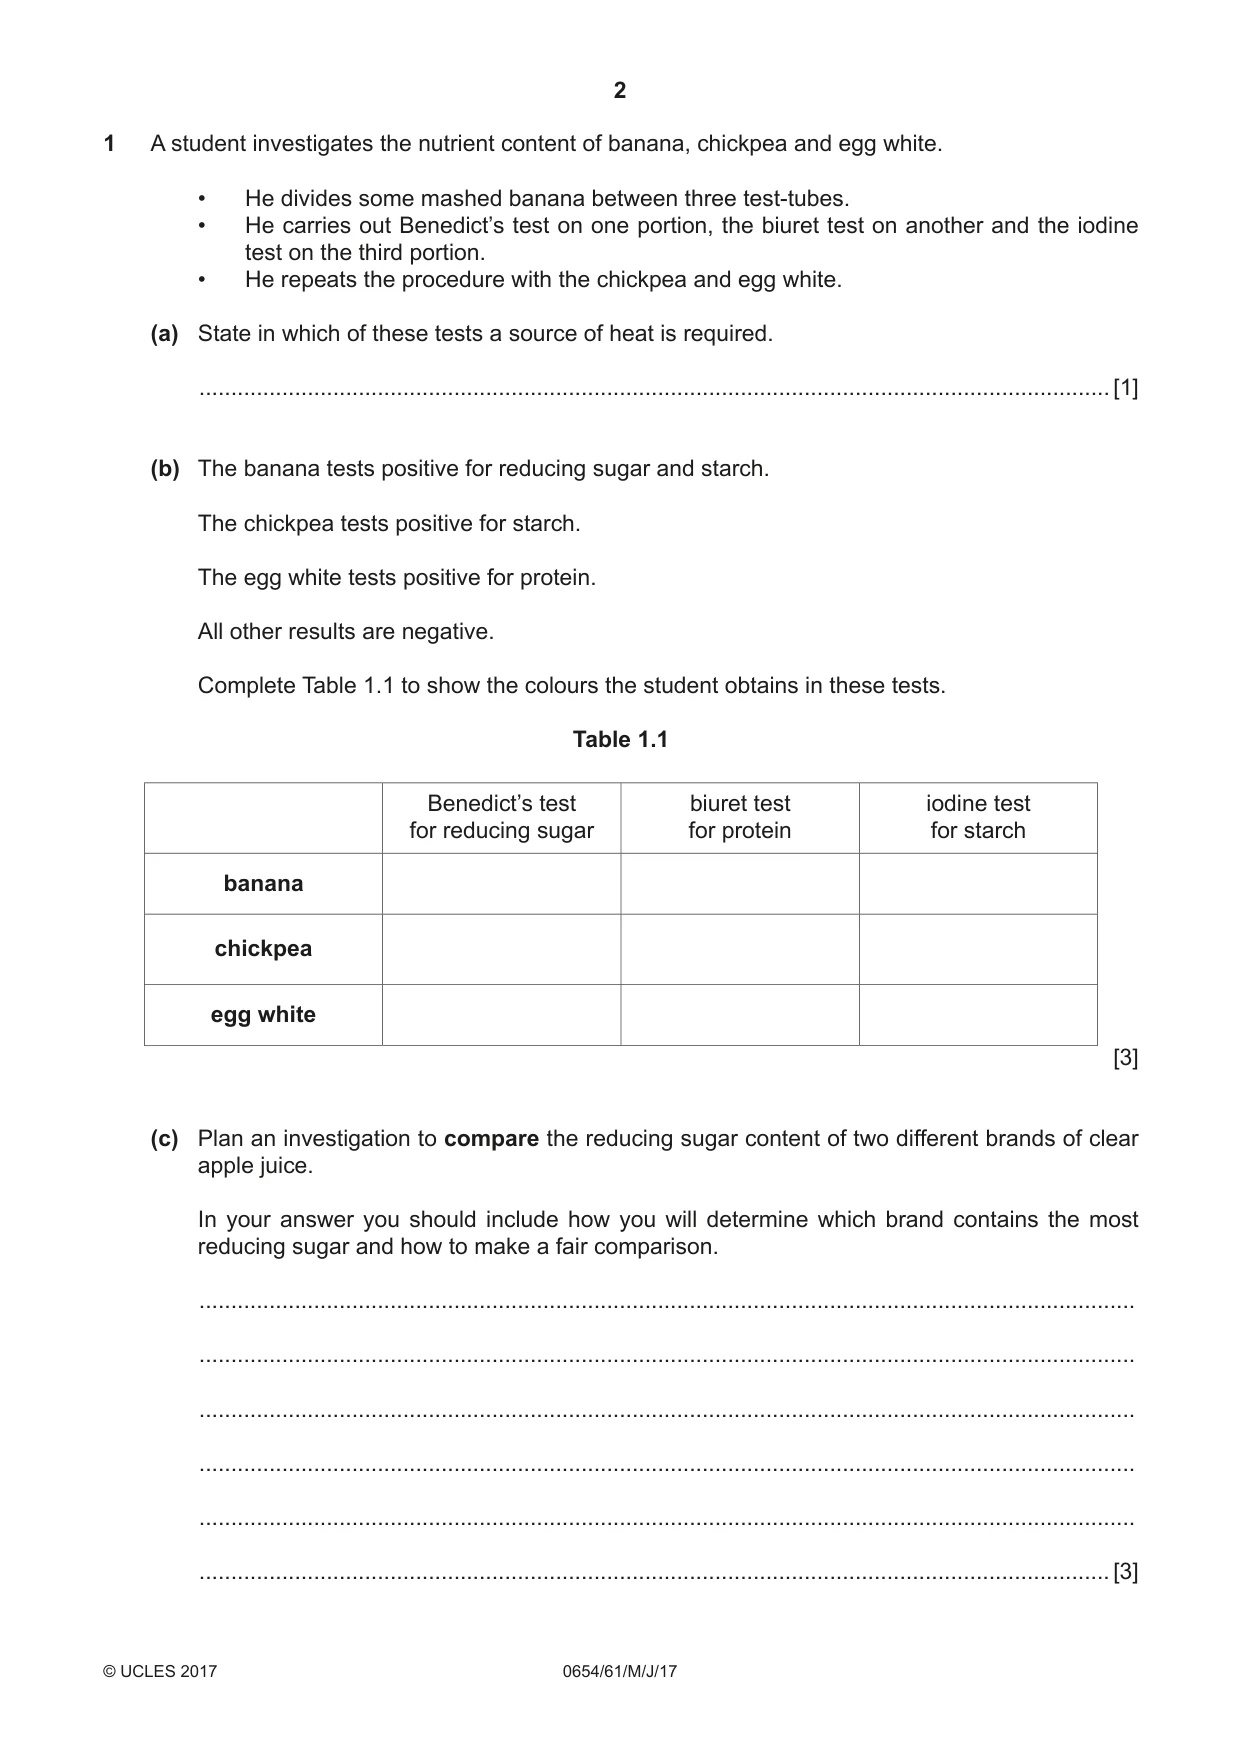
1 A student investigates the nutrient content of banana, chickpea and egg white. • He divides some mashed banana between three test-tubes. • He carries out Benedict’s test on one portion, the biuret test on another and the iodine test on the third portion. • He repeats the procedure with the chickpea and egg white. (a) State in which of these tests a source of heat is required. ............................................................................................................................................... [1] (b) The banana tests positive for reducing sugar and starch. The chickpea tests positive for starch. The egg white tests positive for protein. All other results are negative. Complete Table 1.1 to show the colours the student obtains in these tests. Table 1.1 Benedict’s test biuret test iodine test for reducing sugar for protein for starch banana chickpea egg white [3] (c) Plan an investigation to compare the reducing sugar content of two different brands of clear apple juice. In your answer you should include how you will determine which brand contains the most reducing sugar and how to make a fair comparison. ................................................................................................................................................... ................................................................................................................................................... ................................................................................................................................................... ................................................................................................................................................... ................................................................................................................................................... ............................................................................................................................................... [3] (d) Describe how you can test for the presence of fat in egg white. method ...................................................................................................................................... ................................................................................................................................................... ................................................................................................................................................... observation for positive result ................................................................................................... ................................................................................................................................................... [3]
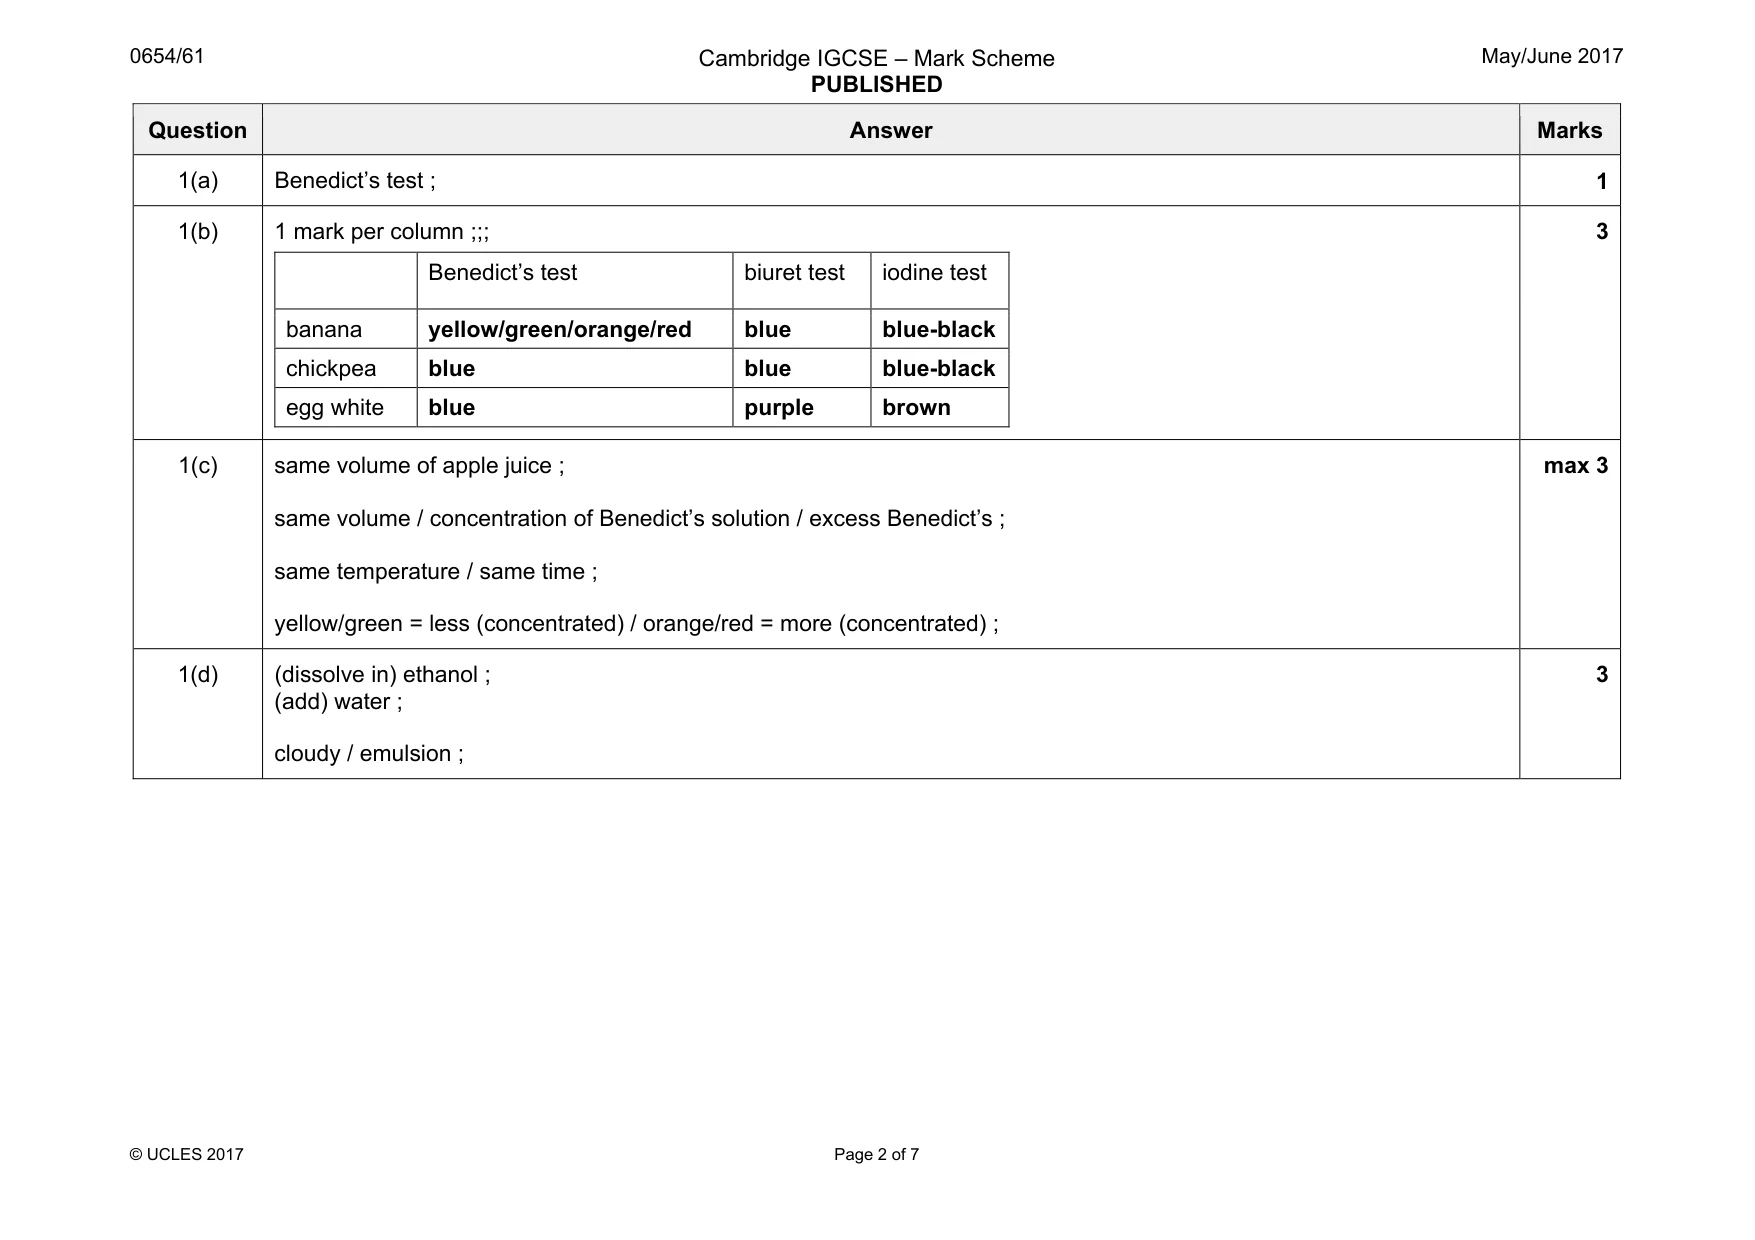
Mark scheme: 1(a) Benedict’s test ; 1 1(b) 1 mark per column ;;; Benedict’s test biuret test iodine test banana yellow/green/orange/red blue blue-black chickpea blue blue blue-black egg white blue purple brown 3 1(c) same volume of apple juice ; same volume / concentration of Benedict’s solution / excess Benedict’s ; same temperature / same time ; yellow/green = less (concentrated) / orange/red = more (concentrated) ; max 3 1(d) (dissolve in) ethanol ; (add) water ; cloudy / emulsion ; 3
Q2 · Solution H and solution J are each one of the following possible solutions
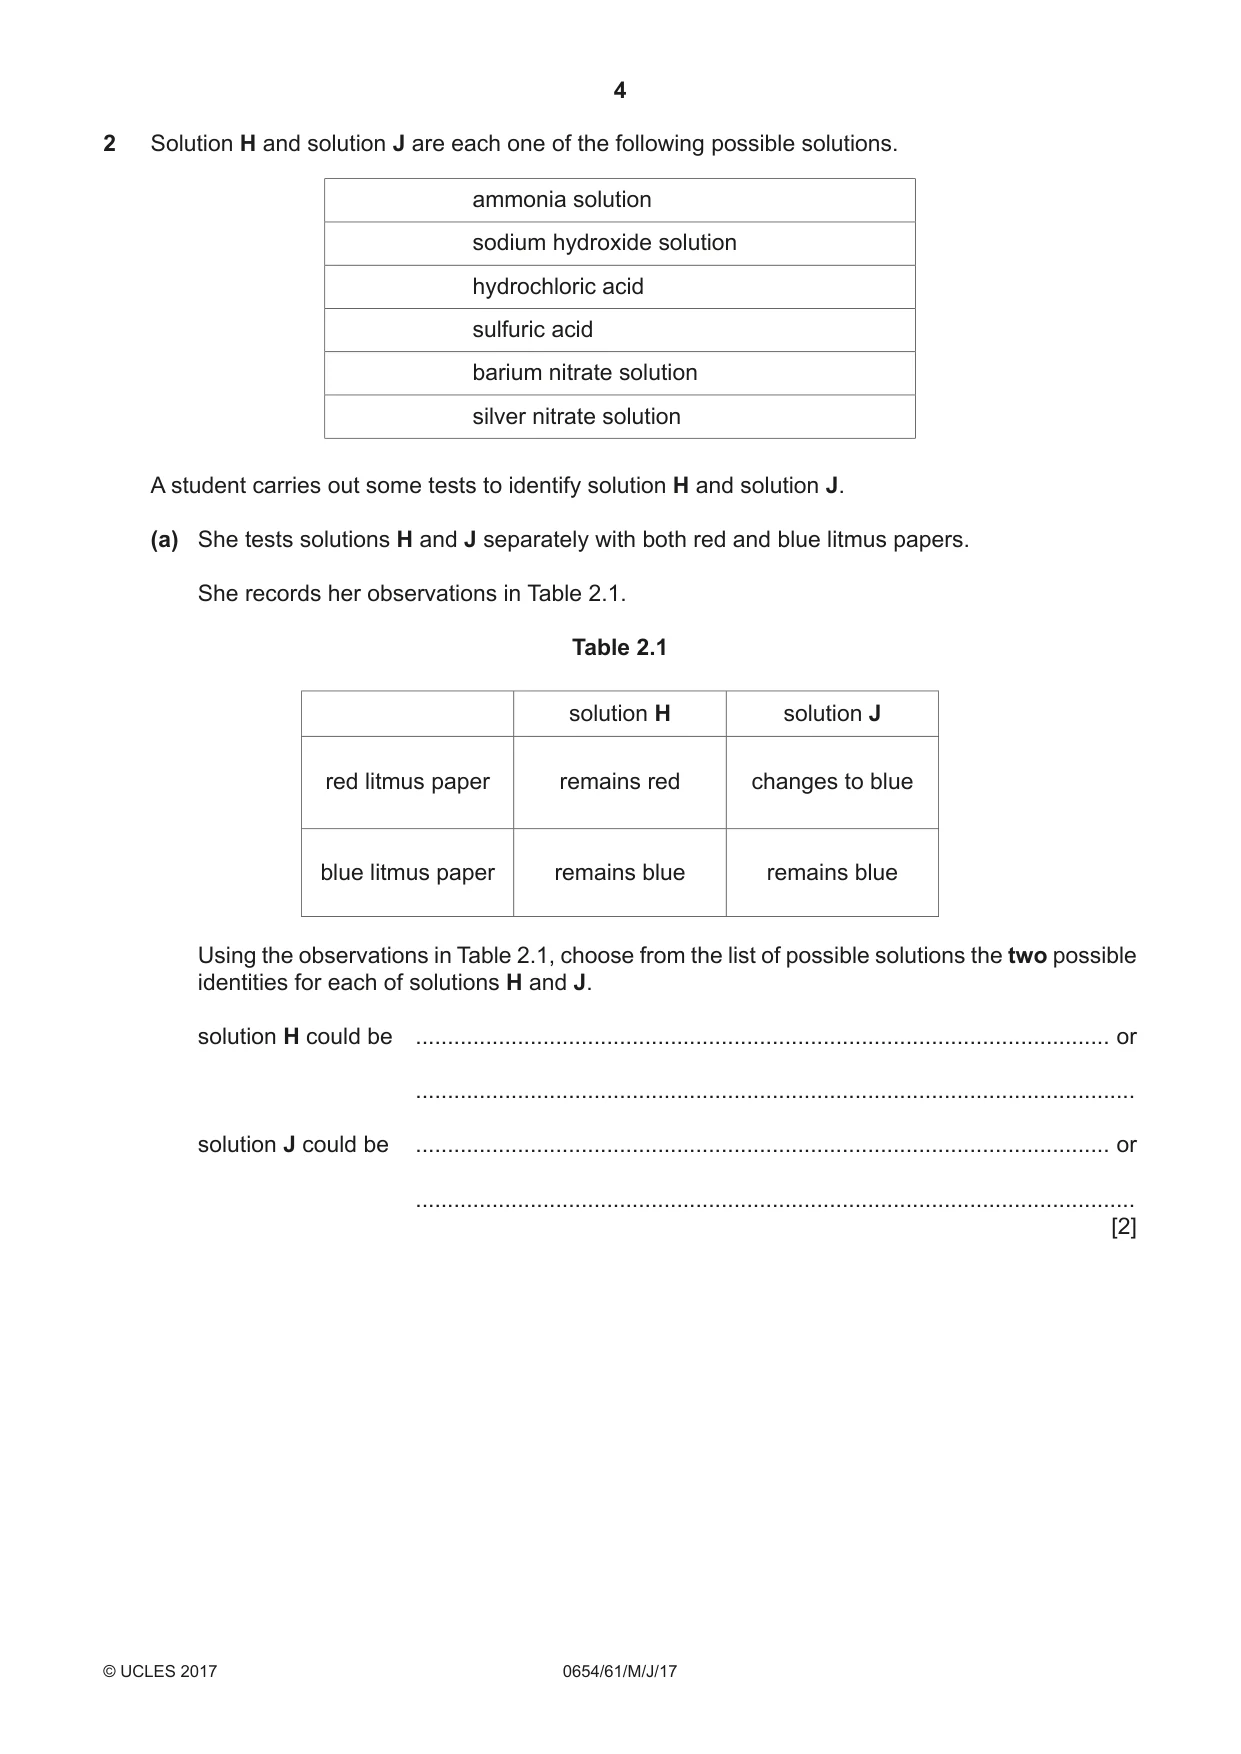
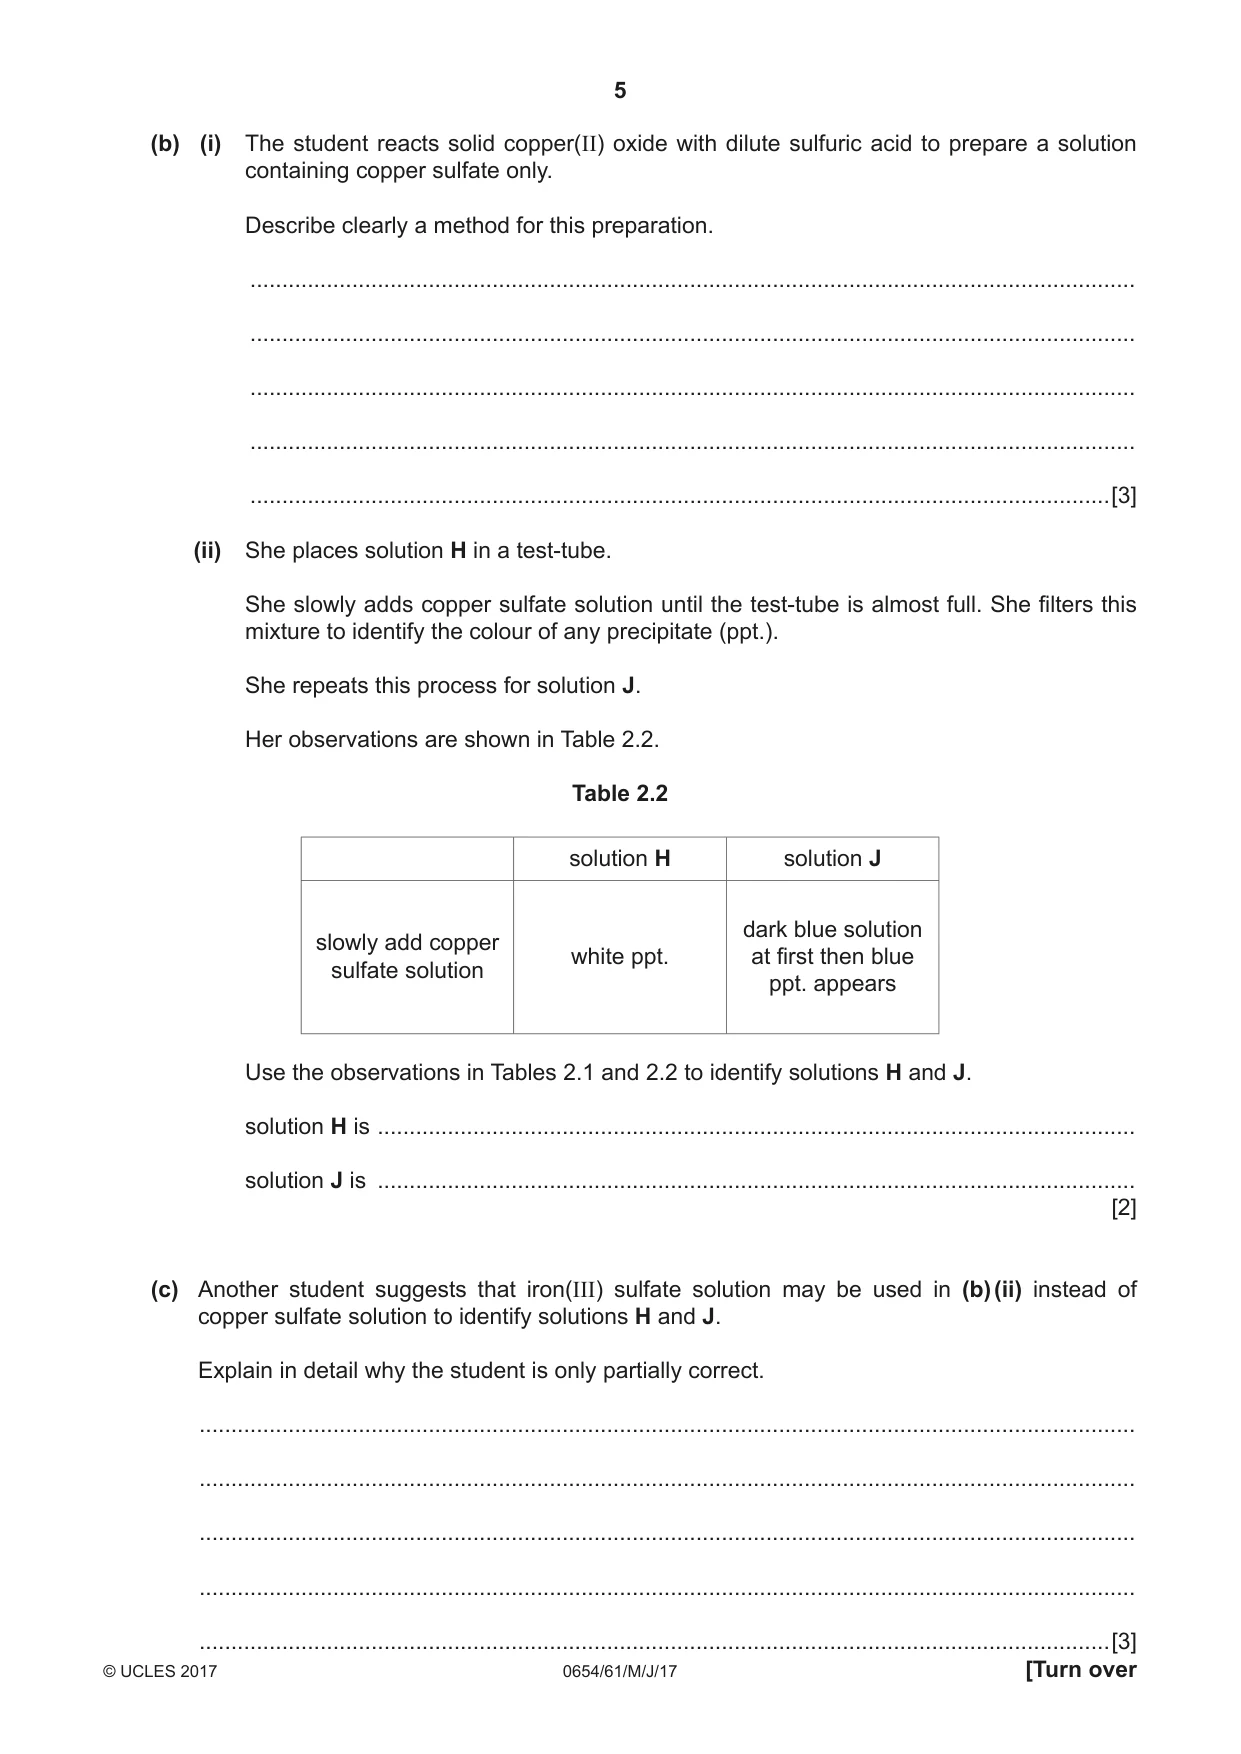
2 Solution H and solution J are each one of the following possible solutions. ammonia solution sodium hydroxide solution hydrochloric acid sulfuric acid barium nitrate solution silver nitrate solution A student carries out some tests to identify solution H and solution J. (a) She tests solutions H and J separately with both red and blue litmus papers. She records her observations in Table 2.1. Table 2.1 solution H solution J red litmus paper remains red changes to blue blue litmus paper remains blue remains blue Using the observations in Table 2.1, choose from the list of possible solutions the two possible identities for each of solutions H and J. solution H could be ............................................................................................................. or ................................................................................................................. solution J could be ............................................................................................................. or ................................................................................................................. [2] (b) (i) The student reacts solid copper(II) oxide with dilute sulfuric acid to prepare a solution containing copper sulfate only. Describe clearly a method for this preparation. ........................................................................................................................................... ........................................................................................................................................... ........................................................................................................................................... ........................................................................................................................................... .......................................................................................................................................[3] (ii) She places solution H in a test-tube. She slowly adds copper sulfate solution until the test-tube is almost full. She filters this mixture to identify the colour of any precipitate (ppt.). She repeats this process for solution J. Her observations are shown in Table 2.2. Table 2.2 solution H solution J dark blue solution slowly add copper white ppt. at first then blue sulfate solution ppt. appears Use the observations in Tables 2.1 and 2.2 to identify solutions H and J. solution H is ....................................................................................................................... solution J is ....................................................................................................................... [2] (c) Another student suggests that iron(III) sulfate solution may be used in (b) (ii) instead of copper sulfate solution to identify solutions H and J. Explain in detail why the student is only partially correct. ................................................................................................................................................... ................................................................................................................................................... ................................................................................................................................................... ................................................................................................................................................... ...............................................................................................................................................[3]
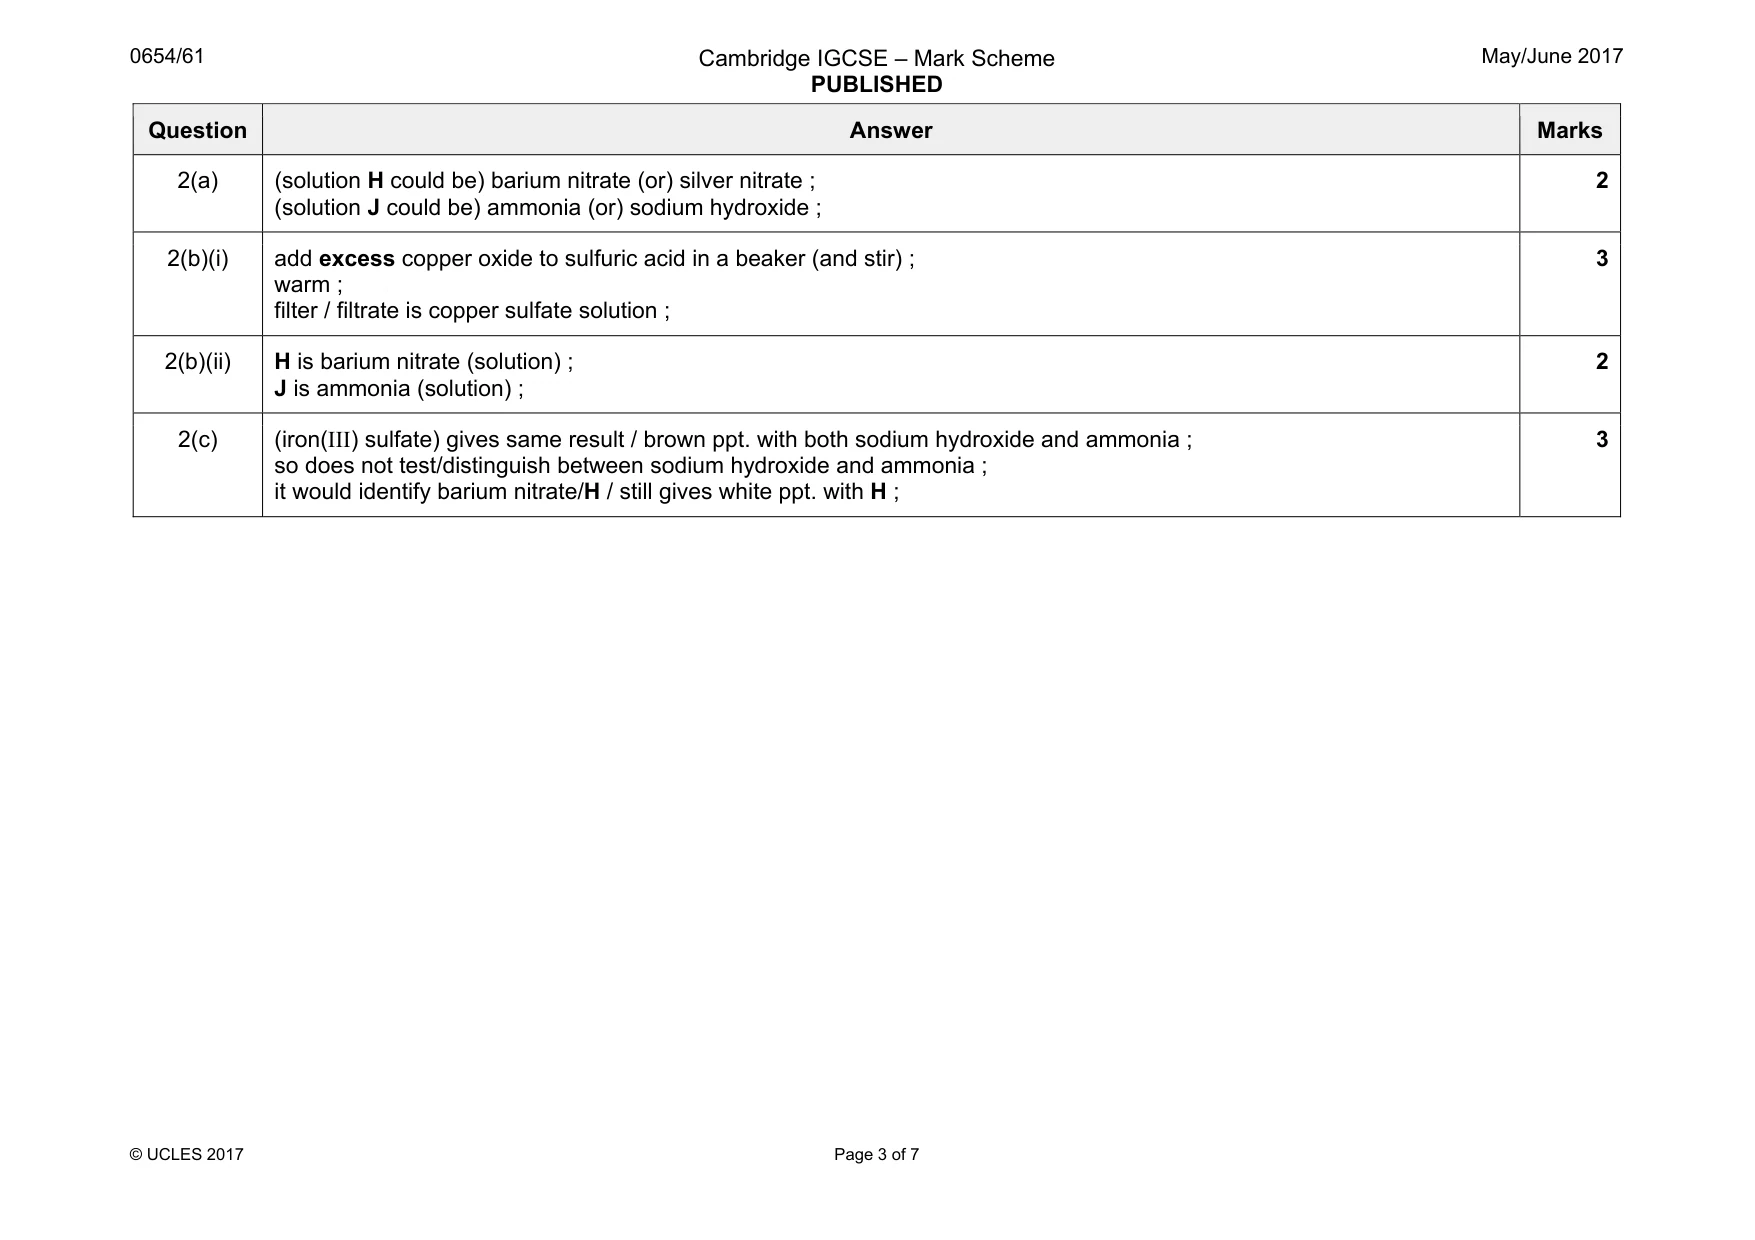
Mark scheme: 2(a) (solution H could be) barium nitrate (or) silver nitrate ; (solution J could be) ammonia (or) sodium hydroxide ; 2 2(b)(i) add excess copper oxide to sulfuric acid in a beaker (and stir) ; warm ; filter / filtrate is copper sulfate solution ; 3 2(b)(ii) H is barium nitrate (solution) ; J is ammonia (solution) ; 2 2(c) (iron(III) sulfate) gives same result / brown ppt. with both sodium hydroxide and ammonia ; so does not test/distinguish between sodium hydroxide and ammonia ; it would identify barium nitrate/H / still gives white ppt. with H ; 3
Q3 · A student investigates how the resistance of a metal wire depends upon its length
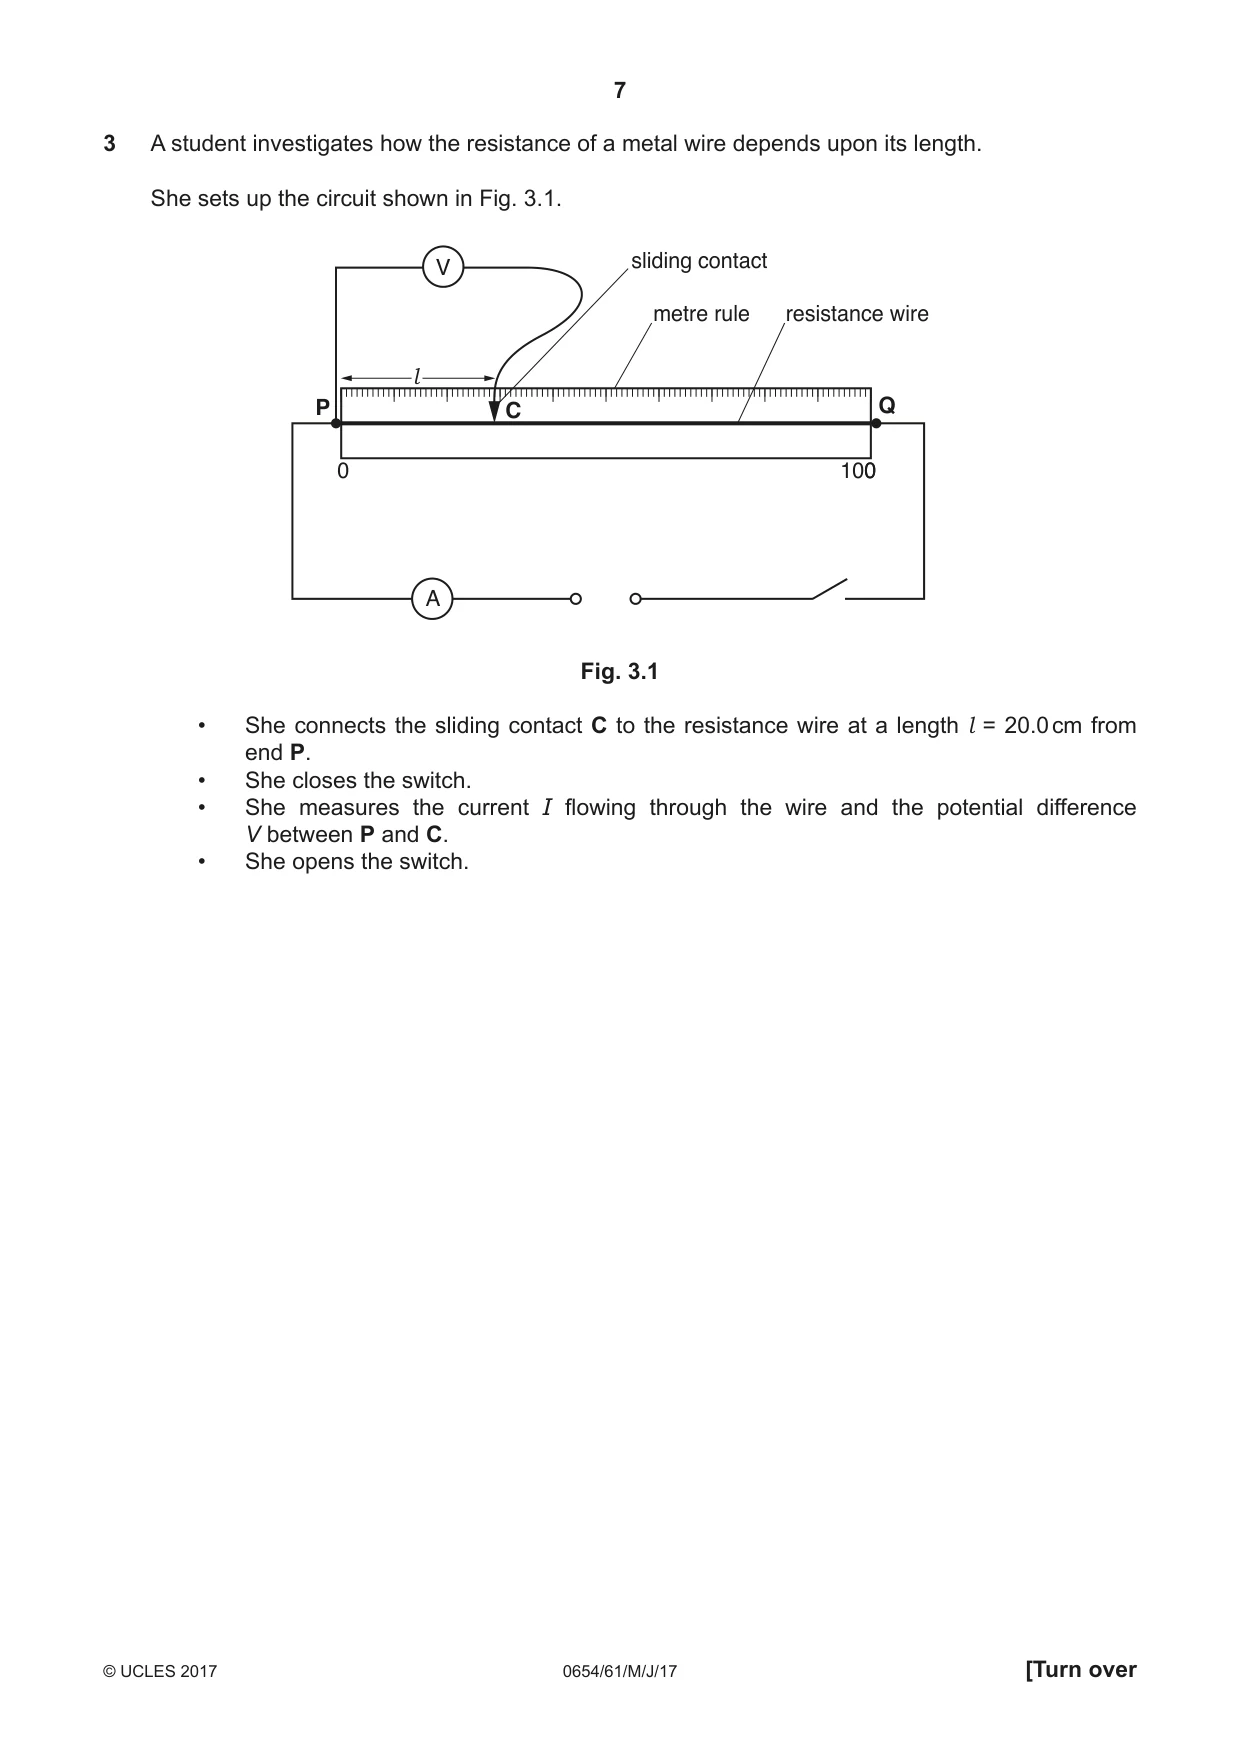
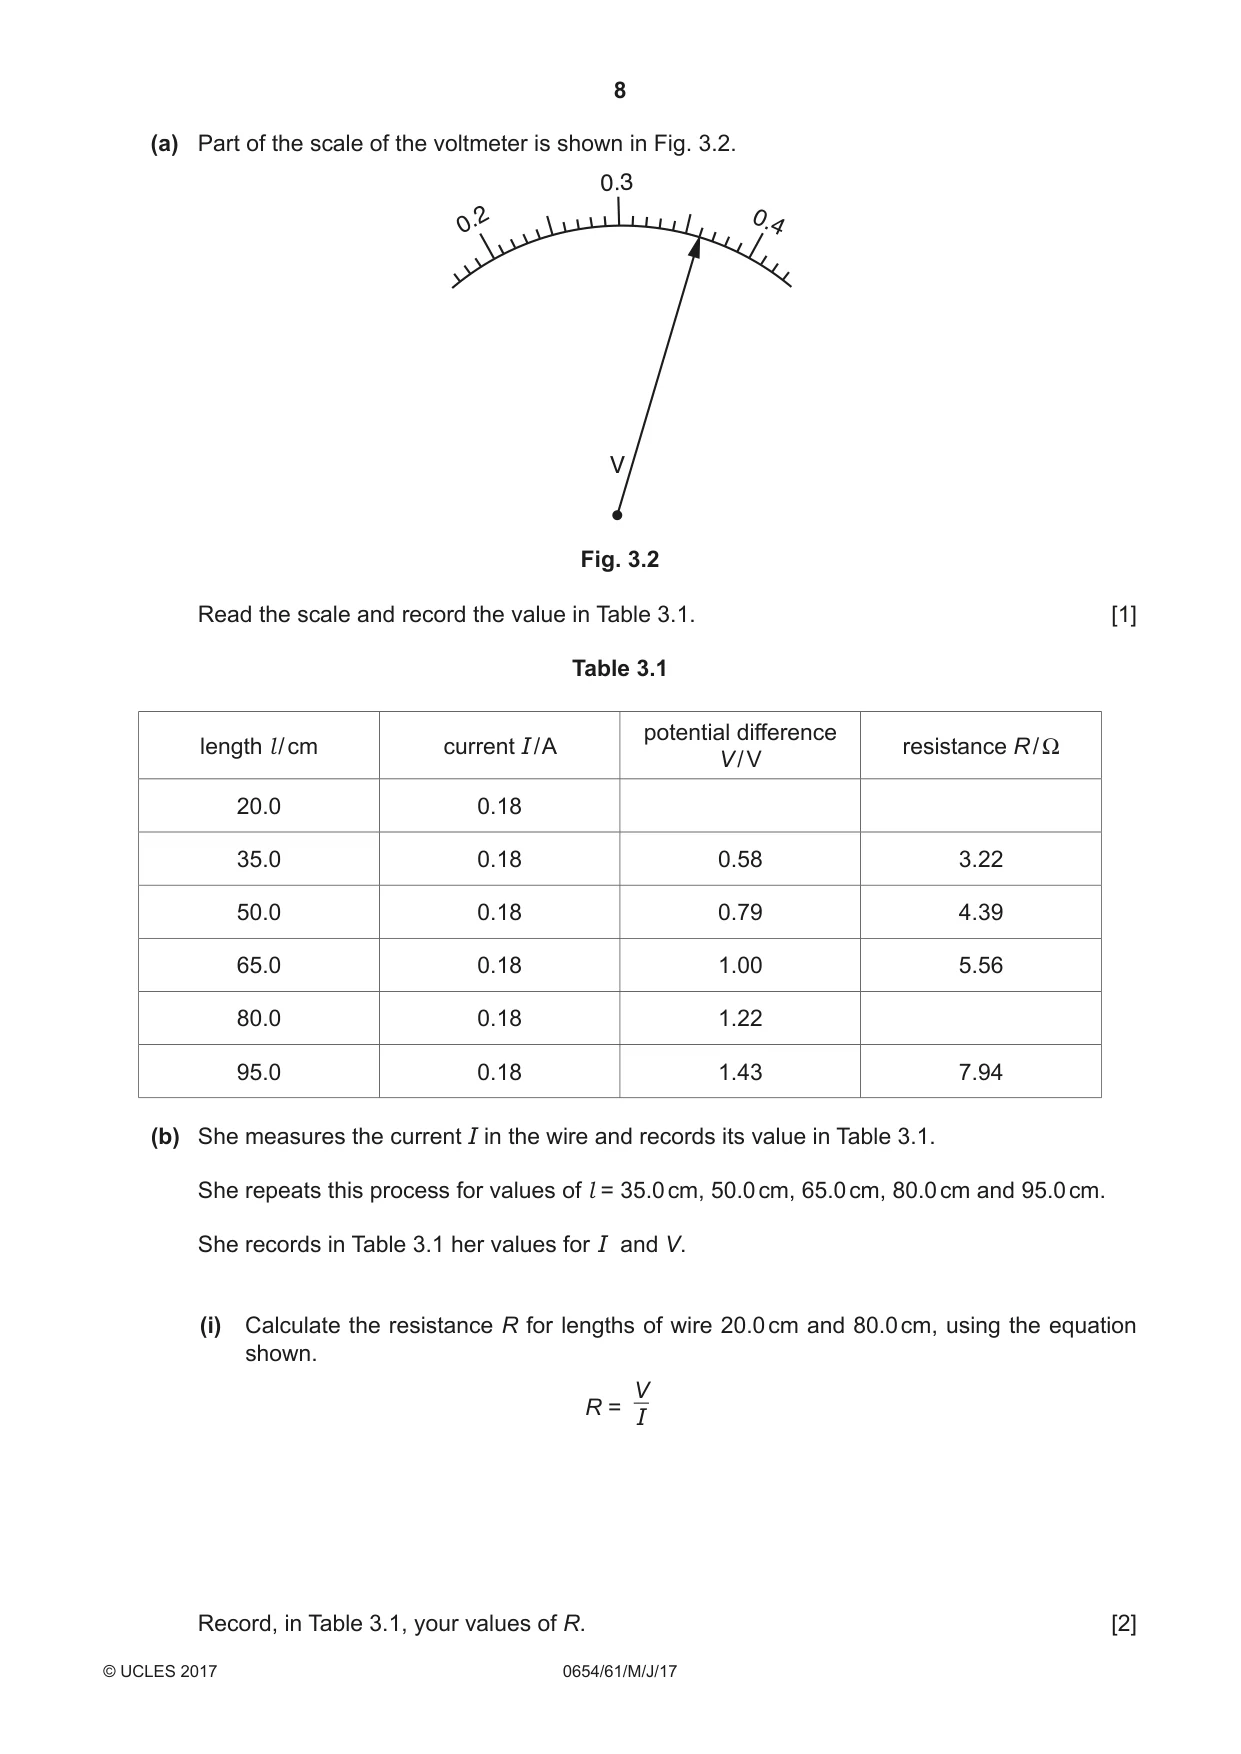
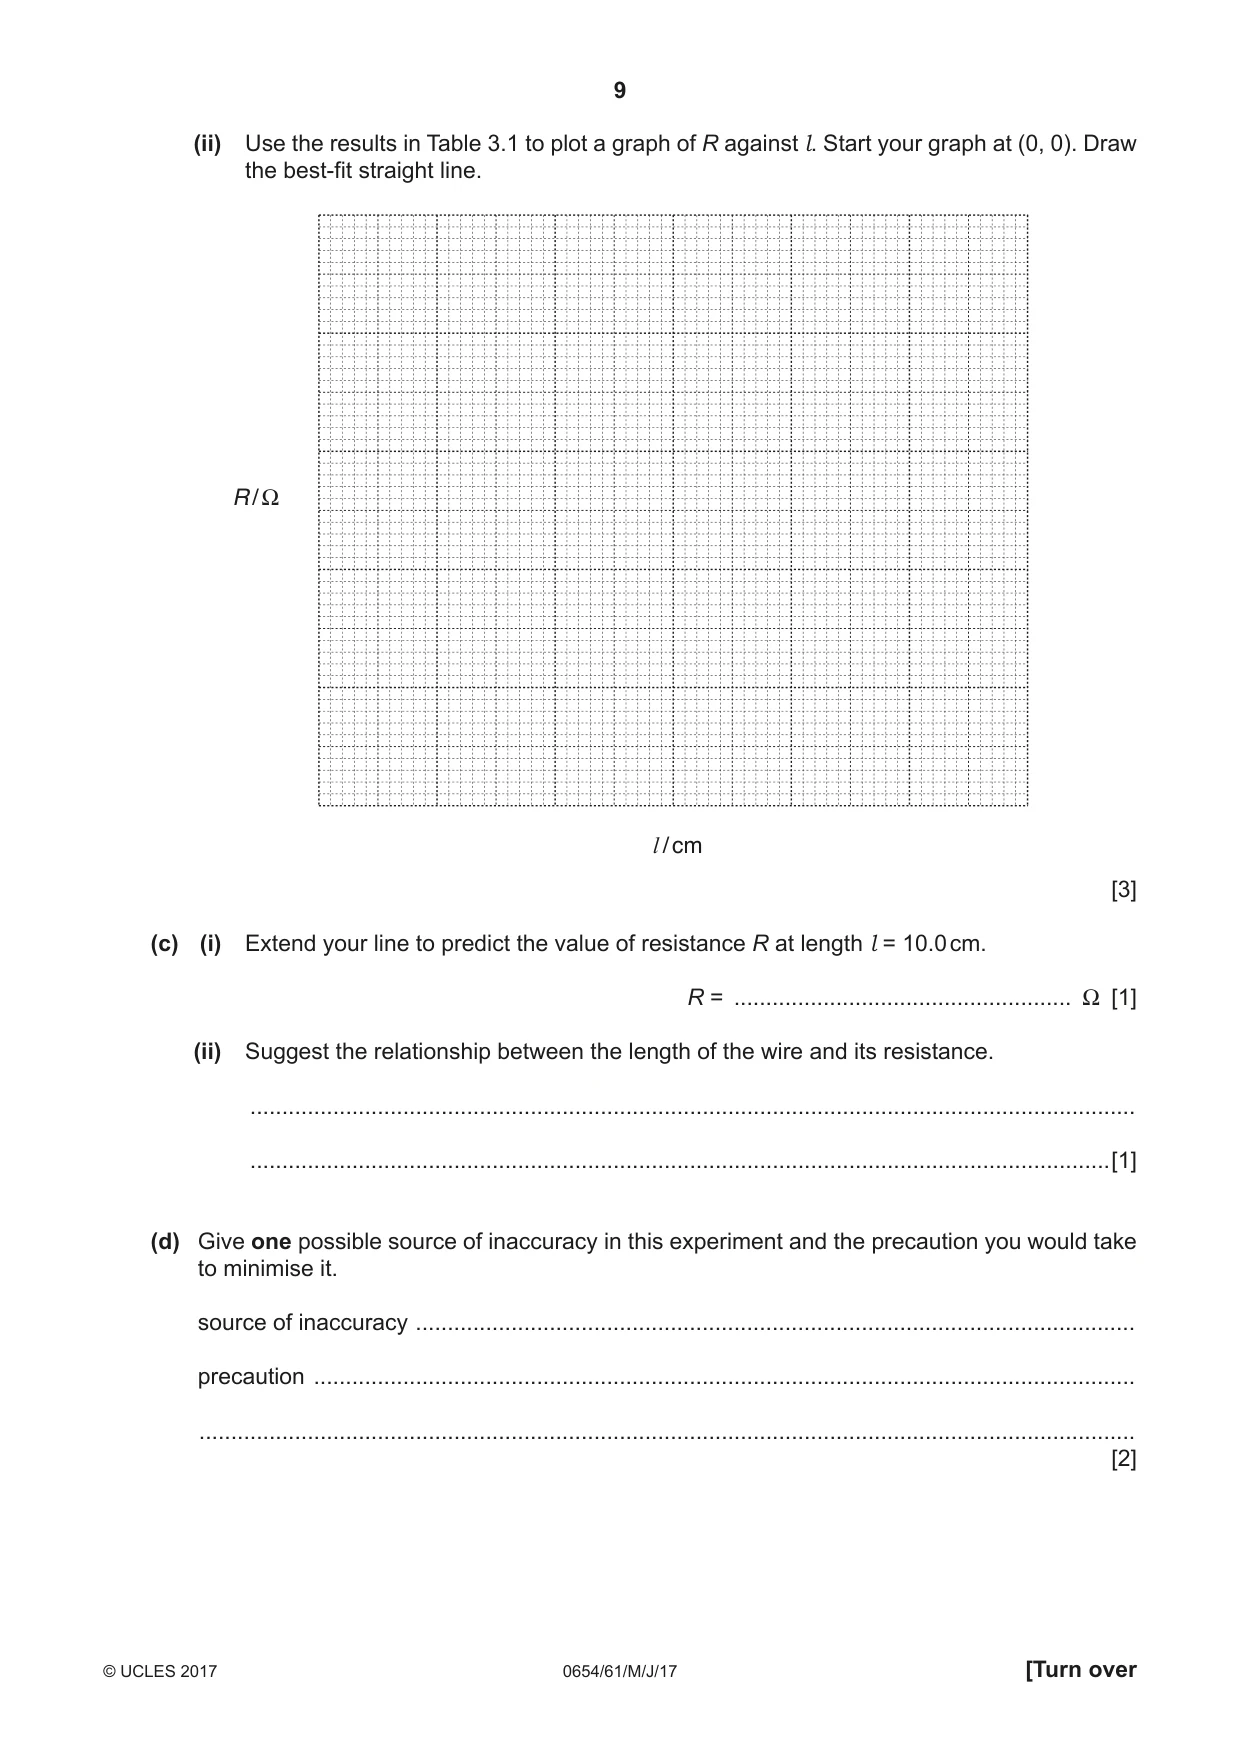
3 A student investigates how the resistance of a metal wire depends upon its length. She sets up the circuit shown in Fig. 3.1. sliding contact V metre rule resistance wire l P C Q 0 1000 A Fig. 3.1 • She connects the sliding contact C to the resistance wire at a length l = 20.0 cm from end P. • She closes the switch. • She measures the current I flowing through the wire and the potential difference V between P and C. • She opens the switch. (a) Part of the scale of the voltmeter is shown in Fig. 3.2. 0.3 0.2 0.4 V Fig. 3.2 Read the scale and record the value in Table 3.1. [1] Table 3.1 potential difference length l / cm current I / A resistance R / Ω V / V 20.0 0.18 35.0 0.18 0.58 3.22 50.0 0.18 0.79 4.39 65.0 0.18 1.00 5.56 80.0 0.18 1.22 95.0 0.18 1.43 7.94 (b) She measures the current I in the wire and records its value in Table 3.1. She repeats this process for values of l = 35.0 cm, 50.0 cm, 65.0 cm, 80.0 cm and 95.0 cm. She records in Table 3.1 her values for I and V. (i) Calculate the resistance R for lengths of wire 20.0 cm and 80.0 cm, using the equation shown. V R = I Record, in Table 3.1, your values of R. [2] (ii) Use the results in Table 3.1 to plot a graph of R against l. Start your graph at (0, 0). Draw the best-fit straight line. R / Ω l / cm [3] (c) (i) Extend your line to predict the value of resistance R at length l = 10.0 cm. R = ..................................................... Ω [1] (ii) Suggest the relationship between the length of the wire and its resistance. ........................................................................................................................................... .......................................................................................................................................[1] (d) Give one possible source of inaccuracy in this experiment and the precaution you would take to minimise it. source of inaccuracy ................................................................................................................. precaution ................................................................................................................................. ................................................................................................................................................... [2]
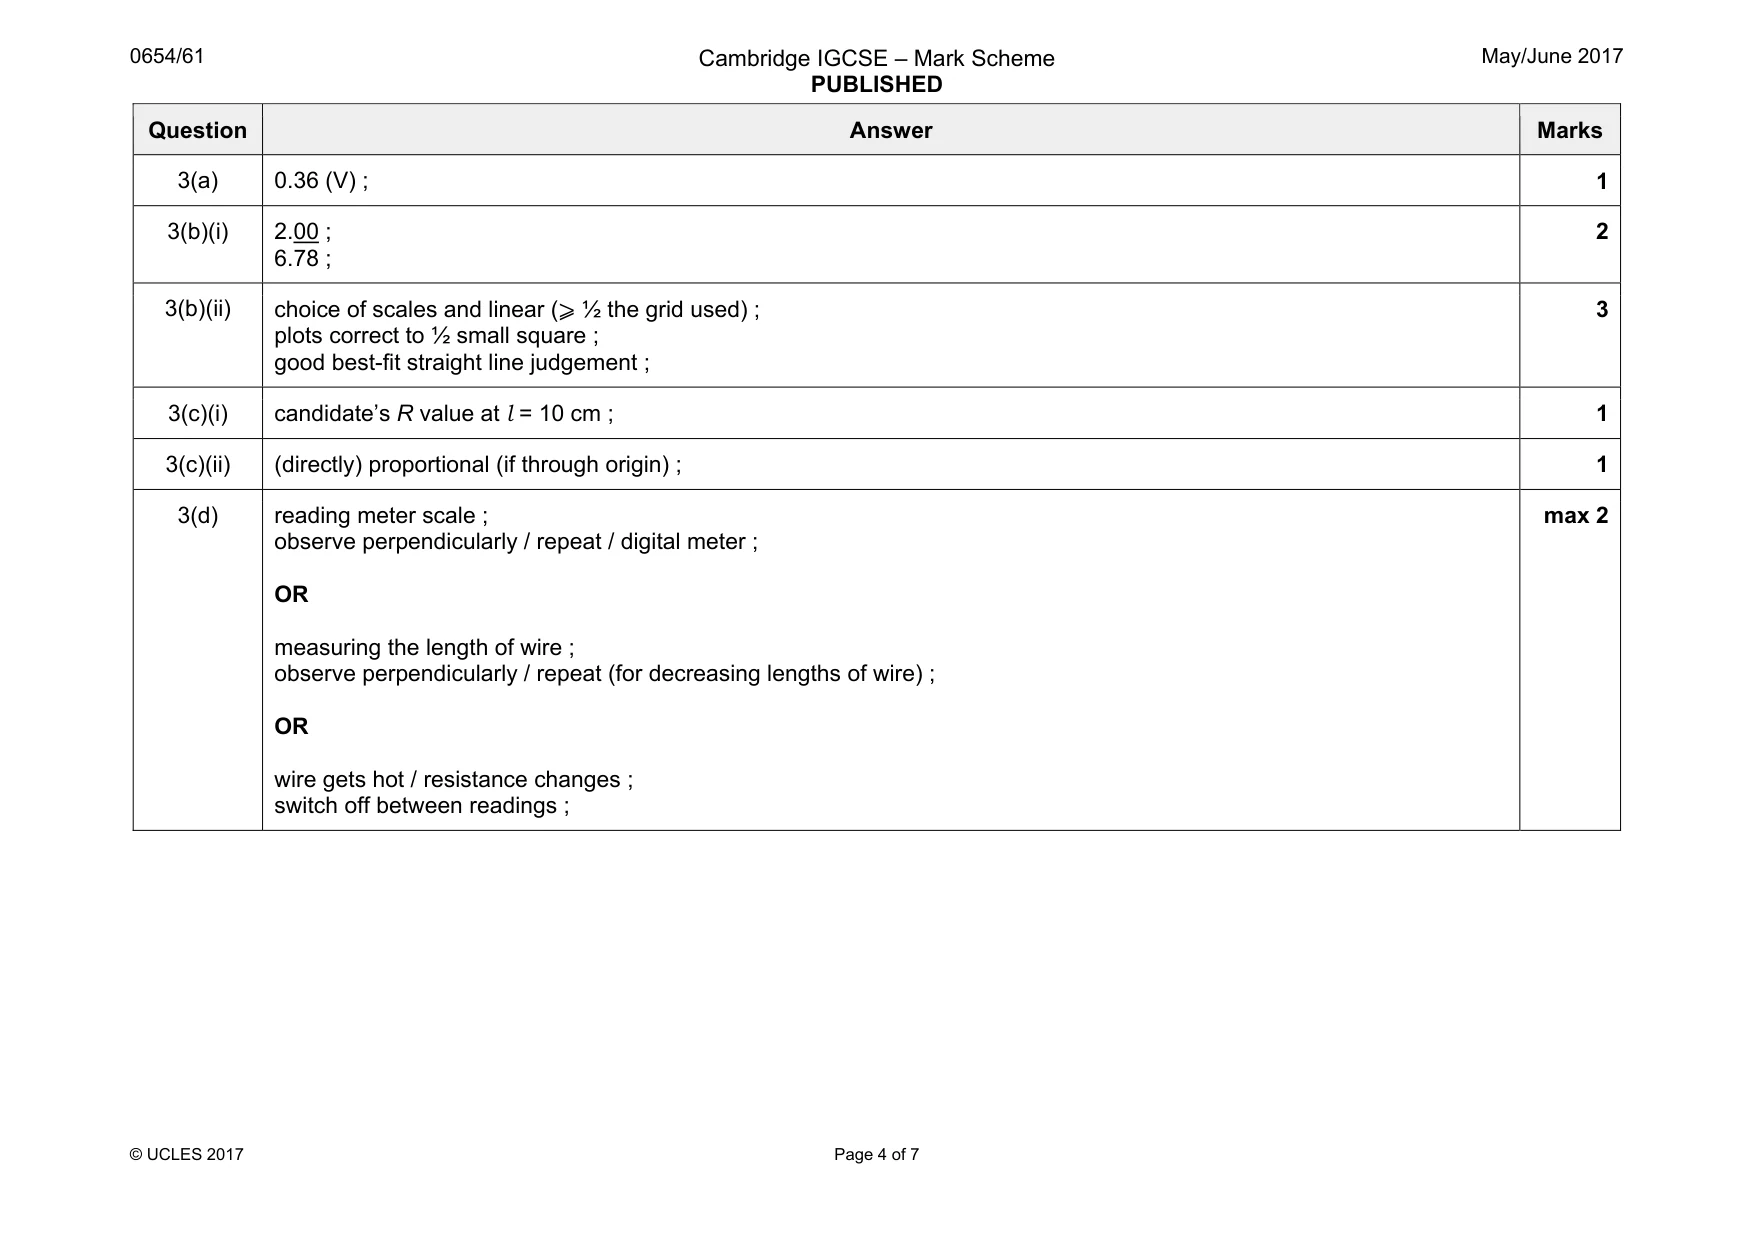
Mark scheme: 3(a) 0.36 (V) ; 1 3(b)(i) 2.00 ; 6.78 ; 2 3(b)(ii) choice of scales and linear (⩾ ½ the grid used) ; plots correct to ½ small square ; good best-fit straight line judgement ; 3 3(c)(i) candidate’s R value at l = 10 cm ; 1 3(c)(ii) (directly) proportional (if through origin) ; 1 3(d) reading meter scale ; observe perpendicularly / repeat / digital meter ; OR measuring the length of wire ; observe perpendicularly / repeat (for decreasing lengths of wire) ; OR wire gets hot / resistance changes ; switch off between readings ; max 2
Q4 · A nurse takes a blood sample from a patient
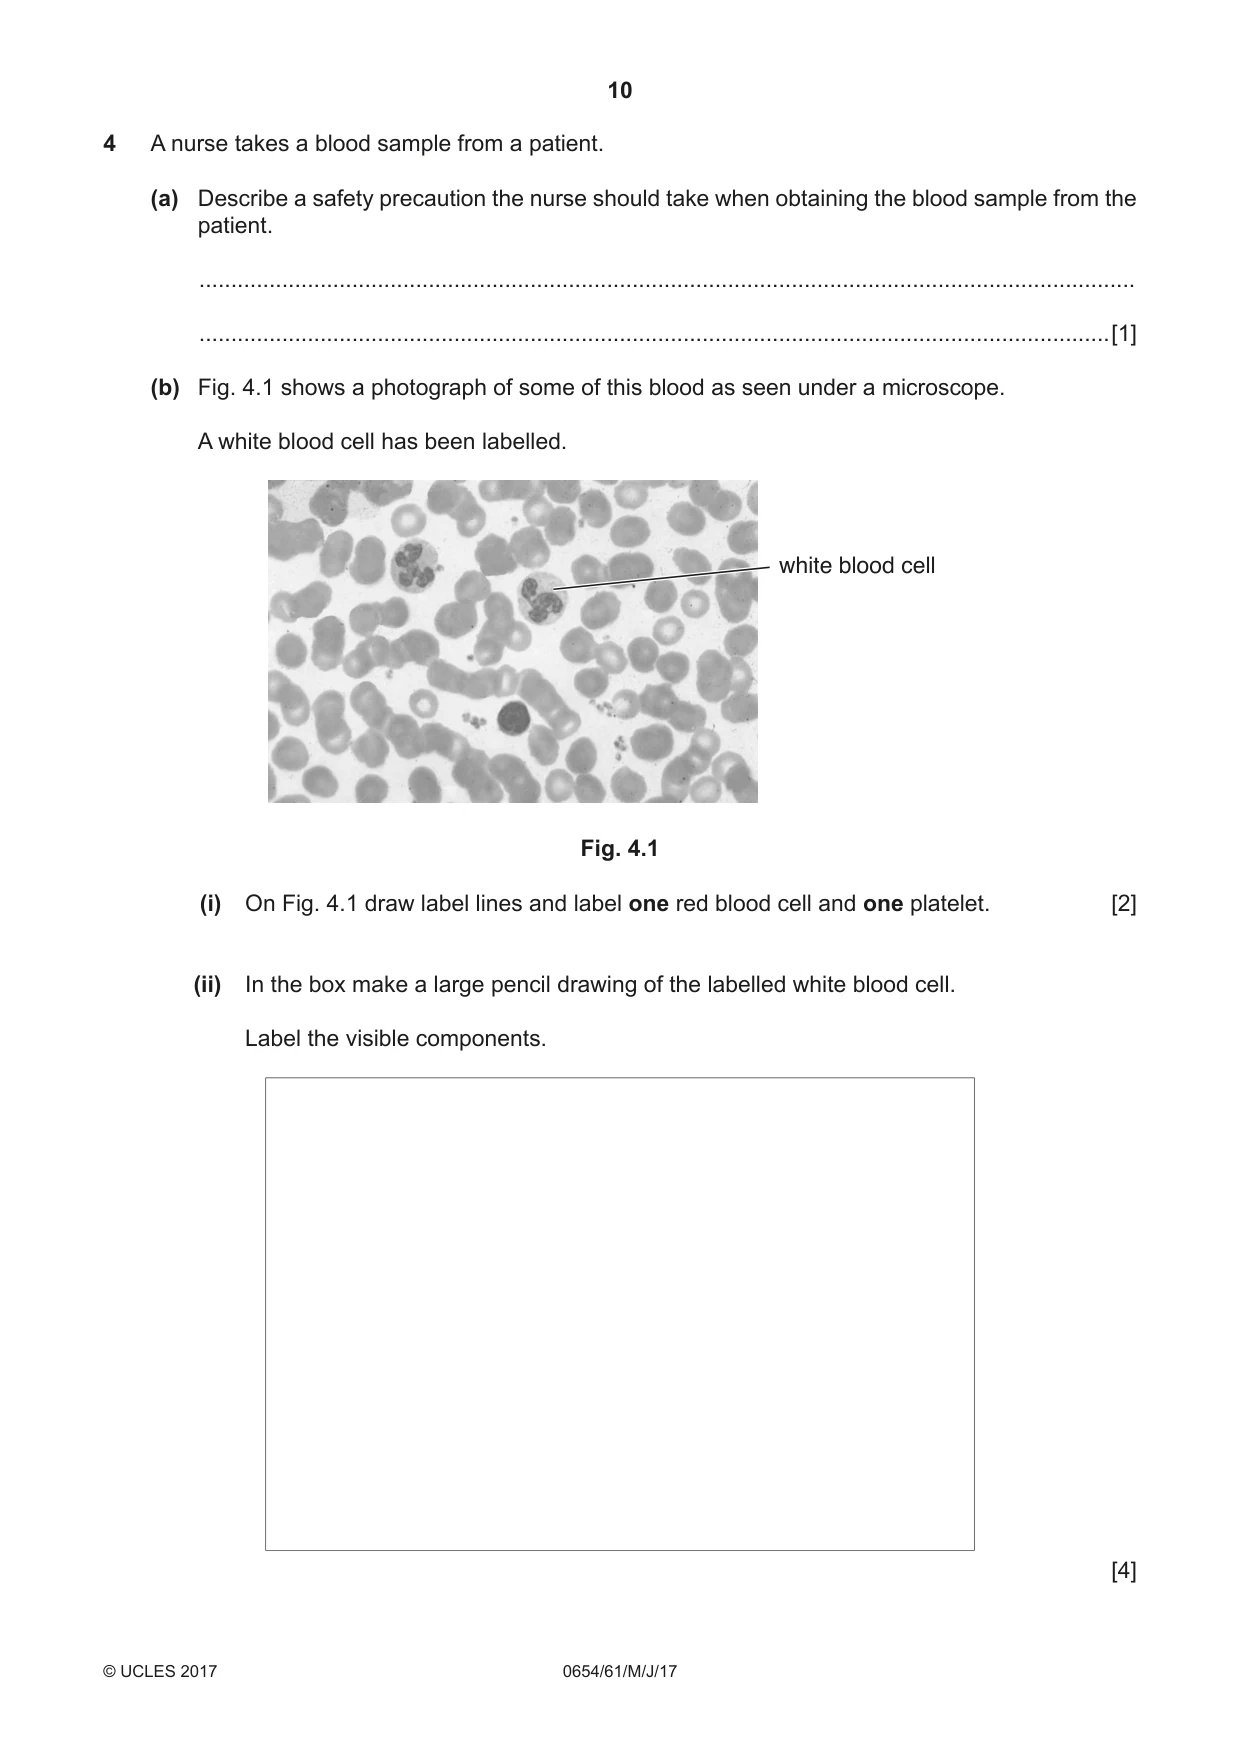
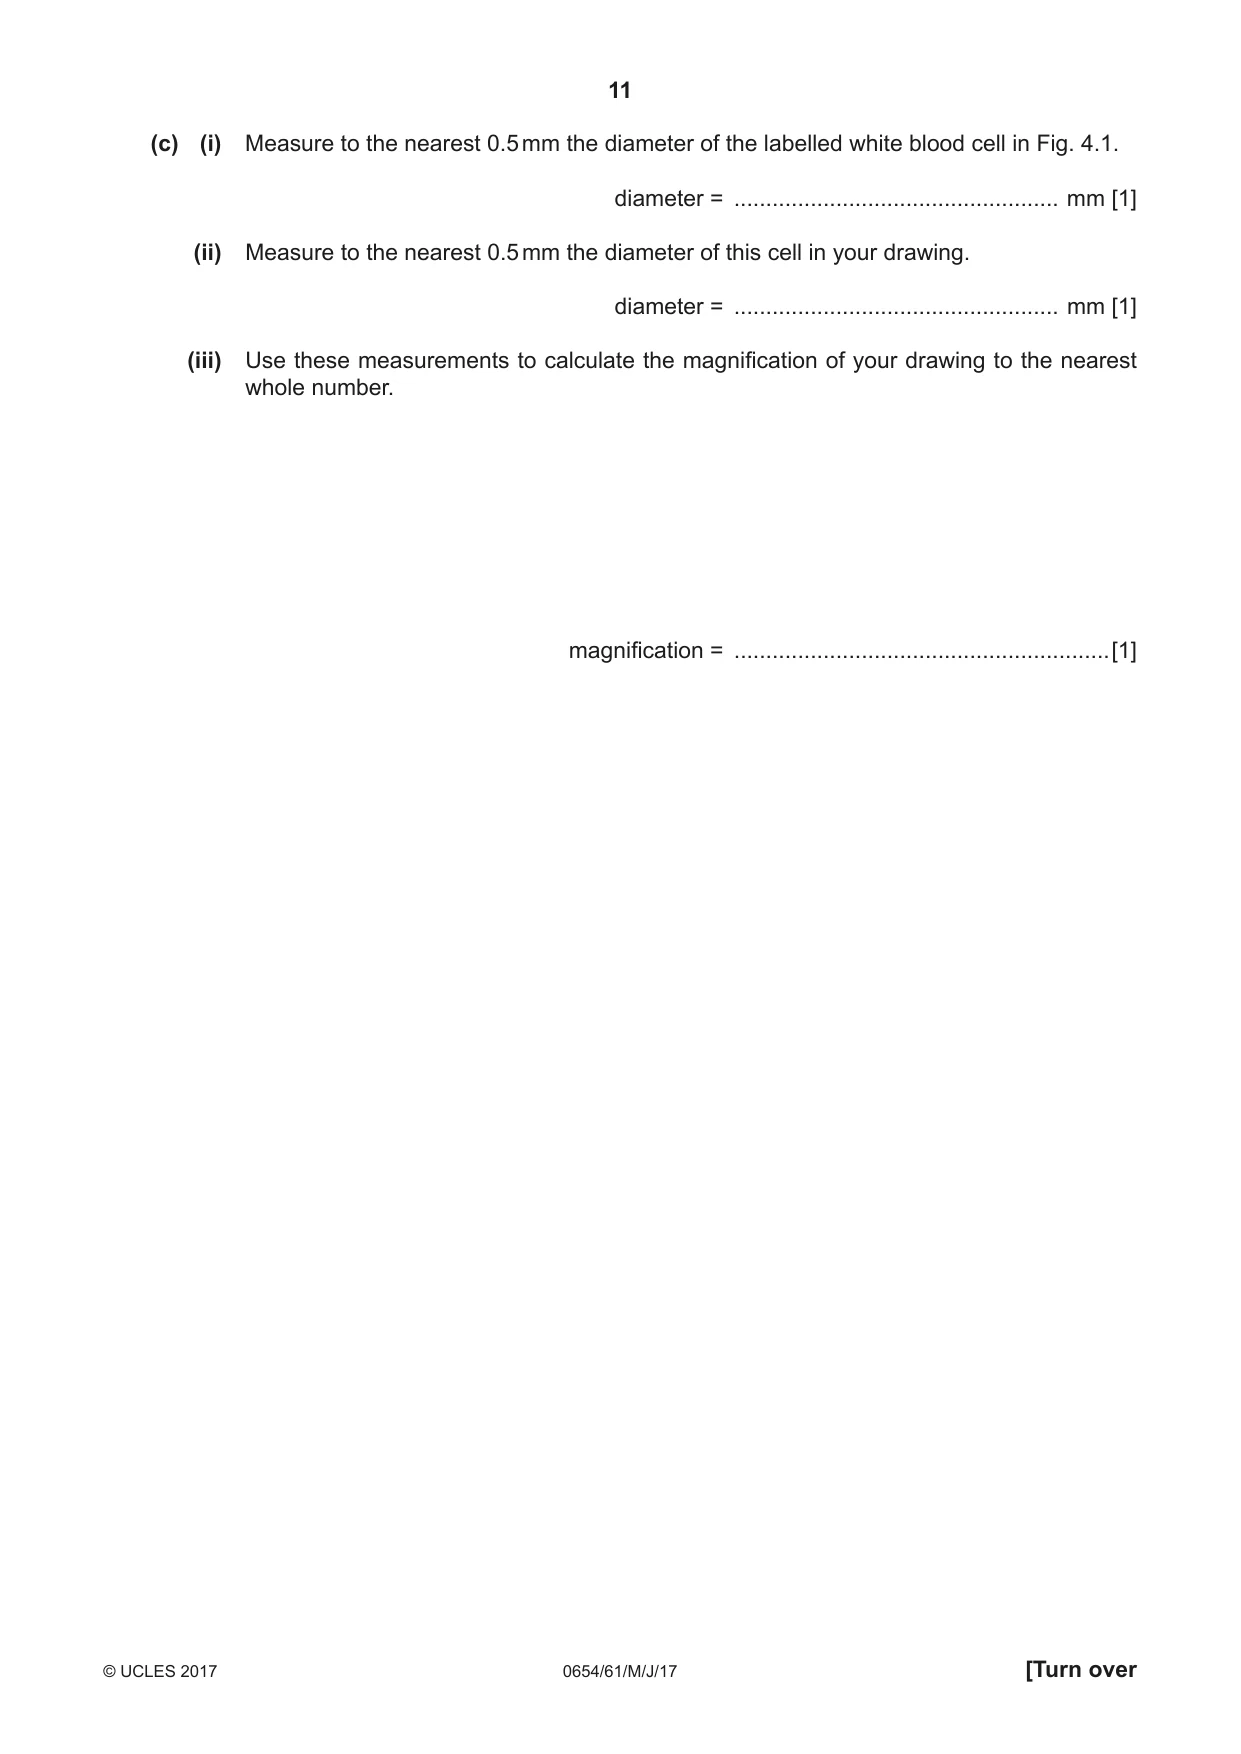
4 A nurse takes a blood sample from a patient. (a) Describe a safety precaution the nurse should take when obtaining the blood sample from the patient. ................................................................................................................................................... ...............................................................................................................................................[1] (b) Fig. 4.1 shows a photograph of some of this blood as seen under a microscope. A white blood cell has been labelled. white blood cell Fig. 4.1 (i) On Fig. 4.1 draw label lines and label one red blood cell and one platelet. [2] (ii) In the box make a large pencil drawing of the labelled white blood cell. Label the visible components. [4] (c) (i) Measure to the nearest 0.5 mm the diameter of the labelled white blood cell in Fig. 4.1. diameter = ................................................... mm [1] (ii) Measure to the nearest 0.5 mm the diameter of this cell in your drawing. diameter = ................................................... mm [1] (iii) Use these measurements to calculate the magnification of your drawing to the nearest whole number. magnification = ...........................................................[1]
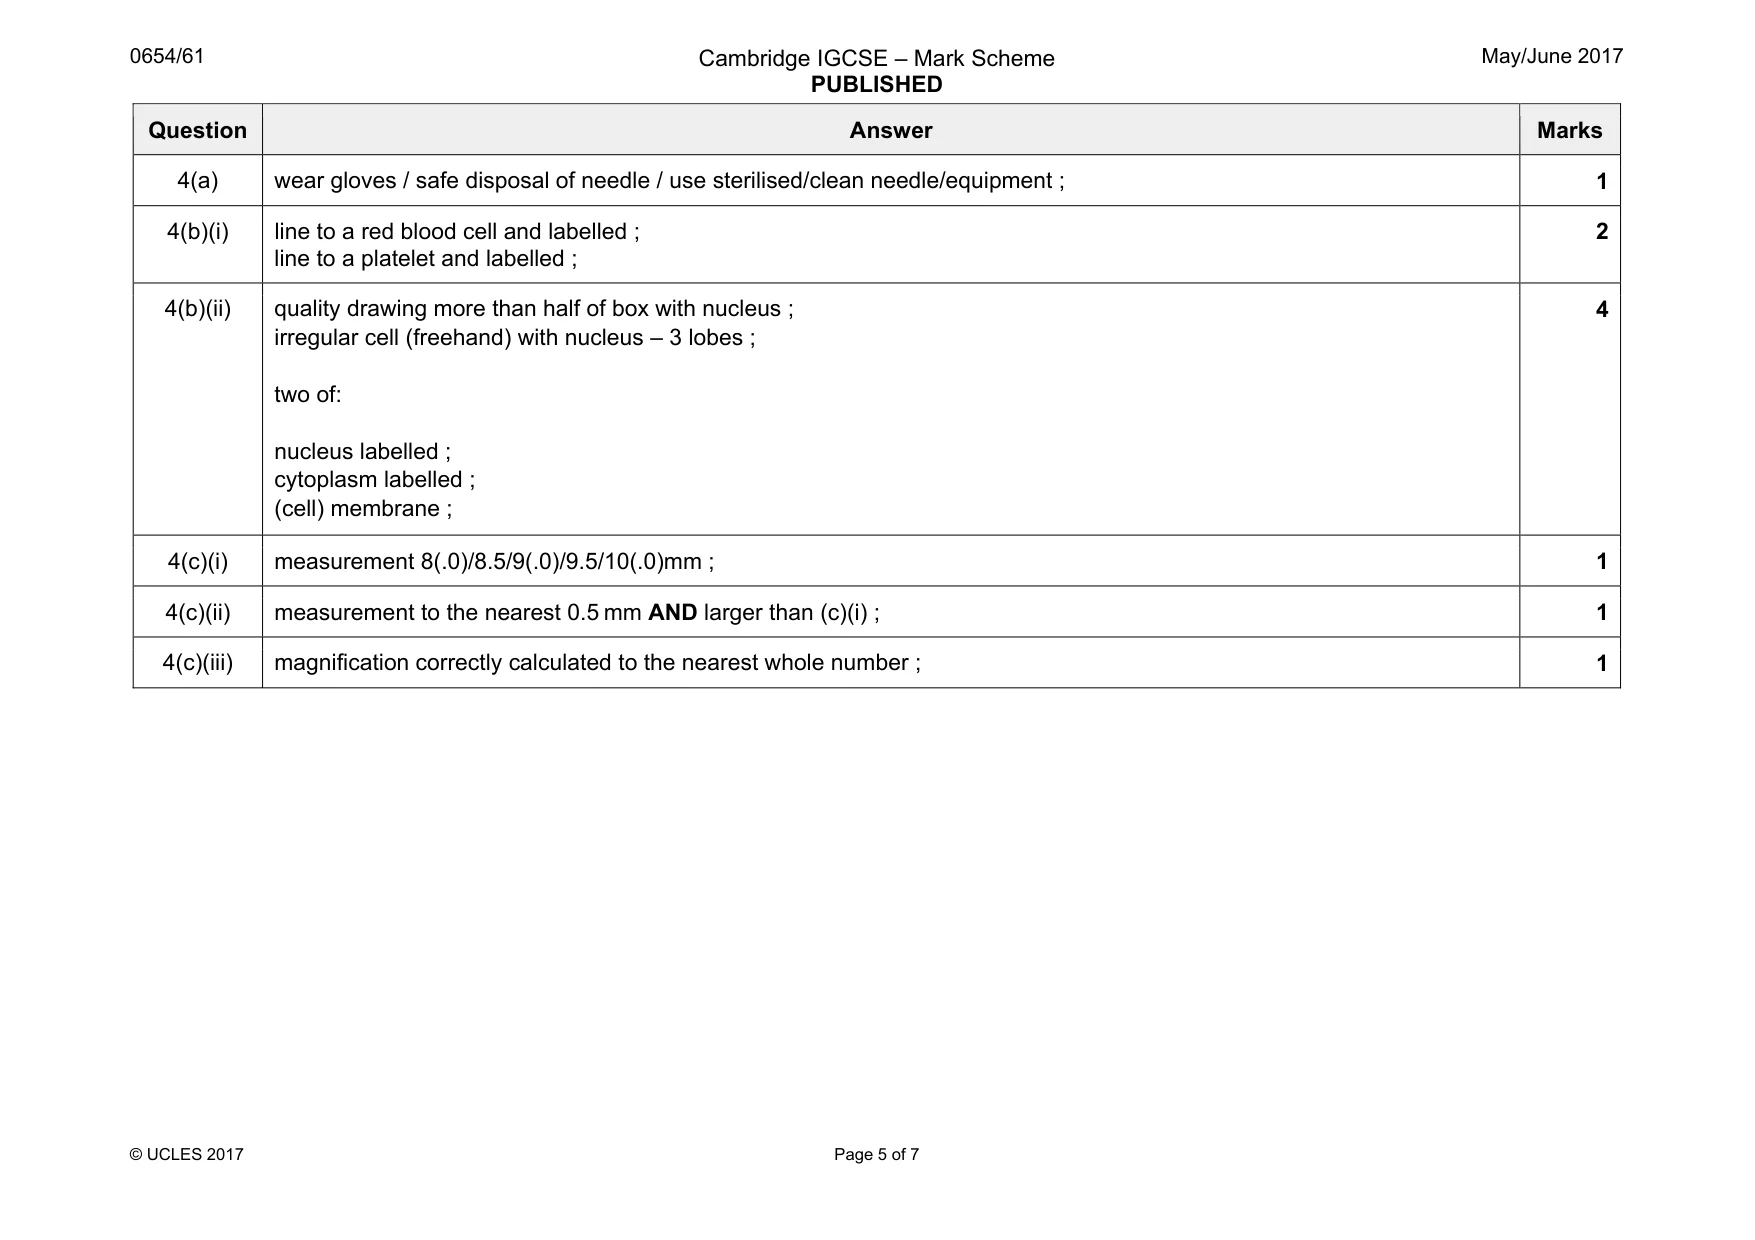
Mark scheme: 4(a) wear gloves / safe disposal of needle / use sterilised/clean needle/equipment ; 1 4(b)(i) line to a red blood cell and labelled ; line to a platelet and labelled ; 2 4(b)(ii) quality drawing more than half of box with nucleus ; irregular cell (freehand) with nucleus – 3 lobes ; two of: nucleus labelled ; cytoplasm labelled ; (cell) membrane ; 4 4(c)(i) measurement 8(.0)/8.5/9(.0)/9.5/10(.0)mm ; 1 4(c)(ii) measurement to the nearest 0.5 mm AND larger than (c)(i) ; 1 4(c)(iii) magnification correctly calculated to the nearest whole number ; 1
Q5 · A student investigates the effect of changing acid concentration on the rate of the…
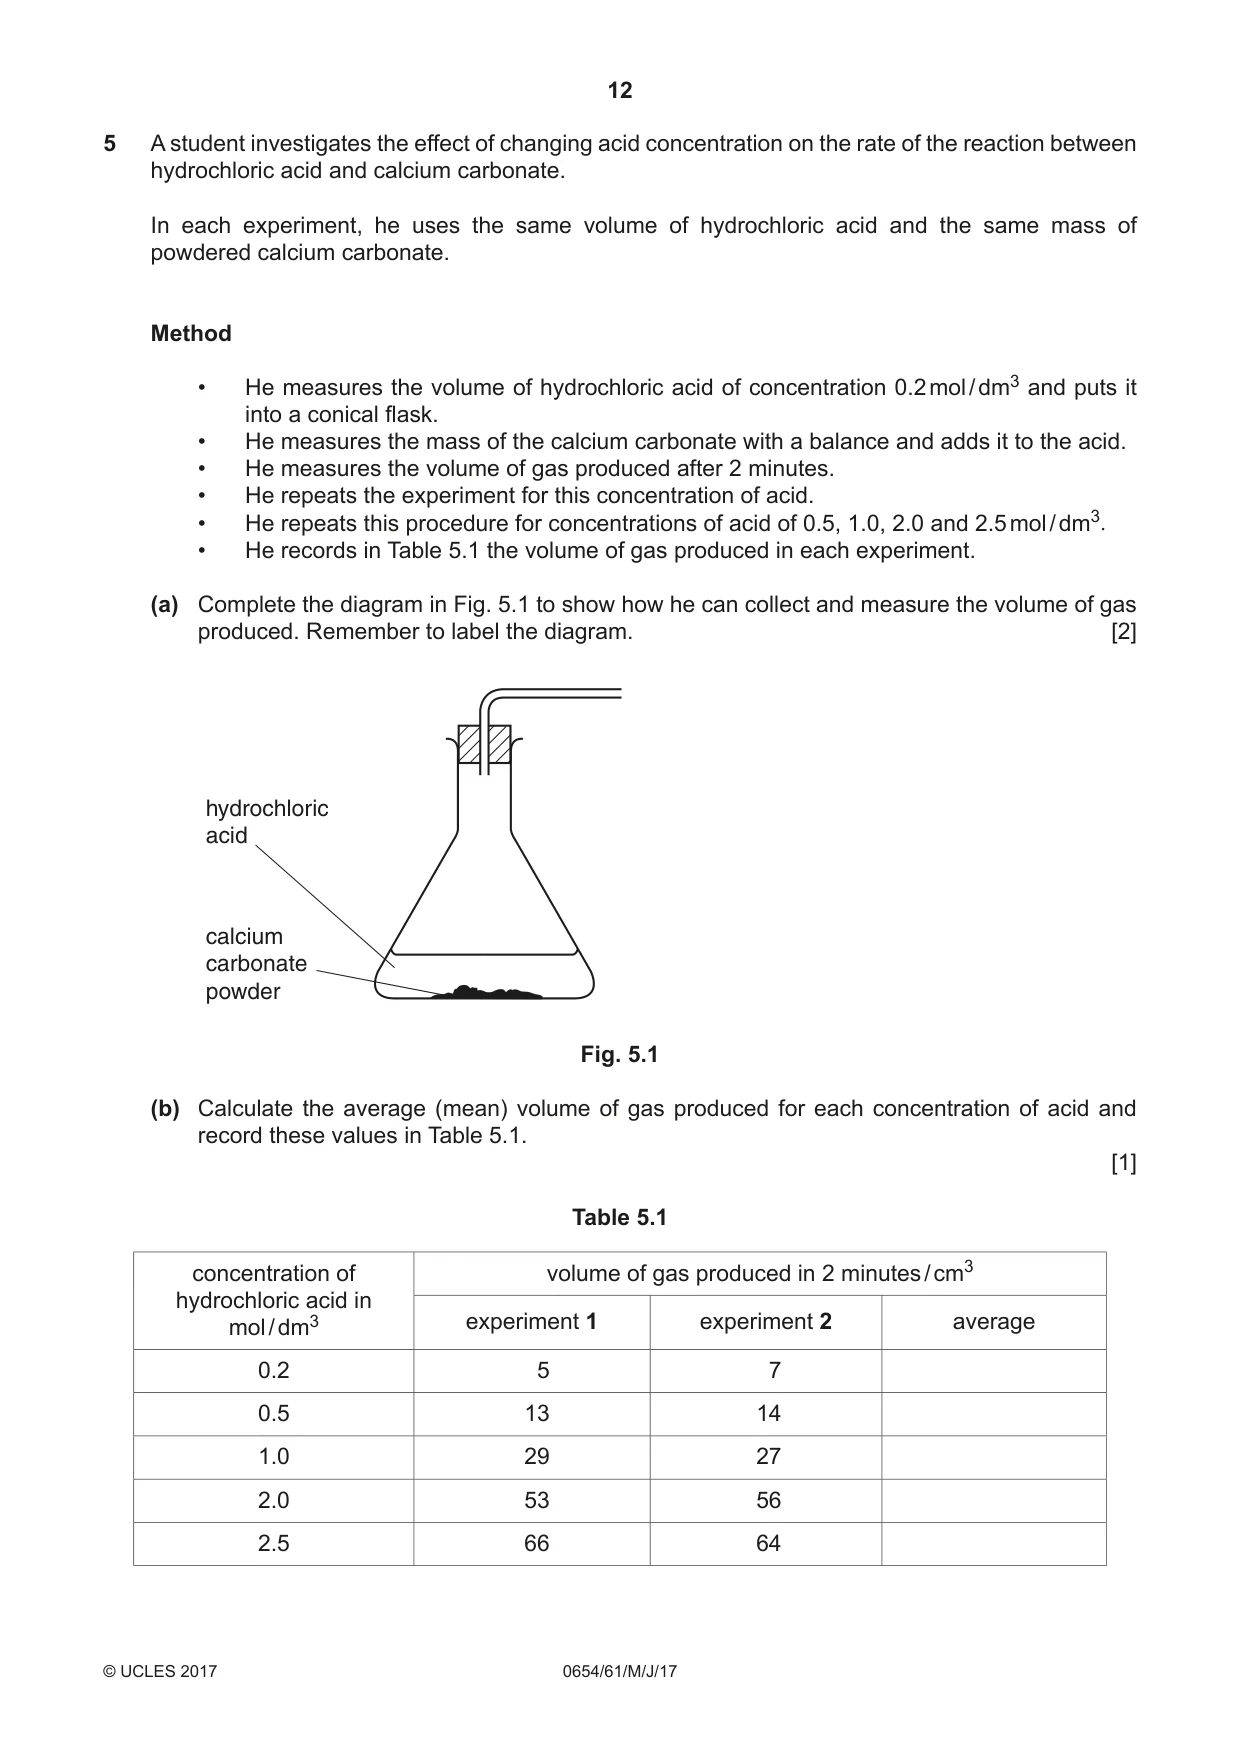
5 A student investigates the effect of changing acid concentration on the rate of the reaction between hydrochloric acid and calcium carbonate. In each experiment, he uses the same volume of hydrochloric acid and the same mass of powdered calcium carbonate. Method • He measures the volume of hydrochloric acid of concentration 0.2 mol / dm3 and puts it into a conical flask. • He measures the mass of the calcium carbonate with a balance and adds it to the acid. • He measures the volume of gas produced after 2 minutes. • He repeats the experiment for this concentration of acid. • He repeats this procedure for concentrations of acid of 0.5, 1.0, 2.0 and 2.5 mol / dm3. • He records in Table 5.1 the volume of gas produced in each experiment. (a) Complete the diagram in Fig. 5.1 to show how he can collect and measure the volume of gas produced. Remember to label the diagram. [2] hydrochloric acid calcium carbonate powder Fig. 5.1 (b) Calculate the average (mean) volume of gas produced for each concentration of acid and record these values in Table 5.1. [1] Table 5.1 concentration of volume of gas produced in 2 minutes / cm3 hydrochloric acid in mol / dm3 experiment 1 experiment 2 average 0.2 5 7 0.5 13 14 1.0 29 27 2.0 53 56 2.5 66 64 (c) State which concentration of hydrochloric acid produced the fastest rate of reaction. Use the data in Table 5.1 to justify your answer. concentration ............................................................................................................................ justification ................................................................................................................................ ................................................................................................................................................... [1] (d) (i) There is a piece of equipment not mentioned in the method, but which is needed to carry out a rate of reaction experiment. State the name of this piece of equipment. .......................................................................................................................................[1] (ii) The student measures the volume of hydrochloric acid using a measuring cylinder. State the name of a different piece of apparatus which could be used to measure the volume more accurately. .......................................................................................................................................[1] (e) (i) Suggest one factor not mentioned in the method which must be kept constant throughout the investigation. .......................................................................................................................................[1] (ii) Explain why the experiment was repeated for each concentration of hydrochloric acid. .......................................................................................................................................[1] (f) One of the products of the reaction is a gas. State the name of the gas and describe a test which can be used to confirm its identity. Remember to include the result of the test in your answer. gas ............................................................................................................................................ test ............................................................................................................................................ ................................................................................................................................................... [2]
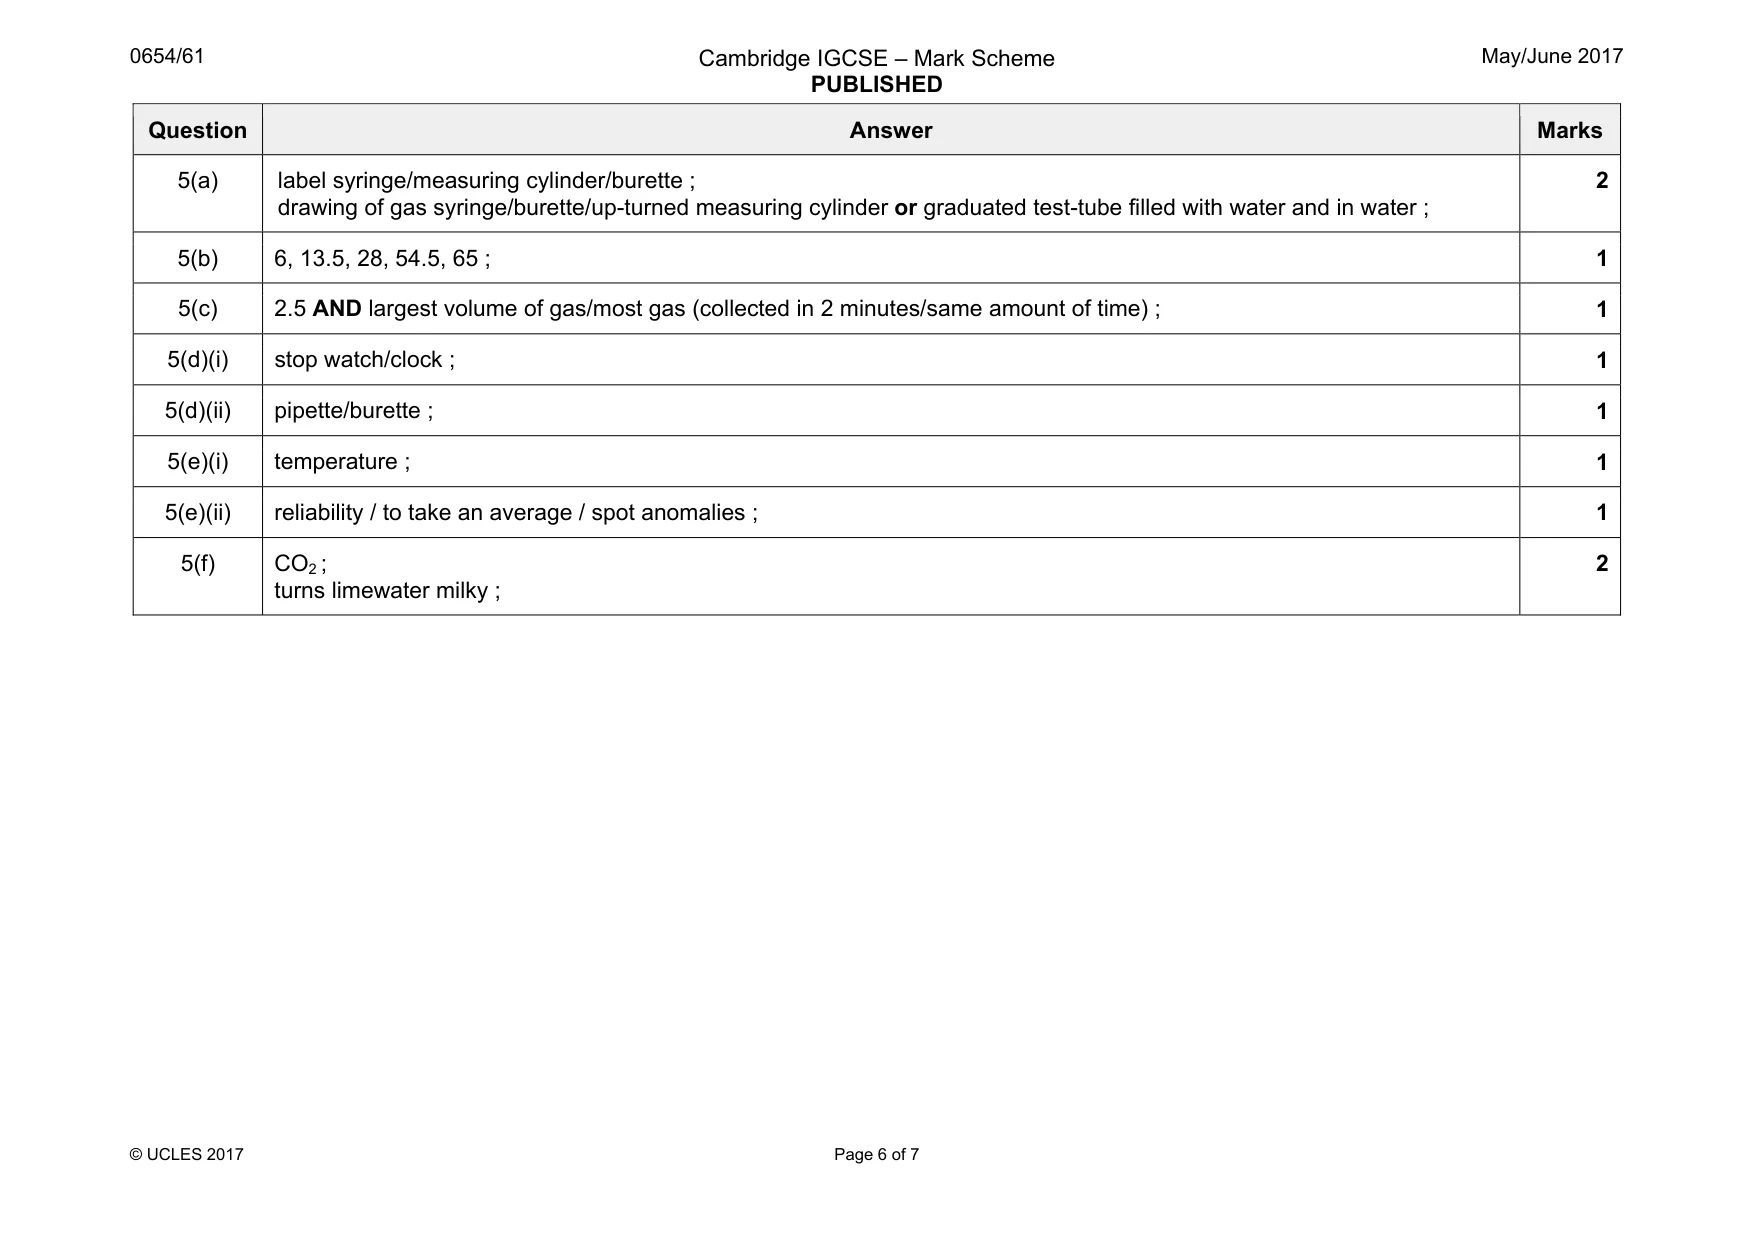
Mark scheme: 5(a) label syringe/measuring cylinder/burette ; drawing of gas syringe/burette/up-turned measuring cylinder or graduated test-tube filled with water and in water ; 2 5(b) 6, 13.5, 28, 54.5, 65 ; 1 5(c) 2.5 AND largest volume of gas/most gas (collected in 2 minutes/same amount of time) ; 1 5(d)(i) stop watch/clock ; 1 5(d)(ii) pipette/burette ; 1 5(e)(i) temperature ; 1 5(e)(ii) reliability / to take an average / spot anomalies ; 1 5(f) CO2 ; turns limewater milky ; 2
Q6 · A student investigates the air temperature at different heights, h, above a lamp as shown…
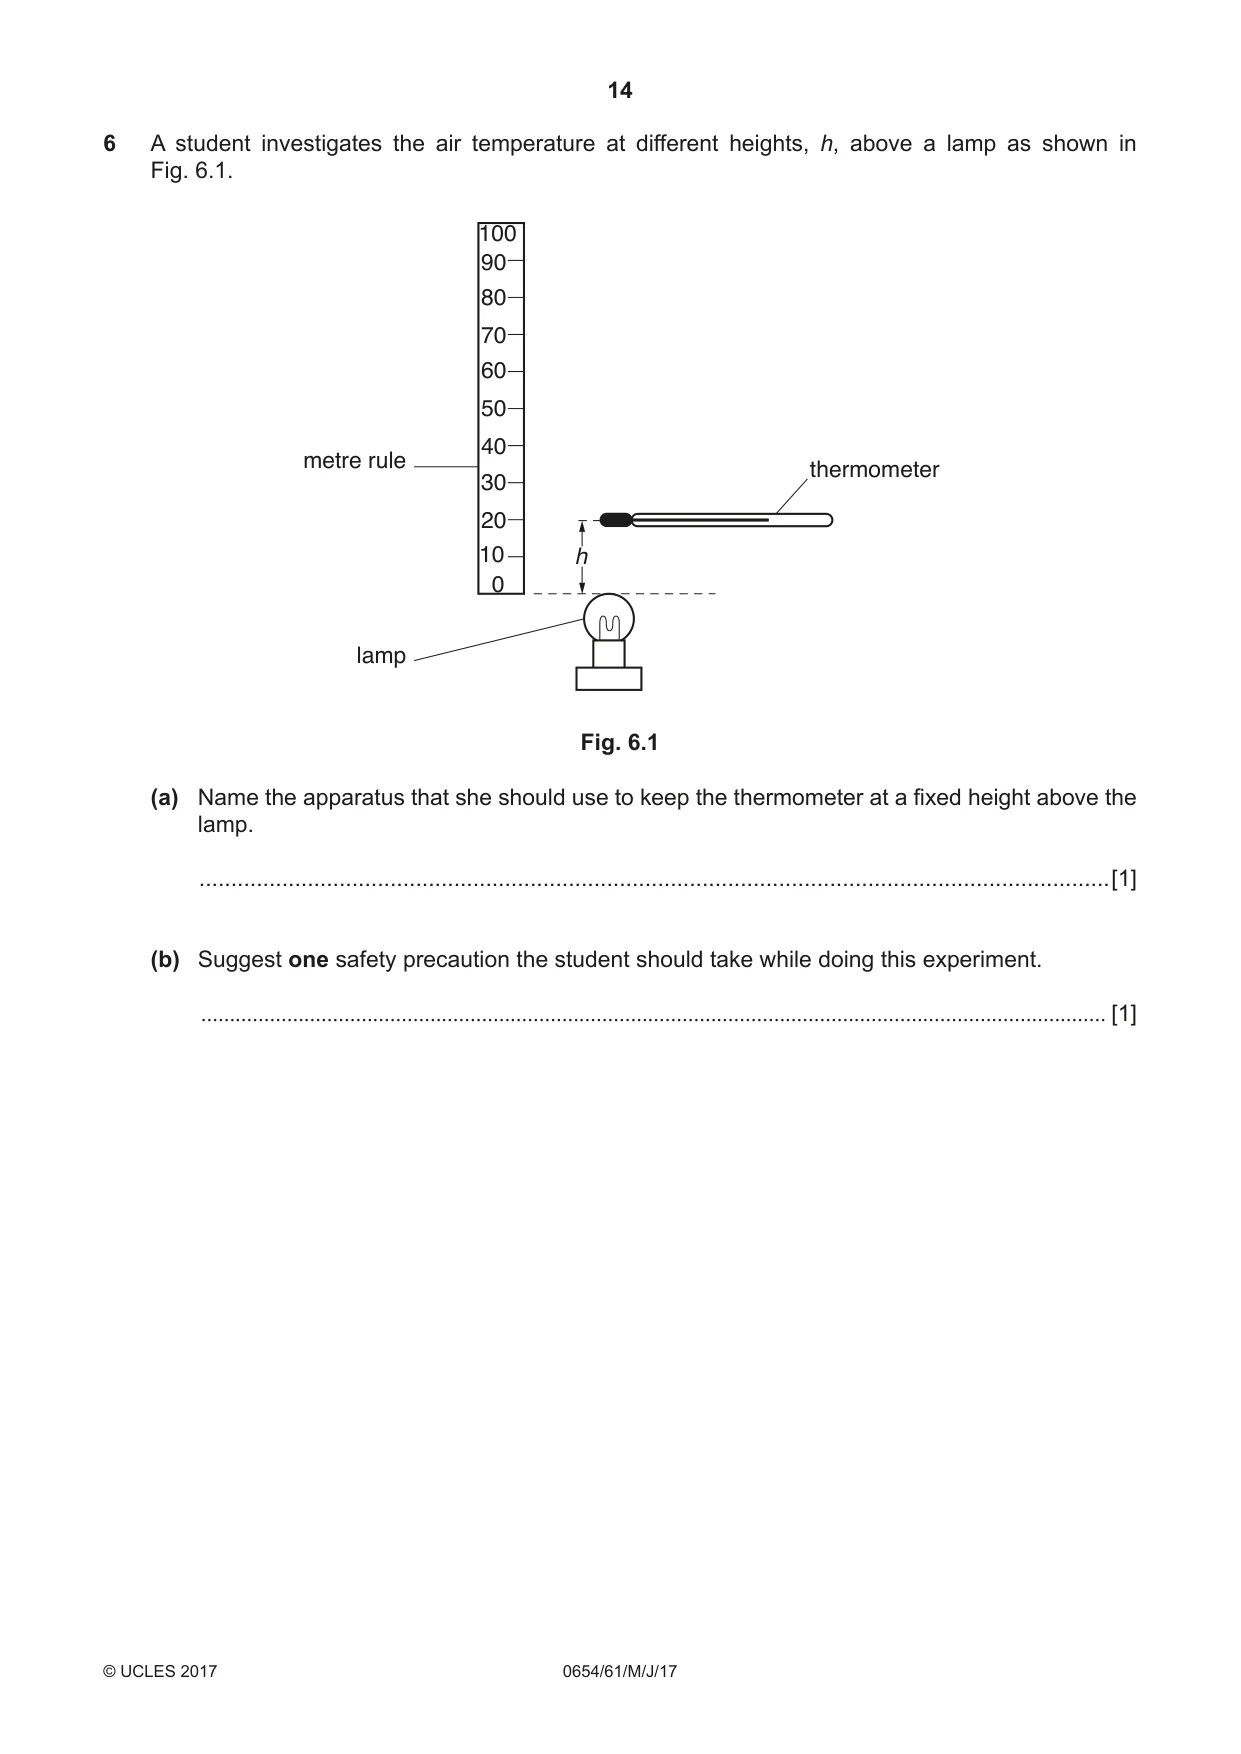
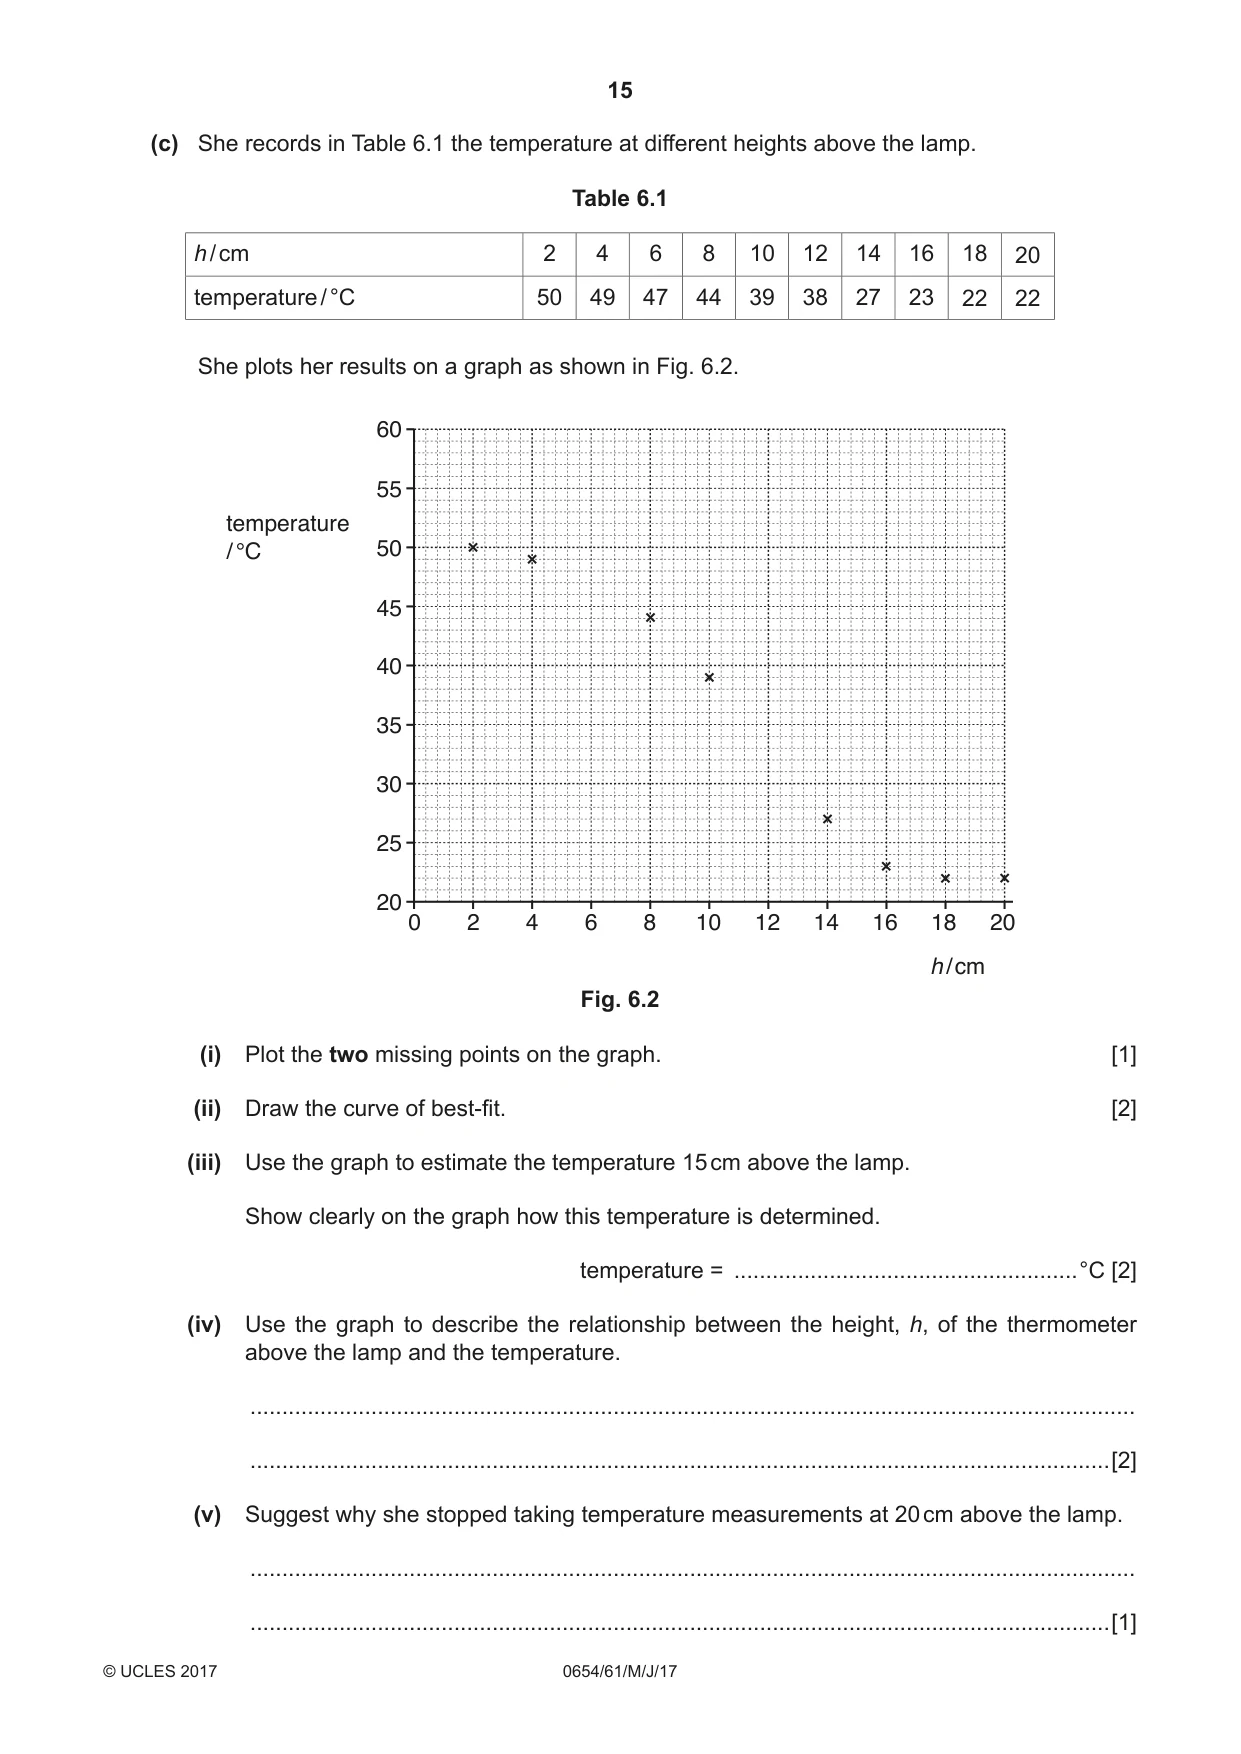
6 A student investigates the air temperature at different heights, h, above a lamp as shown in Fig. 6.1. 100 90 80 70 60 50 40 metre rule thermometer 30 20 10 h 0 lamp Fig. 6.1 (a) Name the apparatus that she should use to keep the thermometer at a fixed height above the lamp. ...............................................................................................................................................[1] (b) Suggest one safety precaution the student should take while doing this experiment. .............................................................................................................................................................. [1] (c) She records in Table 6.1 the temperature at different heights above the lamp. Table 6.1 h / cm 2 4 6 8 10 12 14 16 18 20 temperature / °C 50 49 47 44 39 38 27 23 22 22 She plots her results on a graph as shown in Fig. 6.2. 60 55 temperature / °C 50 45 40 35 30 25 20 0 2 4 6 8 10 12 14 16 18 20 h / cm Fig. 6.2 (i) Plot the two missing points on the graph. [1] (ii) Draw the curve of best-fit. [2] (iii) Use the graph to estimate the temperature 15 cm above the lamp. Show clearly on the graph how this temperature is determined. temperature = ......................................................°C [2] (iv) Use the graph to describe the relationship between the height, h, of the thermometer above the lamp and the temperature. ........................................................................................................................................... .......................................................................................................................................[2] (v) Suggest why she stopped taking temperature measurements at 20 cm above the lamp. ........................................................................................................................................... .......................................................................................................................................[1]
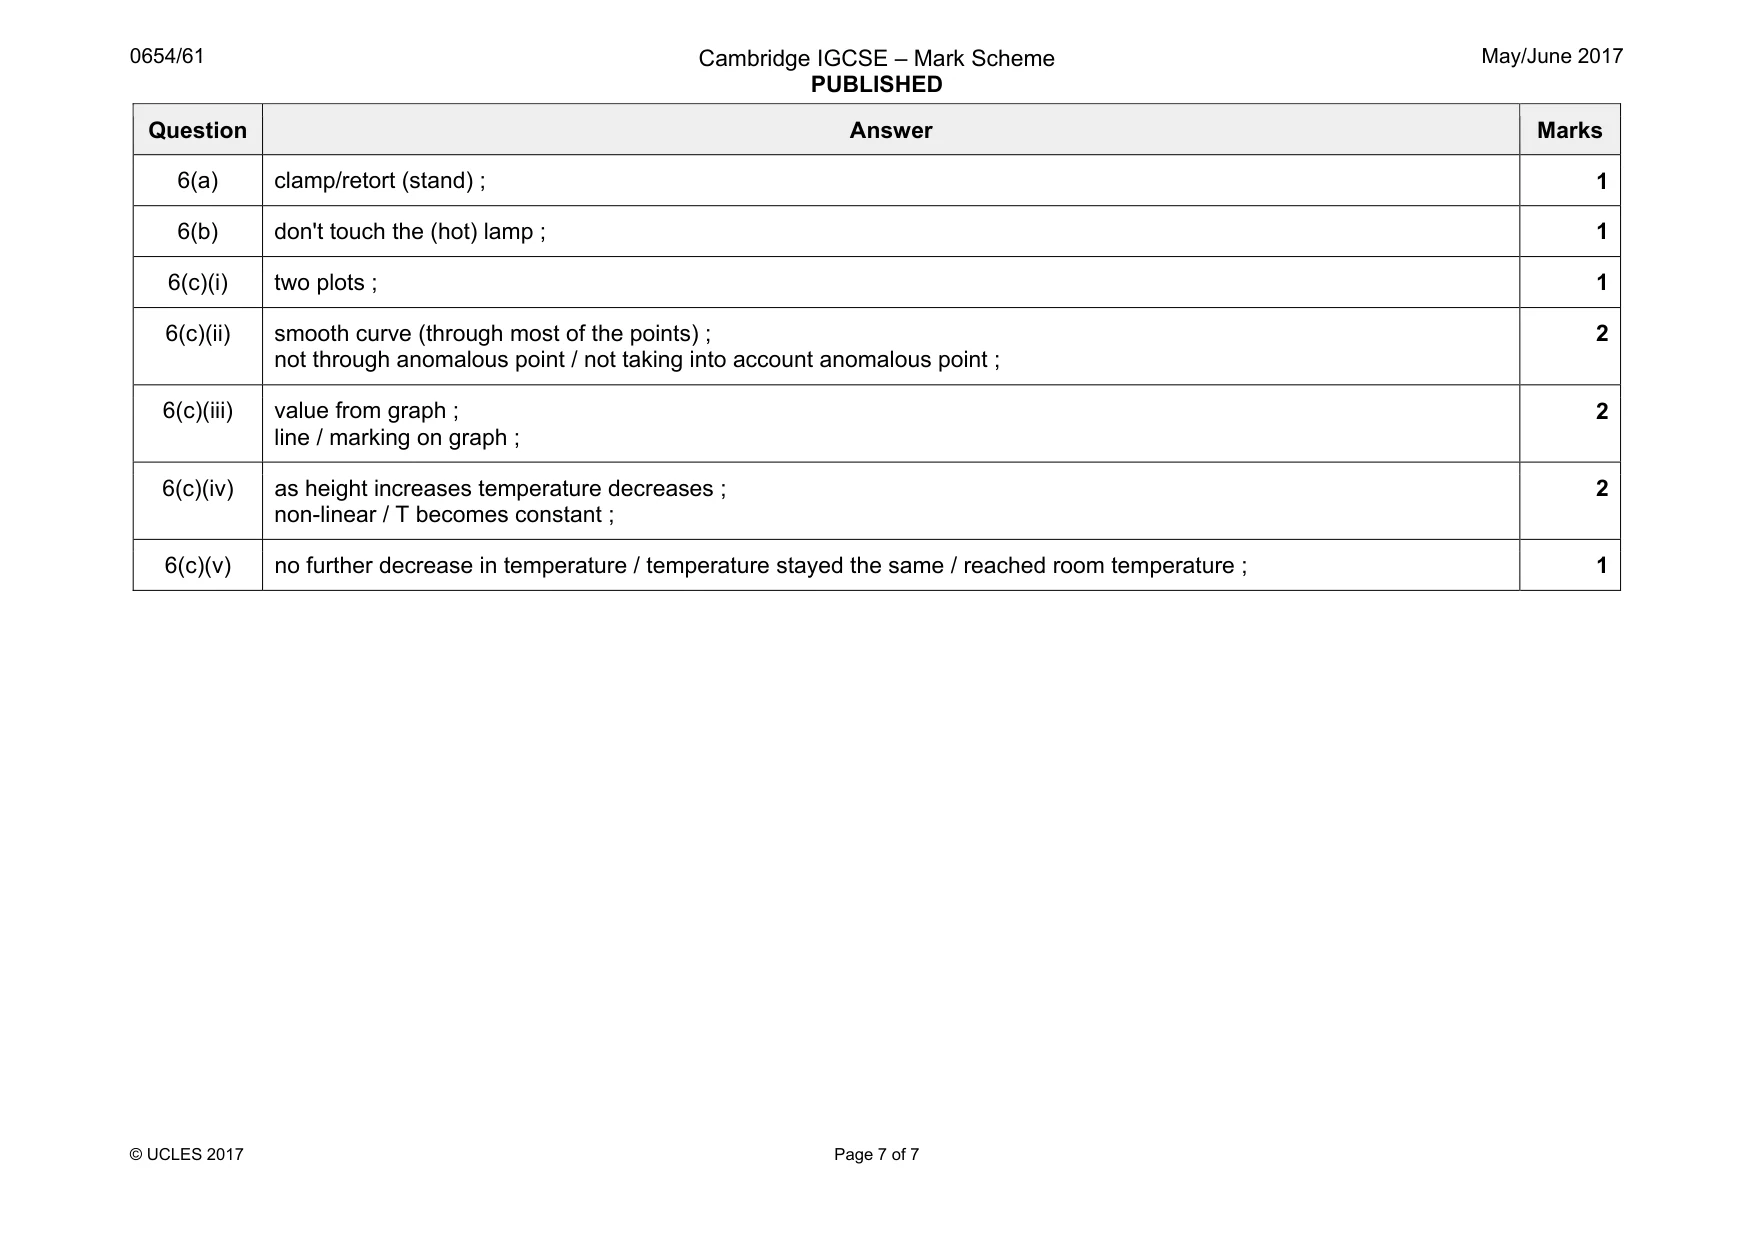
Mark scheme: 6(a) clamp/retort (stand) ; 1 6(b) don't touch the (hot) lamp ; 1 6(c)(i) two plots ; 1 6(c)(ii) smooth curve (through most of the points) ; not through anomalous point / not taking into account anomalous point ; 2 6(c)(iii) value from graph ; line / marking on graph ; 2 6(c)(iv) as height increases temperature decreases ; non-linear / T becomes constant ; 2 6(c)(v) no further decrease in temperature / temperature stayed the same / reached room temperature ; 1
More questions on Physical quantities and measurement techniques
What was in this paper
The subtopics covered by these 6 questions, and how many questions each got. Open one in a new tab to see every Cambridge question on it.
What you needed in this session
Cambridge’s own grade thresholds for 2017 May/June, Paper 6 · Variant 1. A higher threshold means an easier paper — the bar moves with how the cohort did.