Cambridge IGCSE Science - Combined 0653 — 2024 May/June Paper 6 · Variant 2
0653/62/M/J/24 · 4 questions · 40 marks · ≈45 min
The question paper and its mark scheme, free to read here and free to download. This is Cambridge’s own paper, exactly as it was sat.
Question paper16 pages



Mark scheme8 pages
Answers below. Sit the paper first if you are practising.
Questions as text
Q1 · A student investigates the effect of enzyme concentration on the breakdown of a substance
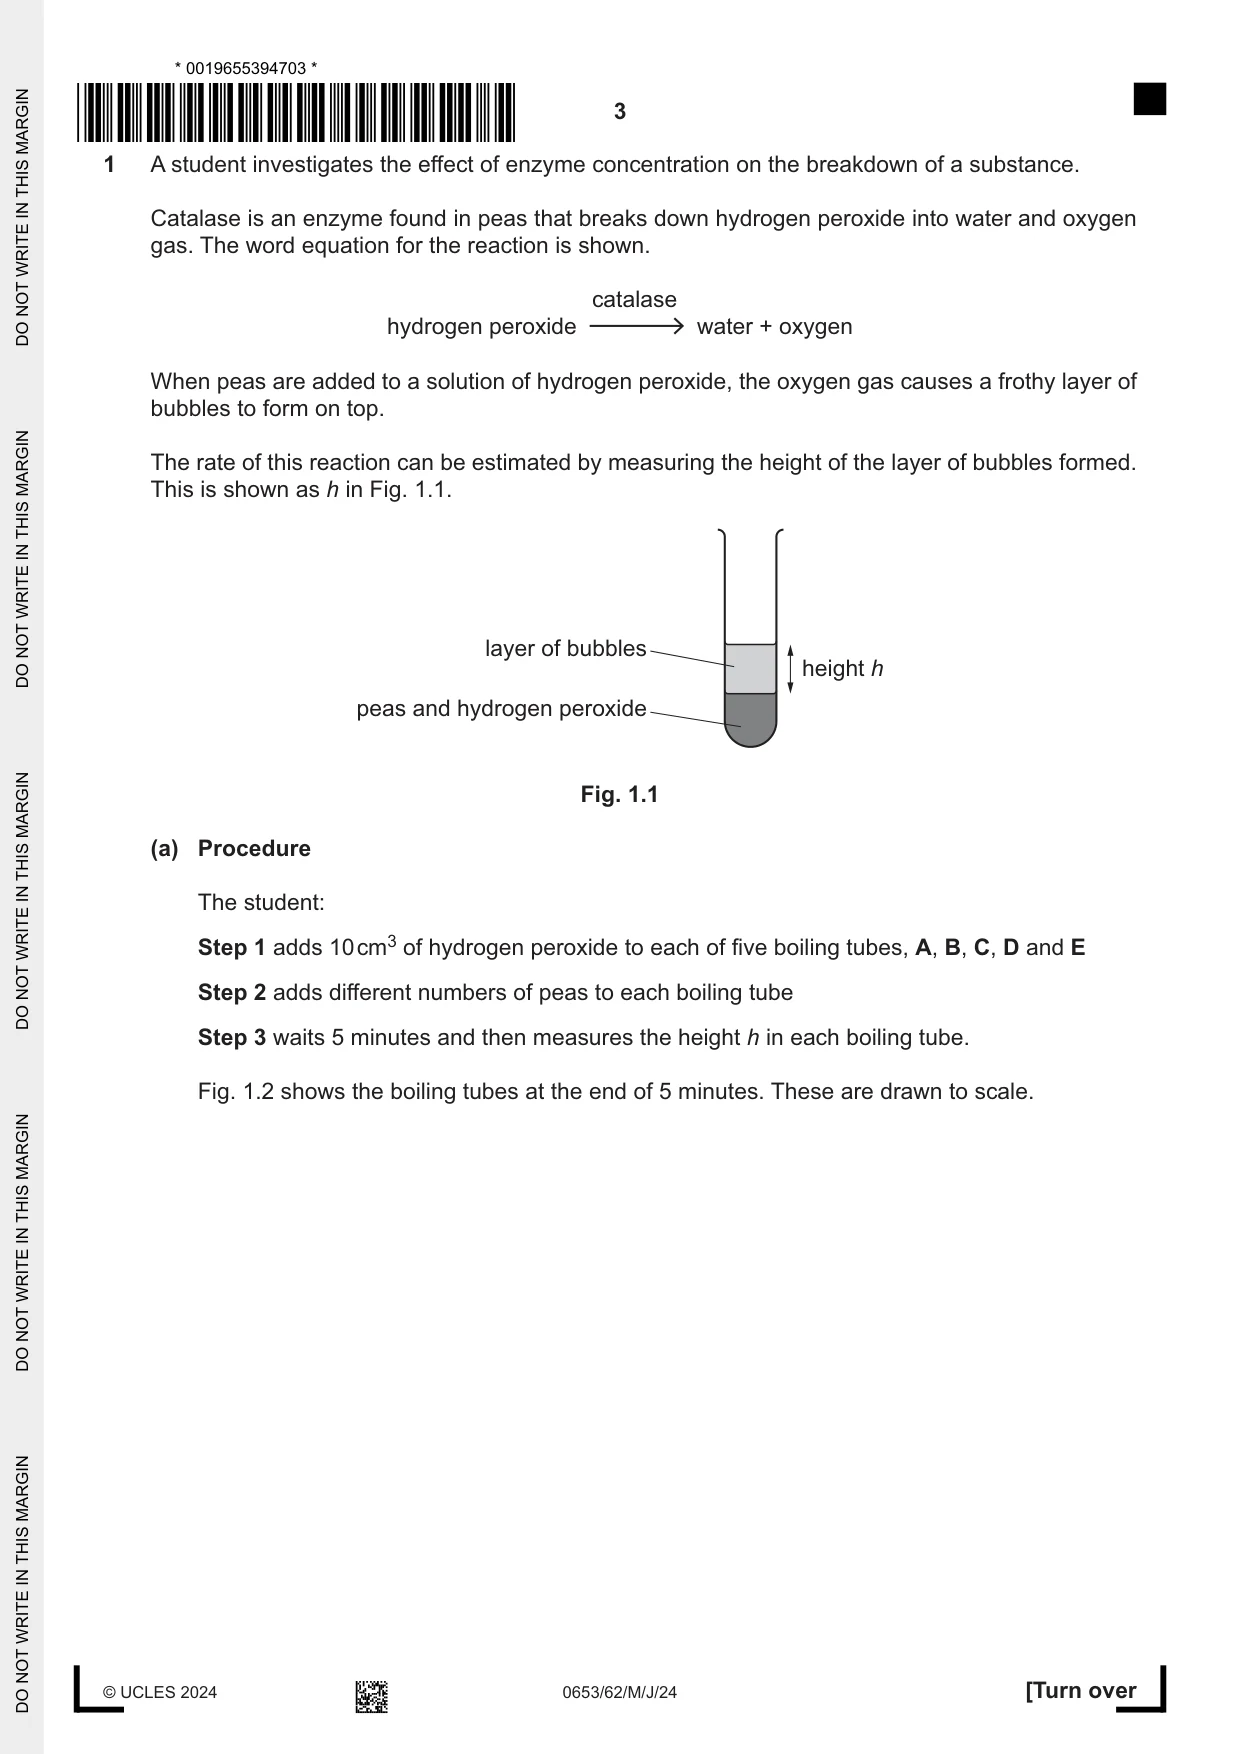
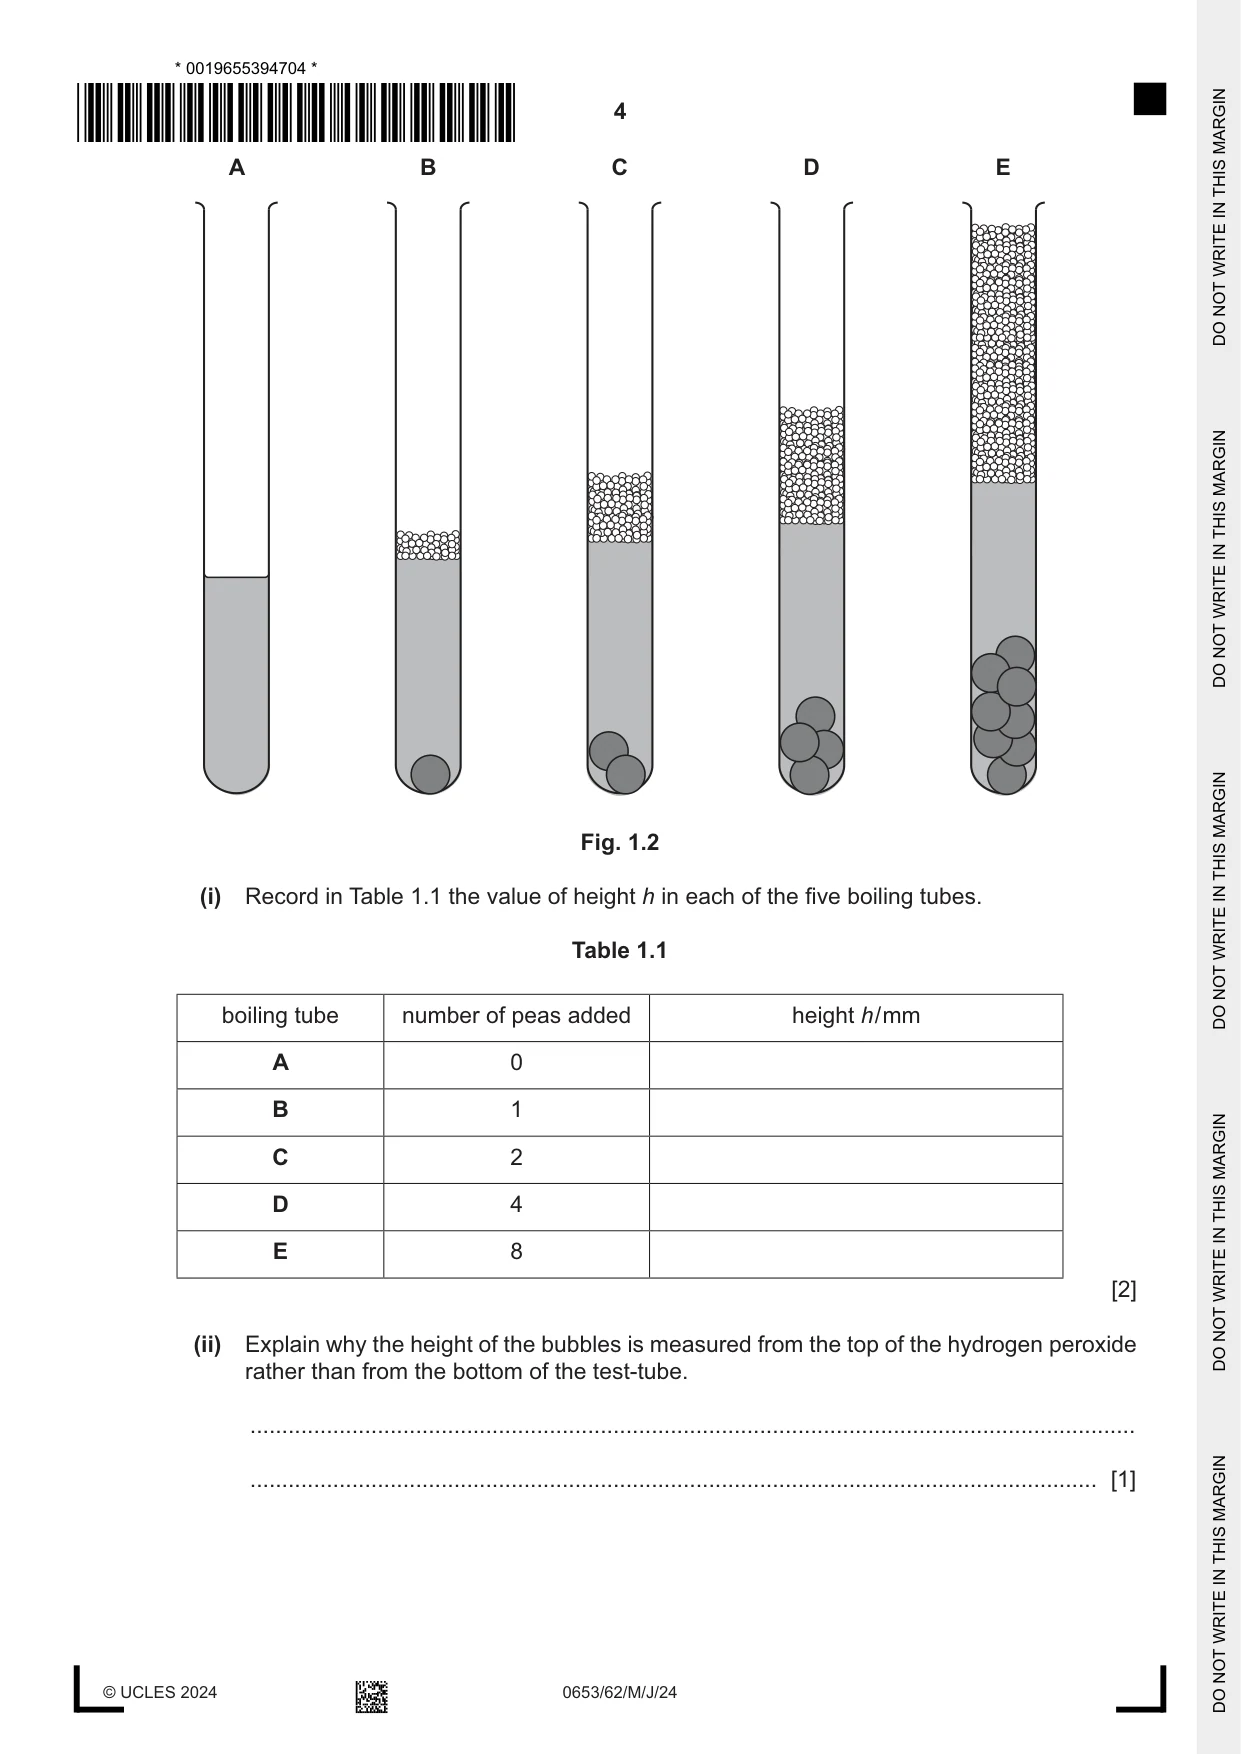
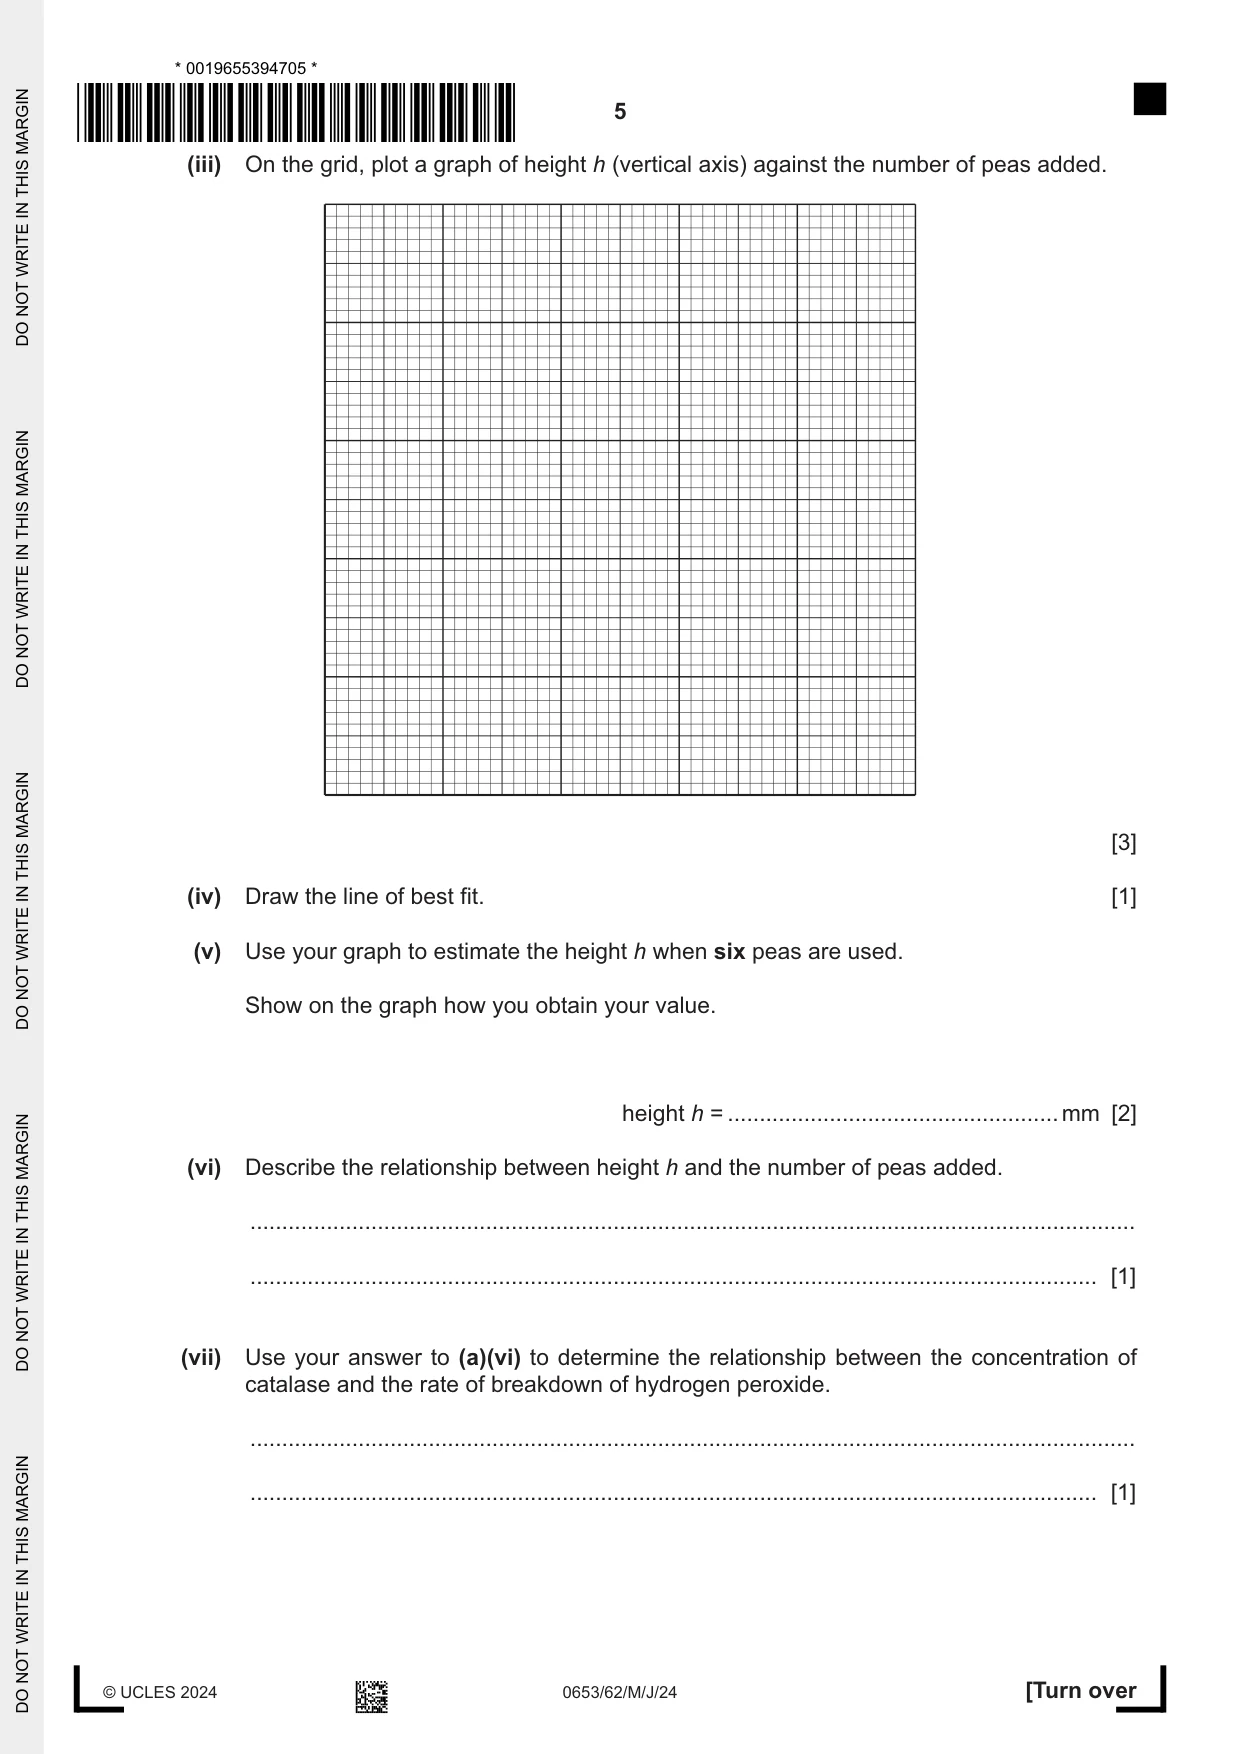
1 A student investigates the effect of enzyme concentration on the breakdown of a substance. Catalase is an enzyme found in peas that breaks down hydrogen peroxide into water and oxygen gas. The word equation for the reaction is shown. catalase hydrogen peroxide water + oxygen When peas are added to a solution of hydrogen peroxide, the oxygen gas causes a frothy layer of bubbles to form on top. The rate of this reaction can be estimated by measuring the height of the layer of bubbles formed. This is shown as h in Fig. 1.1. layer of bubbles height h peas and hydrogen peroxide Fig. 1.1 (a) Procedure The student: Step 1 adds 10 cm3 of hydrogen peroxide to each of five boiling tubes, A, B, C, D and E Step 2 adds different numbers of peas to each boiling tube Step 3 waits 5 minutes and then measures the height h in each boiling tube. Fig. 1.2 shows the boiling tubes at the end of 5 minutes. These are drawn to scale. A B C D E Fig. 1.2 (i) Record in Table 1.1 the value of height h in each of the five boiling tubes. Table 1.1 boiling tube number of peas added height h / mm A 0 B 1 C 2 D 4 E 8 [2] (ii) Explain why the height of the bubbles is measured from the top of the hydrogen peroxide rather than from the bottom of the test-tube. ........................................................................................................................................... ..................................................................................................................................... [1] (iii) On the grid, plot a graph of height h (vertical axis) against the number of peas added. [3] (iv) Draw the line of best fit. [1] (v) Use your graph to estimate the height h when six peas are used. Show on the graph how you obtain your value. height h = .................................................... mm [2] (vi) Describe the relationship between height h and the number of peas added. ........................................................................................................................................... ..................................................................................................................................... [1] (vii) Use your answer to (a)(vi) to determine the relationship between the concentration of catalase and the rate of breakdown of hydrogen peroxide. ........................................................................................................................................... ..................................................................................................................................... [1] (b) Identify one source of error when measuring height h in (a)(i). ................................................................................................................................................... ............................................................................................................................................. [1] (c) The student repeats the procedure several times for each boiling tube. Suggest how repeating the procedure allows the student to evaluate the quality of the data. ................................................................................................................................................... ............................................................................................................................................. [1] [Total: 13]
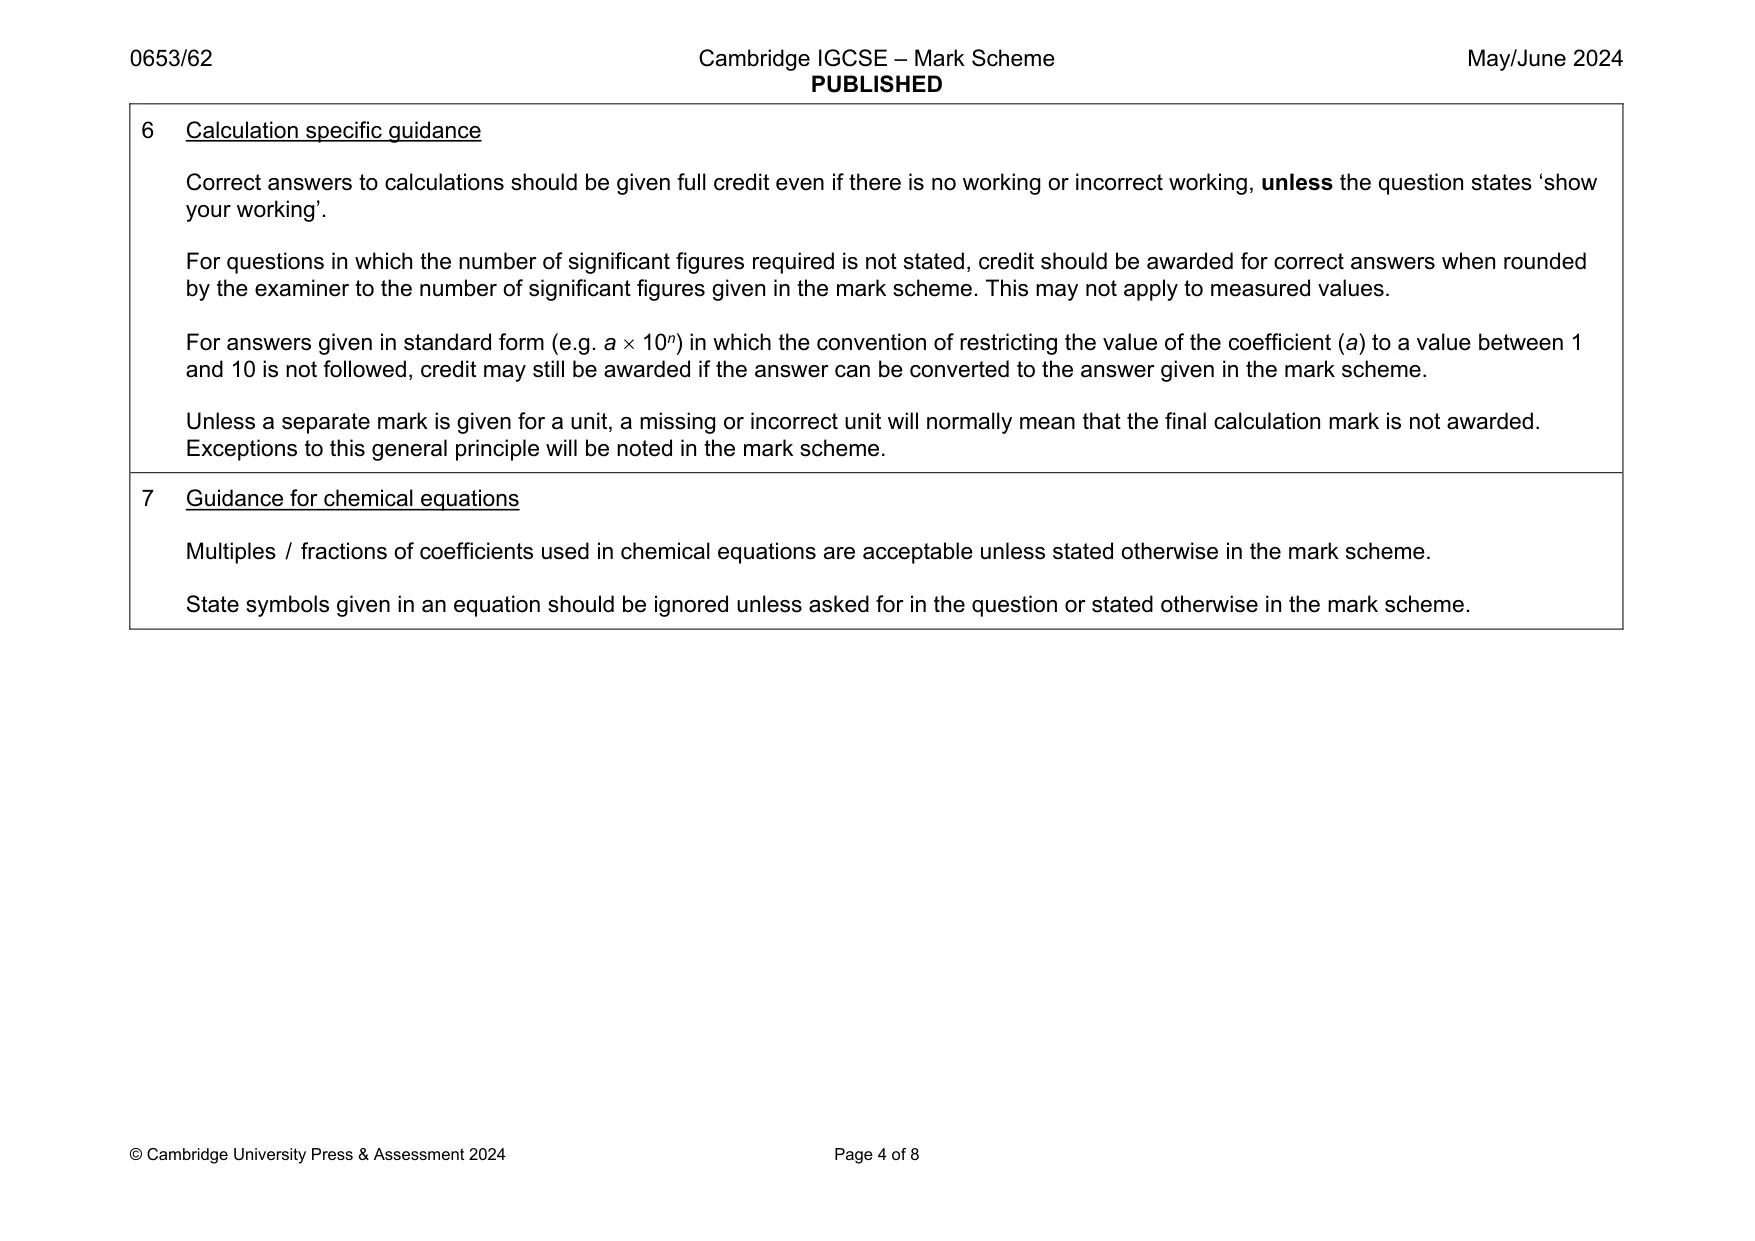
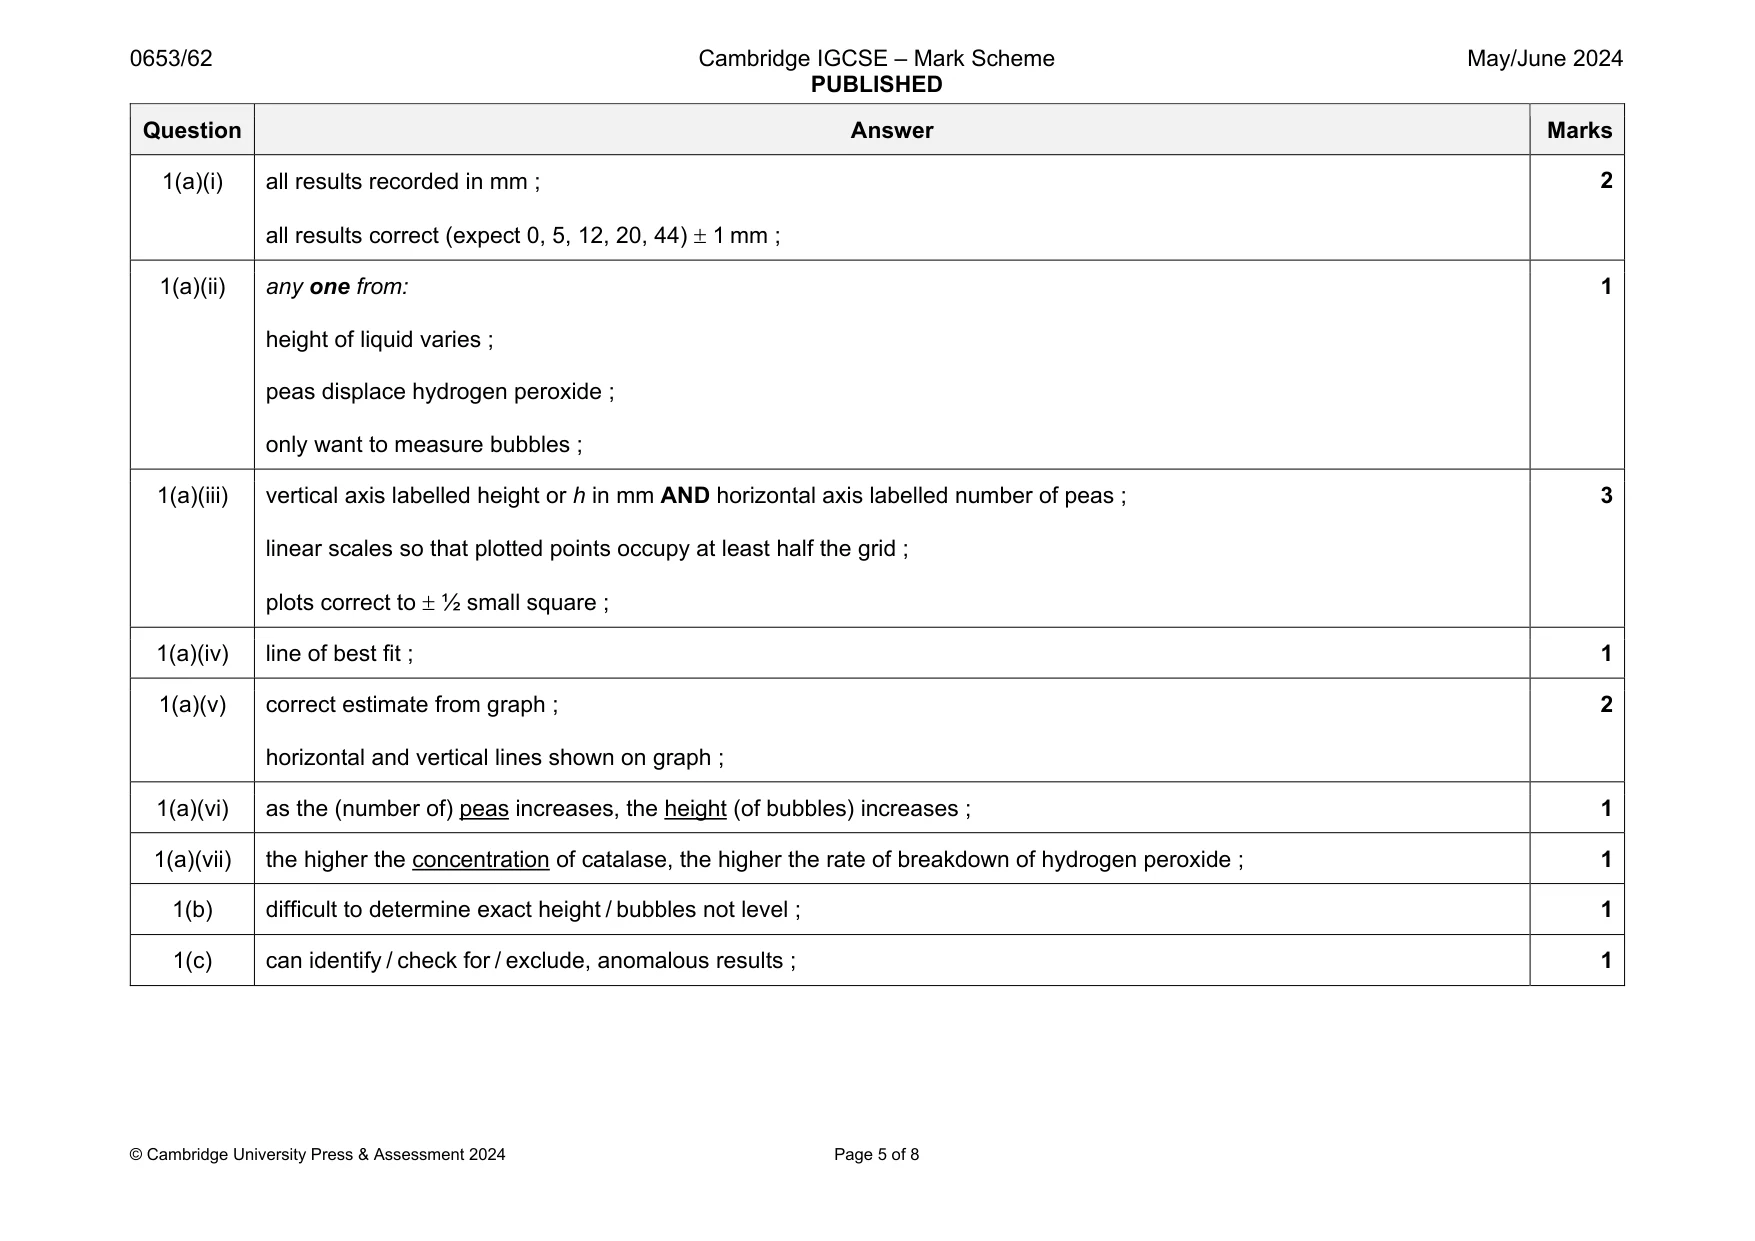
Mark scheme: 1(a)(i) all results recorded in mm ; all results correct (expect 0, 5, 12, 20, 44) 1 mm ; 1(a)(ii) any one from: height of liquid varies ; peas displace hydrogen peroxide ; only want to measure bubbles ; 1 1(a)(iii) vertical axis labelled height or h in mm AND horizontal axis labelled number of peas ; linear scales so that plotted points occupy at least half the grid ; plots correct to ½ small square ; 3 1(a)(iv) line of best fit ; 1 1(a)(v) correct estimate from graph ; horizontal and vertical lines shown on graph ; 2 1(a)(vi) as the (number of) peas increases, the height (of bubbles) increases ; 1 1(a)(vii) the higher the concentration of catalase, the higher the rate of breakdown of hydrogen peroxide ; 1 1(b) difficult to determine exact height / bubbles not level ; 1 1(c) can identify / check for / exclude, anomalous results ; 1
Q2 · A student investigates the identity of unknown solution X
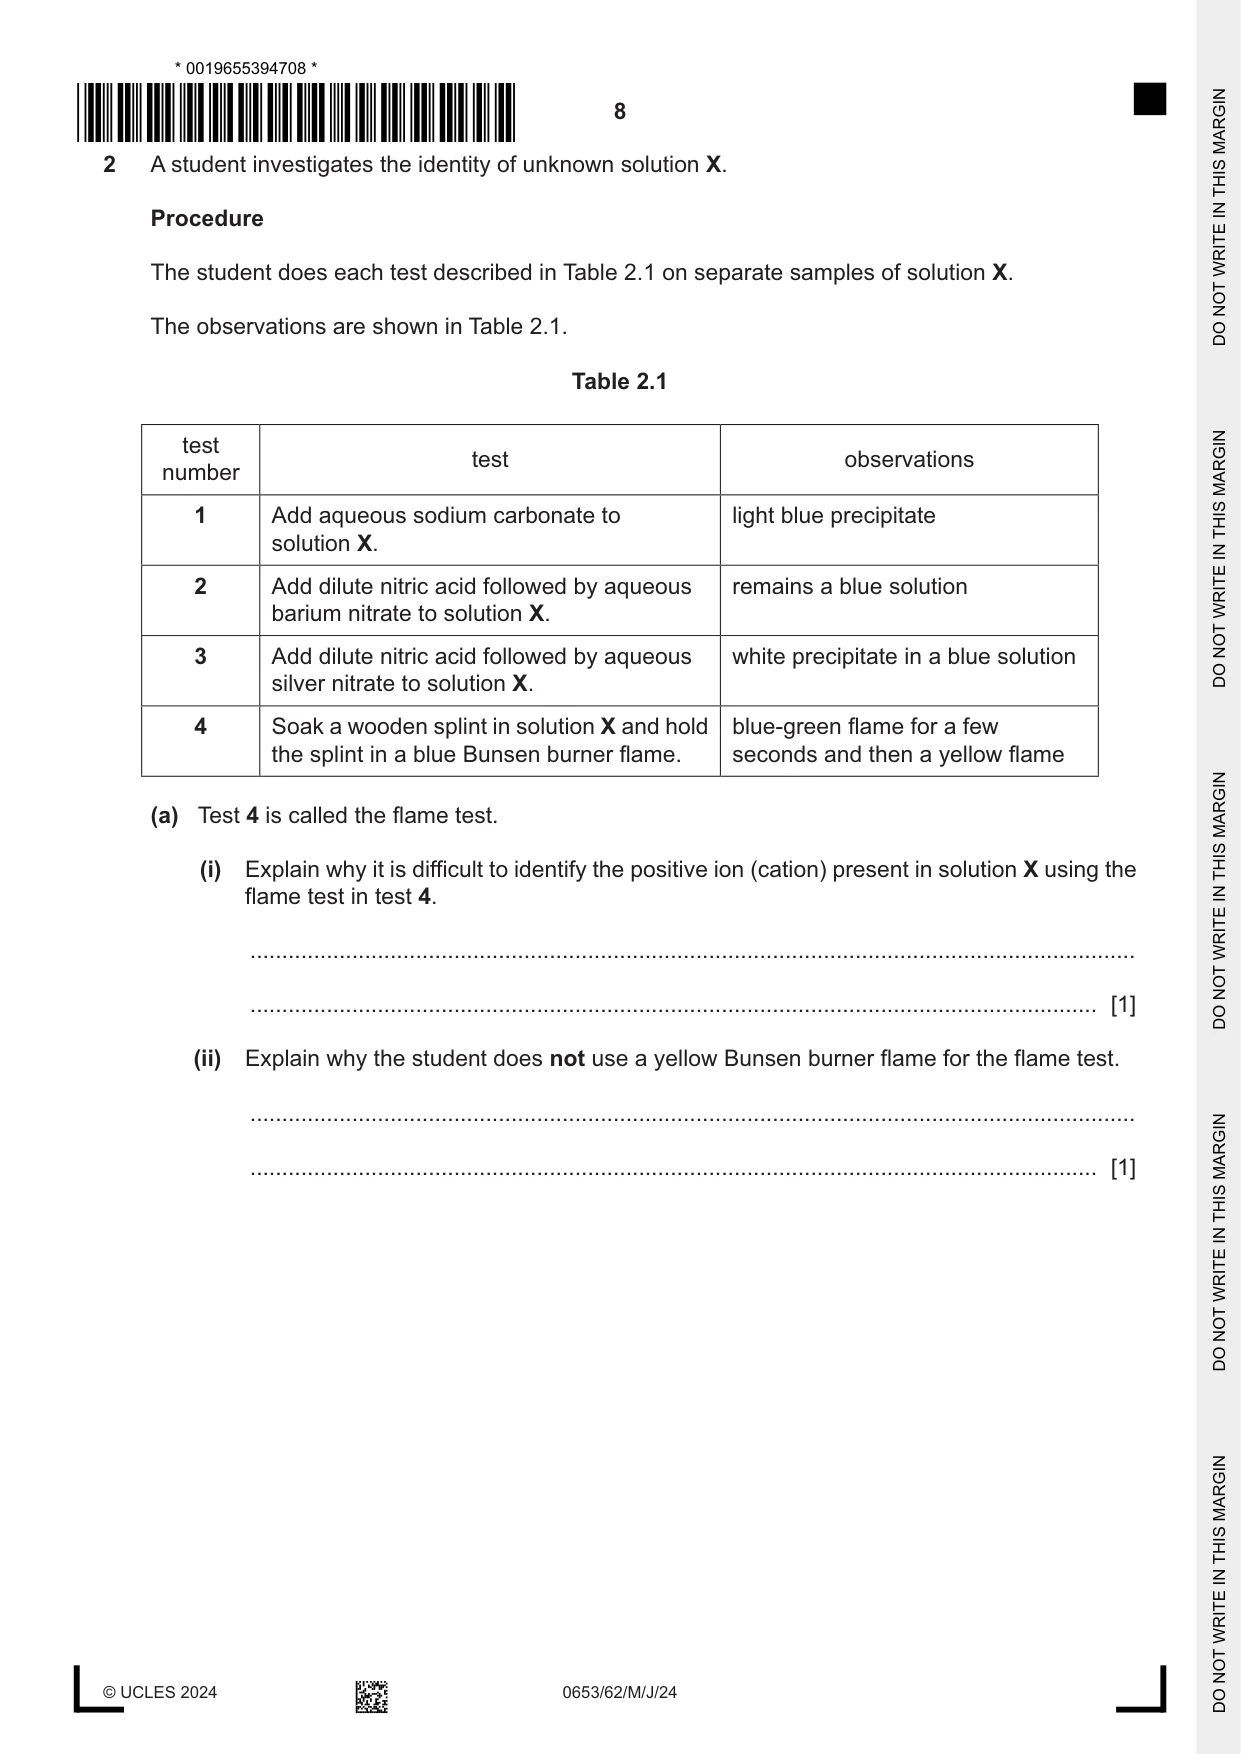
2 A student investigates the identity of unknown solution X. Procedure The student does each test described in Table 2.1 on separate samples of solution X. The observations are shown in Table 2.1. Table 2.1 test test observations number 1 Add aqueous sodium carbonate to light blue precipitate solution X. 2 Add dilute nitric acid followed by aqueous remains a blue solution barium nitrate to solution X. 3 Add dilute nitric acid followed by aqueous white precipitate in a blue solution silver nitrate to solution X. 4 Soak a wooden splint in solution X and hold blue-green flame for a few the splint in a blue Bunsen burner flame. seconds and then a yellow flame (a) Test 4 is called the flame test. (i) Explain why it is difficult to identify the positive ion (cation) present in solution X using the flame test in test 4. ........................................................................................................................................... ..................................................................................................................................... [1] (ii) Explain why the student does not use a yellow Bunsen burner flame for the flame test. ........................................................................................................................................... ..................................................................................................................................... [1] (b) Solution X is blue. In test 3, the precipitate appears to be blue. Describe what the student does to confirm the precipitate is white and not blue. ................................................................................................................................................... .............................................................................................................................................. [1] (c) Identify the negative ion (anion) present in solution X. State which test you use to make this identification. negative ion is ........................................................................................................................... test ............................................................................................................................................ [2] (d) Solution X contains Cu2+ ions. The student adds aqueous ammonia to solution X until the ammonia is in excess. Describe the observations made by the student. ................................................................................................................................................... .............................................................................................................................................. [2] [Total: 7]
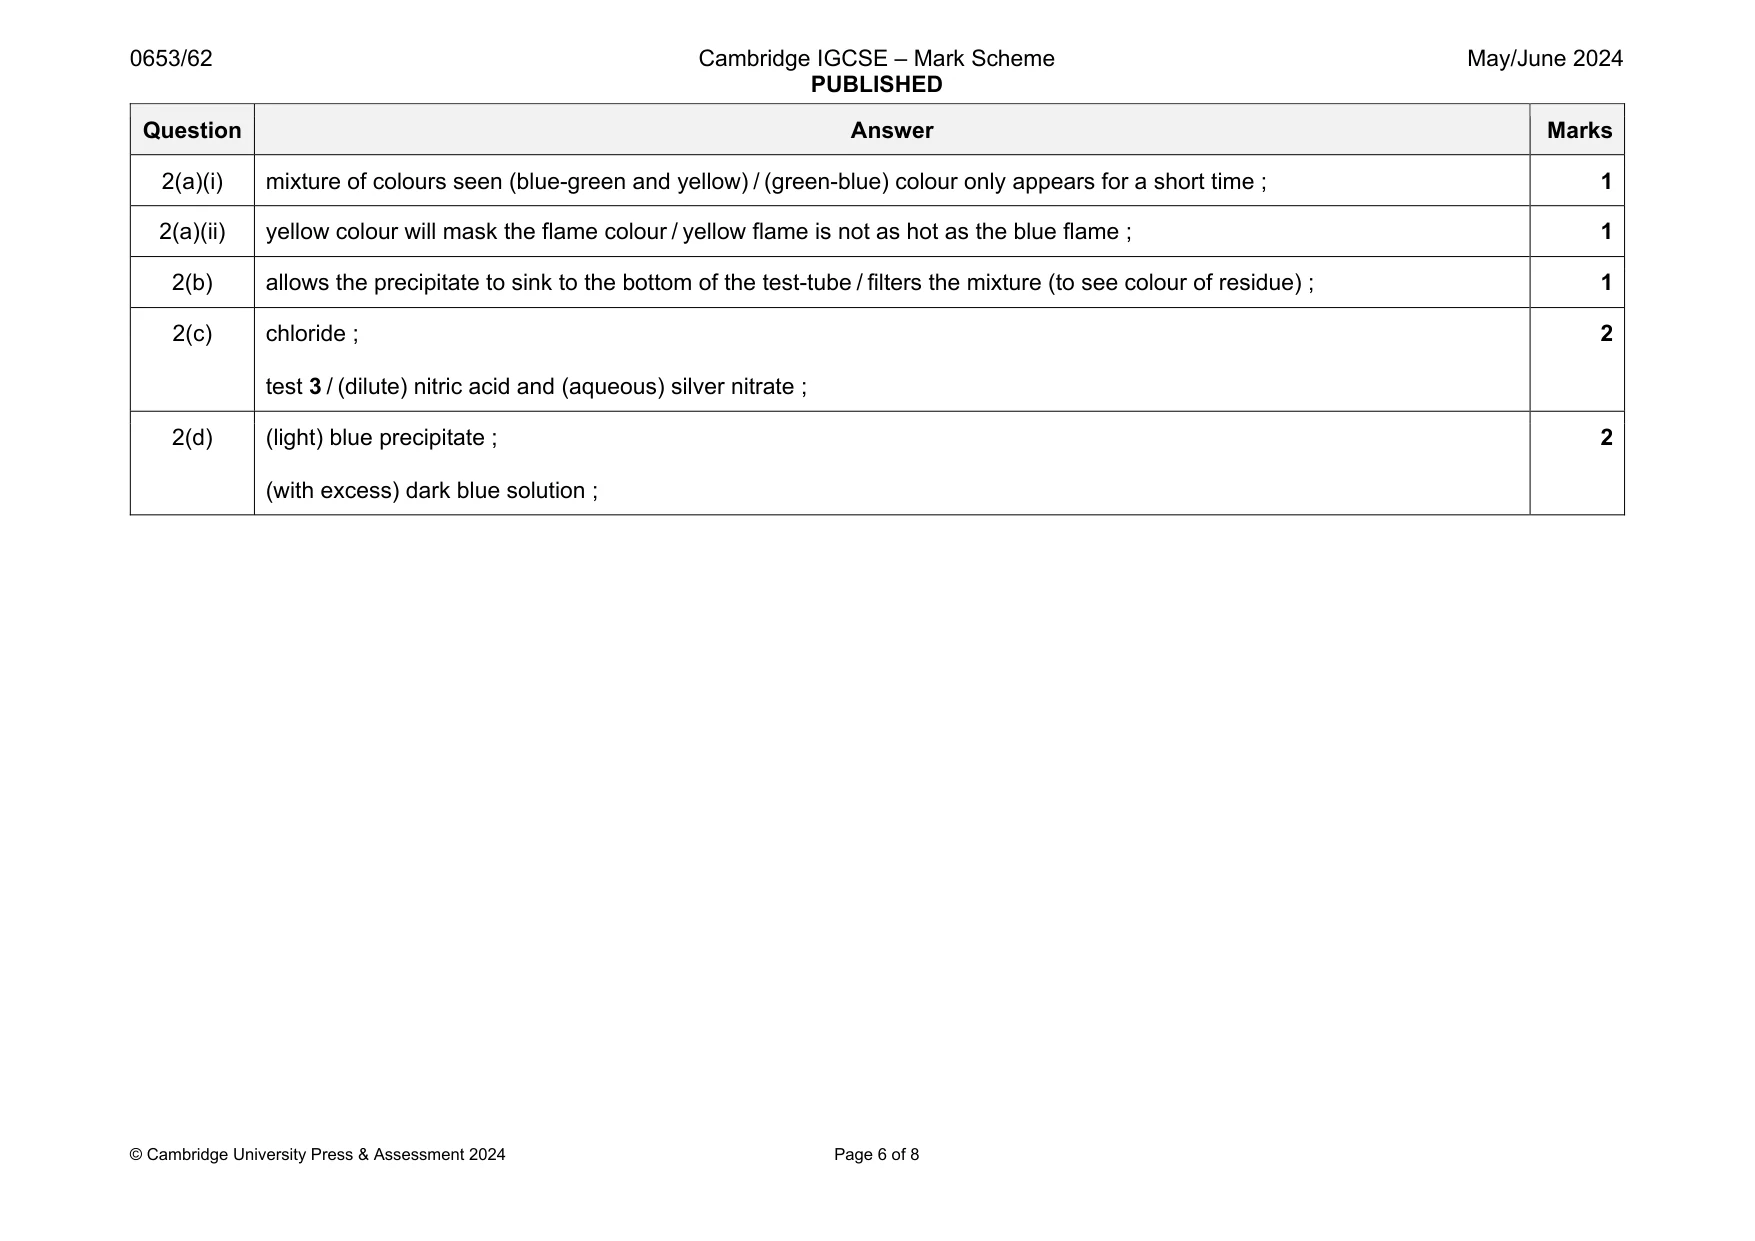
Mark scheme: 2(a)(i) mixture of colours seen (blue-green and yellow) / (green-blue) colour only appears for a short time ; 1 2(a)(ii) yellow colour will mask the flame colour / yellow flame is not as hot as the blue flame ; 1 2(b) allows the precipitate to sink to the bottom of the test-tube / filters the mixture (to see colour of residue) ; 1 2(c) chloride ; test 3 / (dilute) nitric acid and (aqueous) silver nitrate ; 2 2(d) (light) blue precipitate ; (with excess) dark blue solution ; 2
Q3 · When an aqueous salt solution is left in an open container, the mass of the solution…
3 When an aqueous salt solution is left in an open container, the mass of the solution decreases. This is because some of the water evaporates. Plan an investigation to determine the relationship between the concentration of salt solution and the rate of evaporation of water from the salt solution. You are provided with: • distilled water • solid salt. You may use any other common laboratory apparatus in your plan. In your plan, include: • the apparatus you will use • a brief description of the method • what you will measure • which variables you will keep constant • how you will process your results to draw a conclusion. You may include a labelled diagram if you wish. You may include a table that can be used to record the results if you wish. You do not need to include any results in the table. ................................................................................................................................................... ................................................................................................................................................... ................................................................................................................................................... ................................................................................................................................................... ................................................................................................................................................... ................................................................................................................................................... ................................................................................................................................................... ................................................................................................................................................... ................................................................................................................................................... ................................................................................................................................................... ................................................................................................................................................... ................................................................................................................................................... ................................................................................................................................................... ............................................................................................................................................. [7]
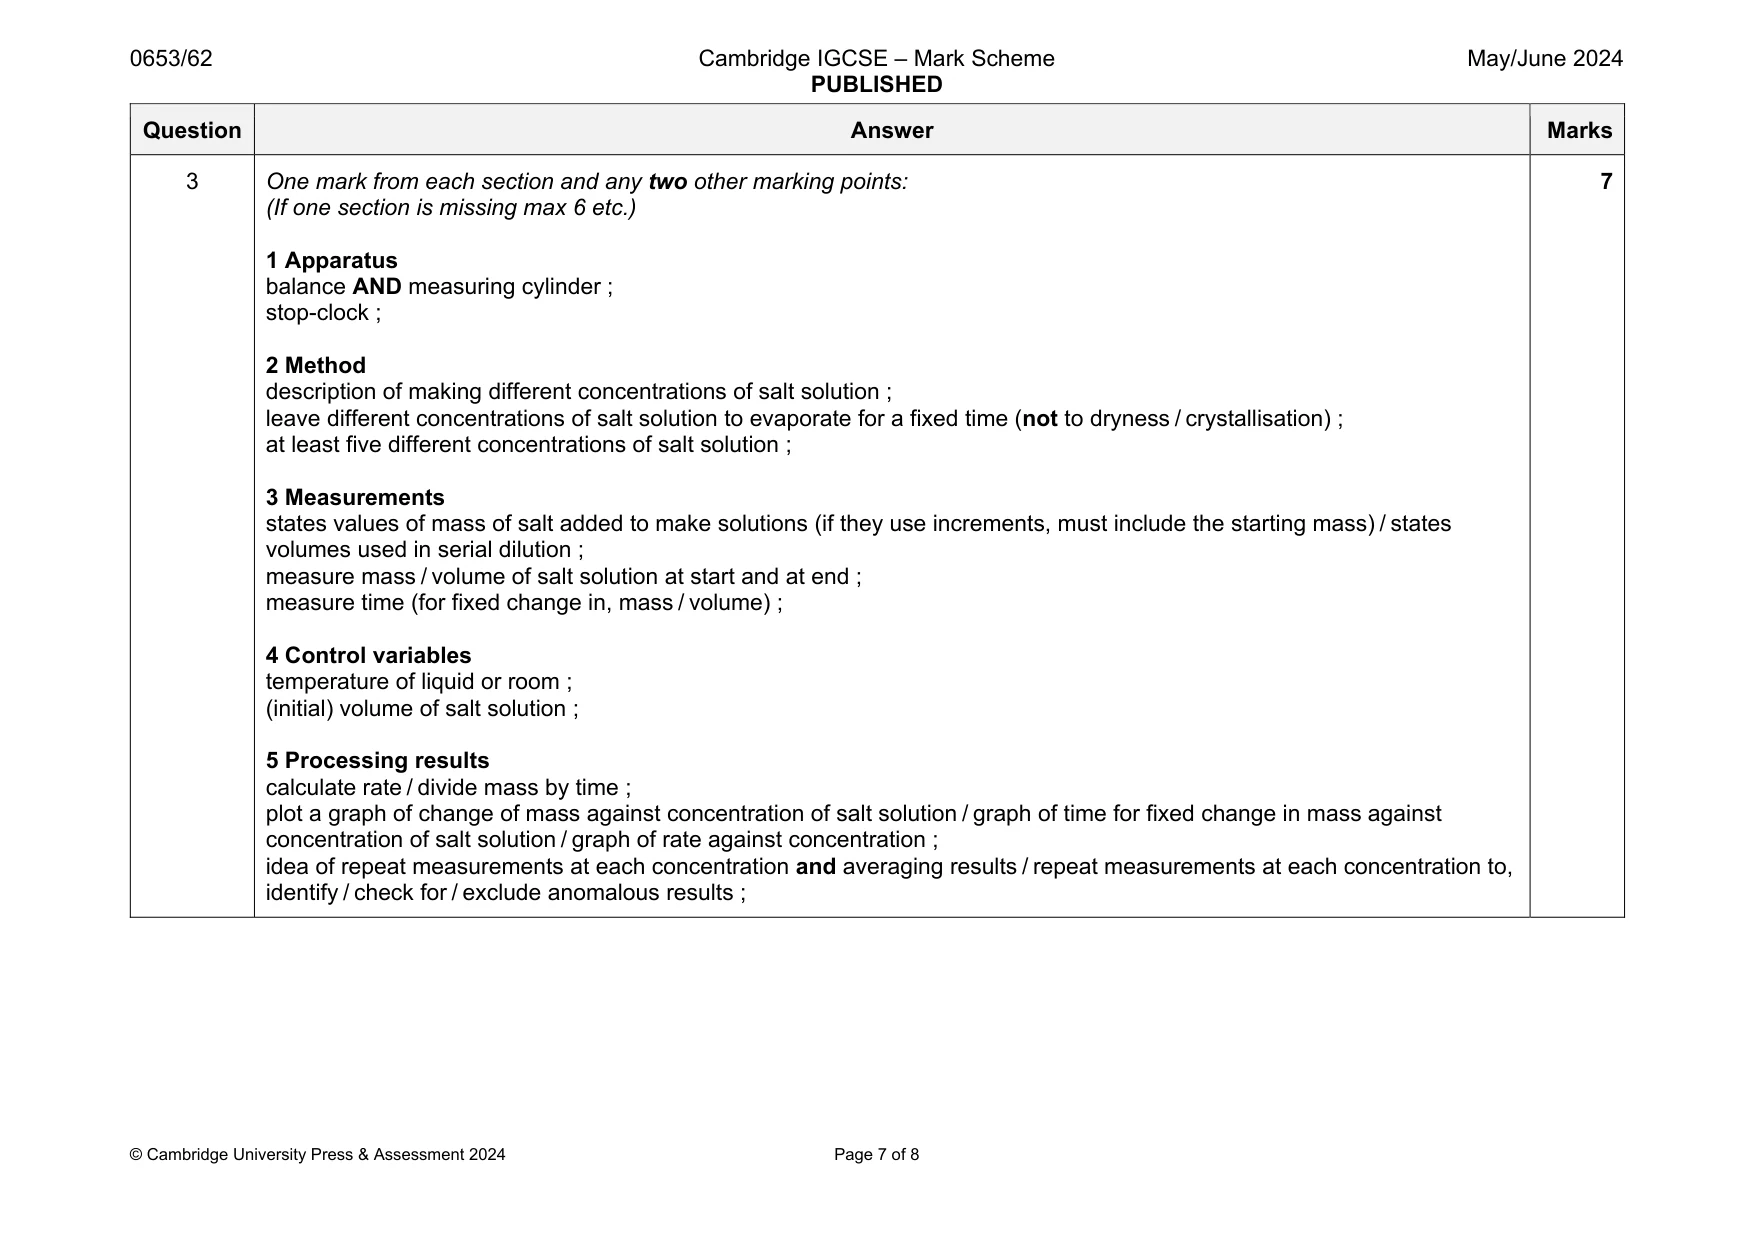
Mark scheme: 3 One mark from each section and any two other marking points: (If one section is missing max 6 etc.) 1 Apparatus balance AND measuring cylinder ; stop-clock ; 2 Method description of making different concentrations of salt solution ; leave different concentrations of salt solution to evaporate for a fixed time (not to dryness / crystallisation) ; at least five different concentrations of salt solution ; 3 Measurements states values of mass of salt added to make solutions (if they use increments, must include the starting mass) / states volumes used in serial dilution ; measure mass / volume of salt solution at start and at end ; measure time (for fixed change in, mass / volume) ; 4 Control variables temperature of liquid or room ; (initial) volume of salt solution ; 5 Processing results calculate rate / divide mass by time ; plot a graph of change of mass against concentration of salt solution / graph of time for fixed change in mass against concentration of salt solution / graph of rate against concentration ; idea of repeat measurements at each concentration and averaging results / repeat measurements at each concentration to, identify / check for / exclude anomalous results ; 7
Q4 · A student compares the rate at which hot water cools in a beaker with and without a lid
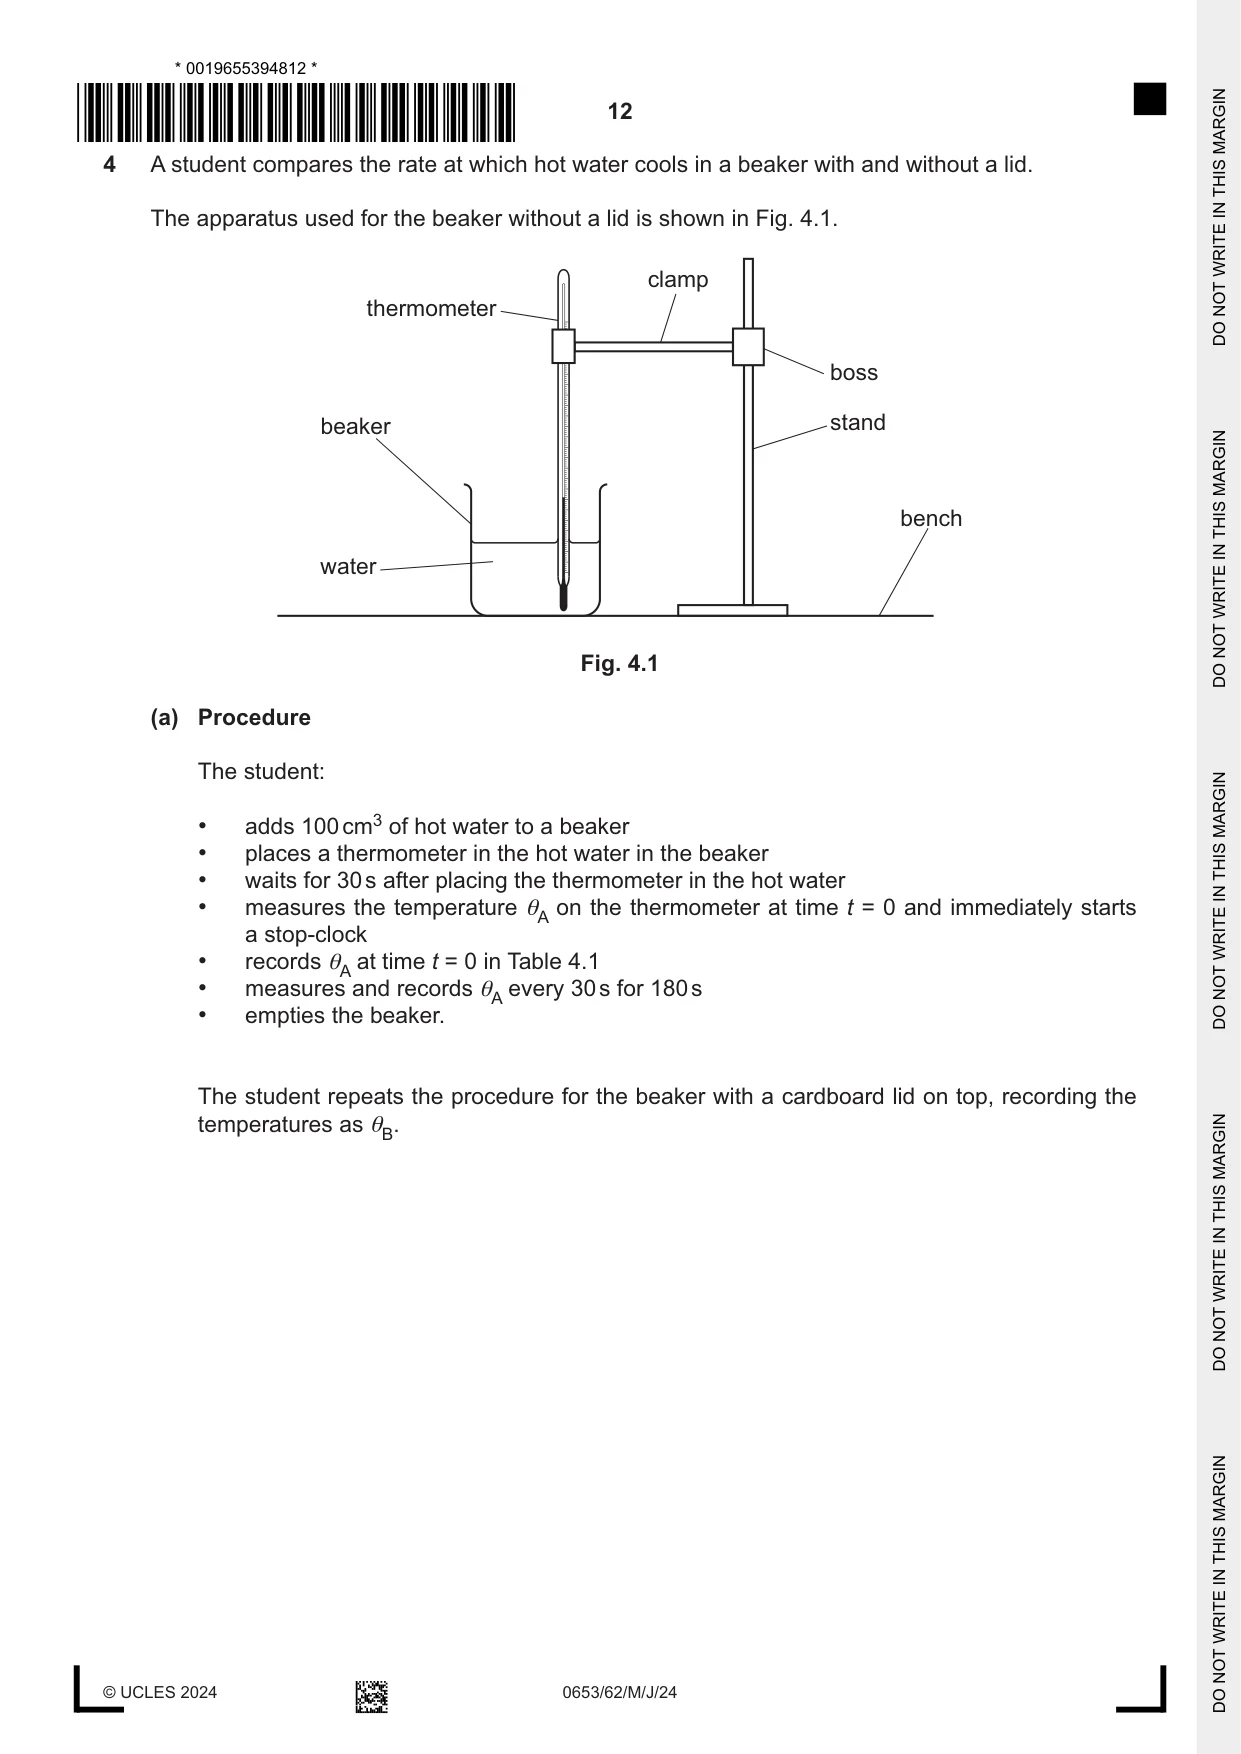
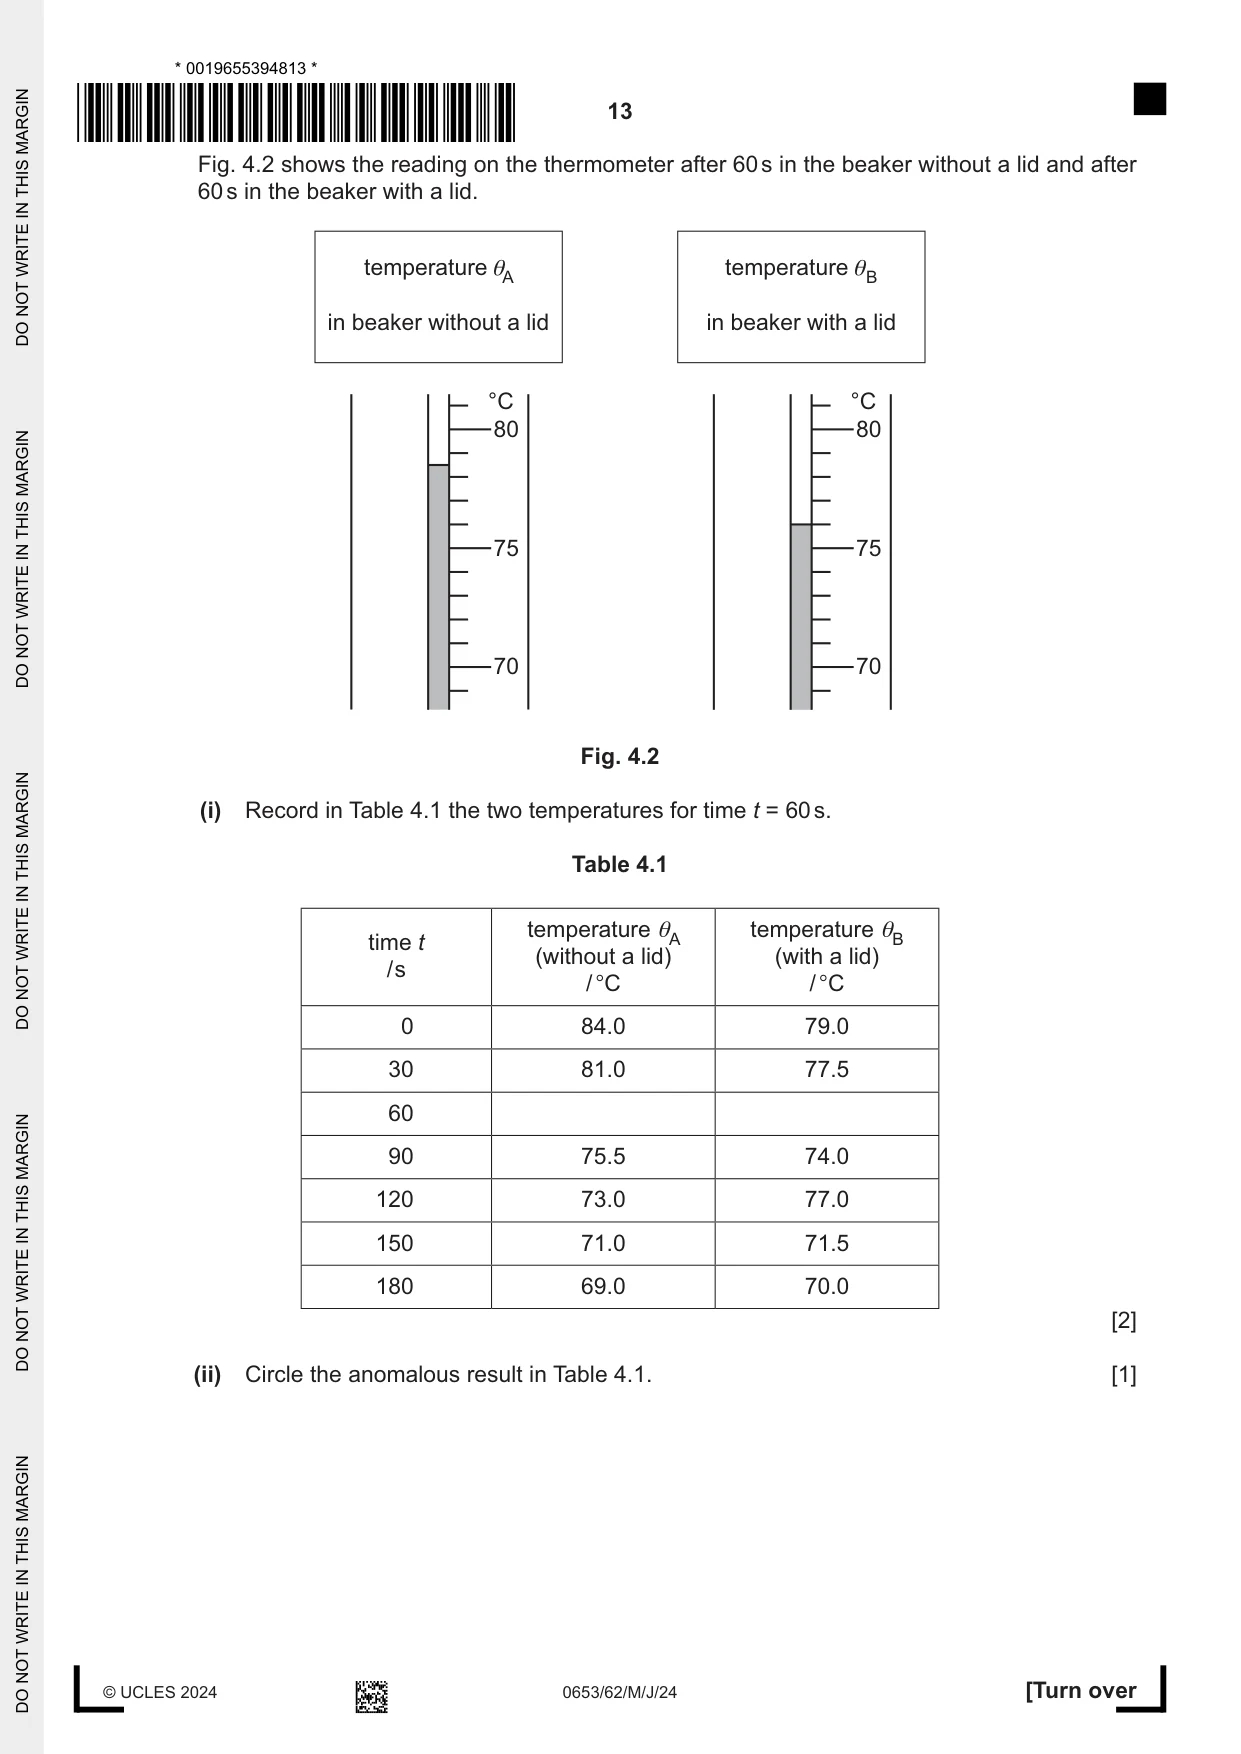
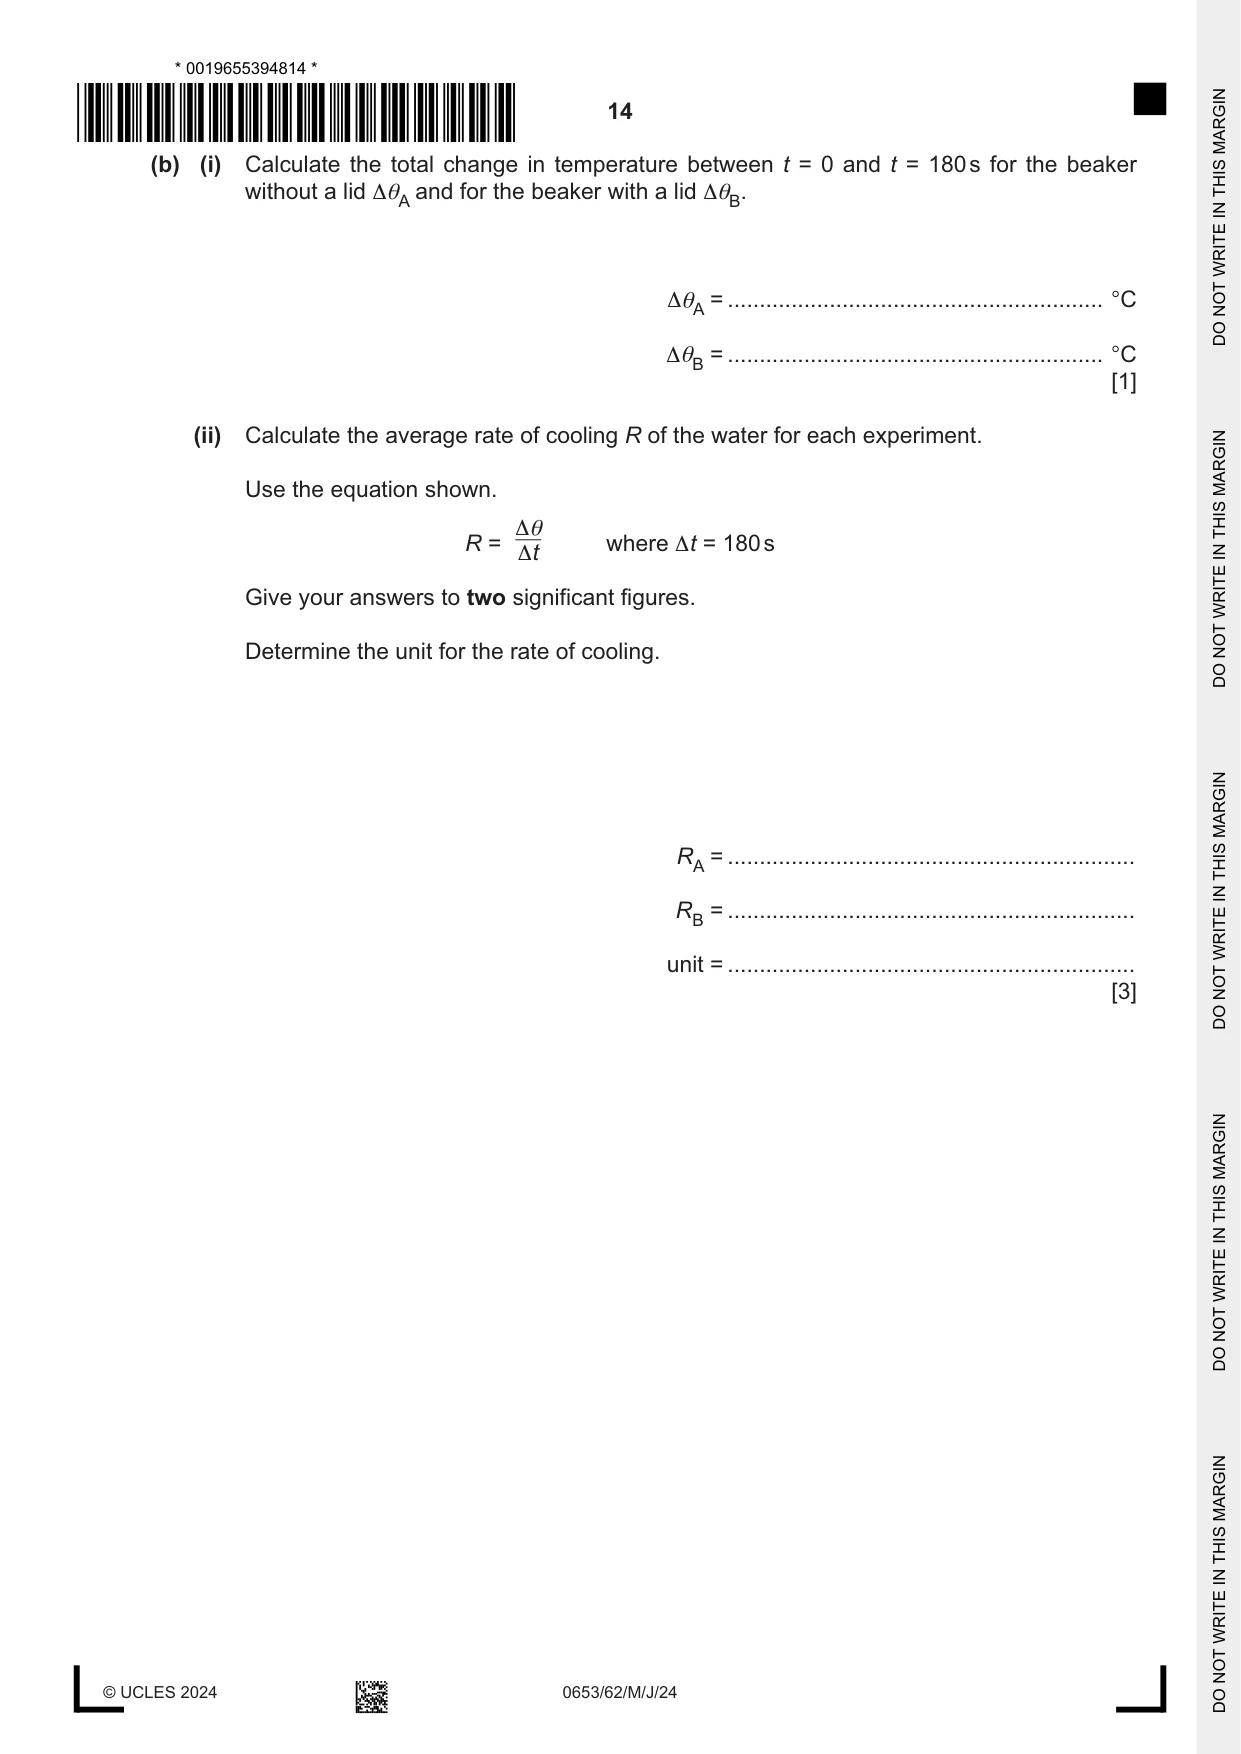
4 A student compares the rate at which hot water cools in a beaker with and without a lid. The apparatus used for the beaker without a lid is shown in Fig. 4.1. clamp thermometer boss beaker stand bench water Fig. 4.1 (a) Procedure The student: • adds 100 cm3 of hot water to a beaker • places a thermometer in the hot water in the beaker • waits for 30 s after placing the thermometer in the hot water • measures the temperature θA on the thermometer at time t = 0 and immediately starts a stop-clock • records θA at time t = 0 in Table 4.1 • measures and records θA every 30 s for 180 s • empties the beaker. The student repeats the procedure for the beaker with a cardboard lid on top, recording the temperatures as θB. Fig. 4.2 shows the reading on the thermometer after 60 s in the beaker without a lid and after 60 s in the beaker with a lid. temperature θ temperature θ A B in beaker without a lid in beaker with a lid °C °C 80 80 75 75 70 70 Fig. 4.2 (i) Record in Table 4.1 the two temperatures for time t = 60 s. Table 4.1 temperature θA temperature θB time t (without a lid) (with a lid) / s / °C / °C 0 84.0 79.0 30 81.0 77.5 60 90 75.5 74.0 120 73.0 77.0 150 71.0 71.5 180 69.0 70.0 [2] (ii) Circle the anomalous result in Table 4.1. [1] (b) (i) Calculate the total change in temperature between t = 0 and t = 180 s for the beaker without a lid ∆θA and for the beaker with a lid ∆θB. ∆θA = ........................................................... °C ∆θB = ........................................................... °C [1] (ii) Calculate the average rate of cooling R of the water for each experiment. Use the equation shown. ∆θ R = where ∆ t = 180 s ∆ t Give your answers to two significant figures. Determine the unit for the rate of cooling. RA = ................................................................ RB = ................................................................ unit = ................................................................ [3]
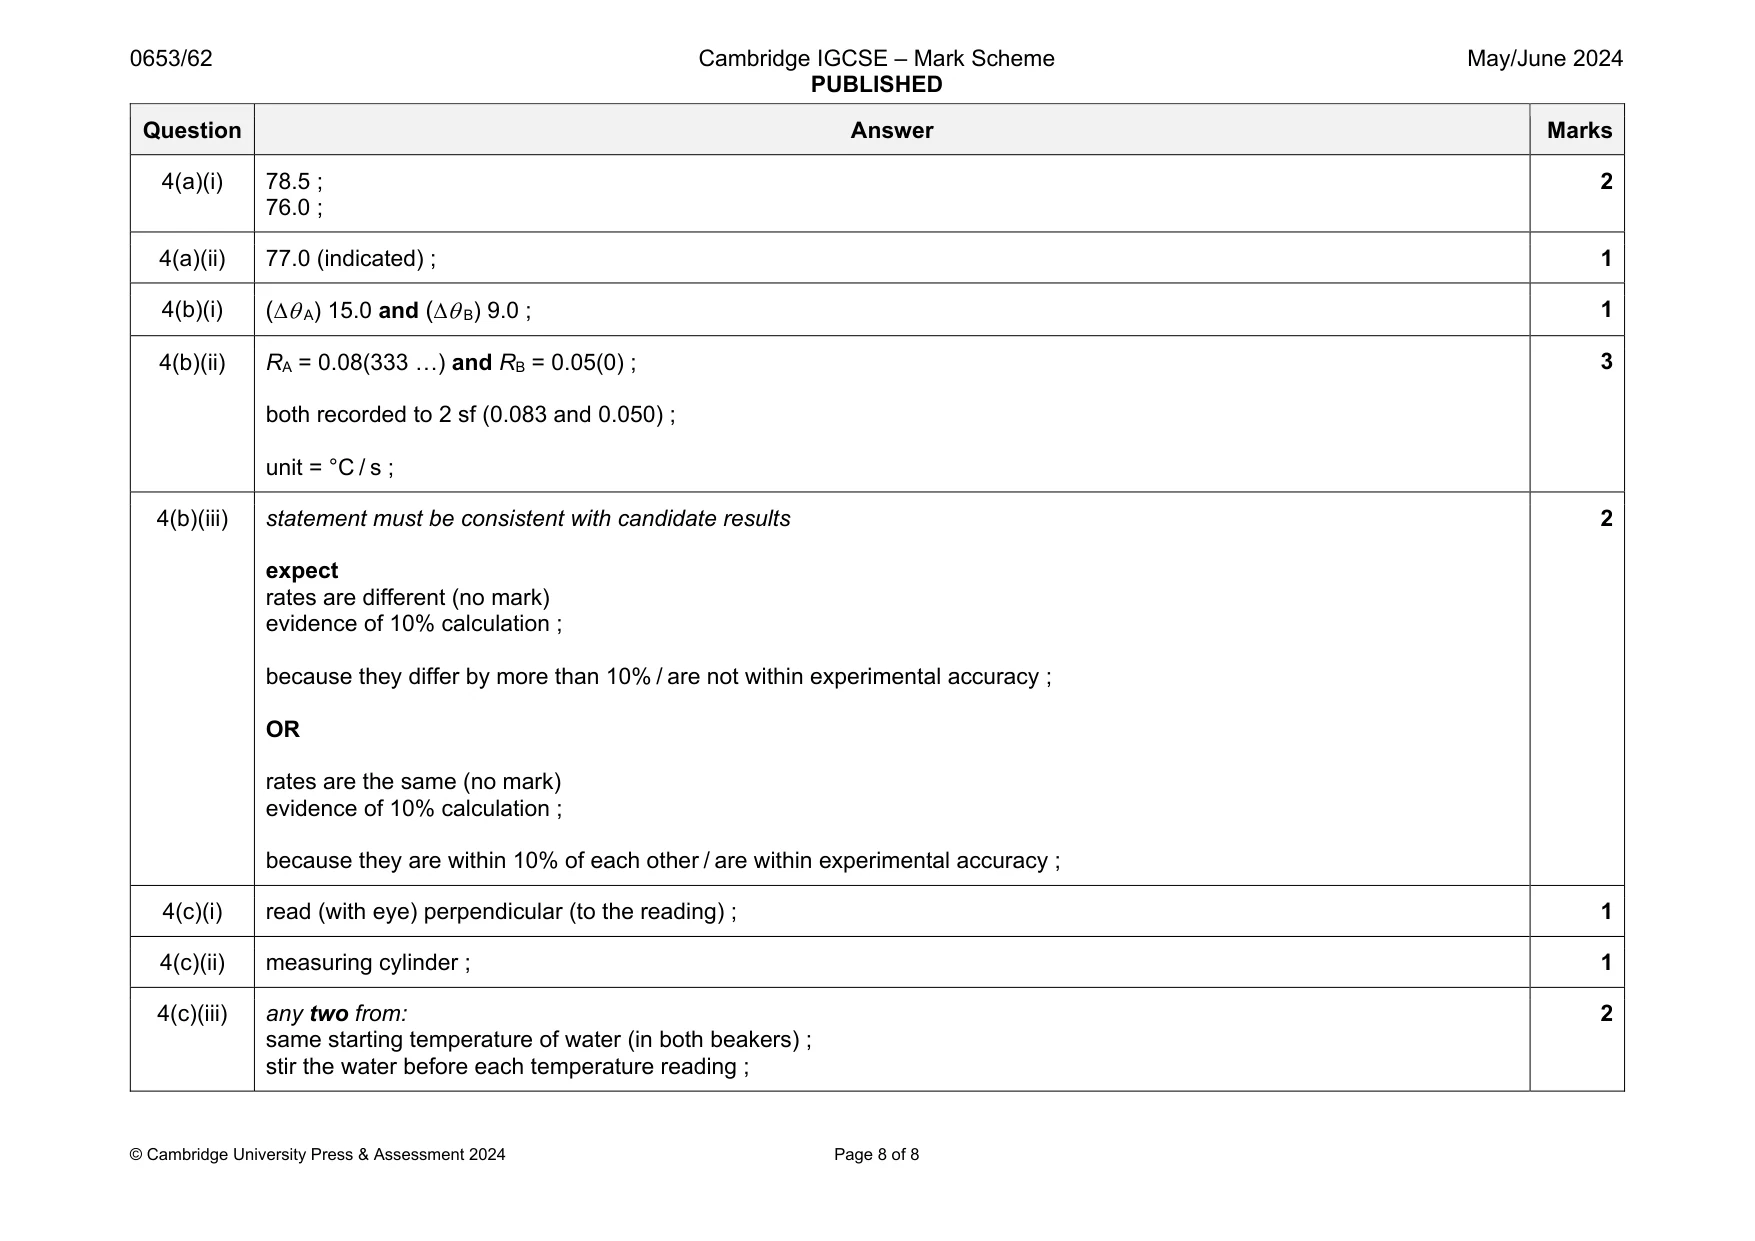
Mark scheme: 4(a)(i) 78.5 ; 76.0 ; 2 4(a)(ii) 77.0 (indicated) ; 1 4(b)(i) ( A) 15.0 and ( B) 9.0 ; 1 4(b)(ii) RA = 0.08(333 …) and RB = 0.05(0) ; both recorded to 2 sf (0.083 and 0.050) ; unit = °C / s ; 3 4(b)(iii) statement must be consistent with candidate results expect rates are different (no mark) evidence of 10% calculation ; because they differ by more than 10% / are not within experimental accuracy ; OR rates are the same (no mark) evidence of 10% calculation ; because they are within 10% of each other / are within experimental accuracy ; 2 4(c)(i) read (with eye) perpendicular (to the reading) ; 1 4(c)(ii) measuring cylinder ; 1 4(c)(iii) any two from: same starting temperature of water (in both beakers) ; stir the water before each temperature reading ; 2
What was in this paper
The subtopics covered by these 4 questions, and how many questions each got. Open one in a new tab to see every Cambridge question on it.
What you needed in this session
Cambridge’s own grade thresholds for 2024 May/June, Paper 6 · Variant 2. A higher threshold means an easier paper — the bar moves with how the cohort did.