Cambridge IGCSE Science - Combined 0653 — 2023 May/June Paper 6 · Variant 1
0653/61/M/J/23 · 4 questions · 40 marks · ≈45 min
The question paper and its mark scheme, free to read here and free to download. This is Cambridge’s own paper, exactly as it was sat.
Question paper16 pages
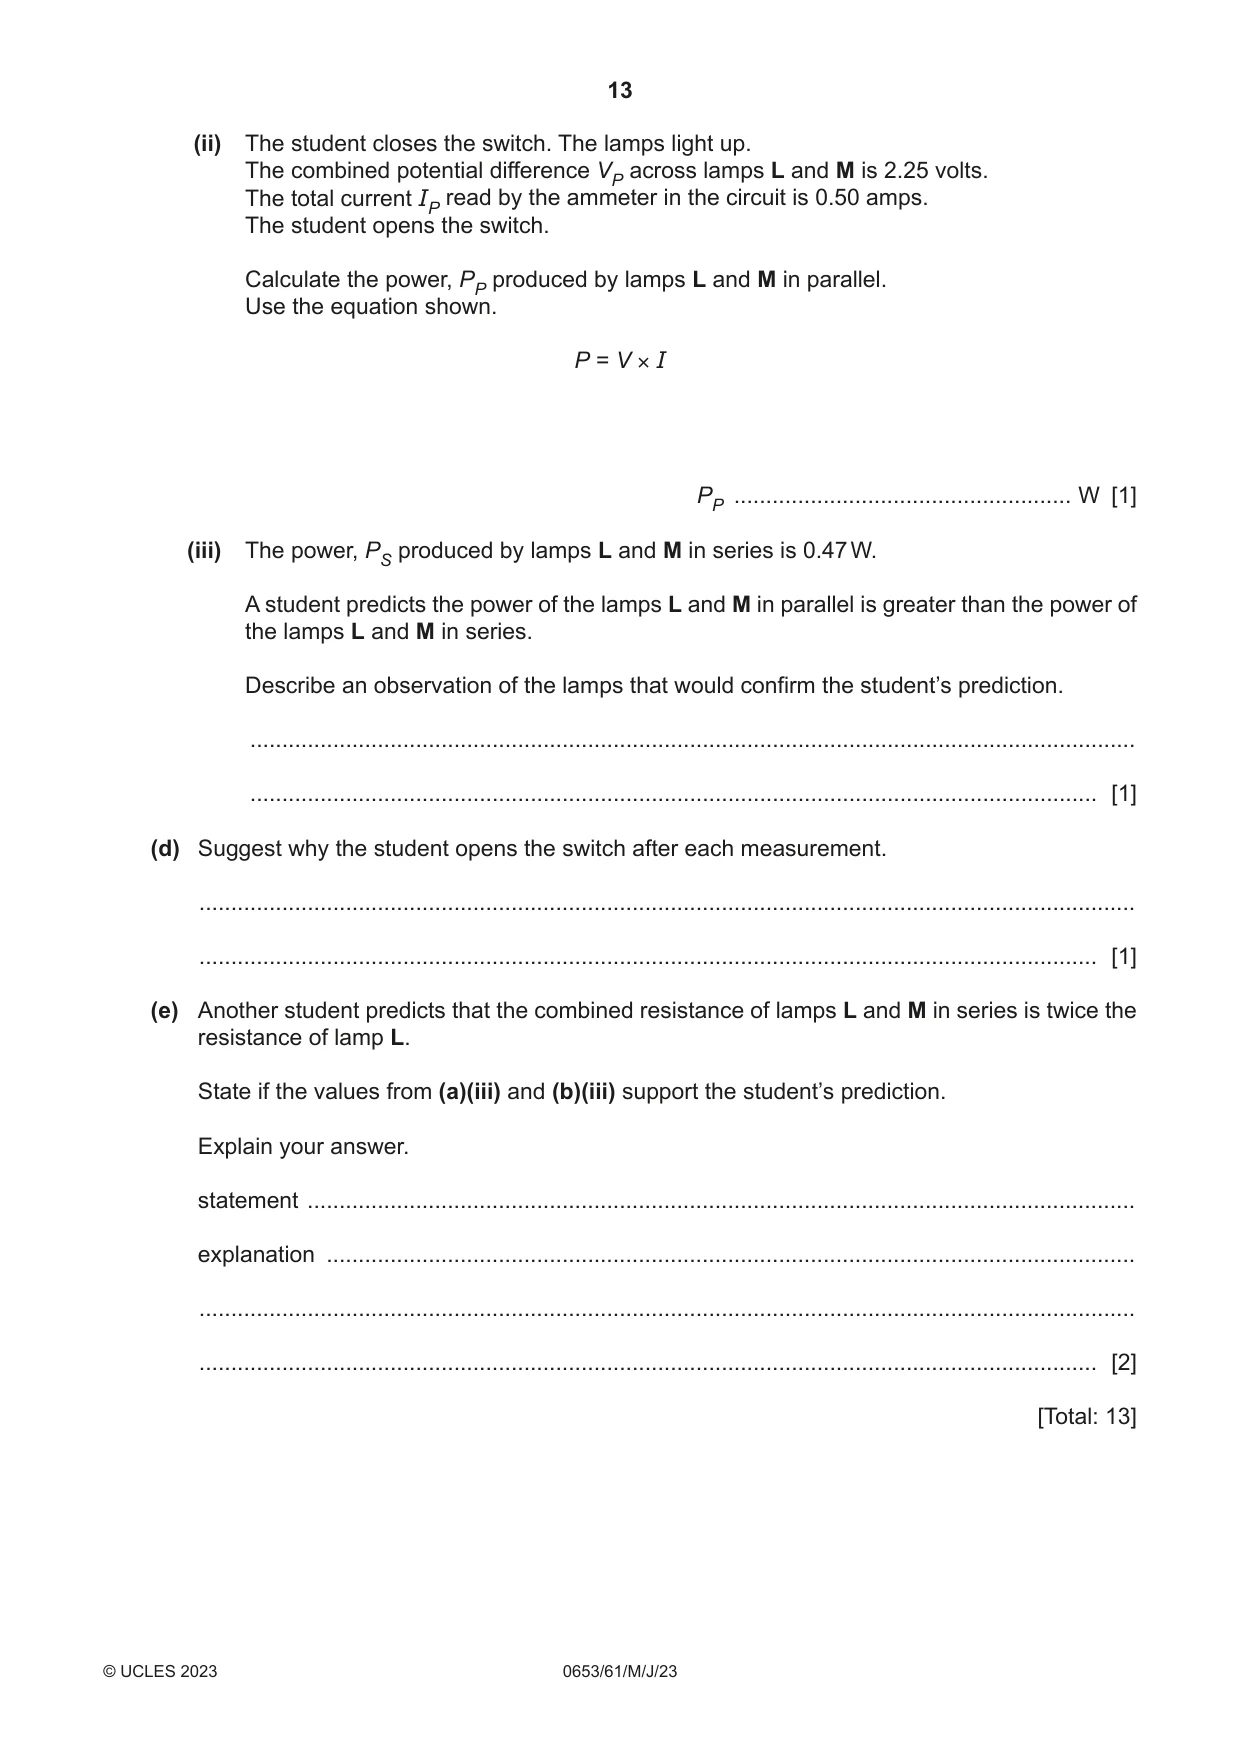


Mark scheme9 pages
Answers below. Sit the paper first if you are practising.
Questions as text
Q1 · A student estimates the concentration of vitamin C in a sample of fruit juice
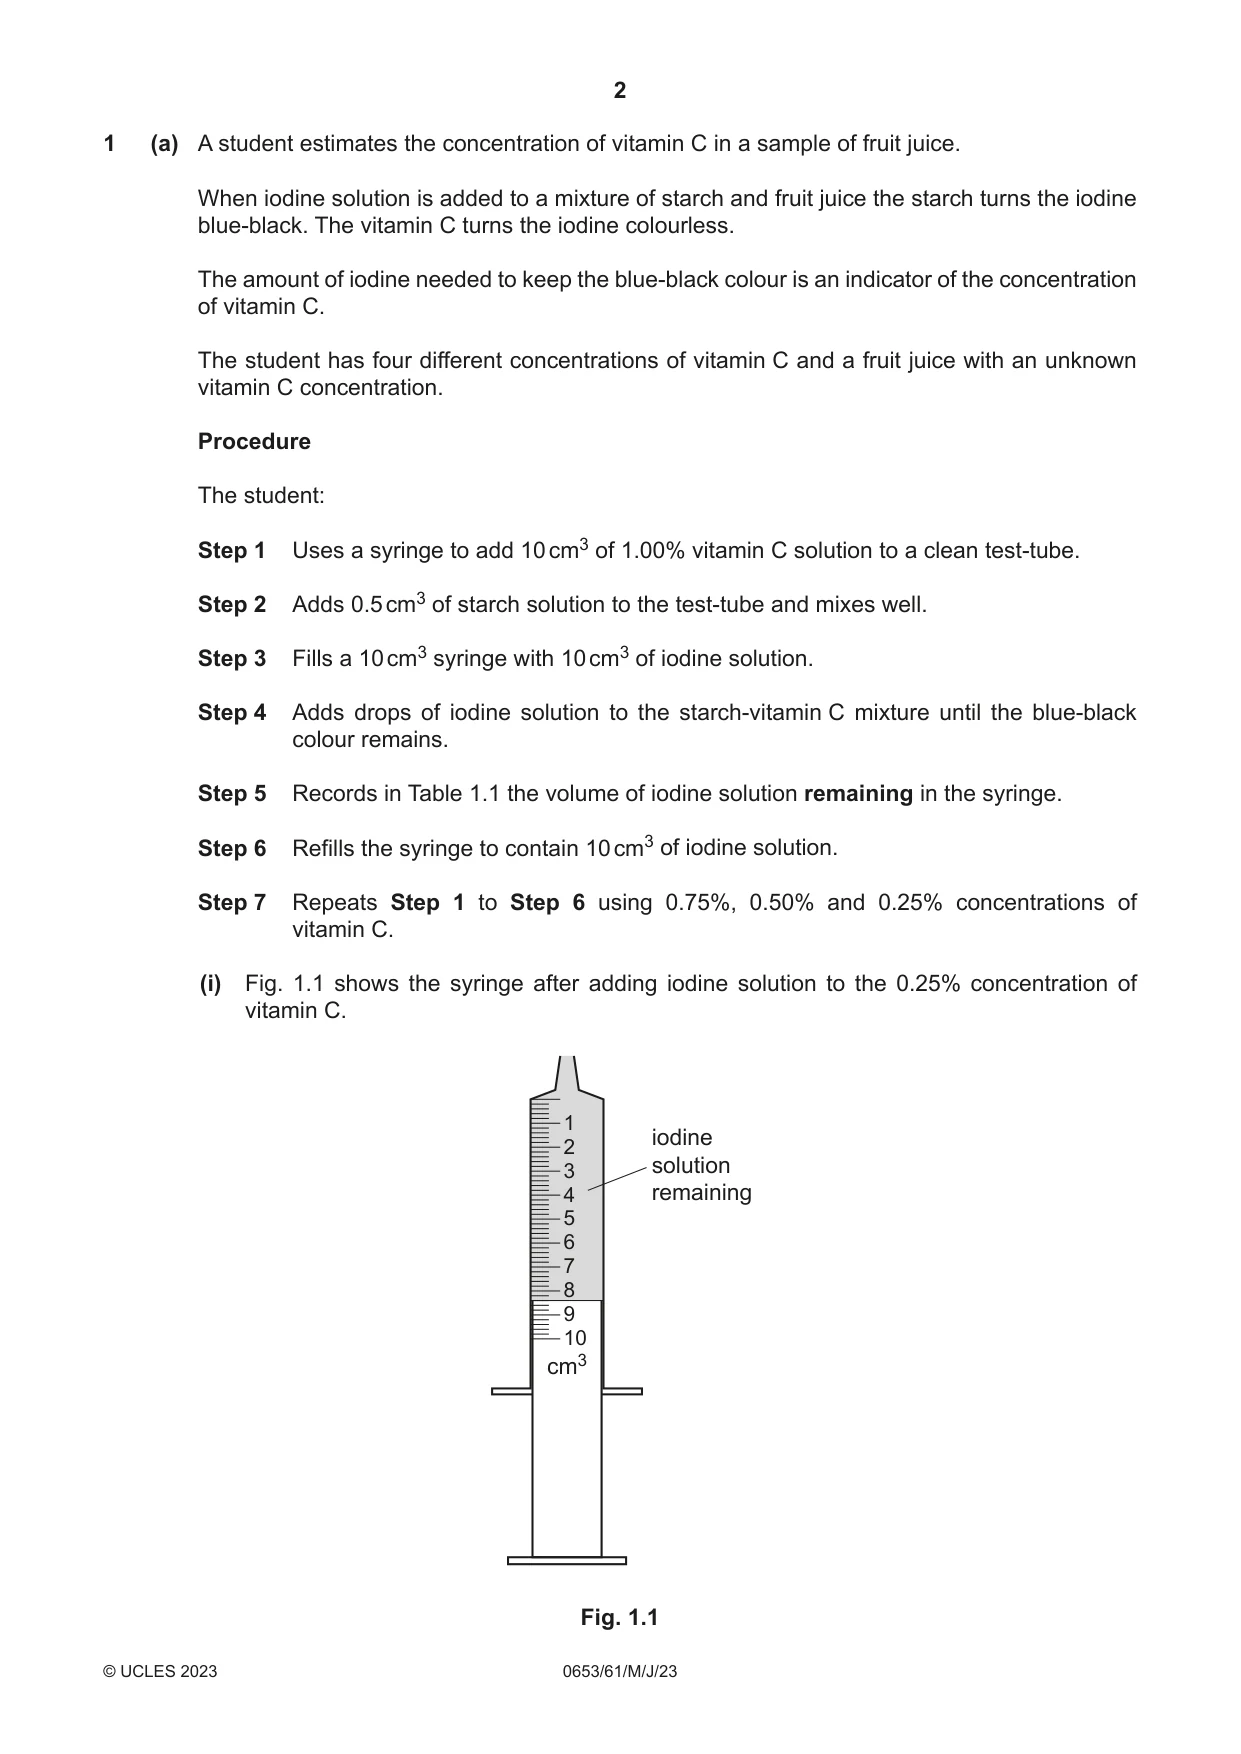
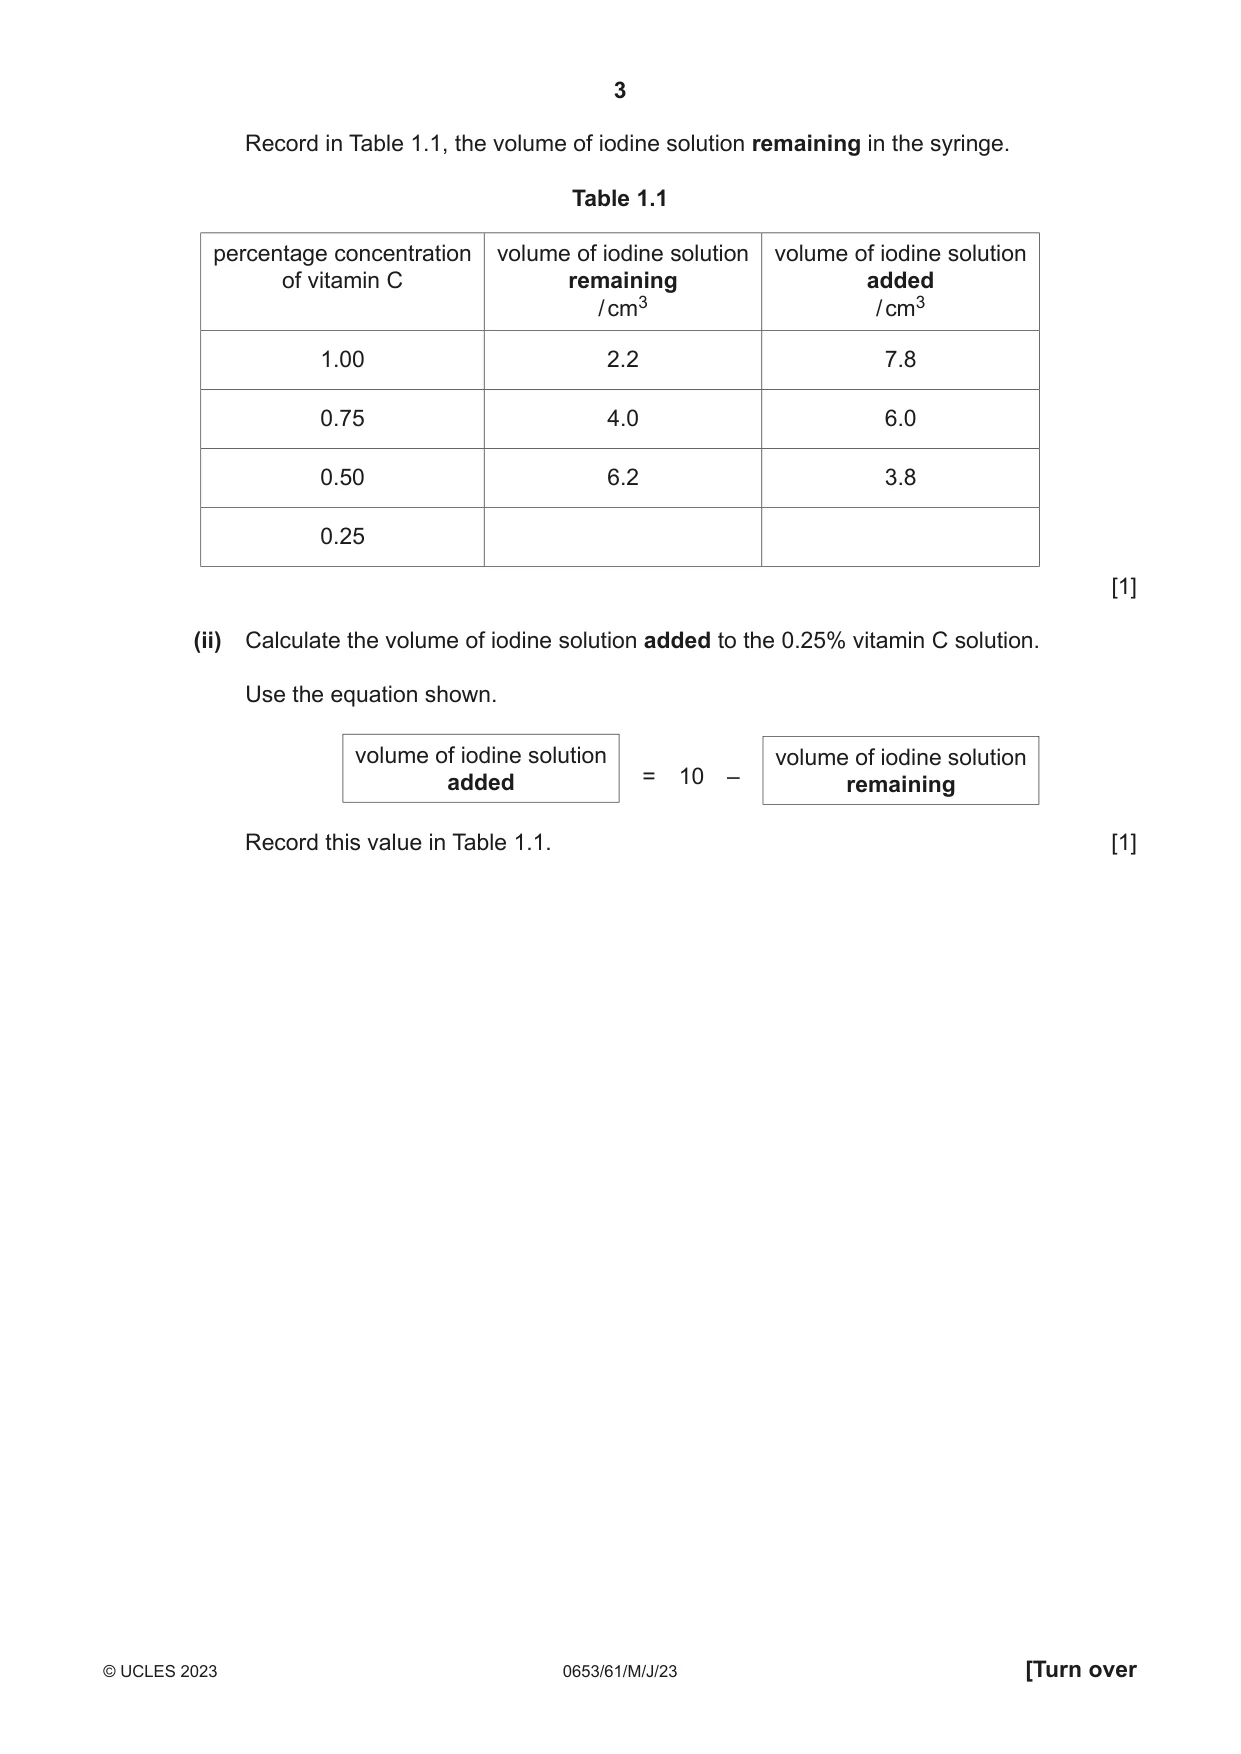
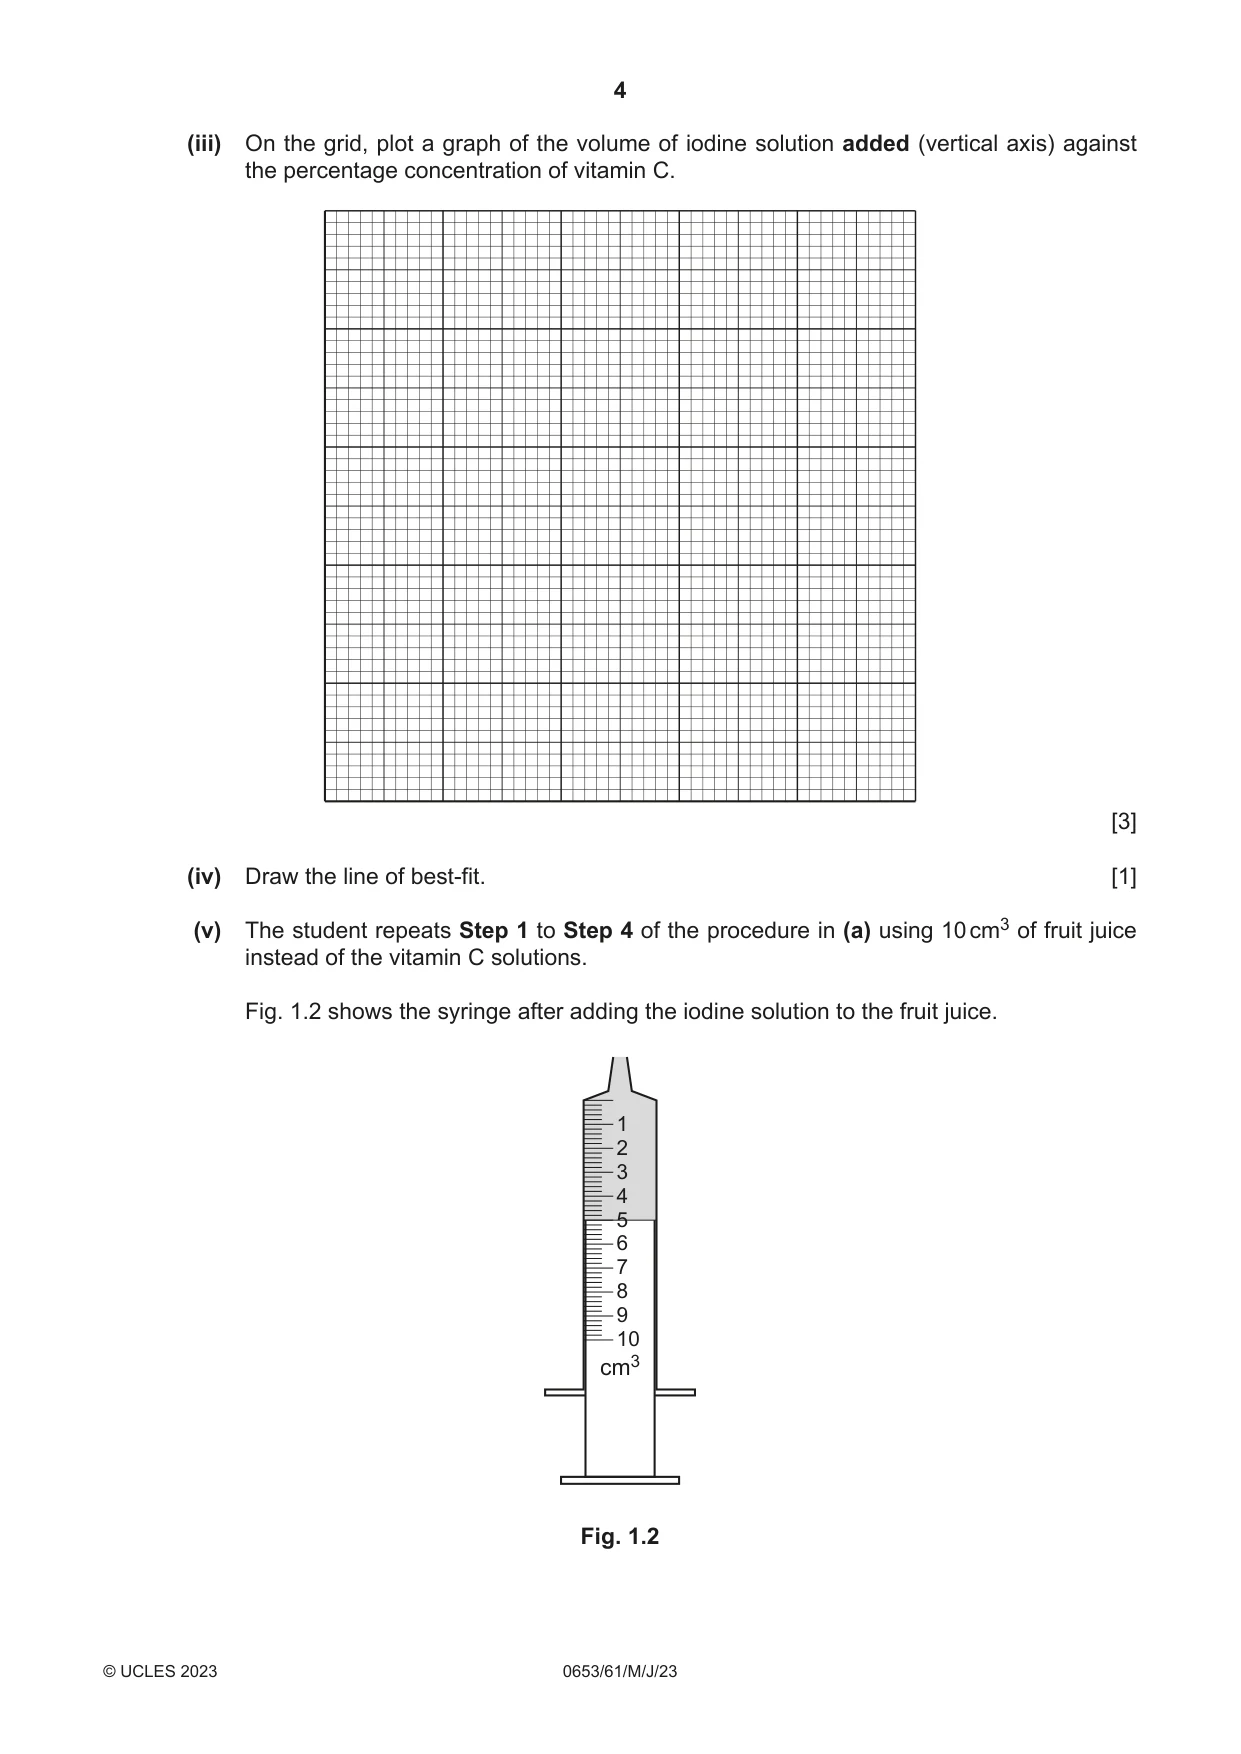
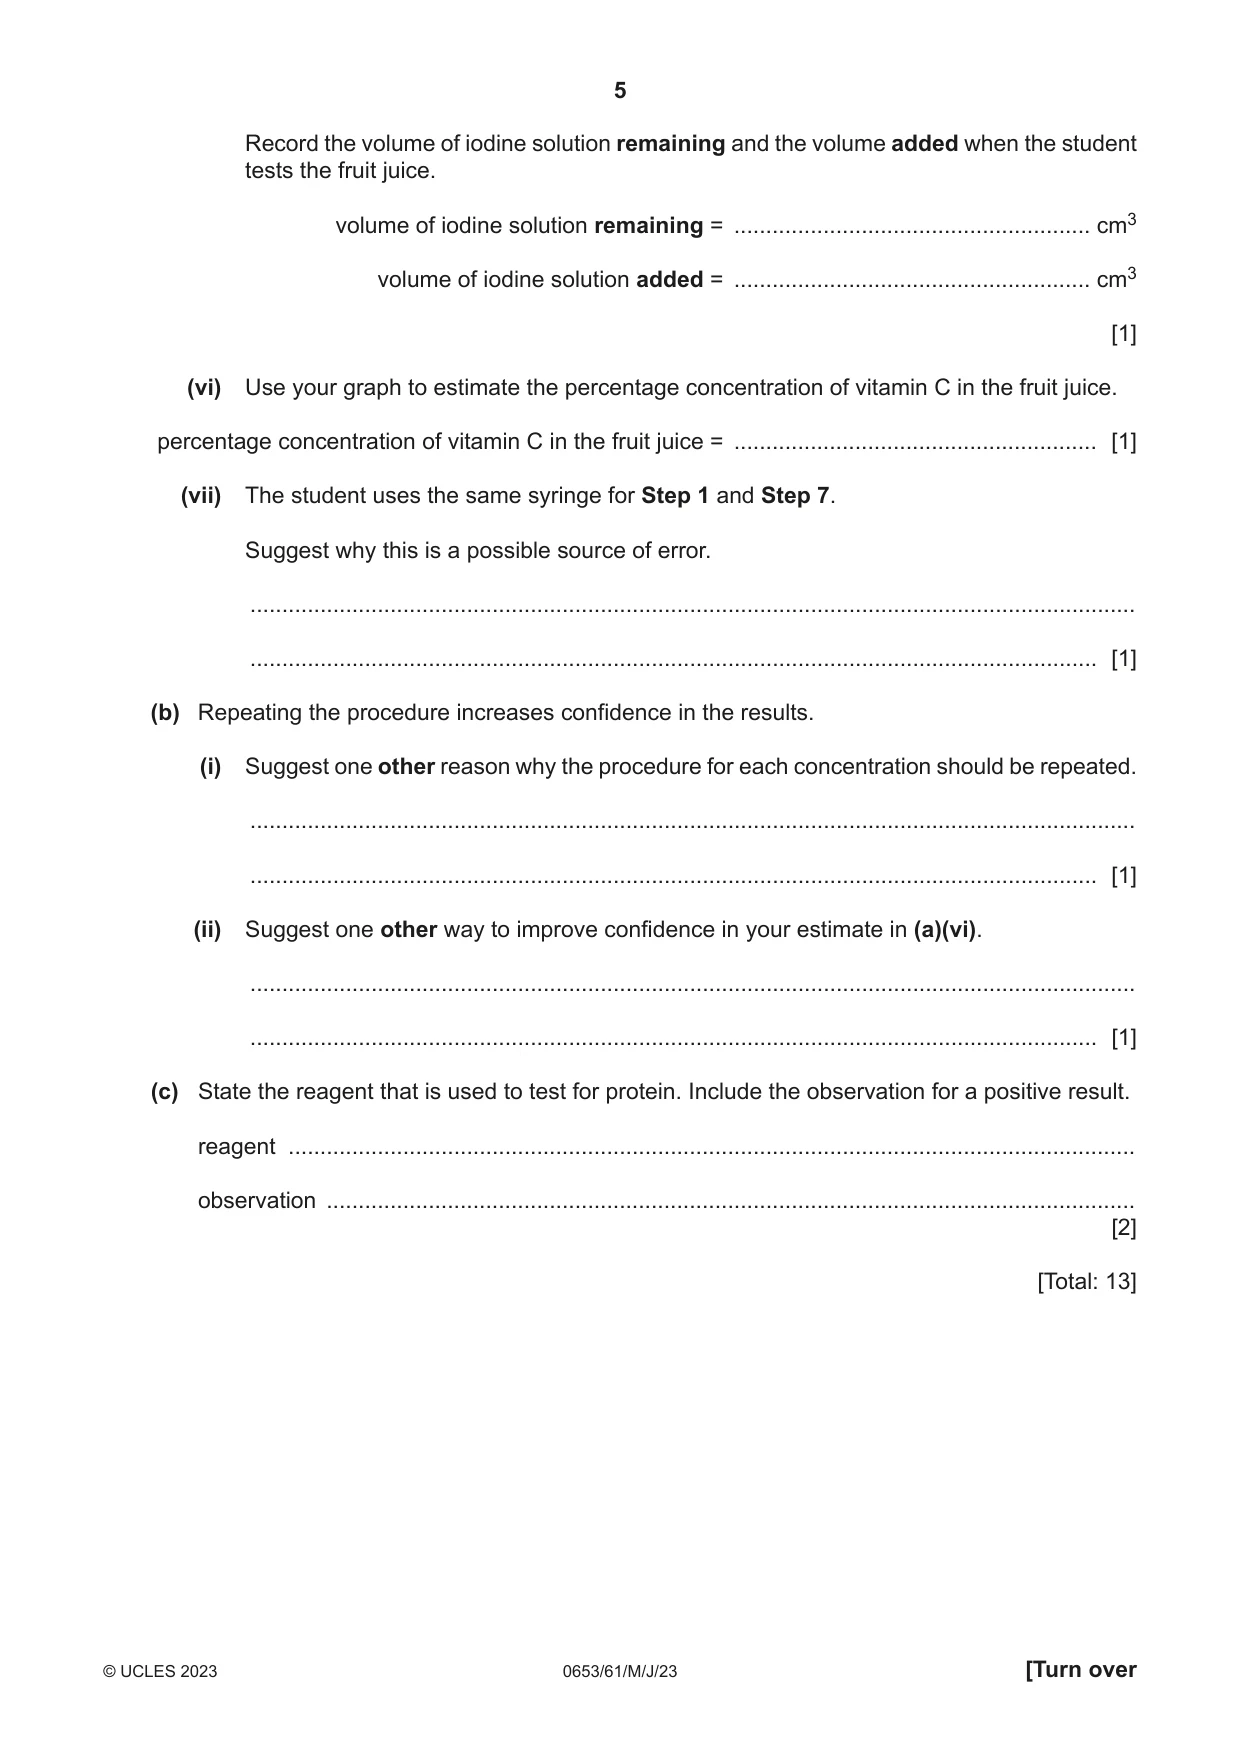
1 (a) A student estimates the concentration of vitamin C in a sample of fruit juice. When iodine solution is added to a mixture of starch and fruit juice the starch turns the iodine blue‑black. The vitamin C turns the iodine colourless. The amount of iodine needed to keep the blue‑black colour is an indicator of the concentration of vitamin C. The student has four different concentrations of vitamin C and a fruit juice with an unknown vitamin C concentration. Procedure The student: Step 1 Uses a syringe to add 10 cm3 of 1.00% vitamin C solution to a clean test‑tube. Step 2 Adds 0.5 cm3 of starch solution to the test‑tube and mixes well. Step 3 Fills a 10 cm3 syringe with 10 cm3 of iodine solution. Step 4 Adds drops of iodine solution to the starch‑vitamin C mixture until the blue‑black colour remains. Step 5 Records in Table 1.1 the volume of iodine solution remaining in the syringe. Step 6 Refills the syringe to contain 10 cm3 of iodine solution. Step 7 Repeats Step 1 to Step 6 using 0.75%, 0.50% and 0.25% concentrations of vitamin C. (i) Fig. 1.1 shows the syringe after adding iodine solution to the 0.25% concentration of vitamin C. 1 iodine 2 3 solution 4 remaining 5 6 7 8 9 10 cm3 Fig. 1.1 Record in Table 1.1, the volume of iodine solution remaining in the syringe. Table 1.1 percentage concentration volume of iodine solution volume of iodine solution of vitamin C remaining added / cm3 / cm3 1.00 2.2 7.8 0.75 4.0 6.0 0.50 6.2 3.8 0.25 [1] (ii) Calculate the volume of iodine solution added to the 0.25% vitamin C solution. Use the equation shown. volume of iodine solution volume of iodine solution added = 10 – remaining Record this value in Table 1.1. [1] (iii) On the grid, plot a graph of the volume of iodine solution added (vertical axis) against the percentage concentration of vitamin C. [3] (iv) Draw the line of best‑fit. [1] (v) The student repeats Step 1 to Step 4 of the procedure in (a) using 10 cm3 of fruit juice instead of the vitamin C solutions. Fig. 1.2 shows the syringe after adding the iodine solution to the fruit juice. 1 2 3 4 5 6 7 8 9 10 cm3 Fig. 1.2 Record the volume of iodine solution remaining and the volume added when the student tests the fruit juice. volume of iodine solution remaining = ........................................................ cm3 volume of iodine solution added = ........................................................ cm3 [1] (vi) Use your graph to estimate the percentage concentration of vitamin C in the fruit juice. percentage concentration of vitamin C in the fruit juice = ......................................................... [1] (vii) The student uses the same syringe for Step 1 and Step 7. Suggest why this is a possible source of error. ........................................................................................................................................... ..................................................................................................................................... [1] (b) Repeating the procedure increases confidence in the results. (i) Suggest one other reason why the procedure for each concentration should be repeated. ........................................................................................................................................... ..................................................................................................................................... [1] (ii) Suggest one other way to improve confidence in your estimate in (a)(vi). ........................................................................................................................................... ..................................................................................................................................... [1] (c) State the reagent that is used to test for protein. Include the observation for a positive result. reagent ..................................................................................................................................... observation ............................................................................................................................... [2] [Total: 13]
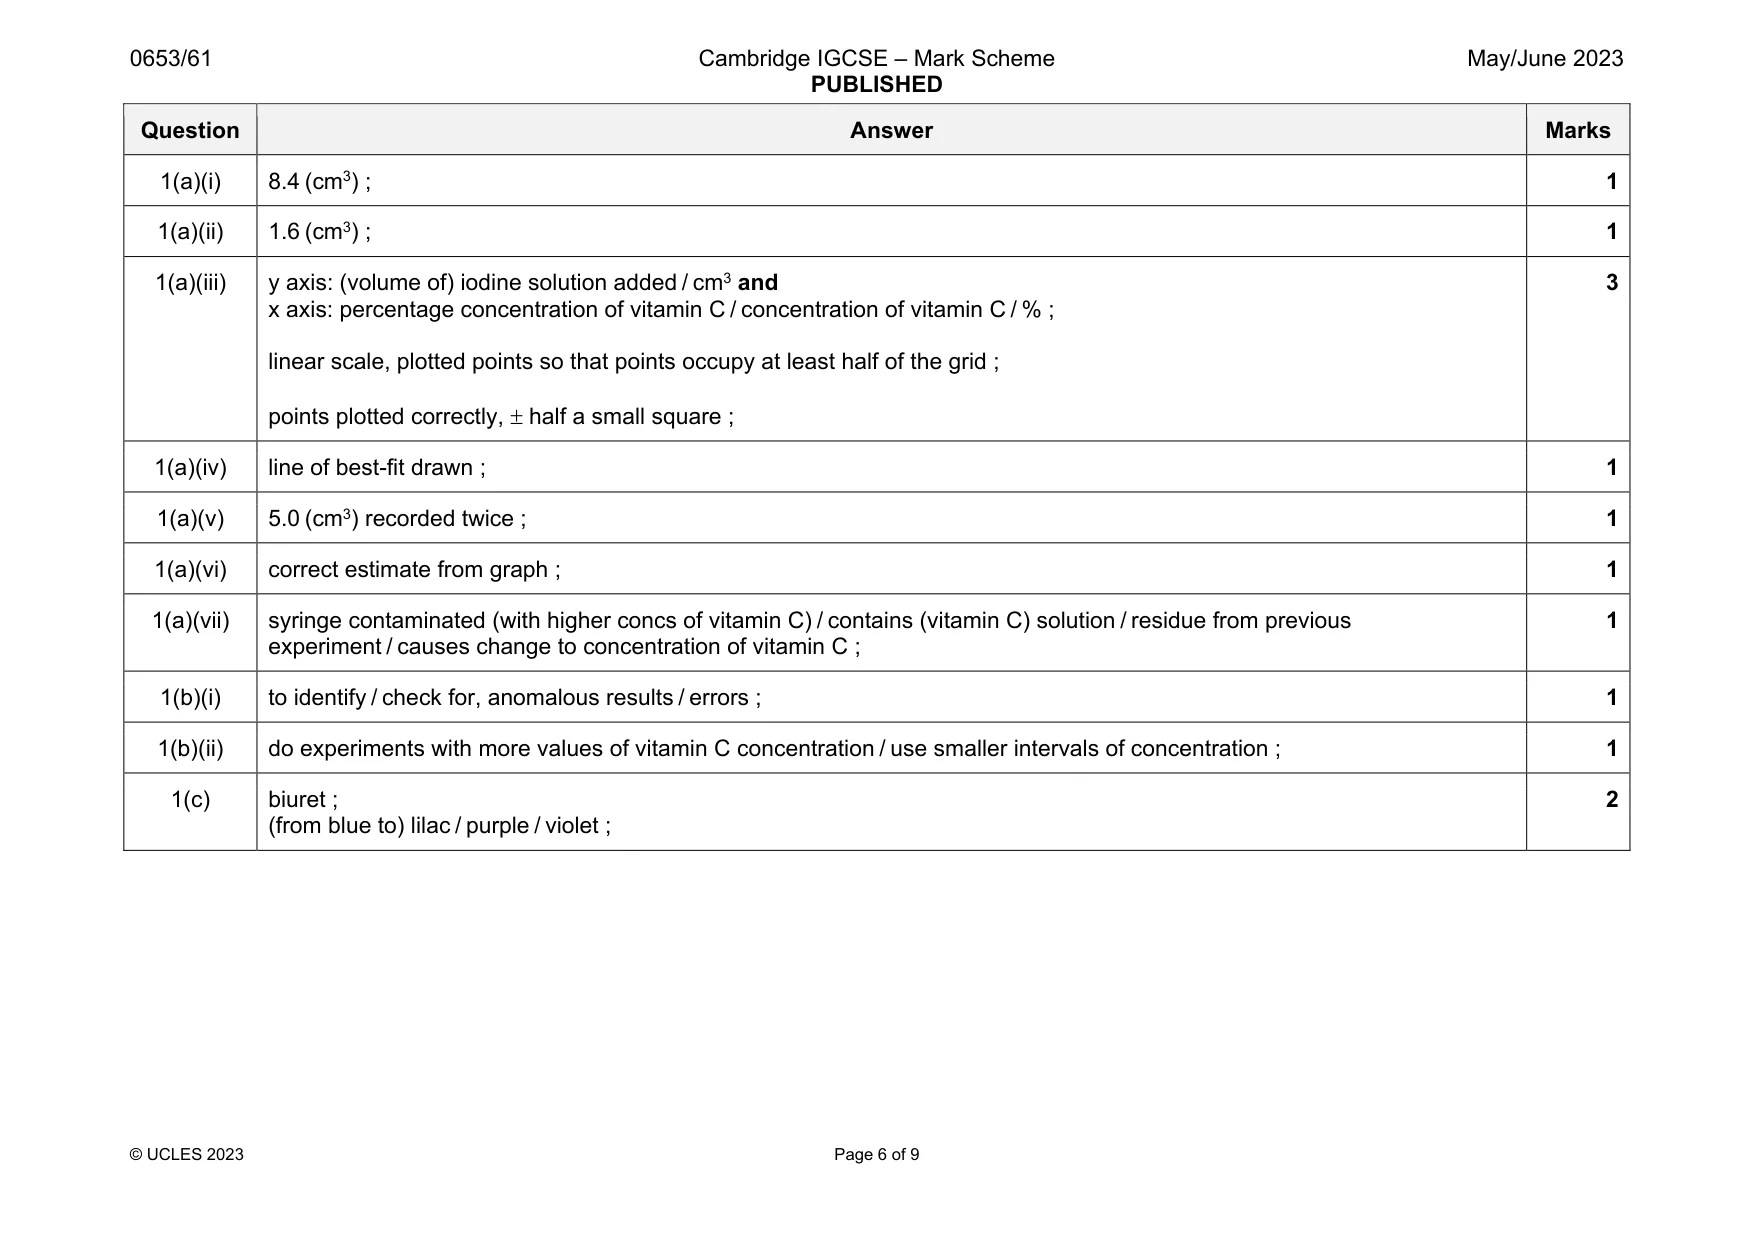
Mark scheme: 1(a)(i) 8.4 (cm3) ; 1 1(a)(ii) 1.6 (cm3) ; 1 1(a)(iii) y axis: (volume of) iodine solution added / cm3 and x axis: percentage concentration of vitamin C / concentration of vitamin C / % ; linear scale, plotted points so that points occupy at least half of the grid ; points plotted correctly, half a small square ; 3 1(a)(iv) line of best-fit drawn ; 1 1(a)(v) 5.0 (cm3) recorded twice ; 1 1(a)(vi) correct estimate from graph ; 1 1(a)(vii) syringe contaminated (with higher concs of vitamin C) / contains (vitamin C) solution / residue from previous experiment / causes change to concentration of vitamin C ; 1 1(b)(i) to identify / check for, anomalous results / errors ; 1 1(b)(ii) do experiments with more values of vitamin C concentration / use smaller intervals of concentration ; 1 1(c) biuret ; (from blue to) lilac / purple / violet ; 2
Q2 · A student investigates the components of a fertiliser
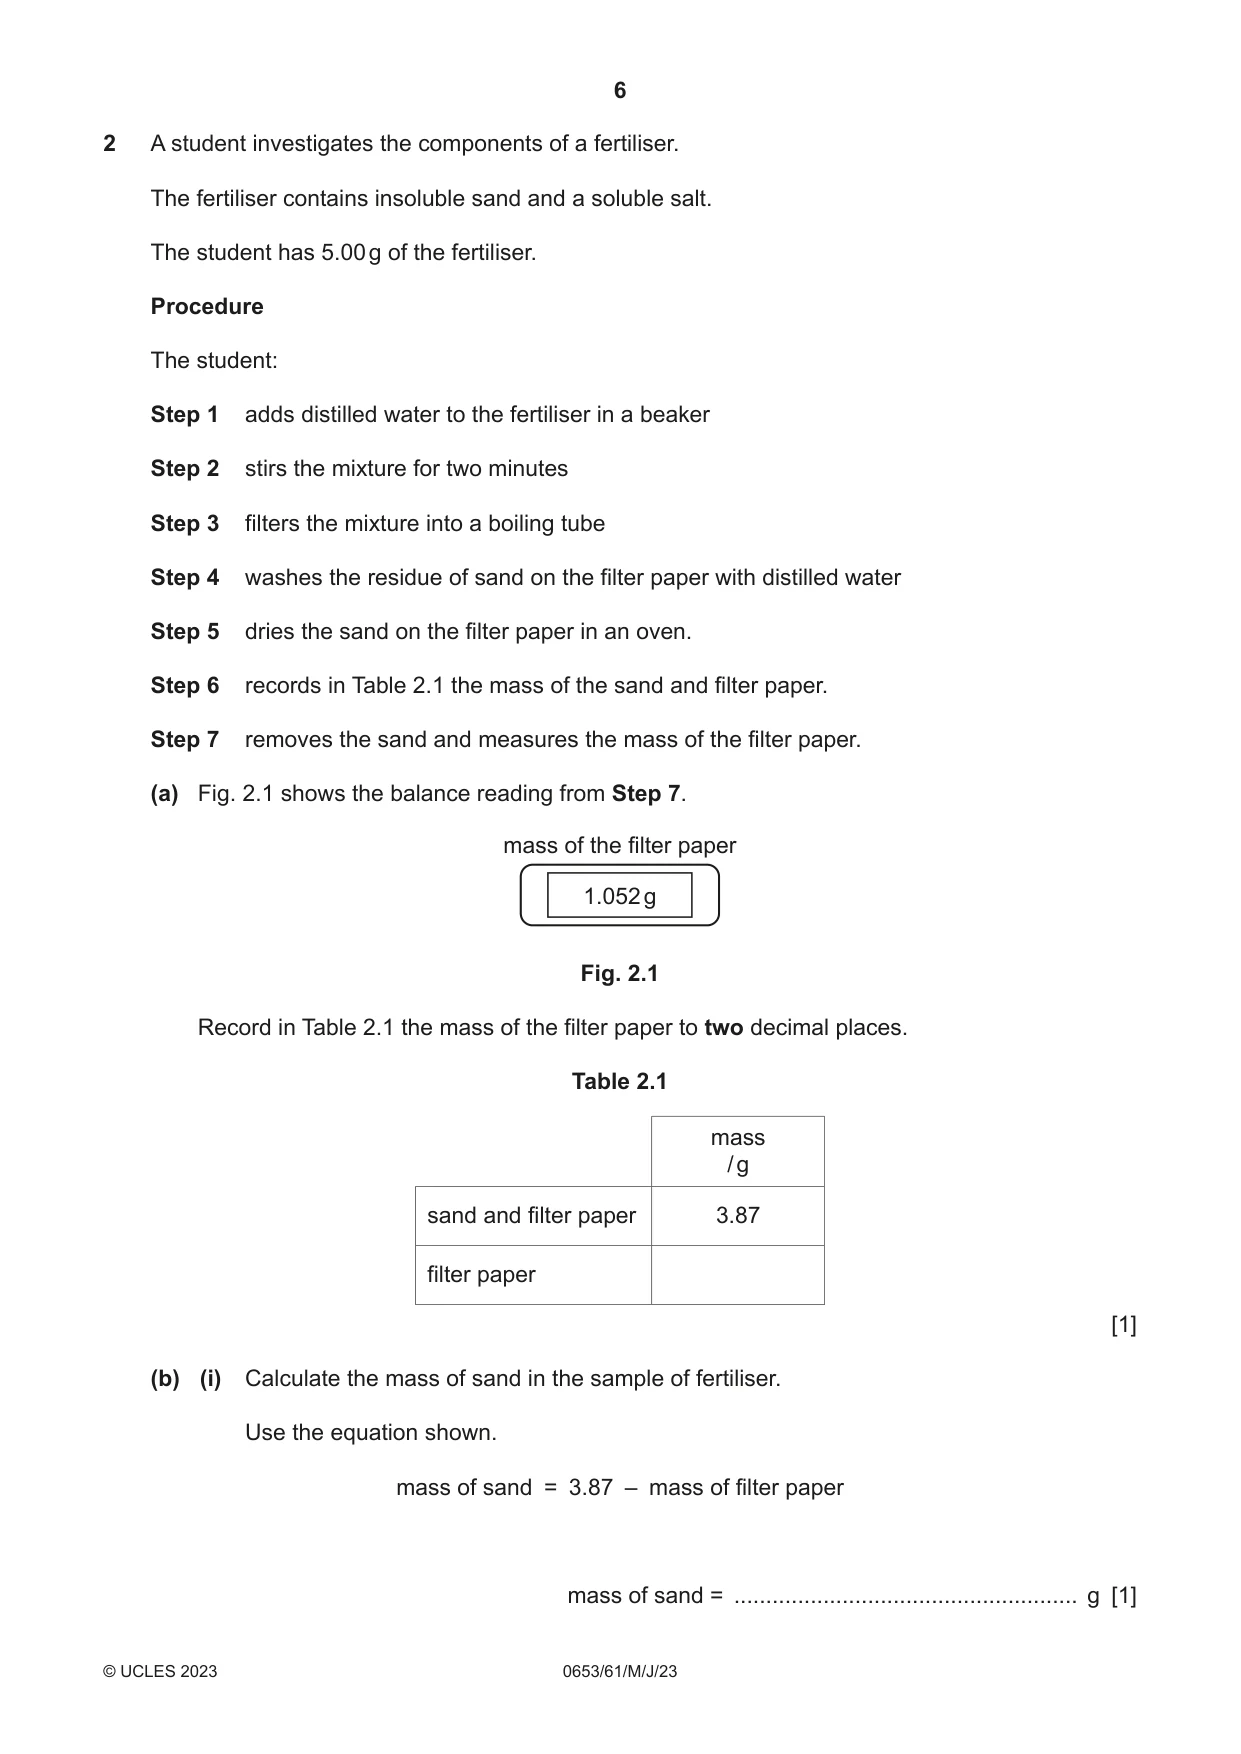
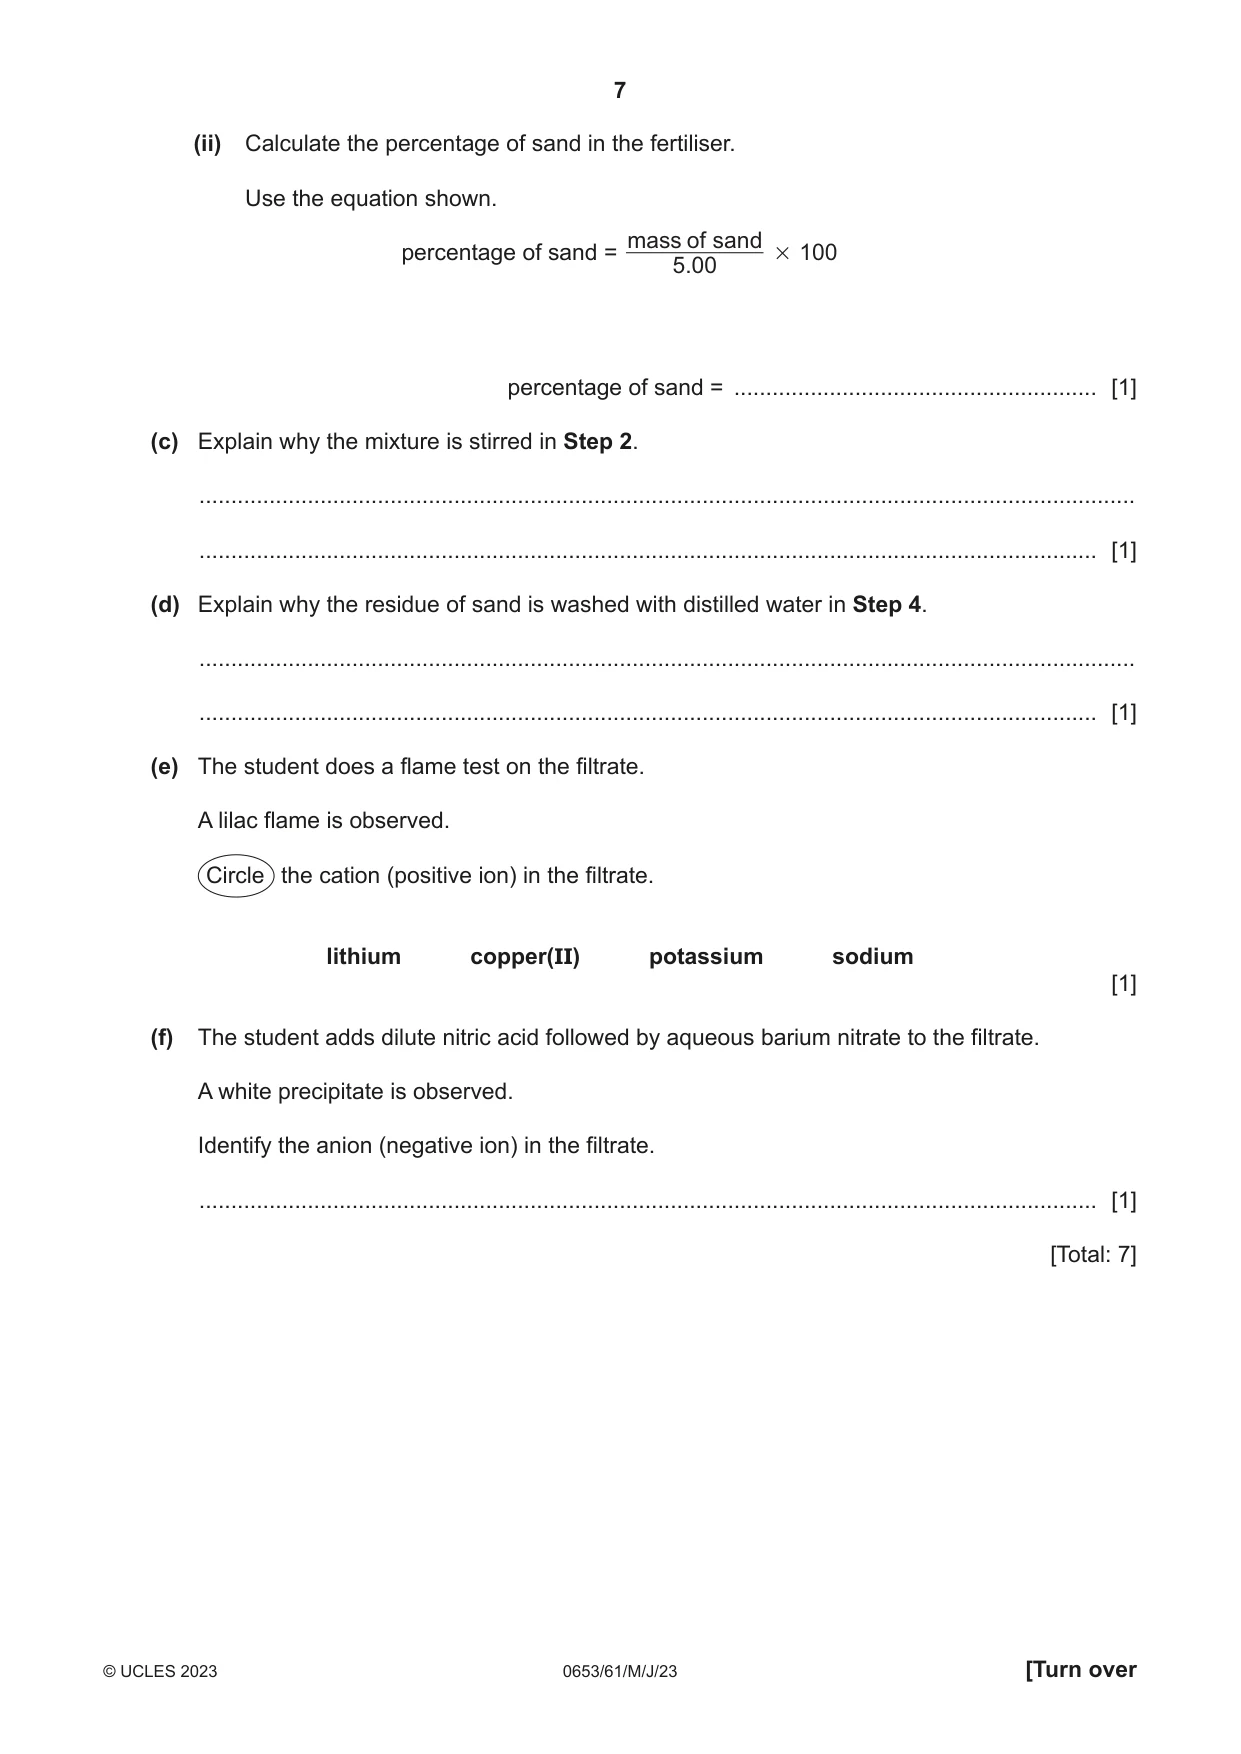
2 A student investigates the components of a fertiliser. The fertiliser contains insoluble sand and a soluble salt. The student has 5.00 g of the fertiliser. Procedure The student: Step 1 adds distilled water to the fertiliser in a beaker Step 2 stirs the mixture for two minutes Step 3 filters the mixture into a boiling tube Step 4 washes the residue of sand on the filter paper with distilled water Step 5 dries the sand on the filter paper in an oven. Step 6 records in Table 2.1 the mass of the sand and filter paper. Step 7 removes the sand and measures the mass of the filter paper. (a) Fig. 2.1 shows the balance reading from Step 7. mass of the filter paper 1.052 g Fig. 2.1 Record in Table 2.1 the mass of the filter paper to two decimal places. Table 2.1 mass / g sand and filter paper 3.87 filter paper [1] (b) (i) Calculate the mass of sand in the sample of fertiliser. Use the equation shown. mass of sand = 3.87 – mass of filter paper mass of sand = ...................................................... g [1] (ii) Calculate the percentage of sand in the fertiliser. Use the equation shown. mass of sand percentage of sand = # 100 5 .00 percentage of sand = ......................................................... [1] (c) Explain why the mixture is stirred in Step 2. ................................................................................................................................................... ............................................................................................................................................. [1] (d) Explain why the residue of sand is washed with distilled water in Step 4. ................................................................................................................................................... ............................................................................................................................................. [1] (e) The student does a flame test on the filtrate. A lilac flame is observed. Circle the cation (positive ion) in the filtrate. lithium copper(II) potassium sodium [1] (f) The student adds dilute nitric acid followed by aqueous barium nitrate to the filtrate. A white precipitate is observed. Identify the anion (negative ion) in the filtrate. ............................................................................................................................................. [1] [Total: 7]
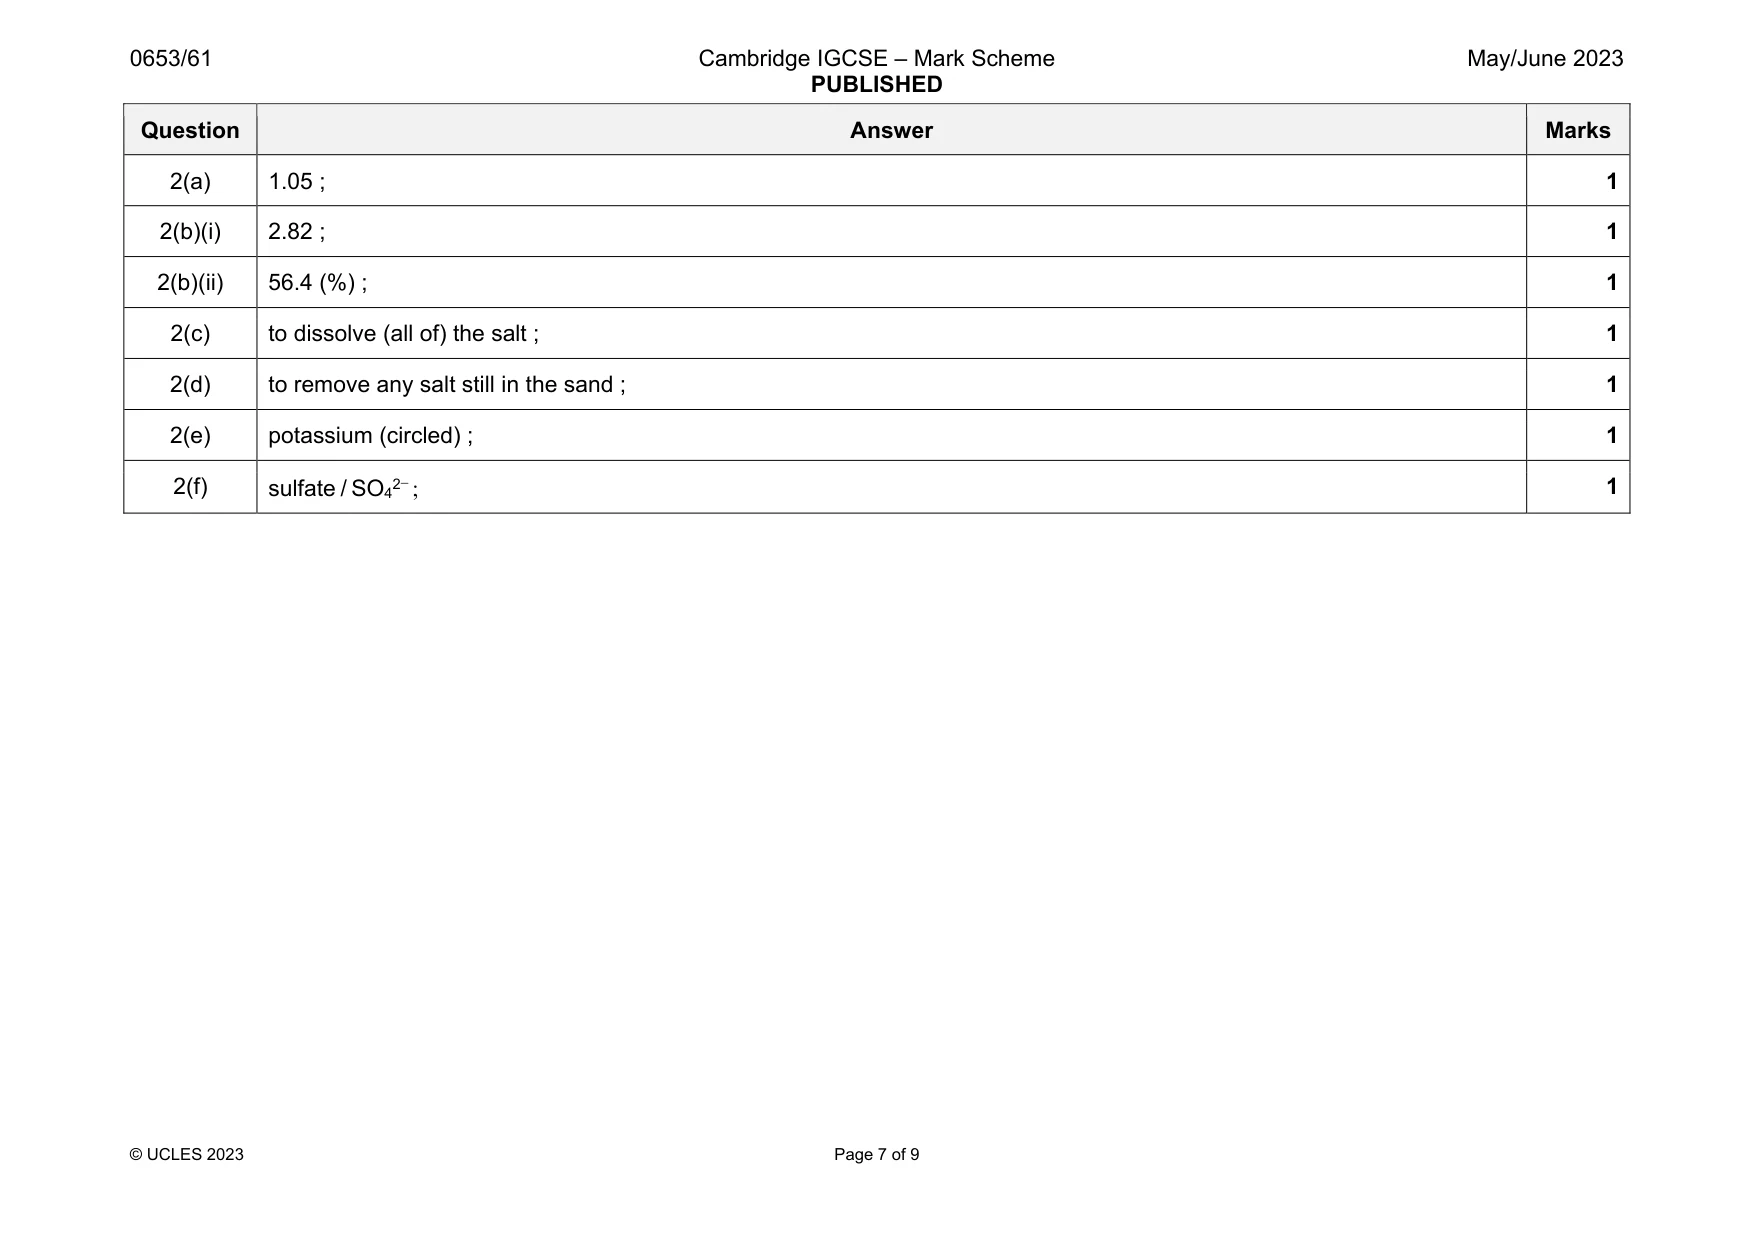
Mark scheme: 2(a) 1.05 ; 1 2(b)(i) 2.82 ; 1 2(b)(ii) 56.4 (%) ; 1 2(c) to dissolve (all of) the salt ; 1 2(d) to remove any salt still in the sand ; 1 2(e) potassium (circled) ; 1 2(f) sulfate / SO42 1
Q3 · Cetyl alcohol is a white solid with a melting point of 49 °C
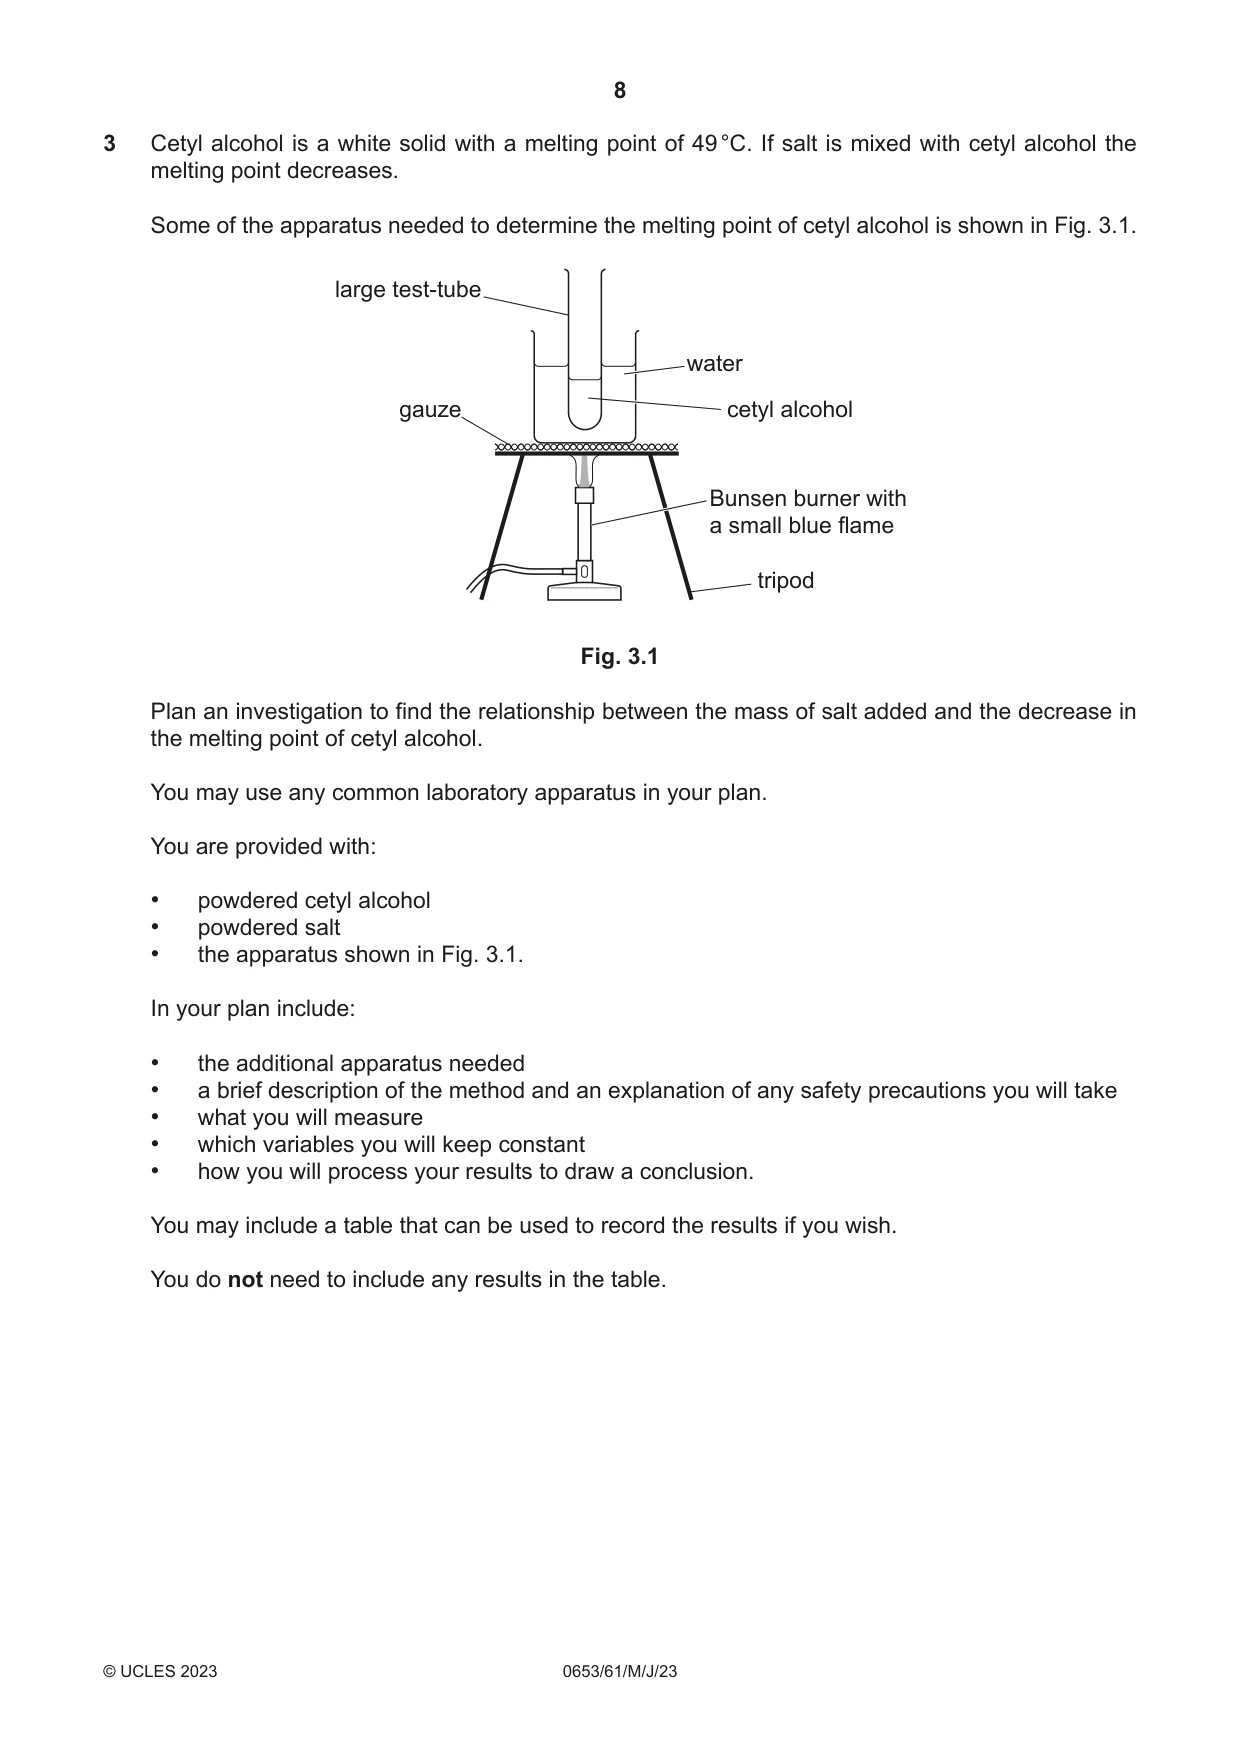
3 Cetyl alcohol is a white solid with a melting point of 49 °C. If salt is mixed with cetyl alcohol the melting point decreases. Some of the apparatus needed to determine the melting point of cetyl alcohol is shown in Fig. 3.1. large test-tube water gauze cetyl alcohol Bunsen burner with a small blue flame tripod Fig. 3.1 Plan an investigation to find the relationship between the mass of salt added and the decrease in the melting point of cetyl alcohol. You may use any common laboratory apparatus in your plan. You are provided with: • powdered cetyl alcohol • powdered salt • the apparatus shown in Fig. 3.1. In your plan include: • the additional apparatus needed • a brief description of the method and an explanation of any safety precautions you will take • what you will measure • which variables you will keep constant • how you will process your results to draw a conclusion. You may include a table that can be used to record the results if you wish. You do not need to include any results in the table. .......................................................................................................................................................... .......................................................................................................................................................... .......................................................................................................................................................... .......................................................................................................................................................... .......................................................................................................................................................... .......................................................................................................................................................... .......................................................................................................................................................... .......................................................................................................................................................... .......................................................................................................................................................... .......................................................................................................................................................... .......................................................................................................................................................... .......................................................................................................................................................... .......................................................................................................................................................... .................................................................................................................................................... [7]
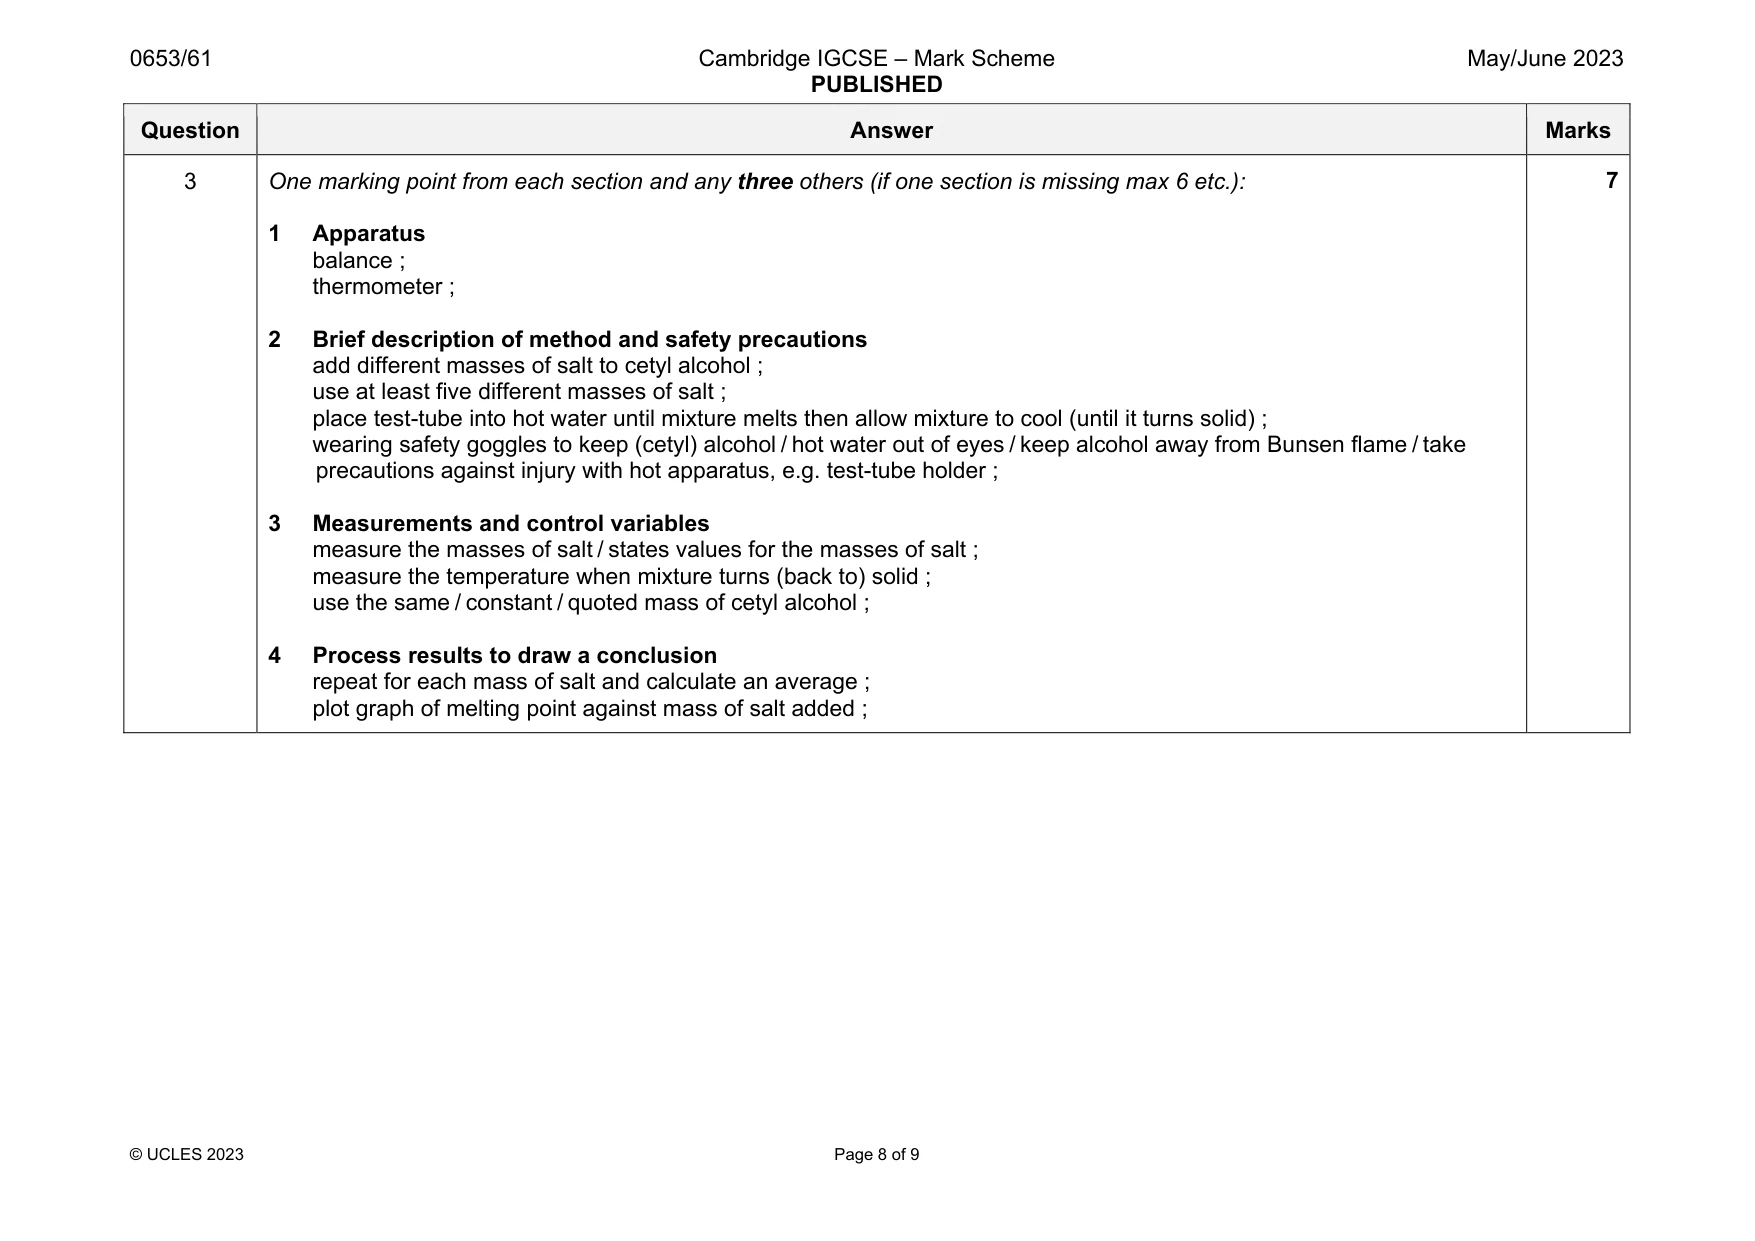
Mark scheme: 3 One marking point from each section and any three others (if one section is missing max 6 etc.): 1 Apparatus balance ; thermometer ; 2 Brief description of method and safety precautions add different masses of salt to cetyl alcohol ; use at least five different masses of salt ; place test-tube into hot water until mixture melts then allow mixture to cool (until it turns solid) ; wearing safety goggles to keep (cetyl) alcohol / hot water out of eyes / keep alcohol away from Bunsen flame / take precautions against injury with hot apparatus, e.g. test-tube holder ; 3 Measurements and control variables measure the masses of salt / states values for the masses of salt ; measure the temperature when mixture turns (back to) solid ; use the same / constant / quoted mass of cetyl alcohol ; 4 Process results to draw a conclusion repeat for each mass of salt and calculate an average ; plot graph of melting point against mass of salt added ;
Q4 · A student investigates the resistance of different combinations of two identical lamps L…
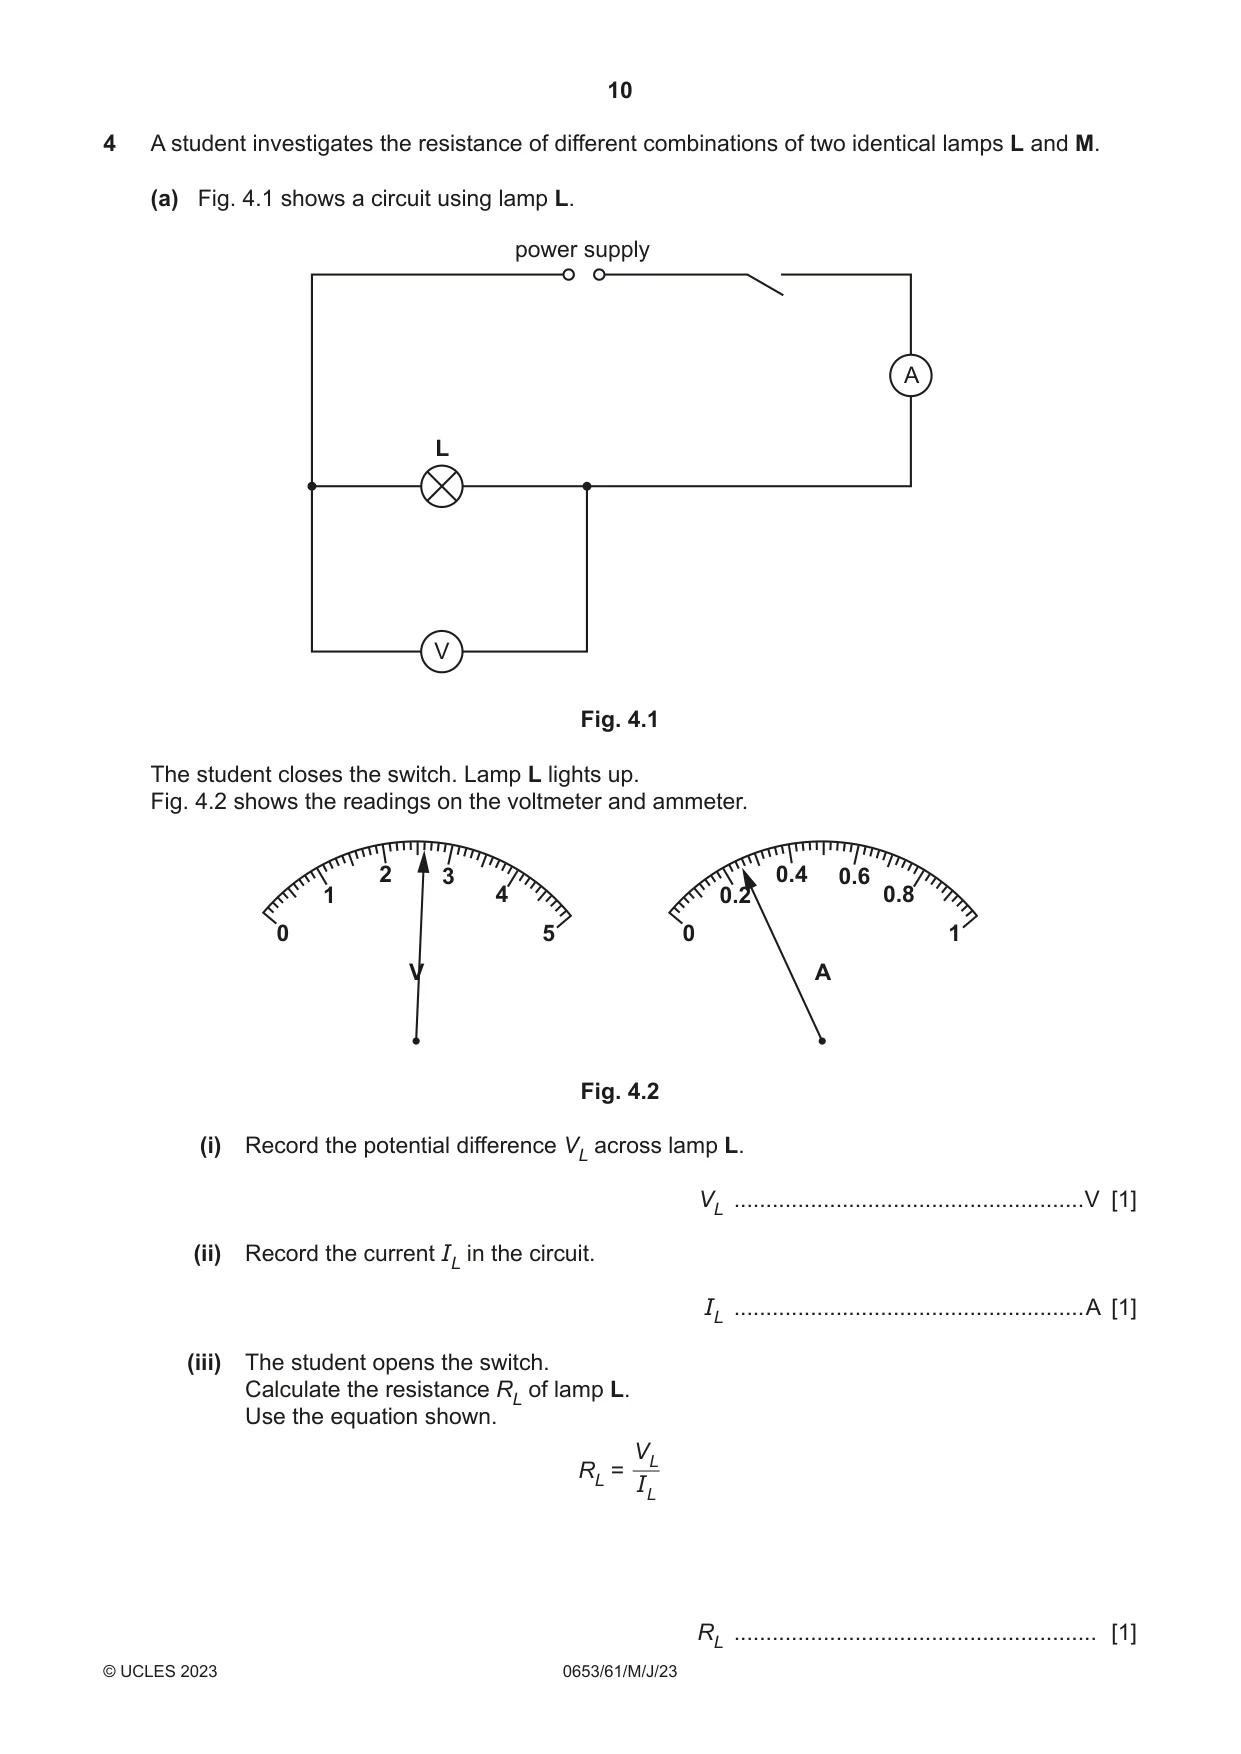
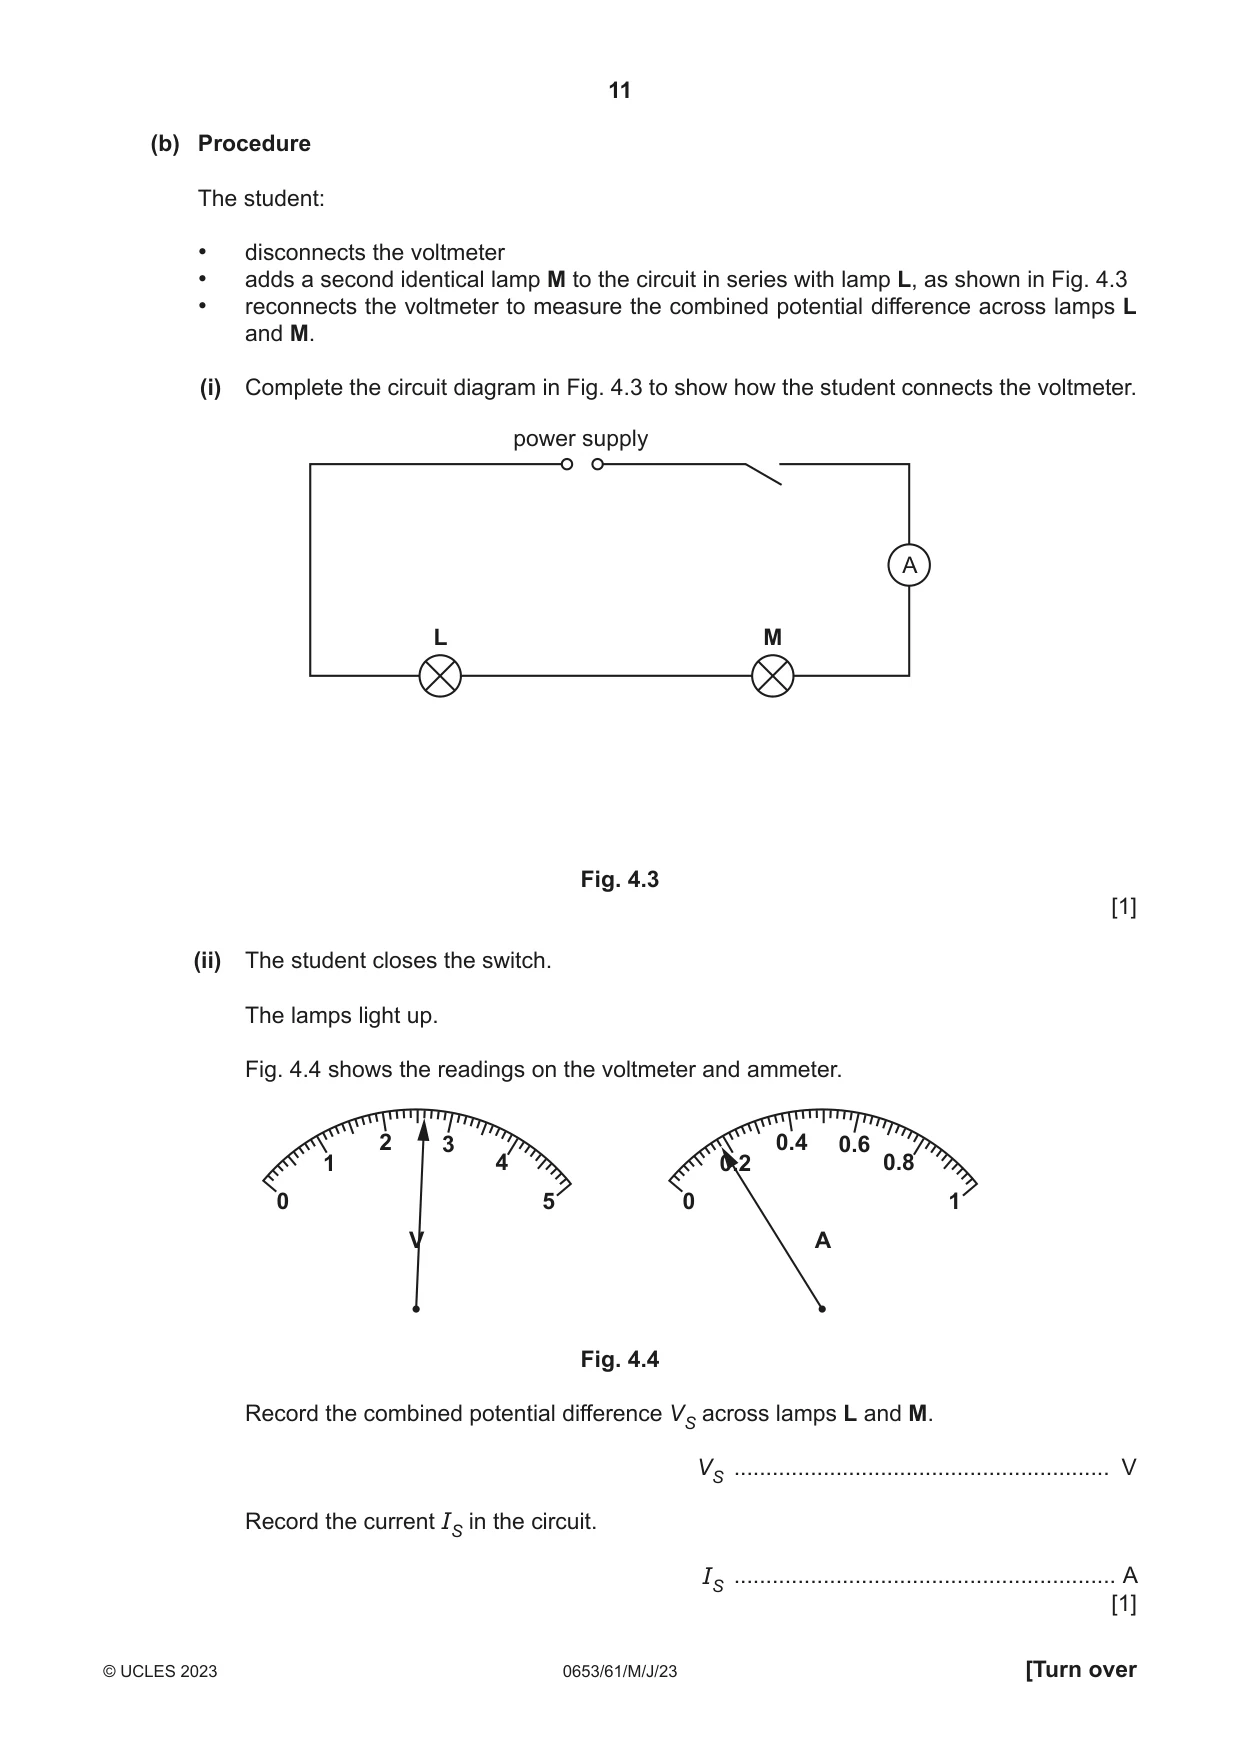
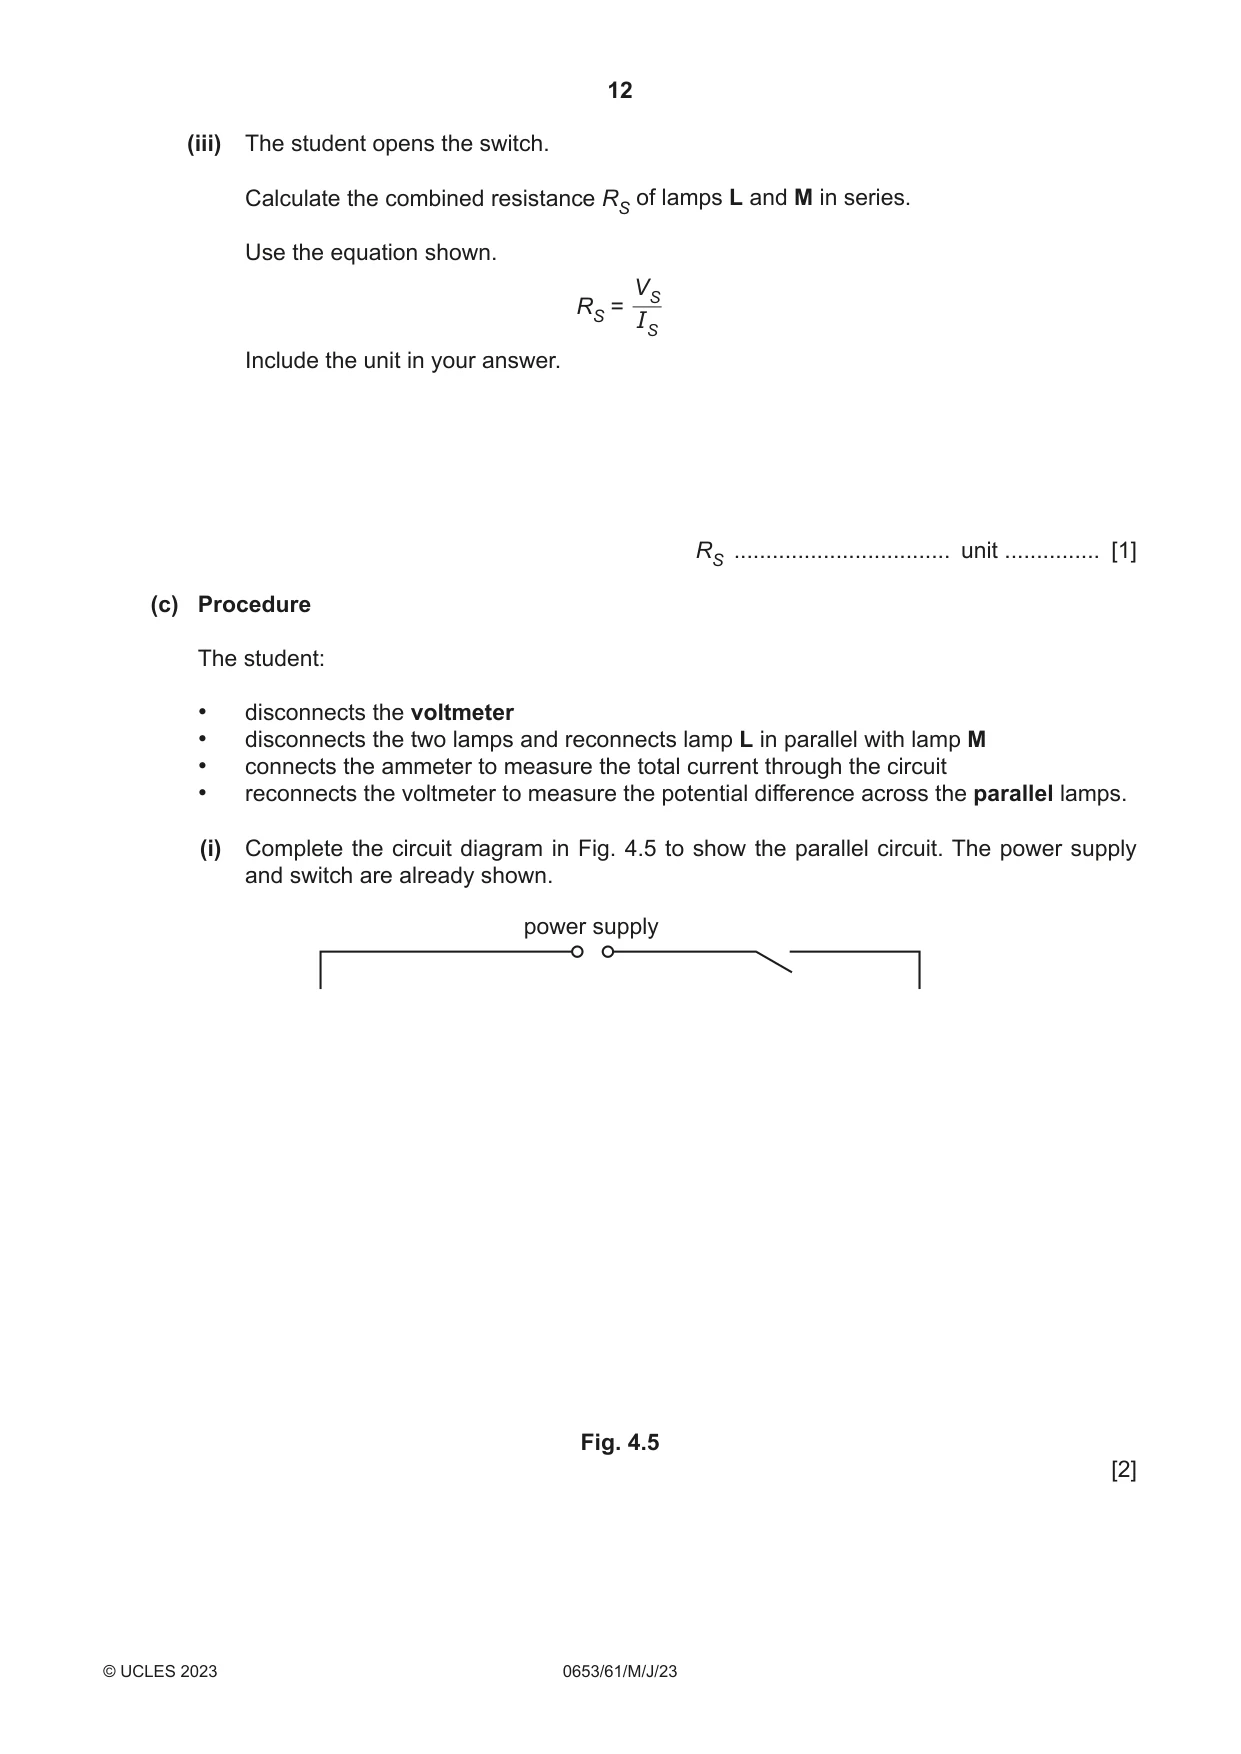
4 A student investigates the resistance of different combinations of two identical lamps L and M. (a) Fig. 4.1 shows a circuit using lamp L. power supply A L V Fig. 4.1 The student closes the switch. Lamp L lights up. Fig. 4.2 shows the readings on the voltmeter and ammeter. 2 3 0.4 0.6 1 4 0.2 0.8 0 5 0 1 V A Fig. 4.2 (i) Record the potential difference VL across lamp L. VL .......................................................V [1] (ii) Record the current IL in the circuit. IL .......................................................A [1] (iii) The student opens the switch. Calculate the resistance RL of lamp L. Use the equation shown. V L RL = I L RL ......................................................... [1] (b) Procedure The student: • disconnects the voltmeter • adds a second identical lamp M to the circuit in series with lamp L, as shown in Fig. 4.3 • reconnects the voltmeter to measure the combined potential difference across lamps L and M. (i) Complete the circuit diagram in Fig. 4.3 to show how the student connects the voltmeter. power supply A L M Fig. 4.3 [1] (ii) The student closes the switch. The lamps light up. Fig. 4.4 shows the readings on the voltmeter and ammeter. 2 3 0.4 0.6 1 4 0.2 0.8 0 5 0 1 V A Fig. 4.4 Record the combined potential difference VS across lamps L and M. VS ........................................................... V Record the current IS in the circuit. IS ............................................................ A [1] (iii) The student opens the switch. Calculate the combined resistance RS of lamps L and M in series. Use the equation shown. V S RS = I S Include the unit in your answer. RS .................................. unit ............... [1] (c) Procedure The student: • disconnects the voltmeter • disconnects the two lamps and reconnects lamp L in parallel with lamp M • connects the ammeter to measure the total current through the circuit • reconnects the voltmeter to measure the potential difference across the parallel lamps. (i) Complete the circuit diagram in Fig. 4.5 to show the parallel circuit. The power supply and switch are already shown. power supply Fig. 4.5 [2]
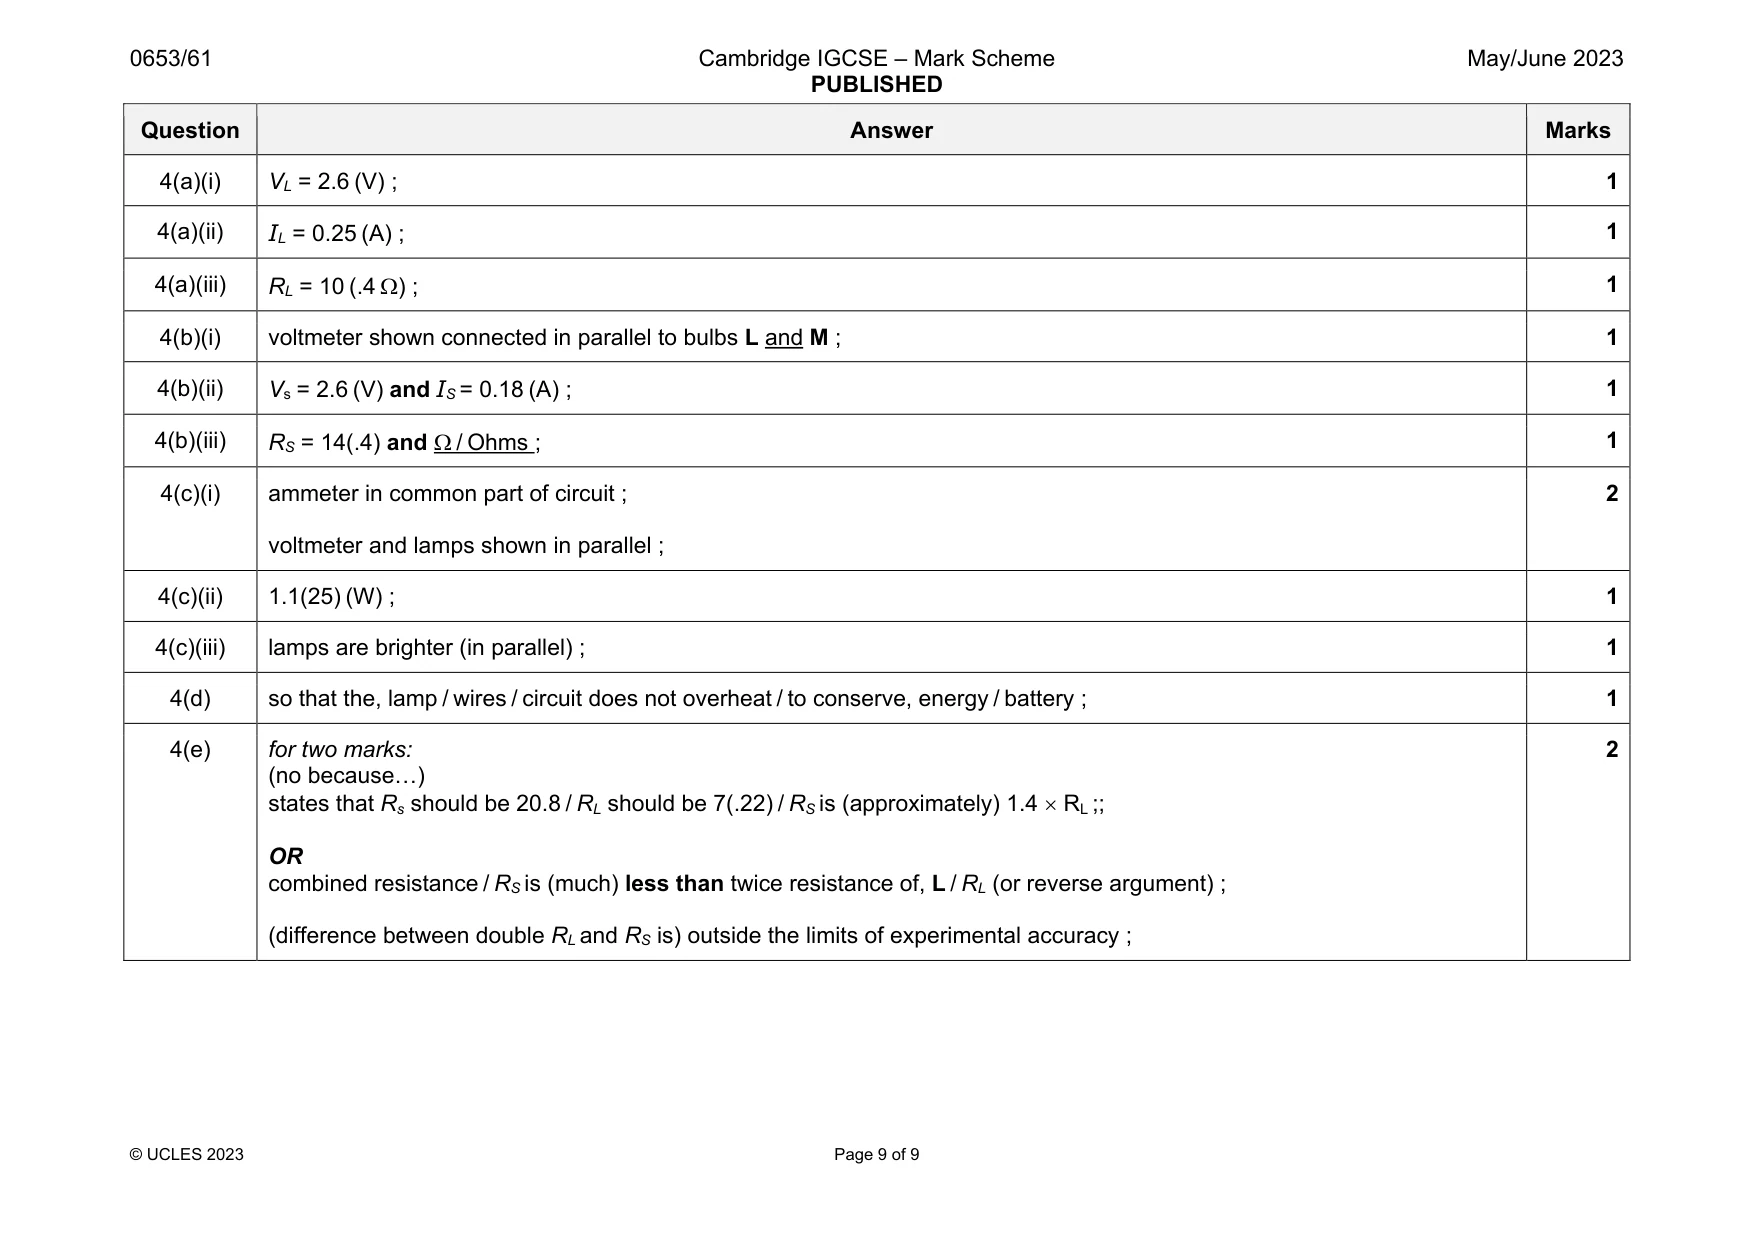
Mark scheme: 4(a)(i) VL = 2.6 (V) ; 1 4(a)(ii) IL = 0.25 (A) ; 1 4(a)(iii) RL = 10 (.4 ) ; 1 4(b)(i) voltmeter shown connected in parallel to bulbs L and M ; 1 4(b)(ii) Vs = 2.6 (V) and IS = 0.18 (A) ; 1 4(b)(iii) RS = 14(.4) and / Ohms ; 1 4(c)(i) ammeter in common part of circuit ; voltmeter and lamps shown in parallel ; 2 4(c)(ii) 1.1(25) (W) ; 1 4(c)(iii) lamps are brighter (in parallel) ; 1 4(d) so that the, lamp / wires / circuit does not overheat / to conserve, energy / battery ; 1 4(e) for two marks: (no because…) states that Rs should be 20.8 / RL should be 7(.22) / RS is (approximately) 1.4 RL ;; OR combined resistance / RS is (much) less than twice resistance of, L / RL (or reverse argument) ; (difference between double RL and RS is) outside the limits of experimental accuracy ; 2
What was in this paper
The subtopics covered by these 4 questions, and how many questions each got. Open one in a new tab to see every Cambridge question on it.
What you needed in this session
Cambridge’s own grade thresholds for 2023 May/June, Paper 6 · Variant 1. A higher threshold means an easier paper — the bar moves with how the cohort did.