Cambridge IGCSE Science - Combined 0653 — 2021 May/June Paper 6 · Variant 3
0653/63/M/J/21 · 4 questions · 40 marks · ≈45 min
The question paper and its mark scheme, free to read here and free to download. This is Cambridge’s own paper, exactly as it was sat.
Question paper16 pages




Mark scheme7 pages
Answers below. Sit the paper first if you are practising.
Questions as text
Q1 · A student investigates the effect of temperature on the activity of the enzyme pepsin
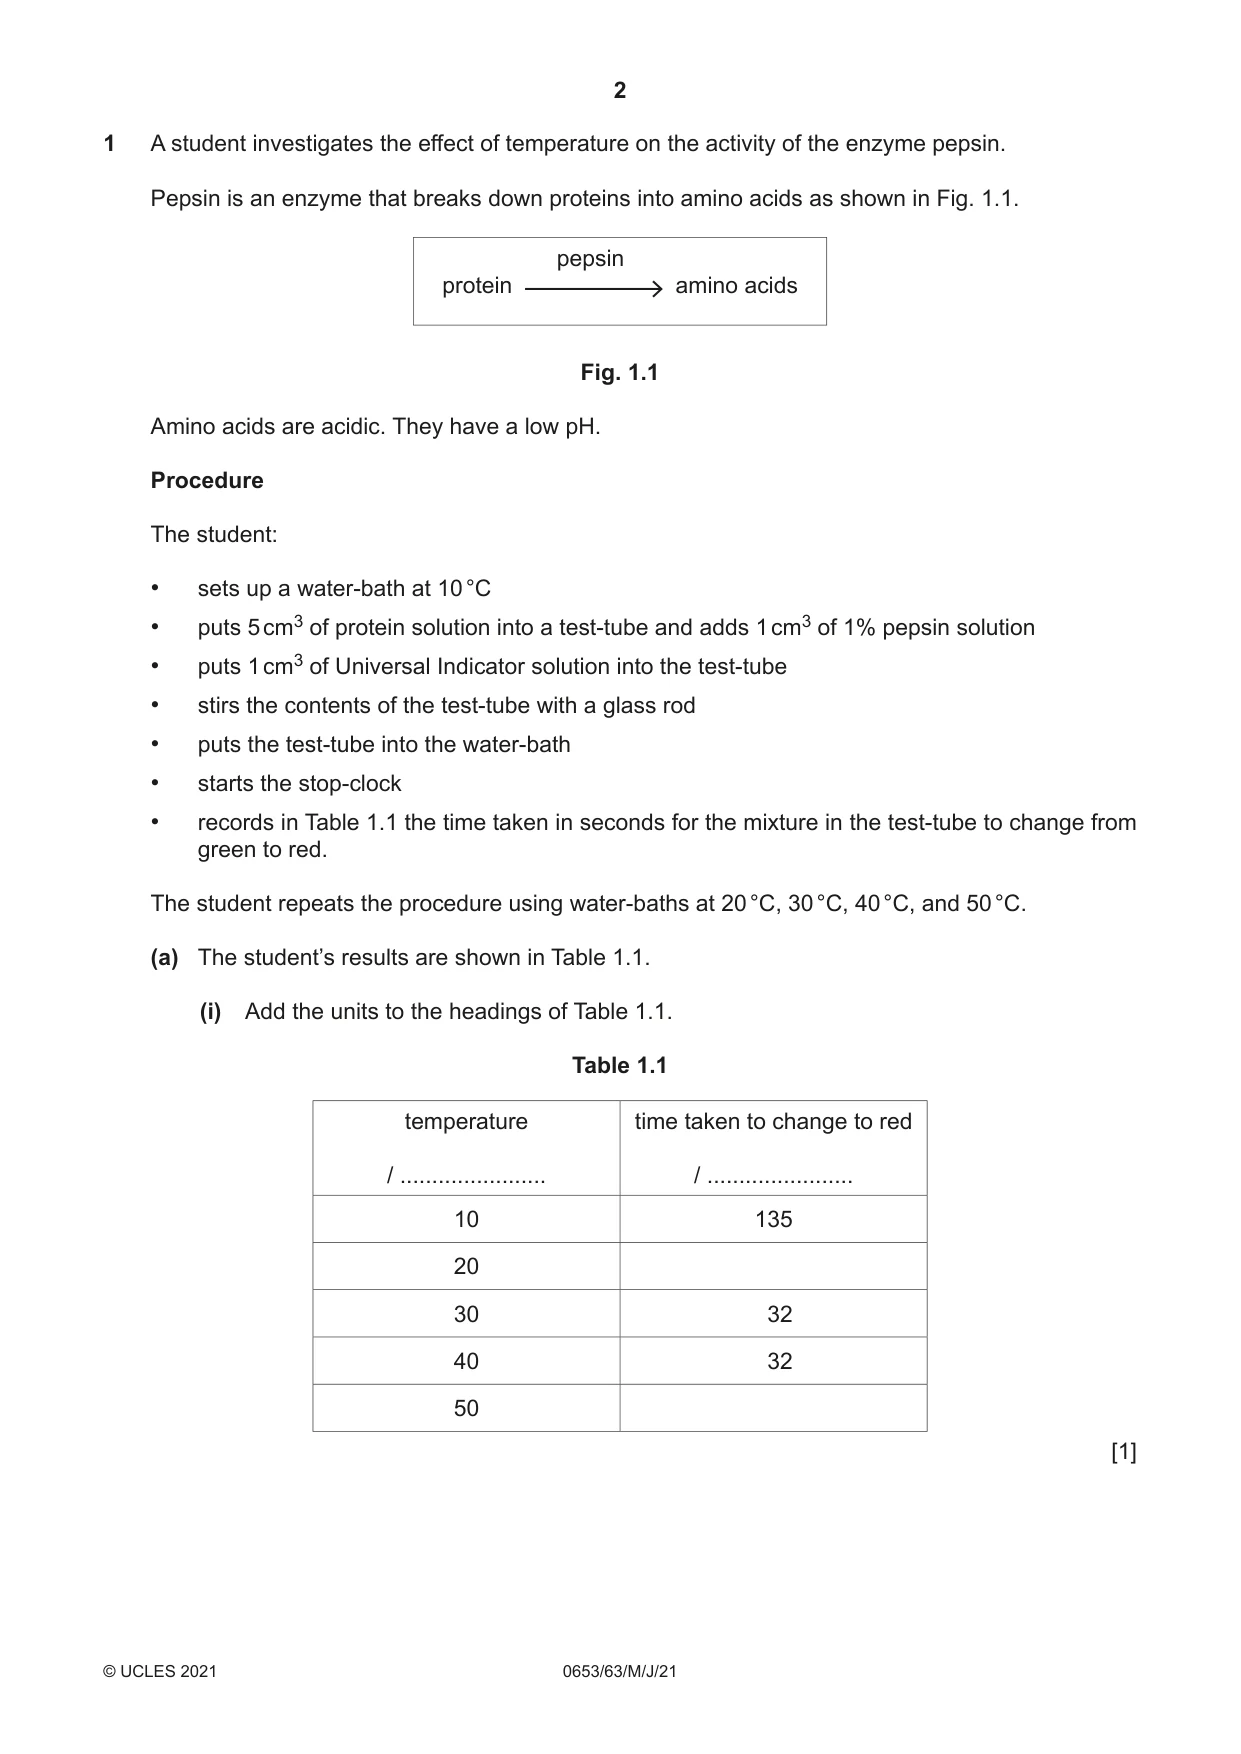
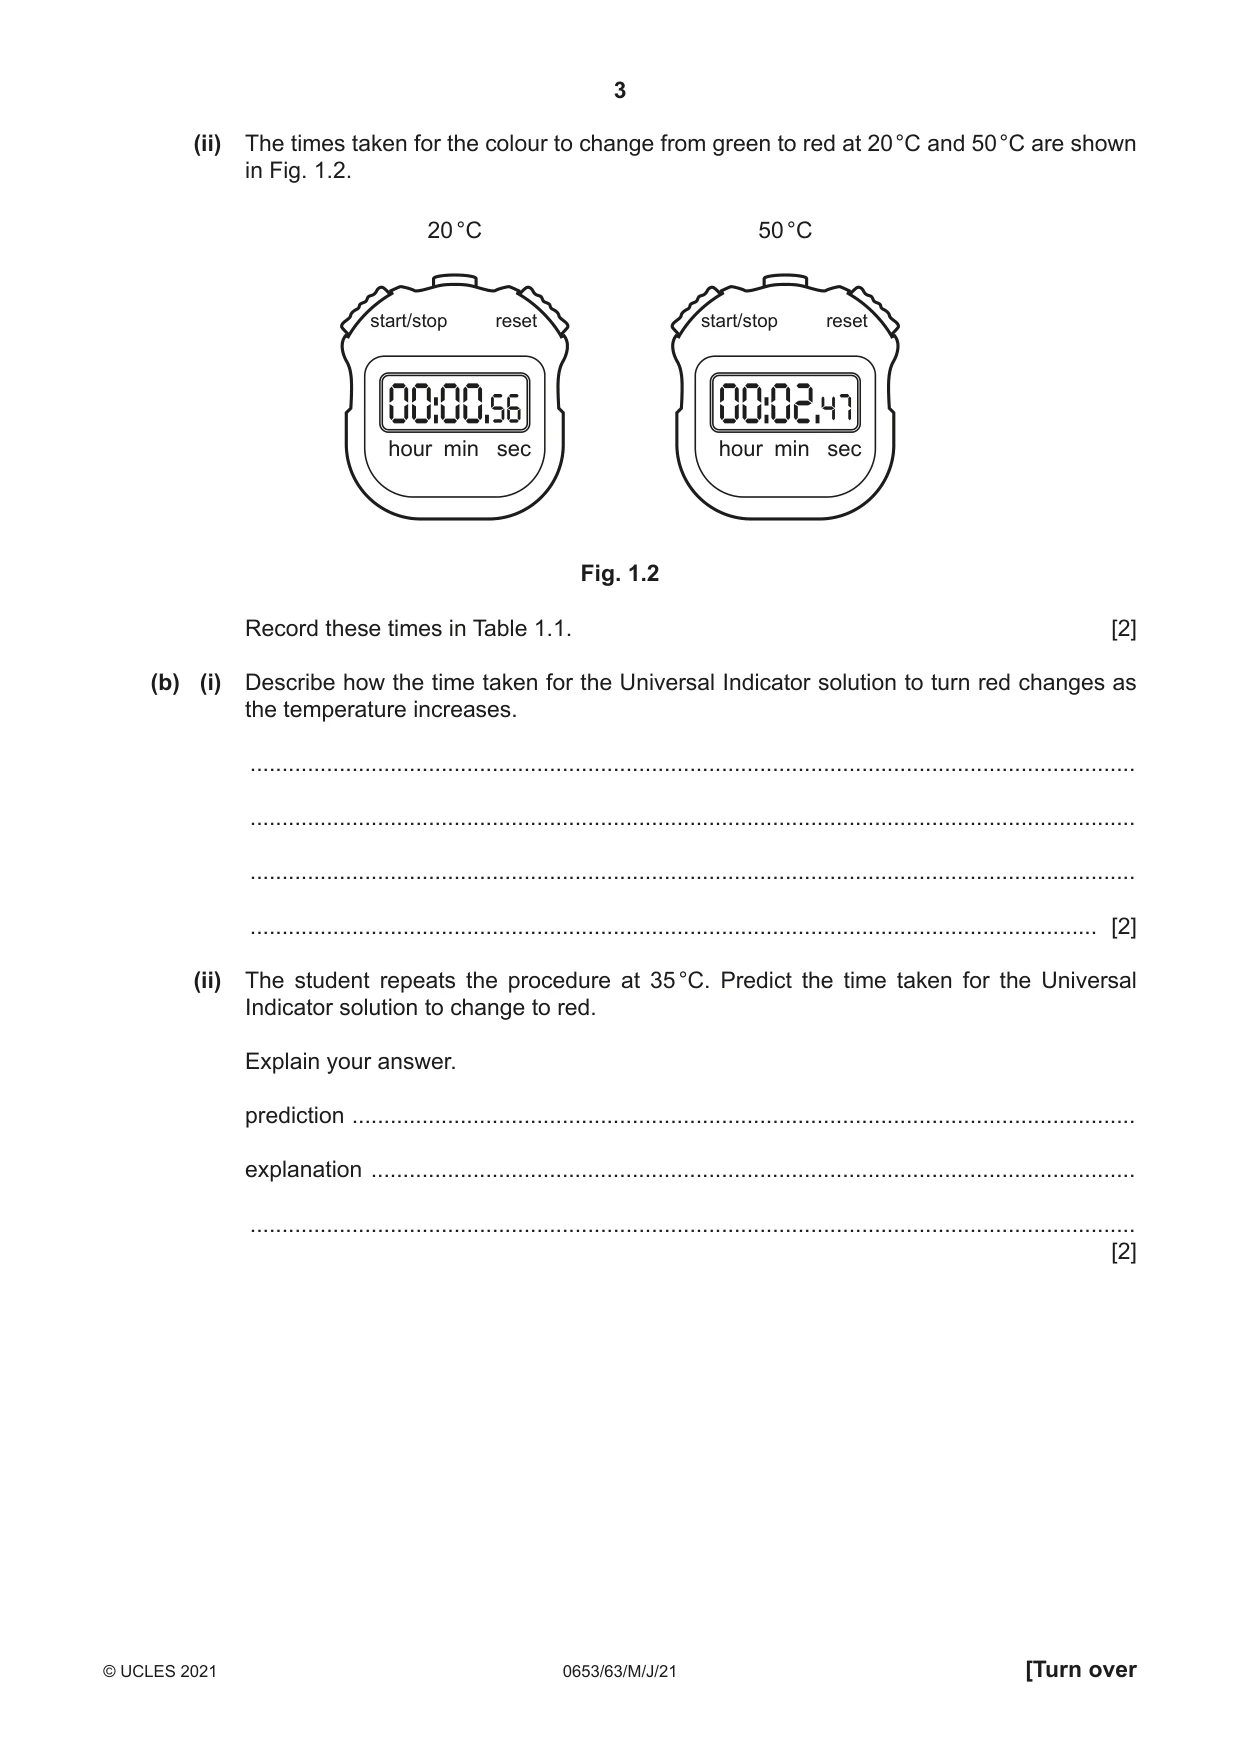
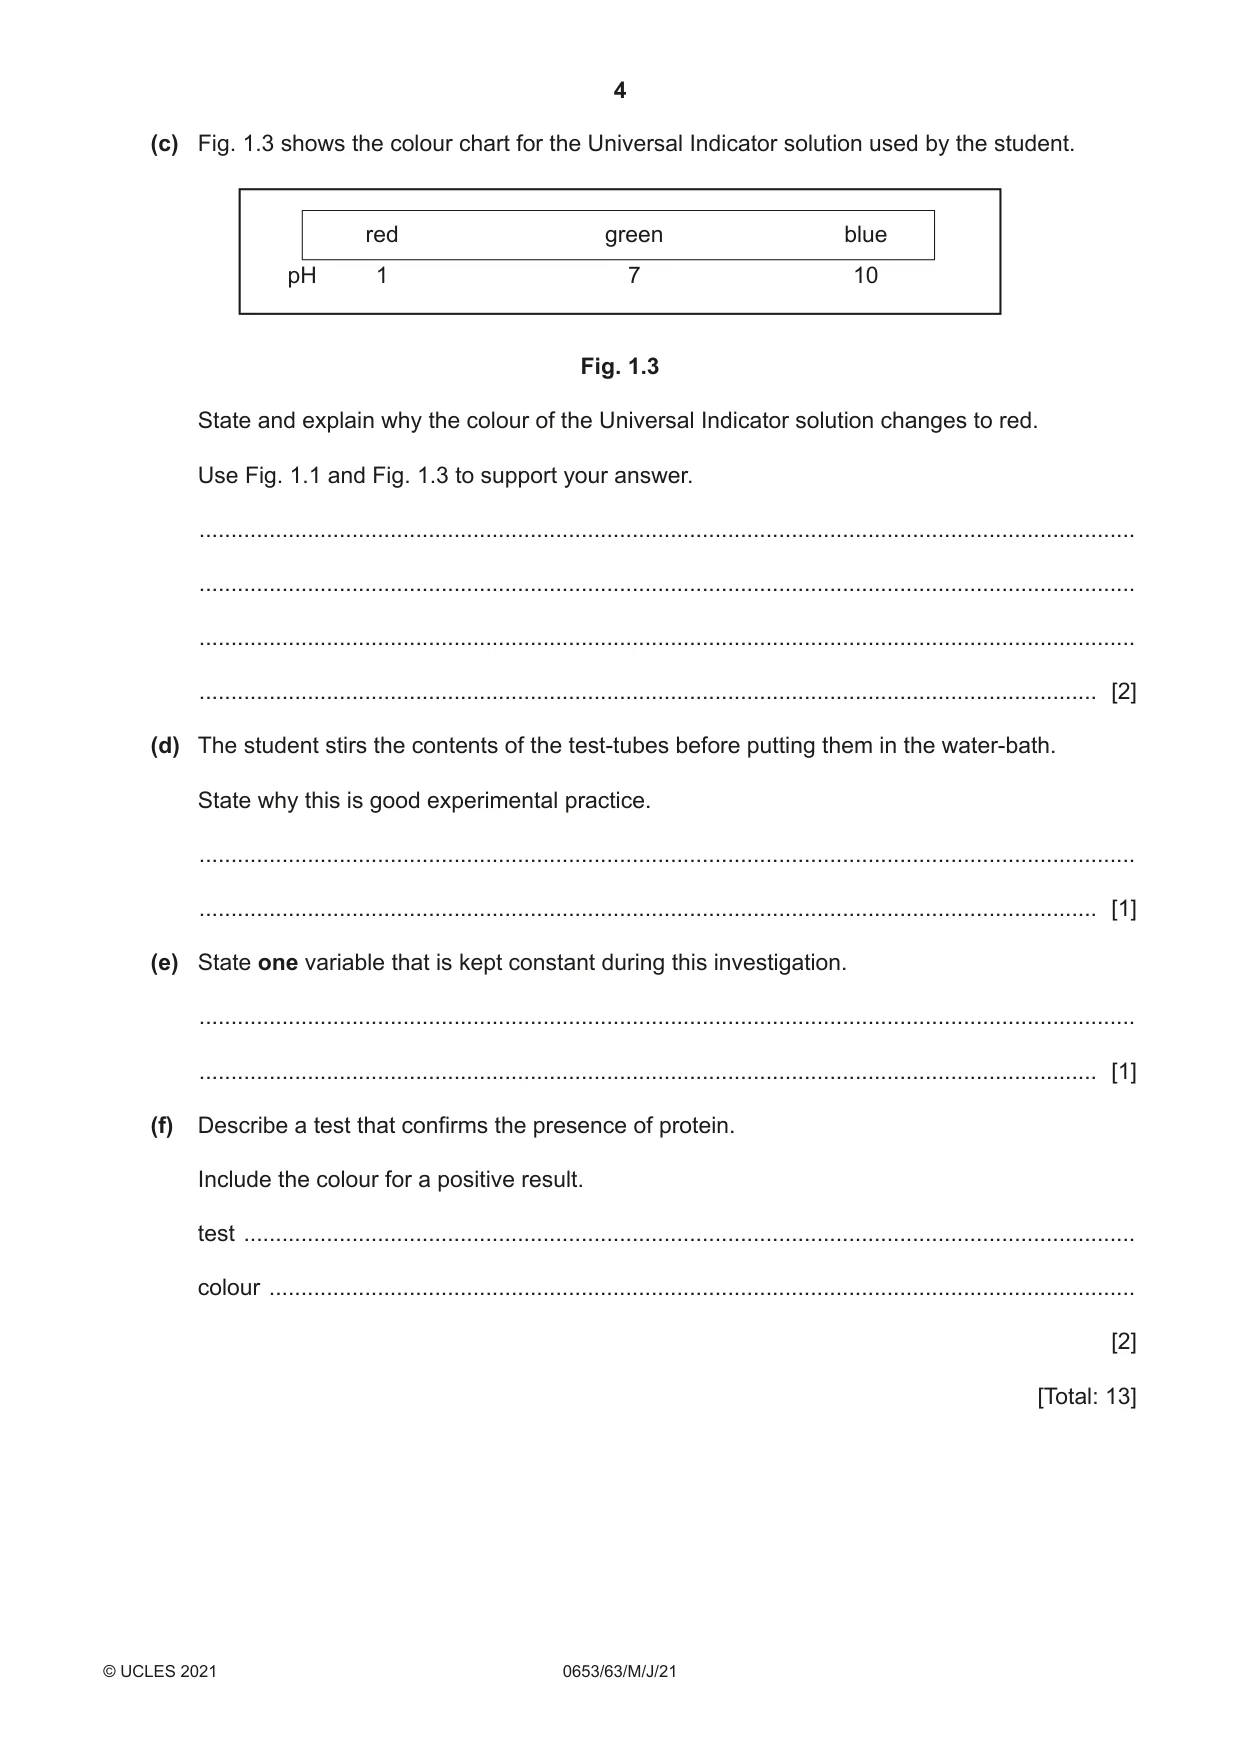
1 A student investigates the effect of temperature on the activity of the enzyme pepsin. Pepsin is an enzyme that breaks down proteins into amino acids as shown in Fig. 1.1. pepsin protein amino acids Fig. 1.1 Amino acids are acidic. They have a low pH. Procedure The student: • sets up a water-bath at 10 °C • puts 5 cm3 of protein solution into a test-tube and adds 1 cm3 of 1% pepsin solution • puts 1 cm3 of Universal Indicator solution into the test-tube • stirs the contents of the test-tube with a glass rod • puts the test-tube into the water-bath • starts the stop-clock • records in Table 1.1 the time taken in seconds for the mixture in the test-tube to change from green to red. The student repeats the procedure using water-baths at 20 °C, 30 °C, 40 °C, and 50 °C. (a) The student’s results are shown in Table 1.1. (i) Add the units to the headings of Table 1.1. Table 1.1 temperature time taken to change to red / ....................... / ....................... 10 135 20 30 32 40 32 50 [1] (ii) The times taken for the colour to change from green to red at 20 °C and 50 °C are shown in Fig. 1.2. 20 °C 50 °C start/stop reset start/stop reset hour min sec hour min sec Fig. 1.2 Record these times in Table 1.1. [2] (b) (i) Describe how the time taken for the Universal Indicator solution to turn red changes as the temperature increases. ........................................................................................................................................... ........................................................................................................................................... ........................................................................................................................................... ..................................................................................................................................... [2] (ii) The student repeats the procedure at 35 °C. Predict the time taken for the Universal Indicator solution to change to red. Explain your answer. prediction ........................................................................................................................... explanation ........................................................................................................................ ........................................................................................................................................... [2] (c) Fig. 1.3 shows the colour chart for the Universal Indicator solution used by the student. red green blue pH 1 7 10 Fig. 1.3 State and explain why the colour of the Universal Indicator solution changes to red. Use Fig. 1.1 and Fig. 1.3 to support your answer. ................................................................................................................................................... ................................................................................................................................................... ................................................................................................................................................... ............................................................................................................................................. [2] (d) The student stirs the contents of the test-tubes before putting them in the water-bath. State why this is good experimental practice. ................................................................................................................................................... ............................................................................................................................................. [1] (e) State one variable that is kept constant during this investigation. ................................................................................................................................................... ............................................................................................................................................. [1] (f) Describe a test that confirms the presence of protein. Include the colour for a positive result. test ............................................................................................................................................ colour ........................................................................................................................................ [2] [Total: 13]
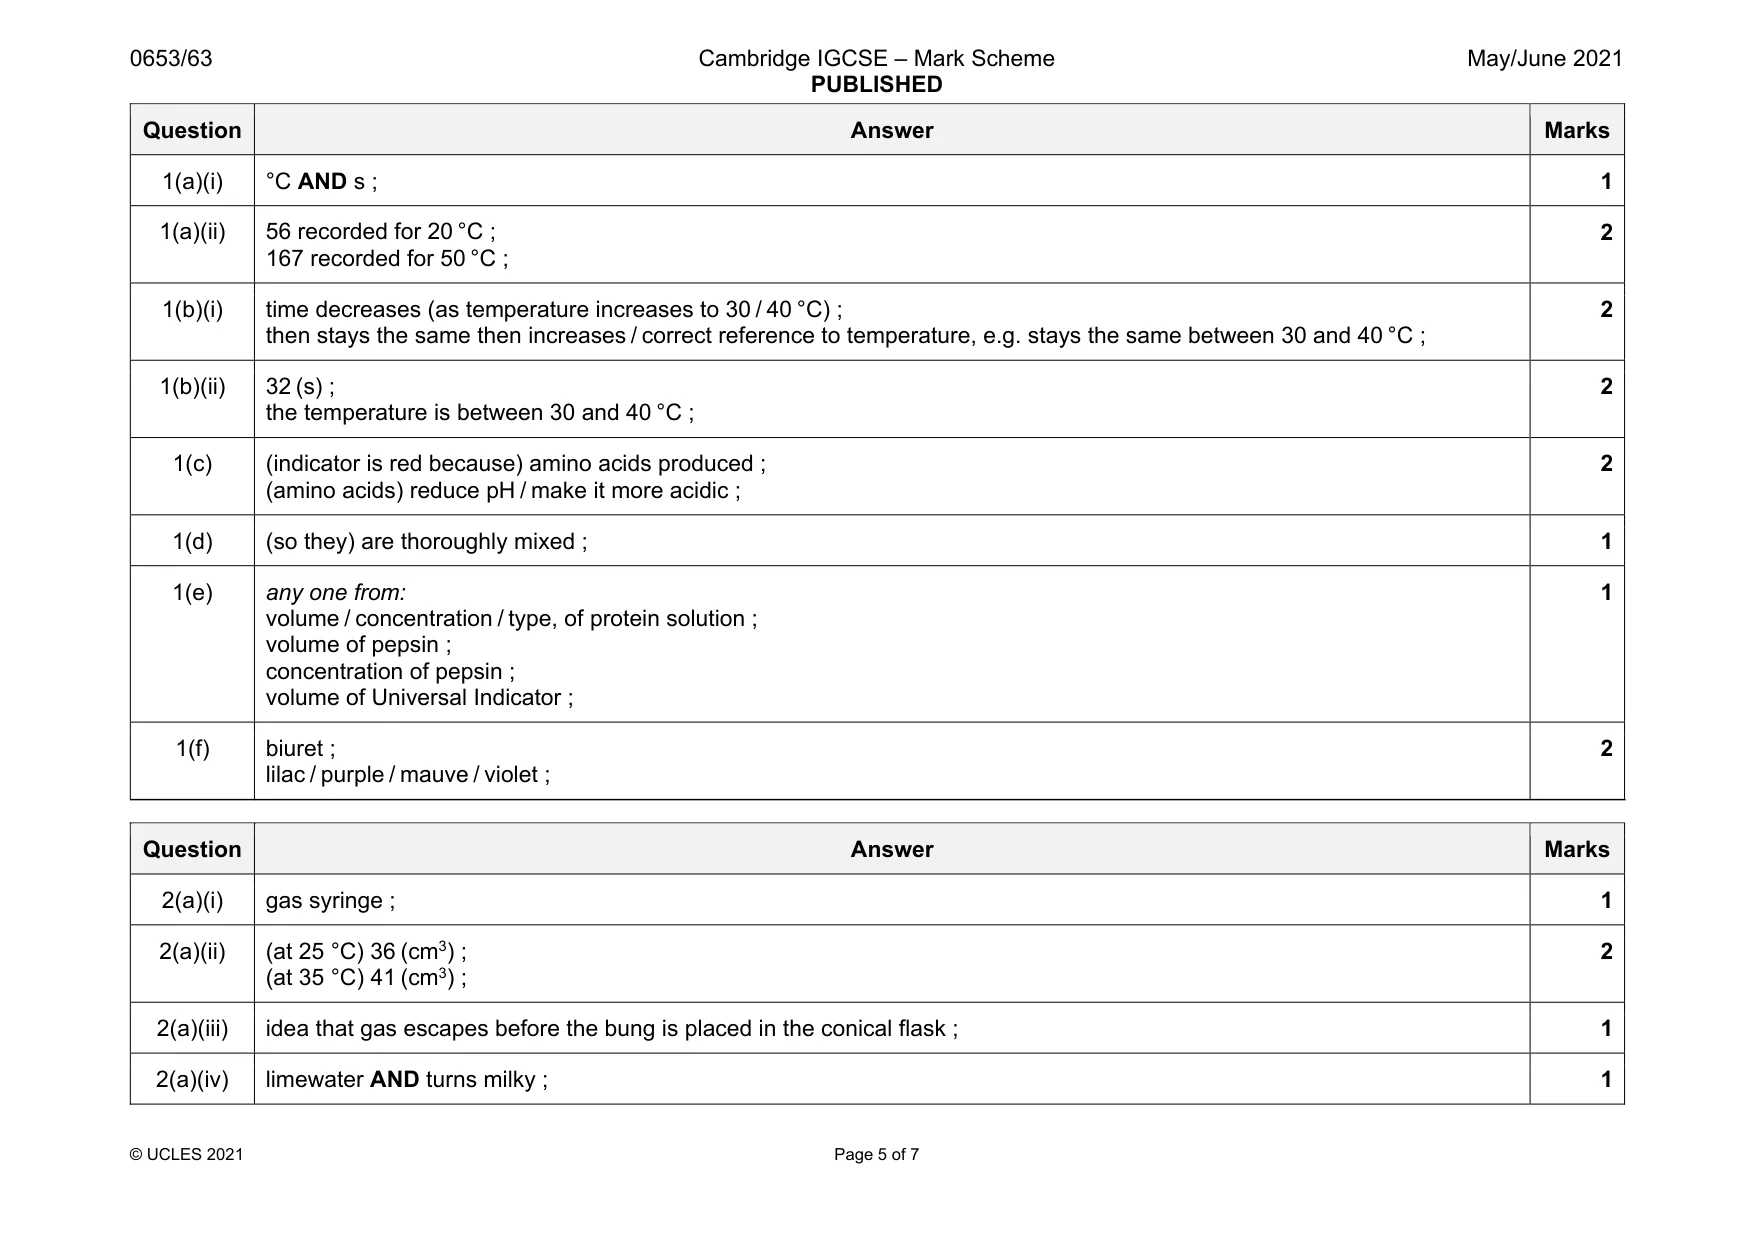
Mark scheme: 1(a)(i) °C AND s ; 1 1(a)(ii) 56 recorded for 20 °C ; 167 recorded for 50 °C ; 2 1(b)(i) time decreases (as temperature increases to 30 / 40 °C) ; then stays the same then increases / correct reference to temperature, e.g. stays the same between 30 and 40 °C ; 2 1(b)(ii) 32 (s) ; the temperature is between 30 and 40 °C ; 2 1(c) (indicator is red because) amino acids produced ; (amino acids) reduce pH / make it more acidic ; 2 1(d) (so they) are thoroughly mixed ; 1 1(e) any one from: volume / concentration / type, of protein solution ; volume of pepsin ; concentration of pepsin ; volume of Universal Indicator ; 1 1(f) biuret ; lilac / purple / mauve / violet ; 2
Q2 · Antacid tablets are used to reduce the symptoms of indigestion in the stomach caused by…
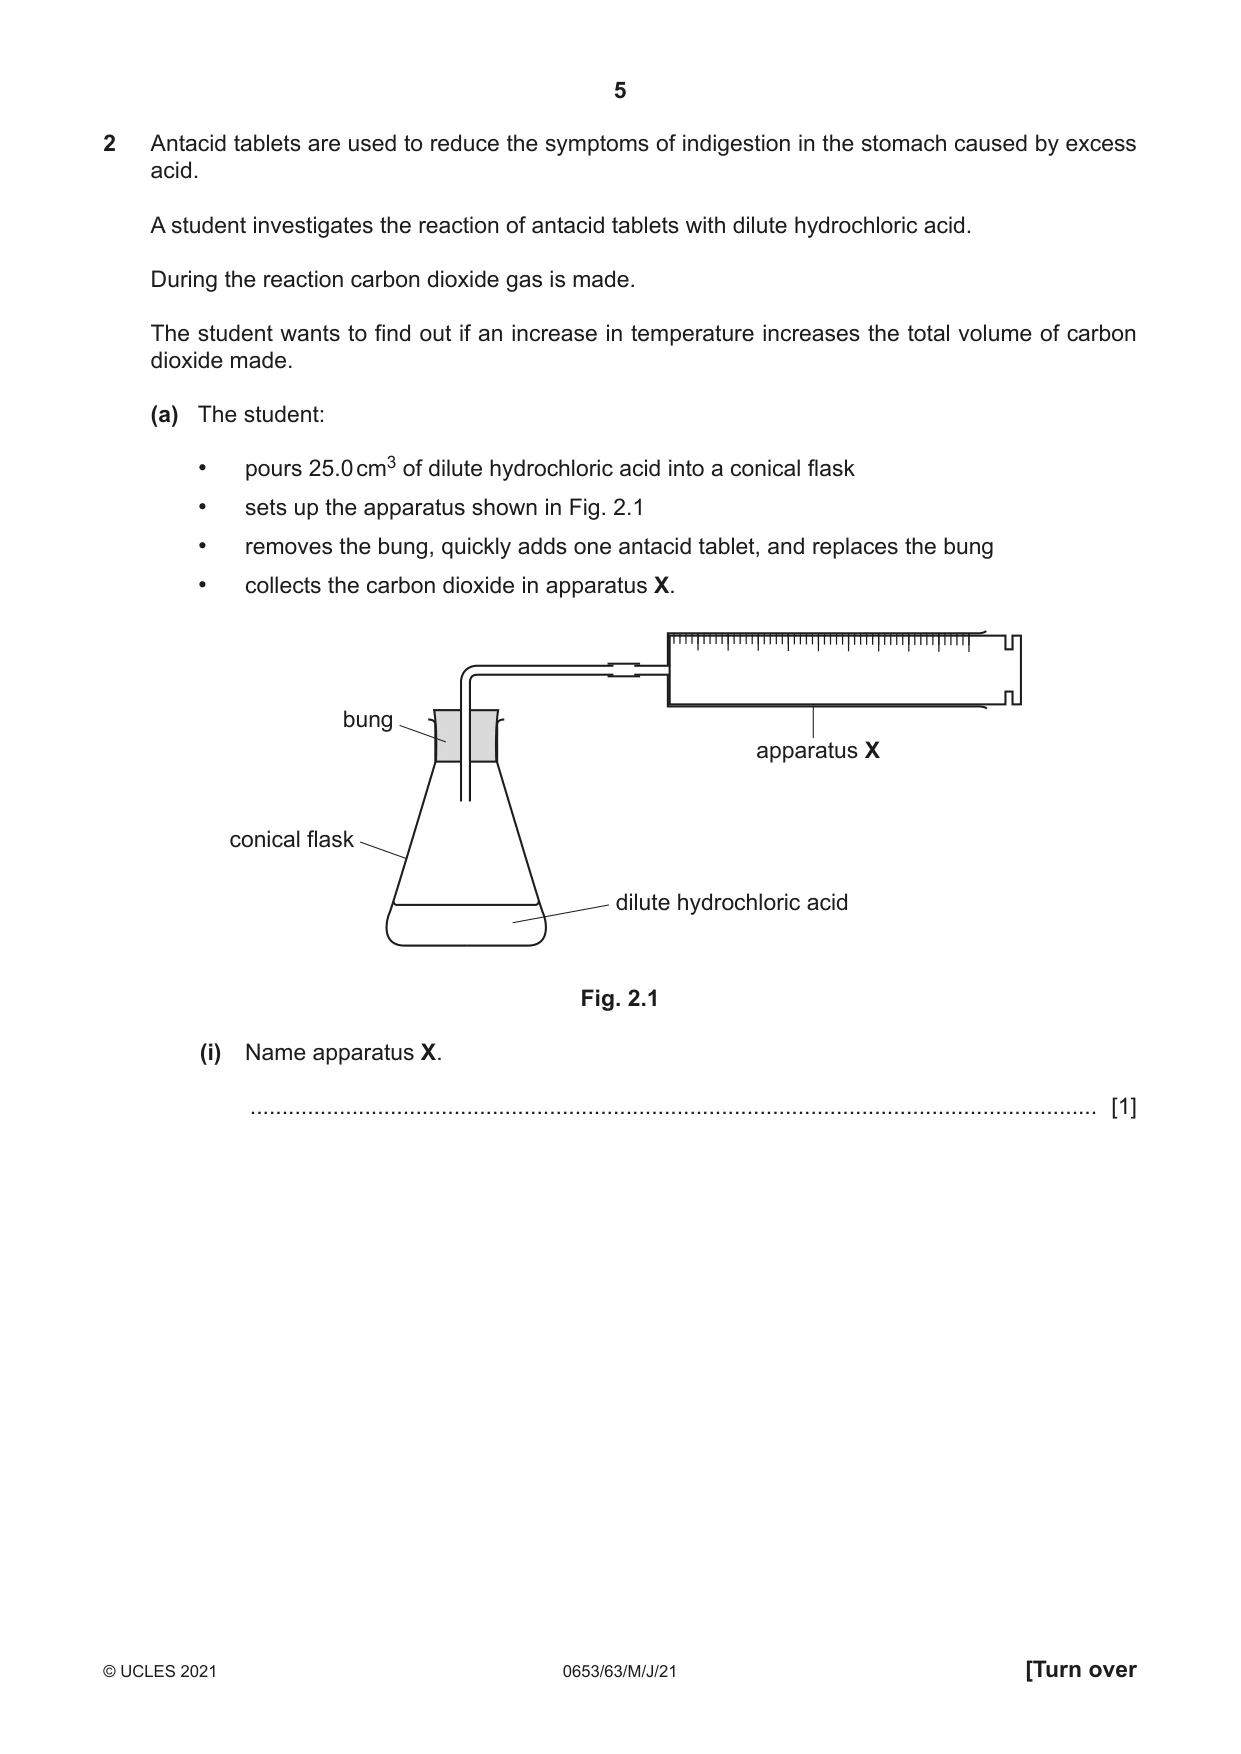
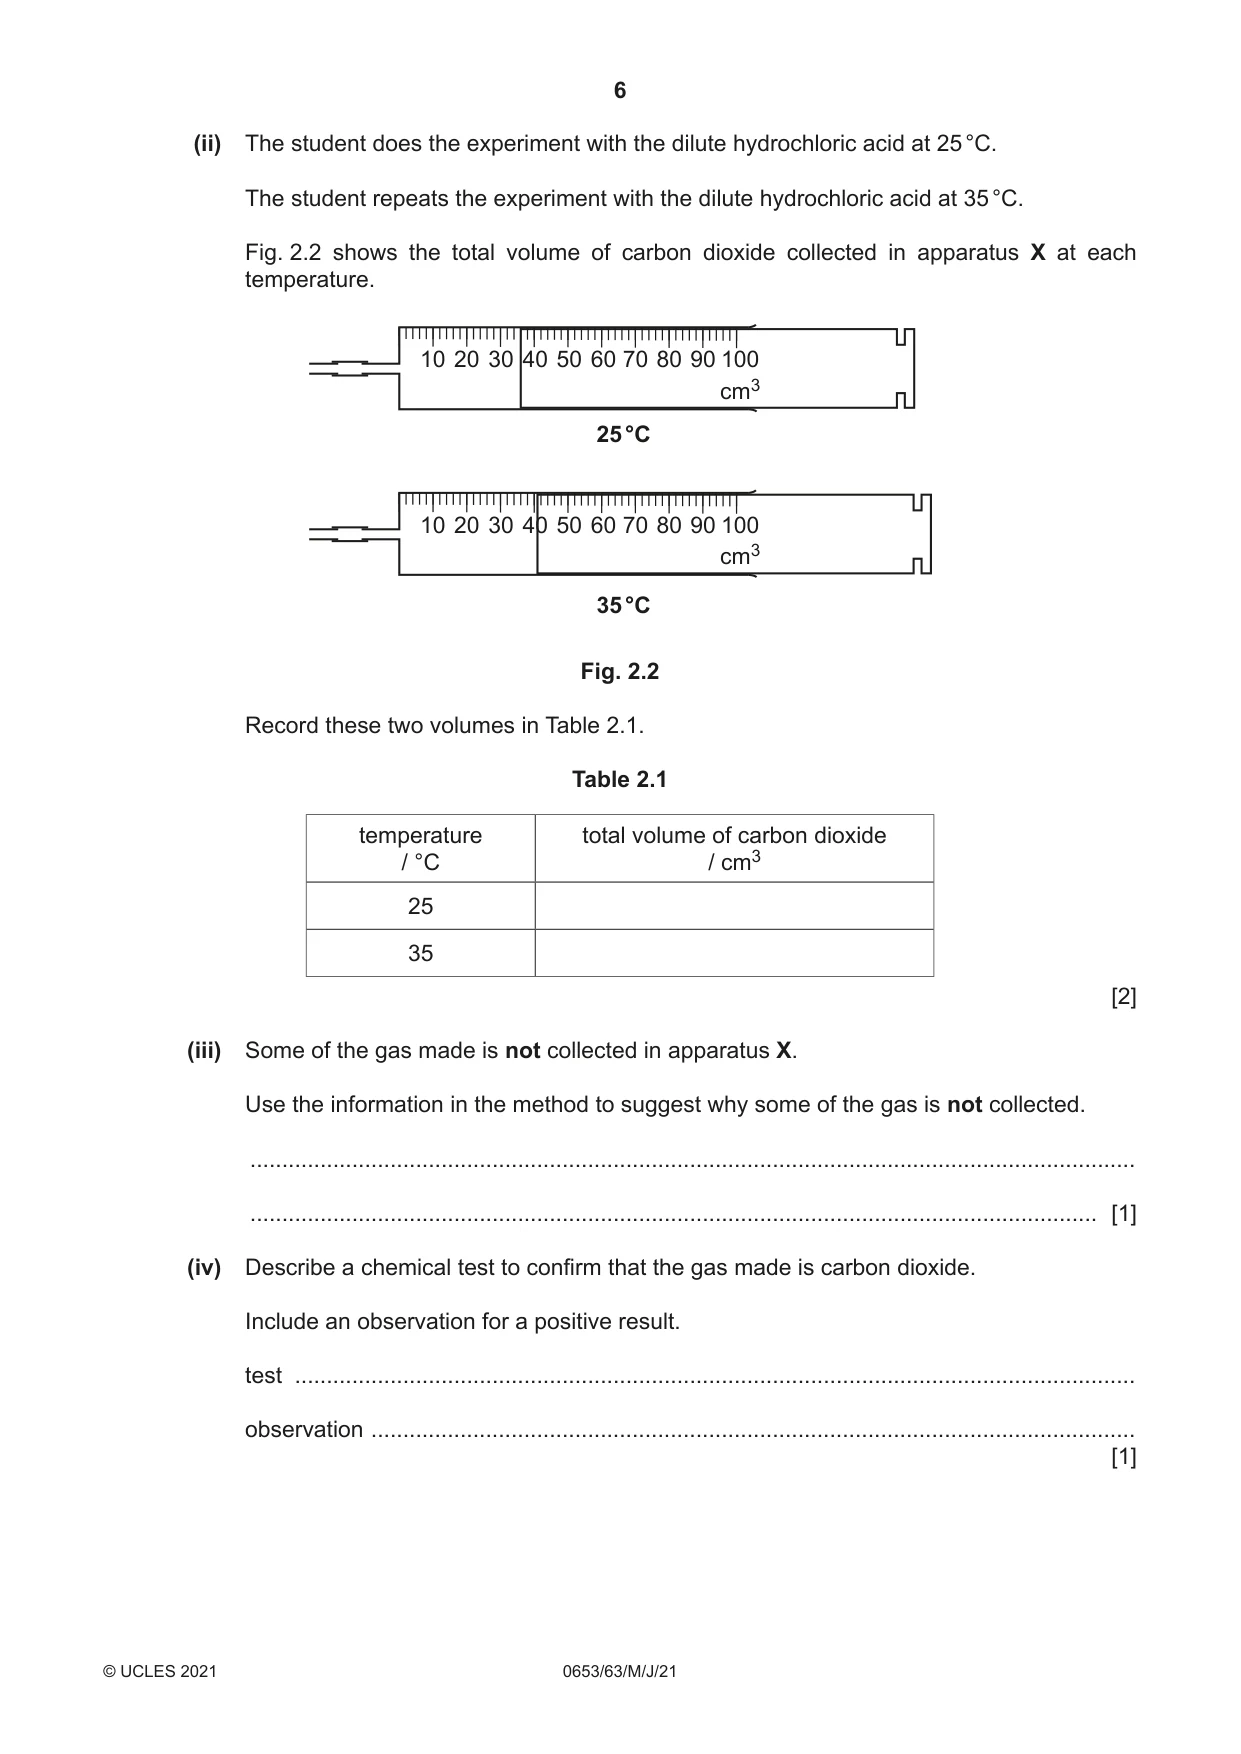
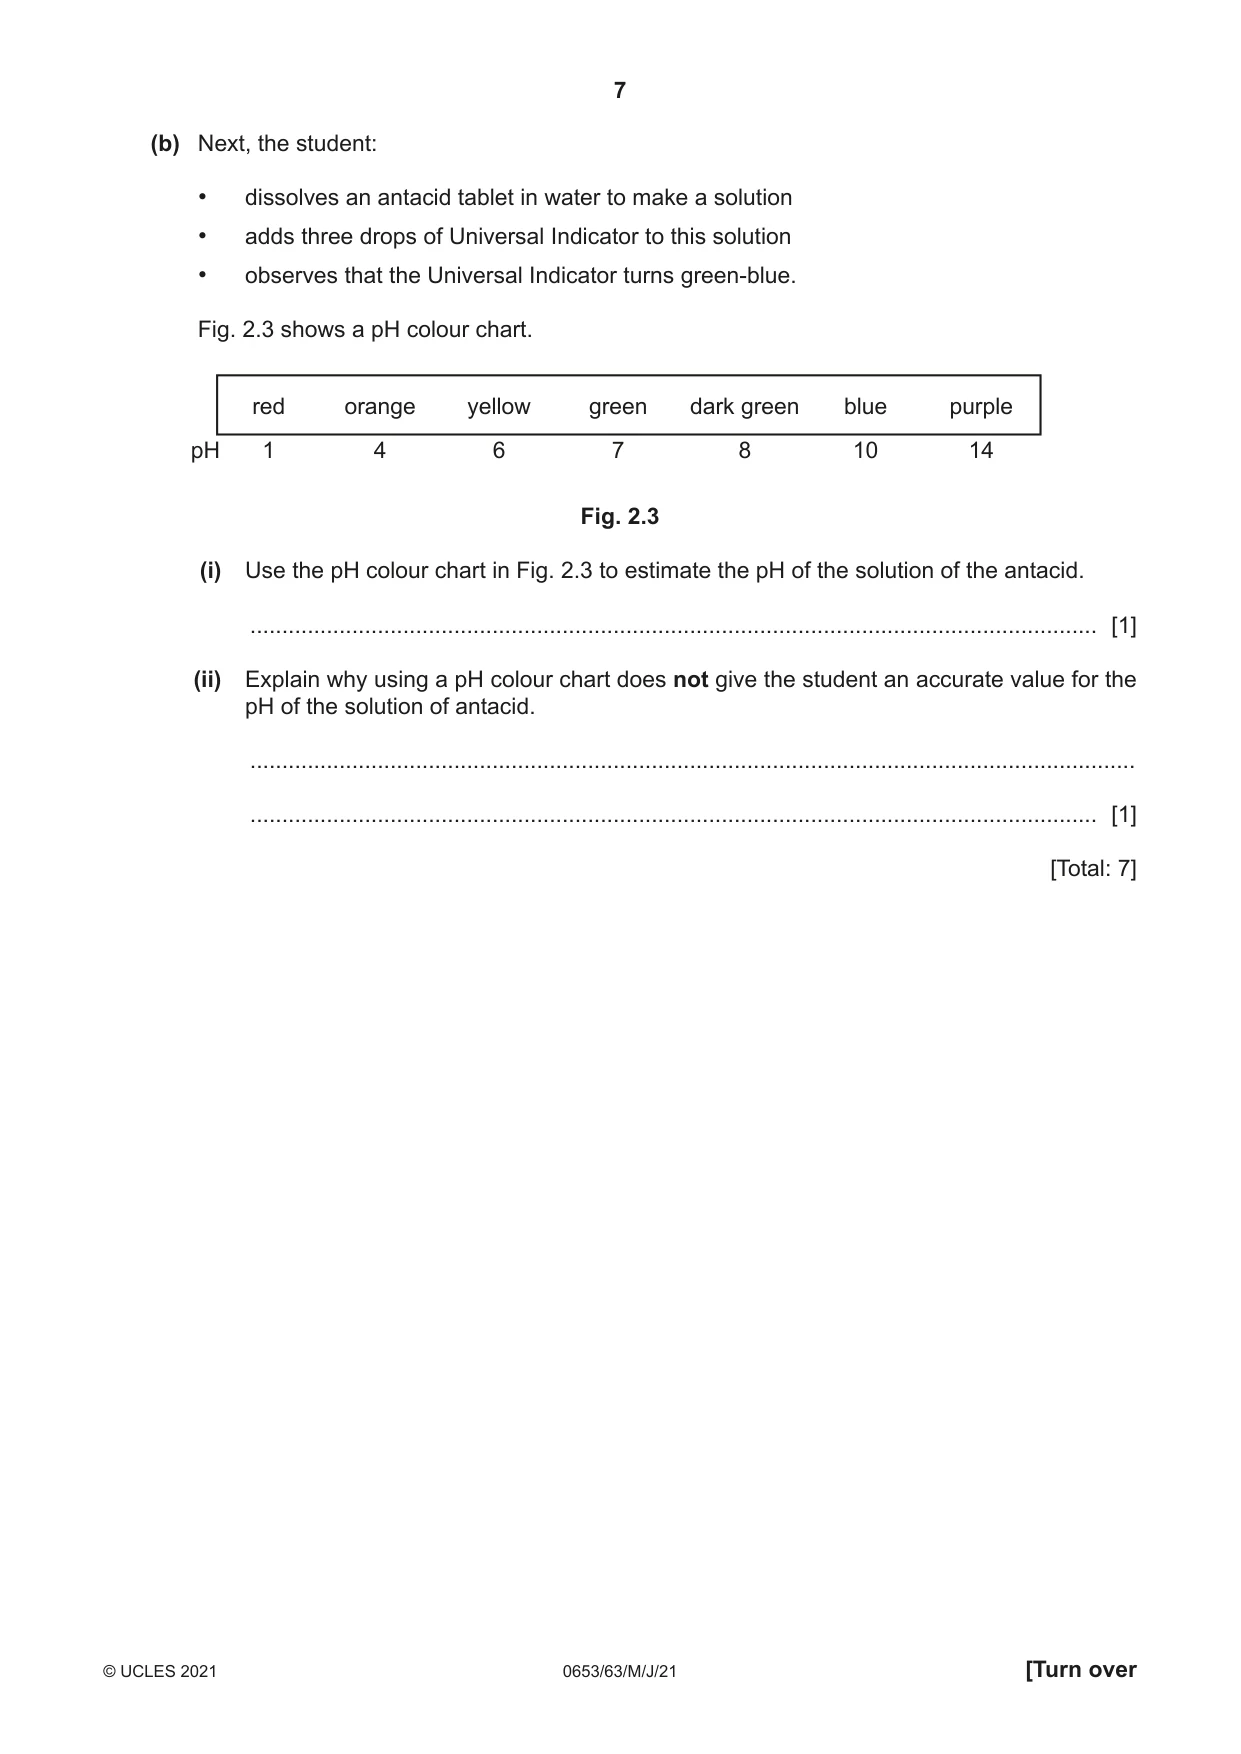
2 Antacid tablets are used to reduce the symptoms of indigestion in the stomach caused by excess acid. A student investigates the reaction of antacid tablets with dilute hydrochloric acid. During the reaction carbon dioxide gas is made. The student wants to find out if an increase in temperature increases the total volume of carbon dioxide made. (a) The student: • pours 25.0 cm3 of dilute hydrochloric acid into a conical flask • sets up the apparatus shown in Fig. 2.1 • removes the bung, quickly adds one antacid tablet, and replaces the bung • collects the carbon dioxide in apparatus X. bung apparatus X conical flask dilute hydrochloric acid Fig. 2.1 (i) Name apparatus X. ..................................................................................................................................... [1] (ii) The student does the experiment with the dilute hydrochloric acid at 25 °C. The student repeats the experiment with the dilute hydrochloric acid at 35 °C. Fig. 2.2 shows the total volume of carbon dioxide collected in apparatus X at each temperature. 10 20 30 40 50 60 70 80 90 100 cm3 25 °C 10 20 30 40 50 60 70 80 90 100 cm3 35 °C Fig. 2.2 Record these two volumes in Table 2.1. Table 2.1 temperature total volume of carbon dioxide / °C / cm3 25 35 [2] (iii) Some of the gas made is not collected in apparatus X. Use the information in the method to suggest why some of the gas is not collected. ........................................................................................................................................... ..................................................................................................................................... [1] (iv) Describe a chemical test to confirm that the gas made is carbon dioxide. Include an observation for a positive result. test .................................................................................................................................... observation ........................................................................................................................ [1] (b) Next, the student: • dissolves an antacid tablet in water to make a solution • adds three drops of Universal Indicator to this solution • observes that the Universal Indicator turns green-blue. Fig. 2.3 shows a pH colour chart. red orange yellow green dark green blue purple pH 1 4 6 7 8 10 14 Fig. 2.3 (i) Use the pH colour chart in Fig. 2.3 to estimate the pH of the solution of the antacid. ..................................................................................................................................... [1] (ii) Explain why using a pH colour chart does not give the student an accurate value for the pH of the solution of antacid. ........................................................................................................................................... ..................................................................................................................................... [1] [Total: 7]
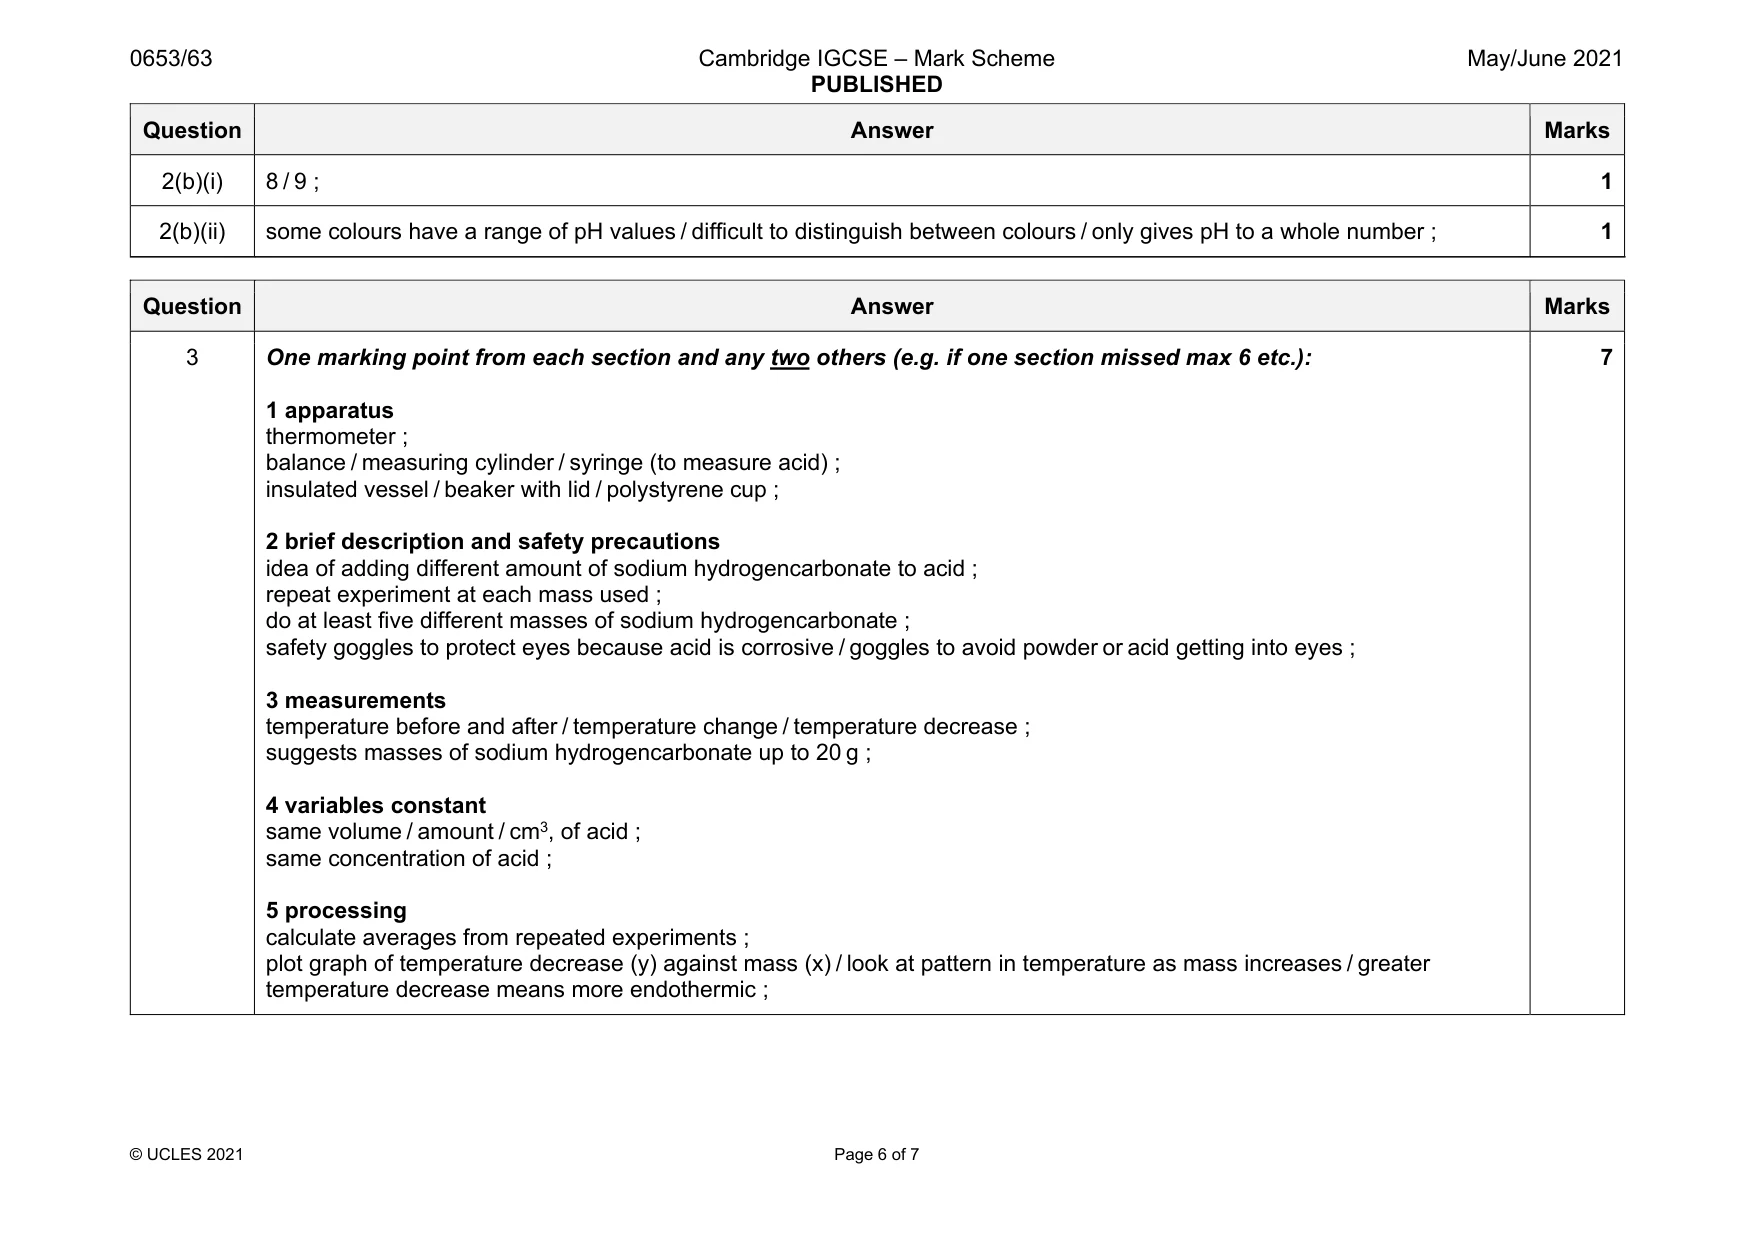
Mark scheme: 2(a)(i) gas syringe ; 1 2(a)(ii) (at 25 °C) 36 (cm3) ; (at 35 °C) 41 (cm3) ; 2 2(a)(iii) idea that gas escapes before the bung is placed in the conical flask ; 1 2(a)(iv) limewater AND turns milky ; 1 Question Answer Marks 2(b)(i) 8 / 9 ; 1 2(b)(ii) some colours have a range of pH values / difficult to distinguish between colours / only gives pH to a whole number ; 1
Q3 · Sodium hydrogencarbonate is a white solid that reacts with dilute nitric acid as shown in…
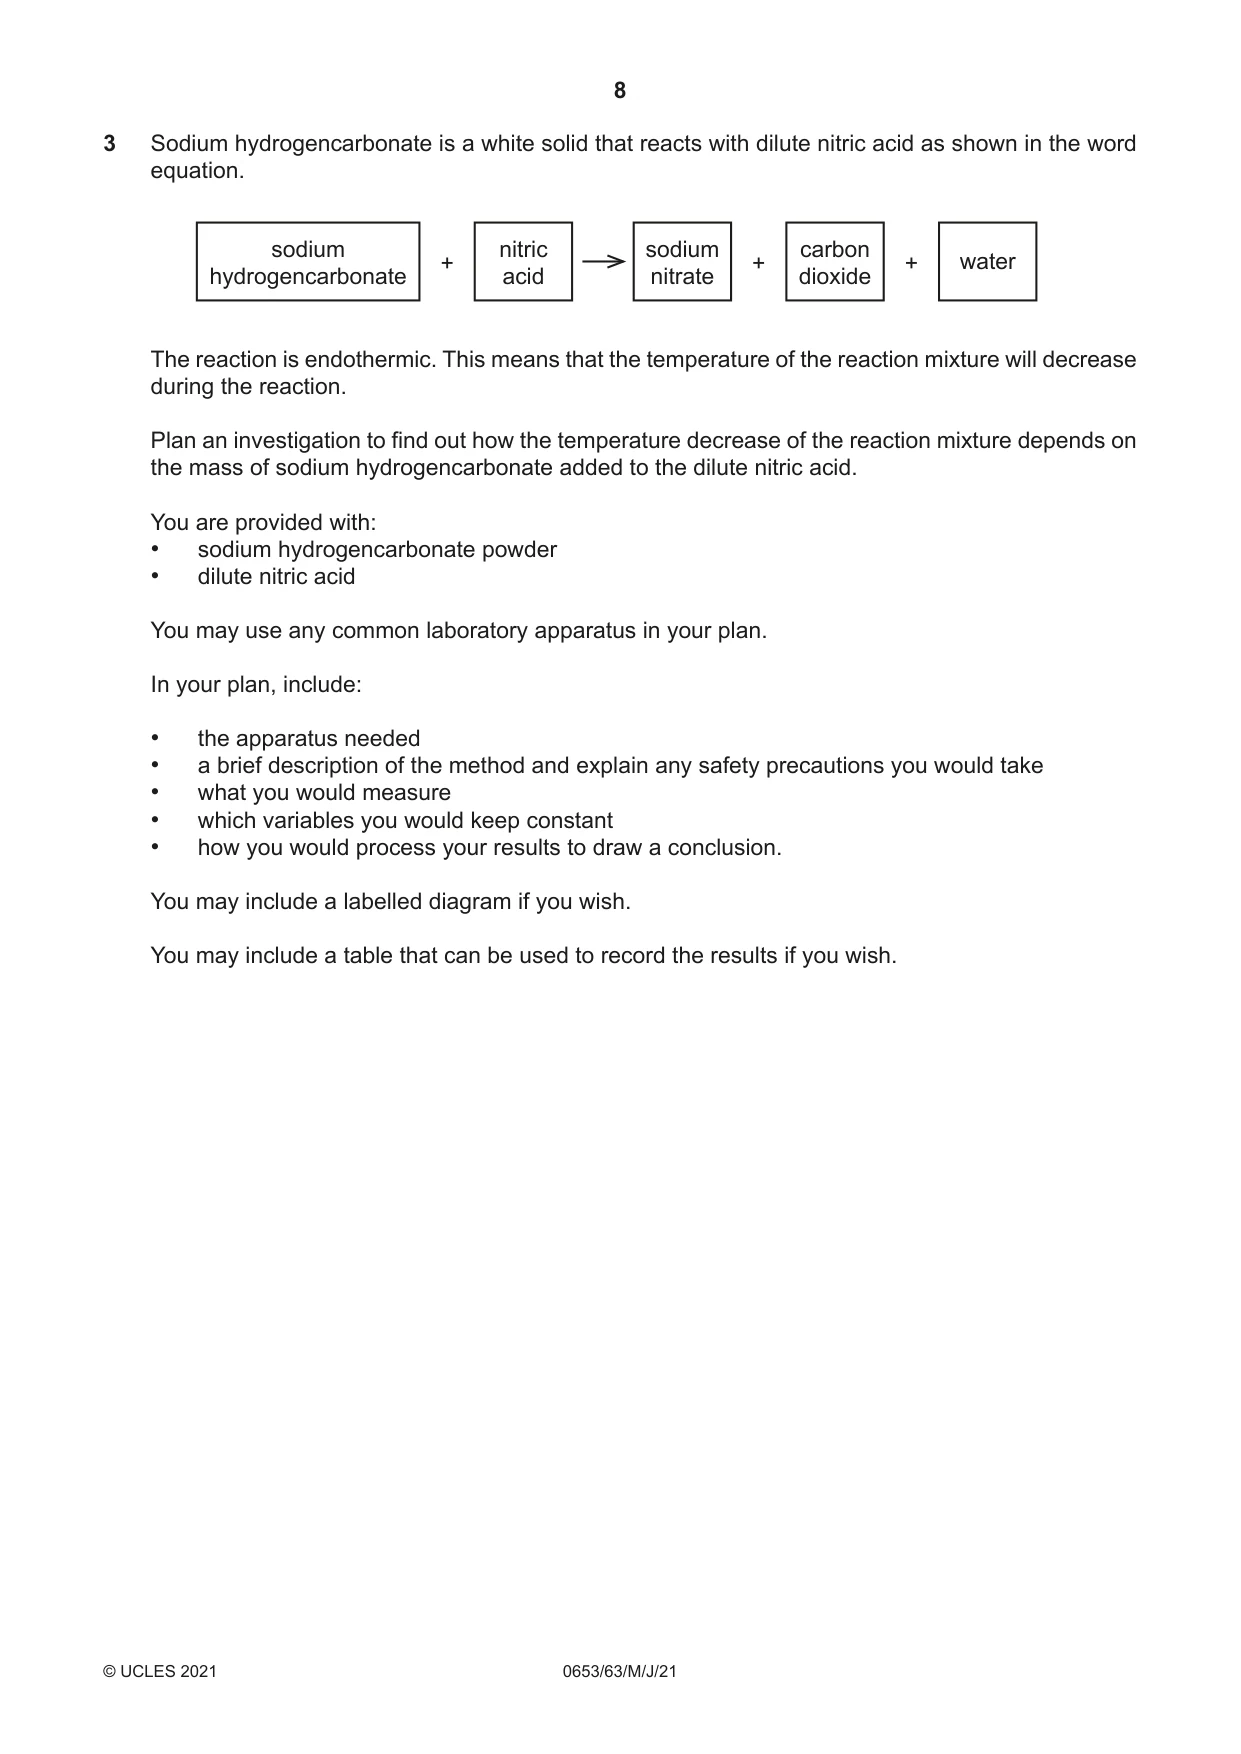
3 Sodium hydrogencarbonate is a white solid that reacts with dilute nitric acid as shown in the word equation. sodium nitric sodium carbon + + + water hydrogencarbonate acid nitrate dioxide The reaction is endothermic. This means that the temperature of the reaction mixture will decrease during the reaction. Plan an investigation to find out how the temperature decrease of the reaction mixture depends on the mass of sodium hydrogencarbonate added to the dilute nitric acid. You are provided with: • sodium hydrogencarbonate powder • dilute nitric acid You may use any common laboratory apparatus in your plan. In your plan, include: • the apparatus needed • a brief description of the method and explain any safety precautions you would take • what you would measure • which variables you would keep constant • how you would process your results to draw a conclusion. You may include a labelled diagram if you wish. You may include a table that can be used to record the results if you wish. .......................................................................................................................................................... .......................................................................................................................................................... .......................................................................................................................................................... .......................................................................................................................................................... .......................................................................................................................................................... .......................................................................................................................................................... .......................................................................................................................................................... .......................................................................................................................................................... .......................................................................................................................................................... .......................................................................................................................................................... .......................................................................................................................................................... .......................................................................................................................................................... .......................................................................................................................................................... .................................................................................................................................................... [7]
Mark scheme: 3 One marking point from each section and any two others (e.g. if one section missed max 6 etc.): 1 apparatus thermometer ; balance / measuring cylinder / syringe (to measure acid) ; insulated vessel / beaker with lid / polystyrene cup ; 2 brief description and safety precautions idea of adding different amount of sodium hydrogencarbonate to acid ; repeat experiment at each mass used ; do at least five different masses of sodium hydrogencarbonate ; safety goggles to protect eyes because acid is corrosive / goggles to avoid powder or acid getting into eyes ; 3 measurements temperature before and after / temperature change / temperature decrease ; suggests masses of sodium hydrogencarbonate up to 20 g ; 4 variables constant same volume / amount / cm3, of acid ; same concentration of acid ; 5 processing calculate averages from repeated experiments ; plot graph of temperature decrease (y) against mass (x) / look at pattern in temperature as mass increases / greater temperature decrease means more endothermic ;
Q4 · A student measures the efficiency of an electric heating element in a circuit
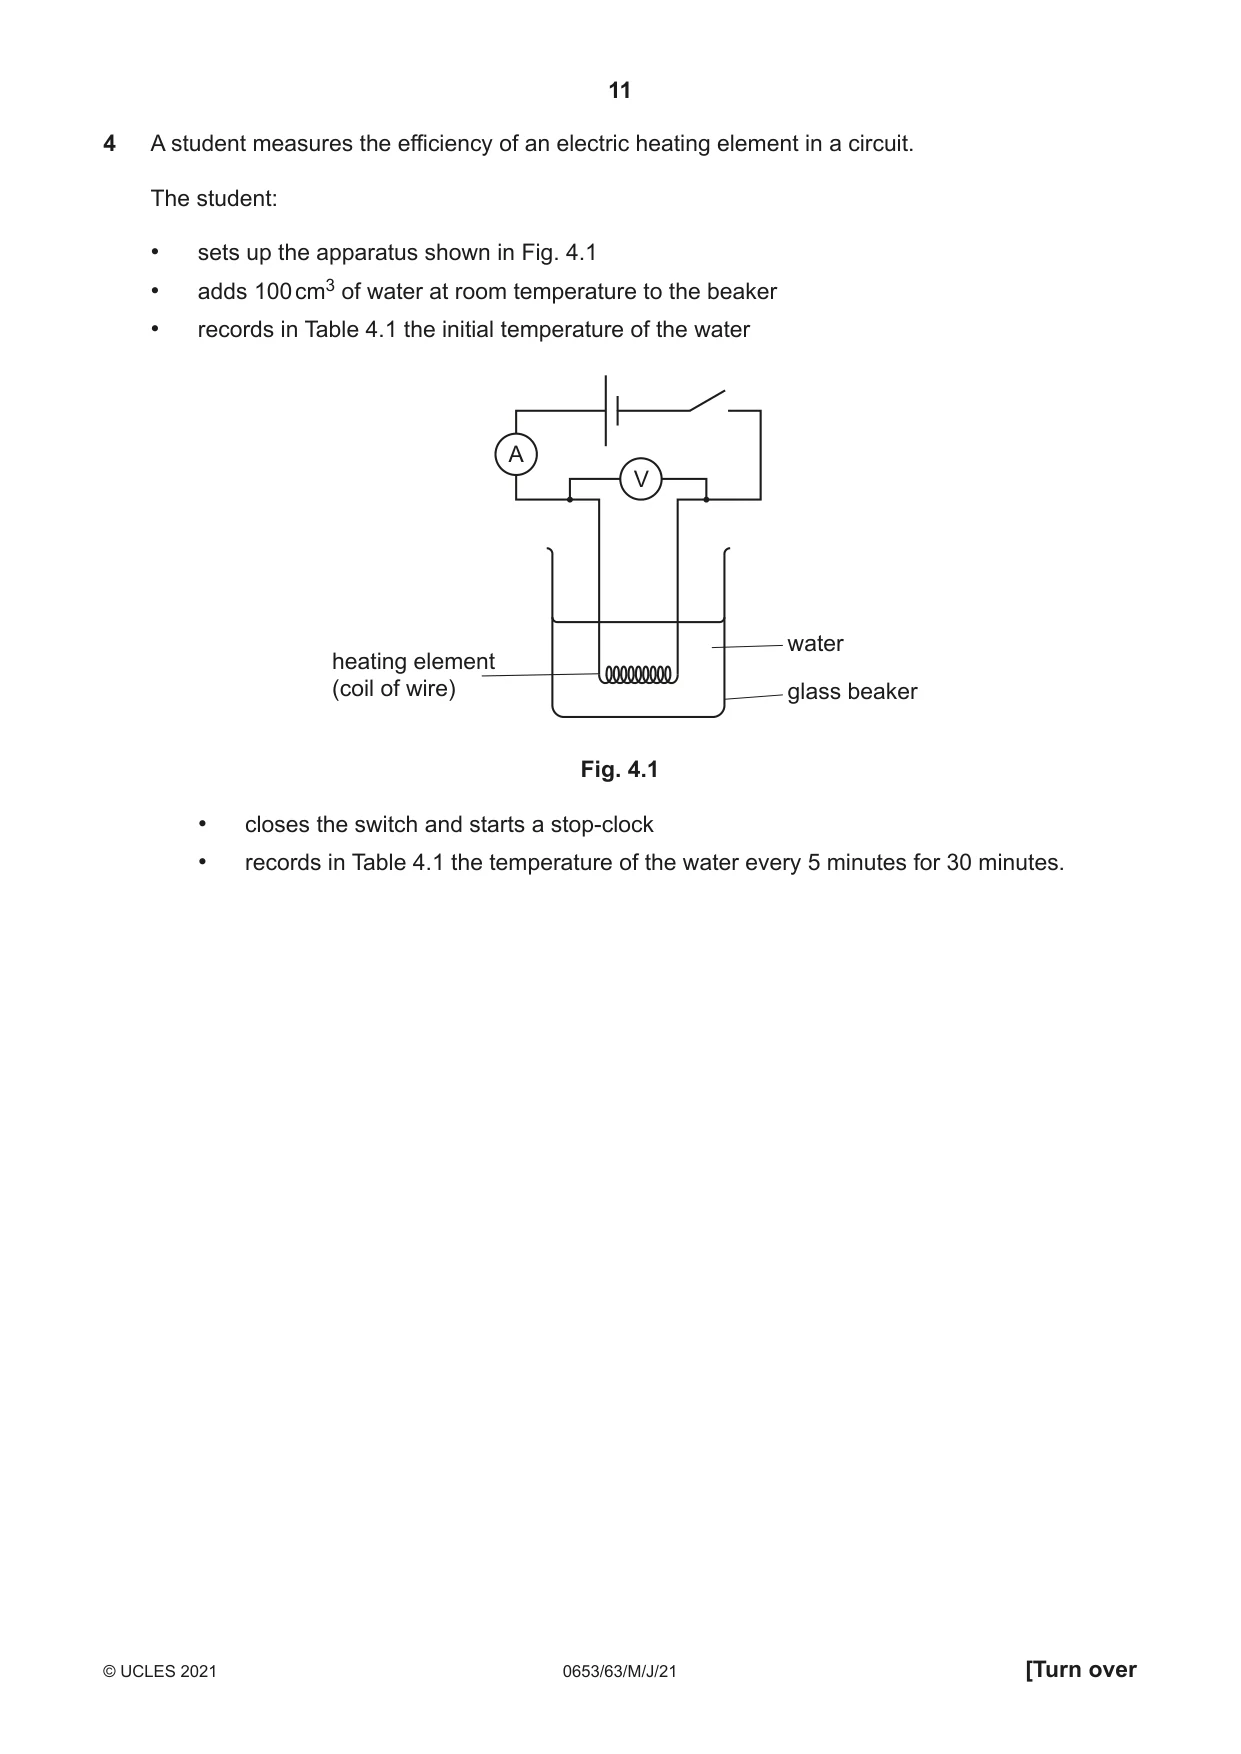
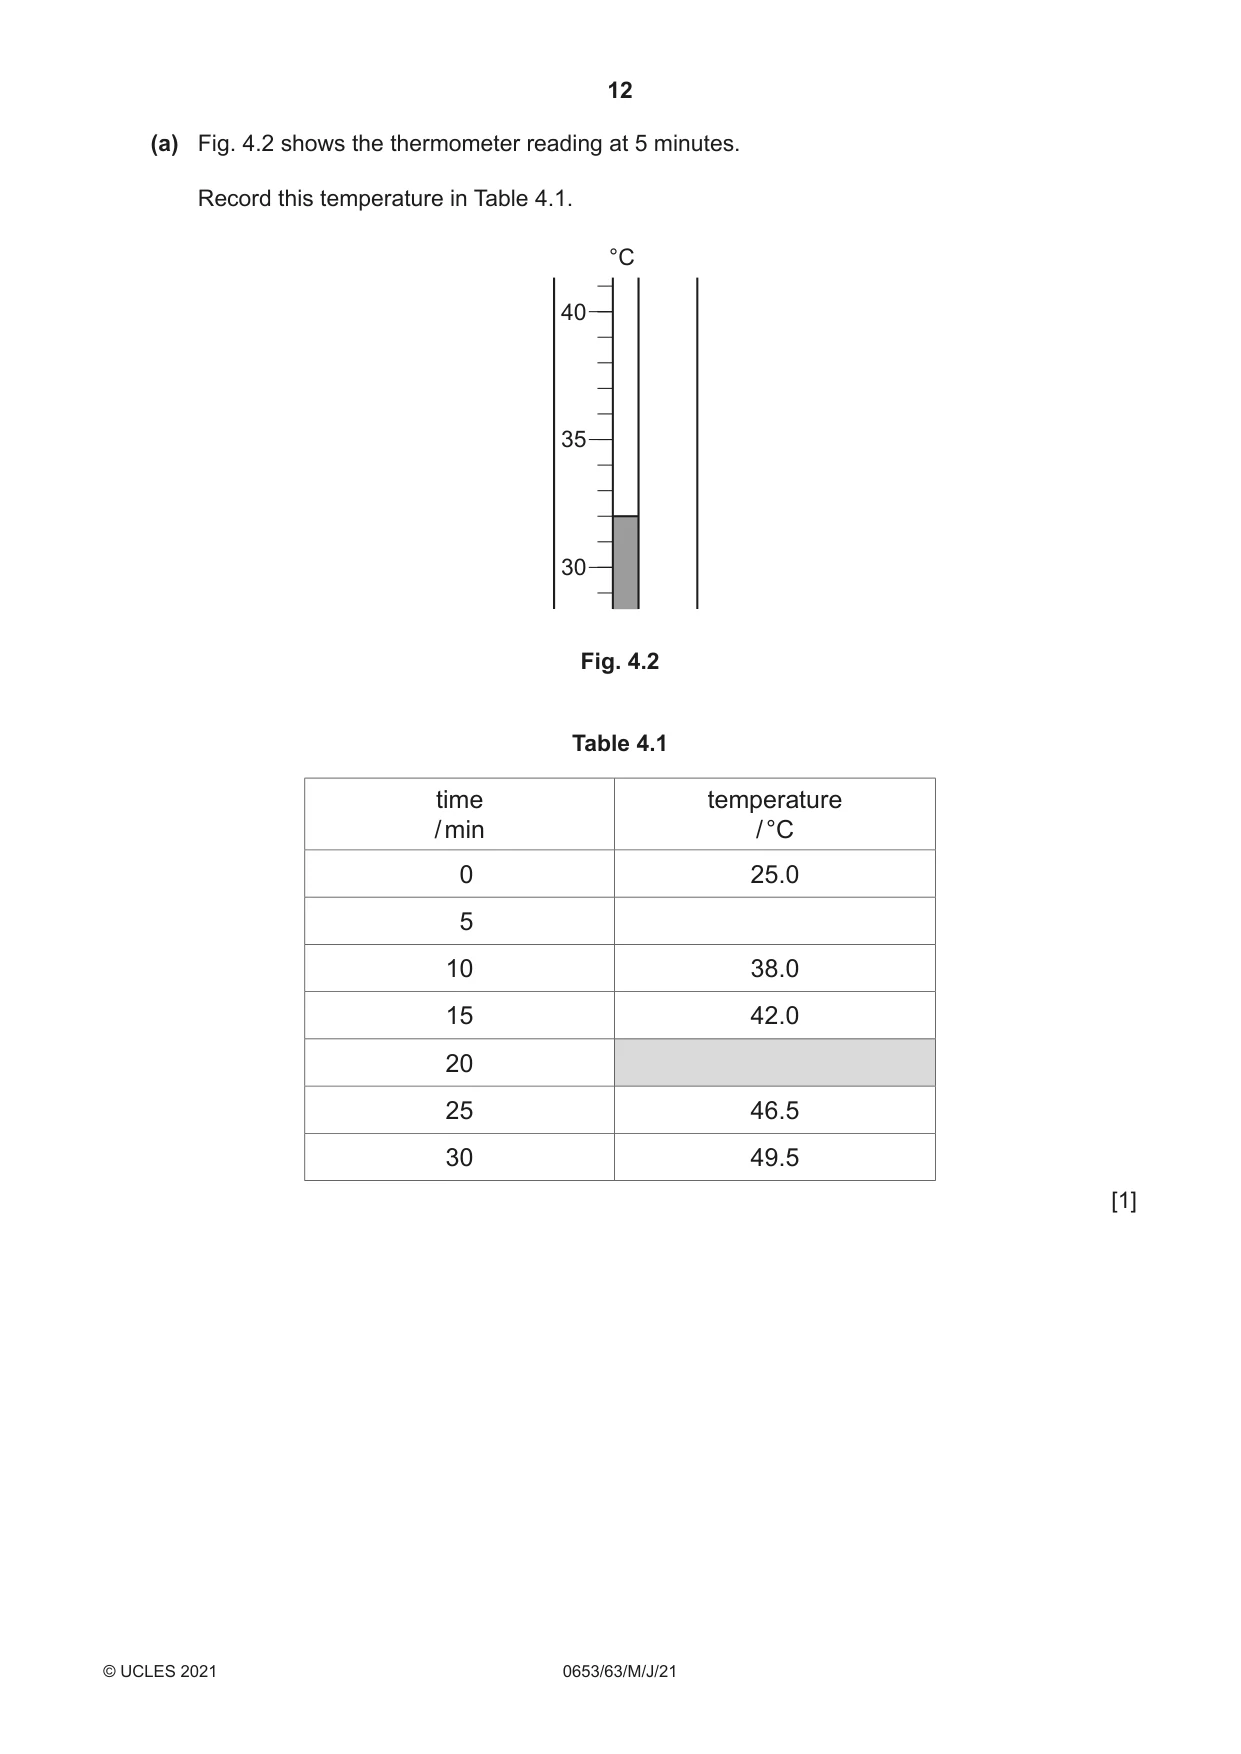
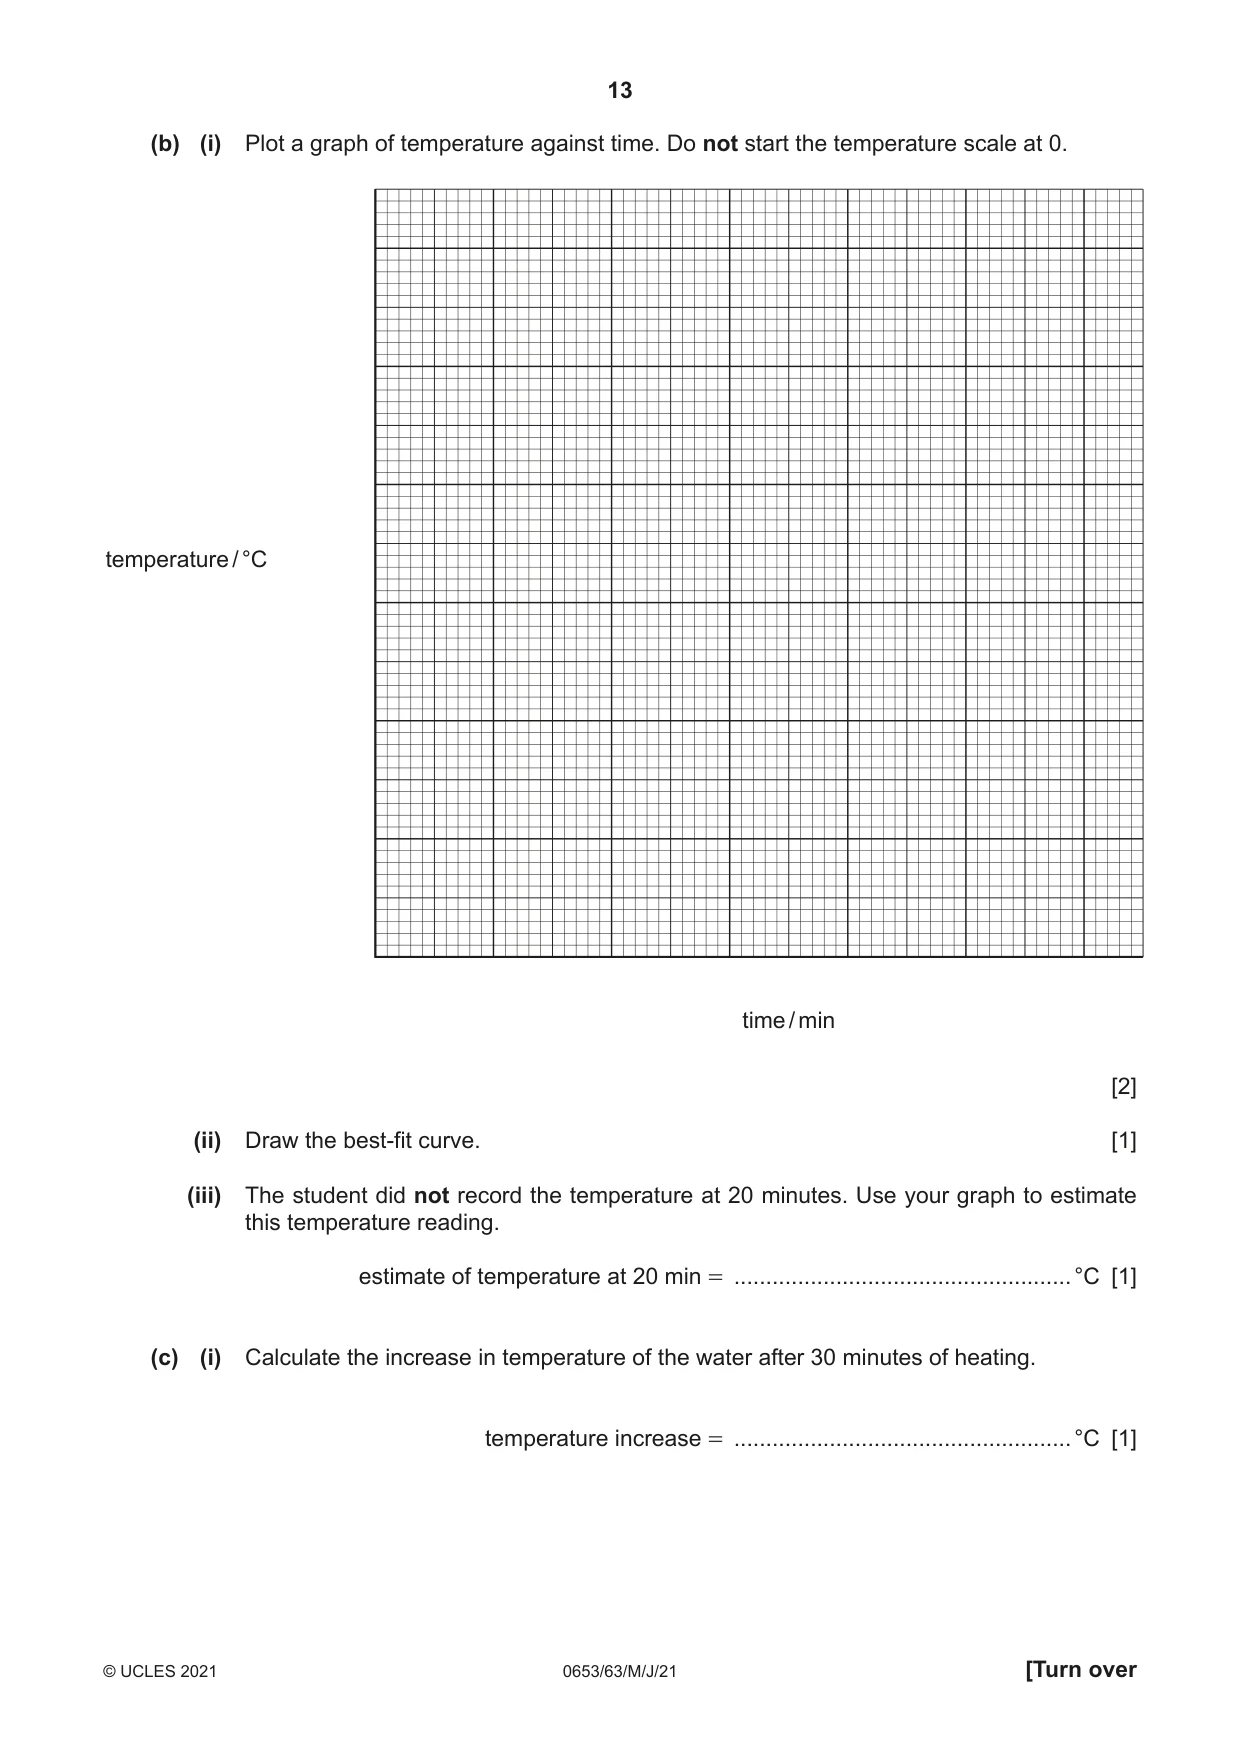
4 A student measures the efficiency of an electric heating element in a circuit. The student: • sets up the apparatus shown in Fig. 4.1 • adds 100 cm3 of water at room temperature to the beaker • records in Table 4.1 the initial temperature of the water A V water heating element (coil of wire) glass beaker Fig. 4.1 • closes the switch and starts a stop-clock • records in Table 4.1 the temperature of the water every 5 minutes for 30 minutes. (a) Fig. 4.2 shows the thermometer reading at 5 minutes. Record this temperature in Table 4.1. °C 40 35 30 Fig. 4.2 Table 4.1 time temperature / min / °C 0 25.0 5 10 38.0 15 42.0 20 25 46.5 30 49.5 [1] (b) (i) Plot a graph of temperature against time. Do not start the temperature scale at 0. temperature / °C time / min [2] (ii) Draw the best-fit curve. [1] (iii) The student did not record the temperature at 20 minutes. Use your graph to estimate this temperature reading. estimate of temperature at 20 min = .....................................................°C [1] (c) (i) Calculate the increase in temperature of the water after 30 minutes of heating. temperature increase = .....................................................°C [1]
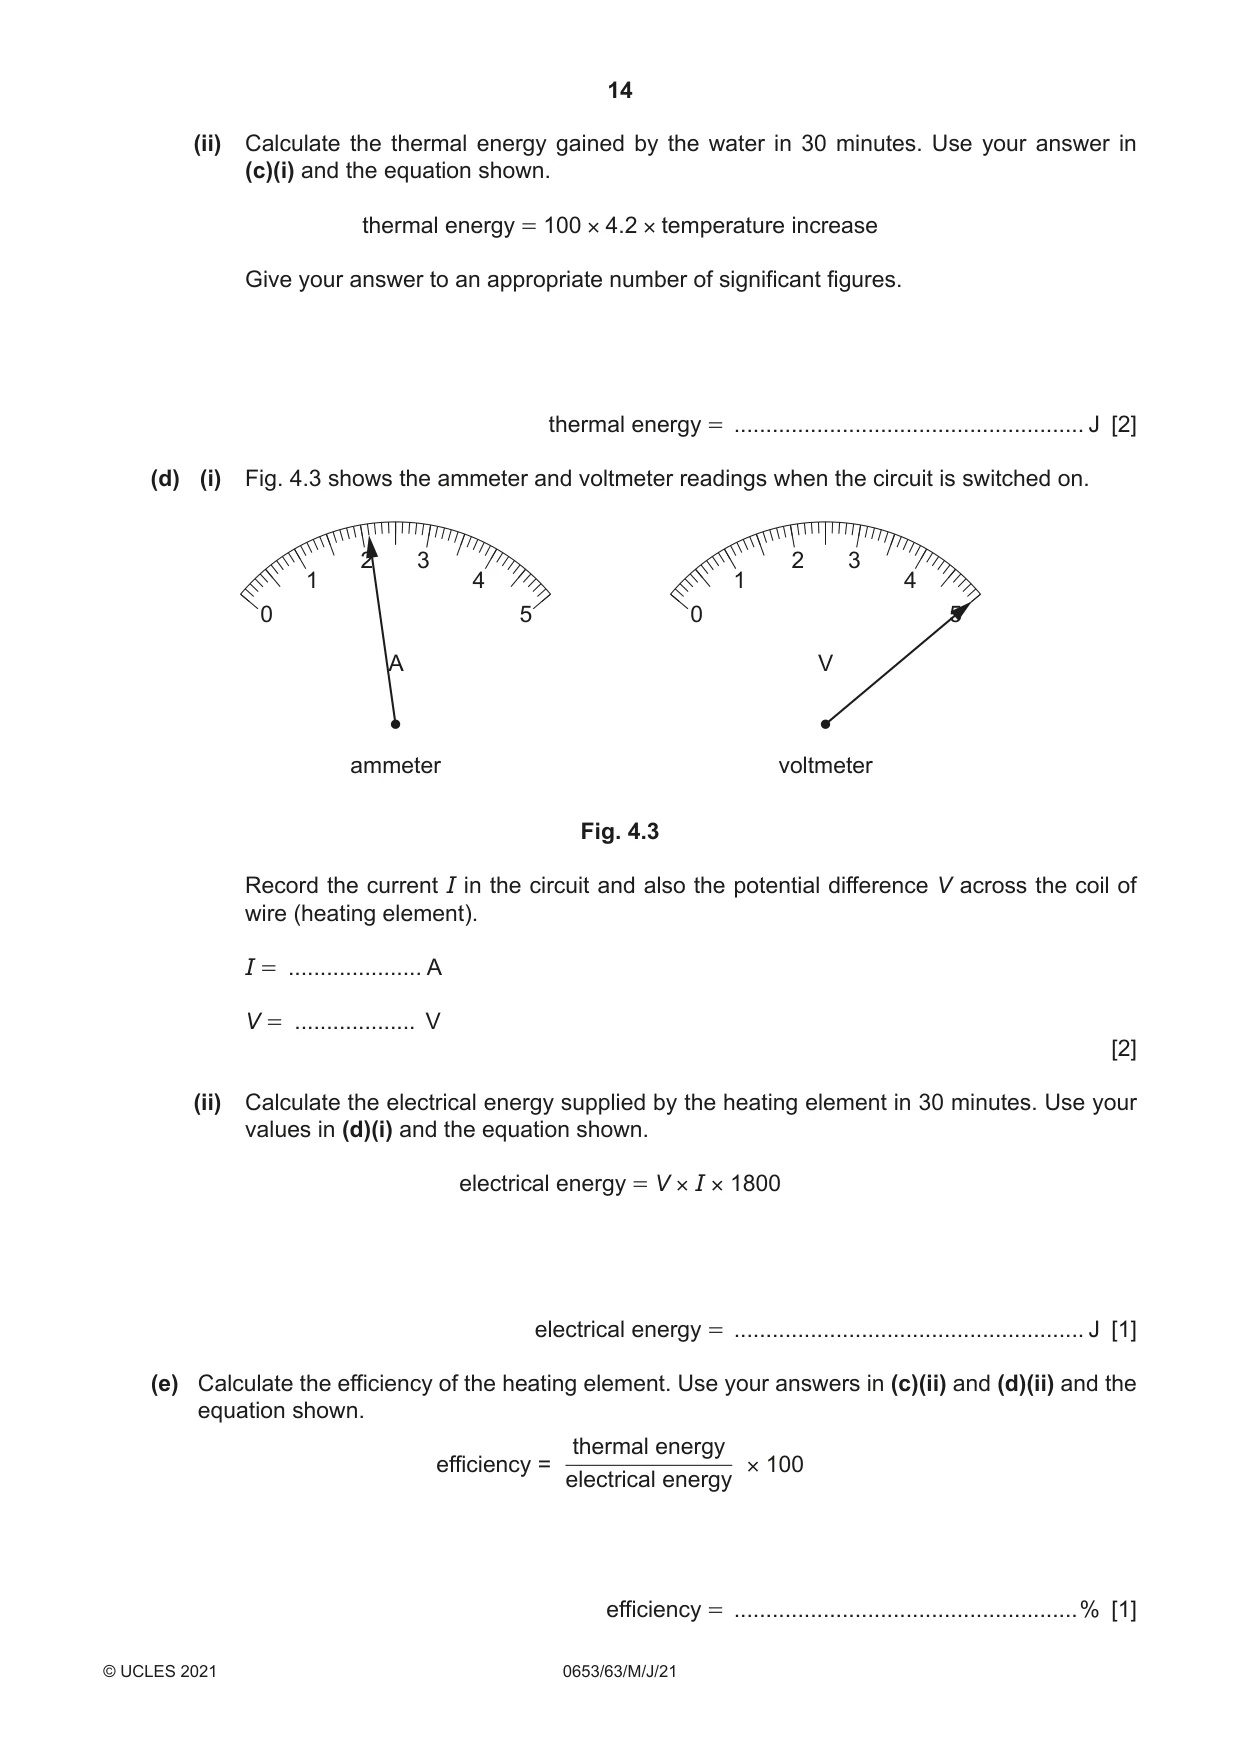
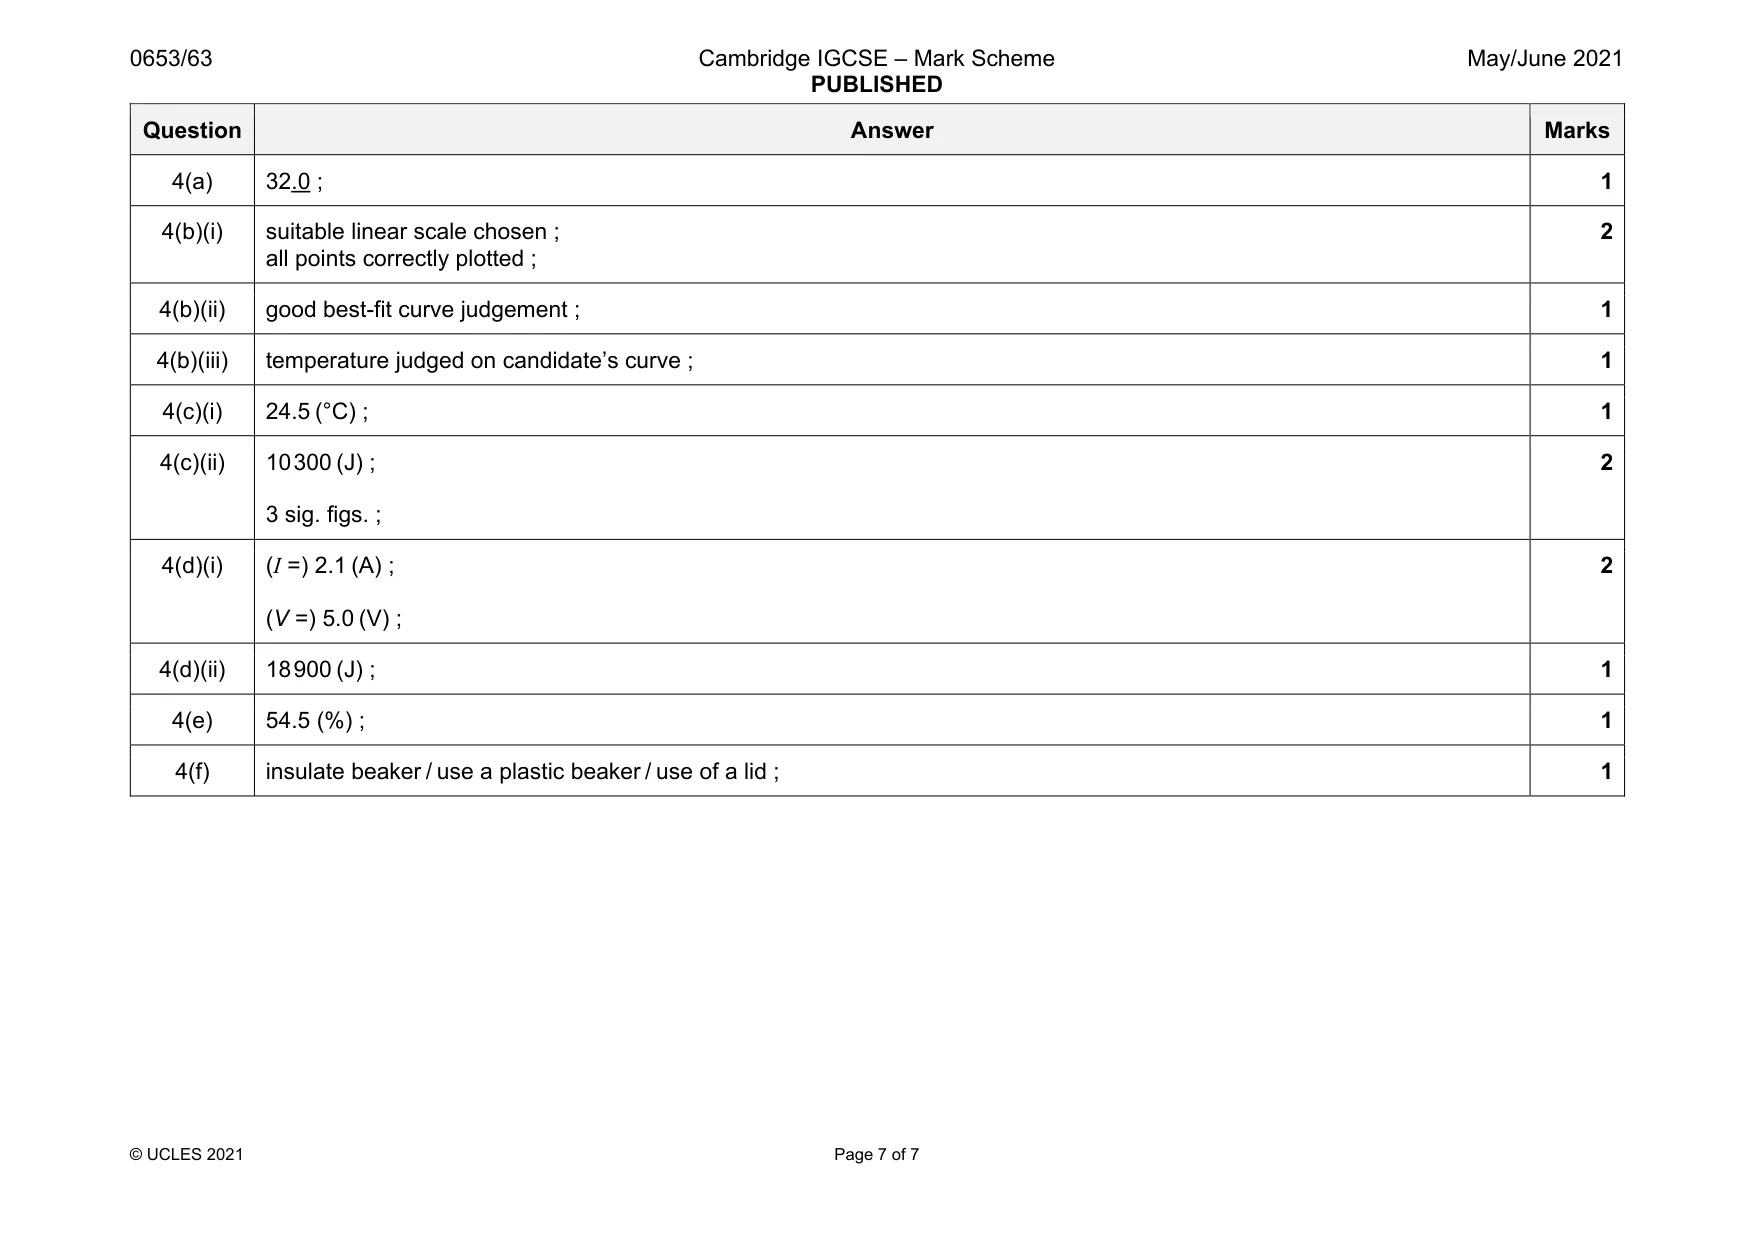
Mark scheme: 4(a) 32.0 ; 1 4(b)(i) suitable linear scale chosen ; all points correctly plotted ; 2 4(b)(ii) good best-fit curve judgement ; 1 4(b)(iii) temperature judged on candidate’s curve ; 1 4(c)(i) 24.5 (°C) ; 1 4(c)(ii) 10 300 (J) ; 3 sig. figs. ; 2 4(d)(i) (I =) 2.1 (A) ; (V =) 5.0 (V) ; 2 4(d)(ii) 18 900 (J) ; 1 4(e) 54.5 (%) ; 1 4(f) insulate beaker / use a plastic beaker / use of a lid ; 1
More questions on Physical quantities and measurement techniques
What was in this paper
The subtopics covered by these 4 questions, and how many questions each got. Open one in a new tab to see every Cambridge question on it.
What you needed in this session
Cambridge’s own grade thresholds for 2021 May/June, Paper 6 · Variant 3. A higher threshold means an easier paper — the bar moves with how the cohort did.