Cambridge IGCSE Science - Combined 0653 — 2021 May/June Paper 6 · Variant 1
0653/61/M/J/21 · 4 questions · 40 marks · ≈45 min
The question paper and its mark scheme, free to read here and free to download. This is Cambridge’s own paper, exactly as it was sat.
Question paper16 pages





Mark scheme8 pages
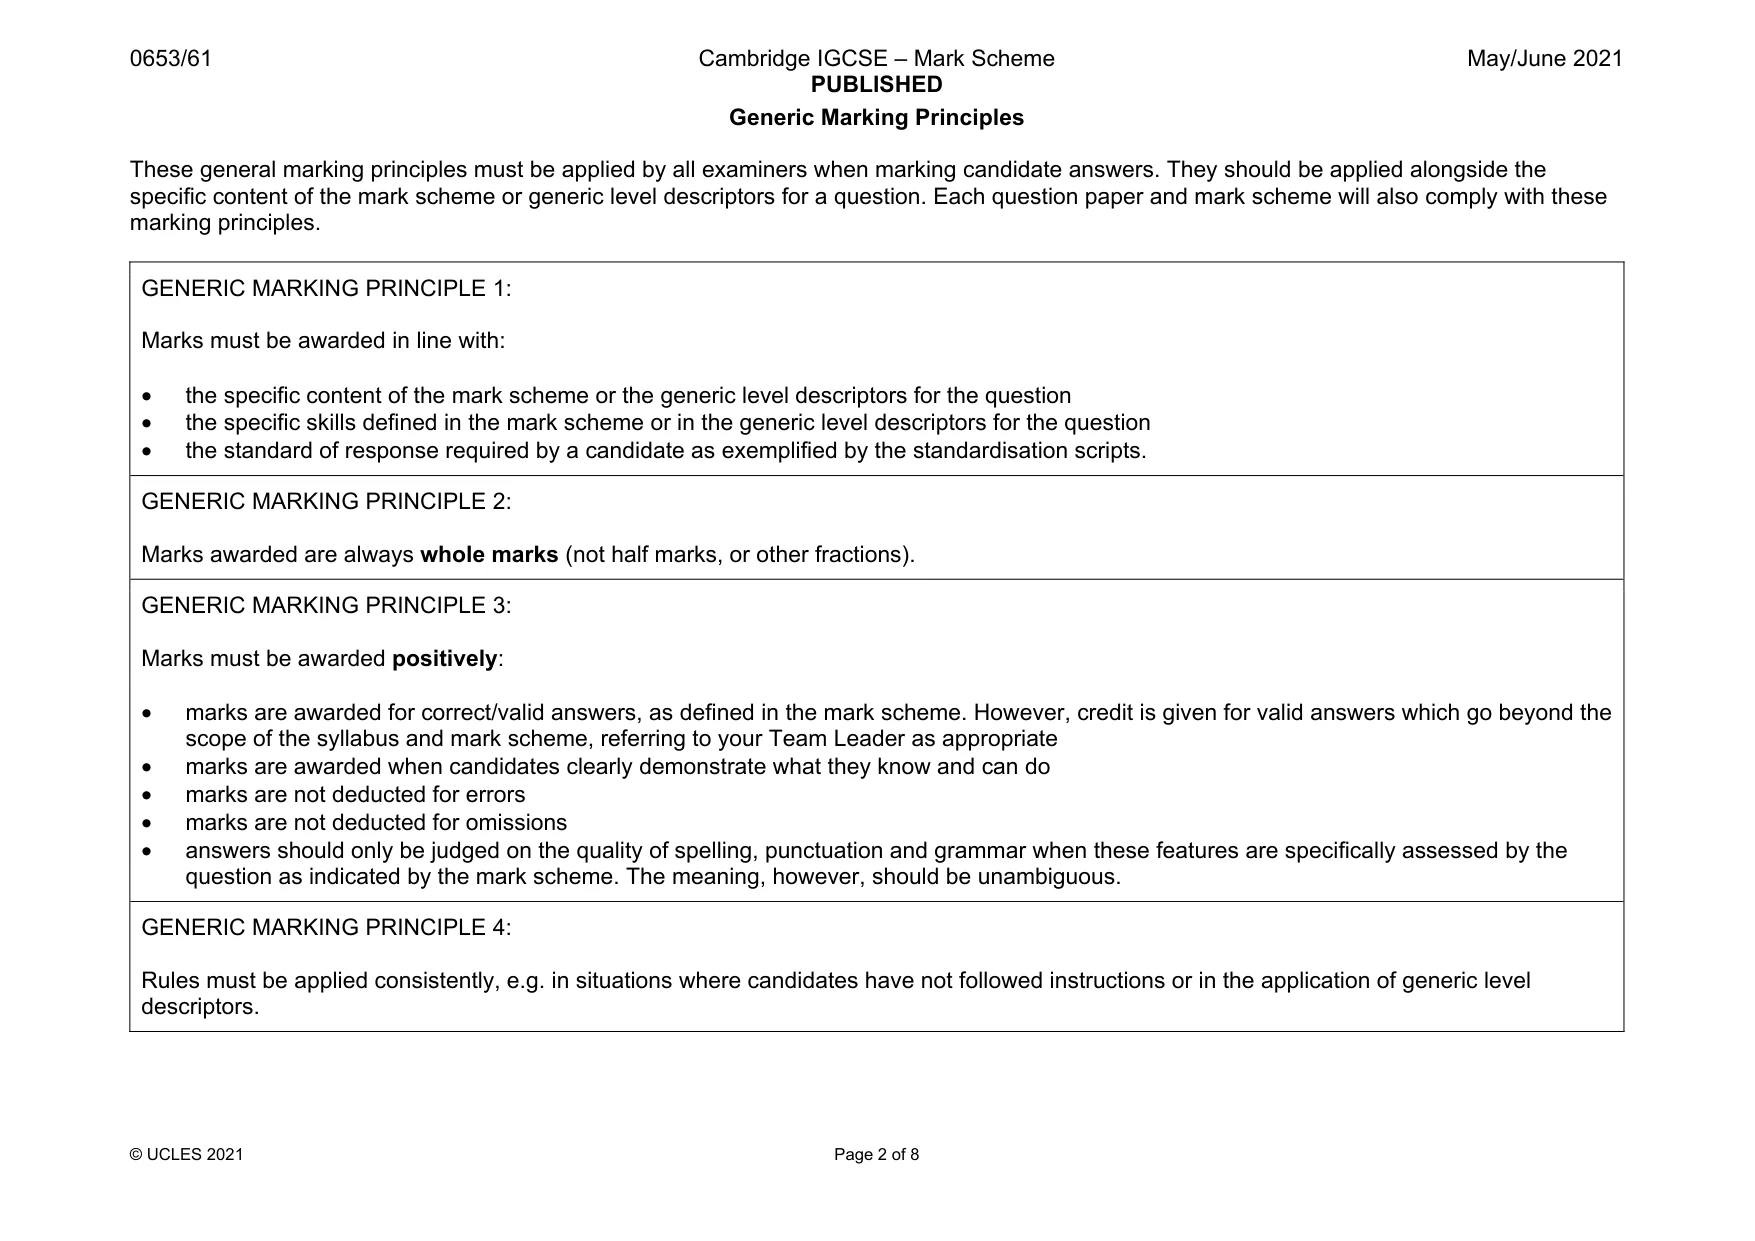
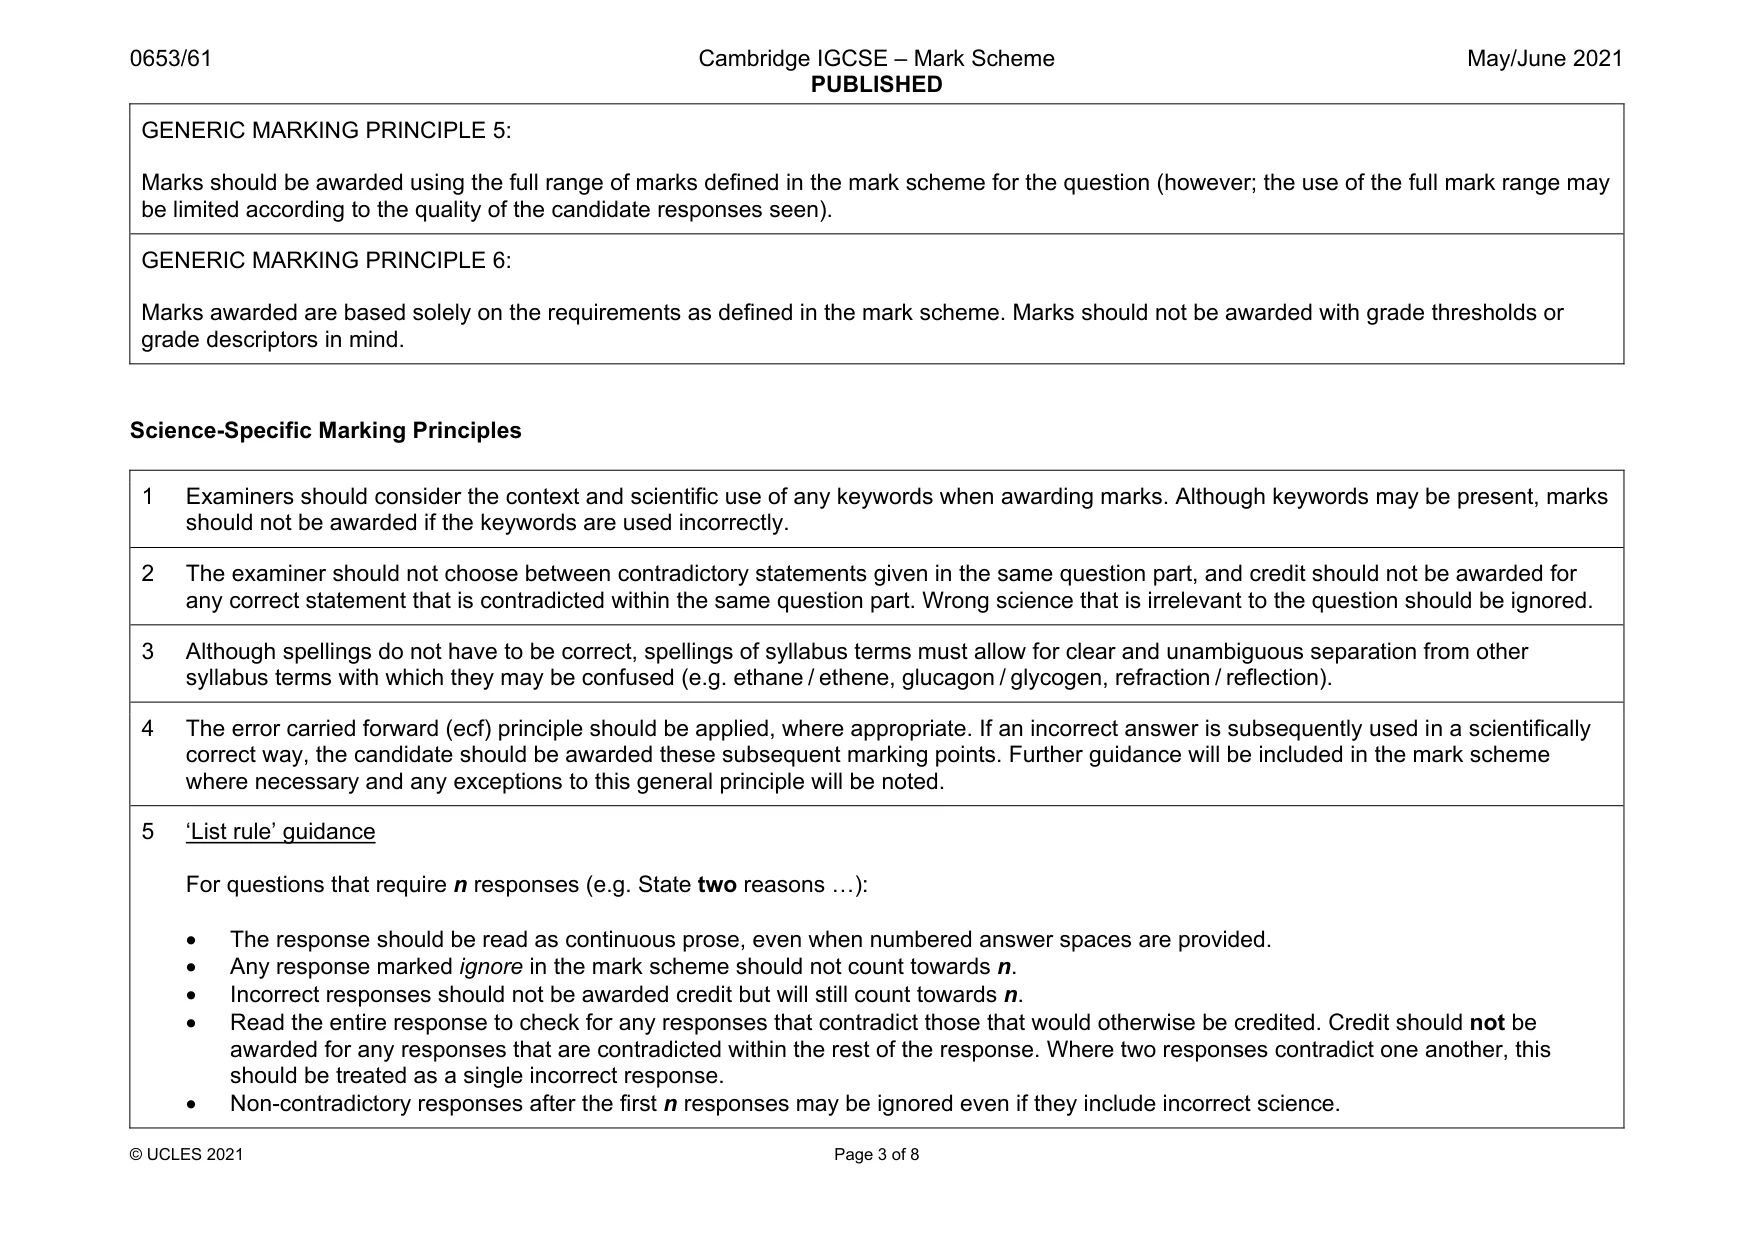
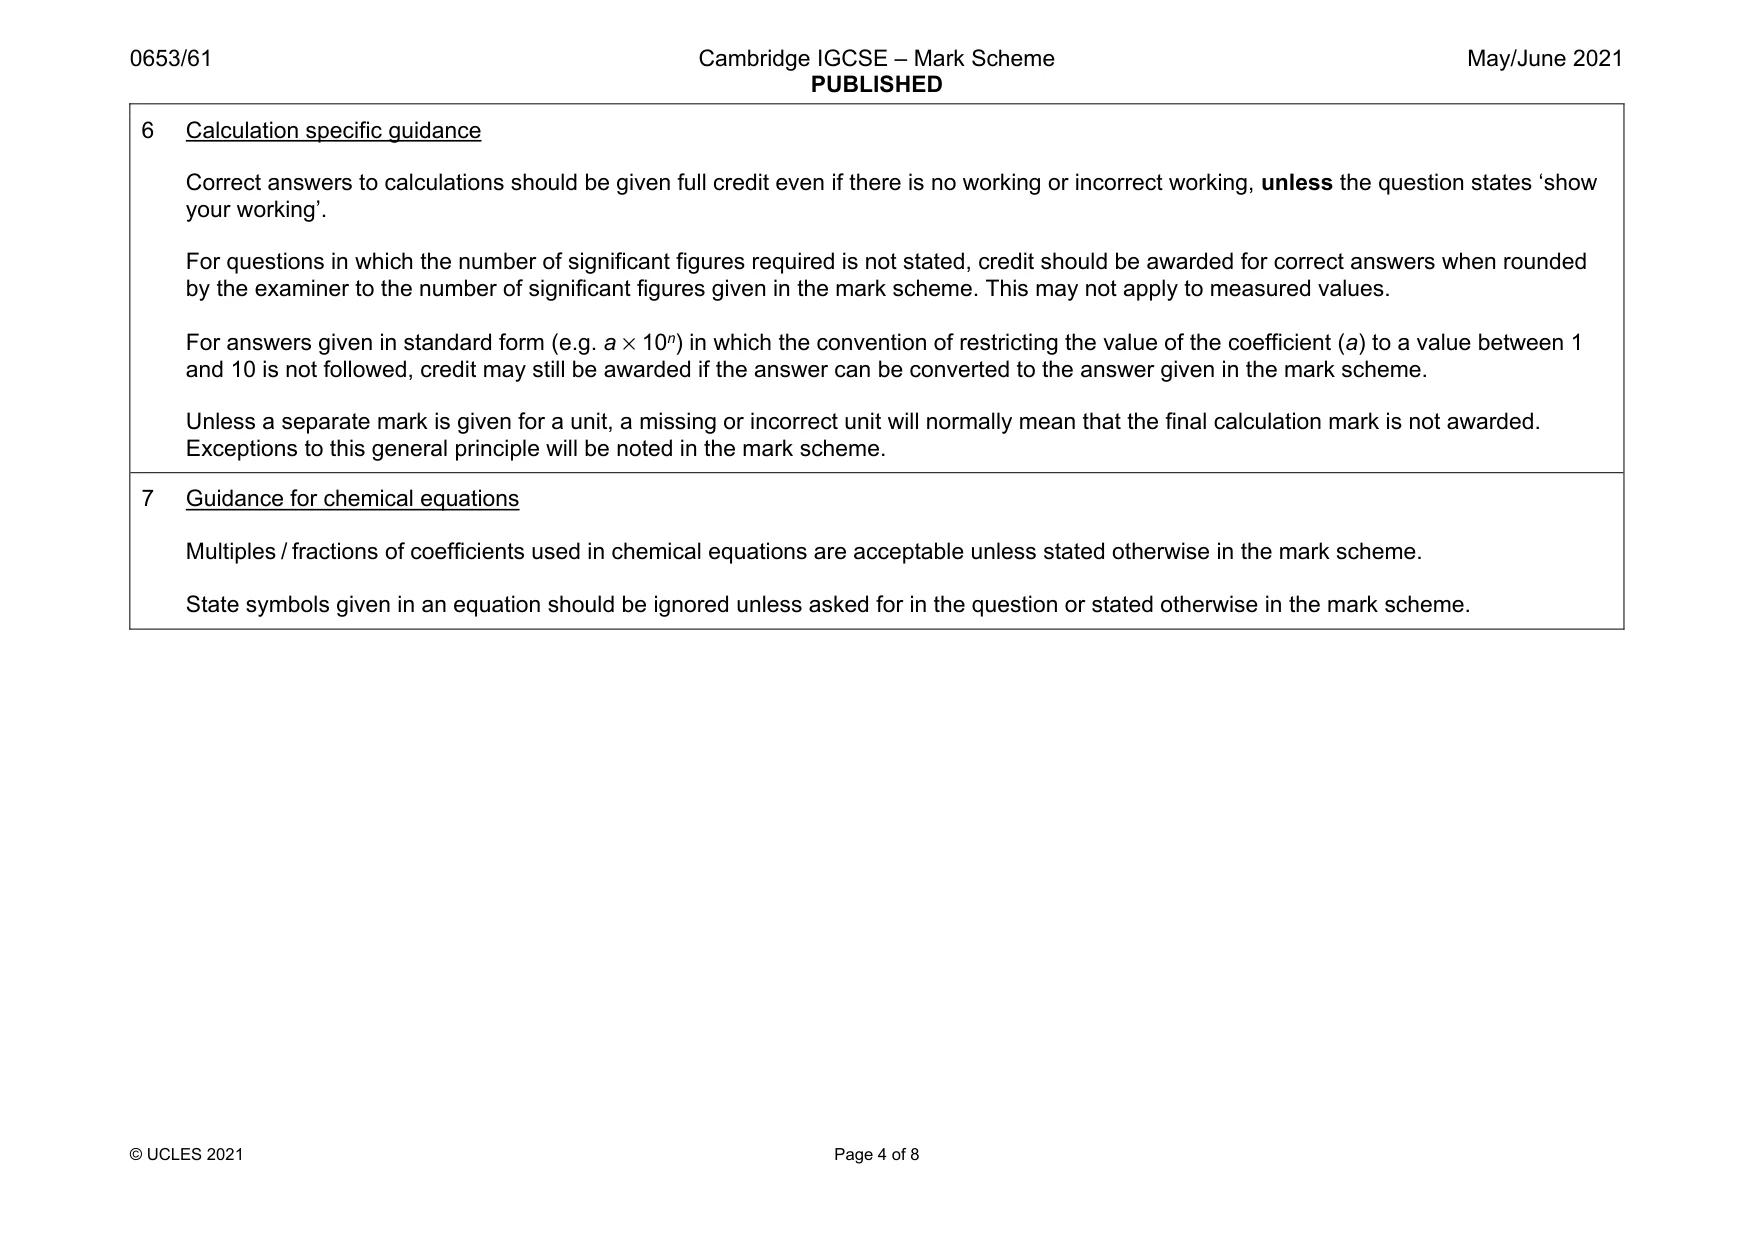
Answers below. Sit the paper first if you are practising.
Questions as text
Q1 · A student investigates an enzyme-catalysed reaction
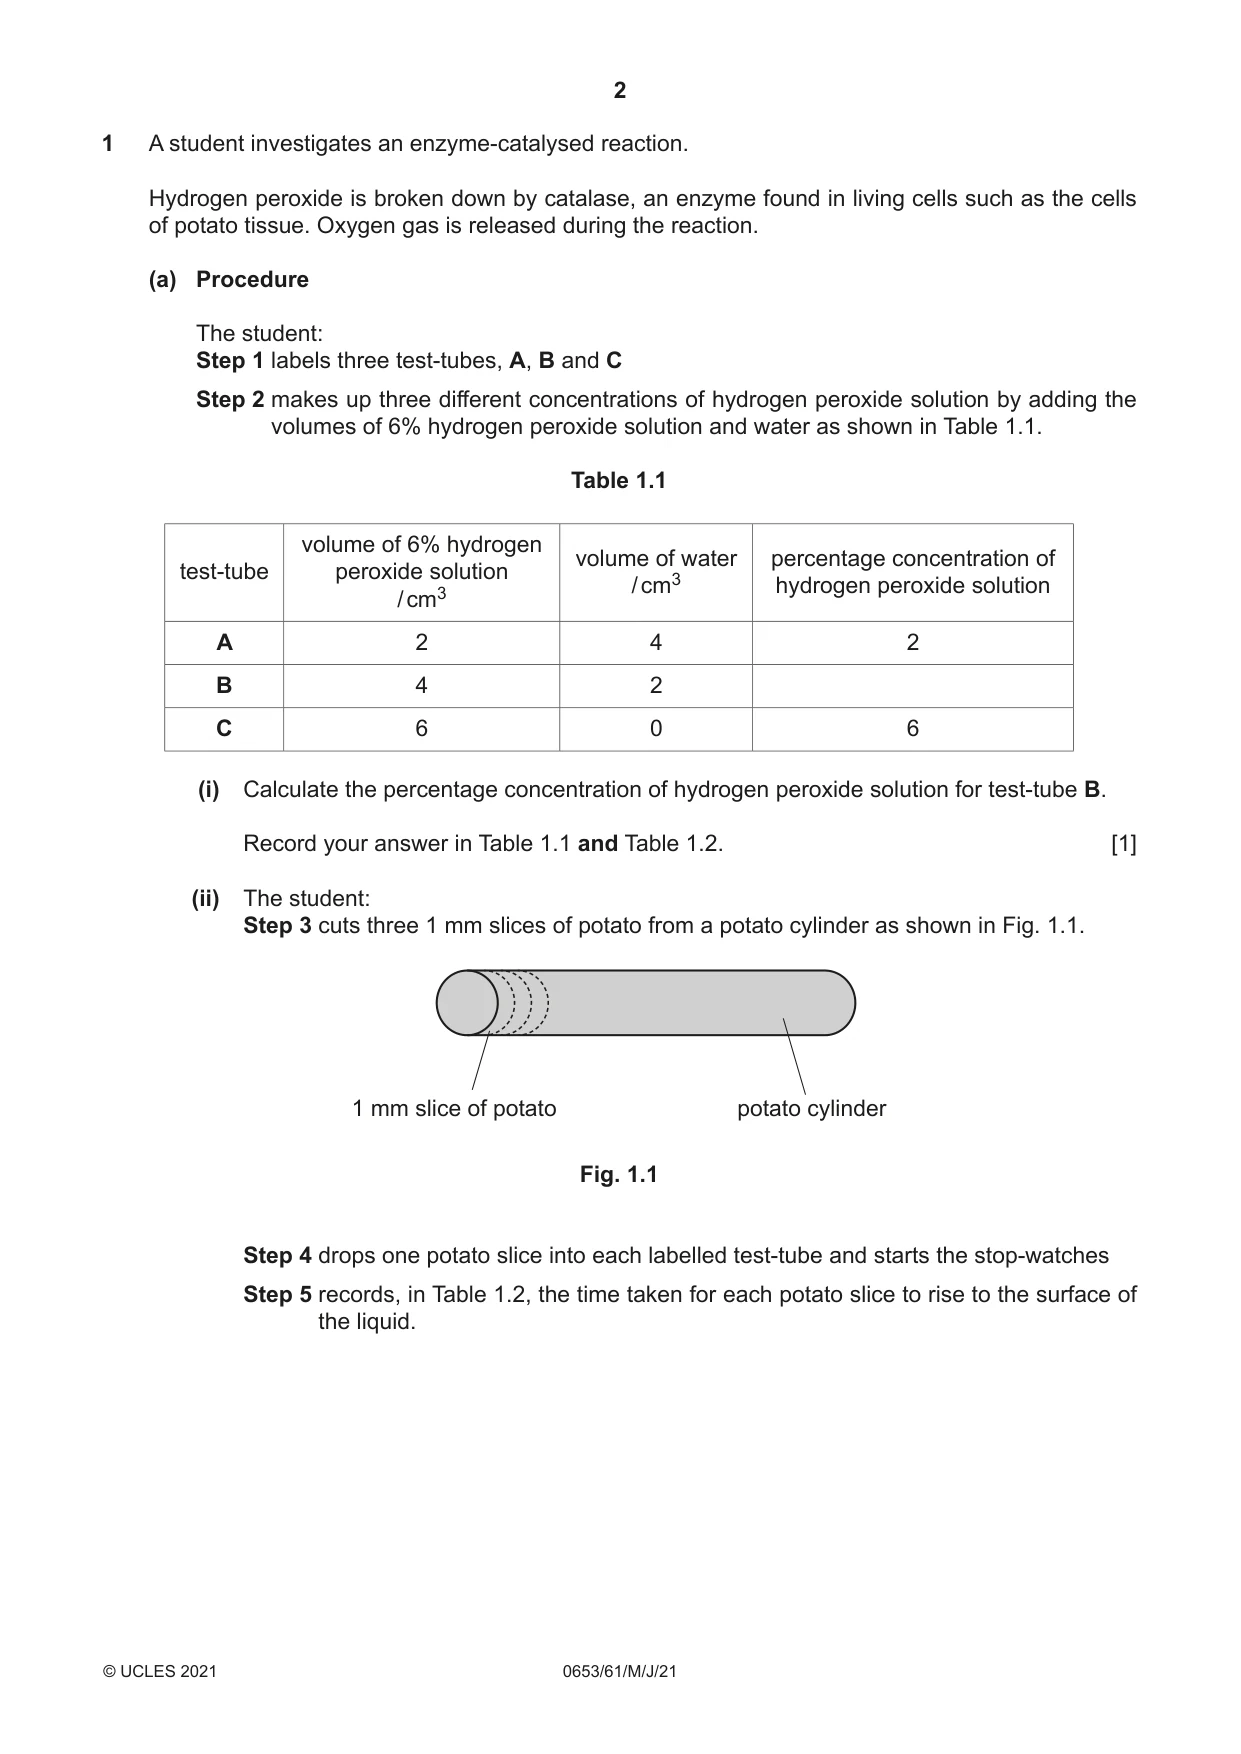
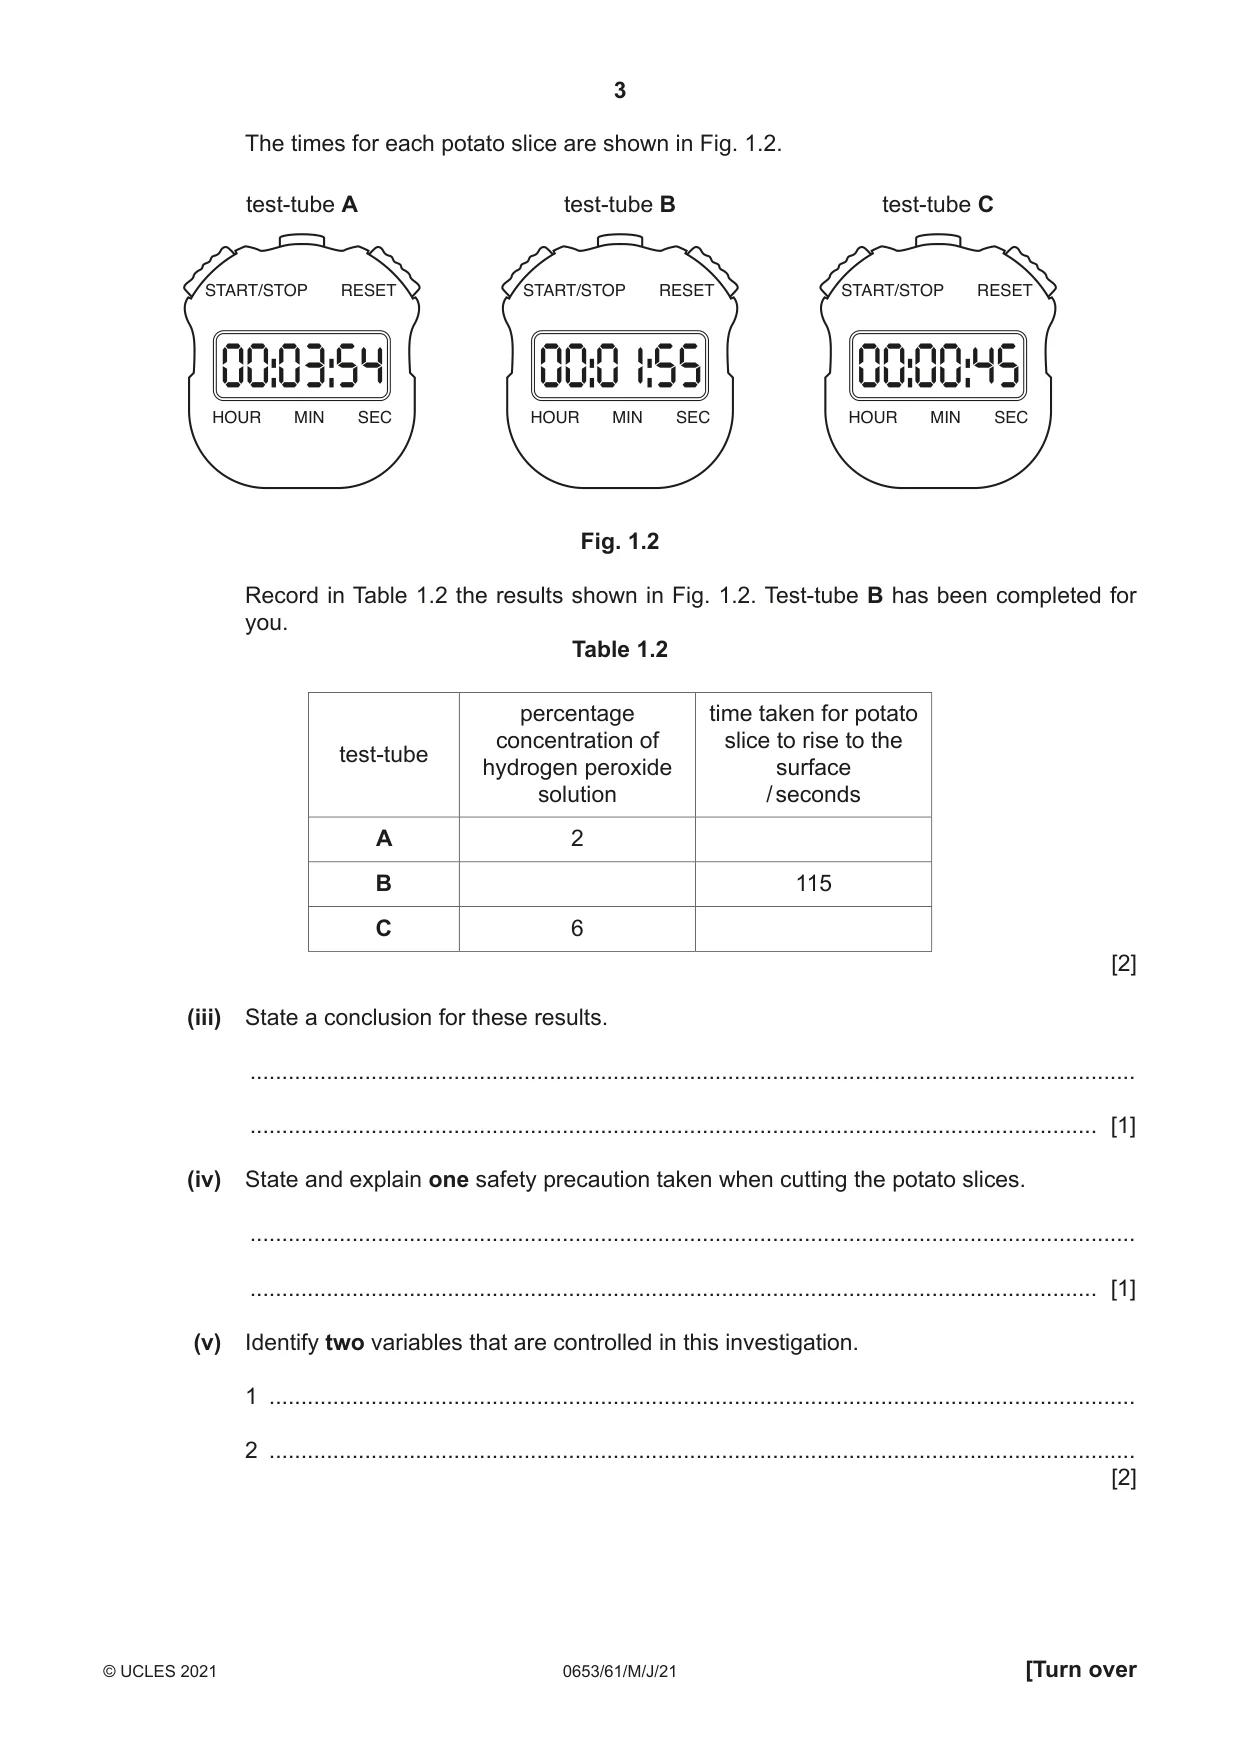
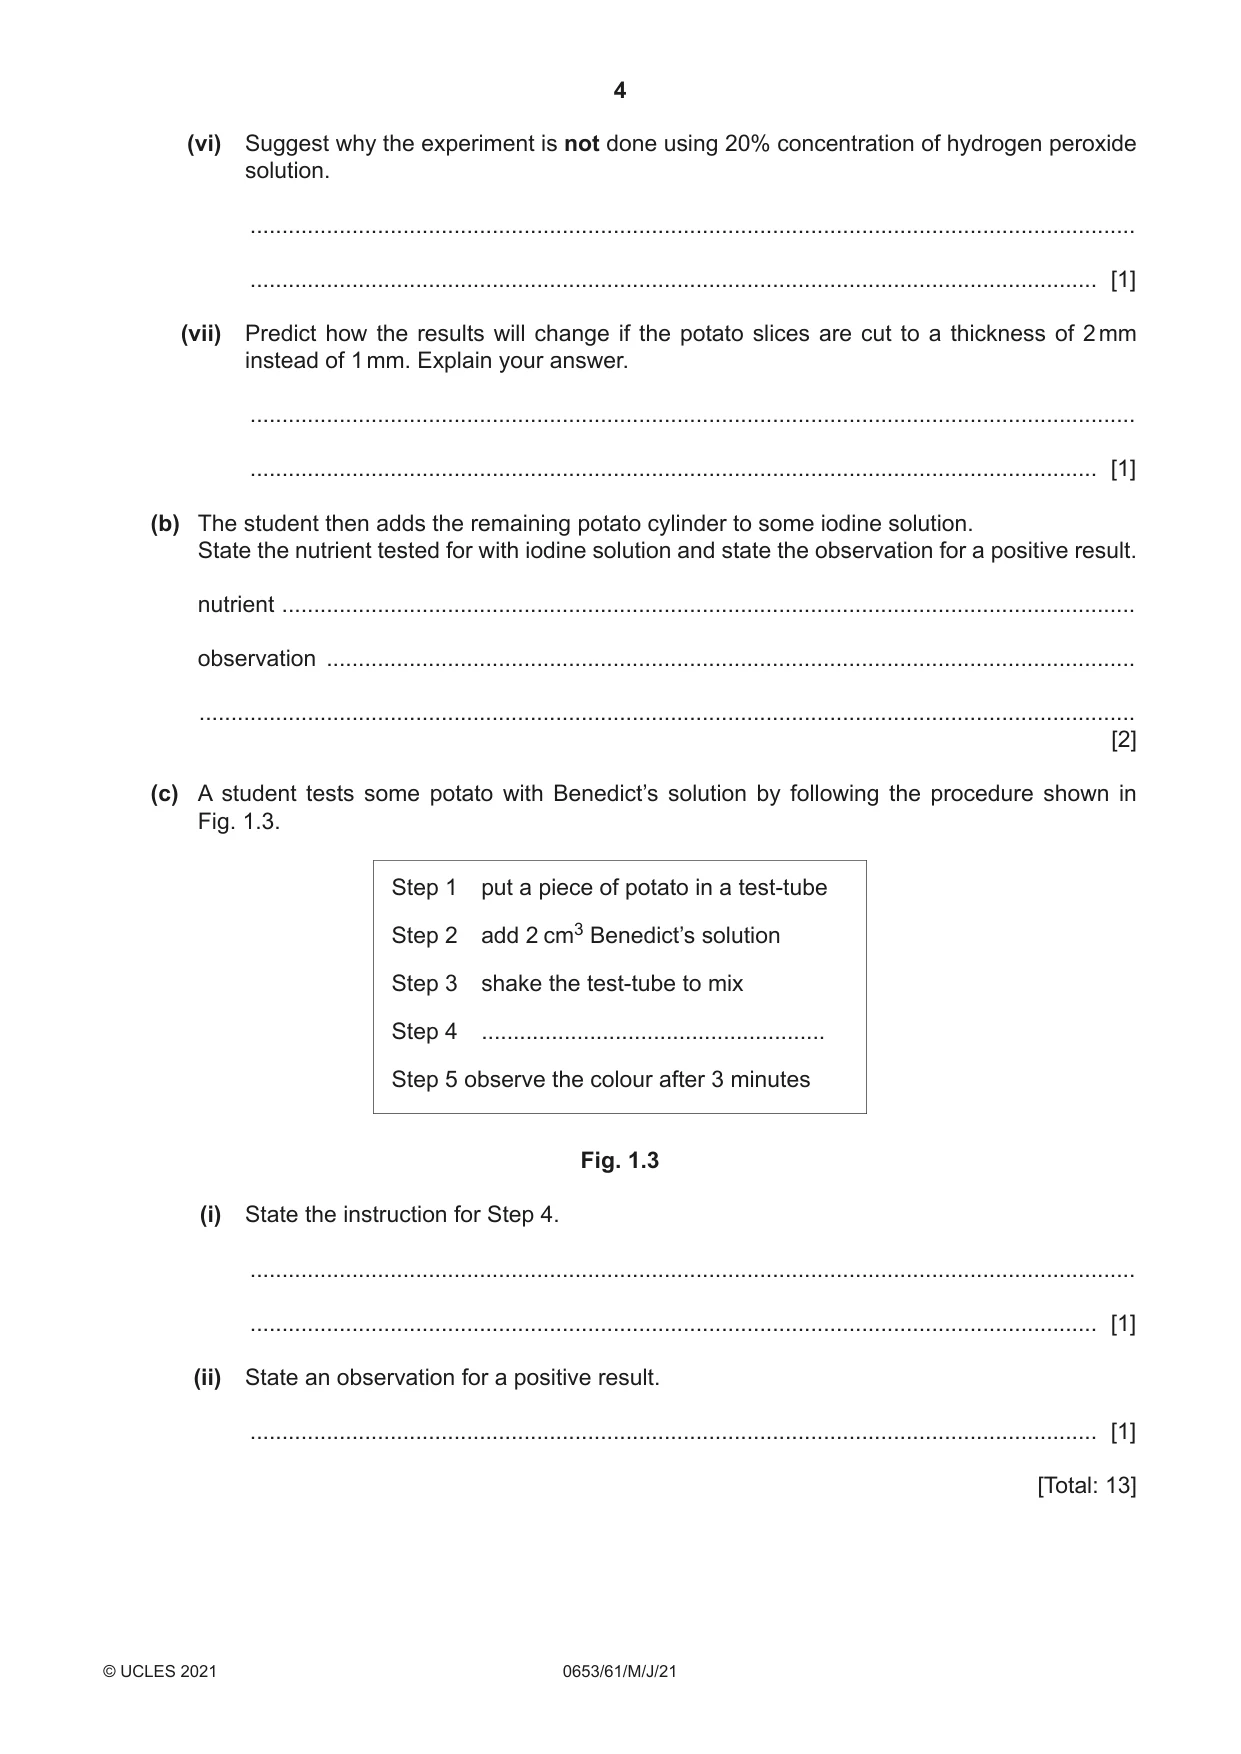
1 A student investigates an enzyme-catalysed reaction. Hydrogen peroxide is broken down by catalase, an enzyme found in living cells such as the cells of potato tissue. Oxygen gas is released during the reaction. (a) Procedure The student: Step 1 labels three test-tubes, A, B and C Step 2 makes up three different concentrations of hydrogen peroxide solution by adding the volumes of 6% hydrogen peroxide solution and water as shown in Table 1.1. Table 1.1 volume of 6% hydrogen volume of water percentage concentration of test-tube peroxide solution / cm3 hydrogen peroxide solution / cm3 A 2 4 2 B 4 2 C 6 0 6 (i) Calculate the percentage concentration of hydrogen peroxide solution for test-tube B. Record your answer in Table 1.1 and Table 1.2. [1] (ii) The student: Step 3 cuts three 1 mm slices of potato from a potato cylinder as shown in Fig. 1.1. 1 mm slice of potato potato cylinder Fig. 1.1 Step 4 drops one potato slice into each labelled test-tube and starts the stop-watches Step 5 records, in Table 1.2, the time taken for each potato slice to rise to the surface of the liquid. The times for each potato slice are shown in Fig. 1.2. test-tube A test-tube B test-tube C START/STOP RESET START/STOP RESET START/STOP RESET HOUR MIN SEC HOUR MIN SEC HOUR MIN SEC Fig. 1.2 Record in Table 1.2 the results shown in Fig. 1.2. Test-tube B has been completed for you. Table 1.2 percentage time taken for potato concentration of slice to rise to the test-tube hydrogen peroxide surface solution / seconds A 2 B 115 C 6 [2] (iii) State a conclusion for these results. ........................................................................................................................................... ..................................................................................................................................... [1] (iv) State and explain one safety precaution taken when cutting the potato slices. ........................................................................................................................................... ..................................................................................................................................... [1] (v) Identify two variables that are controlled in this investigation. 1 ........................................................................................................................................ 2 ........................................................................................................................................ [2] (vi) Suggest why the experiment is not done using 20% concentration of hydrogen peroxide solution. ........................................................................................................................................... ..................................................................................................................................... [1] (vii) Predict how the results will change if the potato slices are cut to a thickness of 2 mm instead of 1 mm. Explain your answer. ........................................................................................................................................... ..................................................................................................................................... [1] (b) The student then adds the remaining potato cylinder to some iodine solution. State the nutrient tested for with iodine solution and state the observation for a positive result. nutrient ...................................................................................................................................... observation ............................................................................................................................... ................................................................................................................................................... [2] (c) A student tests some potato with Benedict’s solution by following the procedure shown in Fig. 1.3. Step 1 put a piece of potato in a test-tube Step 2 add 2 cm3 Benedict’s solution Step 3 shake the test-tube to mix Step 4 ...................................................... Step 5 observe the colour after 3 minutes Fig. 1.3 (i) State the instruction for Step 4. ........................................................................................................................................... ..................................................................................................................................... [1] (ii) State an observation for a positive result. ..................................................................................................................................... [1] [Total: 13]
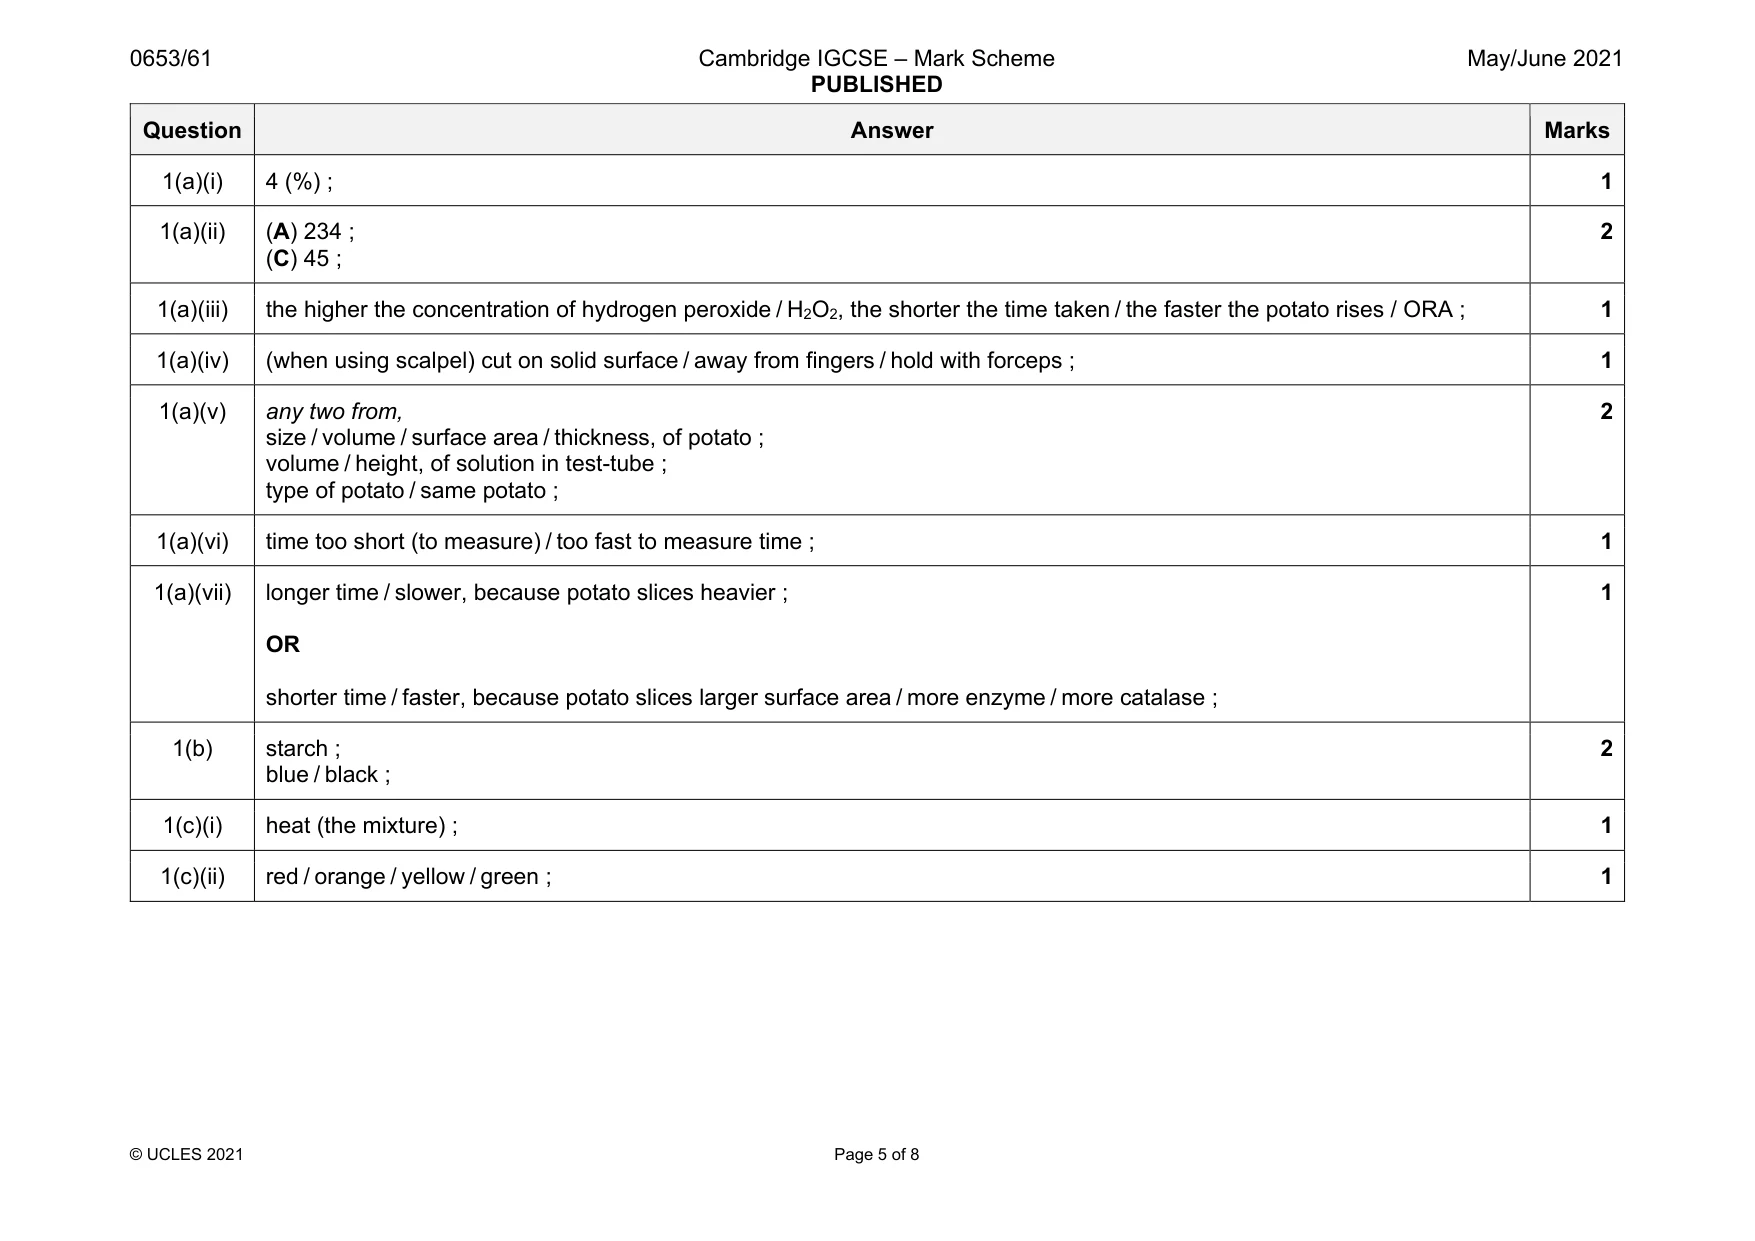
Mark scheme: 1(a)(i) 4 (%) ; 1 1(a)(ii) (A) 234 ; (C) 45 ; 2 1(a)(iii) the higher the concentration of hydrogen peroxide / H2O2, the shorter the time taken / the faster the potato rises / ORA ; 1 1(a)(iv) (when using scalpel) cut on solid surface / away from fingers / hold with forceps ; 1 1(a)(v) any two from, size / volume / surface area / thickness, of potato ; volume / height, of solution in test-tube ; type of potato / same potato ; 2 1(a)(vi) time too short (to measure) / too fast to measure time ; 1 1(a)(vii) longer time / slower, because potato slices heavier ; OR shorter time / faster, because potato slices larger surface area / more enzyme / more catalase ; 1 1(b) starch ; blue / black ; 2 1(c)(i) heat (the mixture) ; 1 1(c)(ii) red / orange / yellow / green ; 1
Q2 · A student is provided with five aqueous solutions, F, G, H, J and K
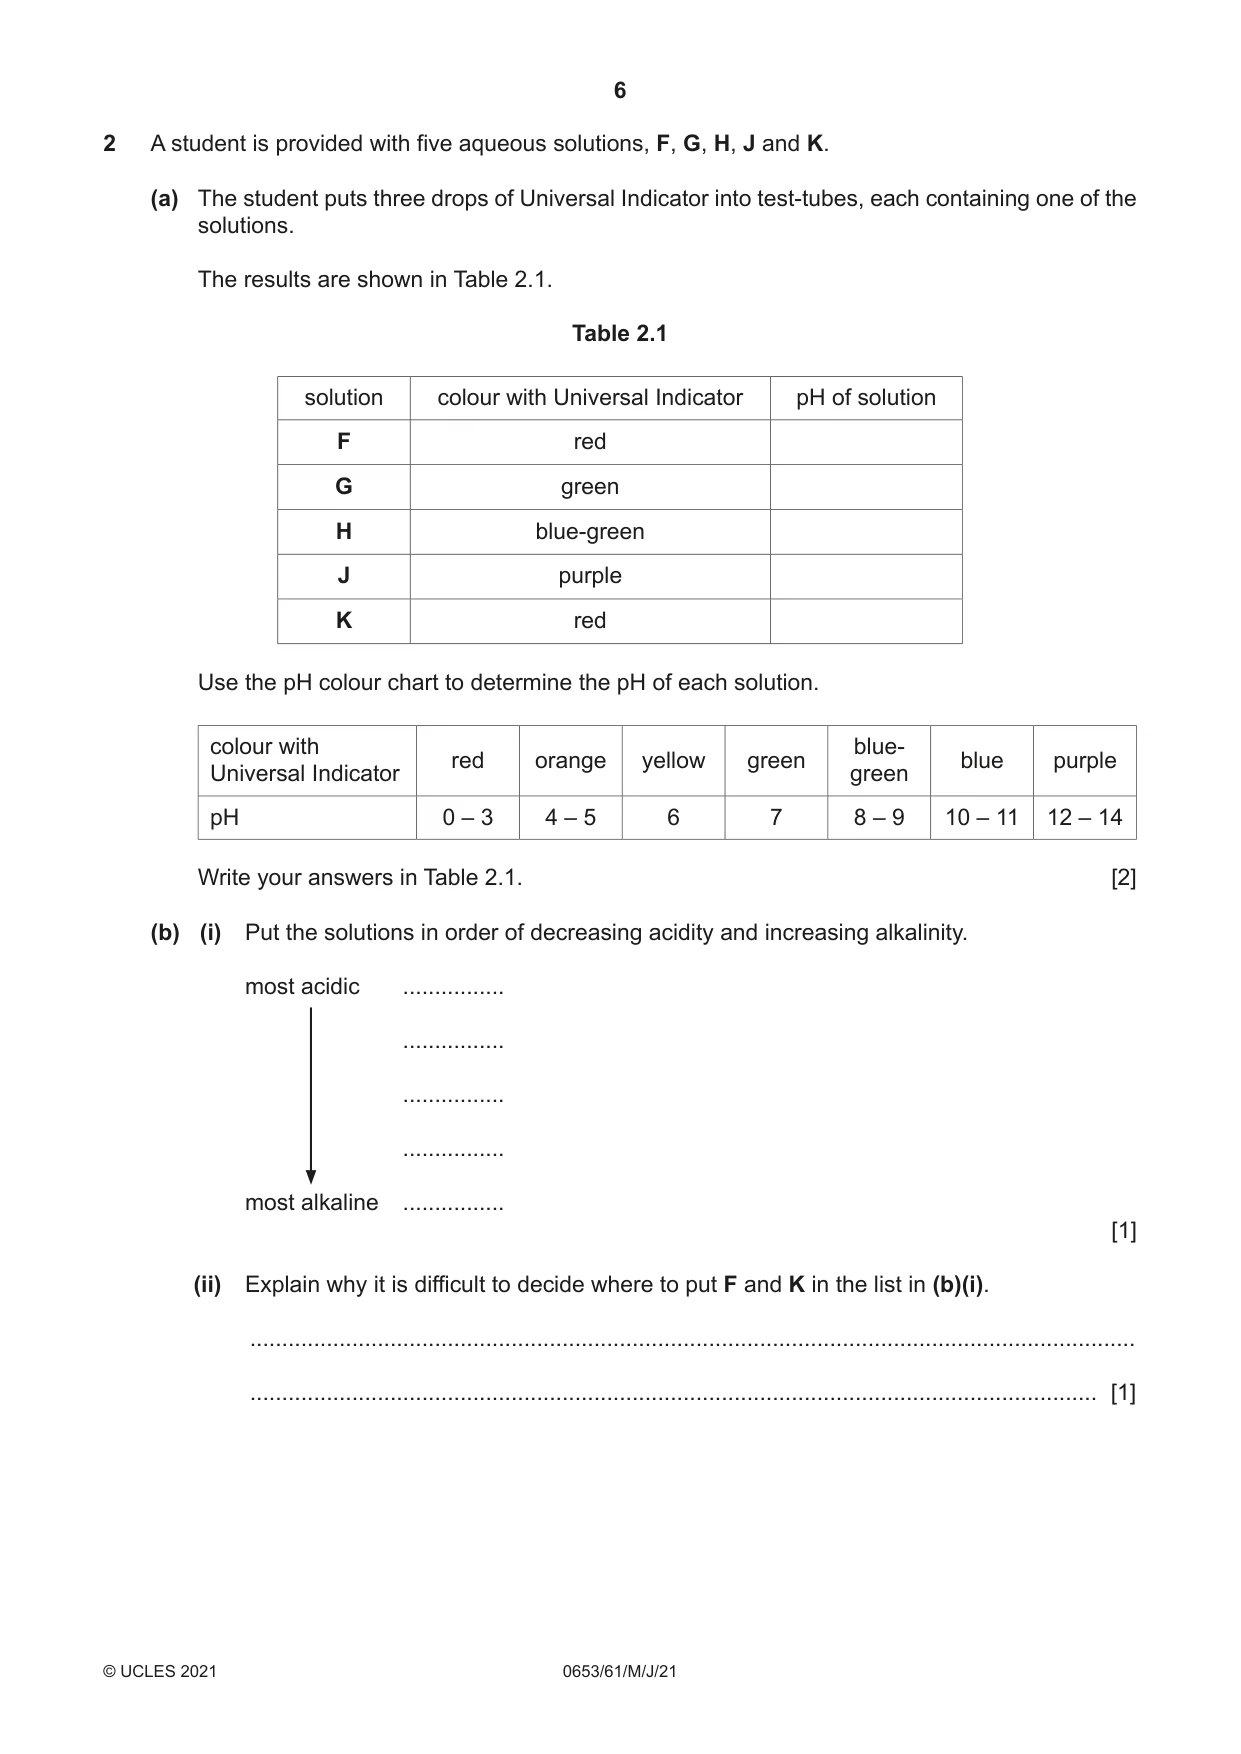
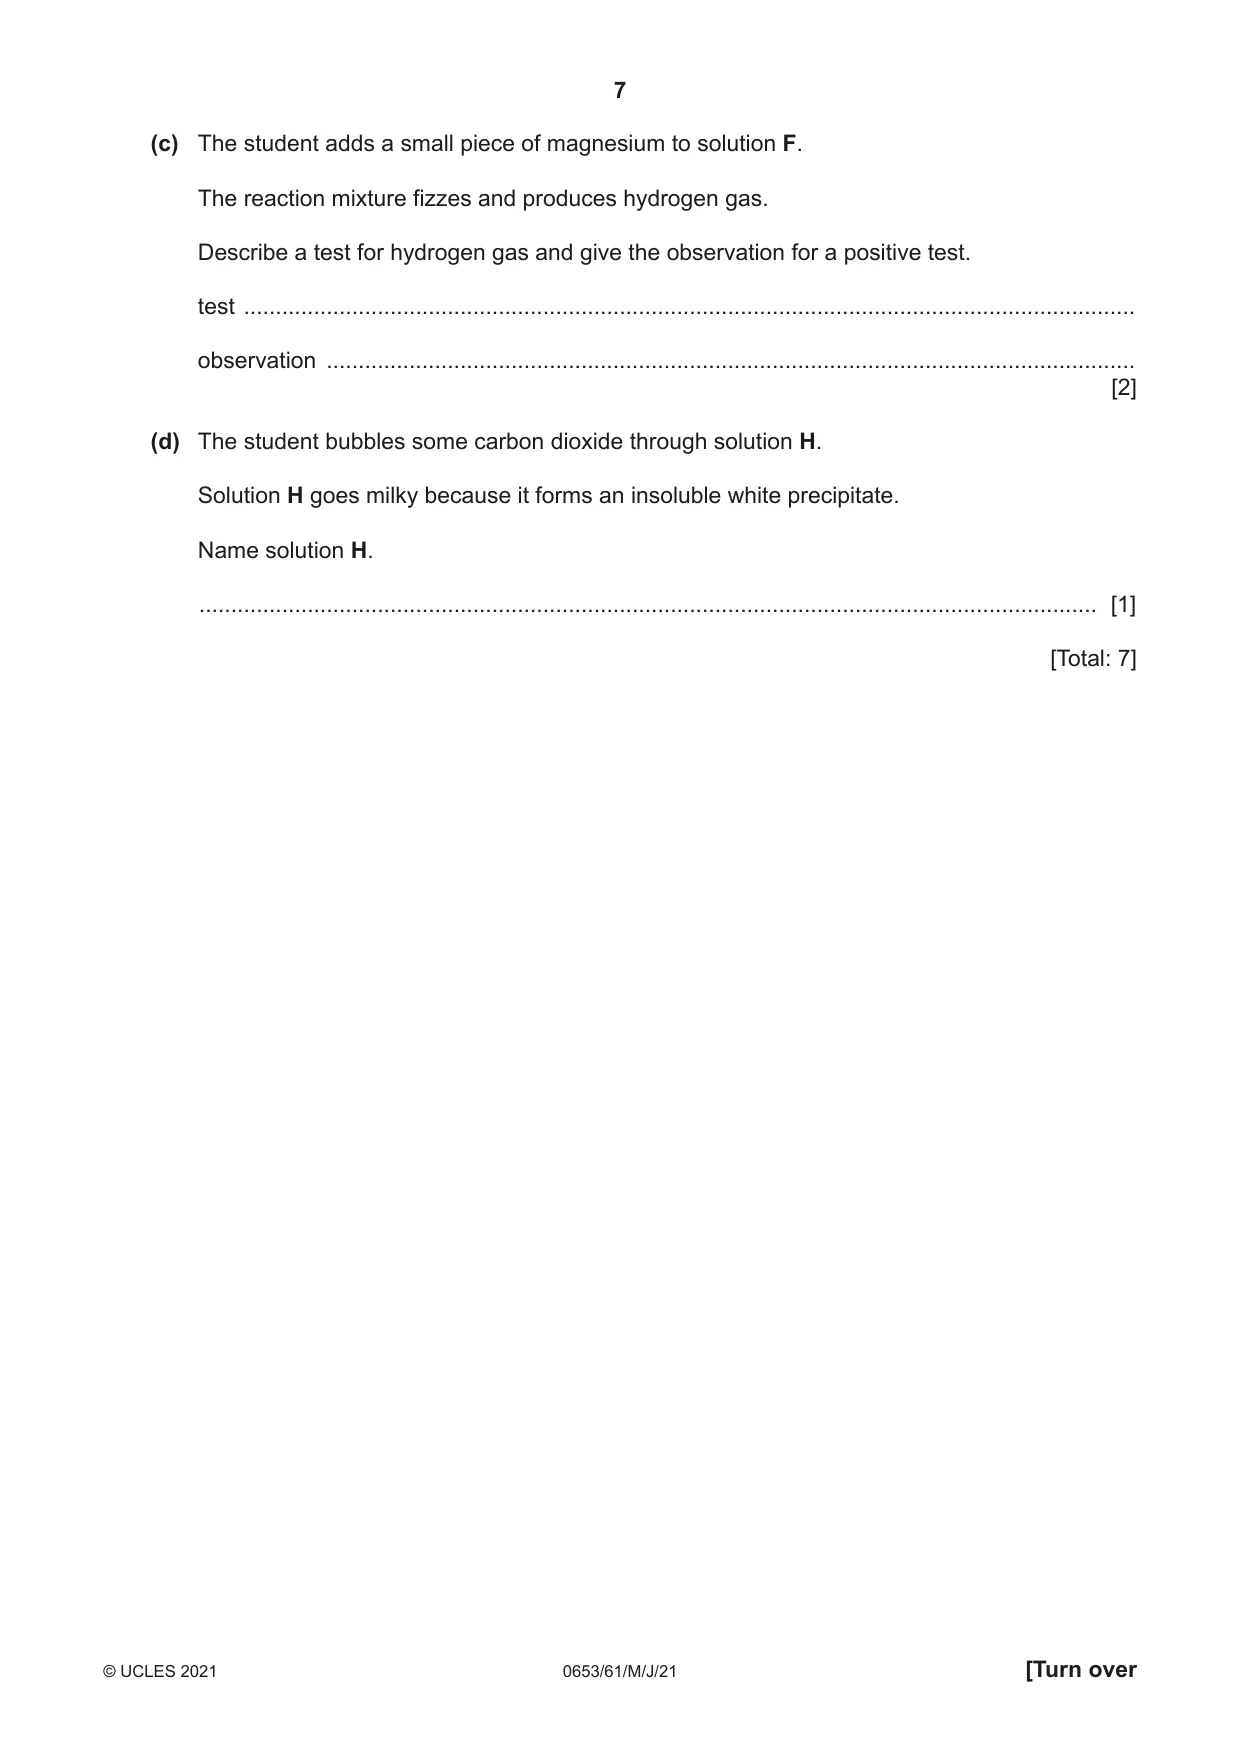
2 A student is provided with five aqueous solutions, F, G, H, J and K. (a) The student puts three drops of Universal Indicator into test-tubes, each containing one of the solutions. The results are shown in Table 2.1. Table 2.1 solution colour with Universal Indicator pH of solution F red G green H blue-green J purple K red Use the pH colour chart to determine the pH of each solution. colour with blue- red orange yellow green blue purple Universal Indicator green pH 0 – 3 4 – 5 6 7 8 – 9 10 – 11 12 – 14 Write your answers in Table 2.1. [2] (b) (i) Put the solutions in order of decreasing acidity and increasing alkalinity. most acidic ................ ................ ................ ................ most alkaline ................ [1] (ii) Explain why it is difficult to decide where to put F and K in the list in (b)(i). ........................................................................................................................................... ..................................................................................................................................... [1] (c) The student adds a small piece of magnesium to solution F. The reaction mixture fizzes and produces hydrogen gas. Describe a test for hydrogen gas and give the observation for a positive test. test ............................................................................................................................................ observation ............................................................................................................................... [2] (d) The student bubbles some carbon dioxide through solution H. Solution H goes milky because it forms an insoluble white precipitate. Name solution H. ............................................................................................................................................. [1] [Total: 7]
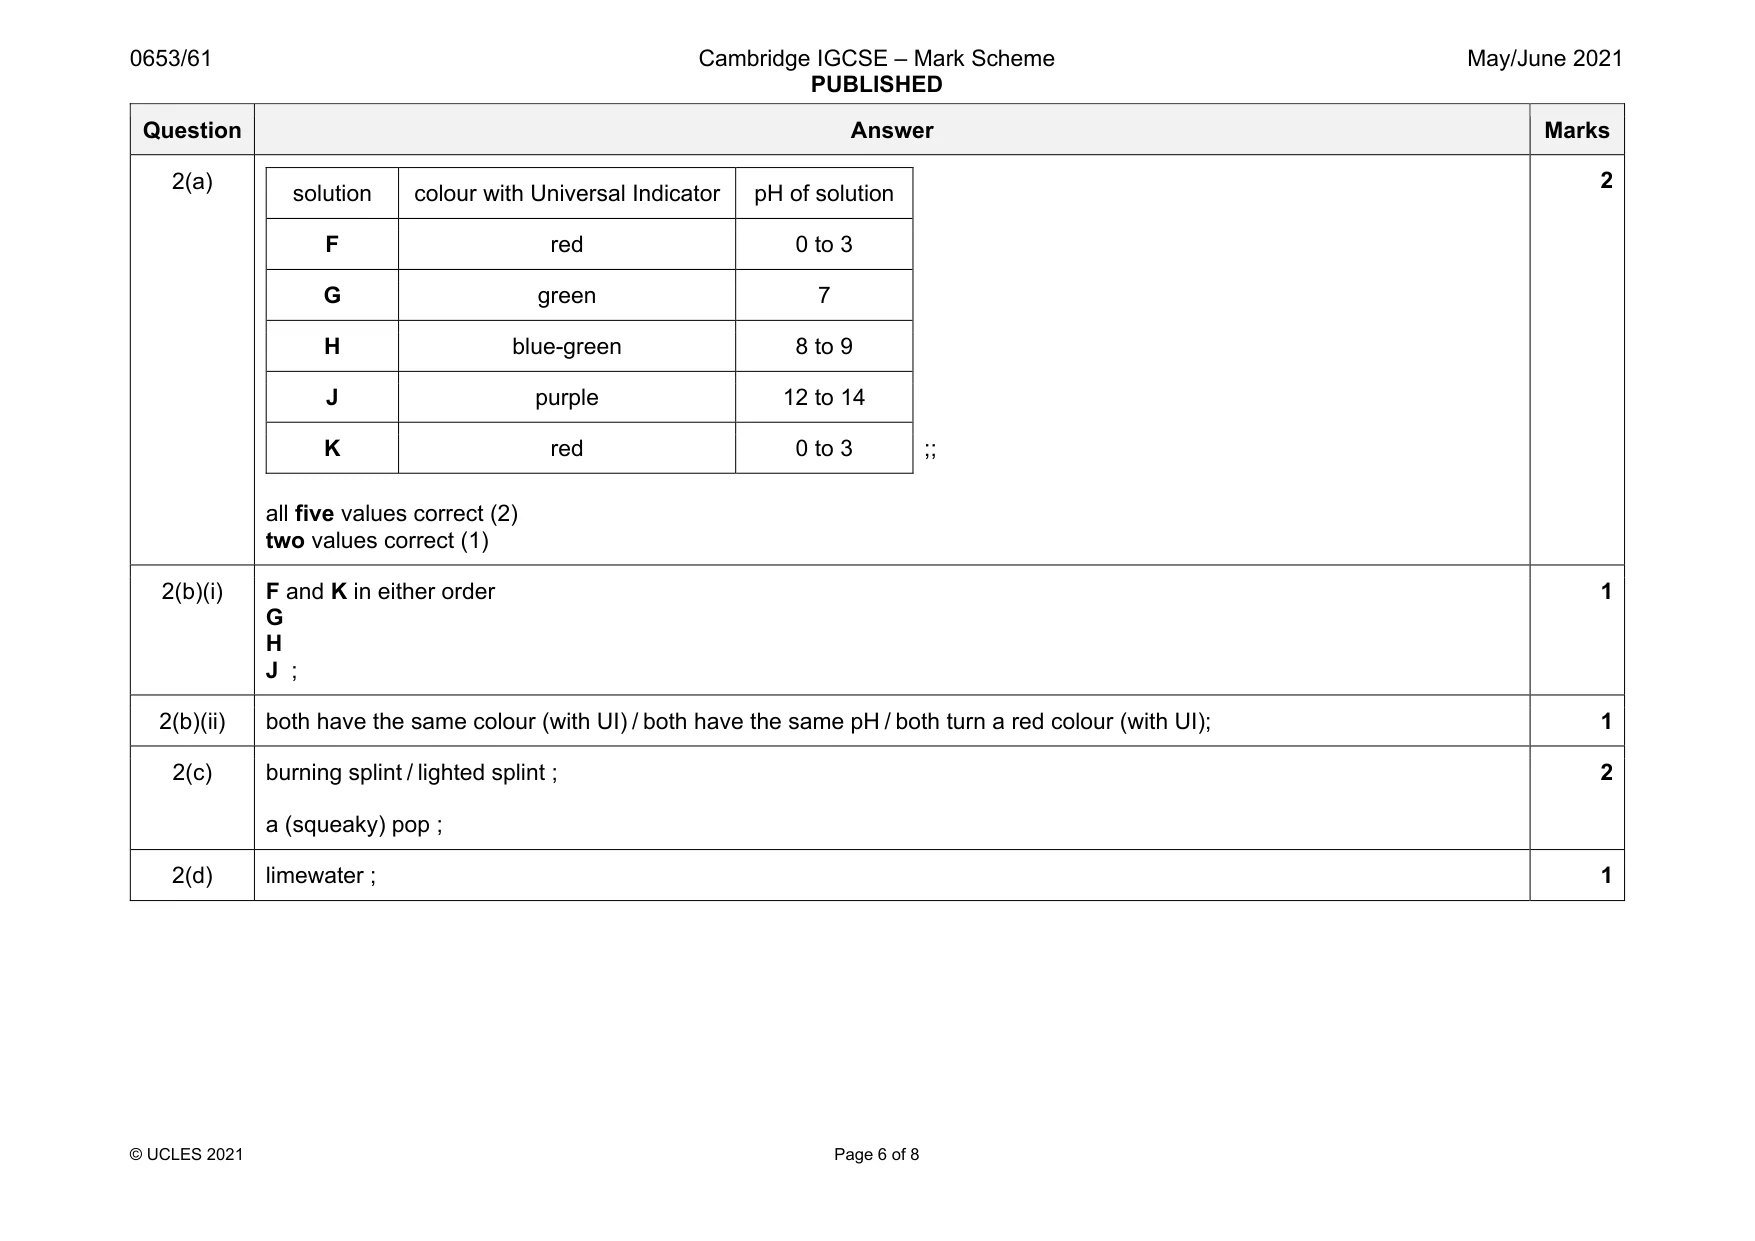
Mark scheme: 2(a) solution colour with Universal Indicator pH of solution F red 0 to 3 G green 7 H blue-green 8 to 9 J purple 12 to 14 K red 0 to 3 ;; all five values correct (2) two values correct (1) 2(b)(i) F and K in either order G H J ; 1 2(b)(ii) both have the same colour (with UI) / both have the same pH / both turn a red colour (with UI); 1 2(c) burning splint / lighted splint ; a (squeaky) pop ; 2 2(d) limewater ; 1
More questions on The characteristic properties of acids and bases
Q3 · Sodium carbonate is a white solid that reacts with dilute hydrochloric acid as shown in…
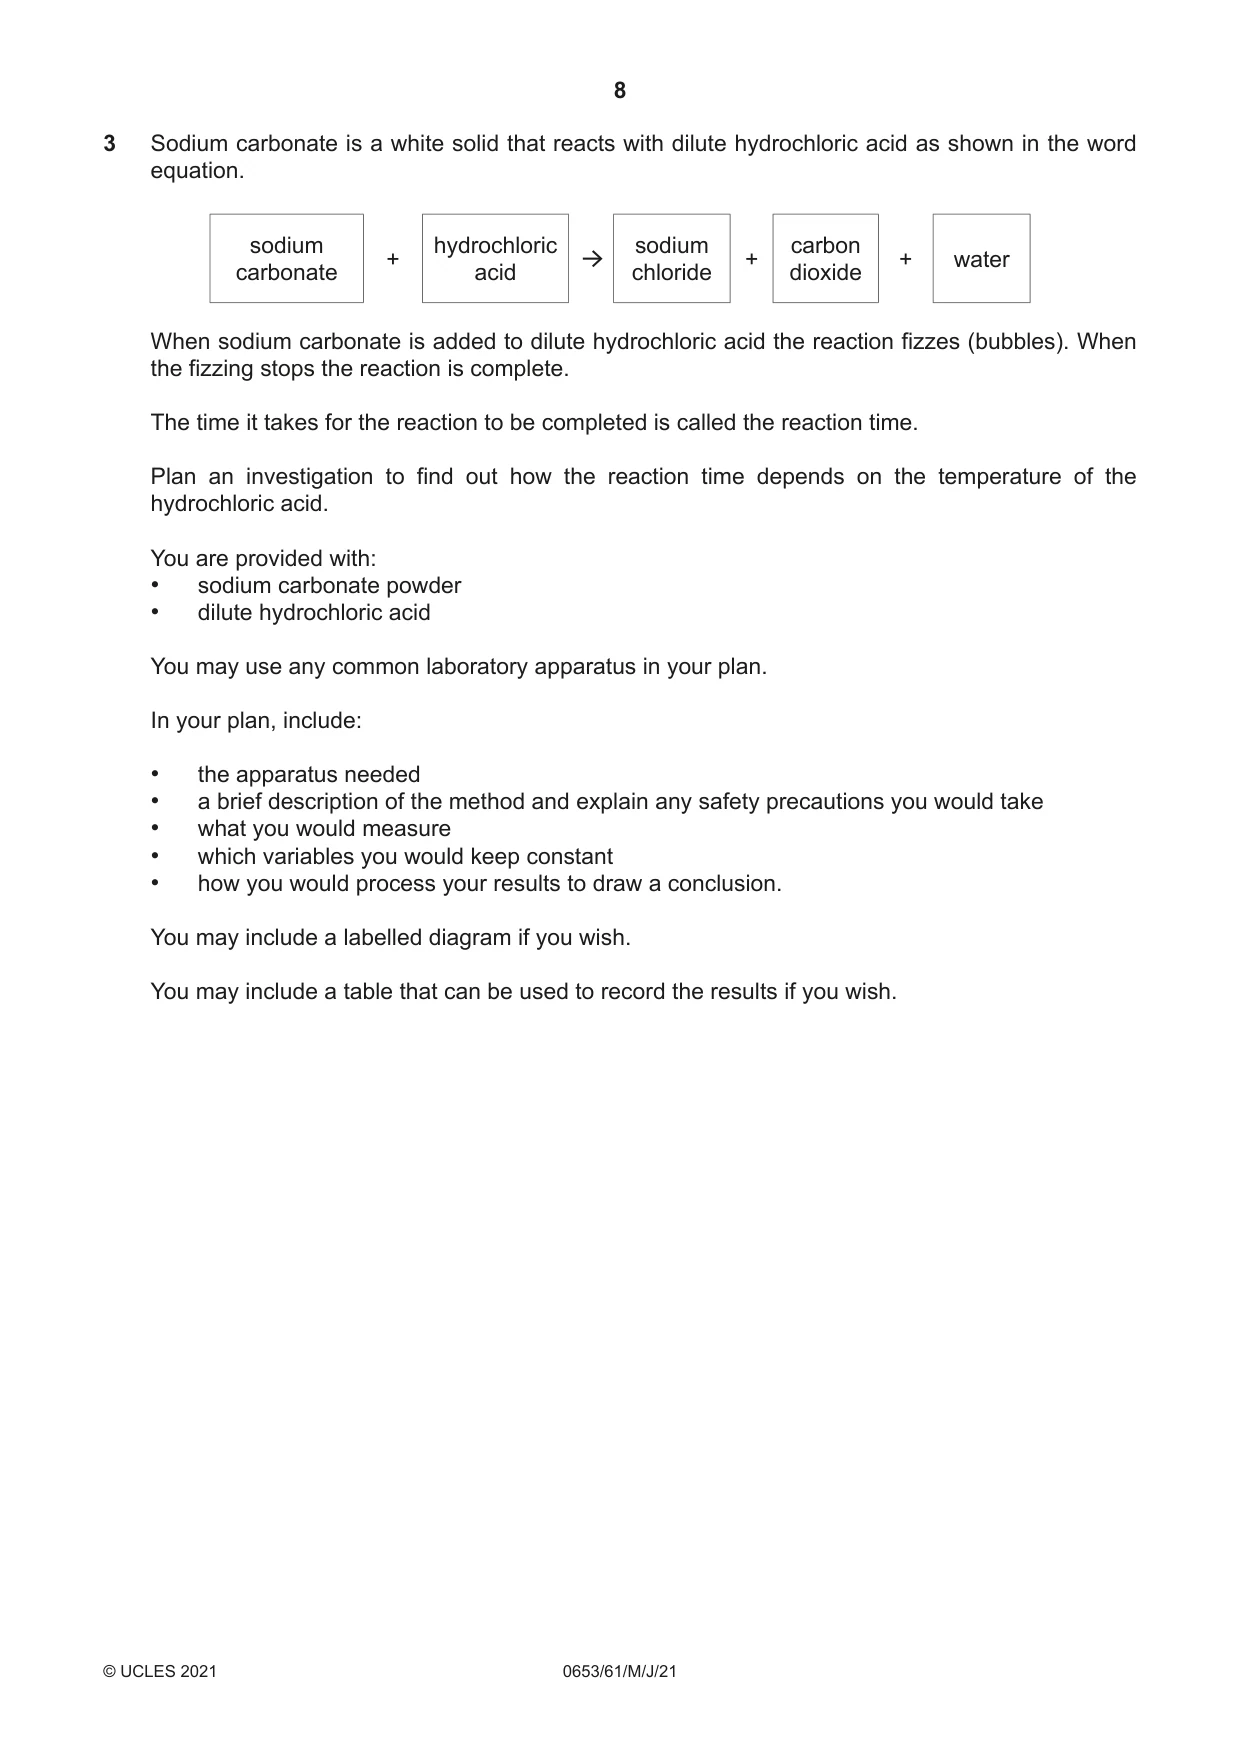
3 Sodium carbonate is a white solid that reacts with dilute hydrochloric acid as shown in the word equation. sodium hydrochloric sodium carbon + + + water carbonate acid chloride dioxide When sodium carbonate is added to dilute hydrochloric acid the reaction fizzes (bubbles). When the fizzing stops the reaction is complete. The time it takes for the reaction to be completed is called the reaction time. Plan an investigation to find out how the reaction time depends on the temperature of the hydrochloric acid. You are provided with: • sodium carbonate powder • dilute hydrochloric acid You may use any common laboratory apparatus in your plan. In your plan, include: • the apparatus needed • a brief description of the method and explain any safety precautions you would take • what you would measure • which variables you would keep constant • how you would process your results to draw a conclusion. You may include a labelled diagram if you wish. You may include a table that can be used to record the results if you wish. .......................................................................................................................................................... .......................................................................................................................................................... .......................................................................................................................................................... .......................................................................................................................................................... .......................................................................................................................................................... .......................................................................................................................................................... .......................................................................................................................................................... .......................................................................................................................................................... .......................................................................................................................................................... .......................................................................................................................................................... .......................................................................................................................................................... .......................................................................................................................................................... .......................................................................................................................................................... .................................................................................................................................................... [7]
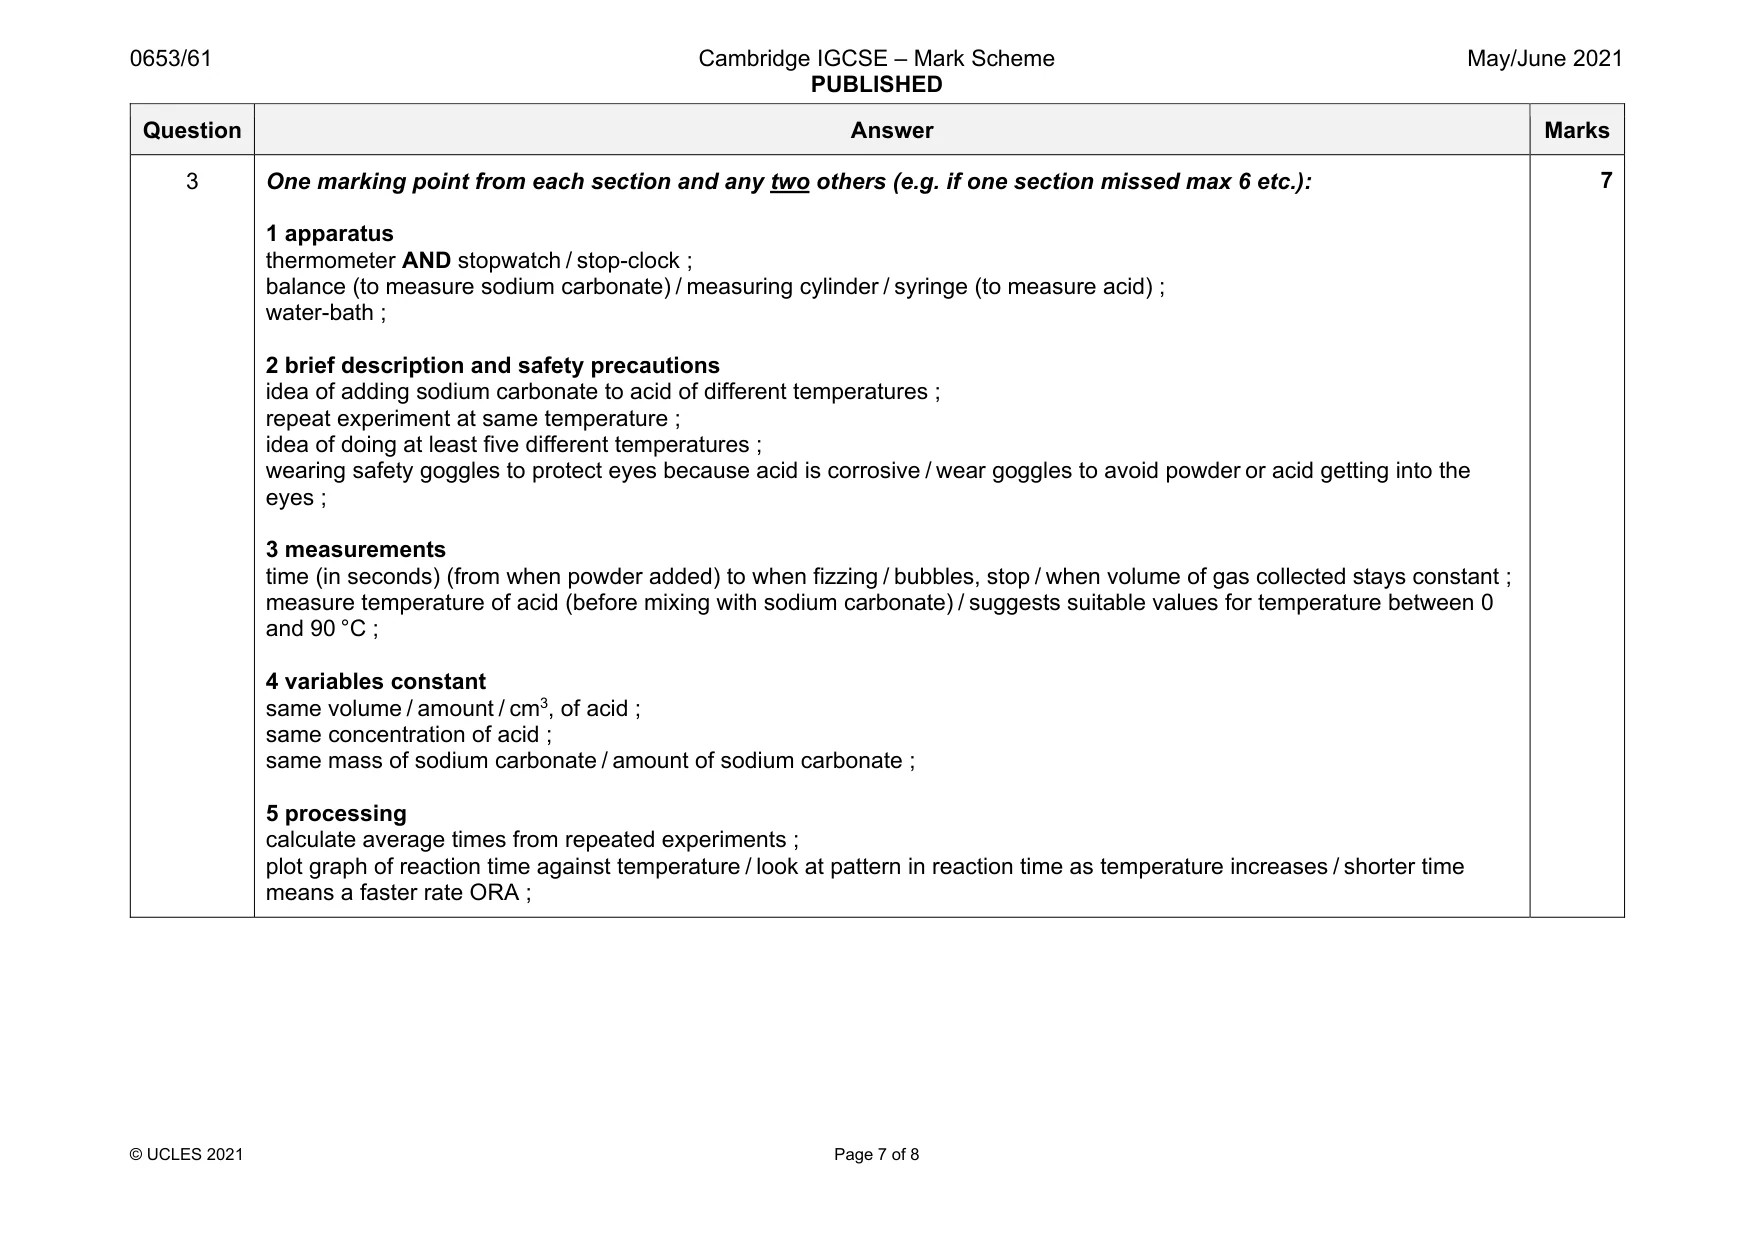
Mark scheme: 3 One marking point from each section and any two others (e.g. if one section missed max 6 etc.): 1 apparatus thermometer AND stopwatch / stop-clock ; balance (to measure sodium carbonate) / measuring cylinder / syringe (to measure acid) ; water-bath ; 2 brief description and safety precautions idea of adding sodium carbonate to acid of different temperatures ; repeat experiment at same temperature ; idea of doing at least five different temperatures ; wearing safety goggles to protect eyes because acid is corrosive / wear goggles to avoid powder or acid getting into the eyes ; 3 measurements time (in seconds) (from when powder added) to when fizzing / bubbles, stop / when volume of gas collected stays constant ; measure temperature of acid (before mixing with sodium carbonate) / suggests suitable values for temperature between 0 and 90 °C ; 4 variables constant same volume / amount / cm3, of acid ; same concentration of acid ; same mass of sodium carbonate / amount of sodium carbonate ; 5 processing calculate average times from repeated experiments ; plot graph of reaction time against temperature / look at pattern in reaction time as temperature increases / shorter time means a faster rate ORA ;
Q4 · A student investigates how forces affect an elastic band
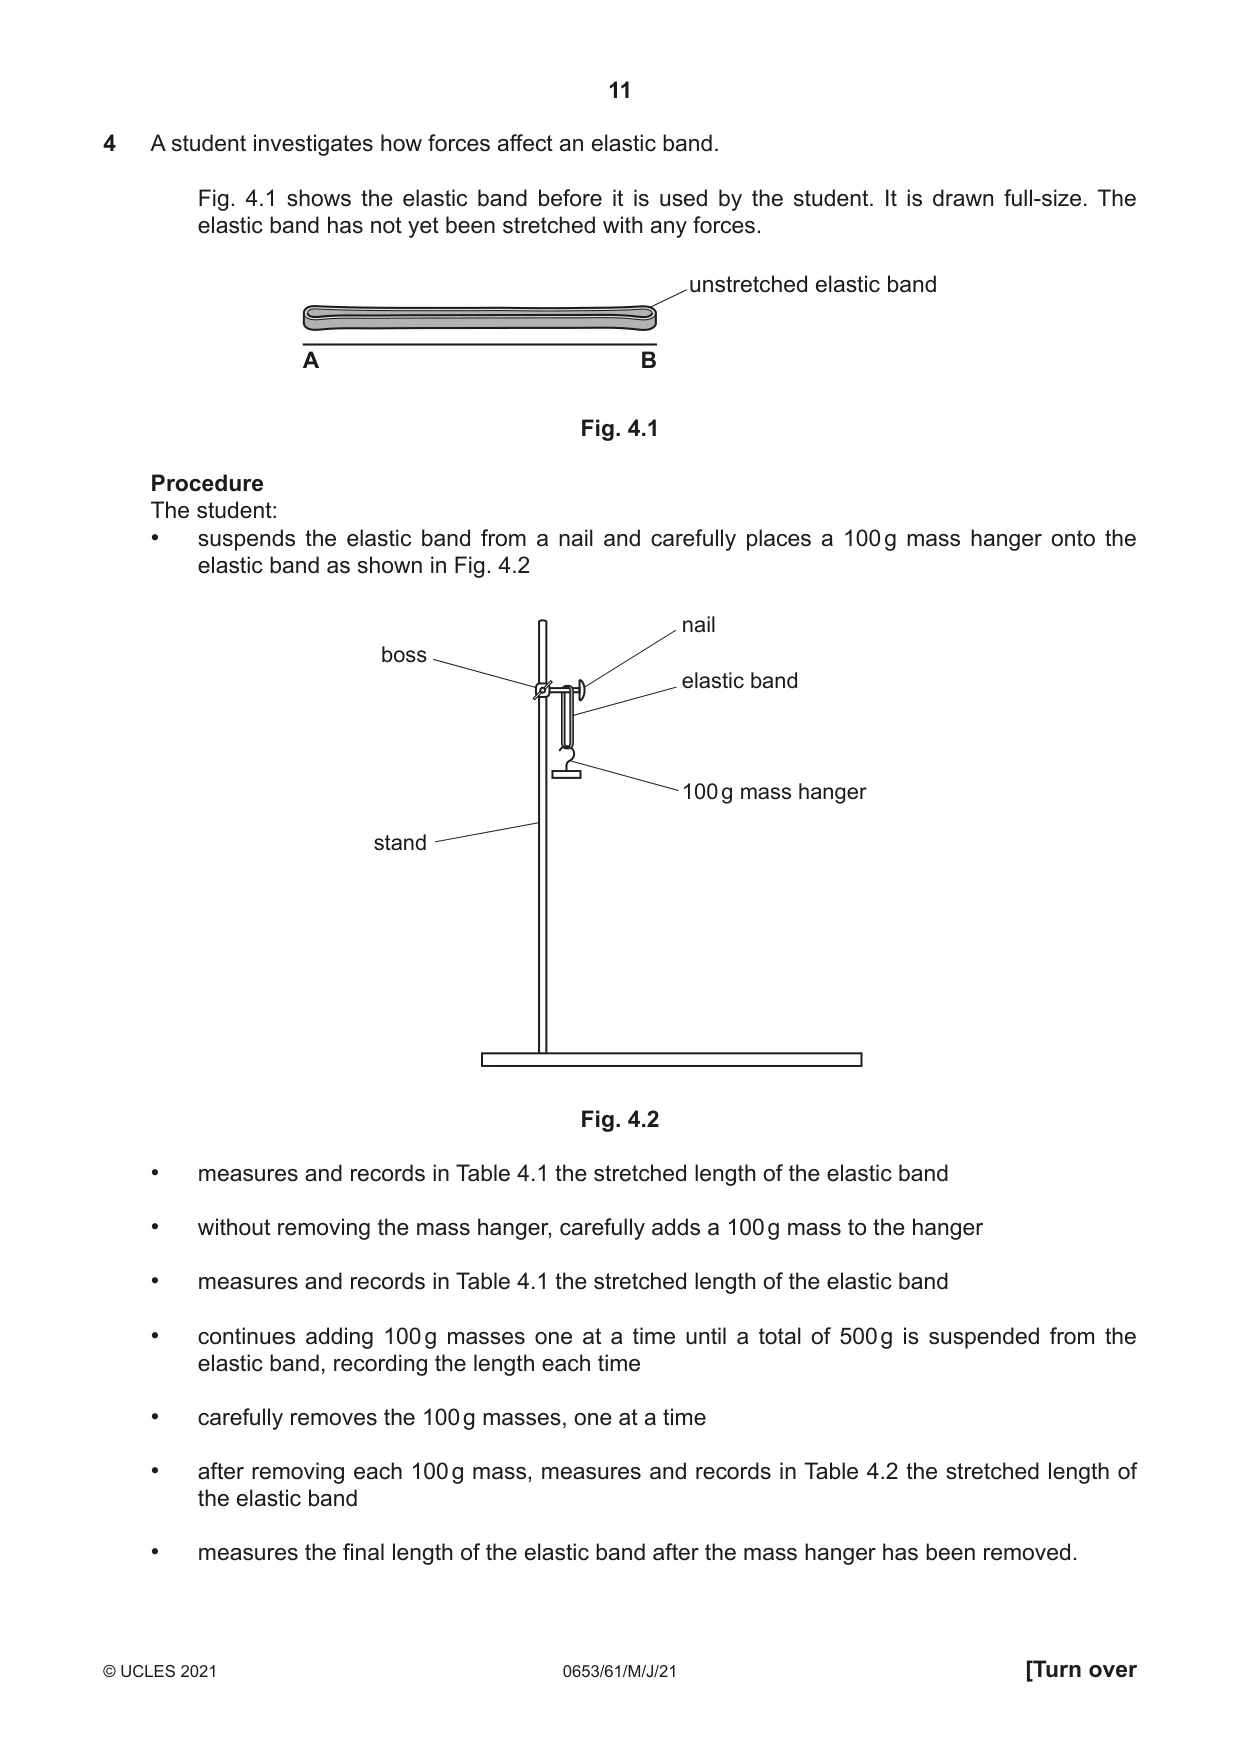
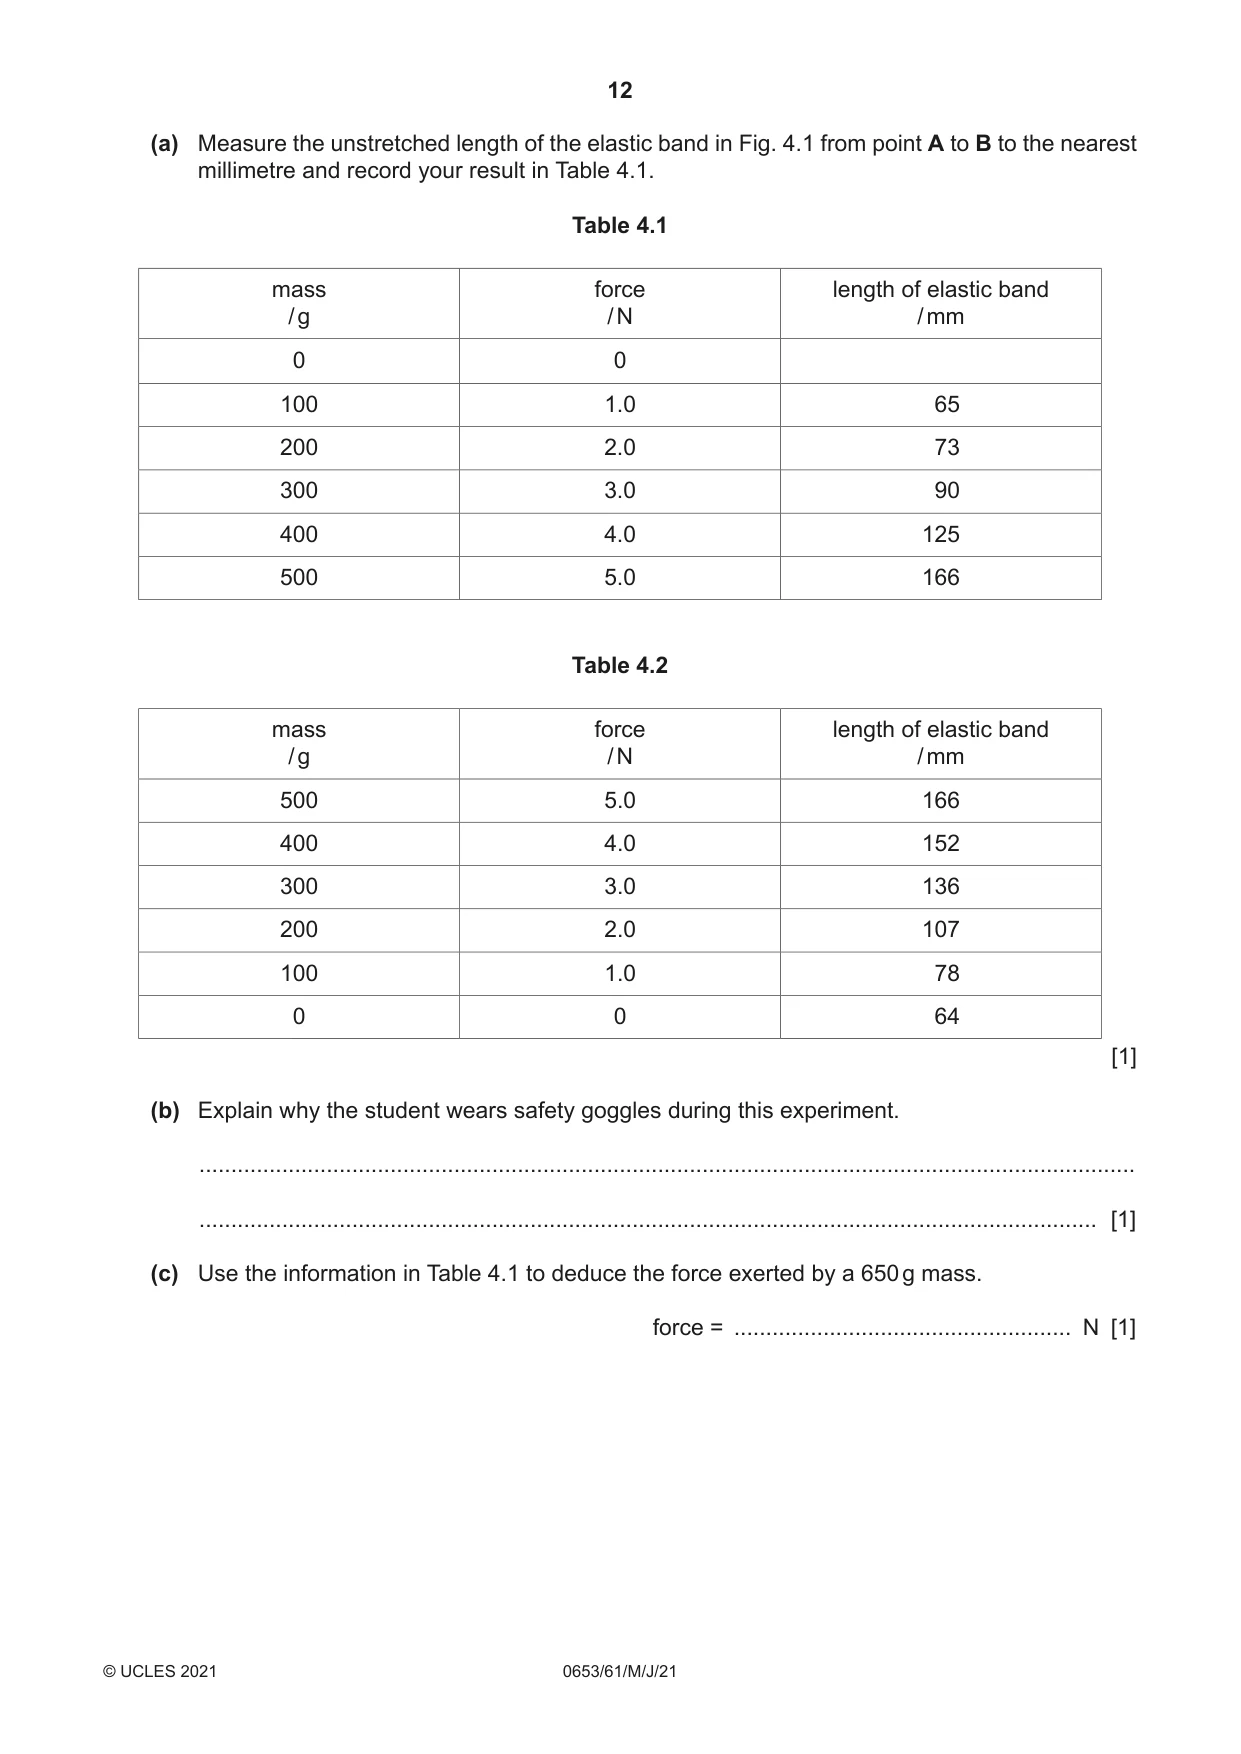
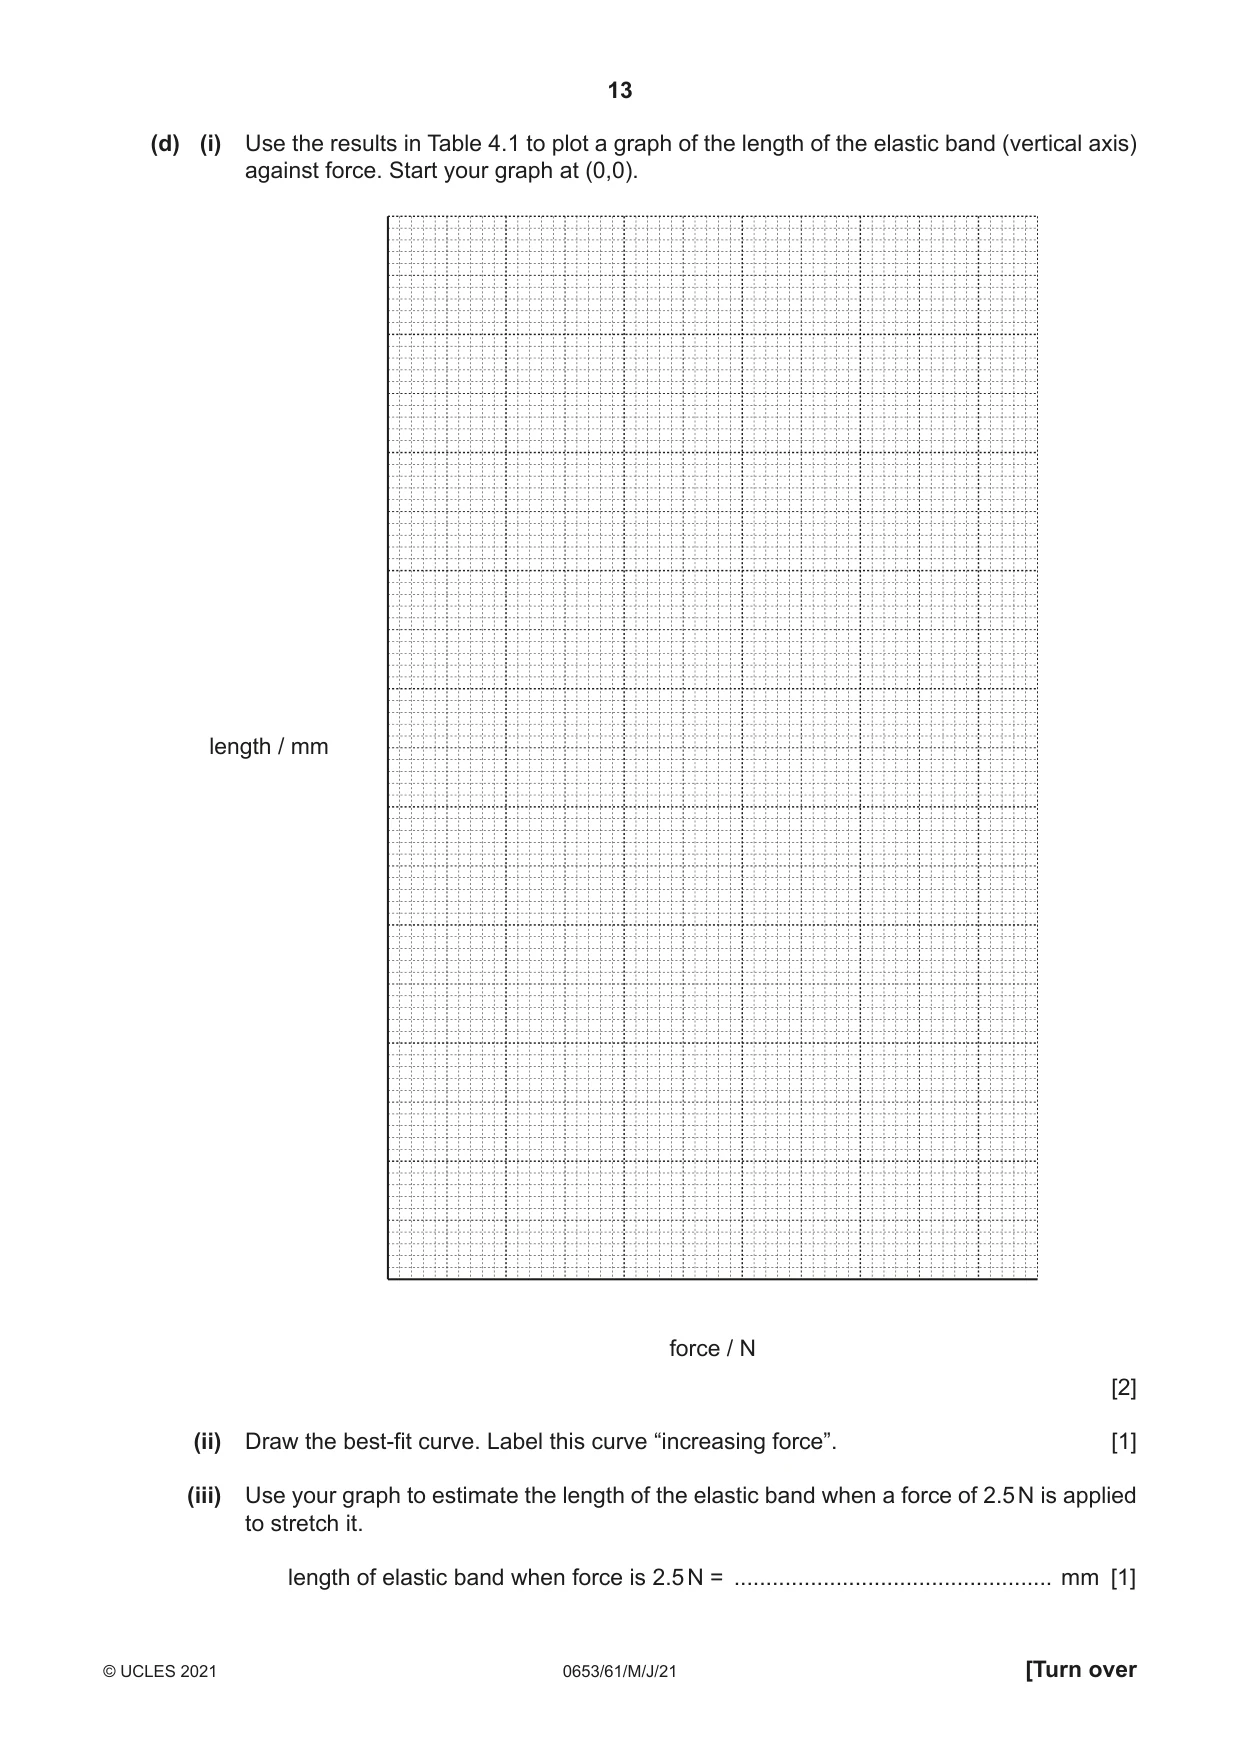
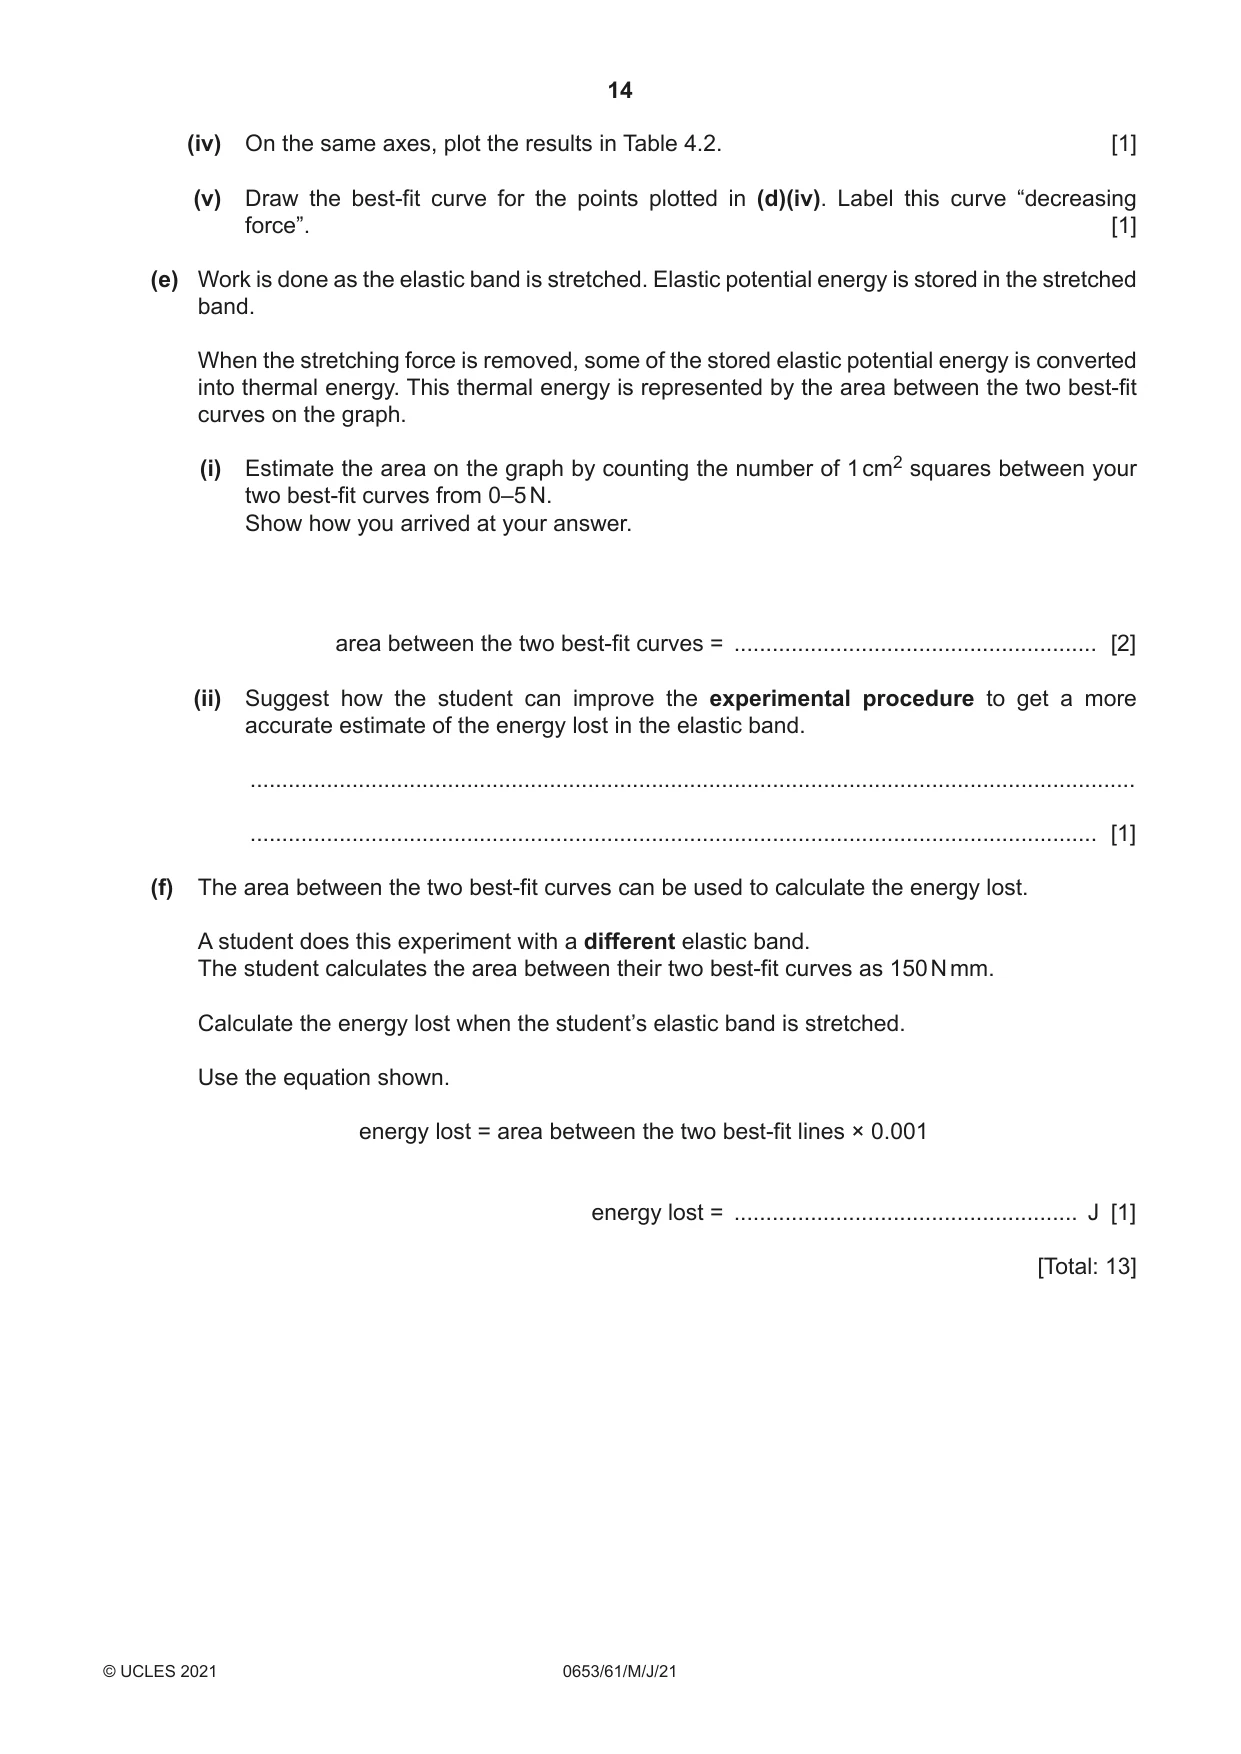
4 A student investigates how forces affect an elastic band. Fig. 4.1 shows the elastic band before it is used by the student. It is drawn full-size. The elastic band has not yet been stretched with any forces. unstretched elastic band A B Fig. 4.1 Procedure The student: • suspends the elastic band from a nail and carefully places a 100 g mass hanger onto the elastic band as shown in Fig. 4.2 nail boss elastic band 100 g mass hanger stand Fig. 4.2 • measures and records in Table 4.1 the stretched length of the elastic band • without removing the mass hanger, carefully adds a 100 g mass to the hanger • measures and records in Table 4.1 the stretched length of the elastic band • continues adding 100 g masses one at a time until a total of 500 g is suspended from the elastic band, recording the length each time • carefully removes the 100 g masses, one at a time • after removing each 100 g mass, measures and records in Table 4.2 the stretched length of the elastic band • measures the final length of the elastic band after the mass hanger has been removed. (a) Measure the unstretched length of the elastic band in Fig. 4.1 from point A to B to the nearest millimetre and record your result in Table 4.1. Table 4.1 mass force length of elastic band / g / N / mm 0 0 100 1.0 65 200 2.0 73 300 3.0 90 400 4.0 125 500 5.0 166 Table 4.2 mass force length of elastic band / g / N / mm 500 5.0 166 400 4.0 152 300 3.0 136 200 2.0 107 100 1.0 78 0 0 64 [1] (b) Explain why the student wears safety goggles during this experiment. ................................................................................................................................................... ............................................................................................................................................. [1] (c) Use the information in Table 4.1 to deduce the force exerted by a 650 g mass. force = ..................................................... N [1]
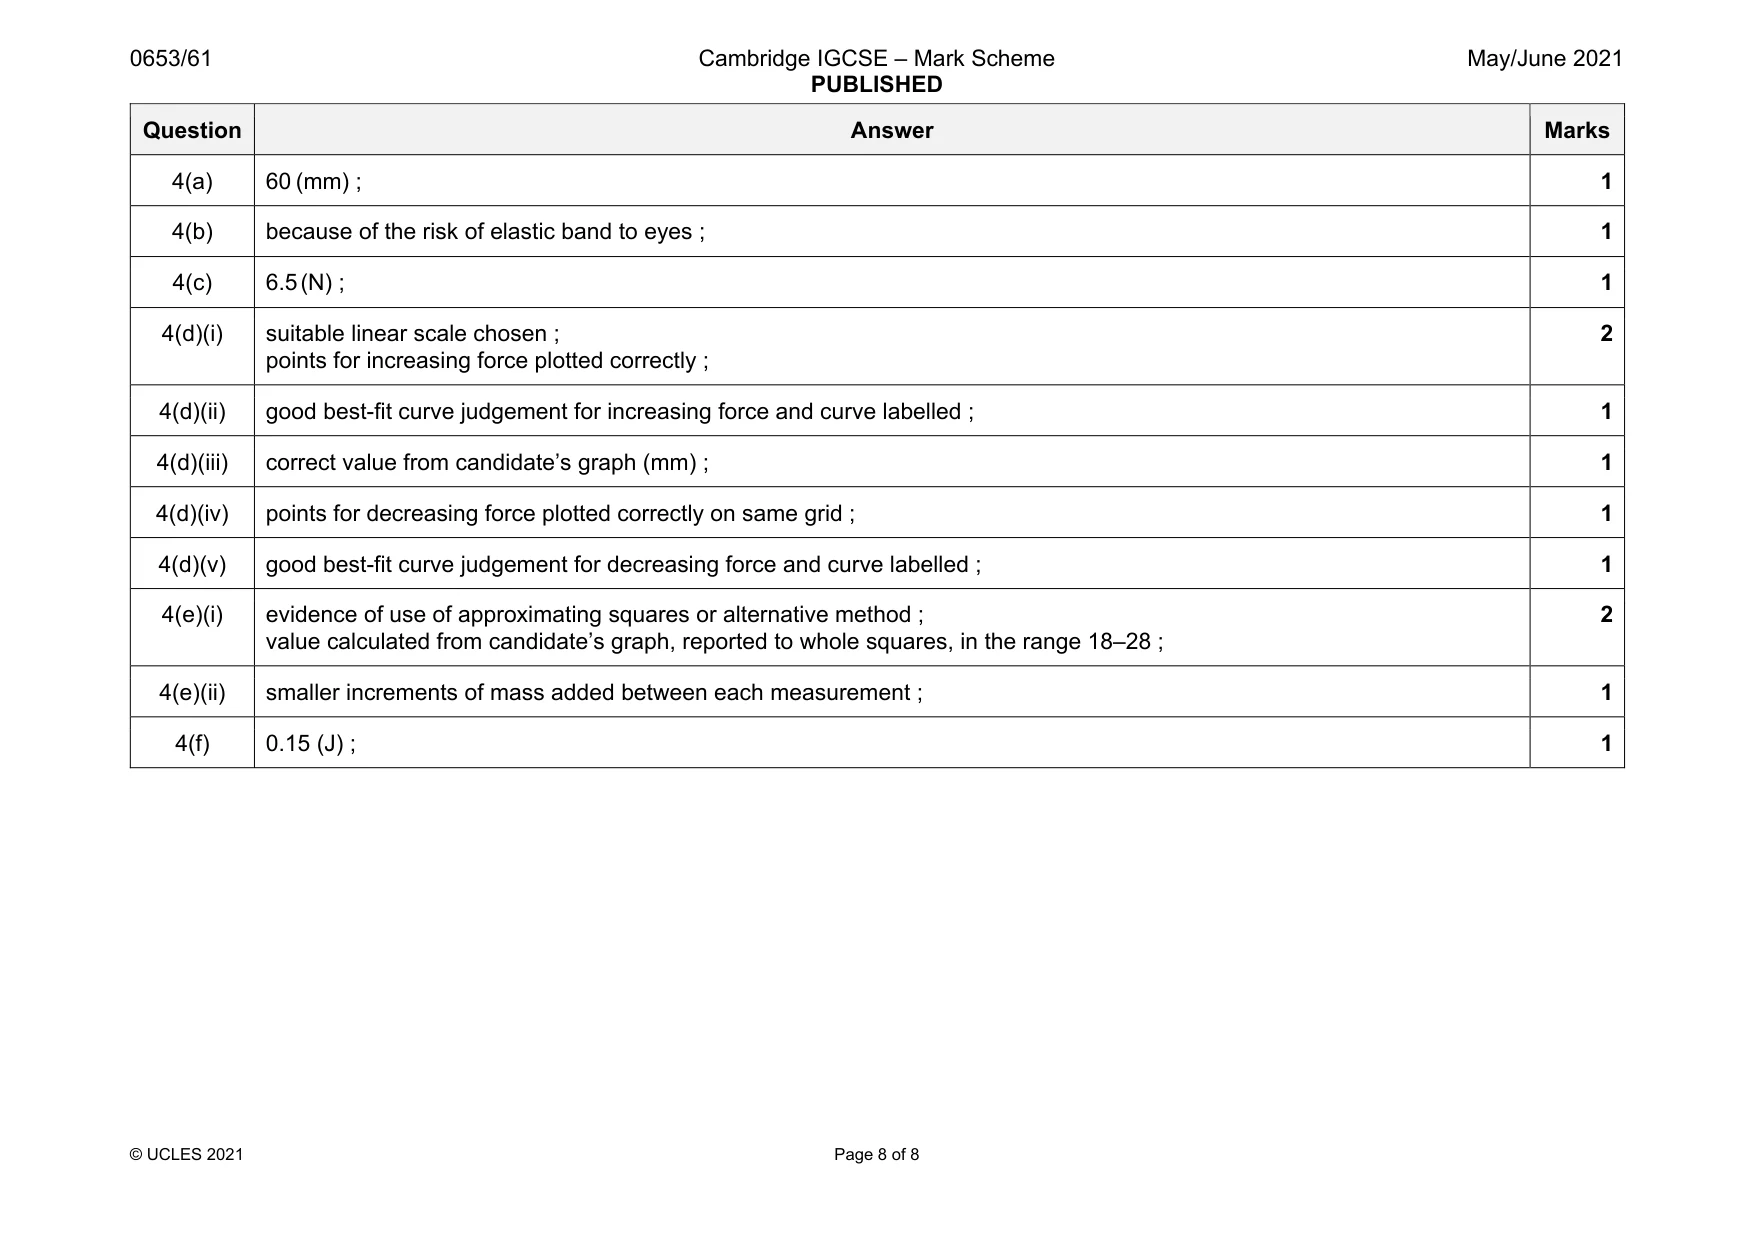
Mark scheme: 4(a) 60 (mm) ; 1 4(b) because of the risk of elastic band to eyes ; 1 4(c) 6.5(N) ; 1 4(d)(i) suitable linear scale chosen ; points for increasing force plotted correctly ; 2 4(d)(ii) good best-fit curve judgement for increasing force and curve labelled ; 1 4(d)(iii) correct value from candidate’s graph (mm) ; 1 4(d)(iv) points for decreasing force plotted correctly on same grid ; 1 4(d)(v) good best-fit curve judgement for decreasing force and curve labelled ; 1 4(e)(i) evidence of use of approximating squares or alternative method ; value calculated from candidate’s graph, reported to whole squares, in the range 18–28 ; 2 4(e)(ii) smaller increments of mass added between each measurement ; 1 4(f) 0.15 (J) ; 1
More questions on Physical quantities and measurement techniques
What was in this paper
The subtopics covered by these 4 questions, and how many questions each got. Open one in a new tab to see every Cambridge question on it.
What you needed in this session
Cambridge’s own grade thresholds for 2021 May/June, Paper 6 · Variant 1. A higher threshold means an easier paper — the bar moves with how the cohort did.