Cambridge IGCSE Science - Combined 0653 — 2020 May/June Paper 6 · Variant 3
0653/63/M/J/20 · 4 questions · 40 marks · ≈45 min
The question paper and its mark scheme, free to read here and free to download. This is Cambridge’s own paper, exactly as it was sat.
Question paper16 pages


Mark scheme7 pages
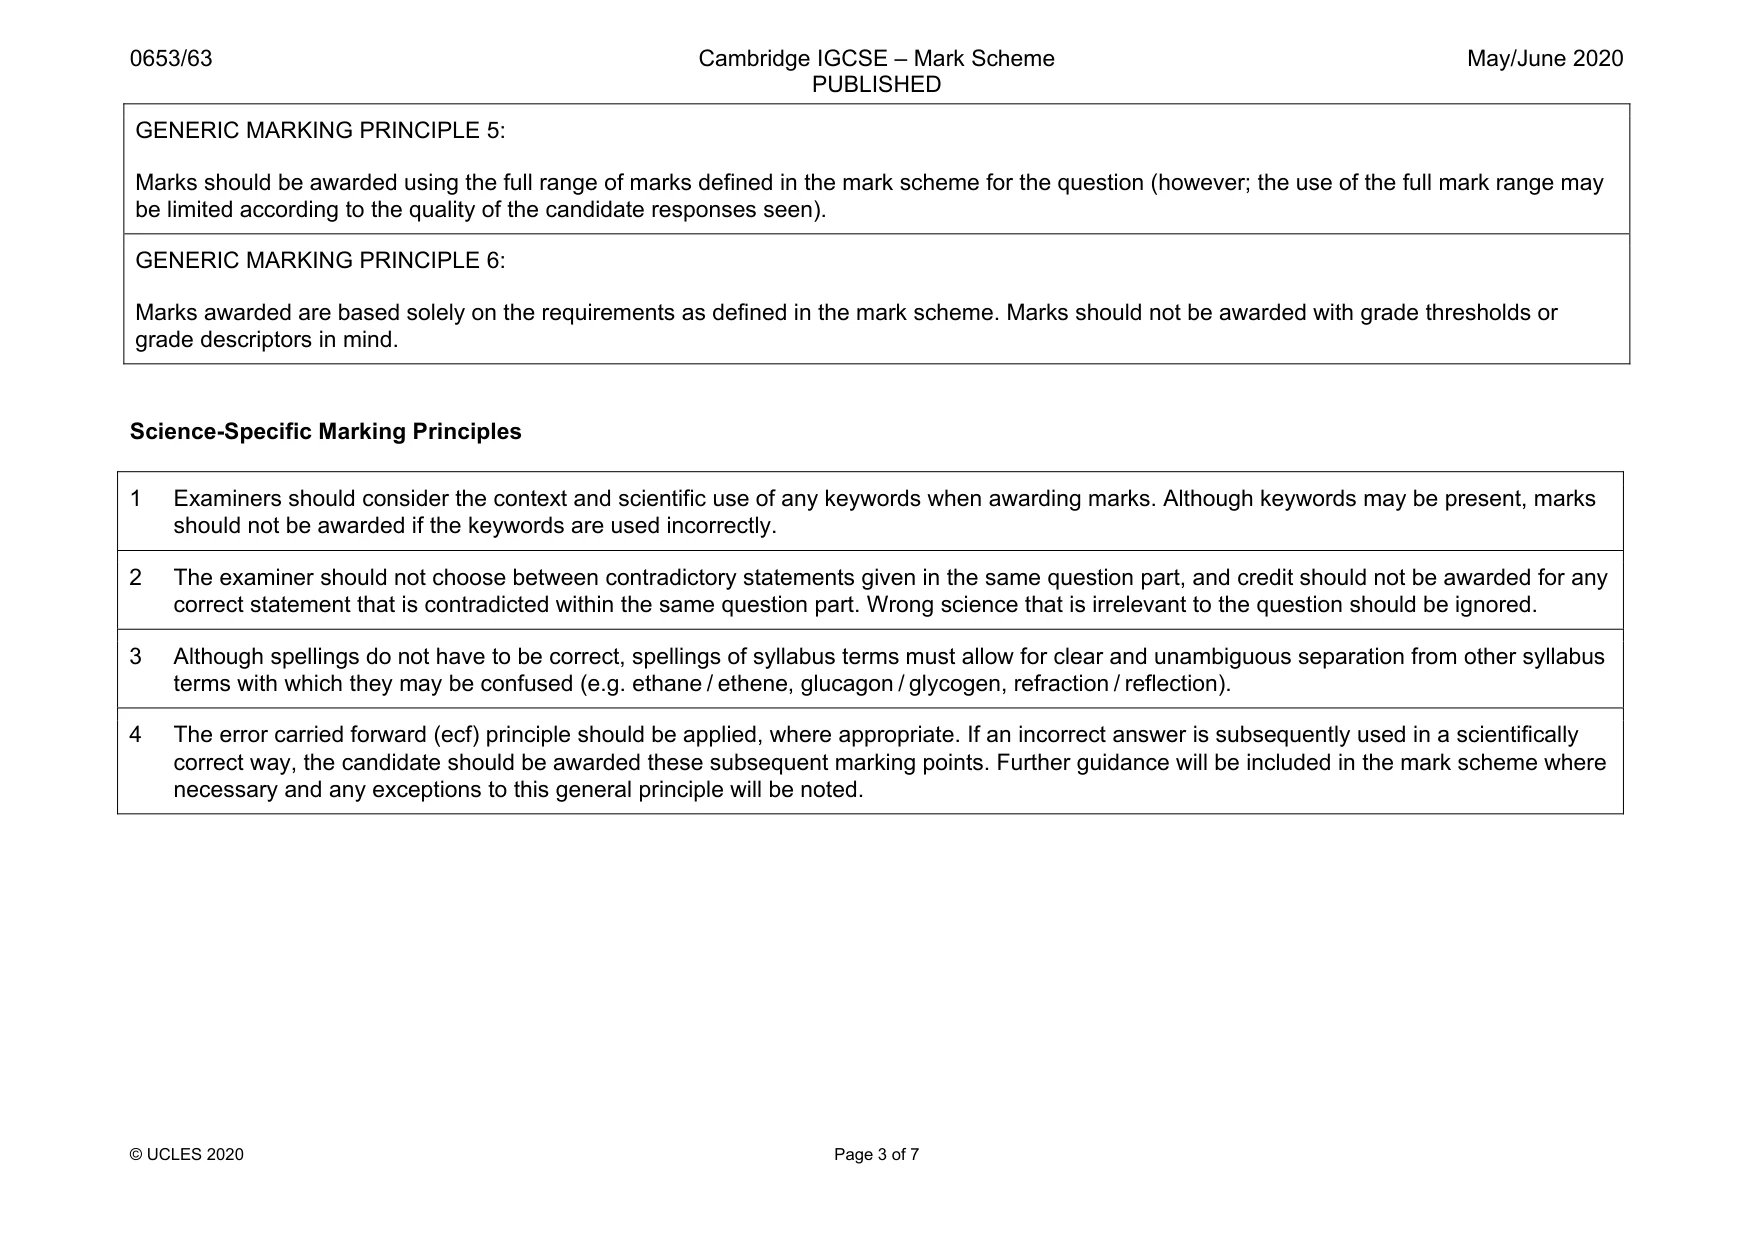
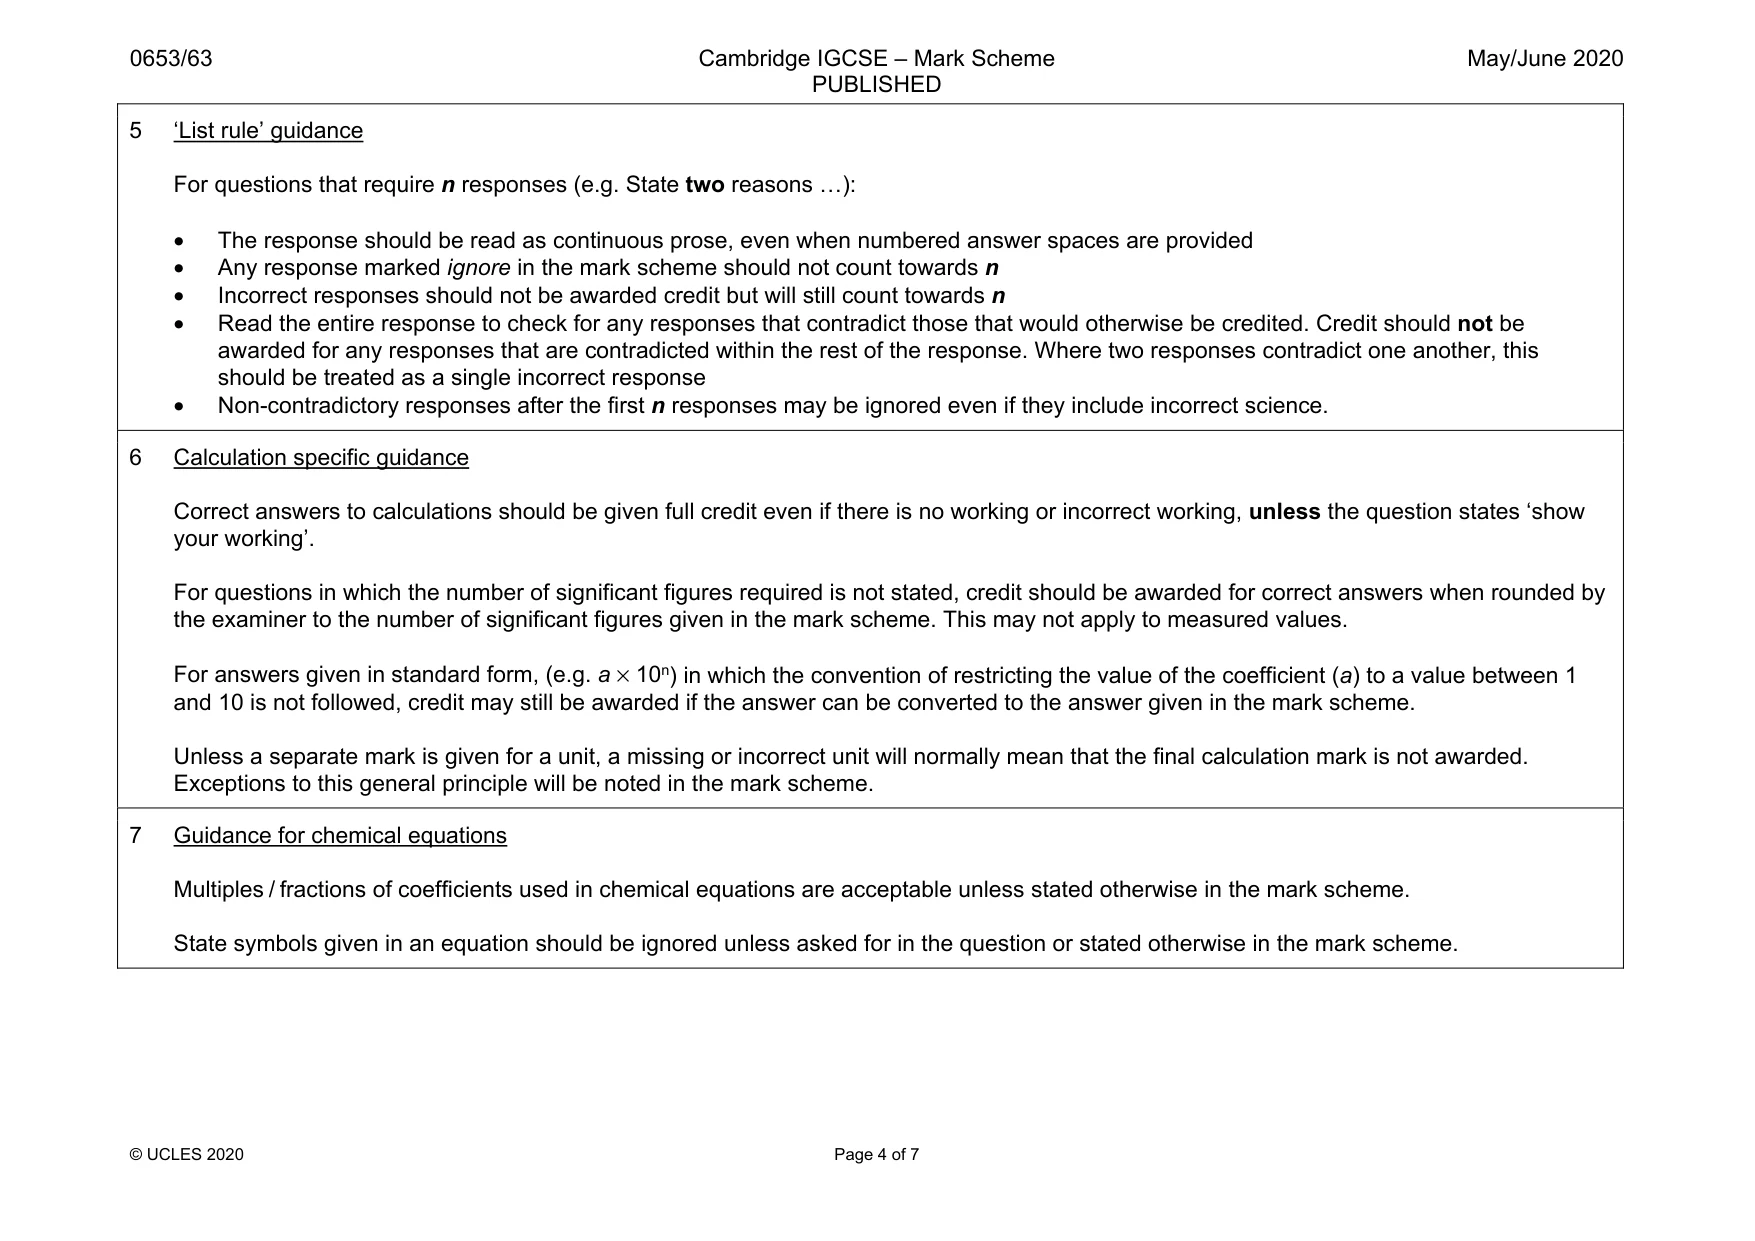
Answers below. Sit the paper first if you are practising.
Questions as text
Q1 · A student investigates the effect of temperature on the uptake of water by a stem
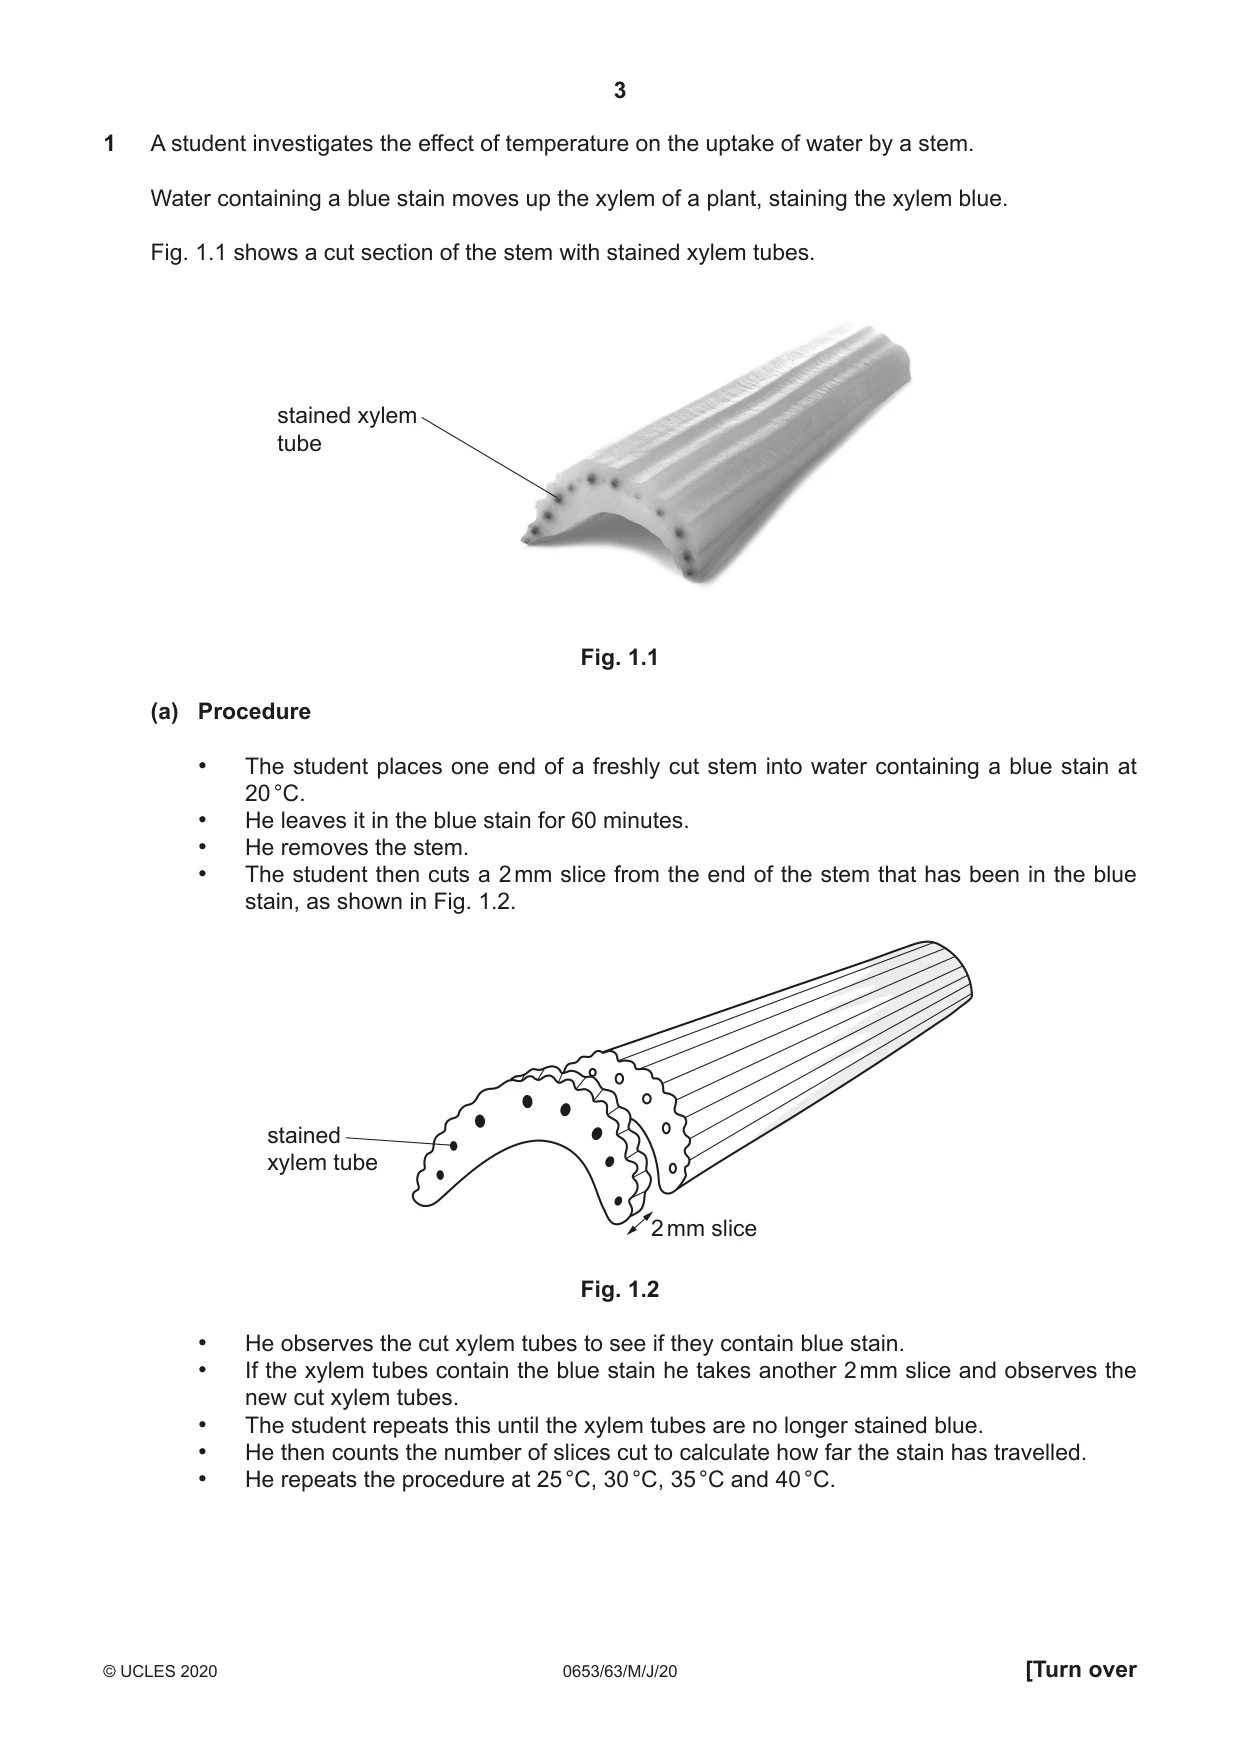
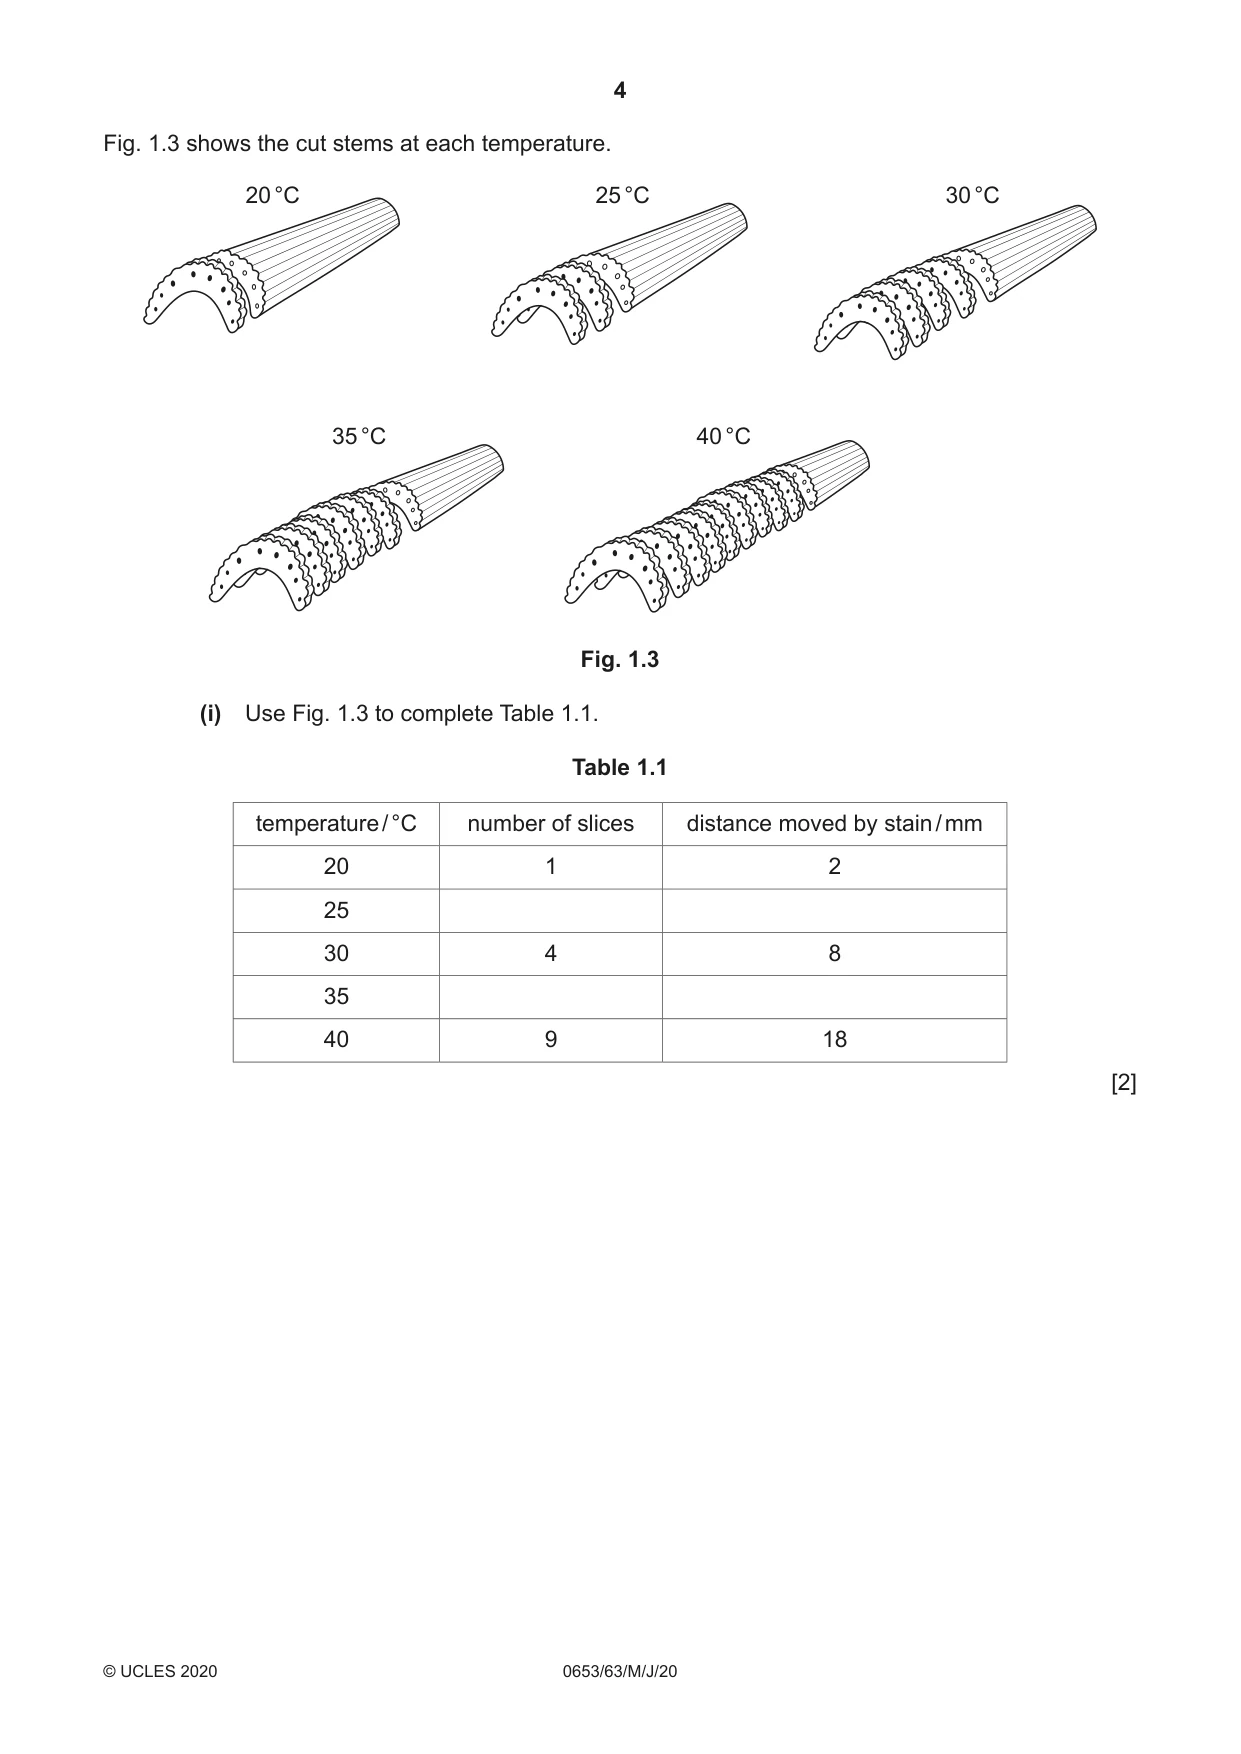
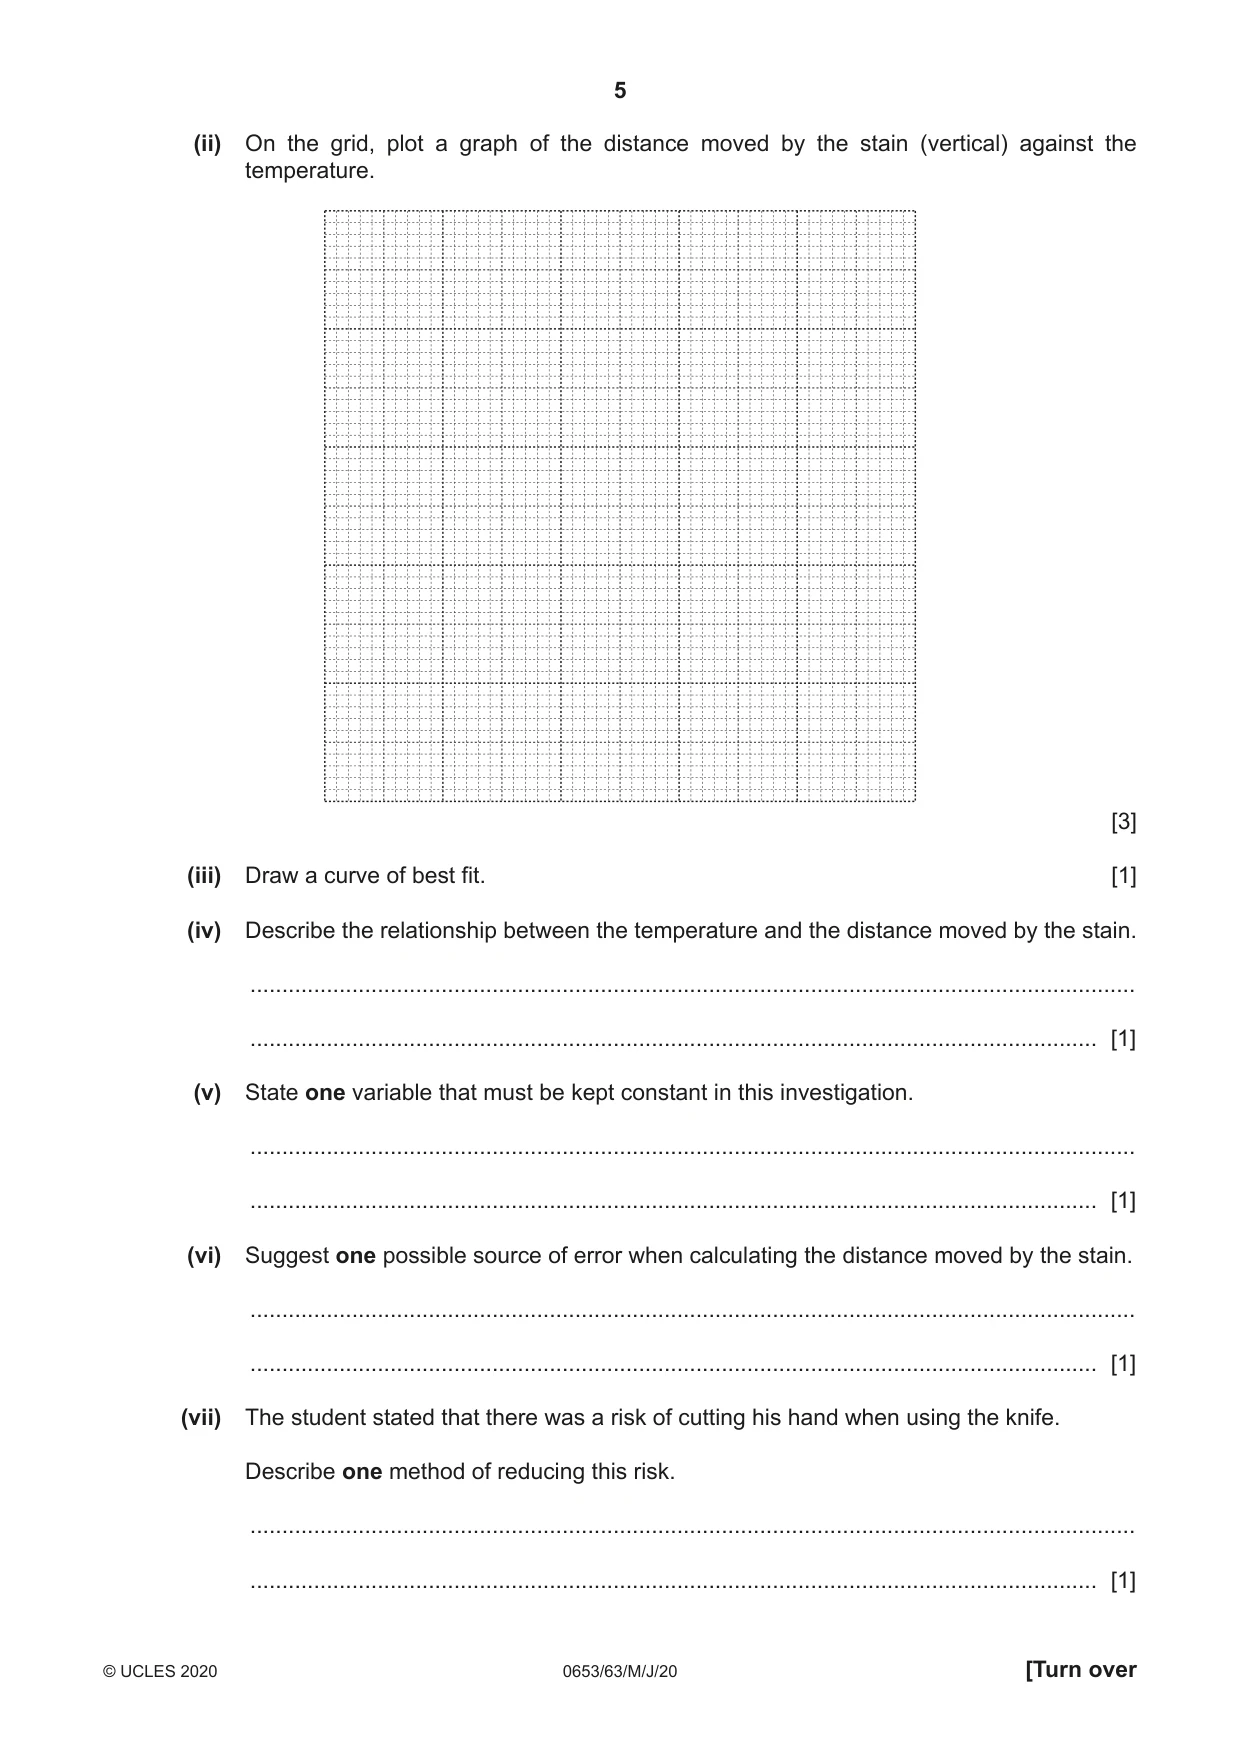
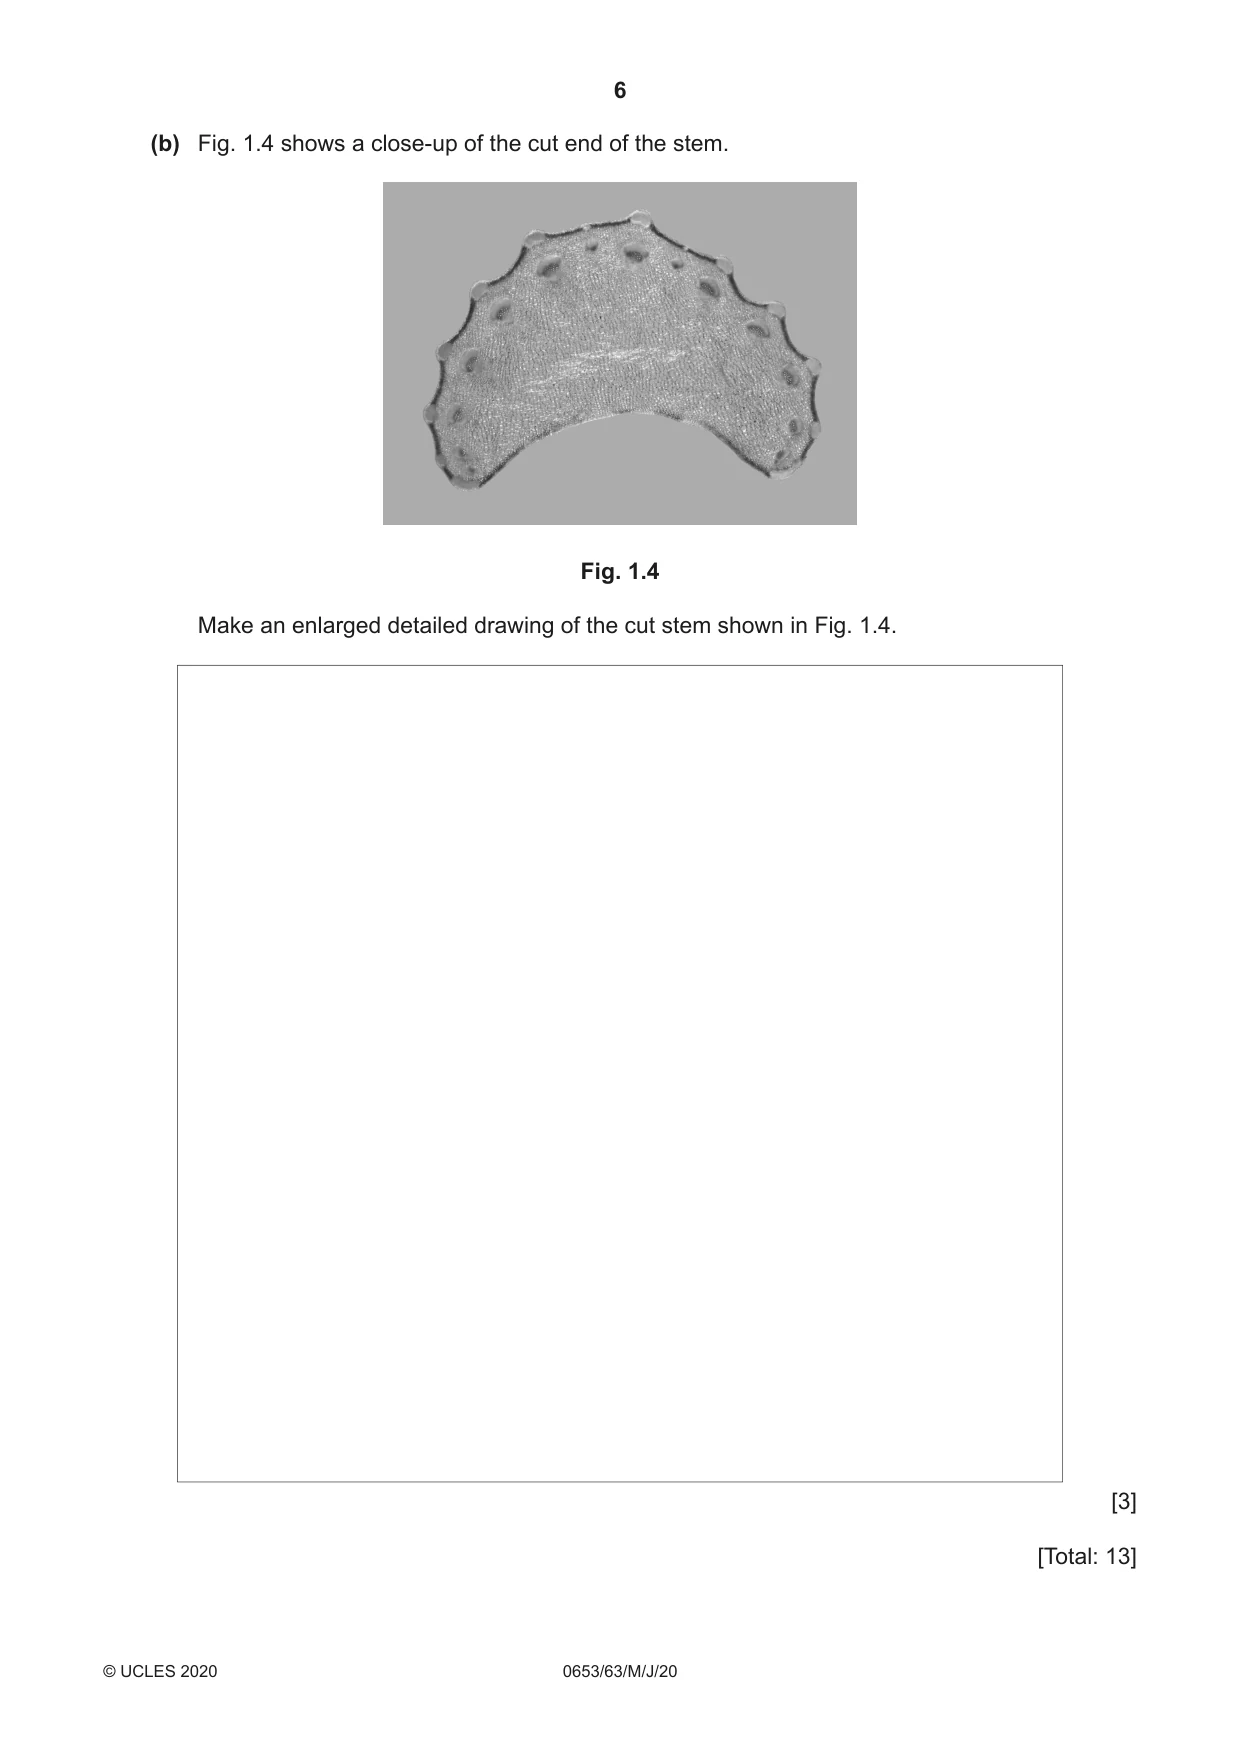
1 A student investigates the effect of temperature on the uptake of water by a stem. Water containing a blue stain moves up the xylem of a plant, staining the xylem blue. Fig. 1.1 shows a cut section of the stem with stained xylem tubes. stained xylem tube Fig. 1.1 (a) Procedure • The student places one end of a freshly cut stem into water containing a blue stain at 20 °C. • He leaves it in the blue stain for 60 minutes. • He removes the stem. • The student then cuts a 2 mm slice from the end of the stem that has been in the blue stain, as shown in Fig. 1.2. stained xylem tube 2 mm slice Fig. 1.2 • He observes the cut xylem tubes to see if they contain blue stain. • If the xylem tubes contain the blue stain he takes another 2 mm slice and observes the new cut xylem tubes. • The student repeats this until the xylem tubes are no longer stained blue. • He then counts the number of slices cut to calculate how far the stain has travelled. • He repeats the procedure at 25 °C, 30 °C, 35 °C and 40 °C. Fig. 1.3 shows the cut stems at each temperature. 20 °C 25 °C 30 °C 35 °C 40 °C Fig. 1.3 (i) Use Fig. 1.3 to complete Table 1.1. Table 1.1 temperature / °C number of slices distance moved by stain / mm 20 1 2 25 30 4 8 35 40 9 18 [2] (ii) On the grid, plot a graph of the distance moved by the stain (vertical) against the temperature. [3] (iii) Draw a curve of best fit. [1] (iv) Describe the relationship between the temperature and the distance moved by the stain. ........................................................................................................................................... ..................................................................................................................................... [1] (v) State one variable that must be kept constant in this investigation. ........................................................................................................................................... ..................................................................................................................................... [1] (vi) Suggest one possible source of error when calculating the distance moved by the stain. ........................................................................................................................................... ..................................................................................................................................... [1] (vii) The student stated that there was a risk of cutting his hand when using the knife. Describe one method of reducing this risk. ........................................................................................................................................... ..................................................................................................................................... [1] (b) Fig. 1.4 shows a close-up of the cut end of the stem. Fig. 1.4 Make an enlarged detailed drawing of the cut stem shown in Fig. 1.4. [3] [Total: 13]
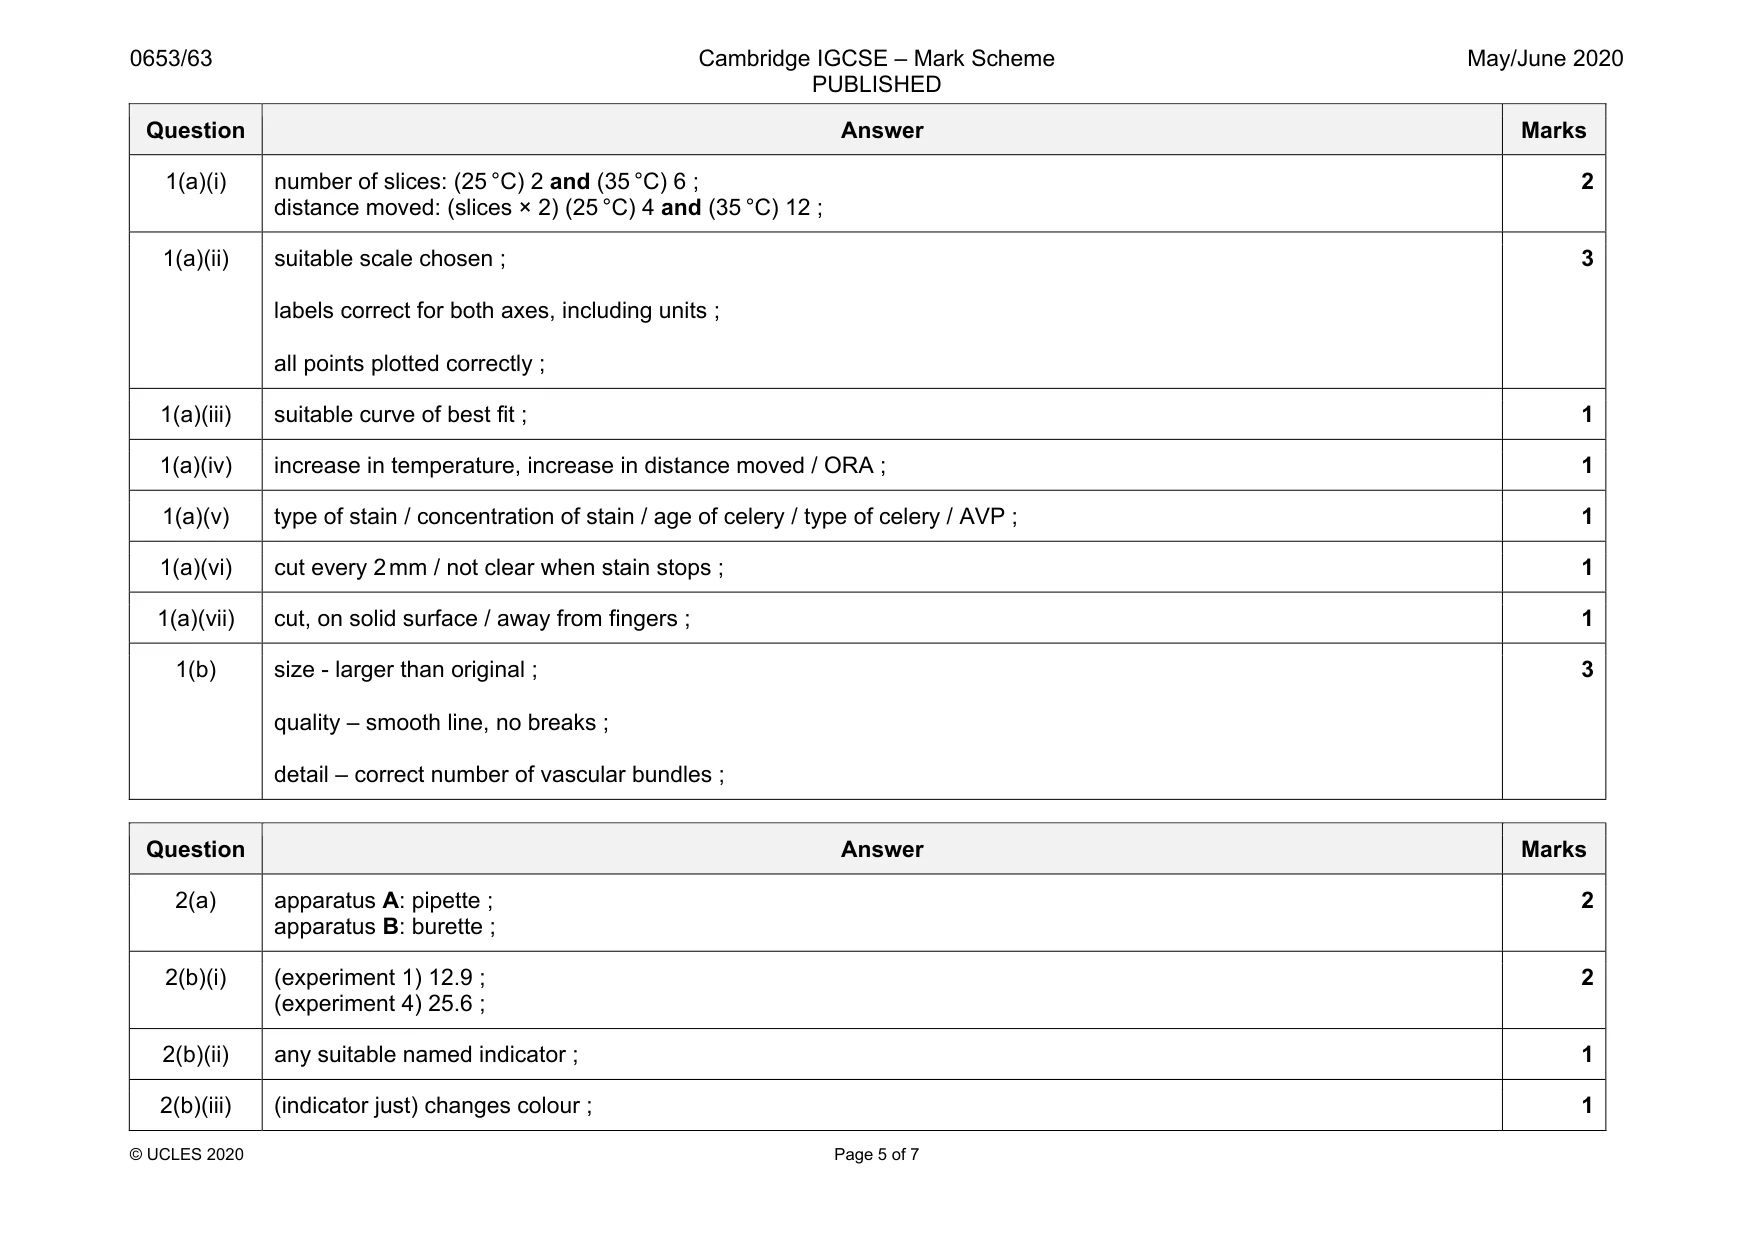
Mark scheme: 1(a)(i) number of slices: (25 °C) 2 and (35 °C) 6 ; distance moved: (slices × 2) (25 °C) 4 and (35 °C) 12 ; 2 1(a)(ii) suitable scale chosen ; labels correct for both axes, including units ; all points plotted correctly ; 3 1(a)(iii) suitable curve of best fit ; 1 1(a)(iv) increase in temperature, increase in distance moved / ORA ; 1 1(a)(v) type of stain / concentration of stain / age of celery / type of celery / AVP ; 1 1(a)(vi) cut every 2mm / not clear when stain stops ; 1 1(a)(vii) cut, on solid surface / away from fingers ; 1 1(b) size - larger than original ; quality – smooth line, no breaks ; detail – correct number of vascular bundles ; 3
Q2 · A student performs an experiment to determine the volume of dilute hydrochloric acid…
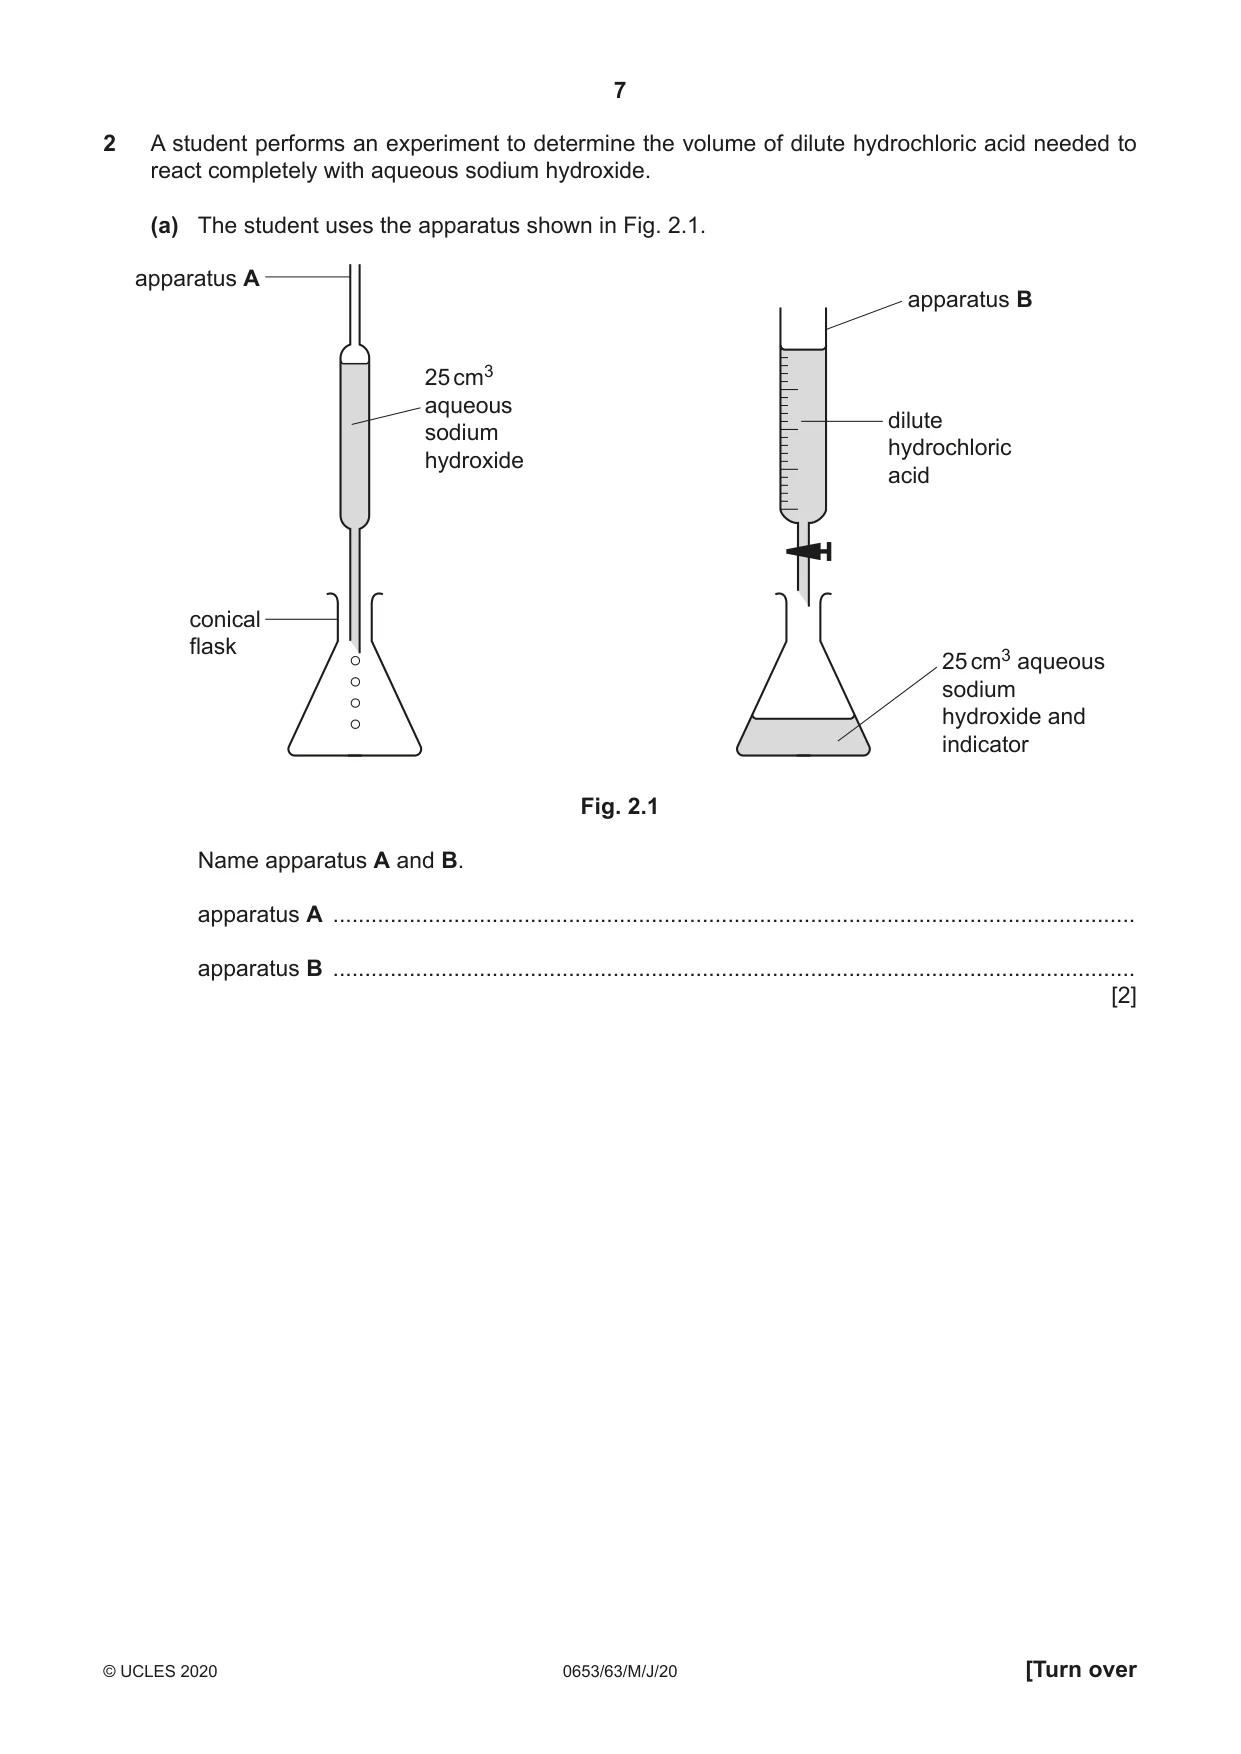
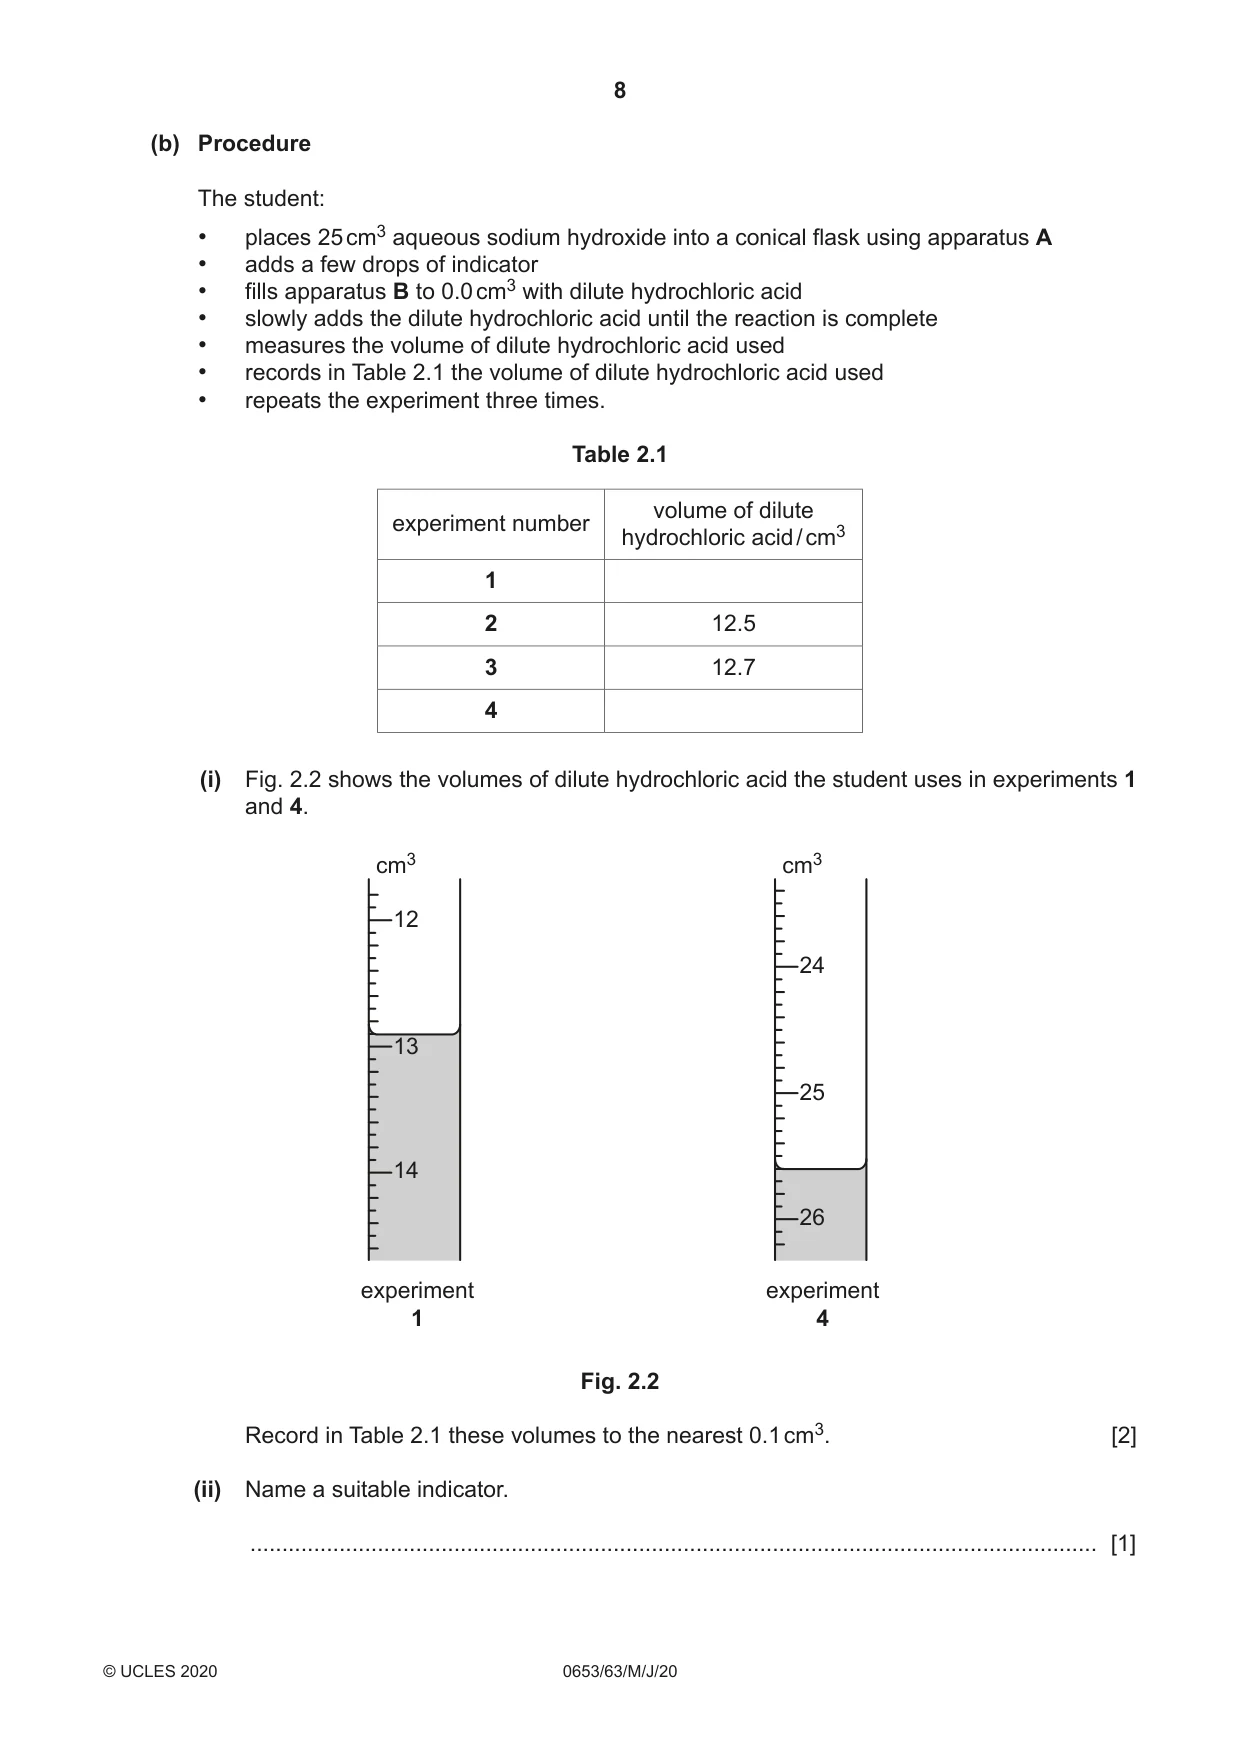
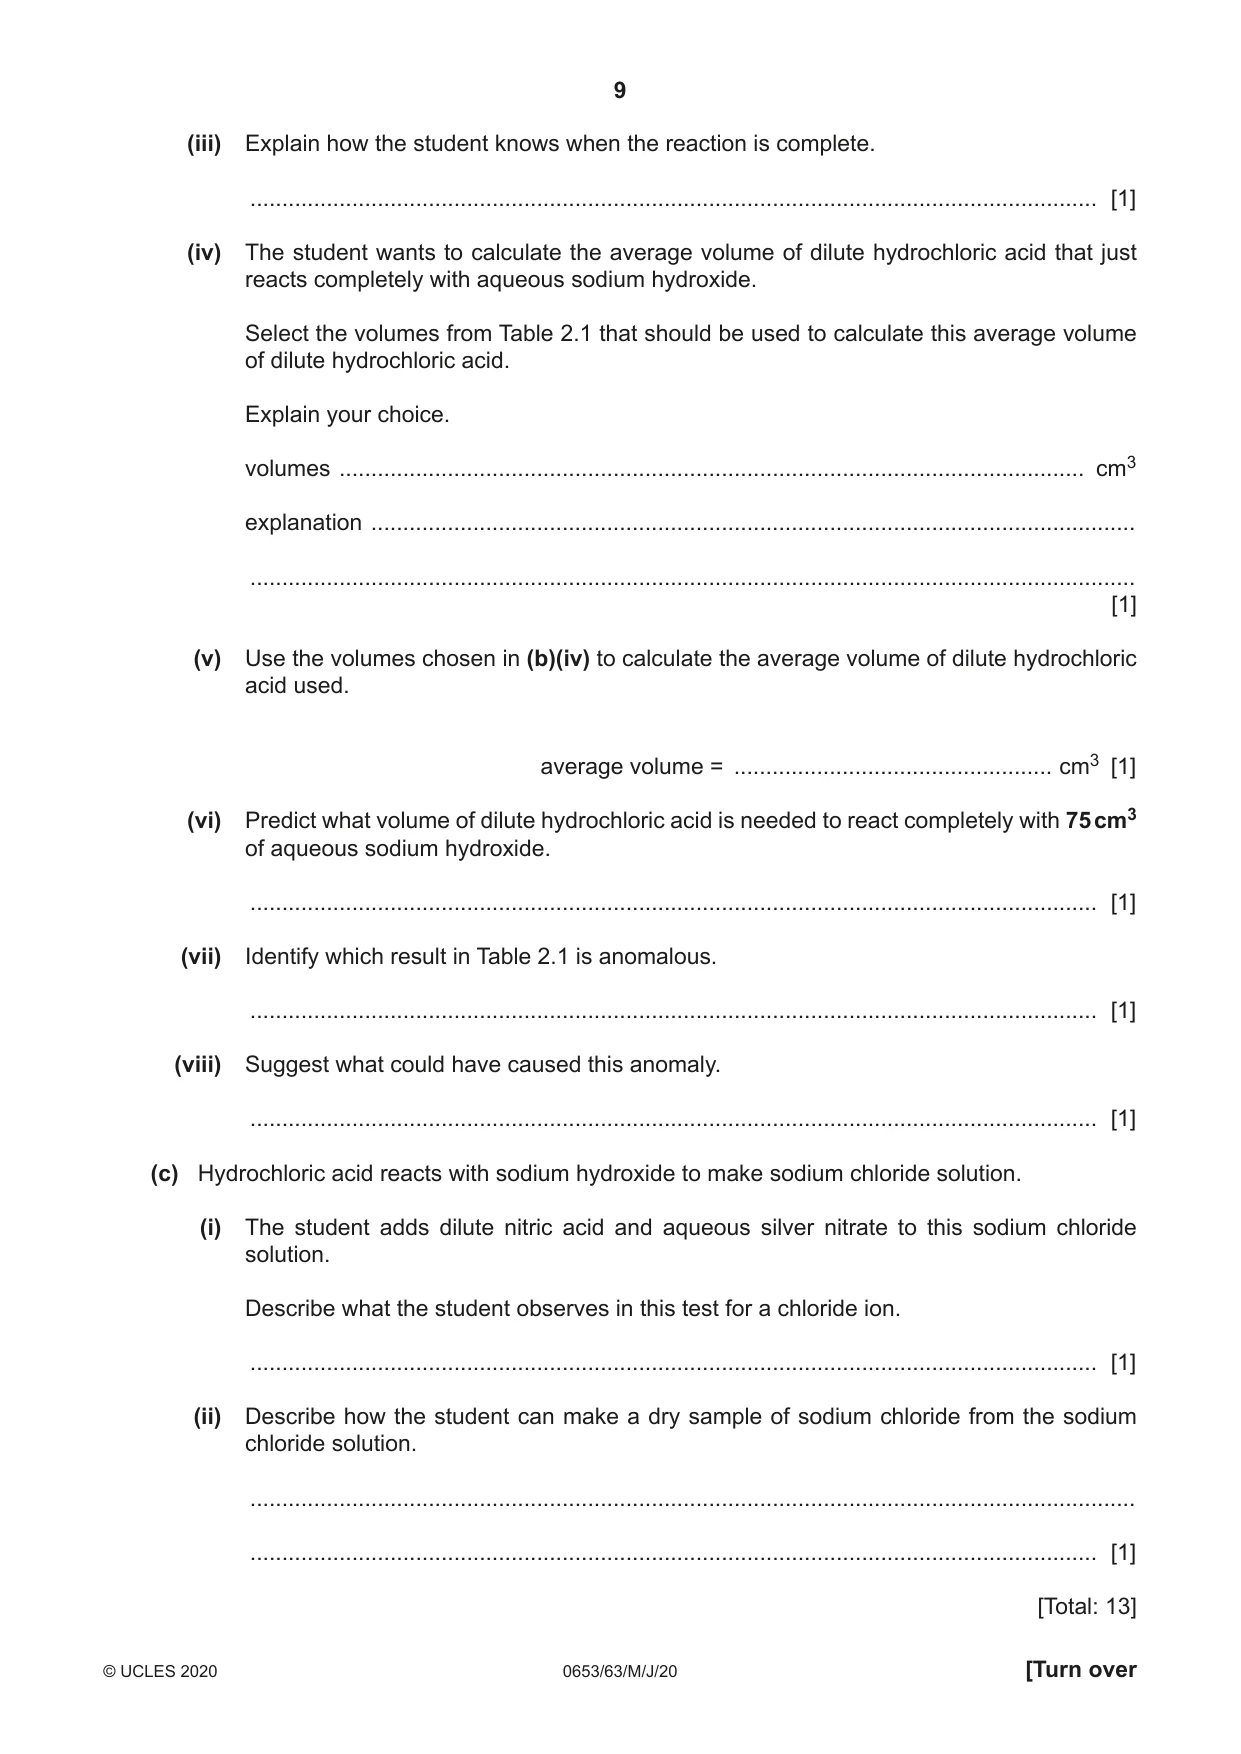
2 A student performs an experiment to determine the volume of dilute hydrochloric acid needed to react completely with aqueous sodium hydroxide. (a) The student uses the apparatus shown in Fig. 2.1. apparatus A apparatus B 25 cm3 aqueous dilute sodium hydrochloric hydroxide acid conical flask 25 cm3 aqueous sodium hydroxide and indicator Fig. 2.1 Name apparatus A and B. apparatus A .............................................................................................................................. apparatus B .............................................................................................................................. [2] (b) Procedure The student: • places 25 cm3 aqueous sodium hydroxide into a conical flask using apparatus A • adds a few drops of indicator • fills apparatus B to 0.0 cm3 with dilute hydrochloric acid • slowly adds the dilute hydrochloric acid until the reaction is complete • measures the volume of dilute hydrochloric acid used • records in Table 2.1 the volume of dilute hydrochloric acid used • repeats the experiment three times. Table 2.1 volume of dilute experiment number hydrochloric acid / cm3 1 2 12.5 3 12.7 4 (i) Fig. 2.2 shows the volumes of dilute hydrochloric acid the student uses in experiments 1 and 4. cm3 cm3 12 24 13 25 14 26 experiment experiment 1 4 Fig. 2.2 Record in Table 2.1 these volumes to the nearest 0.1 cm3. [2] (ii) Name a suitable indicator. ..................................................................................................................................... [1] (iii) Explain how the student knows when the reaction is complete. ..................................................................................................................................... [1] (iv) The student wants to calculate the average volume of dilute hydrochloric acid that just reacts completely with aqueous sodium hydroxide. Select the volumes from Table 2.1 that should be used to calculate this average volume of dilute hydrochloric acid. Explain your choice. volumes ..................................................................................................................... cm3 explanation ........................................................................................................................ ........................................................................................................................................... [1] (v) Use the volumes chosen in (b)(iv) to calculate the average volume of dilute hydrochloric acid used. average volume = .................................................. cm3 [1] (vi) Predict what volume of dilute hydrochloric acid is needed to react completely with 75 cm3 of aqueous sodium hydroxide. ..................................................................................................................................... [1] (vii) Identify which result in Table 2.1 is anomalous. ..................................................................................................................................... [1] (viii) Suggest what could have caused this anomaly. ..................................................................................................................................... [1] (c) Hydrochloric acid reacts with sodium hydroxide to make sodium chloride solution. (i) The student adds dilute nitric acid and aqueous silver nitrate to this sodium chloride solution. Describe what the student observes in this test for a chloride ion. ..................................................................................................................................... [1] (ii) Describe how the student can make a dry sample of sodium chloride from the sodium chloride solution. ........................................................................................................................................... ..................................................................................................................................... [1] [Total: 13]
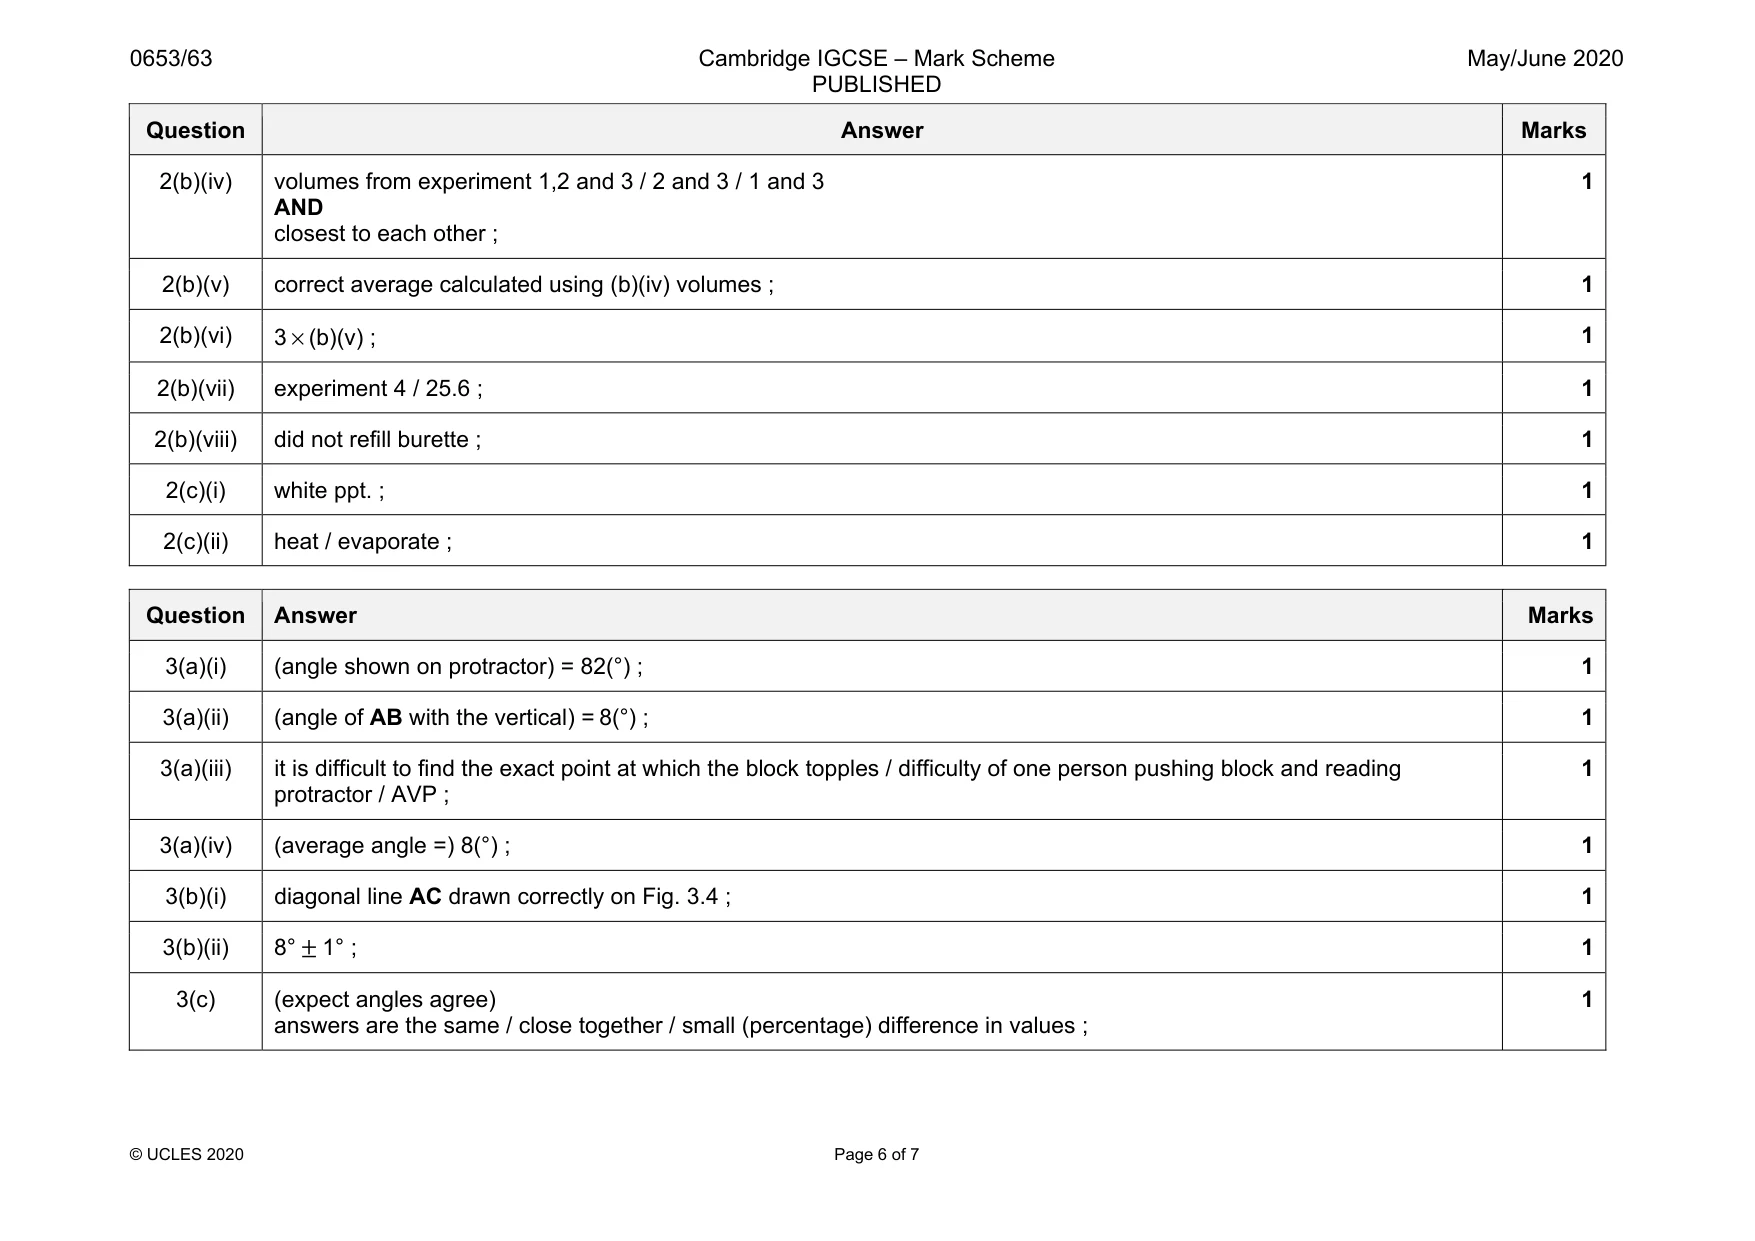
Mark scheme: 2(a) apparatus A: pipette ; apparatus B: burette ; 2 2(b)(i) (experiment 1) 12.9 ; (experiment 4) 25.6 ; 2 2(b)(ii) any suitable named indicator ; 1 2(b)(iii) (indicator just) changes colour ; 1 Question Answer Marks 2(b)(iv) volumes from experiment 1,2 and 3 / 2 and 3 / 1 and 3 AND closest to each other ; 1 2(b)(v) correct average calculated using (b)(iv) volumes ; 1 2(b)(vi) 3 × (b)(v) ; 1 2(b)(vii) experiment 4 / 25.6 ; 1 2(b)(viii) did not refill burette ; 1 2(c)(i) white ppt. ; 1 2(c)(ii) heat / evaporate ; 1
Q3 · A student investigates the stability of a plastic block
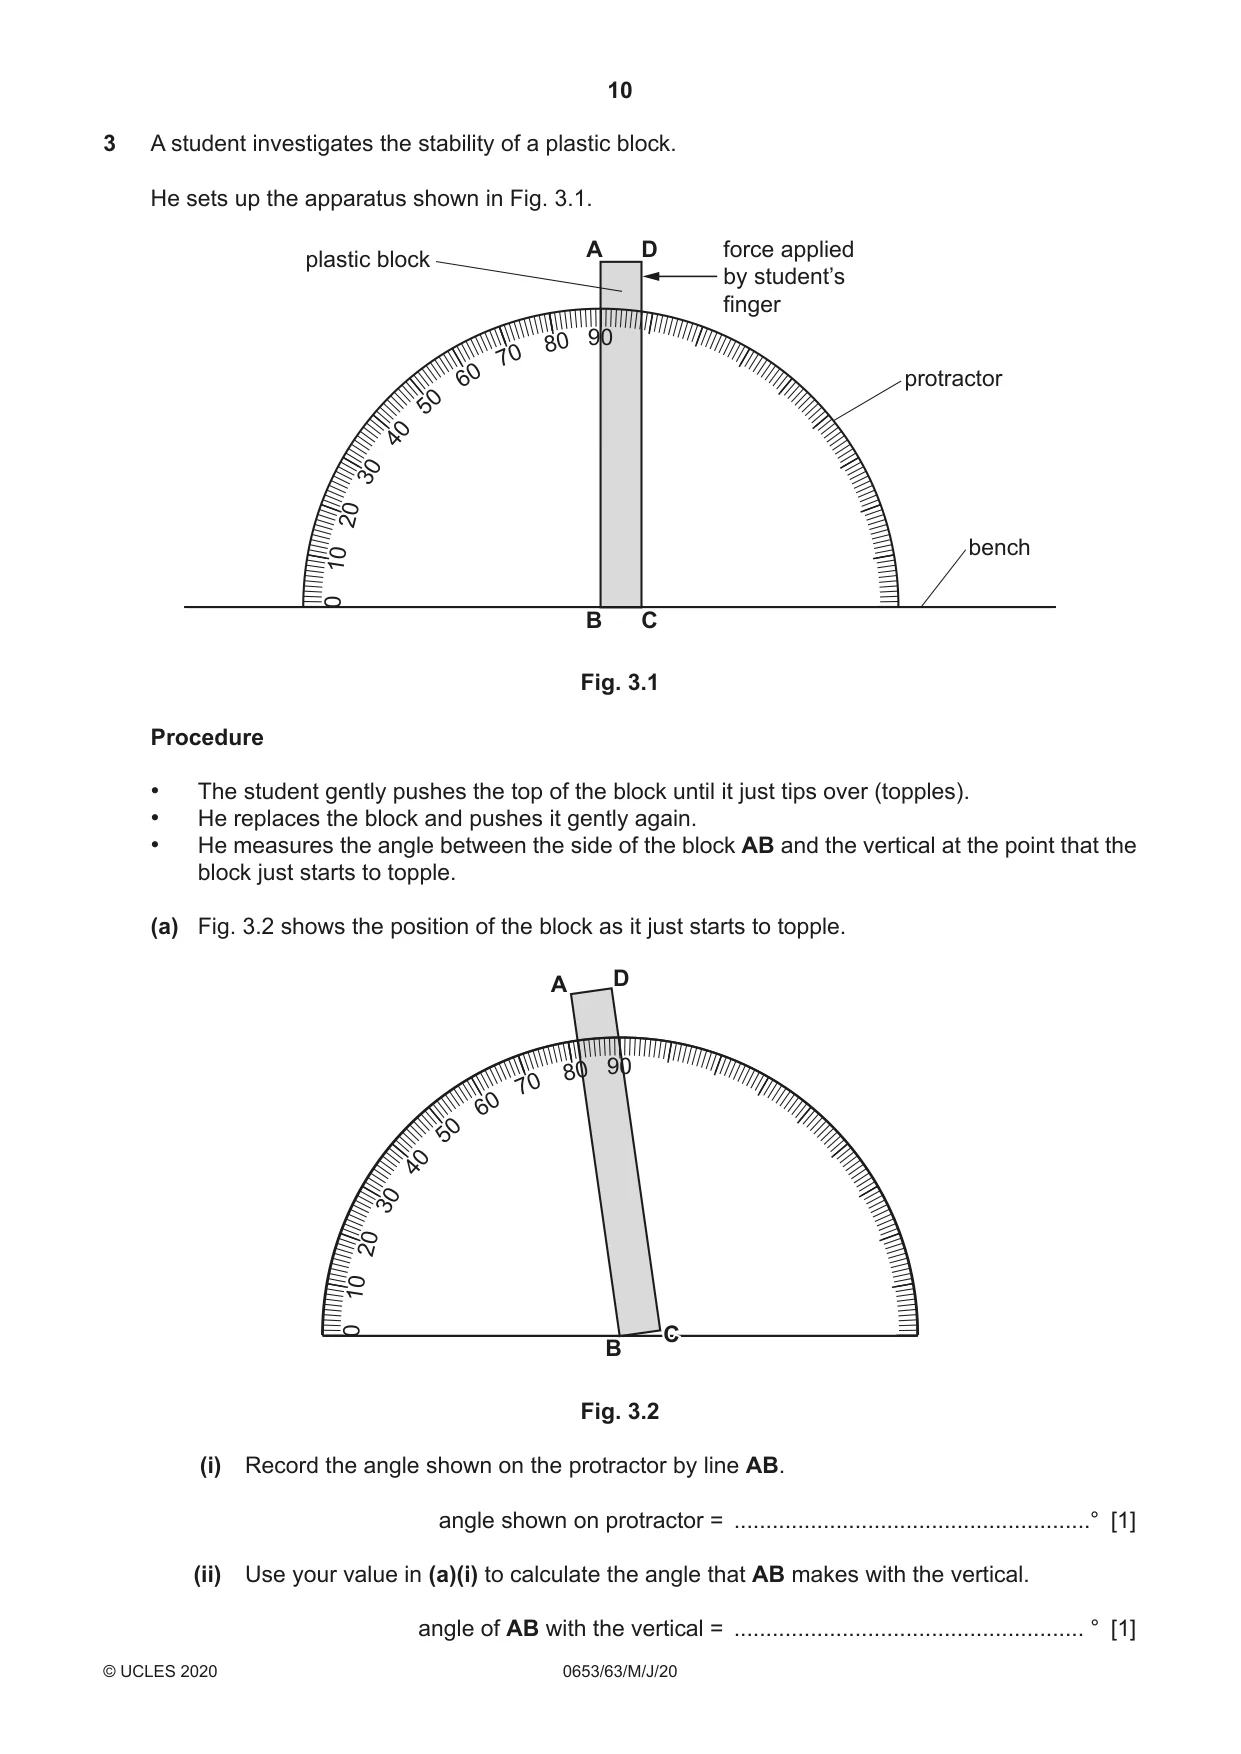
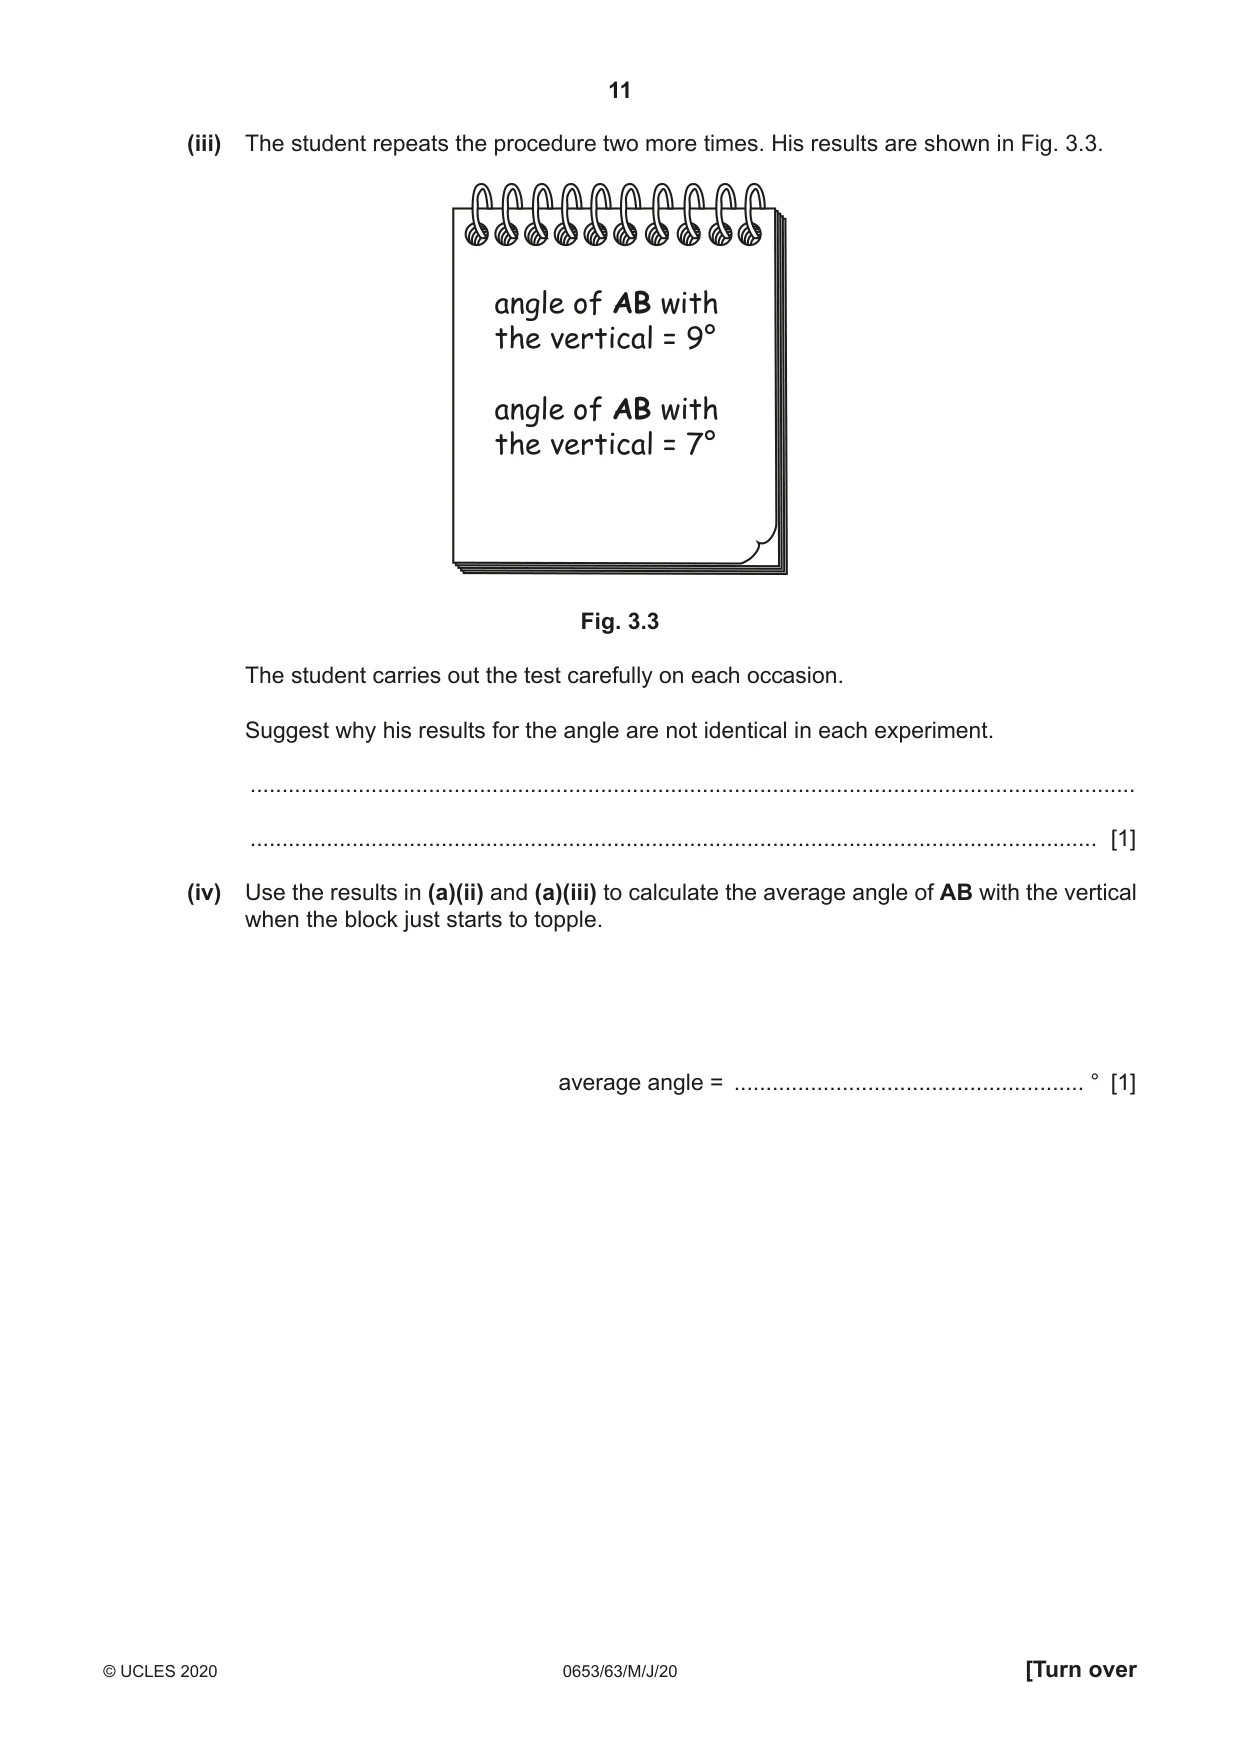
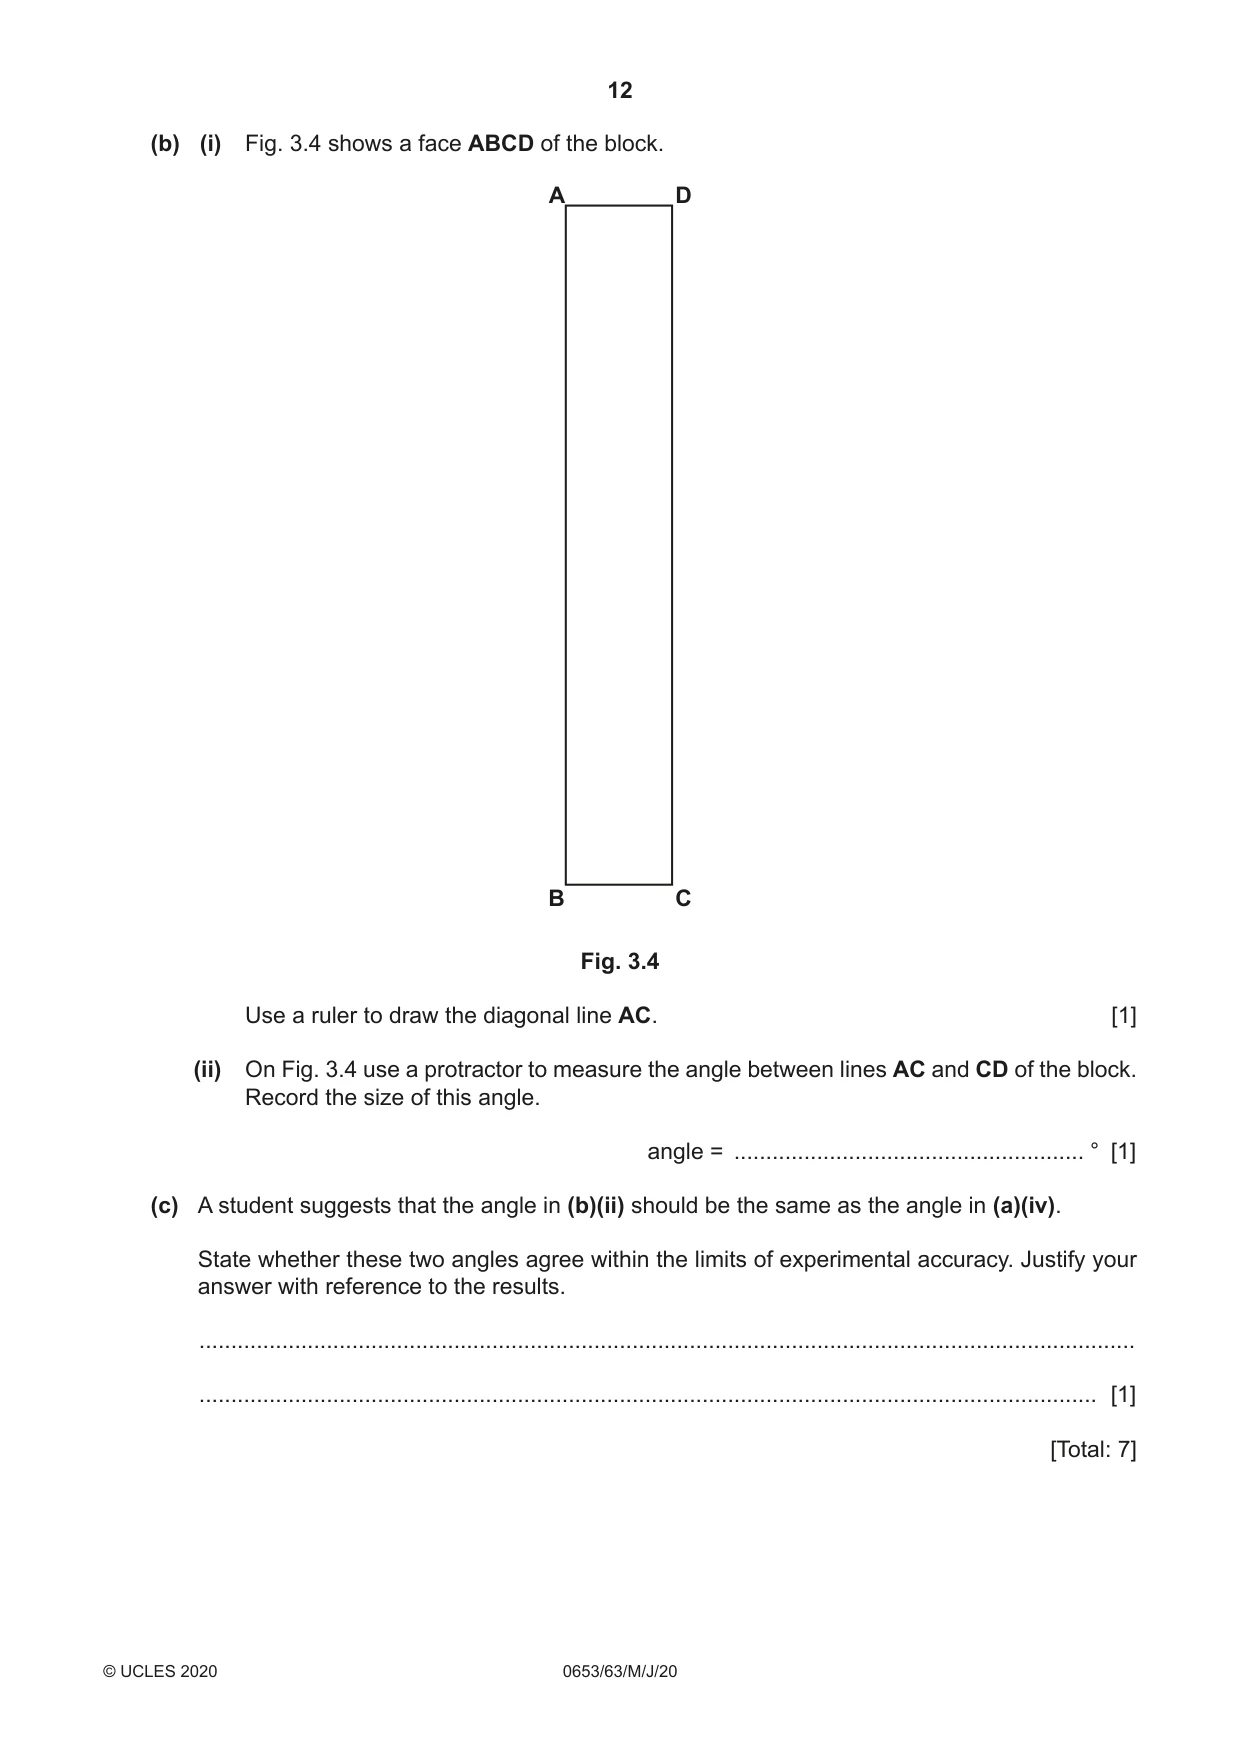
3 A student investigates the stability of a plastic block. He sets up the apparatus shown in Fig. 3.1. A D force applied plastic block by student’s finger 80 90 70 60 protractor 50 40 30 20 bench 10 0 B C Fig. 3.1 Procedure • The student gently pushes the top of the block until it just tips over (topples). • He replaces the block and pushes it gently again. • He measures the angle between the side of the block AB and the vertical at the point that the block just starts to topple. (a) Fig. 3.2 shows the position of the block as it just starts to topple. D A 80 90 70 60 50 40 30 20 10 0 C B Fig. 3.2 (i) Record the angle shown on the protractor by line AB. angle shown on protractor = ........................................................° [1] (ii) Use your value in (a)(i) to calculate the angle that AB makes with the vertical. angle of AB with the vertical = ....................................................... ° [1] (iii) The student repeats the procedure two more times. His results are shown in Fig. 3.3. angle of AB with the vertical = 9° angle of AB with the vertical = 7° Fig. 3.3 The student carries out the test carefully on each occasion. Suggest why his results for the angle are not identical in each experiment. ........................................................................................................................................... ..................................................................................................................................... [1] (iv) Use the results in (a)(ii) and (a)(iii) to calculate the average angle of AB with the vertical when the block just starts to topple. average angle = ....................................................... ° [1] (b) (i) Fig. 3.4 shows a face ABCD of the block. A D B C Fig. 3.4 Use a ruler to draw the diagonal line AC. [1] (ii) On Fig. 3.4 use a protractor to measure the angle between lines AC and CD of the block. Record the size of this angle. angle = ....................................................... ° [1] (c) A student suggests that the angle in (b)(ii) should be the same as the angle in (a)(iv). State whether these two angles agree within the limits of experimental accuracy. Justify your answer with reference to the results. ................................................................................................................................................... ............................................................................................................................................. [1] [Total: 7] Question 4 begins on page 14
Mark scheme: 3(a)(i) (angle shown on protractor) = 82(°) ; 1 3(a)(ii) (angle of AB with the vertical) = 8(°) ; 1 3(a)(iii) it is difficult to find the exact point at which the block topples / difficulty of one person pushing block and reading protractor / AVP ; 1 3(a)(iv) (average angle =) 8(°) ; 1 3(b)(i) diagonal line AC drawn correctly on Fig. 3.4 ; 1 3(b)(ii) 8° ± 1° ; 1 3(c) (expect angles agree) answers are the same / close together / small (percentage) difference in values ; 1
More questions on Physical quantities and measurement techniques
Q4 · When a ball is released at the top of a ramp (slope) it will roll to the bottom of the…
4 When a ball is released at the top of a ramp (slope) it will roll to the bottom of the ramp and then continue for some distance on a level surface before coming to rest. A student predicts that the distance travelled by a ball from the bottom of the ramp will be proportional to the height of the top of the ramp above the bench. Plan an investigation to test the student’s prediction. In your answer, include: • the apparatus you will use. You may include a diagram • a brief description of the method • the variables which will be controlled • the measurements you will make • how you will ensure that your results are as accurate as possible • how you will process your results to draw a conclusion. .......................................................................................................................................................... .......................................................................................................................................................... .......................................................................................................................................................... .......................................................................................................................................................... .......................................................................................................................................................... .......................................................................................................................................................... .......................................................................................................................................................... .......................................................................................................................................................... .......................................................................................................................................................... .......................................................................................................................................................... .......................................................................................................................................................... .......................................................................................................................................................... .................................................................................................................................................... [7]
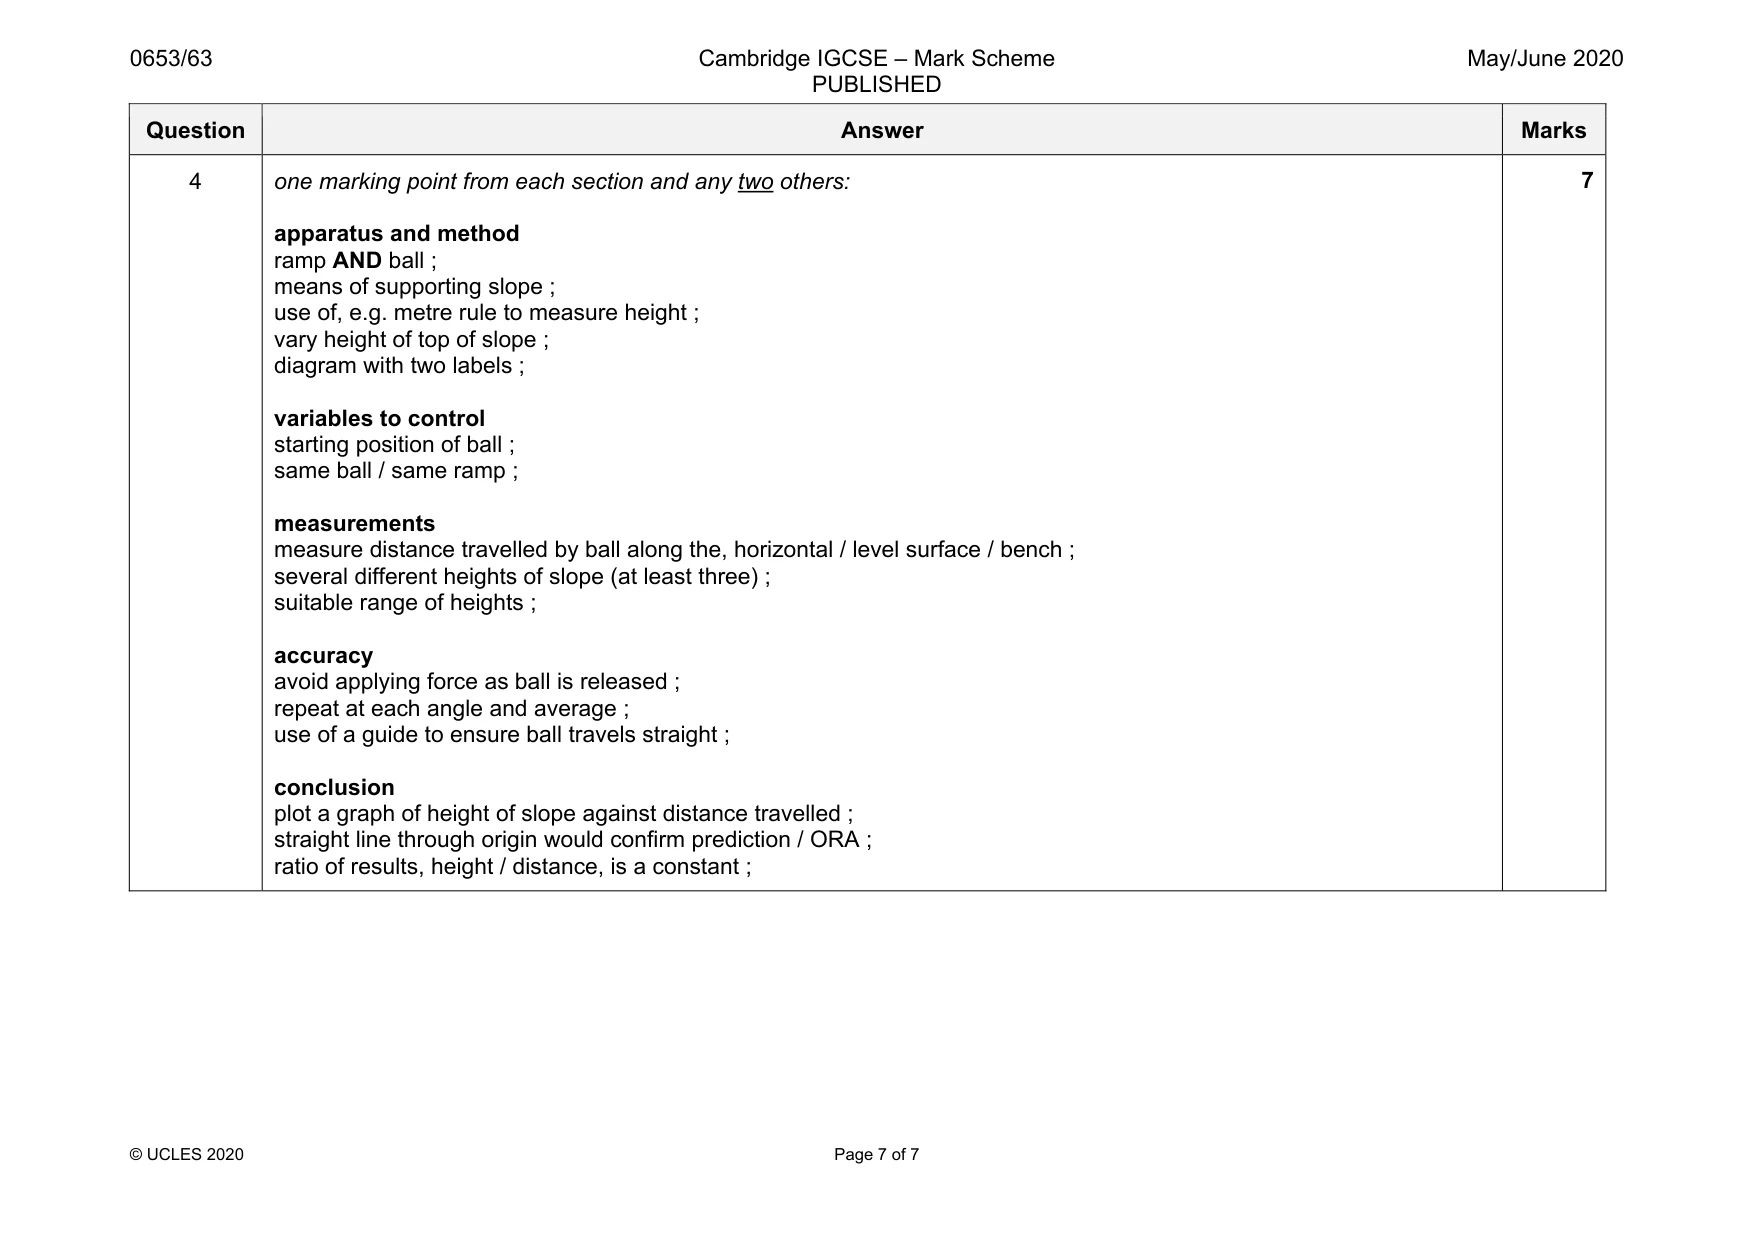
Mark scheme: 4 one marking point from each section and any two others: apparatus and method ramp AND ball ; means of supporting slope ; use of, e.g. metre rule to measure height ; vary height of top of slope ; diagram with two labels ; variables to control starting position of ball ; same ball / same ramp ; measurements measure distance travelled by ball along the, horizontal / level surface / bench ; several different heights of slope (at least three) ; suitable range of heights ; accuracy avoid applying force as ball is released ; repeat at each angle and average ; use of a guide to ensure ball travels straight ; conclusion plot a graph of height of slope against distance travelled ; straight line through origin would confirm prediction / ORA ; ratio of results, height / distance, is a constant ;
What was in this paper
The subtopics covered by these 4 questions, and how many questions each got. Open one in a new tab to see every Cambridge question on it.