Cambridge IGCSE Science - Combined 0653 — 2020 May/June Paper 6 · Variant 2
0653/62/M/J/20 · 4 questions · 40 marks · ≈45 min
The question paper and its mark scheme, free to read here and free to download. This is Cambridge’s own paper, exactly as it was sat.
Question paper16 pages


Mark scheme7 pages
Answers below. Sit the paper first if you are practising.
Questions as text
Q1 · A student investigates the reaction of some metals with dilute hydrochloric acid and with…
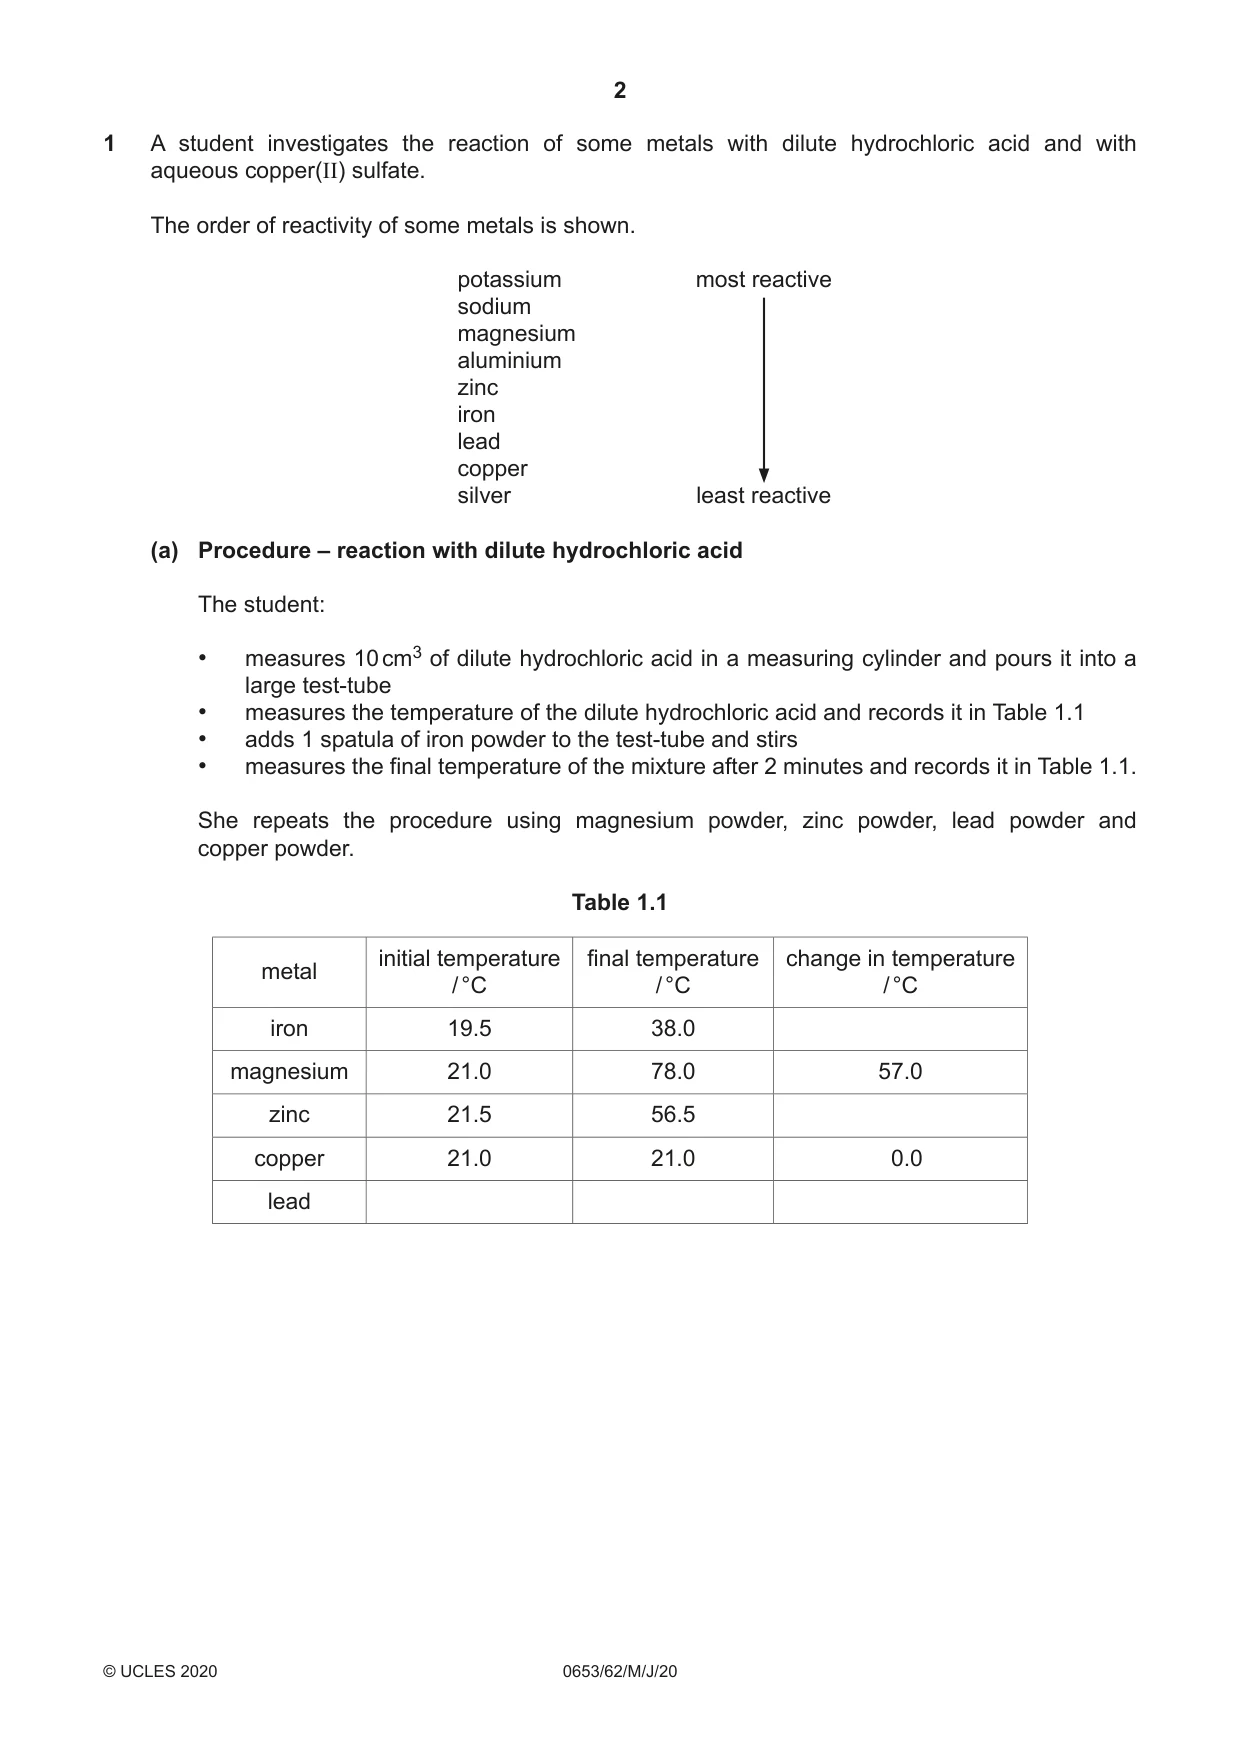
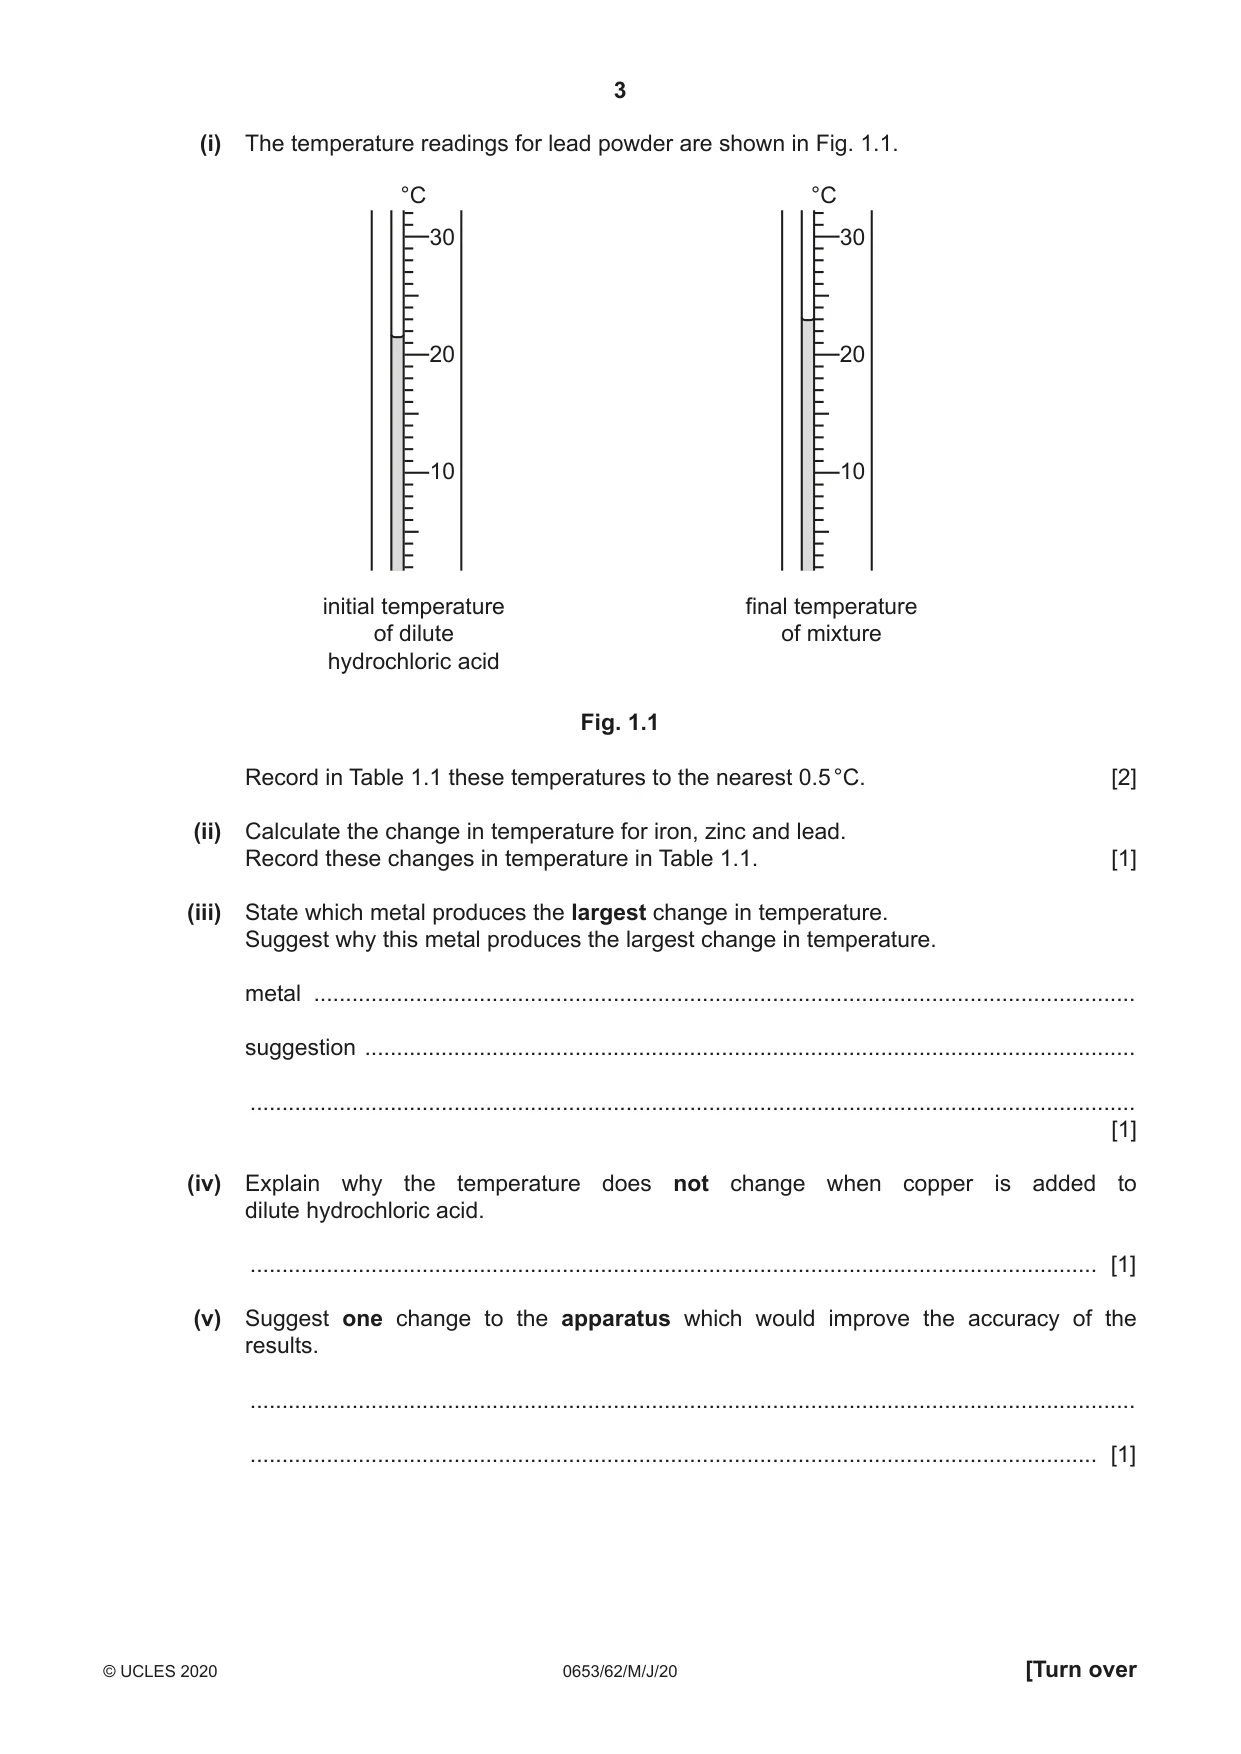
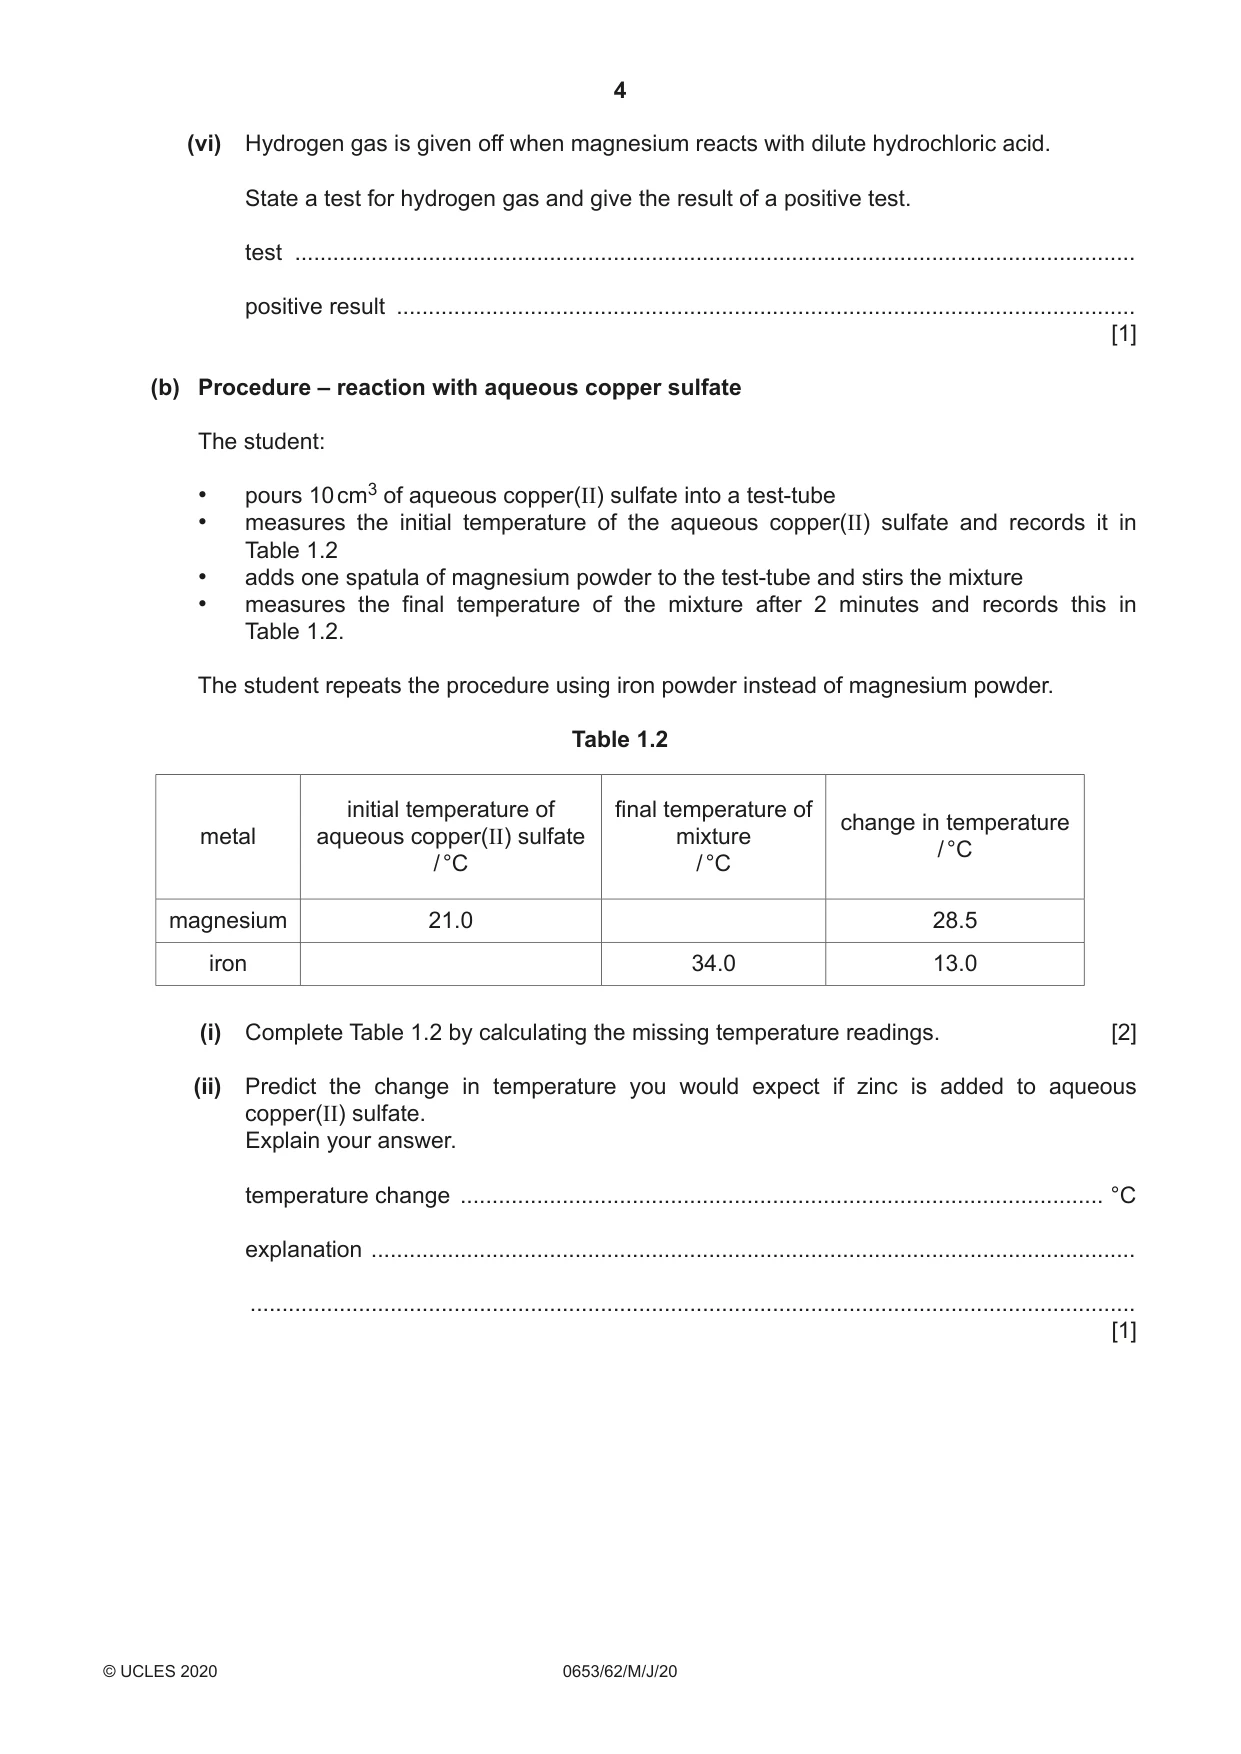
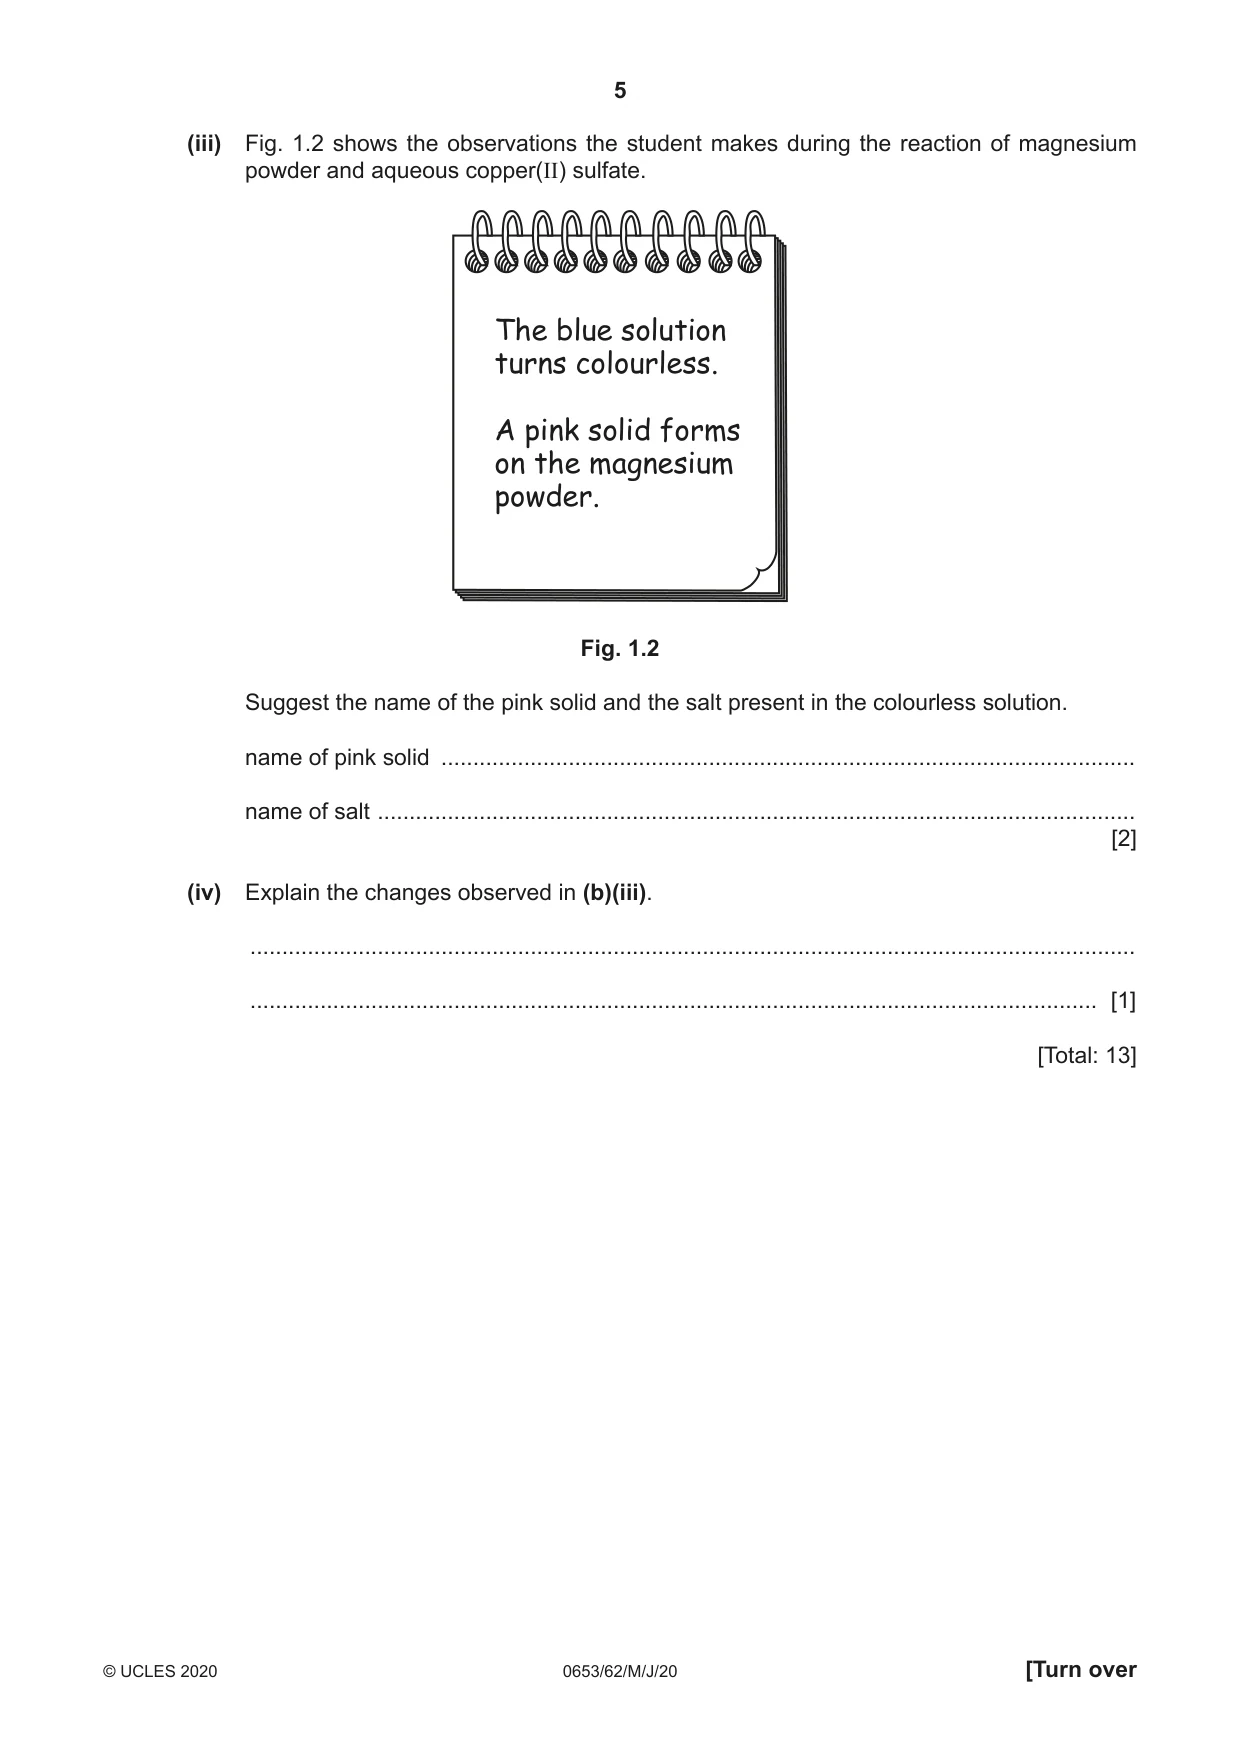
1 A student investigates the reaction of some metals with dilute hydrochloric acid and with aqueous copper(II) sulfate. The order of reactivity of some metals is shown. potassium most reactive sodium magnesium aluminium zinc iron lead copper silver least reactive (a) Procedure – reaction with dilute hydrochloric acid The student: • measures 10 cm3 of dilute hydrochloric acid in a measuring cylinder and pours it into a large test-tube • measures the temperature of the dilute hydrochloric acid and records it in Table 1.1 • adds 1 spatula of iron powder to the test-tube and stirs • measures the final temperature of the mixture after 2 minutes and records it in Table 1.1. She repeats the procedure using magnesium powder, zinc powder, lead powder and copper powder. Table 1.1 initial temperature final temperature change in temperature metal / °C / °C / °C iron 19.5 38.0 magnesium 21.0 78.0 57.0 zinc 21.5 56.5 copper 21.0 21.0 0.0 lead (i) The temperature readings for lead powder are shown in Fig. 1.1. °C °C 30 30 20 20 10 10 initial temperature final temperature of dilute of mixture hydrochloric acid Fig. 1.1 Record in Table 1.1 these temperatures to the nearest 0.5 °C. [2] (ii) Calculate the change in temperature for iron, zinc and lead. Record these changes in temperature in Table 1.1. [1] (iii) State which metal produces the largest change in temperature. Suggest why this metal produces the largest change in temperature. metal ................................................................................................................................. suggestion ......................................................................................................................... ........................................................................................................................................... [1] (iv) Explain why the temperature does not change when copper is added to dilute hydrochloric acid. ..................................................................................................................................... [1] (v) Suggest one change to the apparatus which would improve the accuracy of the results. ........................................................................................................................................... ..................................................................................................................................... [1] (vi) Hydrogen gas is given off when magnesium reacts with dilute hydrochloric acid. State a test for hydrogen gas and give the result of a positive test. test .................................................................................................................................... positive result .................................................................................................................... [1] (b) Procedure – reaction with aqueous copper sulfate The student: • pours 10 cm3 of aqueous copper(II) sulfate into a test-tube • measures the initial temperature of the aqueous copper(II) sulfate and records it in Table 1.2 • adds one spatula of magnesium powder to the test-tube and stirs the mixture • measures the final temperature of the mixture after 2 minutes and records this in Table 1.2. The student repeats the procedure using iron powder instead of magnesium powder. Table 1.2 initial temperature of final temperature of change in temperature metal aqueous copper(II) sulfate mixture / °C / °C / °C magnesium 21.0 28.5 iron 34.0 13.0 (i) Complete Table 1.2 by calculating the missing temperature readings. [2] (ii) Predict the change in temperature you would expect if zinc is added to aqueous copper(II) sulfate. Explain your answer. temperature change ..................................................................................................... °C explanation ........................................................................................................................ ........................................................................................................................................... [1] (iii) Fig. 1.2 shows the observations the student makes during the reaction of magnesium powder and aqueous copper(II) sulfate. The blue solution turns colourless. A pink solid forms on the magnesium powder. Fig. 1.2 Suggest the name of the pink solid and the salt present in the colourless solution. name of pink solid ............................................................................................................. name of salt ....................................................................................................................... [2] (iv) Explain the changes observed in (b)(iii). ........................................................................................................................................... ..................................................................................................................................... [1] [Total: 13]
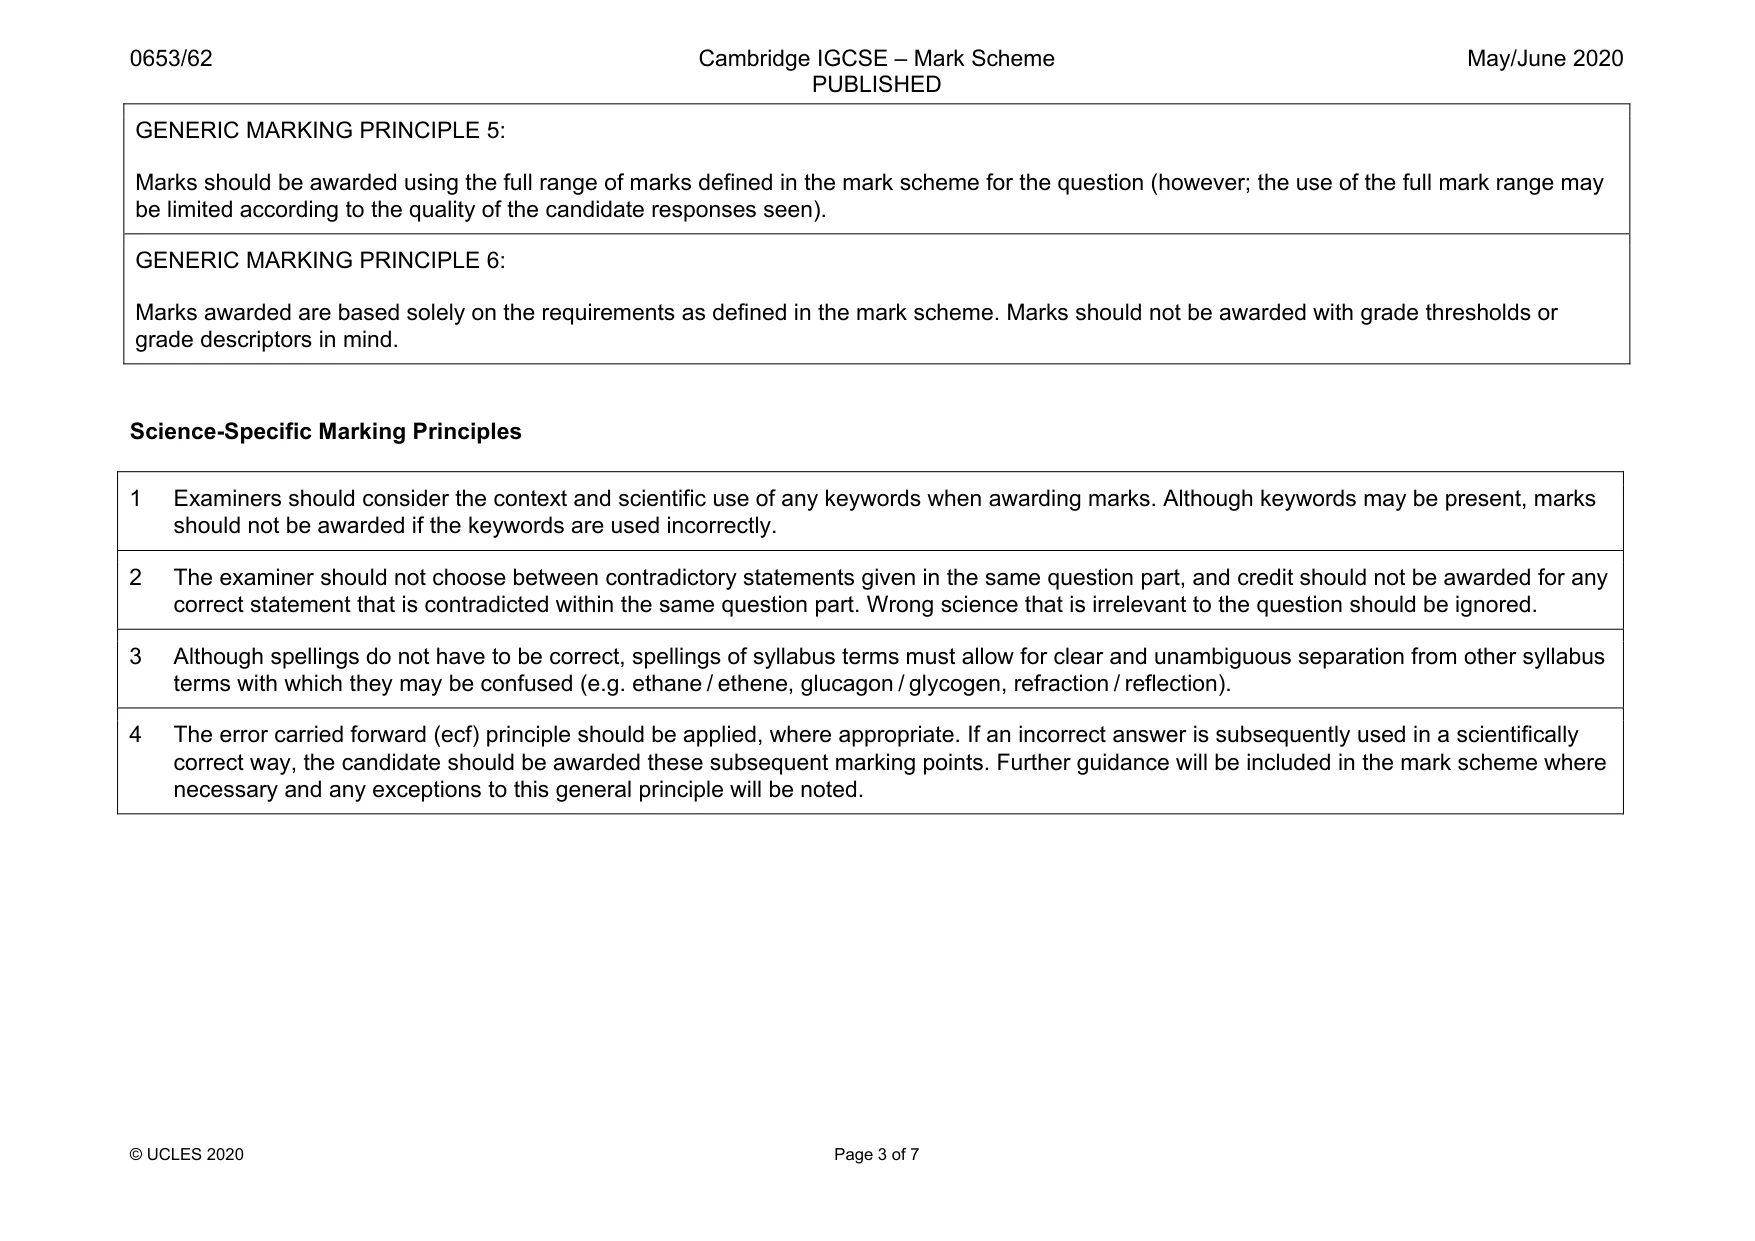
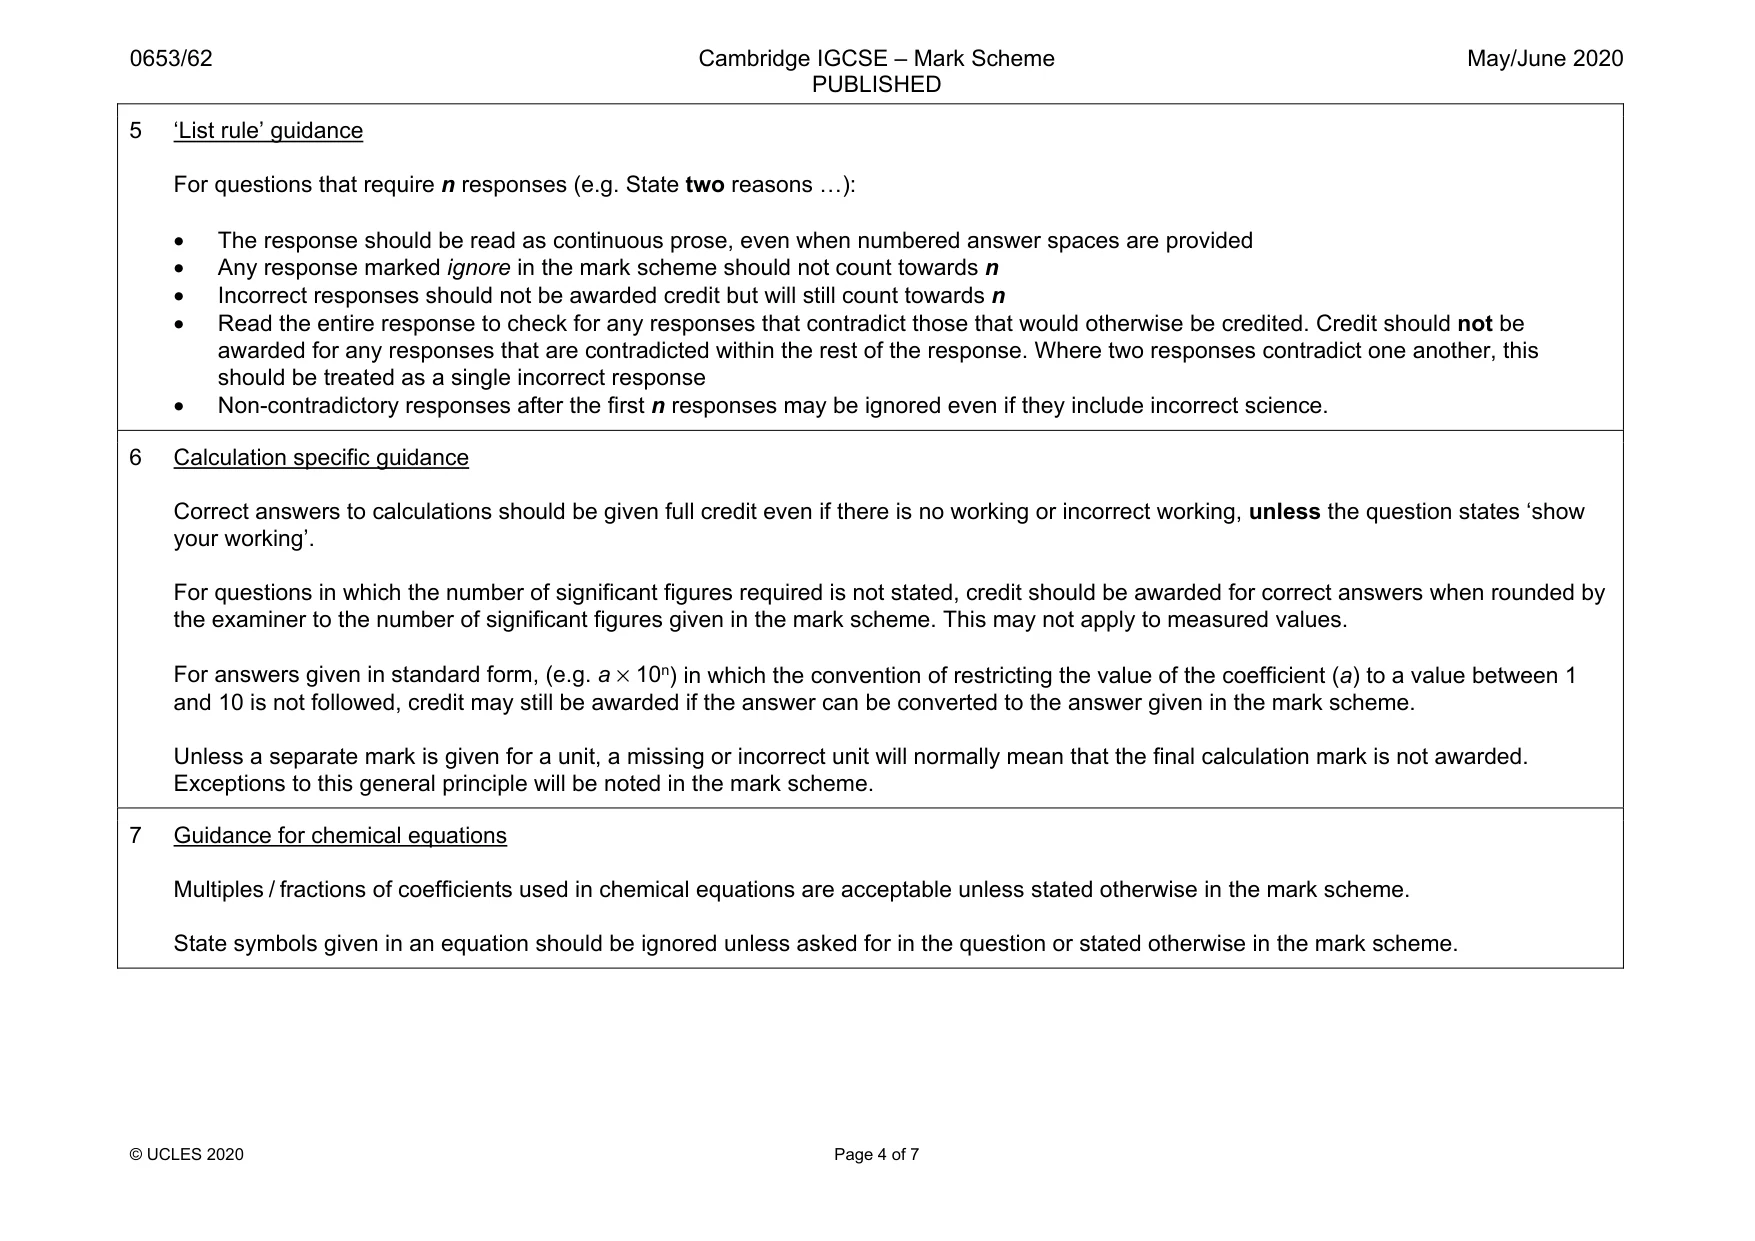
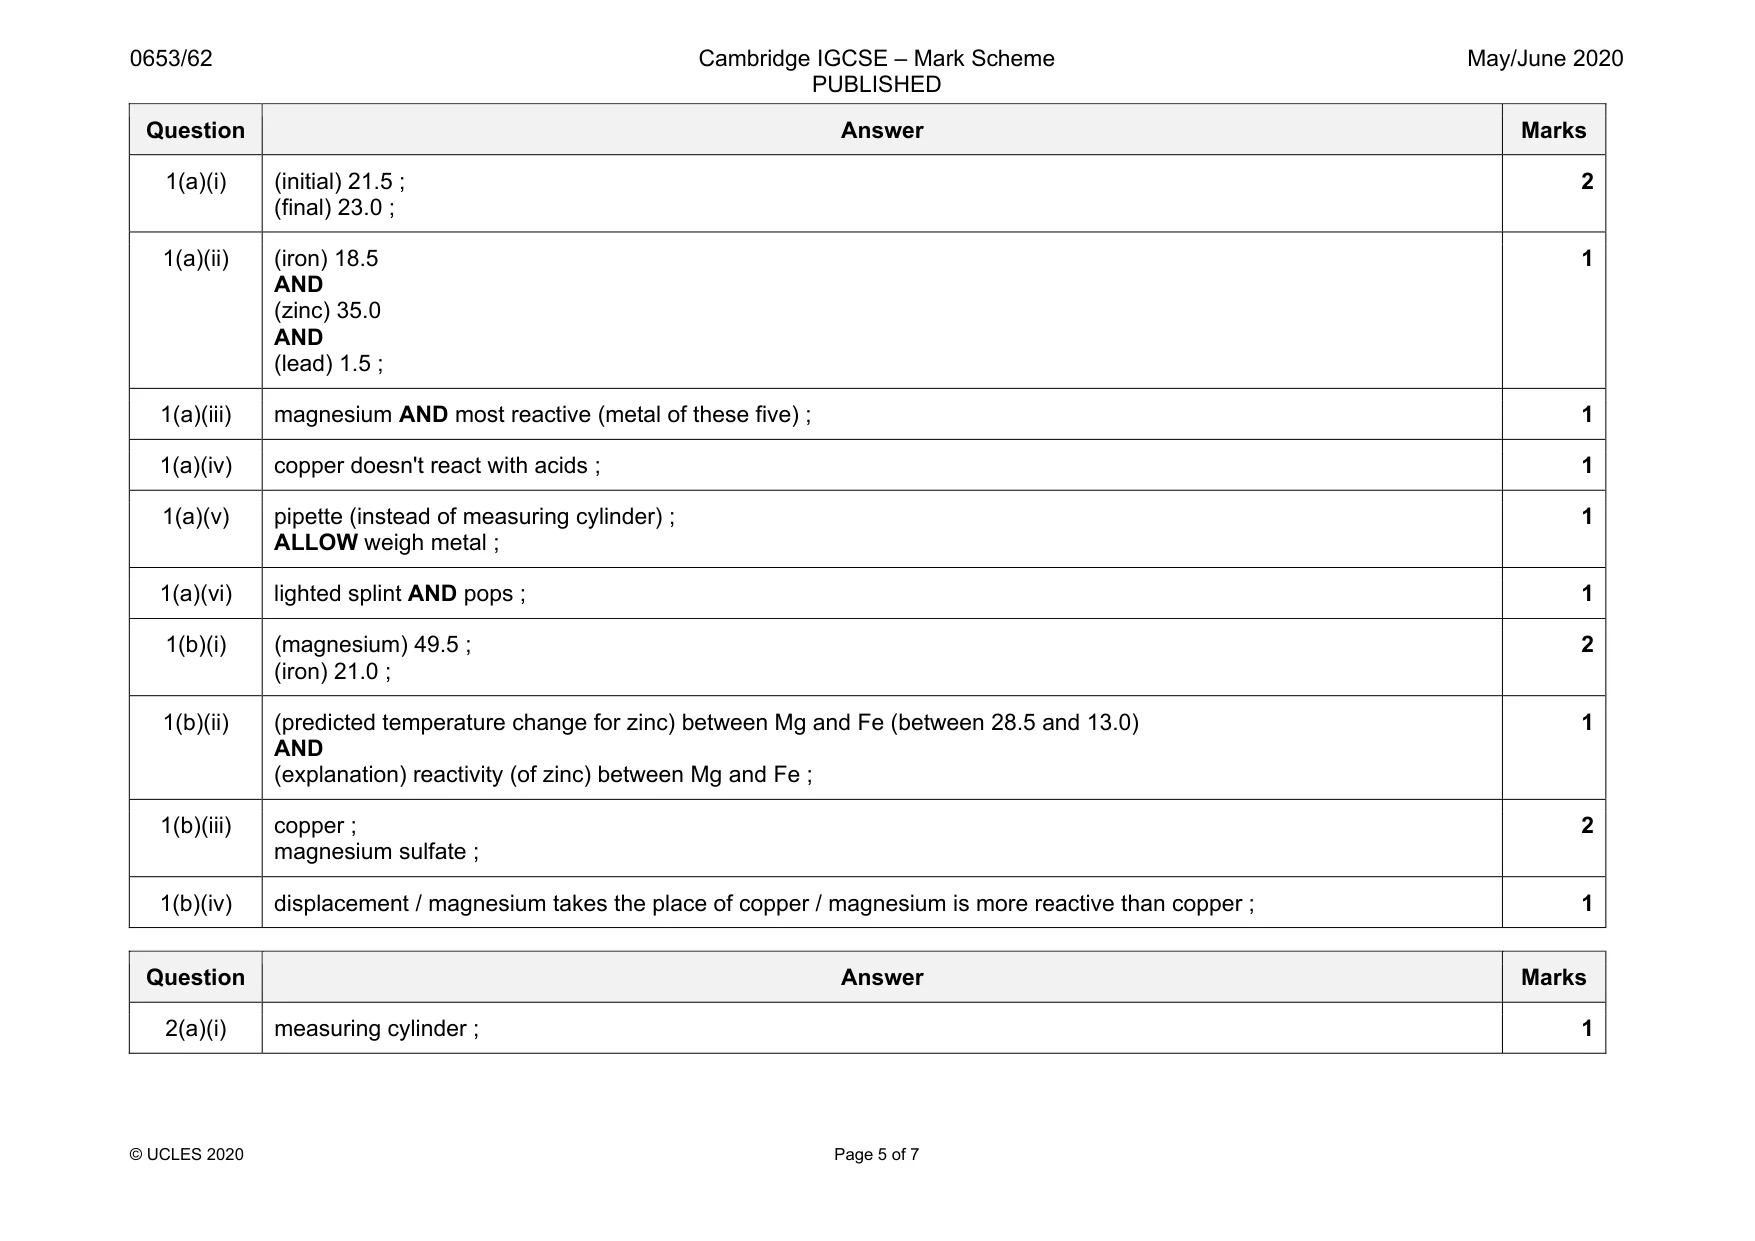
Mark scheme: 1(a)(i) (initial) 21.5 ; (final) 23.0 ; 2 1(a)(ii) (iron) 18.5 AND (zinc) 35.0 AND (lead) 1.5 ; 1 1(a)(iii) magnesium AND most reactive (metal of these five) ; 1 1(a)(iv) copper doesn't react with acids ; 1 1(a)(v) pipette (instead of measuring cylinder) ; ALLOW weigh metal ; 1 1(a)(vi) lighted splint AND pops ; 1 1(b)(i) (magnesium) 49.5 ; (iron) 21.0 ; 2 1(b)(ii) (predicted temperature change for zinc) between Mg and Fe (between 28.5 and 13.0) AND (explanation) reactivity (of zinc) between Mg and Fe ; 1 1(b)(iii) copper ; magnesium sulfate ; 2 1(b)(iv) displacement / magnesium takes the place of copper / magnesium is more reactive than copper ; 1
Q2 · A student investigates the effect of substrate concentration on the rate of a reaction
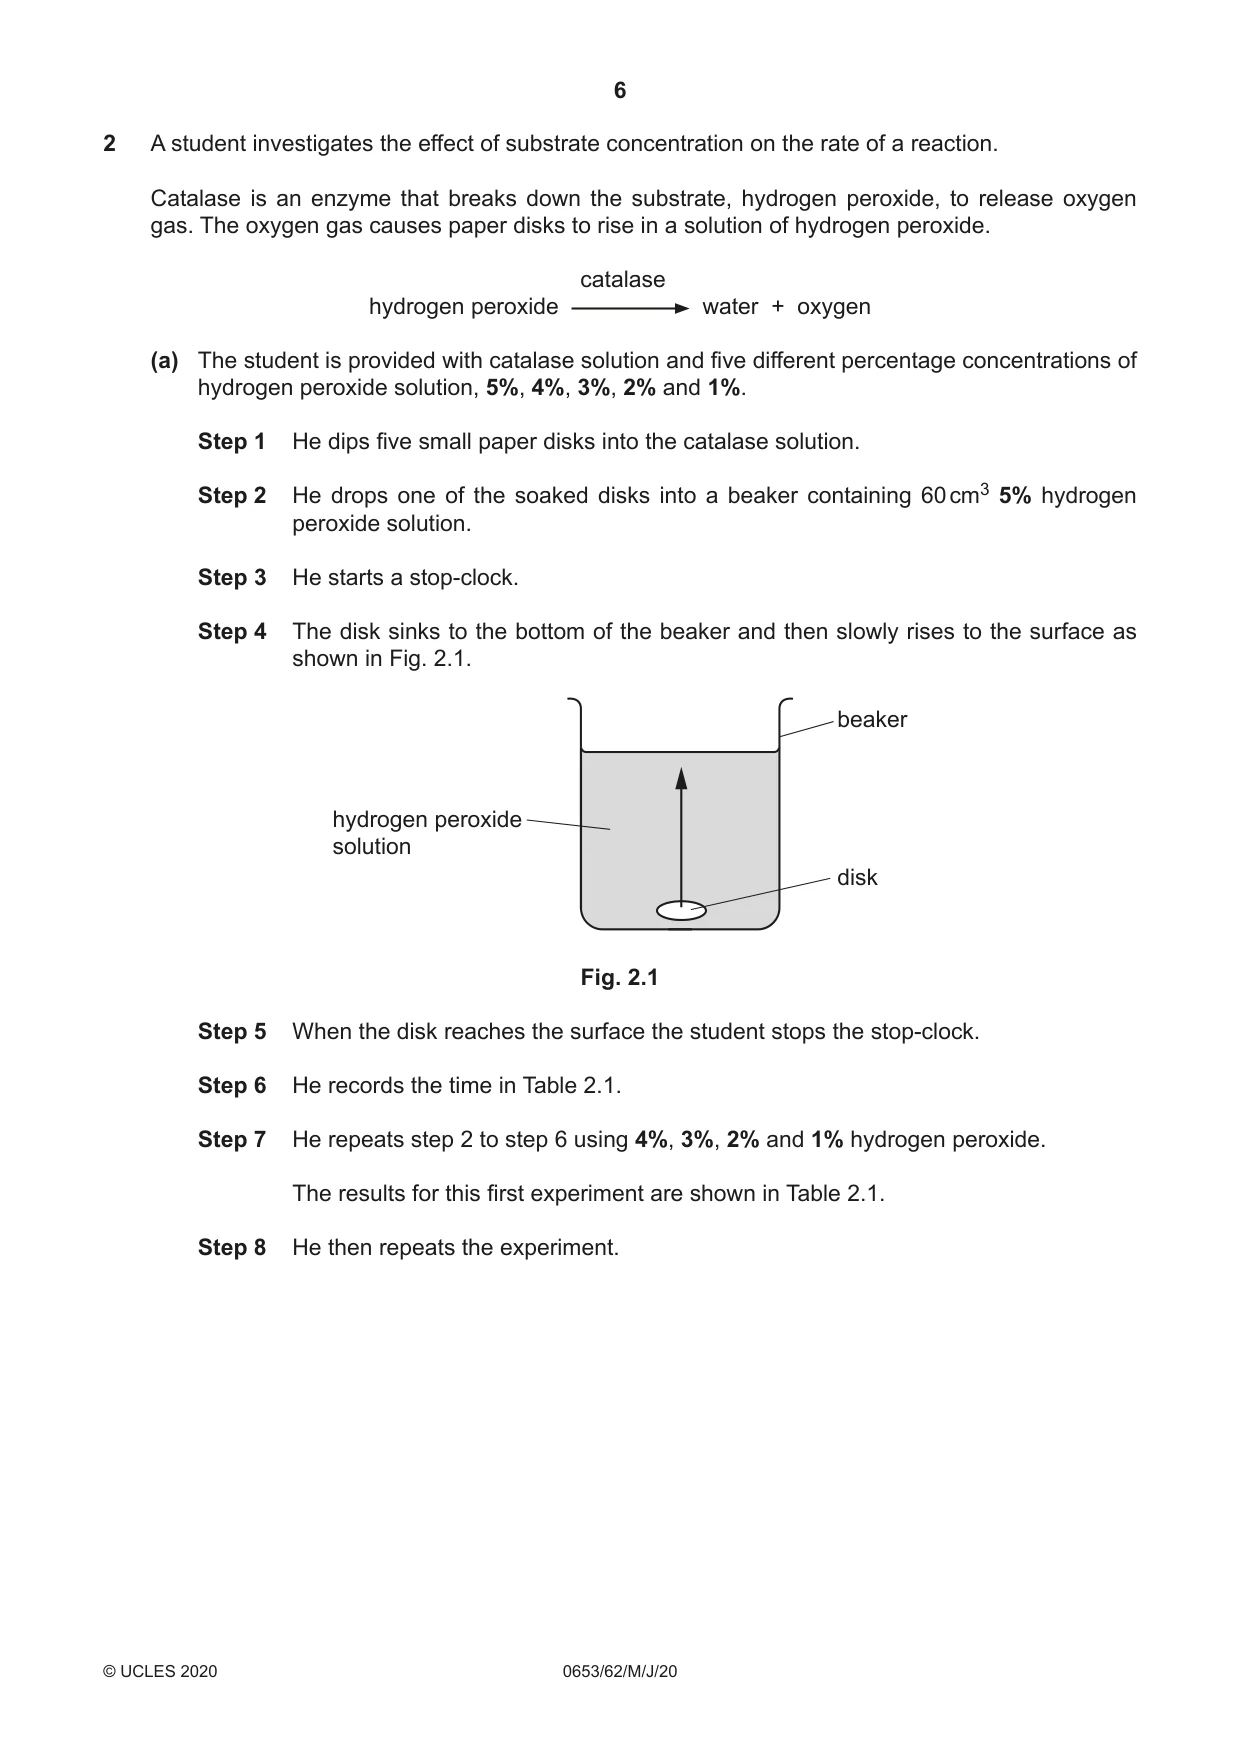
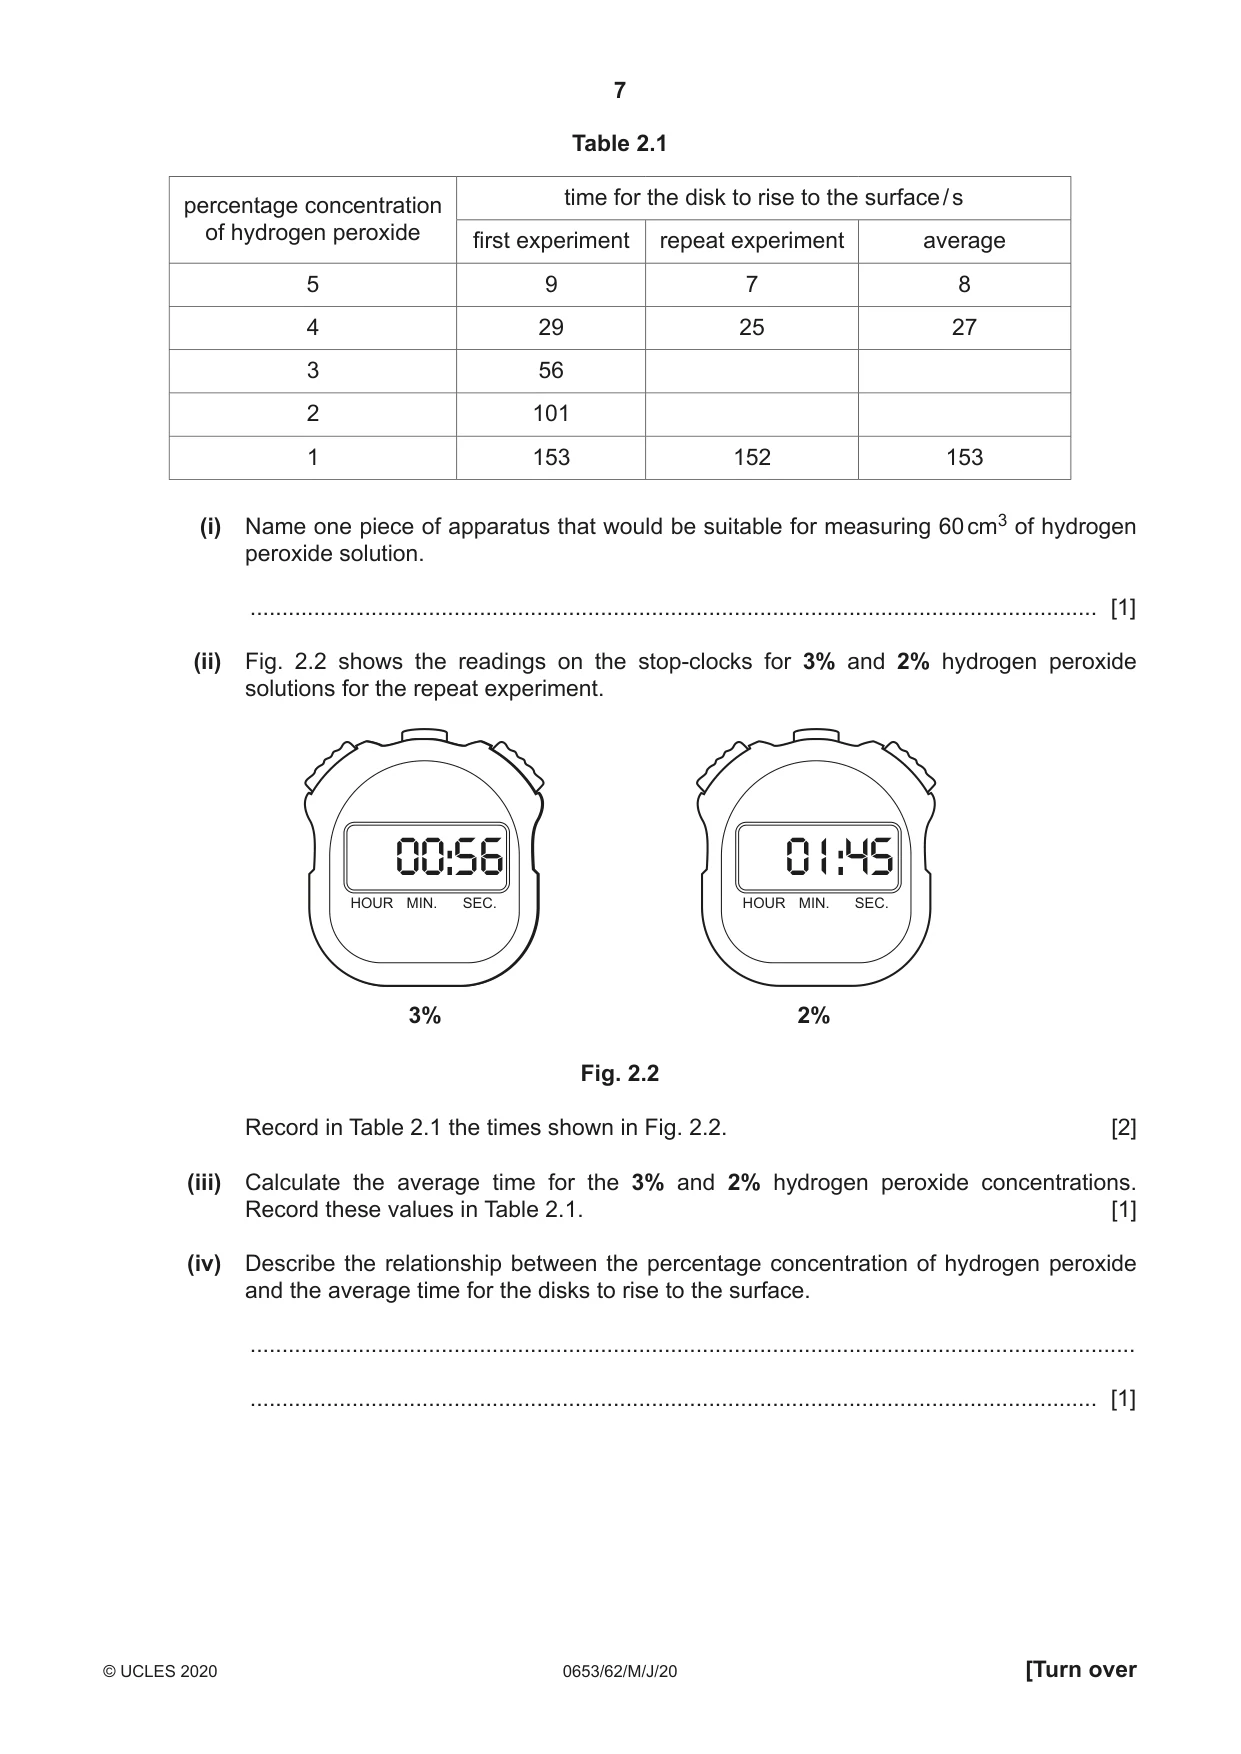
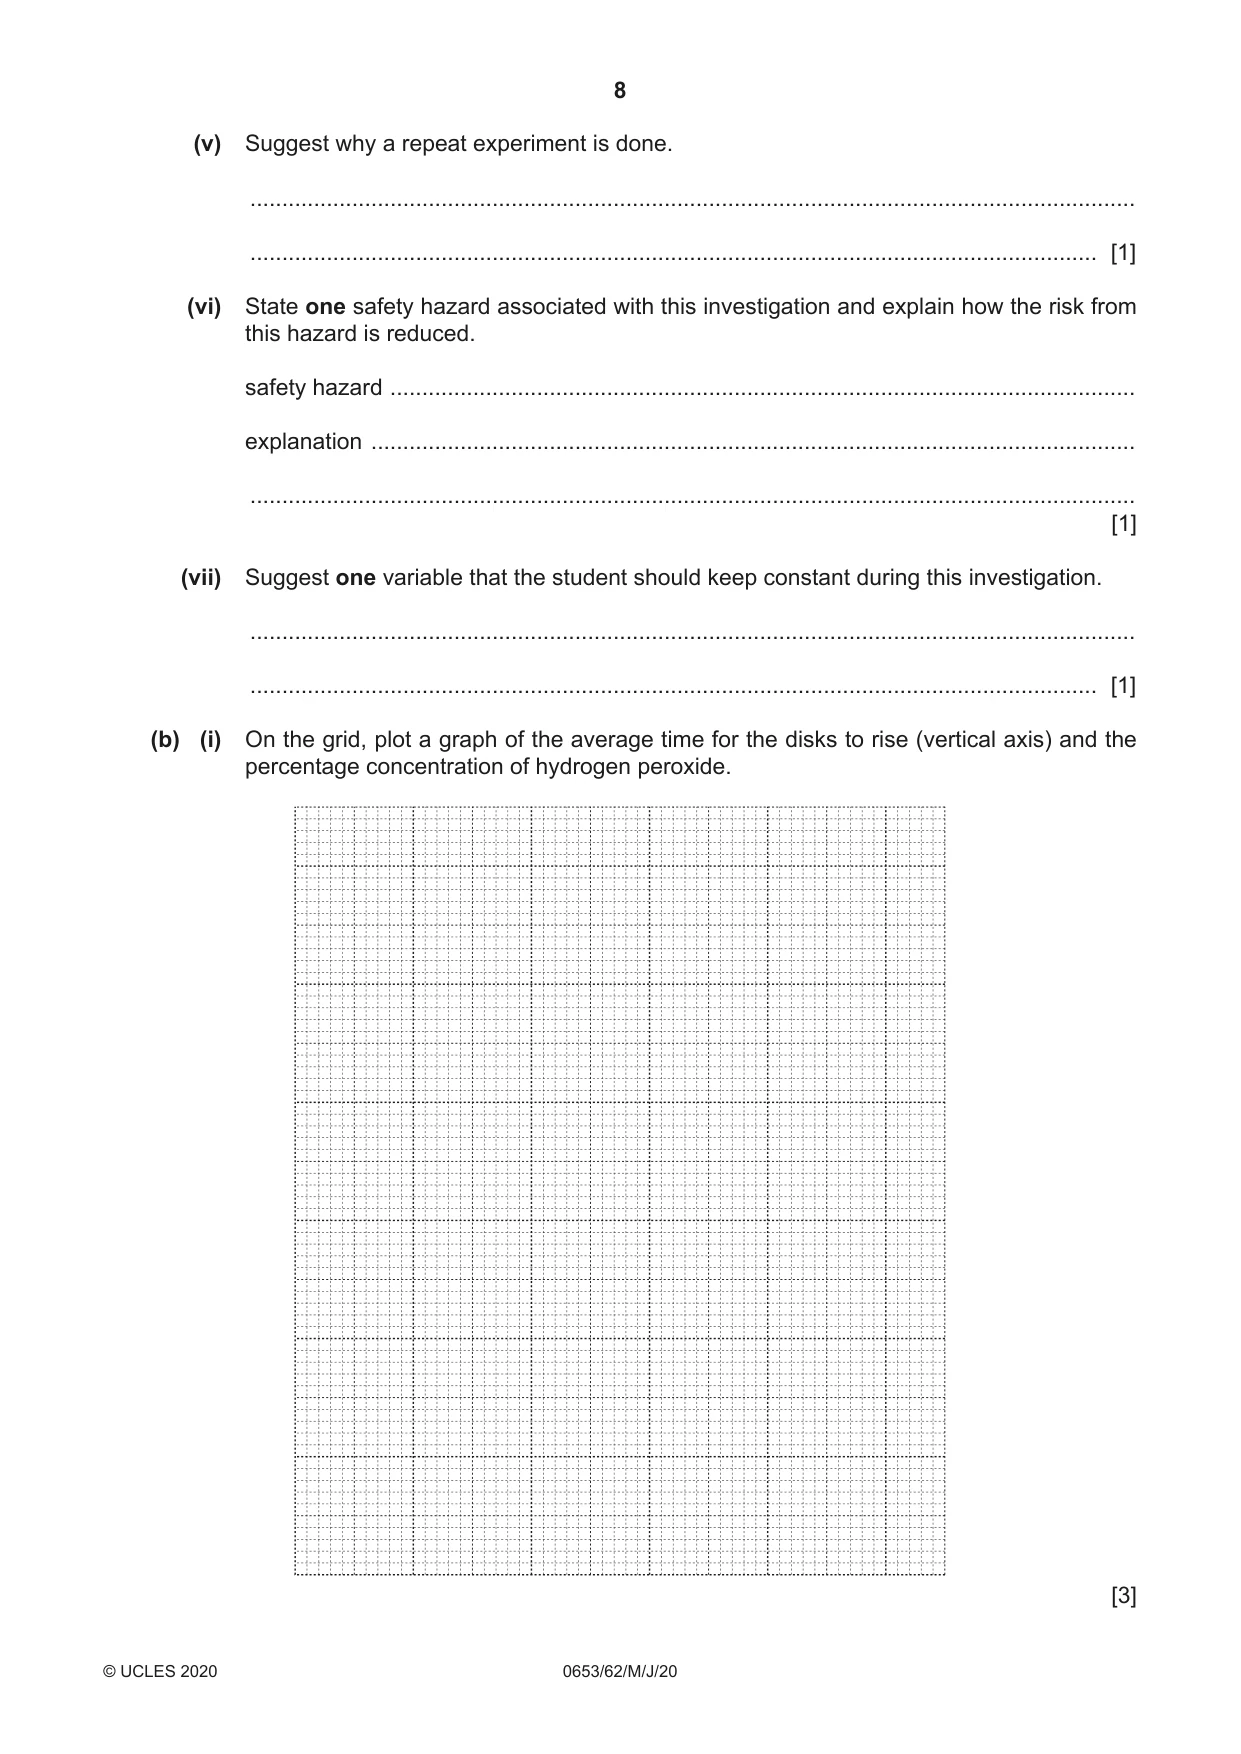
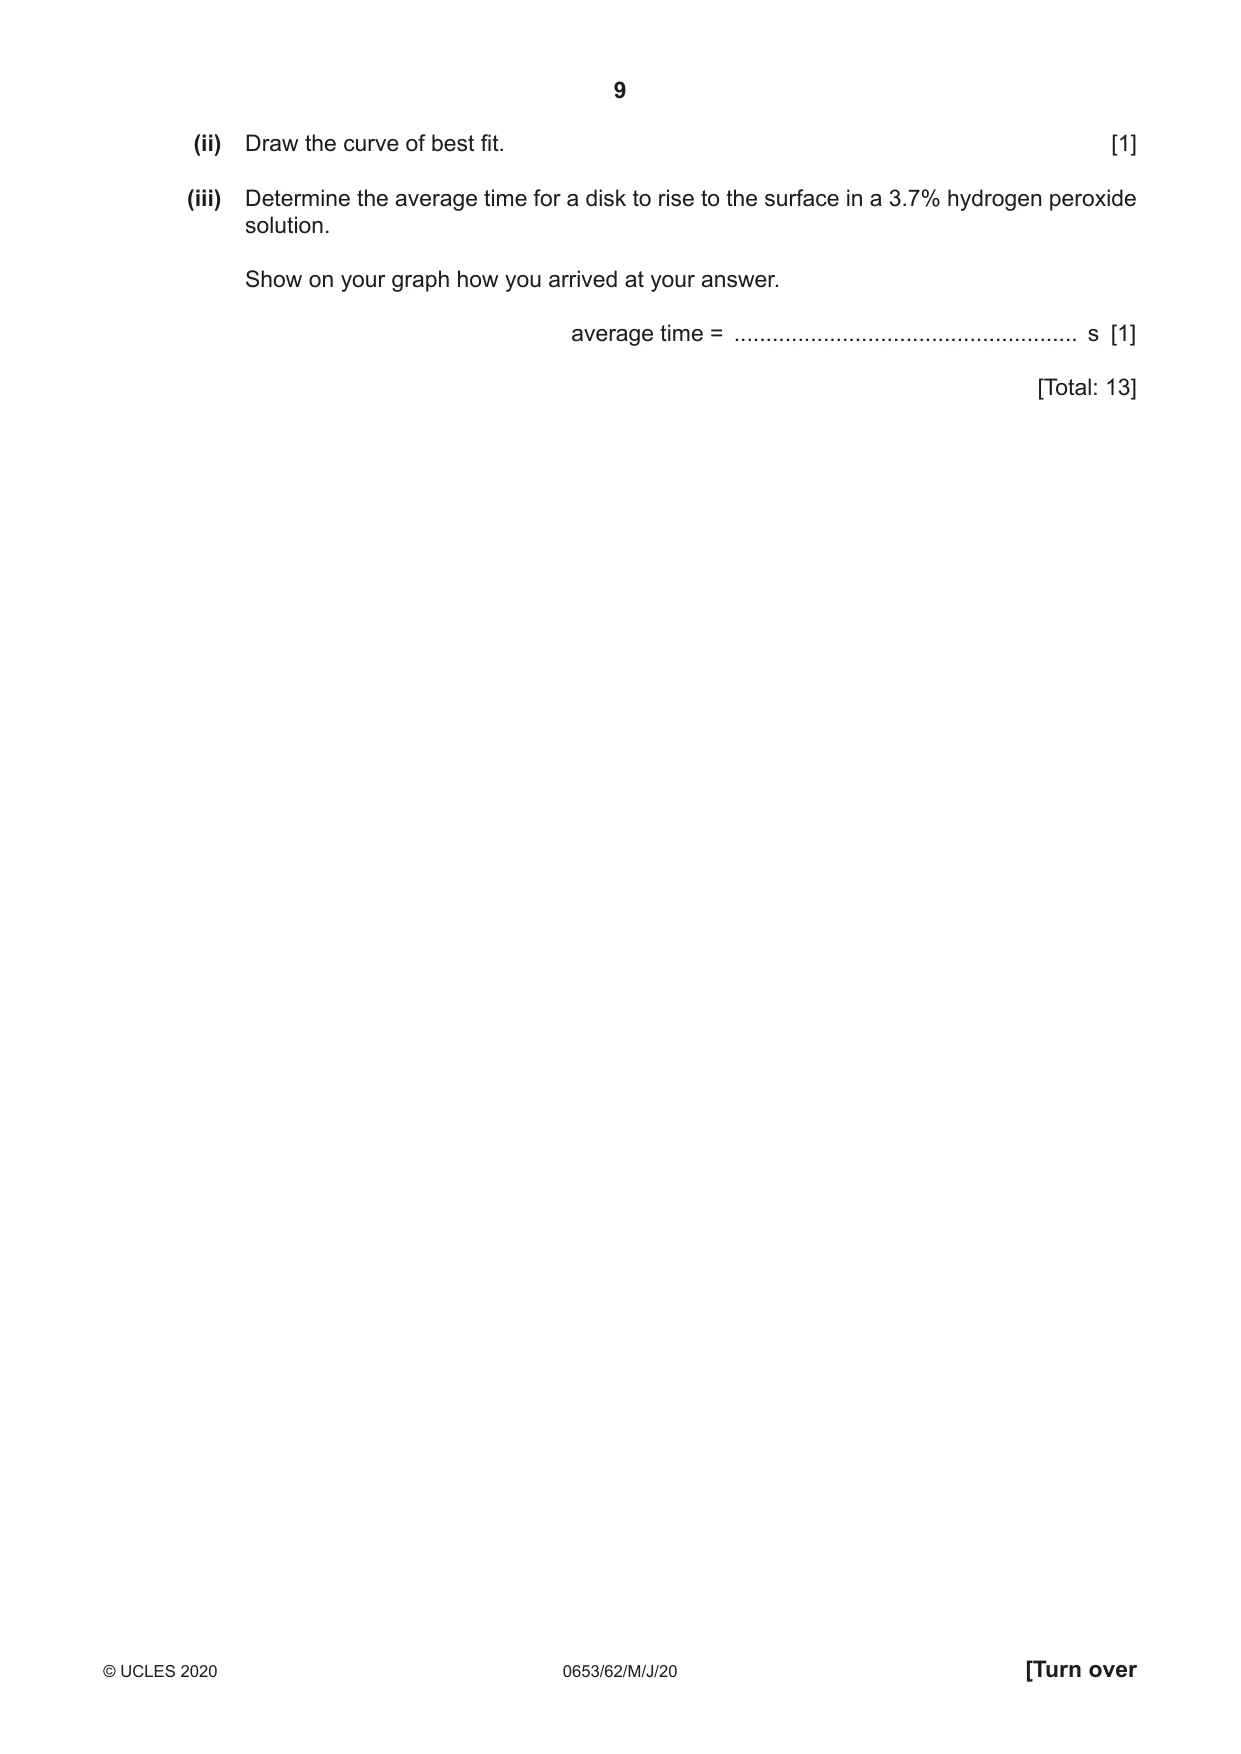
2 A student investigates the effect of substrate concentration on the rate of a reaction. Catalase is an enzyme that breaks down the substrate, hydrogen peroxide, to release oxygen gas. The oxygen gas causes paper disks to rise in a solution of hydrogen peroxide. catalase hydrogen peroxide water + oxygen (a) The student is provided with catalase solution and five different percentage concentrations of hydrogen peroxide solution, 5%, 4%, 3%, 2% and 1%. Step 1 He dips five small paper disks into the catalase solution. Step 2 He drops one of the soaked disks into a beaker containing 60 cm3 5% hydrogen peroxide solution. Step 3 He starts a stop-clock. Step 4 The disk sinks to the bottom of the beaker and then slowly rises to the surface as shown in Fig. 2.1. beaker hydrogen peroxide solution disk Fig. 2.1 Step 5 When the disk reaches the surface the student stops the stop-clock. Step 6 He records the time in Table 2.1. Step 7 He repeats step 2 to step 6 using 4%, 3%, 2% and 1% hydrogen peroxide. The results for this first experiment are shown in Table 2.1. Step 8 He then repeats the experiment. Table 2.1 time for the disk to rise to the surface / spercentage concentration of hydrogen peroxide first experiment repeat experiment average 5 9 7 8 4 29 25 27 3 56 2 101 1 153 152 153 (i) Name one piece of apparatus that would be suitable for measuring 60 cm3 of hydrogen peroxide solution. ..................................................................................................................................... [1] (ii) Fig. 2.2 shows the readings on the stop-clocks for 3% and 2% hydrogen peroxide solutions for the repeat experiment. 00:56 01:45 HOUR MIN. SEC. HOUR MIN. SEC. 3% 2% Fig. 2.2 Record in Table 2.1 the times shown in Fig. 2.2. [2] (iii) Calculate the average time for the 3% and 2% hydrogen peroxide concentrations. Record these values in Table 2.1. [1] (iv) Describe the relationship between the percentage concentration of hydrogen peroxide and the average time for the disks to rise to the surface. ........................................................................................................................................... ..................................................................................................................................... [1] (v) Suggest why a repeat experiment is done. ........................................................................................................................................... ..................................................................................................................................... [1] (vi) State one safety hazard associated with this investigation and explain how the risk from this hazard is reduced. safety hazard ..................................................................................................................... explanation ........................................................................................................................ ........................................................................................................................................... [1] (vii) Suggest one variable that the student should keep constant during this investigation. ........................................................................................................................................... ..................................................................................................................................... [1] (b) (i) On the grid, plot a graph of the average time for the disks to rise (vertical axis) and the percentage concentration of hydrogen peroxide. [3] (ii) Draw the curve of best fit. [1] (iii) Determine the average time for a disk to rise to the surface in a 3.7% hydrogen peroxide solution. Show on your graph how you arrived at your answer. average time = ...................................................... s [1] [Total: 13]
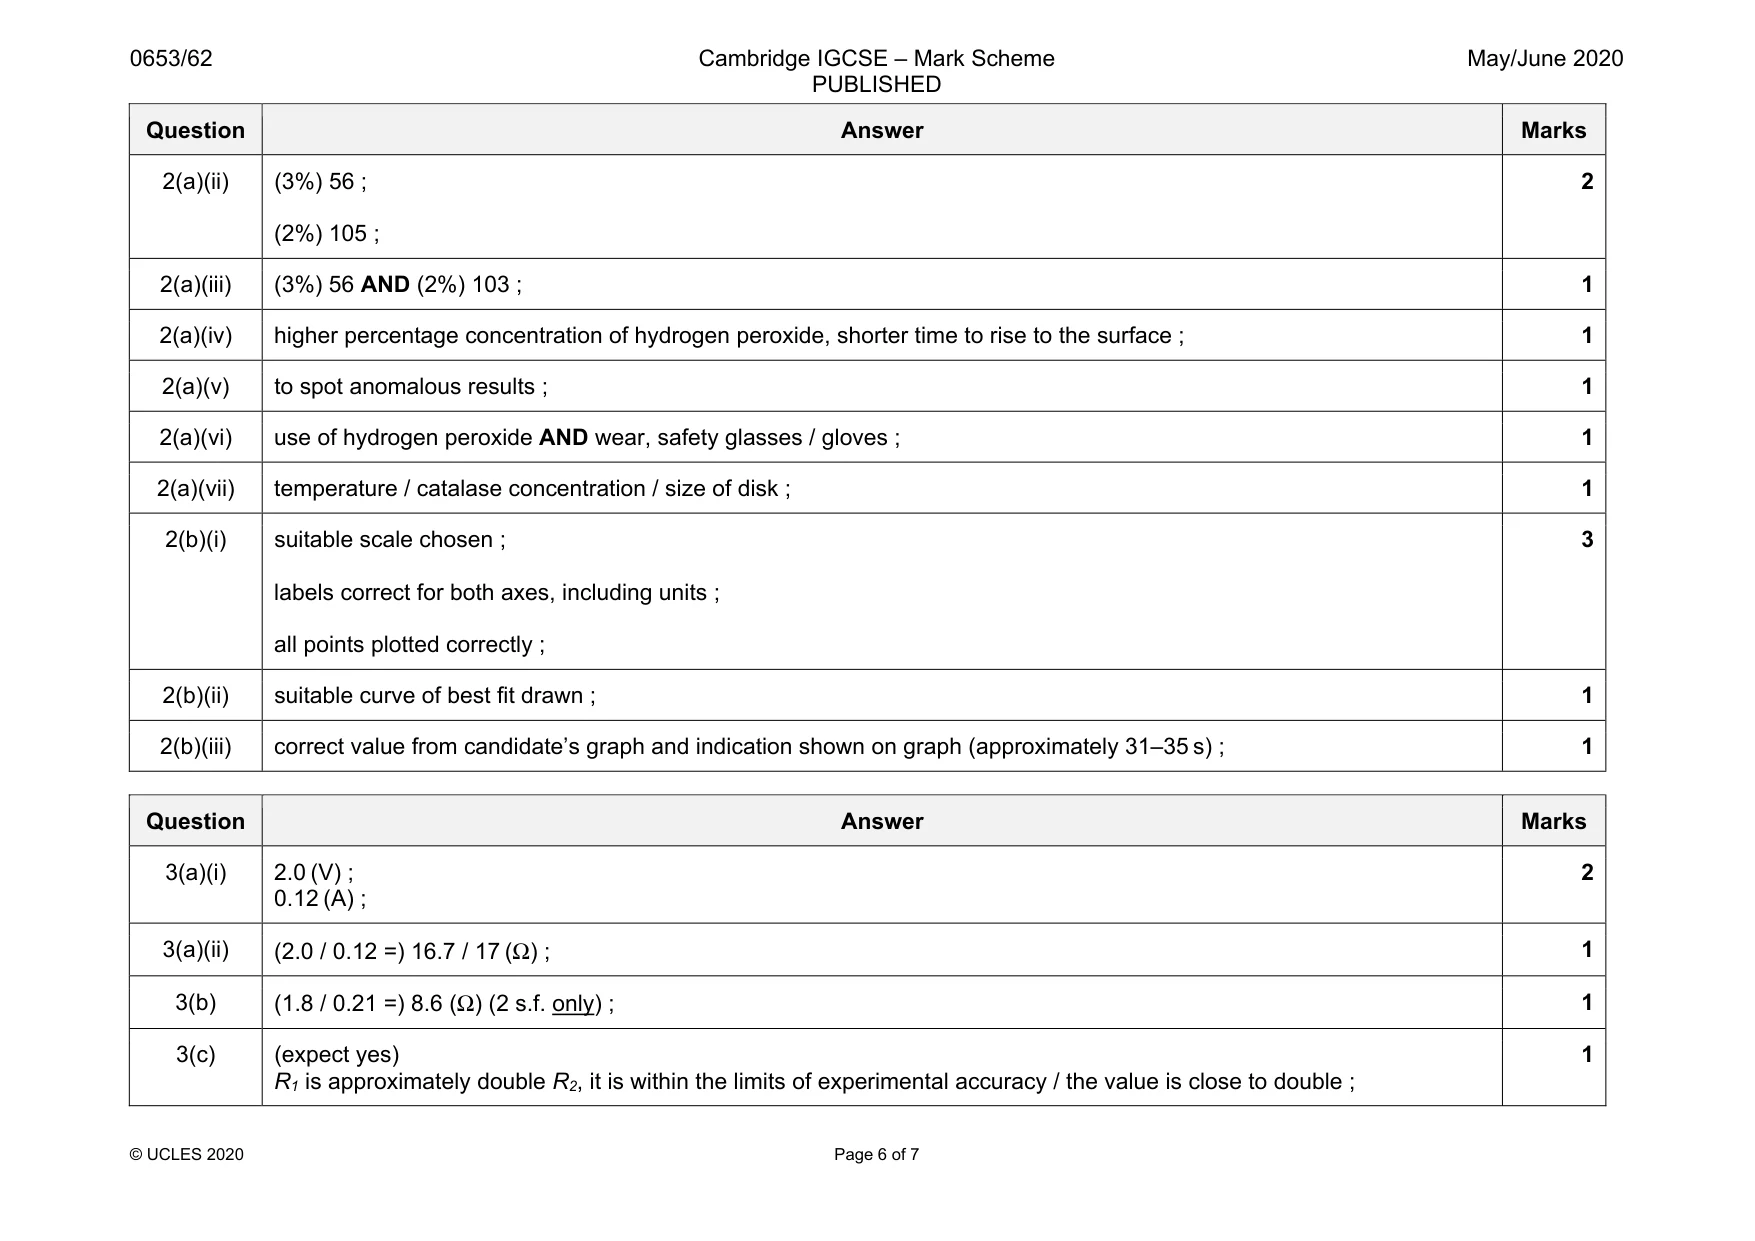
Mark scheme: 2(a)(i) measuring cylinder ; 1 Question Answer Marks 2(a)(ii) (3%) 56 ; (2%) 105 ; 2 2(a)(iii) (3%) 56 AND (2%) 103 ; 1 2(a)(iv) higher percentage concentration of hydrogen peroxide, shorter time to rise to the surface ; 1 2(a)(v) to spot anomalous results ; 1 2(a)(vi) use of hydrogen peroxide AND wear, safety glasses / gloves ; 1 2(a)(vii) temperature / catalase concentration / size of disk ; 1 2(b)(i) suitable scale chosen ; labels correct for both axes, including units ; all points plotted correctly ; 3 2(b)(ii) suitable curve of best fit drawn ; 1 2(b)(iii) correct value from candidate’s graph and indication shown on graph (approximately 31–35 s) ; 1
Q3 · A student investigates the resistance of a piece of wire
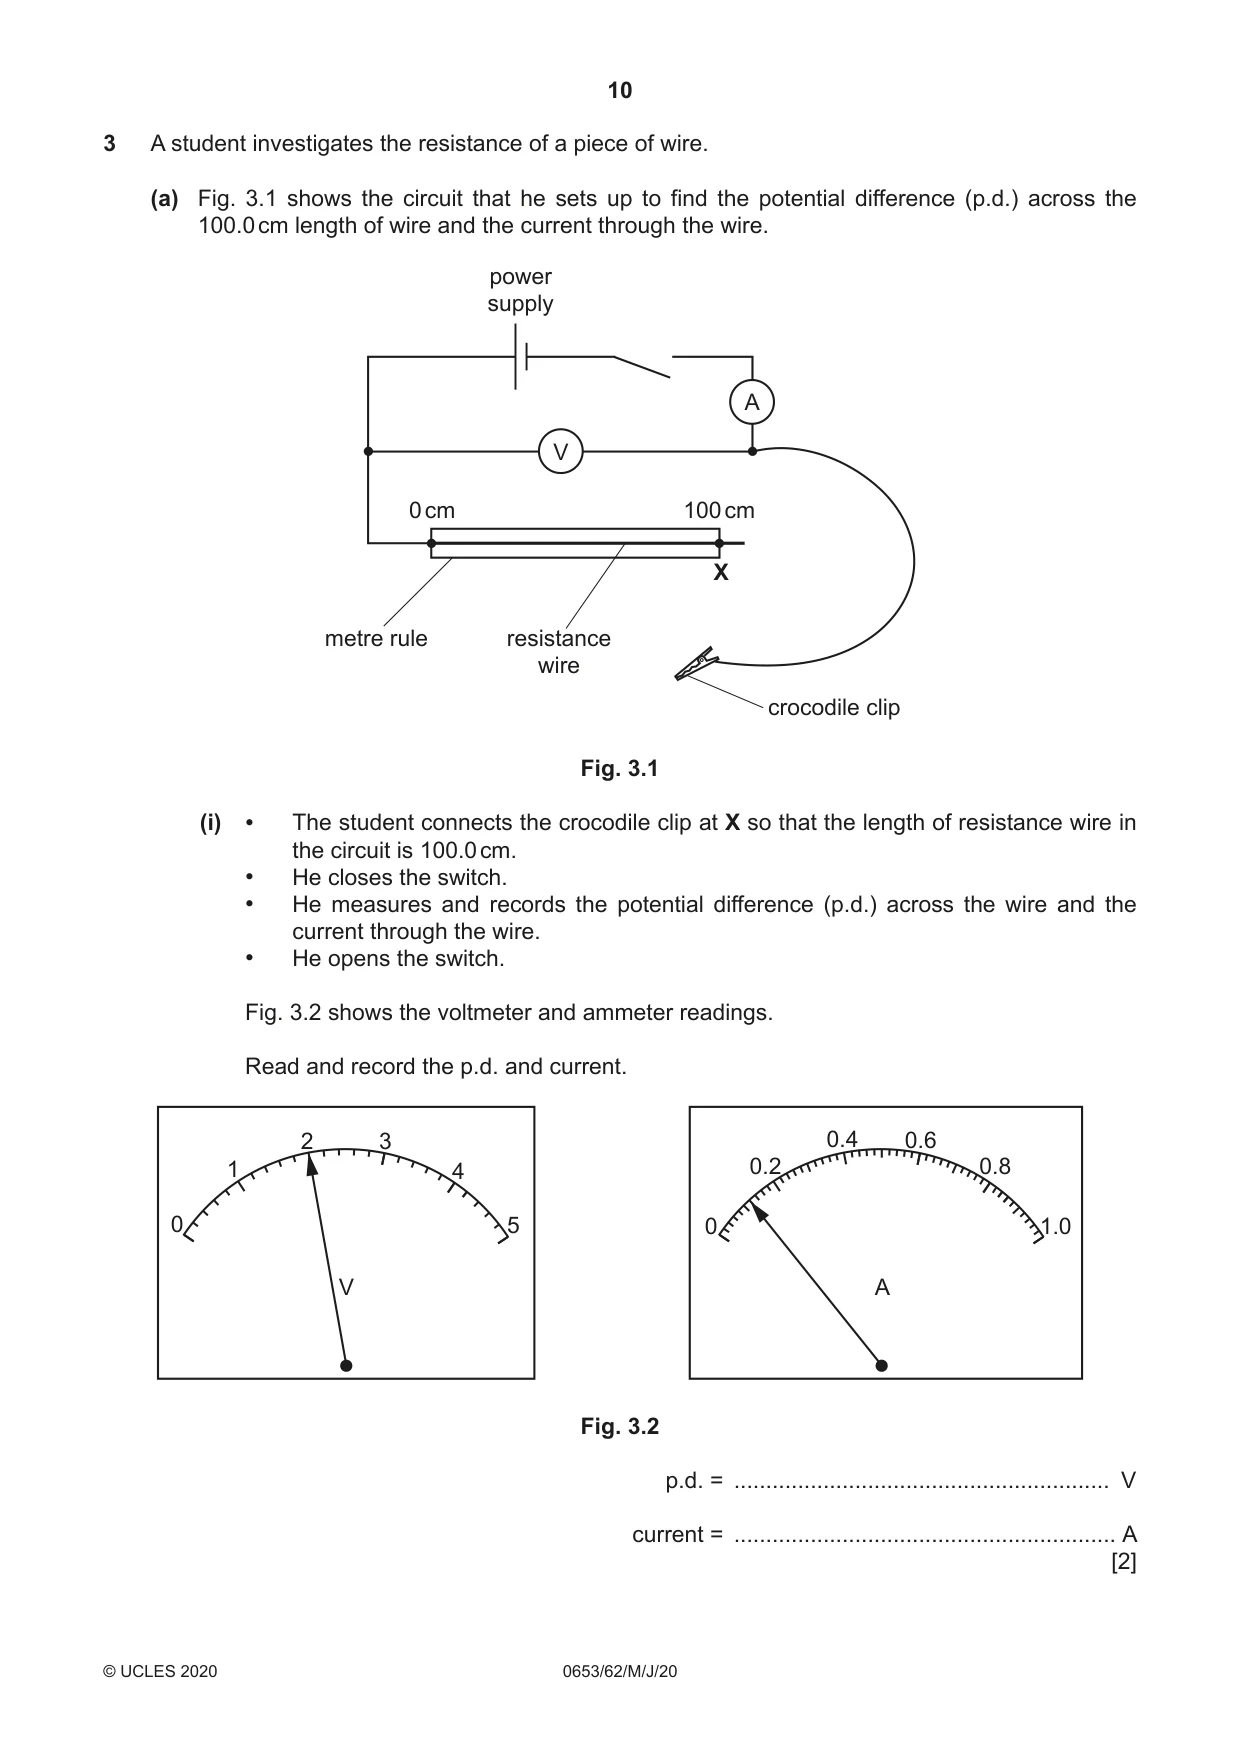
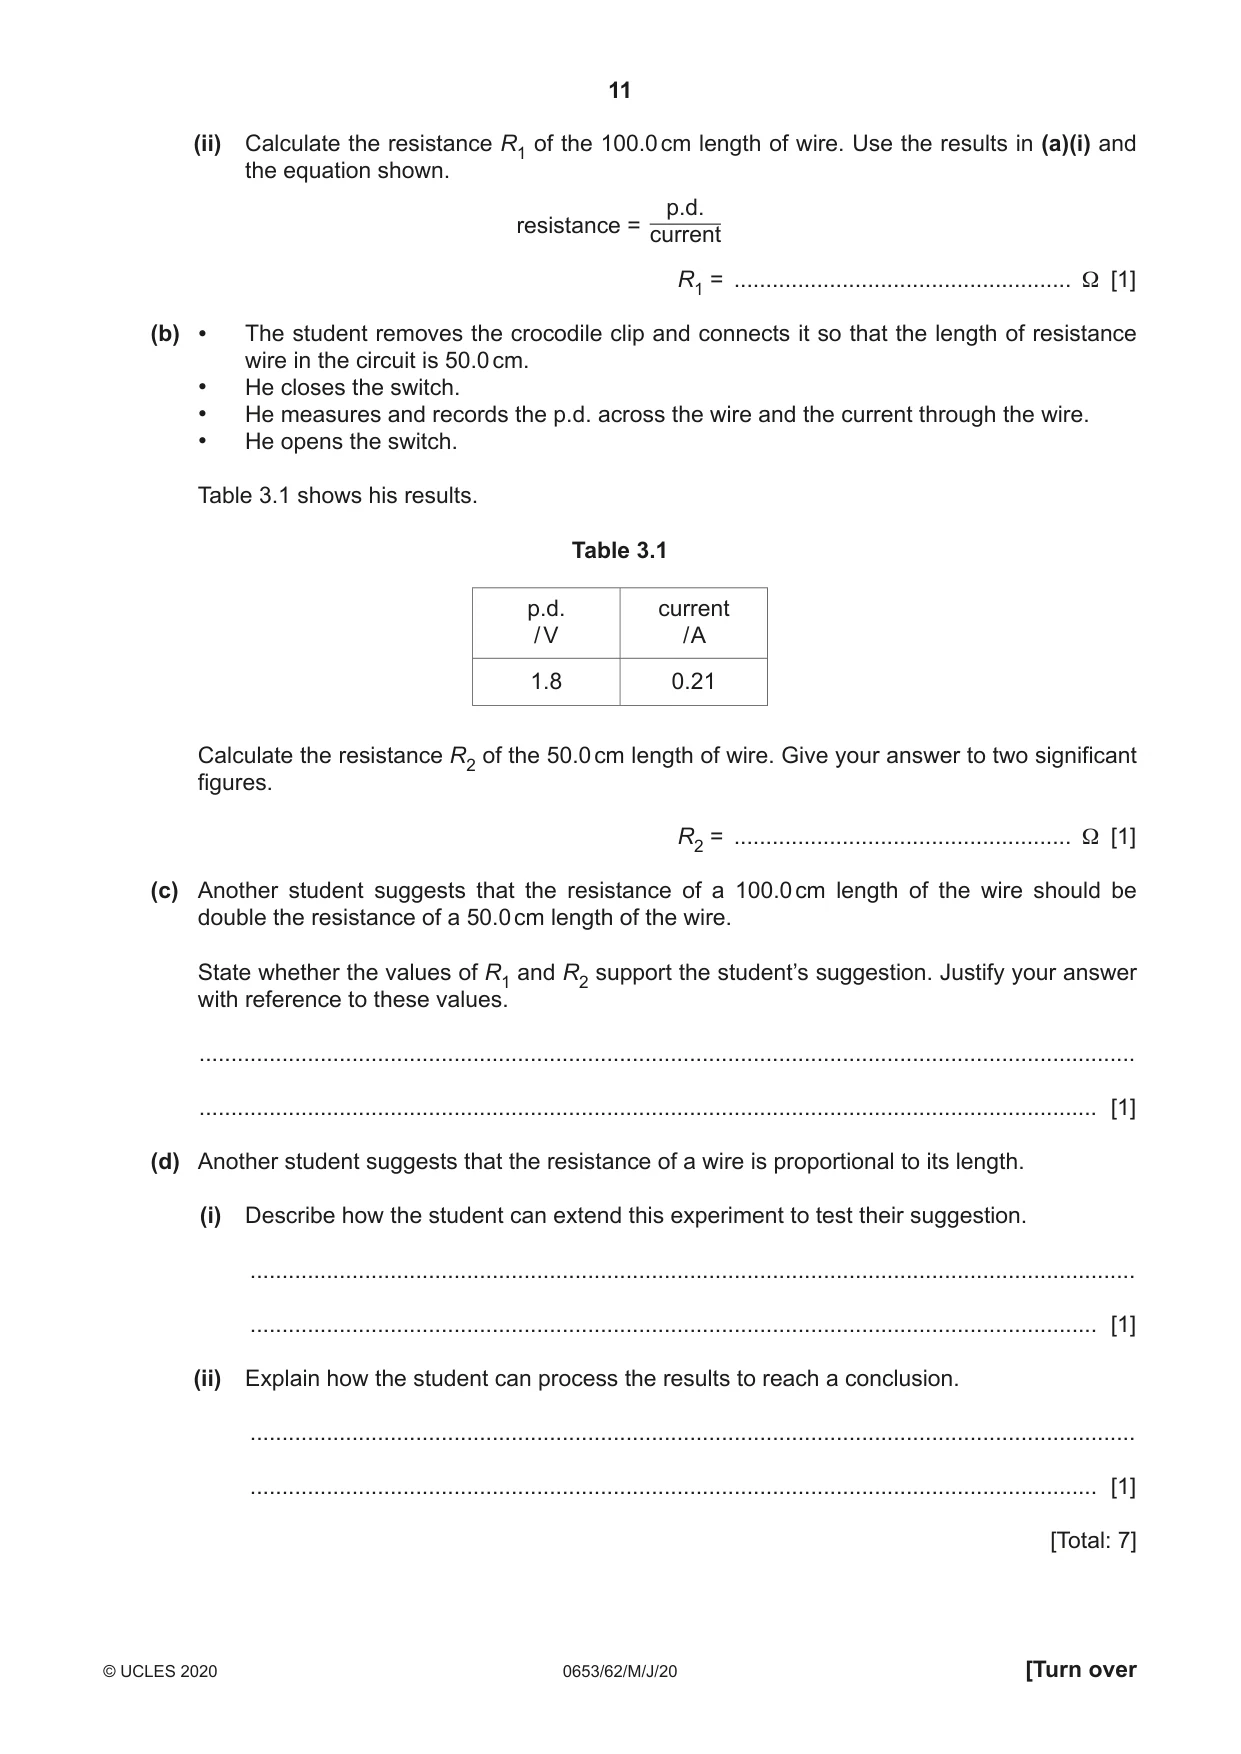
3 A student investigates the resistance of a piece of wire. (a) Fig. 3.1 shows the circuit that he sets up to find the potential difference (p.d.) across the 100.0 cm length of wire and the current through the wire. power supply A V 0 cm 100 cm X metre rule resistance wire crocodile clip Fig. 3.1 (i) • The student connects the crocodile clip at X so that the length of resistance wire in the circuit is 100.0 cm. • He closes the switch. • He measures and records the potential difference (p.d.) across the wire and the current through the wire. • He opens the switch. Fig. 3.2 shows the voltmeter and ammeter readings. Read and record the p.d. and current. 2 3 0.4 0.6 1 4 0.2 0.8 0 5 0 1.0 V A Fig. 3.2 p.d. = ........................................................... V current = ............................................................ A [2] (ii) Calculate the resistance R1 of the 100.0 cm length of wire. Use the results in (a)(i) and the equation shown. p.d. resistance = current R1 = ..................................................... Ω [1] (b) • The student removes the crocodile clip and connects it so that the length of resistance wire in the circuit is 50.0 cm. • He closes the switch. • He measures and records the p.d. across the wire and the current through the wire. • He opens the switch. Table 3.1 shows his results. Table 3.1 p.d. current / V / A 1.8 0.21 Calculate the resistance R2 of the 50.0 cm length of wire. Give your answer to two significant figures. R2 = ..................................................... Ω [1] (c) Another student suggests that the resistance of a 100.0 cm length of the wire should be double the resistance of a 50.0 cm length of the wire. State whether the values of R1 and R2 support the student’s suggestion. Justify your answer with reference to these values. ................................................................................................................................................... ............................................................................................................................................. [1] (d) Another student suggests that the resistance of a wire is proportional to its length. (i) Describe how the student can extend this experiment to test their suggestion. ........................................................................................................................................... ..................................................................................................................................... [1] (ii) Explain how the student can process the results to reach a conclusion. ........................................................................................................................................... ..................................................................................................................................... [1] [Total: 7]
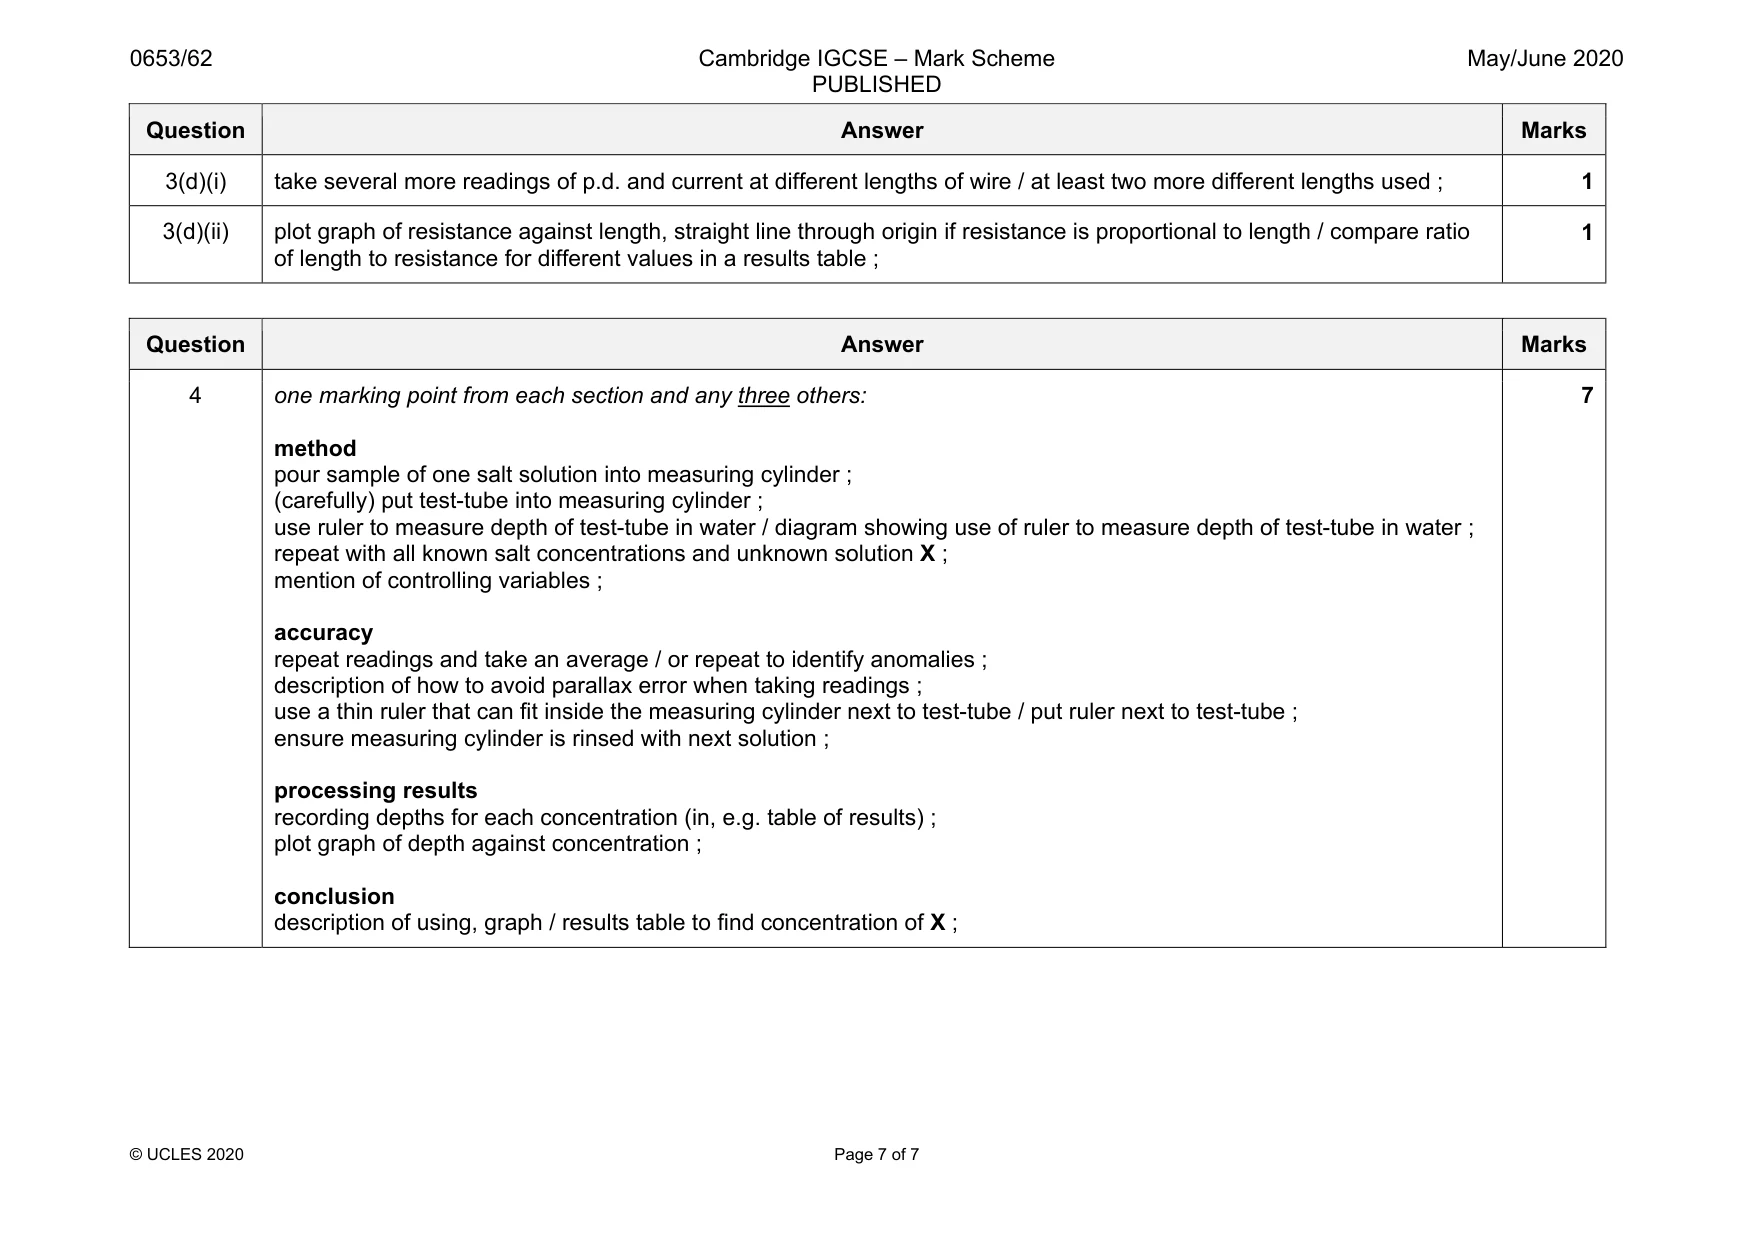
Mark scheme: 3(a)(i) 2.0 (V) ; 0.12 (A) ; 2 3(a)(ii) (2.0 / 0.12 =) 16.7 / 17 (Ω) ; 1 3(b) (1.8 / 0.21 =) 8.6 (Ω) (2 s.f. only) ; 1 3(c) (expect yes) R1 is approximately double R2, it is within the limits of experimental accuracy / the value is close to double ; 1 Question Answer Marks 3(d)(i) take several more readings of p.d. and current at different lengths of wire / at least two more different lengths used ; 1 3(d)(ii) plot graph of resistance against length, straight line through origin if resistance is proportional to length / compare ratio of length to resistance for different values in a results table ; 1
Q4 · An empty test-tube, floating in a measuring cylinder containing pure water
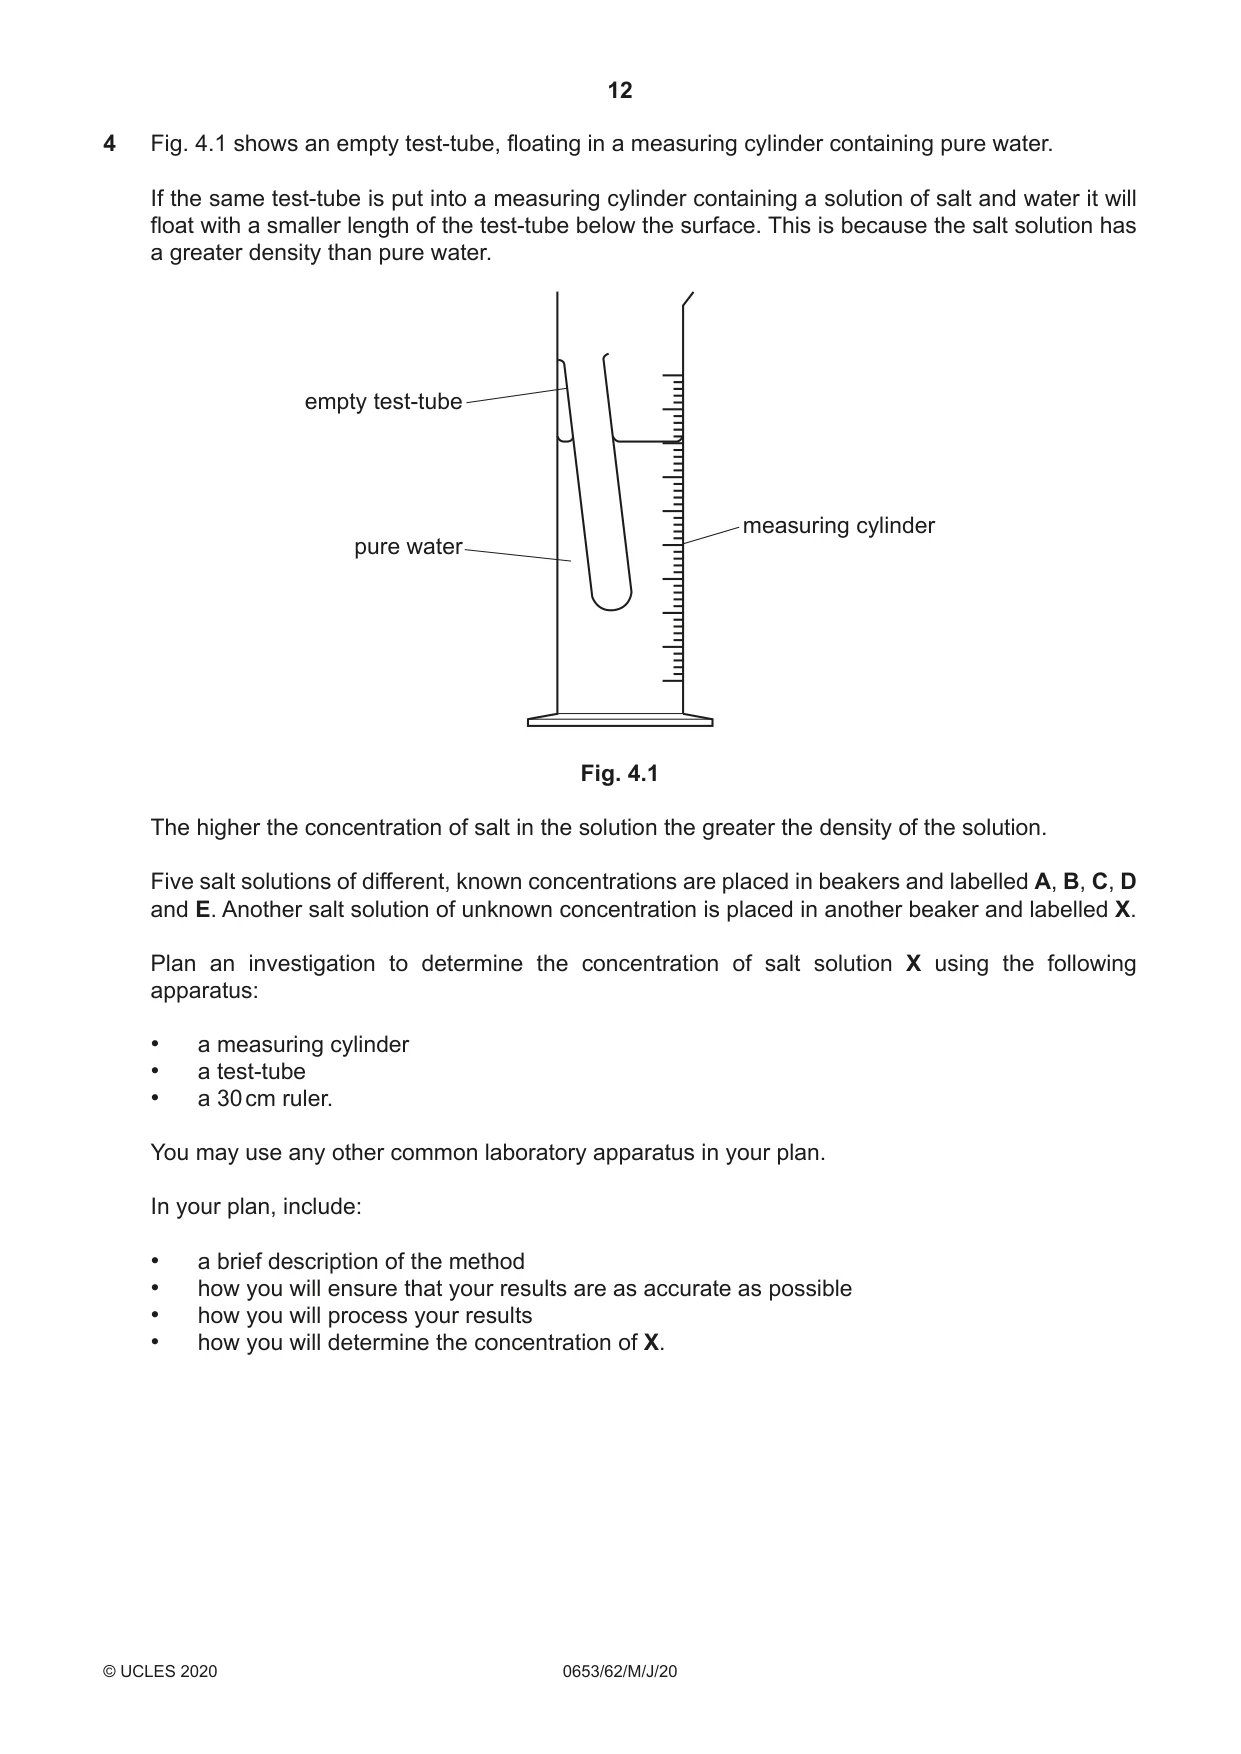
4 Fig. 4.1 shows an empty test-tube, floating in a measuring cylinder containing pure water. If the same test-tube is put into a measuring cylinder containing a solution of salt and water it will float with a smaller length of the test-tube below the surface. This is because the salt solution has a greater density than pure water. empty test-tube measuring cylinder pure water Fig. 4.1 The higher the concentration of salt in the solution the greater the density of the solution. Five salt solutions of different, known concentrations are placed in beakers and labelled A, B, C, D and E. Another salt solution of unknown concentration is placed in another beaker and labelled X. Plan an investigation to determine the concentration of salt solution X using the following apparatus: • a measuring cylinder • a test-tube • a 30 cm ruler. You may use any other common laboratory apparatus in your plan. In your plan, include: • a brief description of the method • how you will ensure that your results are as accurate as possible • how you will process your results • how you will determine the concentration of X. .......................................................................................................................................................... .......................................................................................................................................................... .......................................................................................................................................................... .......................................................................................................................................................... .......................................................................................................................................................... .......................................................................................................................................................... .......................................................................................................................................................... .......................................................................................................................................................... .......................................................................................................................................................... .................................................................................................................................................... [7]
Mark scheme: 4 one marking point from each section and any three others: method pour sample of one salt solution into measuring cylinder ; (carefully) put test-tube into measuring cylinder ; use ruler to measure depth of test-tube in water / diagram showing use of ruler to measure depth of test-tube in water ; repeat with all known salt concentrations and unknown solution X ; mention of controlling variables ; accuracy repeat readings and take an average / or repeat to identify anomalies ; description of how to avoid parallax error when taking readings ; use a thin ruler that can fit inside the measuring cylinder next to test-tube / put ruler next to test-tube ; ensure measuring cylinder is rinsed with next solution ; processing results recording depths for each concentration (in, e.g. table of results) ; plot graph of depth against concentration ; conclusion description of using, graph / results table to find concentration of X ;
What was in this paper
The subtopics covered by these 4 questions, and how many questions each got. Open one in a new tab to see every Cambridge question on it.