Cambridge IGCSE Science - Combined 0653 — 2019 May/June Paper 6 · Variant 3
0653/63/M/J/19 · 4 questions · 40 marks · ≈45 min
The question paper and its mark scheme, free to read here and free to download. This is Cambridge’s own paper, exactly as it was sat.
Question paper16 pages



Mark scheme7 pages
Answers below. Sit the paper first if you are practising.
Questions as text
Q1 · A student uses the apparatus shown in Fig
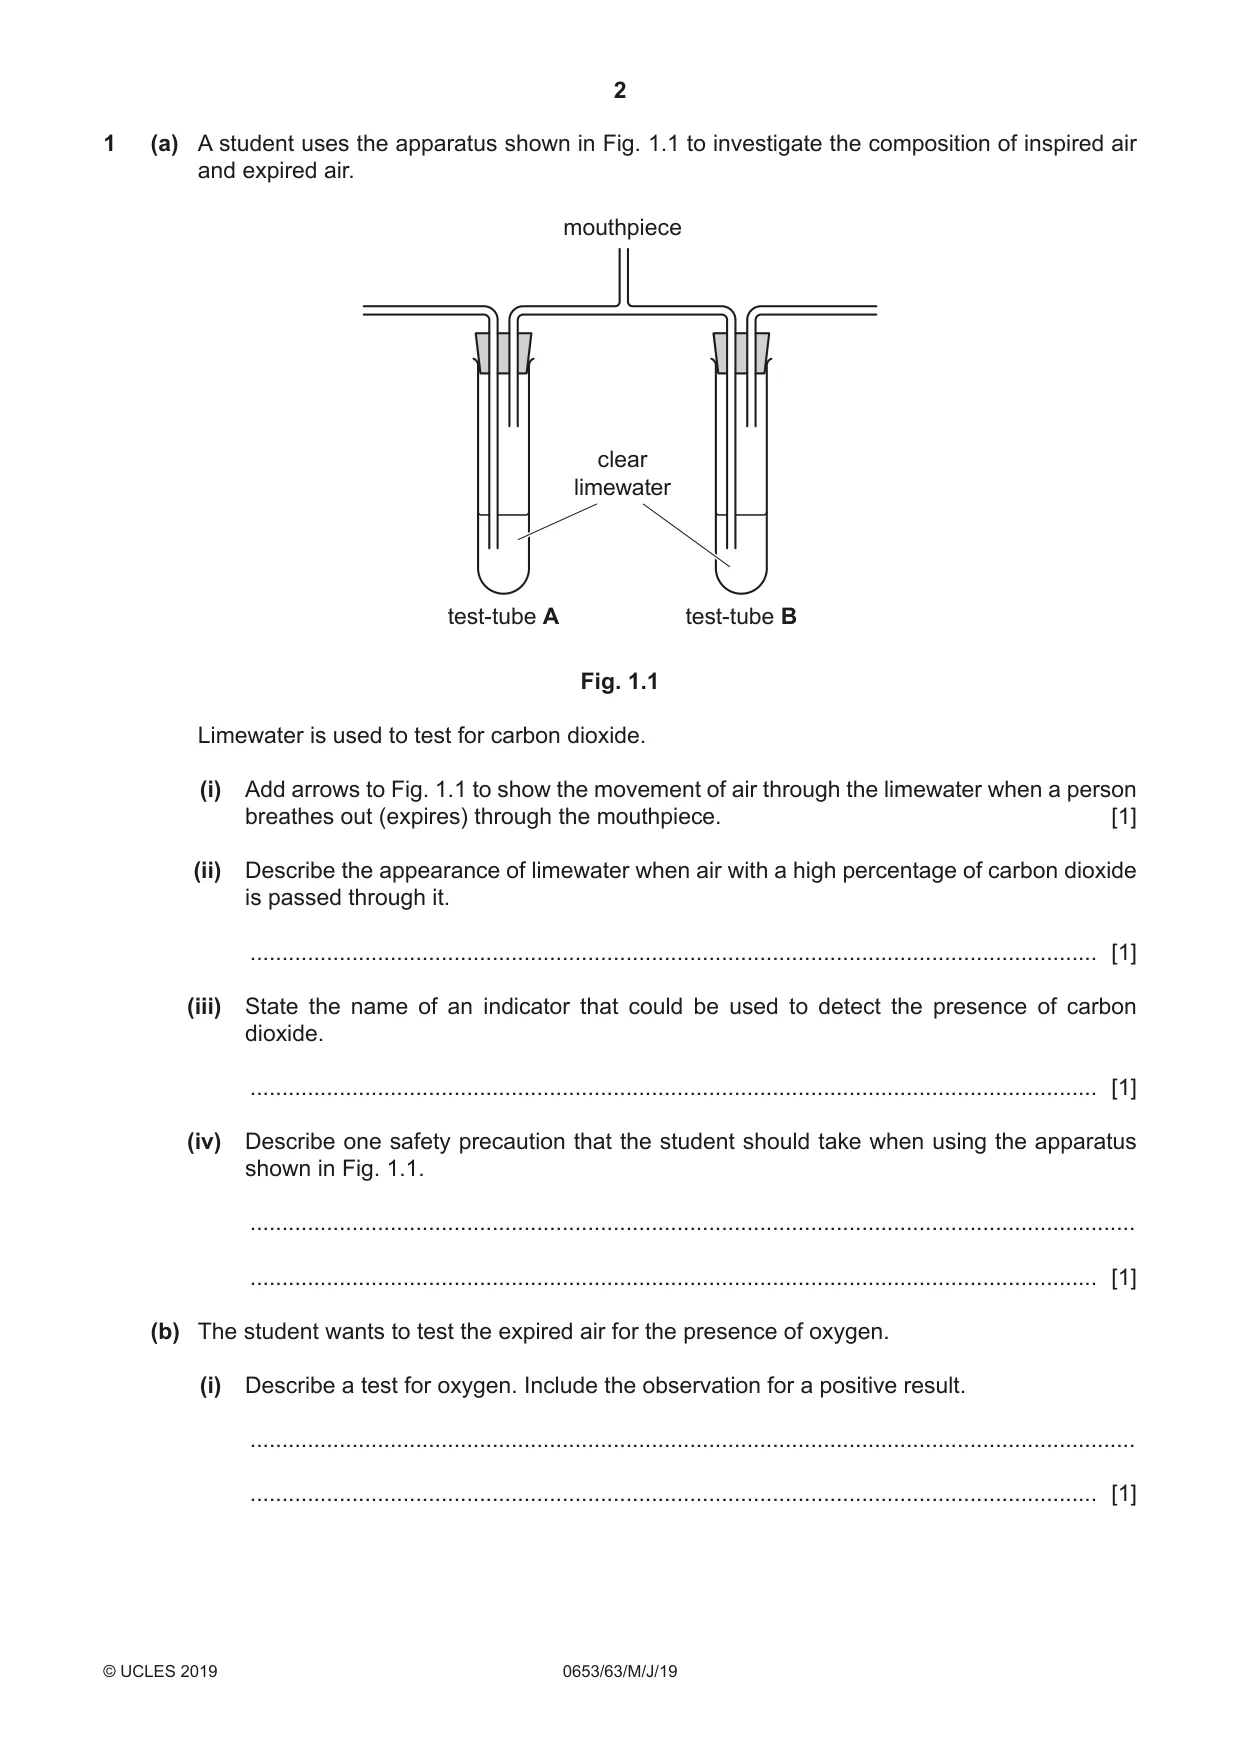
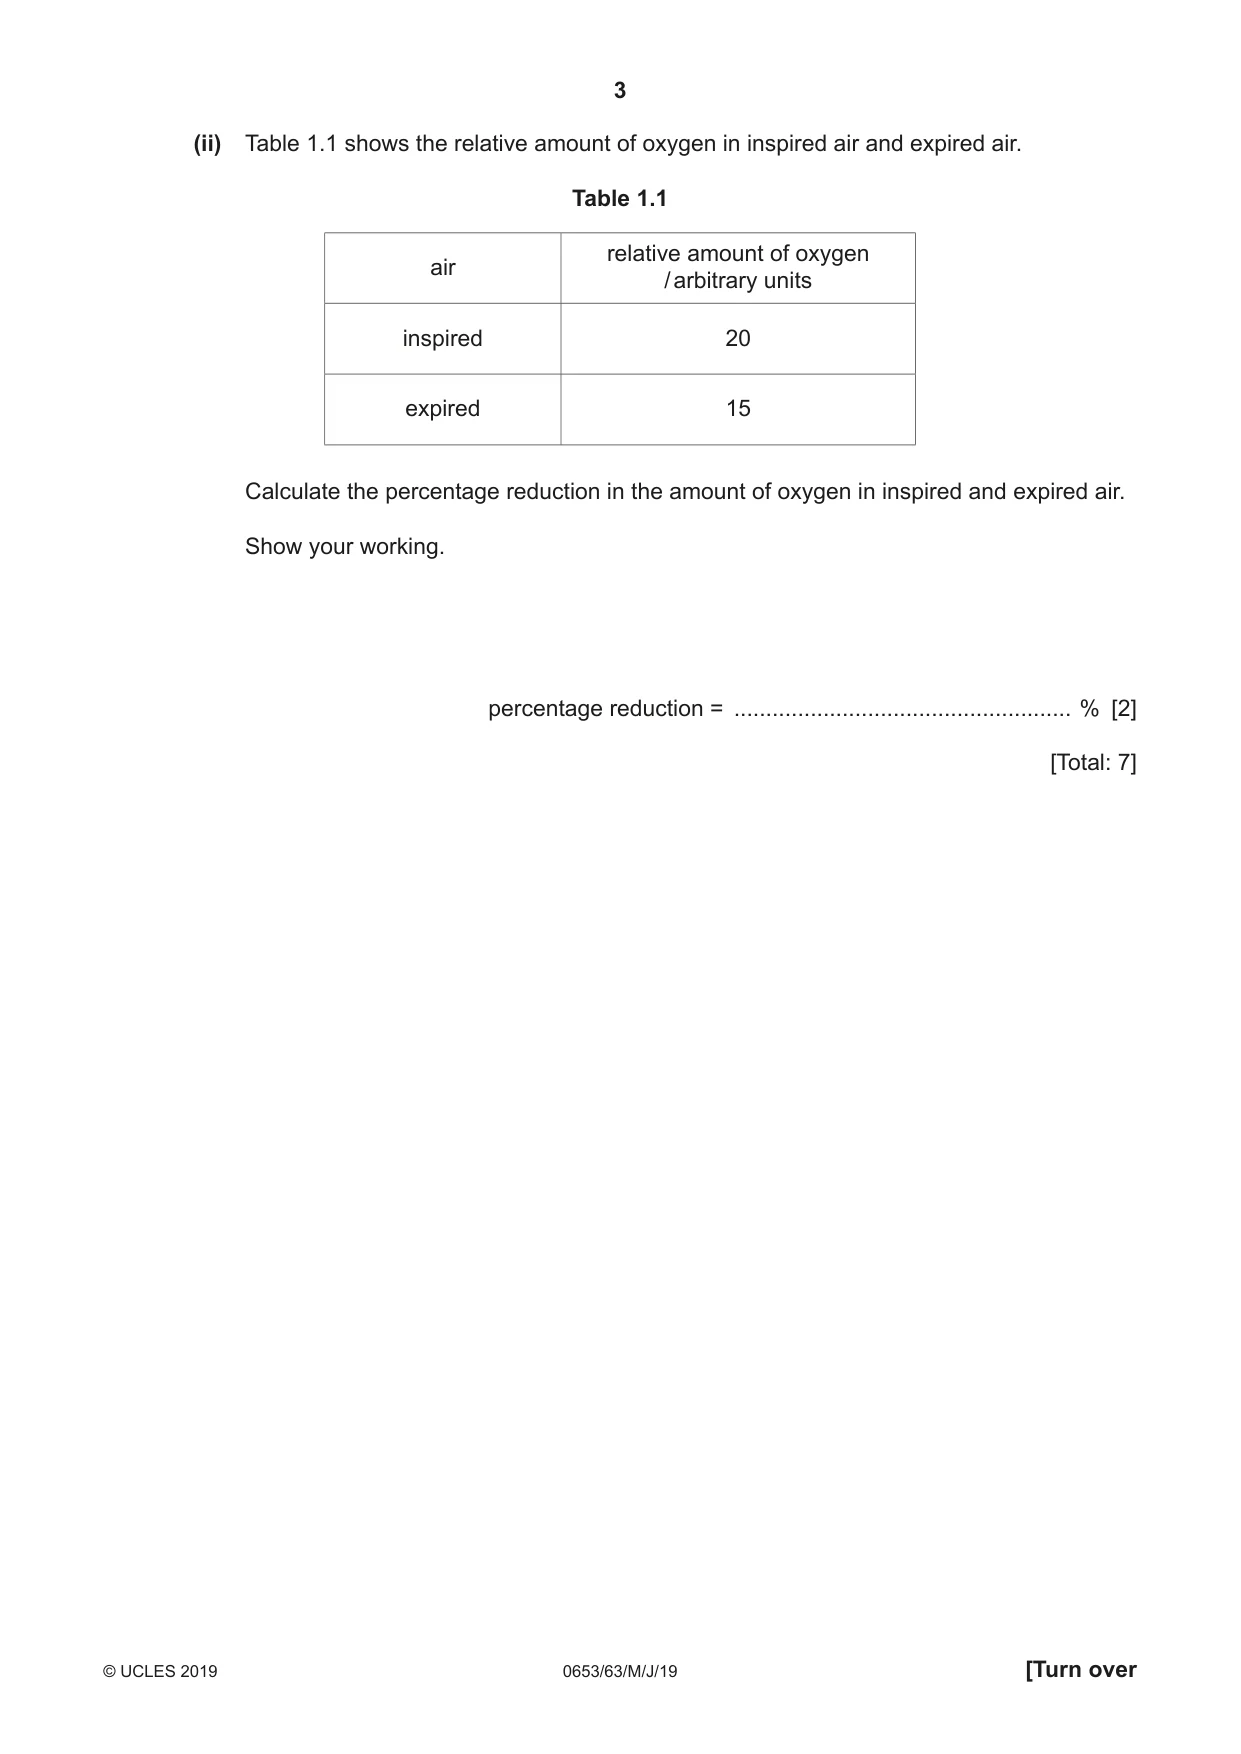
1 (a) A student uses the apparatus shown in Fig. 1.1 to investigate the composition of inspired air and expired air. mouthpiece clear limewater test-tube A test-tube B Fig. 1.1 Limewater is used to test for carbon dioxide. (i) Add arrows to Fig. 1.1 to show the movement of air through the limewater when a person breathes out (expires) through the mouthpiece. [1] (ii) Describe the appearance of limewater when air with a high percentage of carbon dioxide is passed through it. ..................................................................................................................................... [1] (iii) State the name of an indicator that could be used to detect the presence of carbon dioxide. ..................................................................................................................................... [1] (iv) Describe one safety precaution that the student should take when using the apparatus shown in Fig. 1.1. ........................................................................................................................................... ..................................................................................................................................... [1] (b) The student wants to test the expired air for the presence of oxygen. (i) Describe a test for oxygen. Include the observation for a positive result. ........................................................................................................................................... ..................................................................................................................................... [1] (ii) Table 1.1 shows the relative amount of oxygen in inspired air and expired air. Table 1.1 relative amount of oxygen air / arbitrary units inspired 20 expired 15 Calculate the percentage reduction in the amount of oxygen in inspired and expired air. Show your working. percentage reduction = ..................................................... % [2] [Total: 7]
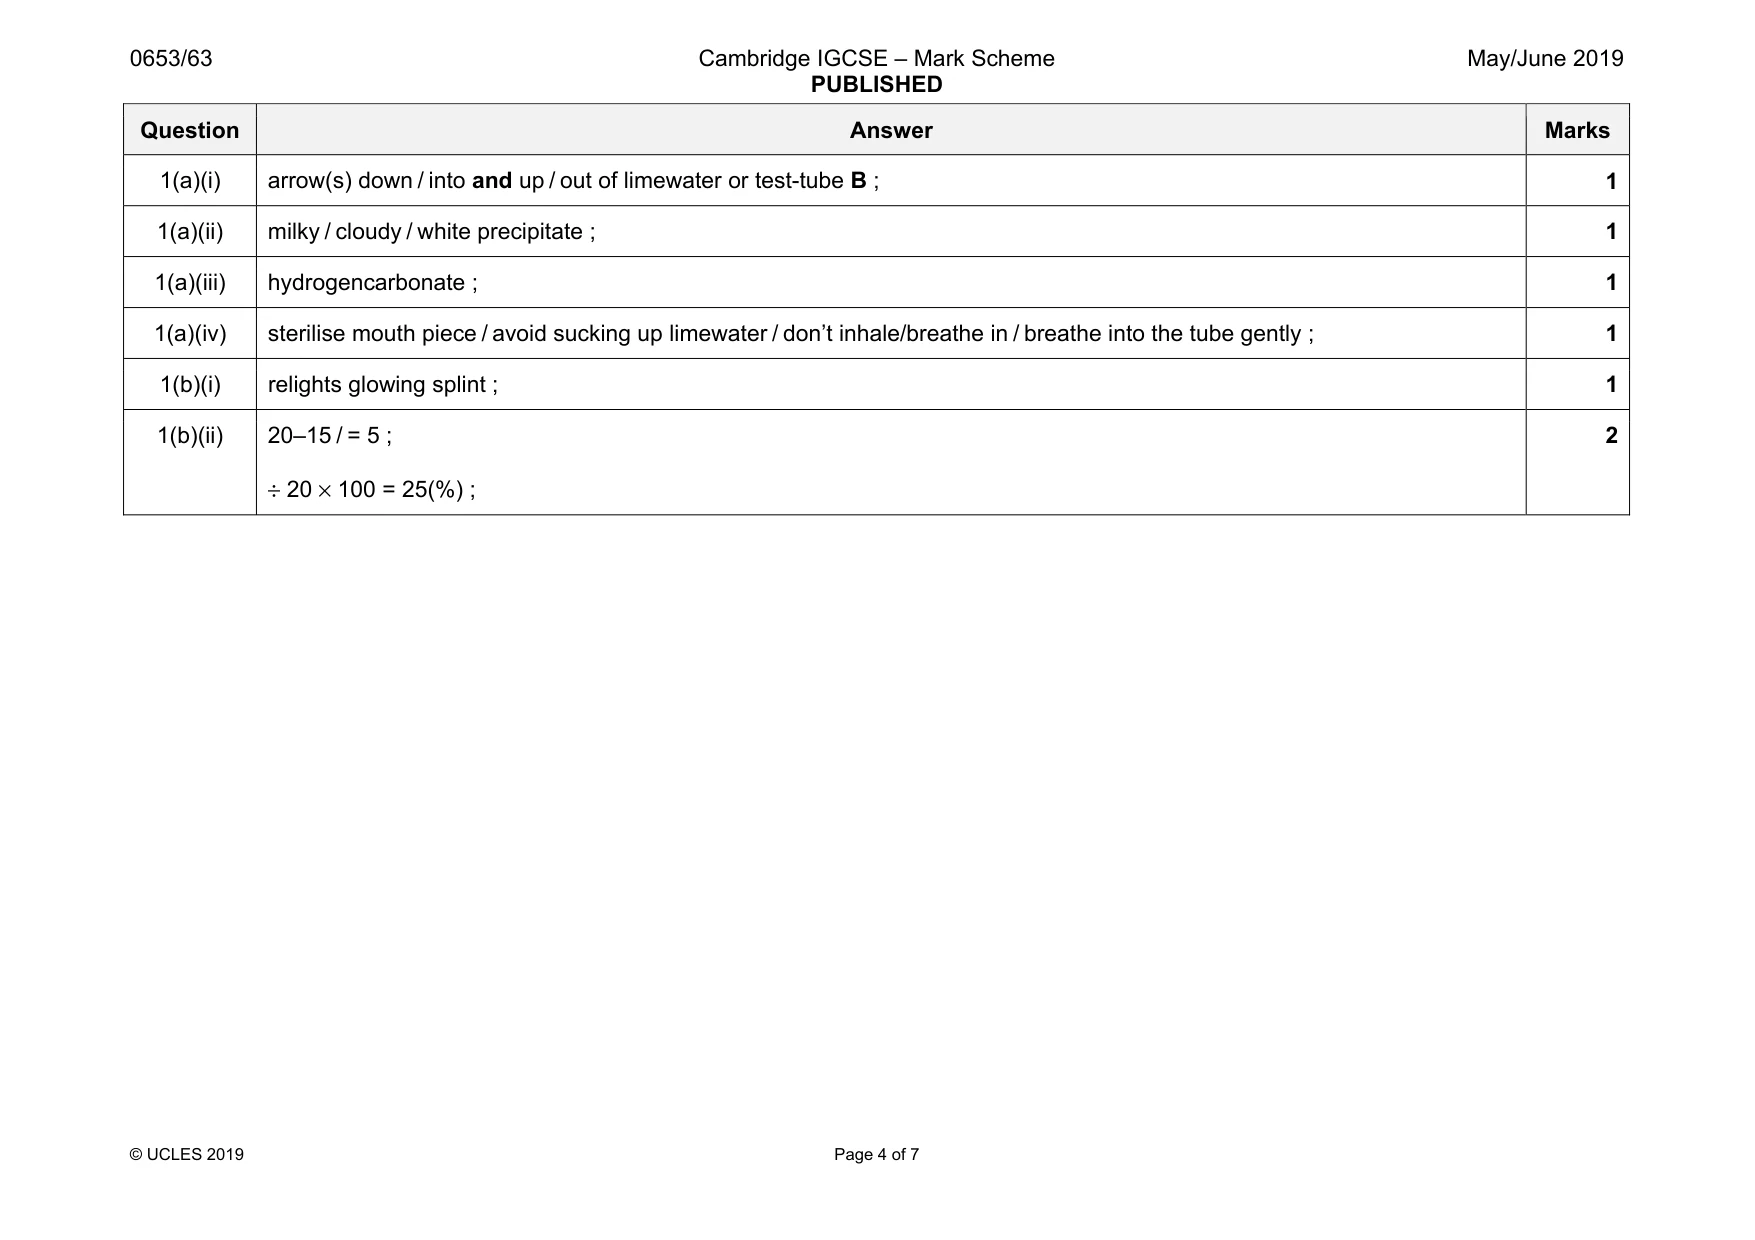
Mark scheme: 1(a)(i) arrow(s) down / into and up / out of limewater or test-tube B ; 1 1(a)(ii) milky / cloudy / white precipitate ; 1 1(a)(iii) hydrogencarbonate ; 1 1(a)(iv) sterilise mouth piece / avoid sucking up limewater / don’t inhale/breathe in / breathe into the tube gently ; 1 1(b)(i) relights glowing splint ; 1 1(b)(ii) 20–15 / = 5 ; ÷ 20 × 100 = 25(%) ; 2
Q2 · A person’s heart rate increases as they do more exercise
2 A person’s heart rate increases as they do more exercise. After the person stops exercising, the heart rate will return to normal. (a) Describe one technique for measuring a person’s heart rate. ................................................................................................................................................... ............................................................................................................................................. [1] (b) Plan an investigation, using the technique you have described in (a), to find out the average time it takes for the heart rate to return to normal after exercise. In your answer, include: • the apparatus needed, including a labelled diagram if you wish • a brief description of the method • how you will treat variables and any safety precautions • the measurements you will make • how you will use your results to draw a conclusion. ................................................................................................................................................... ................................................................................................................................................... ................................................................................................................................................... ................................................................................................................................................... ................................................................................................................................................... ................................................................................................................................................... ................................................................................................................................................... ................................................................................................................................................... ................................................................................................................................................... ................................................................................................................................................... ................................................................................................................................................... ............................................................................................................................................. [6] [Total: 7]
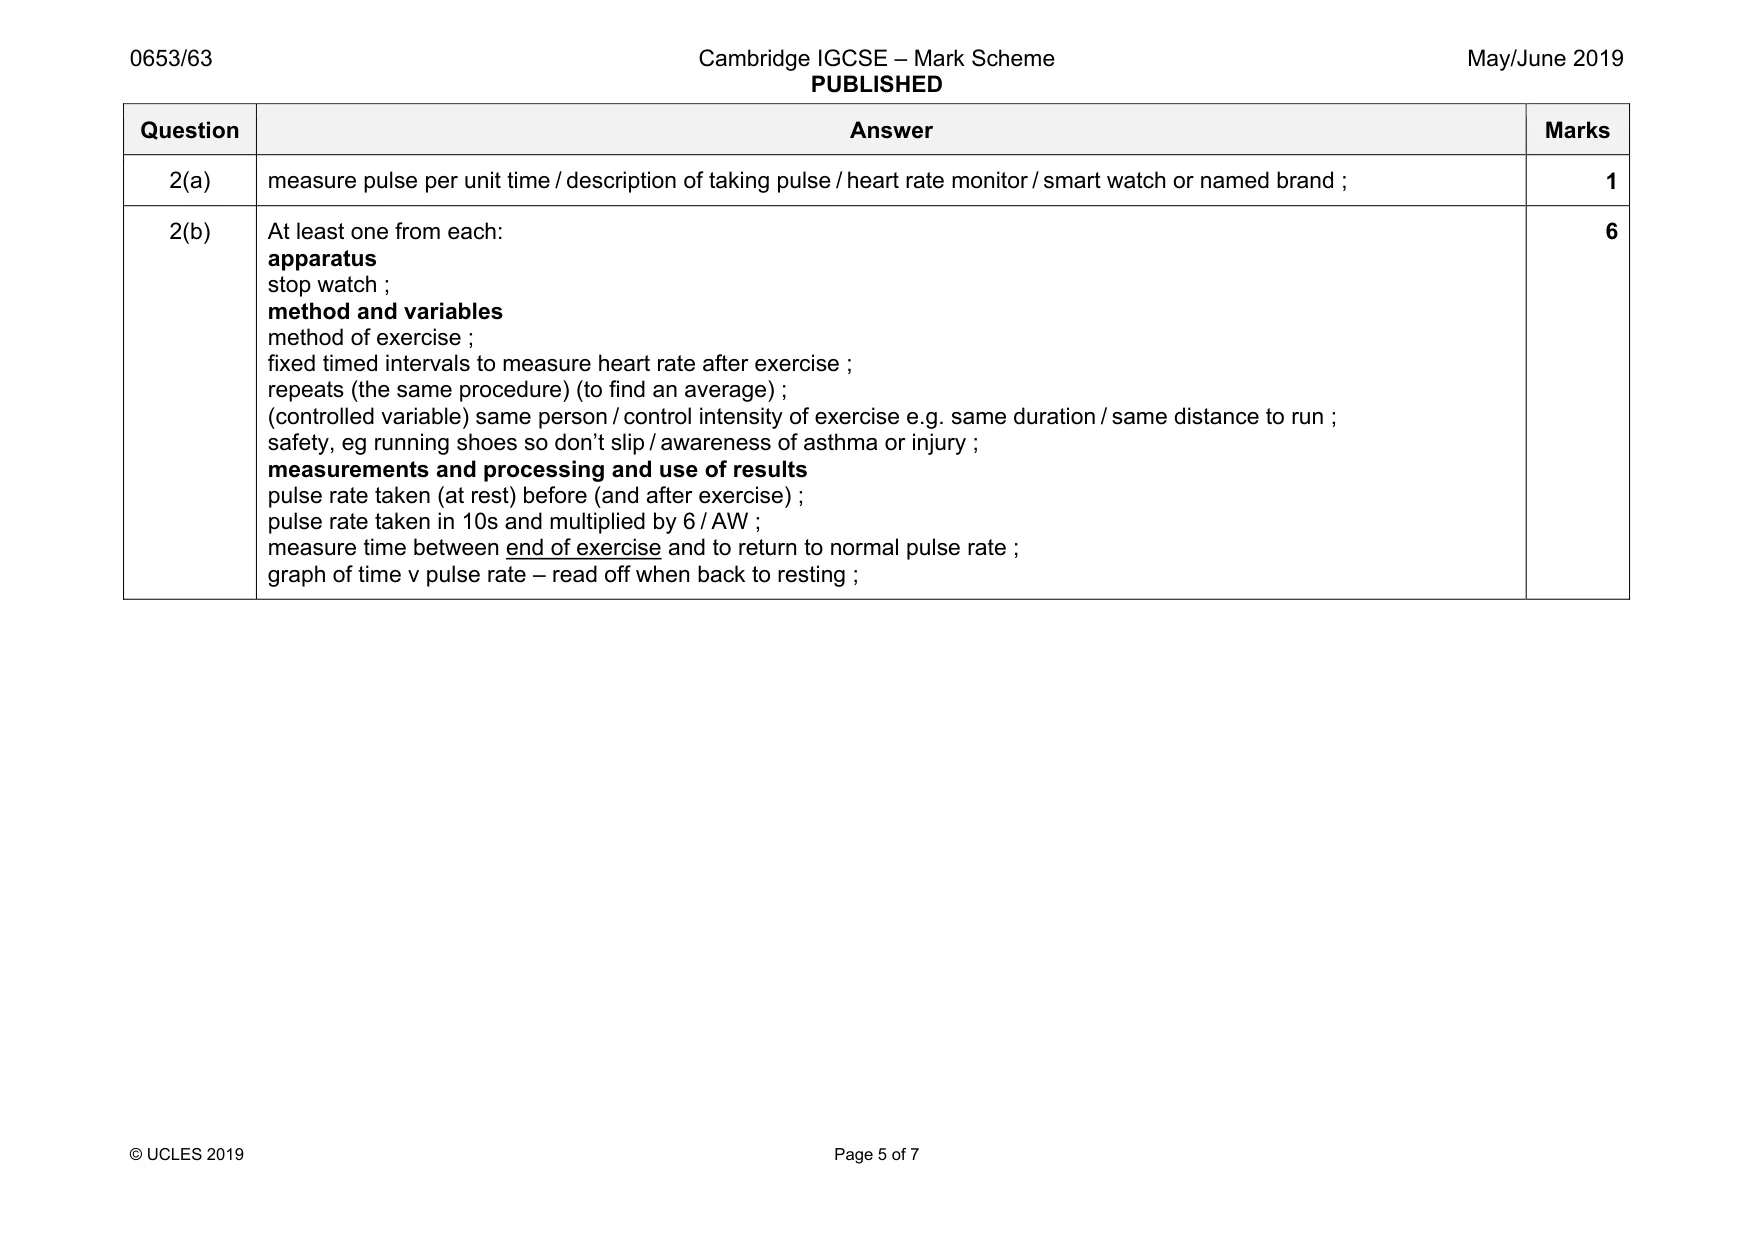
Mark scheme: 2(a) measure pulse per unit time / description of taking pulse / heart rate monitor / smart watch or named brand ; 1 2(b) At least one from each: apparatus stop watch ; method and variables method of exercise ; fixed timed intervals to measure heart rate after exercise ; repeats (the same procedure) (to find an average) ; (controlled variable) same person / control intensity of exercise e.g. same duration / same distance to run ; safety, eg running shoes so don’t slip / awareness of asthma or injury ; measurements and processing and use of results pulse rate taken (at rest) before (and after exercise) ; pulse rate taken in 10s and multiplied by 6 / AW ; measure time between end of exercise and to return to normal pulse rate ; graph of time v pulse rate – read off when back to resting ; 6
Q3 · A student investigates the volume of carbon dioxide given off when calcium carbonate…
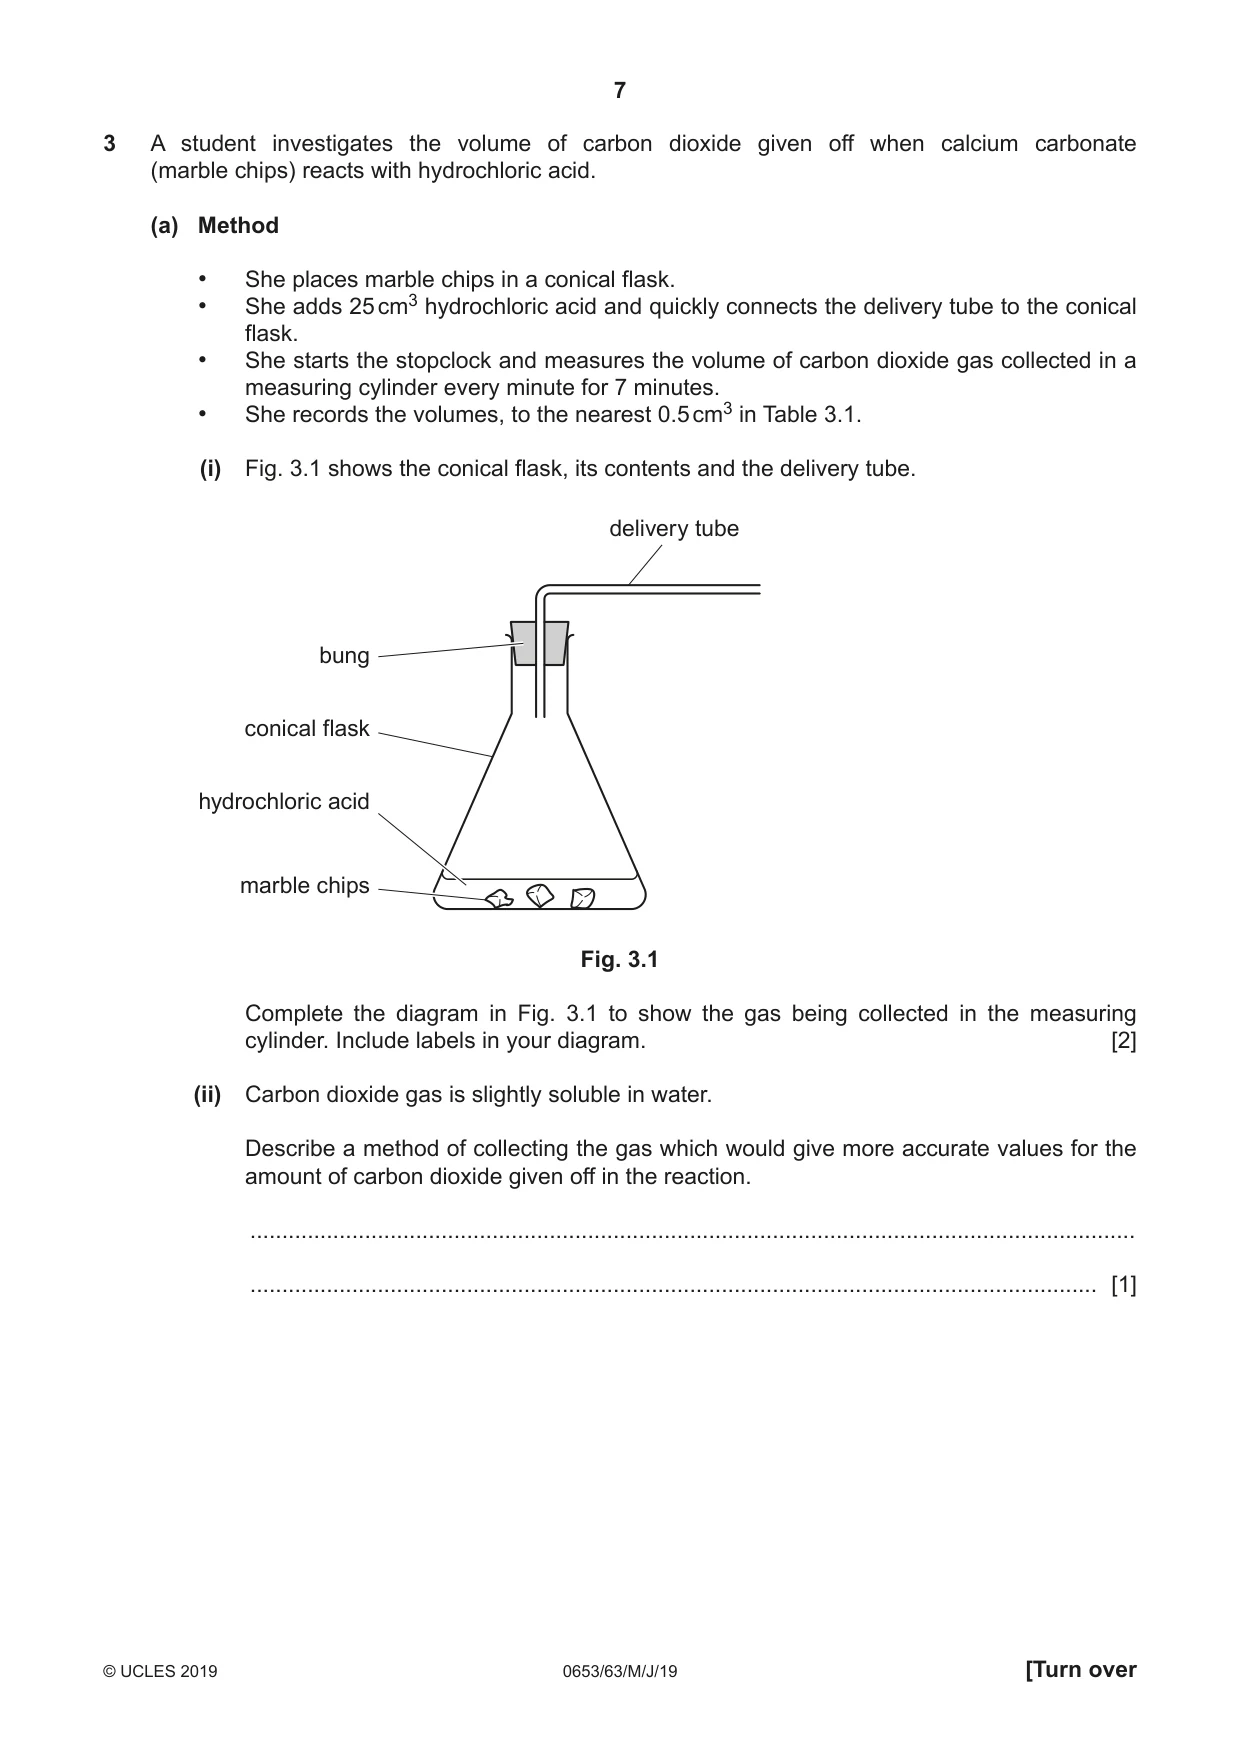
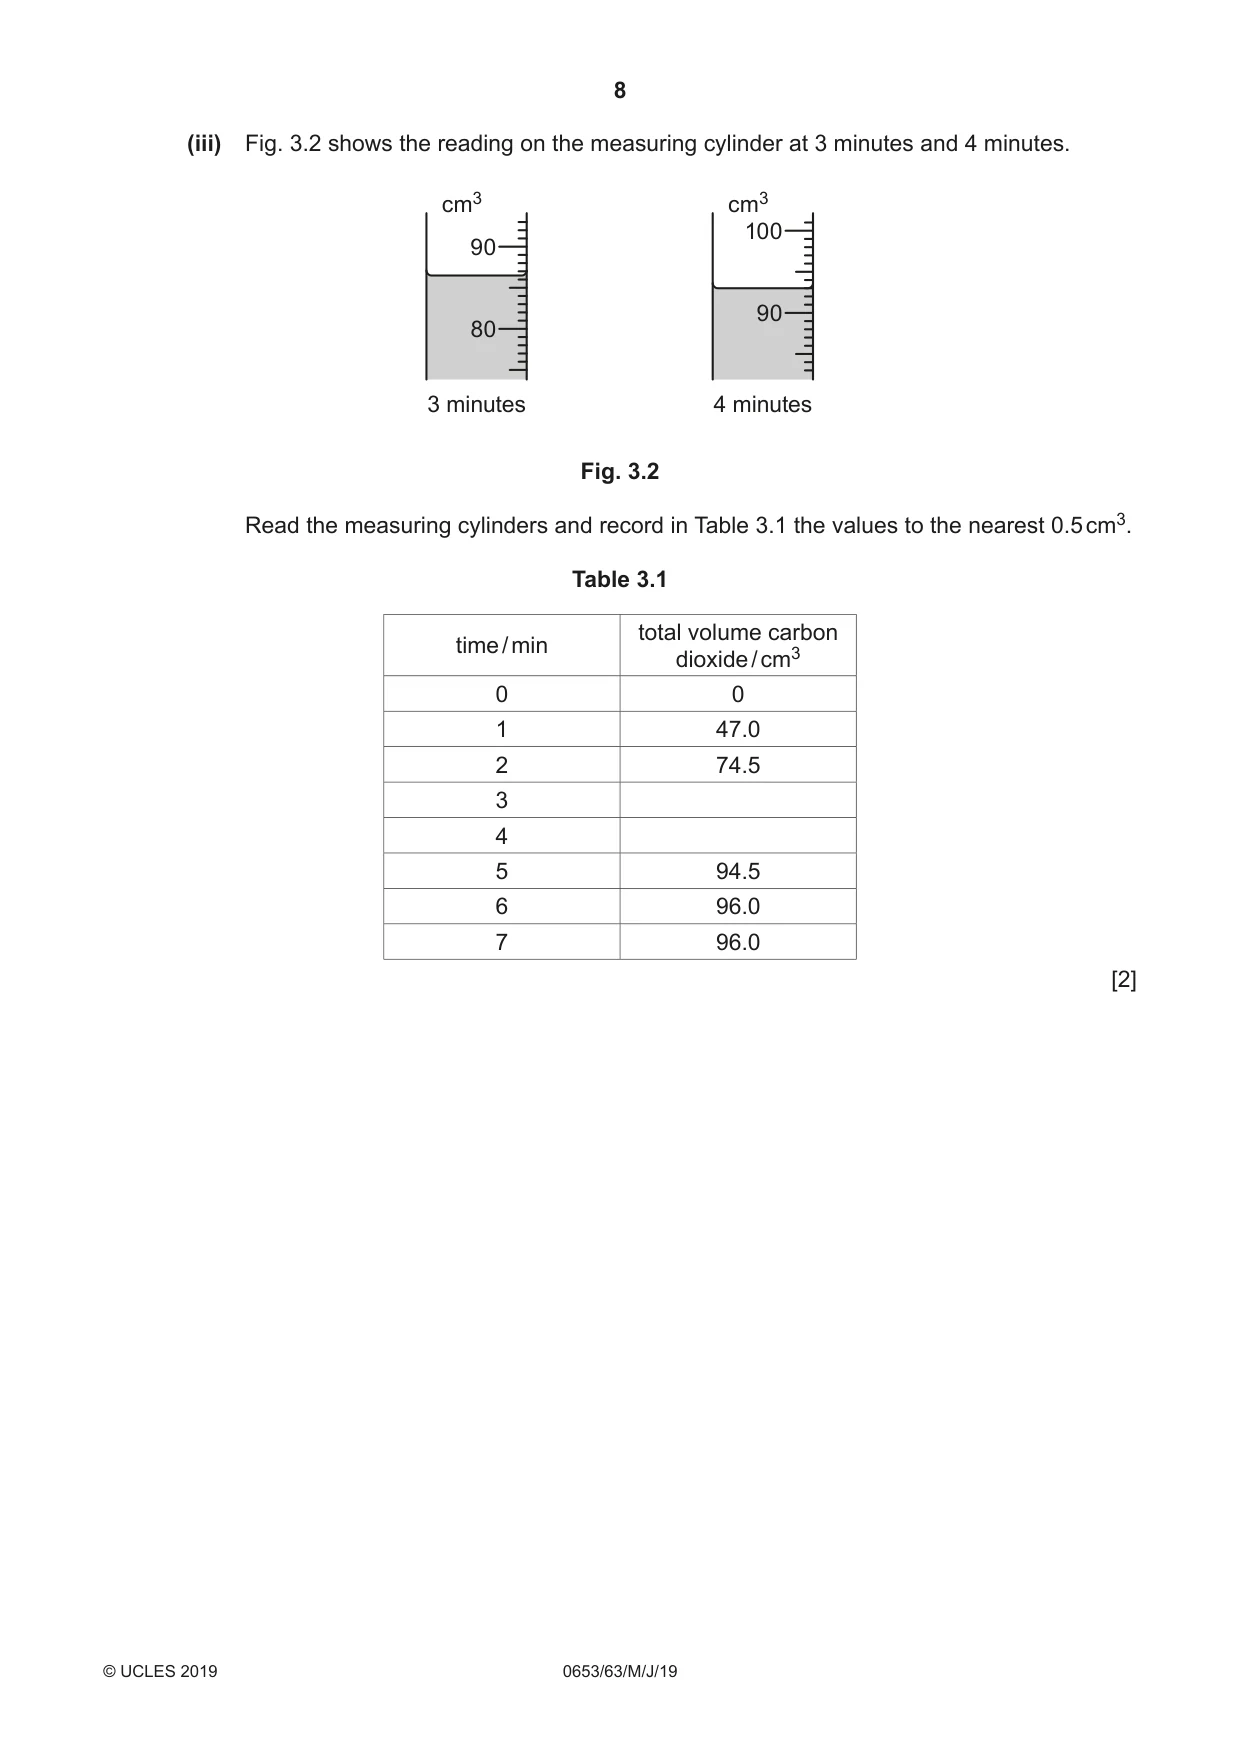
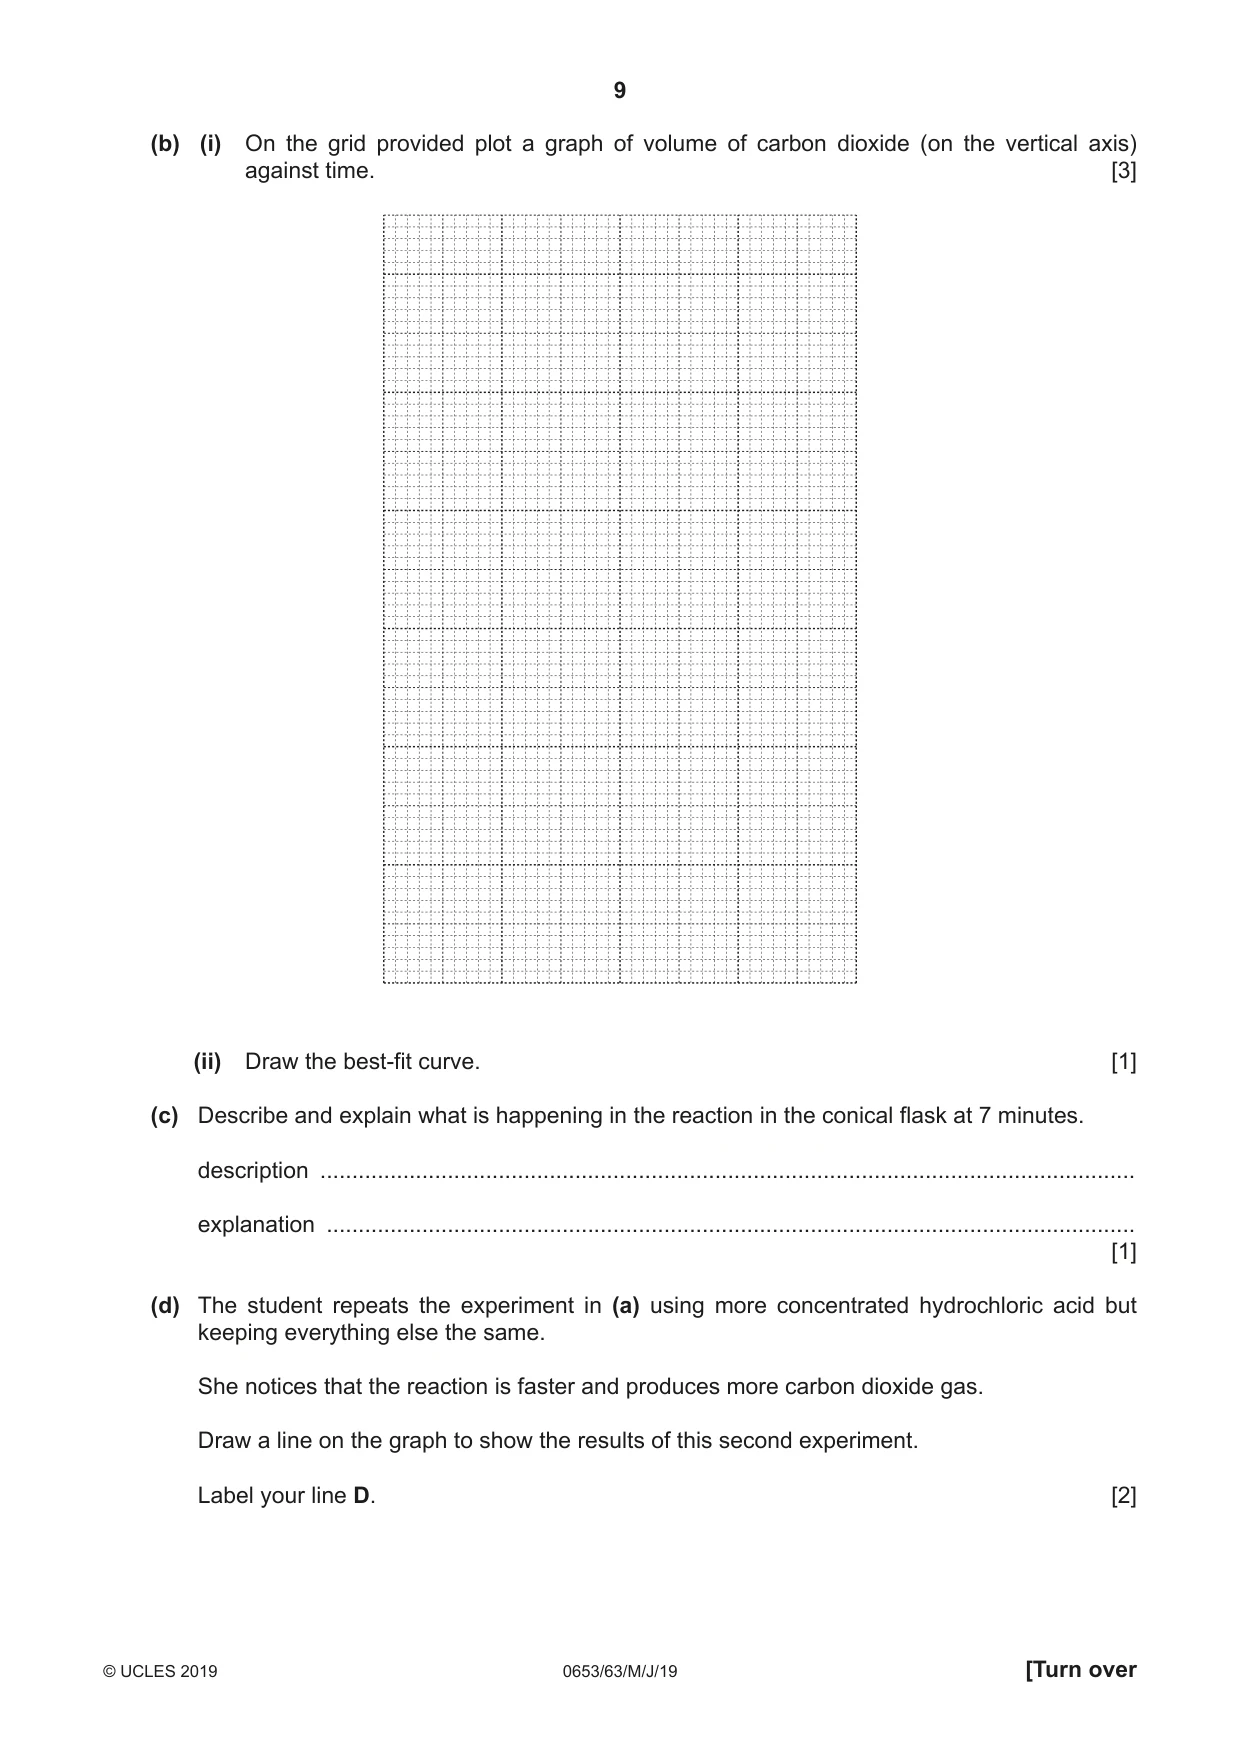
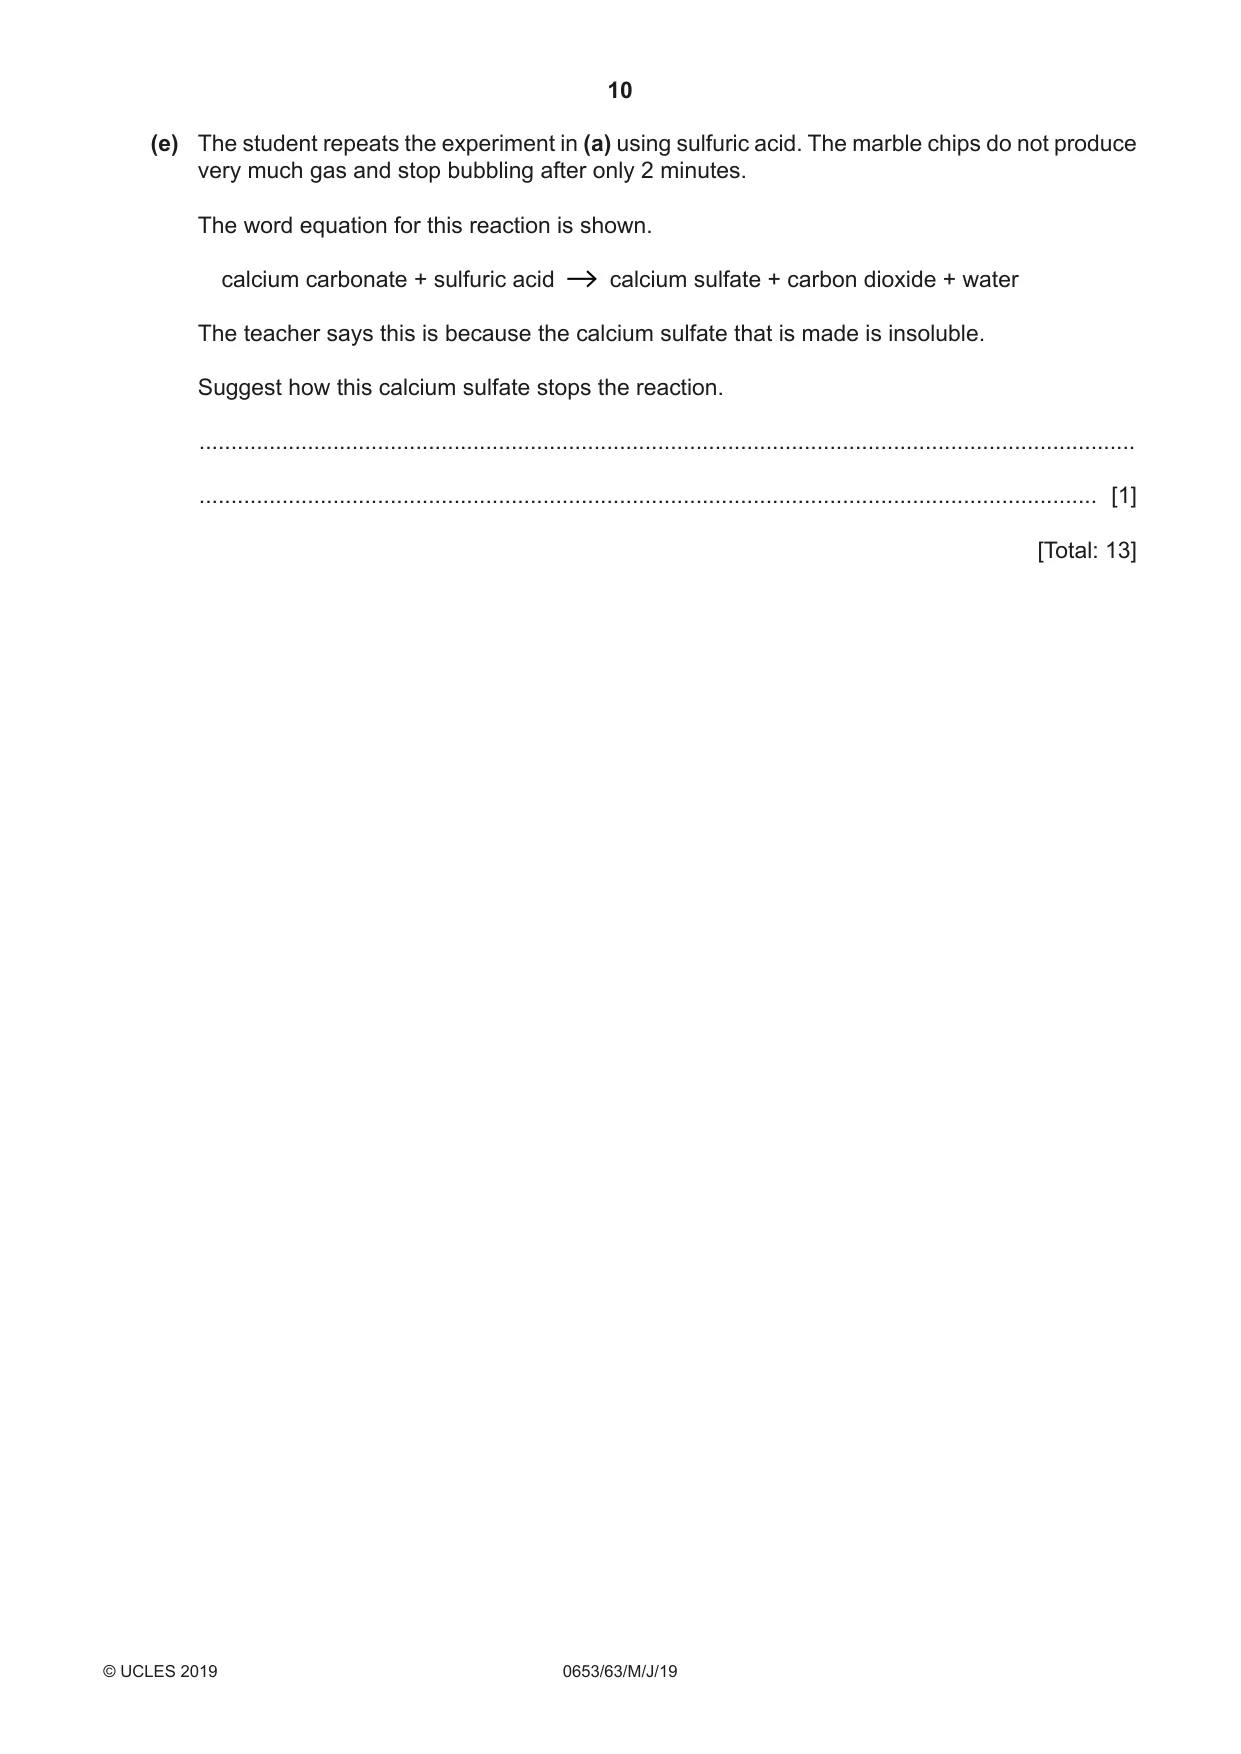
3 A student investigates the volume of carbon dioxide given off when calcium carbonate (marble chips) reacts with hydrochloric acid. (a) Method • She places marble chips in a conical flask. • She adds 25 cm3 hydrochloric acid and quickly connects the delivery tube to the conical flask. • She starts the stopclock and measures the volume of carbon dioxide gas collected in a measuring cylinder every minute for 7 minutes. • She records the volumes, to the nearest 0.5 cm3 in Table 3.1. (i) Fig. 3.1 shows the conical flask, its contents and the delivery tube. delivery tube bung conical flask hydrochloric acid marble chips Fig. 3.1 Complete the diagram in Fig. 3.1 to show the gas being collected in the measuring cylinder. Include labels in your diagram. [2] (ii) Carbon dioxide gas is slightly soluble in water. Describe a method of collecting the gas which would give more accurate values for the amount of carbon dioxide given off in the reaction. ........................................................................................................................................... ..................................................................................................................................... [1] (iii) Fig. 3.2 shows the reading on the measuring cylinder at 3 minutes and 4 minutes. cm3 cm3 100 90 90 80 3 minutes 4 minutes Fig. 3.2 Read the measuring cylinders and record in Table 3.1 the values to the nearest 0.5 cm3. Table 3.1 total volume carbon time / min dioxide / cm3 0 0 1 47.0 2 74.5 3 4 5 94.5 6 96.0 7 96.0 [2] (b) (i) On the grid provided plot a graph of volume of carbon dioxide (on the vertical axis) against time. [3] (ii) Draw the best-fit curve. [1] (c) Describe and explain what is happening in the reaction in the conical flask at 7 minutes. description ................................................................................................................................ explanation ............................................................................................................................... [1] (d) The student repeats the experiment in (a) using more concentrated hydrochloric acid but keeping everything else the same. She notices that the reaction is faster and produces more carbon dioxide gas. Draw a line on the graph to show the results of this second experiment. Label your line D. [2] (e) The student repeats the experiment in (a) using sulfuric acid. The marble chips do not produce very much gas and stop bubbling after only 2 minutes. The word equation for this reaction is shown. calcium carbonate + sulfuric acid calcium sulfate + carbon dioxide + water The teacher says this is because the calcium sulfate that is made is insoluble. Suggest how this calcium sulfate stops the reaction. ................................................................................................................................................... ............................................................................................................................................. [1] [Total: 13]
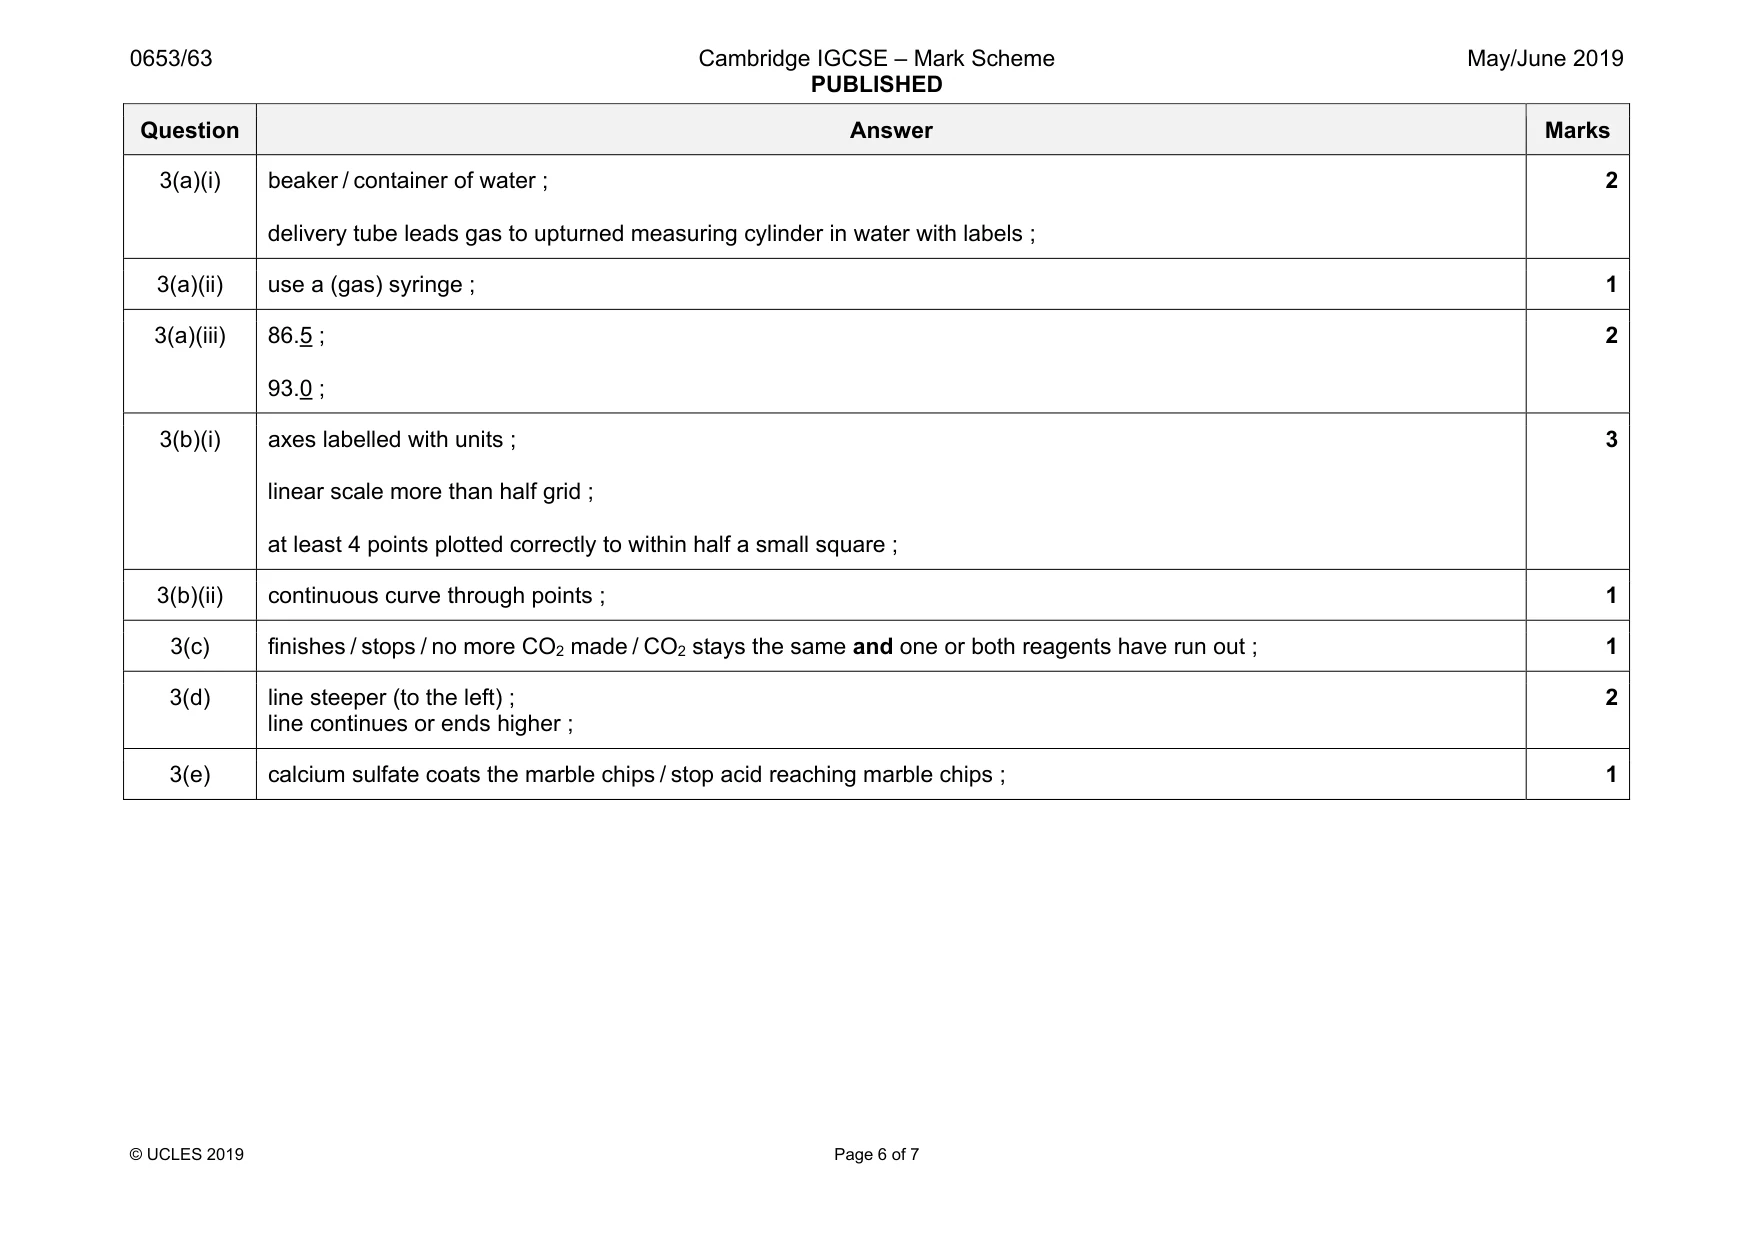
Mark scheme: 3(a)(i) beaker / container of water ; delivery tube leads gas to upturned measuring cylinder in water with labels ; 2 3(a)(ii) use a (gas) syringe ; 1 3(a)(iii) 86.5 ; 93.0 ; 2 3(b)(i) axes labelled with units ; linear scale more than half grid ; at least 4 points plotted correctly to within half a small square ; 3 3(b)(ii) continuous curve through points ; 1 3(c) finishes / stops / no more CO2 made / CO2 stays the same and one or both reagents have run out ; 1 3(d) line steeper (to the left) ; line continues or ends higher ; 2 3(e) calcium sulfate coats the marble chips / stop acid reaching marble chips ; 1
Q4 · A student investigates the relationship between the speed of sound in different materials…
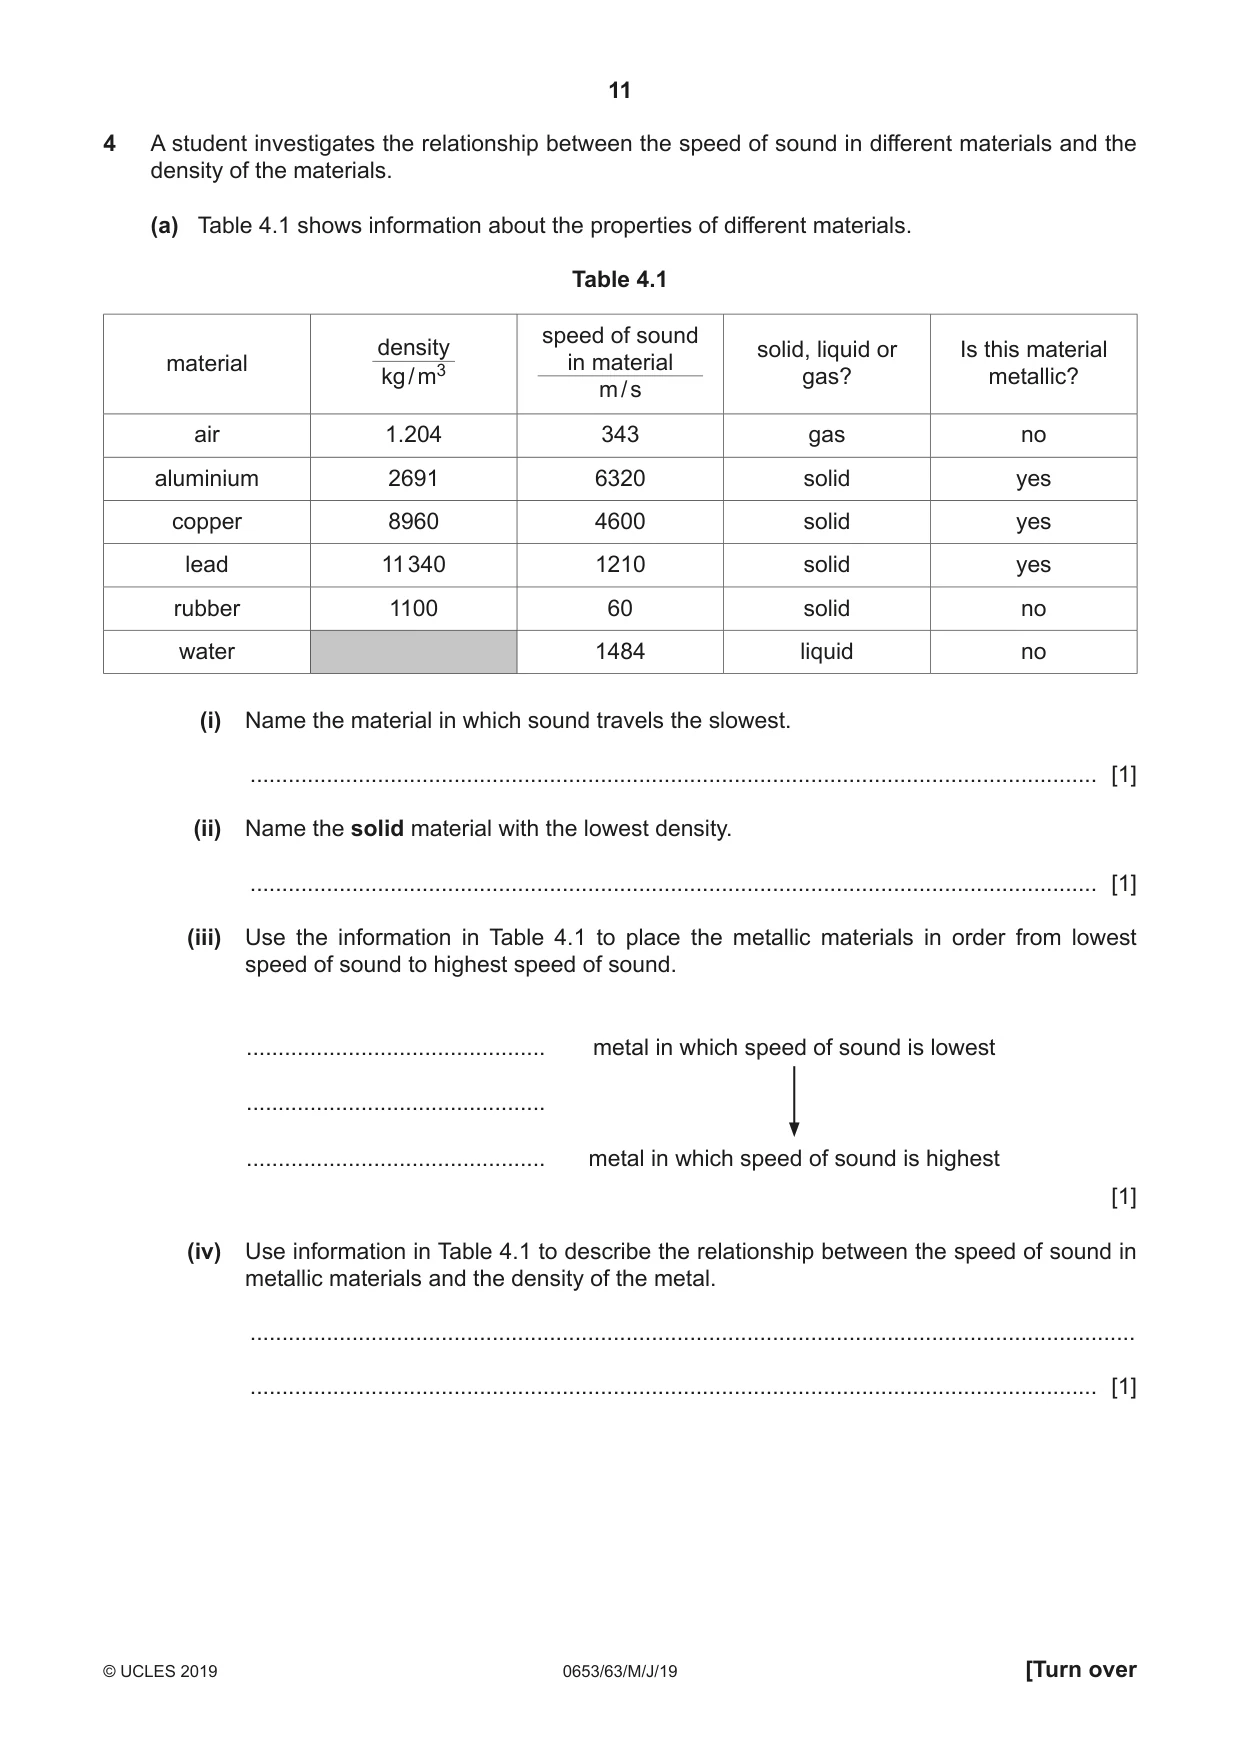
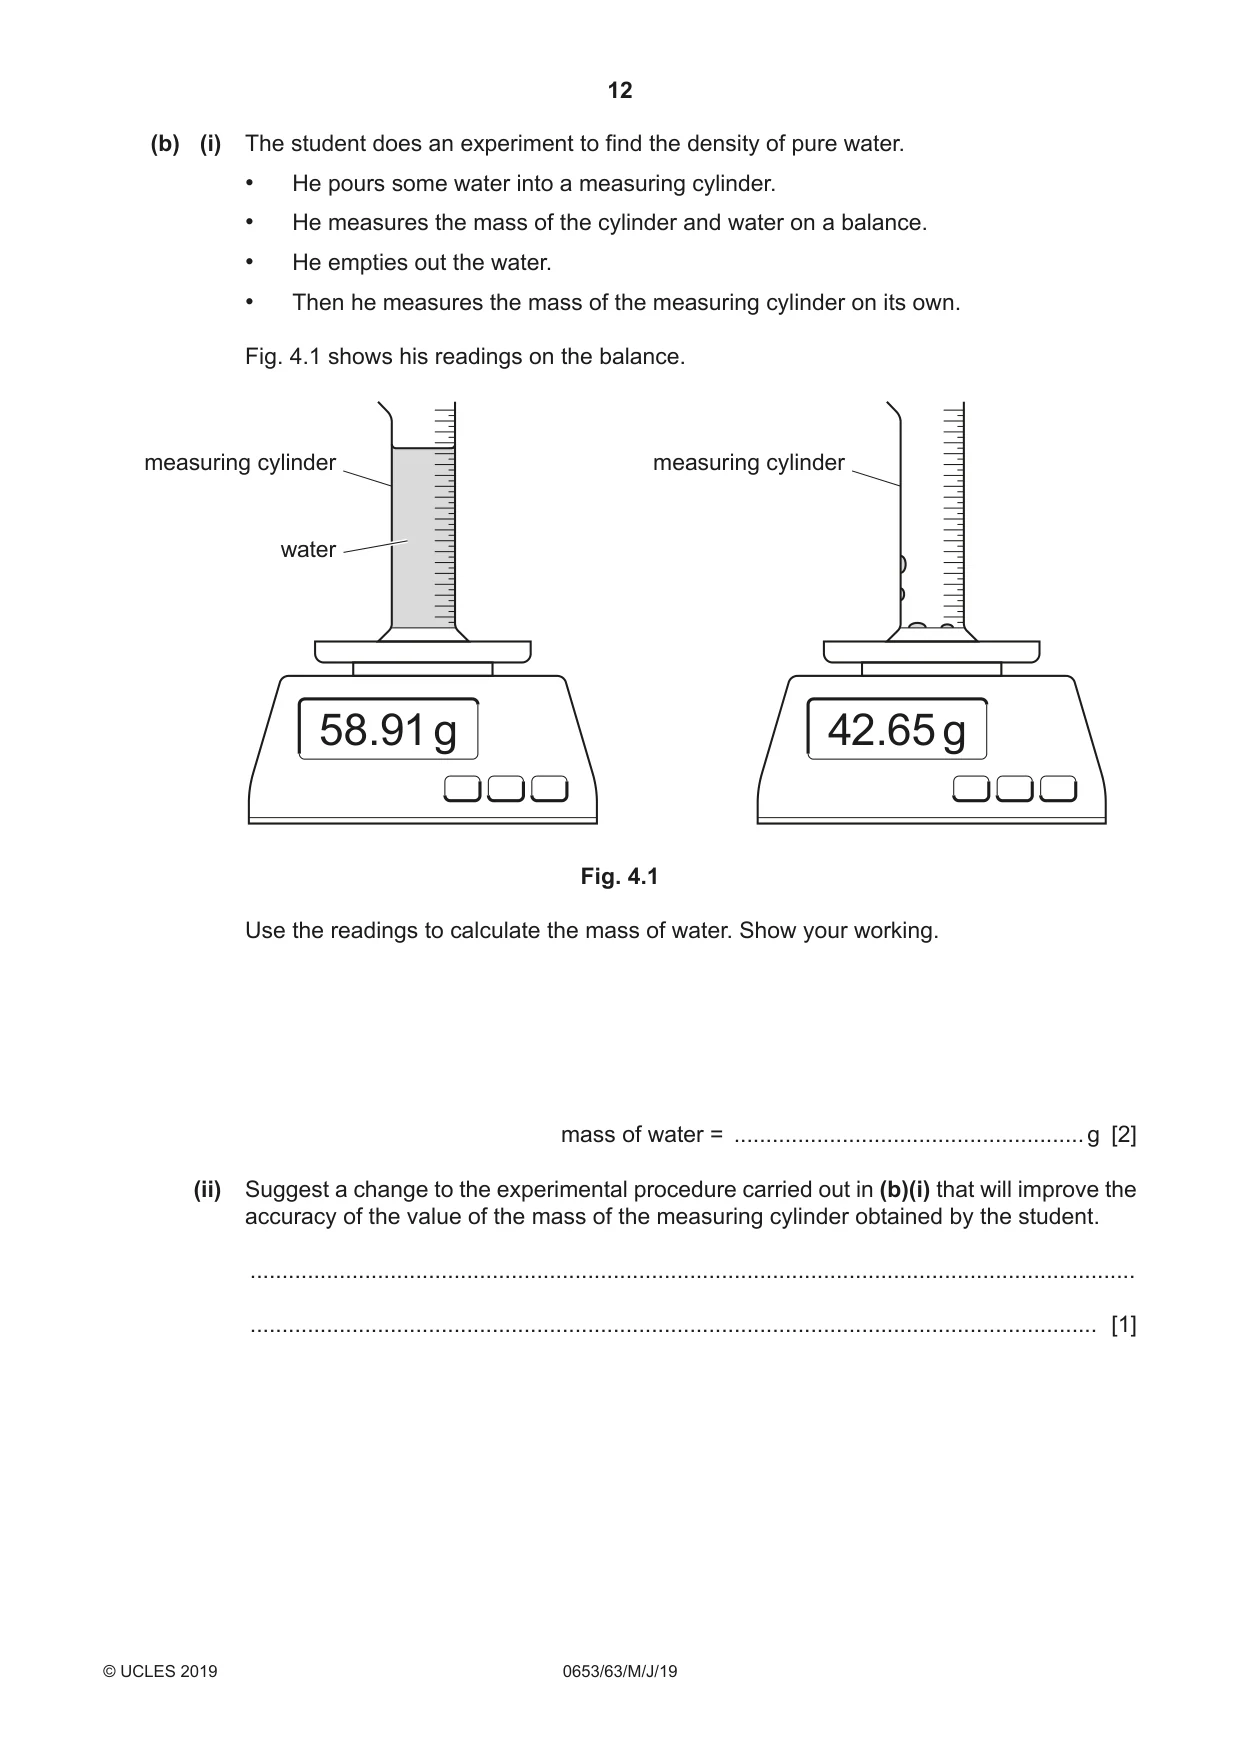
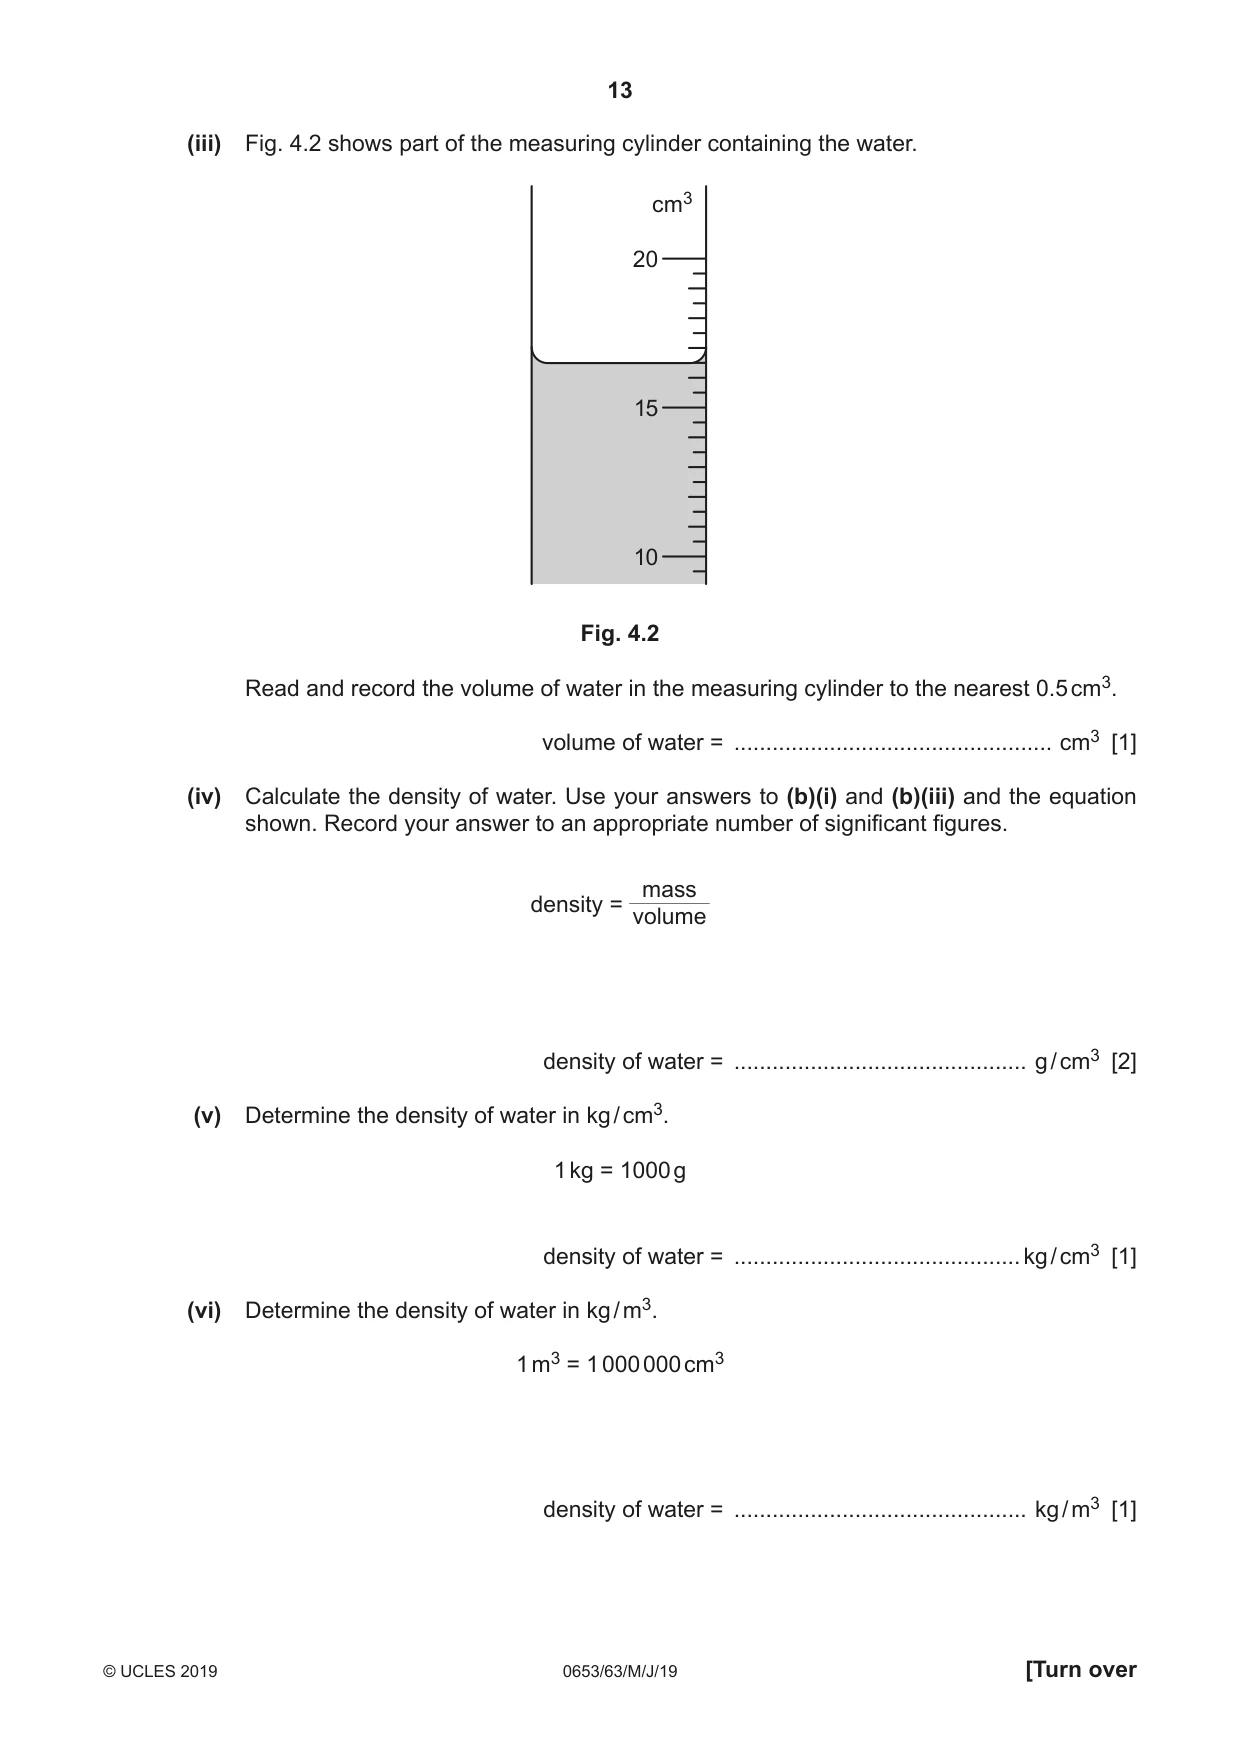
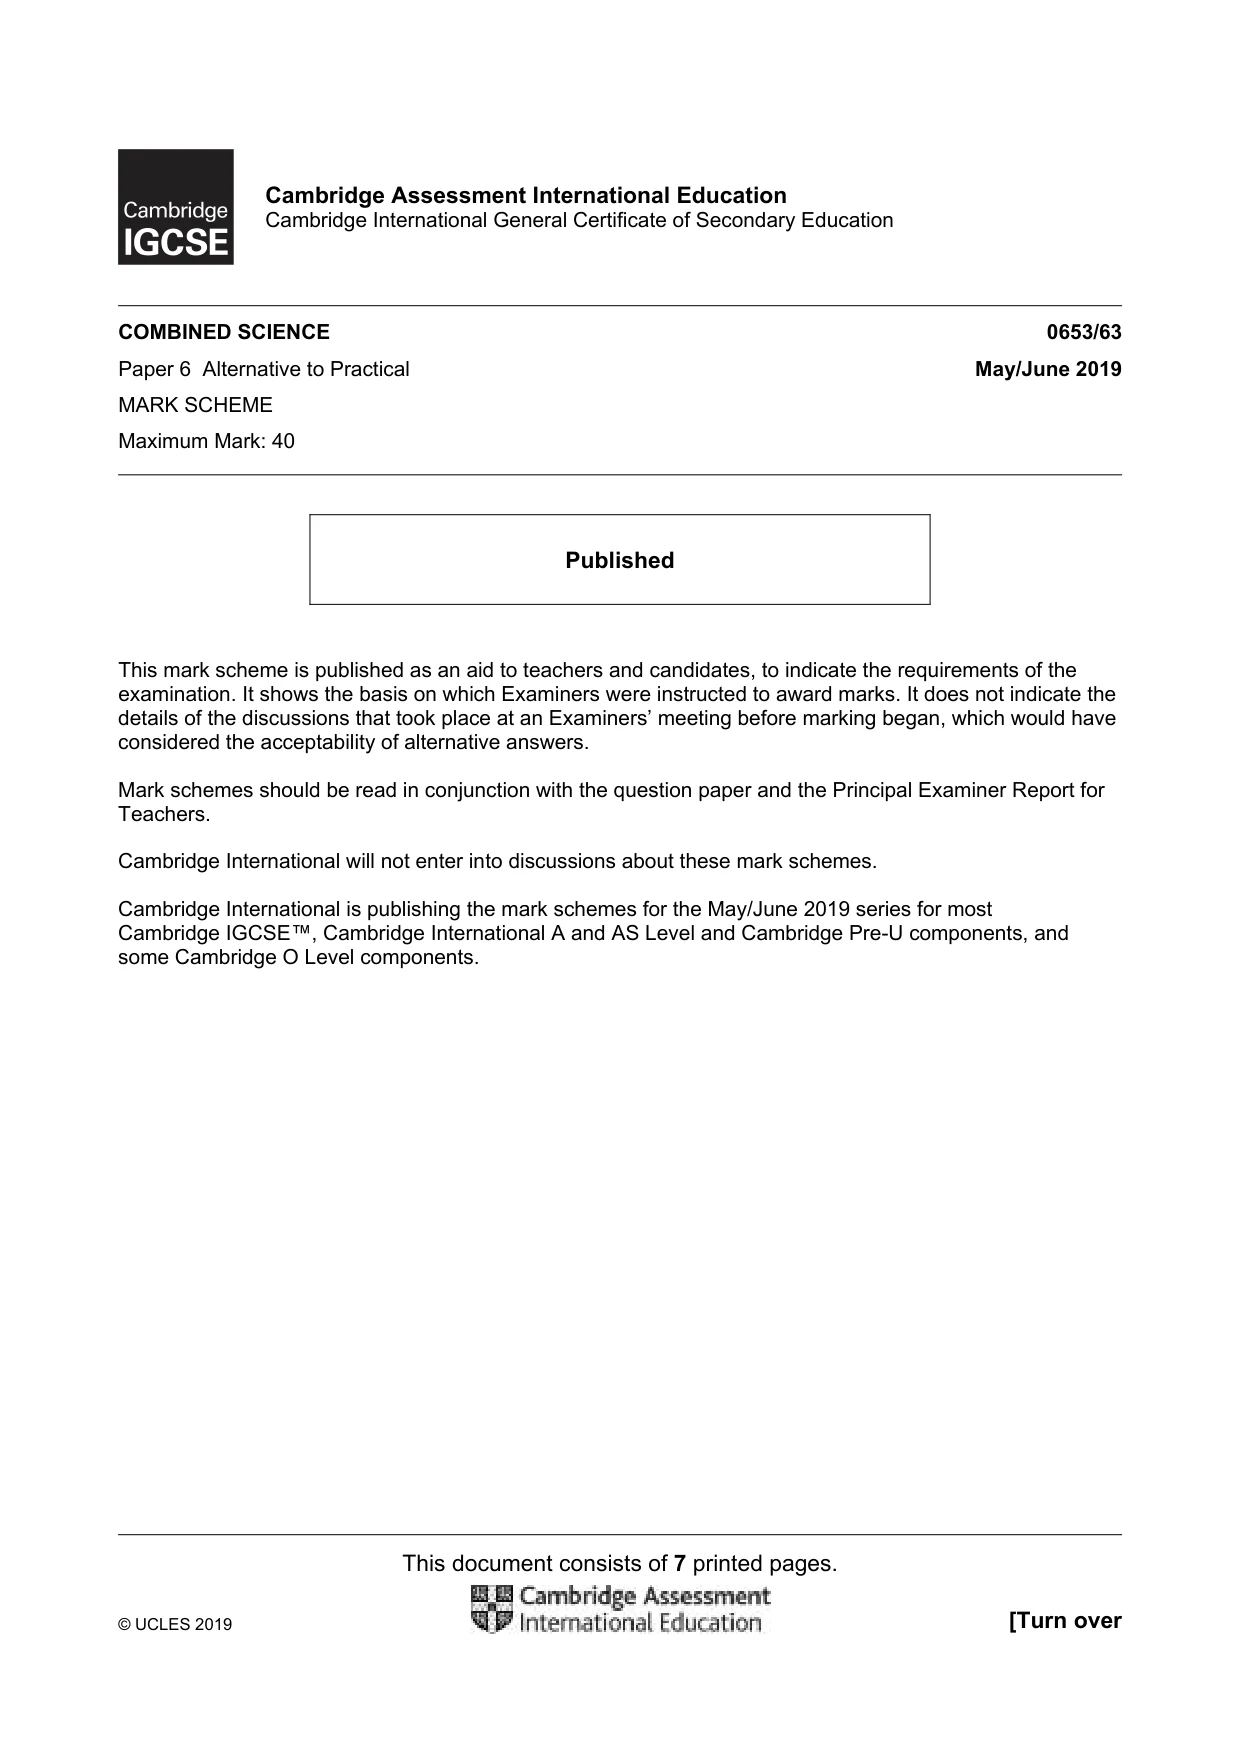
4 A student investigates the relationship between the speed of sound in different materials and the density of the materials. (a) Table 4.1 shows information about the properties of different materials. Table 4.1 speed of sound density solid, liquid or Is this material material in material kg / m3 gas? metallic? m / s air 1.204 343 gas no aluminium 2691 6320 solid yes copper 8960 4600 solid yes lead 11 340 1210 solid yes rubber 1100 60 solid no water 1484 liquid no (i) Name the material in which sound travels the slowest. ..................................................................................................................................... [1] (ii) Name the solid material with the lowest density. ..................................................................................................................................... [1] (iii) Use the information in Table 4.1 to place the metallic materials in order from lowest speed of sound to highest speed of sound. ............................................... metal in which speed of sound is lowest ............................................... ............................................... metal in which speed of sound is highest [1] (iv) Use information in Table 4.1 to describe the relationship between the speed of sound in metallic materials and the density of the metal. ........................................................................................................................................... ..................................................................................................................................... [1] (b) (i) The student does an experiment to find the density of pure water. • He pours some water into a measuring cylinder. • He measures the mass of the cylinder and water on a balance. • He empties out the water. • Then he measures the mass of the measuring cylinder on its own. Fig. 4.1 shows his readings on the balance. measuring cylinder measuring cylinder water 58.91 g 42.65 g Fig. 4.1 Use the readings to calculate the mass of water. Show your working. mass of water = ....................................................... g [2] (ii) Suggest a change to the experimental procedure carried out in (b)(i) that will improve the accuracy of the value of the mass of the measuring cylinder obtained by the student. ........................................................................................................................................... ..................................................................................................................................... [1] (iii) Fig. 4.2 shows part of the measuring cylinder containing the water. cm3 20 15 10 Fig. 4.2 Read and record the volume of water in the measuring cylinder to the nearest 0.5 cm3. volume of water = .................................................. cm3 [1] (iv) Calculate the density of water. Use your answers to (b)(i) and (b)(iii) and the equation shown. Record your answer to an appropriate number of significant figures. mass density = volume density of water = .............................................. g / cm3 [2] (v) Determine the density of water in kg / cm3. 1 kg = 1000 g density of water = ............................................. kg / cm3 [1] (vi) Determine the density of water in kg / m3. 1 m3 = 1 000 000 cm3 density of water = .............................................. kg / m3 [1]
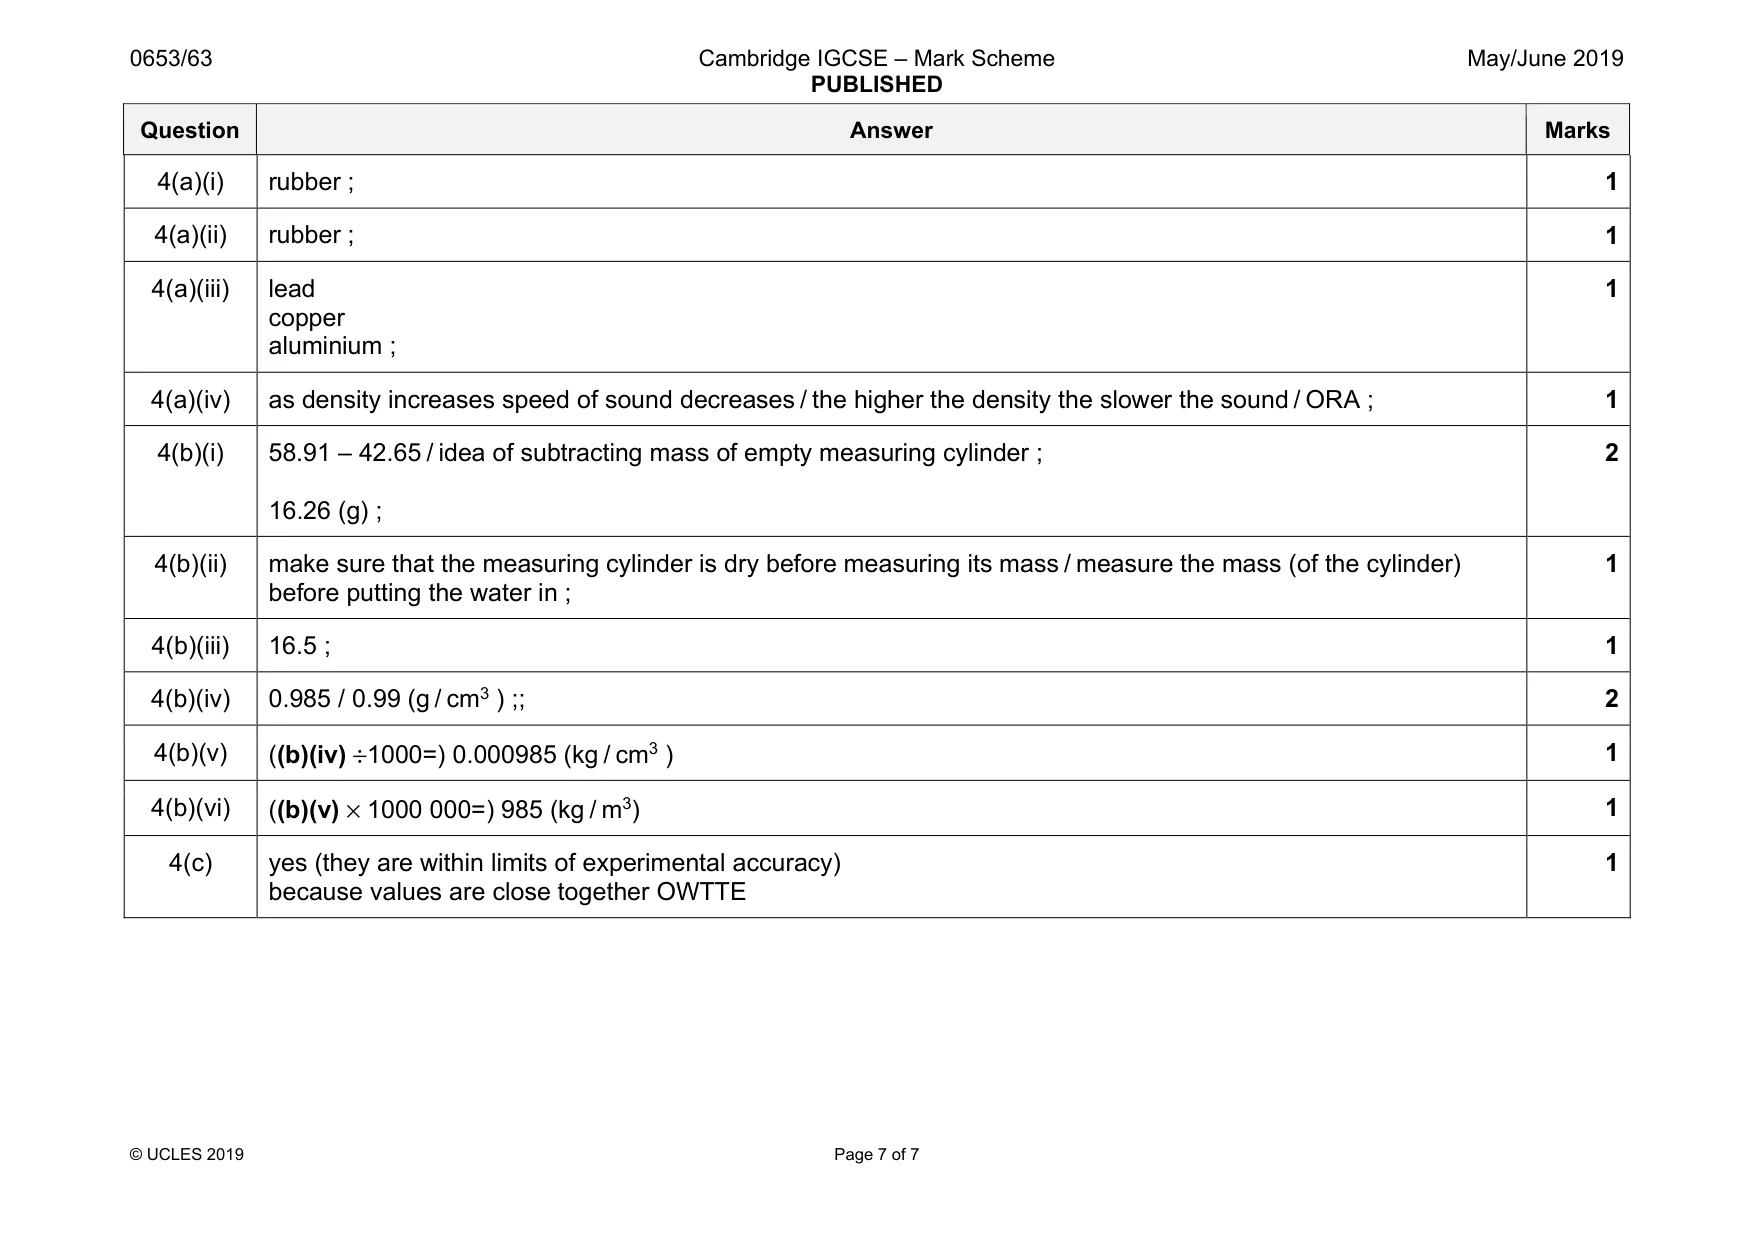
Mark scheme: 4(a)(i) rubber ; 1 4(a)(ii) rubber ; 1 4(a)(iii) lead copper aluminium ; 1 4(a)(iv) as density increases speed of sound decreases / the higher the density the slower the sound / ORA ; 1 4(b)(i) 58.91 – 42.65 / idea of subtracting mass of empty measuring cylinder ; 16.26 (g) ; 2 4(b)(ii) make sure that the measuring cylinder is dry before measuring its mass / measure the mass (of the cylinder) before putting the water in ; 1 4(b)(iii) 16.5 ; 1 4(b)(iv) 0.985 / 0.99 (g / cm3 ) ;; 2 4(b)(v) ((b)(iv) ÷1000=) 0.000985 (kg / cm3 ) 1 4(b)(vi) ((b)(v) × 1000 000=) 985 (kg / m3) 1 4(c) yes (they are within limits of experimental accuracy) because values are close together OWTTE 1
What was in this paper
The subtopics covered by these 4 questions, and how many questions each got. Open one in a new tab to see every Cambridge question on it.
What you needed in this session
Cambridge’s own grade thresholds for 2019 May/June, Paper 6 · Variant 3. A higher threshold means an easier paper — the bar moves with how the cohort did.