Cambridge IGCSE Science - Combined 0653 — 2019 May/June Paper 6 · Variant 2
0653/62/M/J/19 · 4 questions · 40 marks · ≈45 min
The question paper and its mark scheme, free to read here and free to download. This is Cambridge’s own paper, exactly as it was sat.
Question paper12 pages

Mark scheme7 pages
Answers below. Sit the paper first if you are practising.
Questions as text
Q1 · A student investigates the effects of the enzyme pectinase on fruit
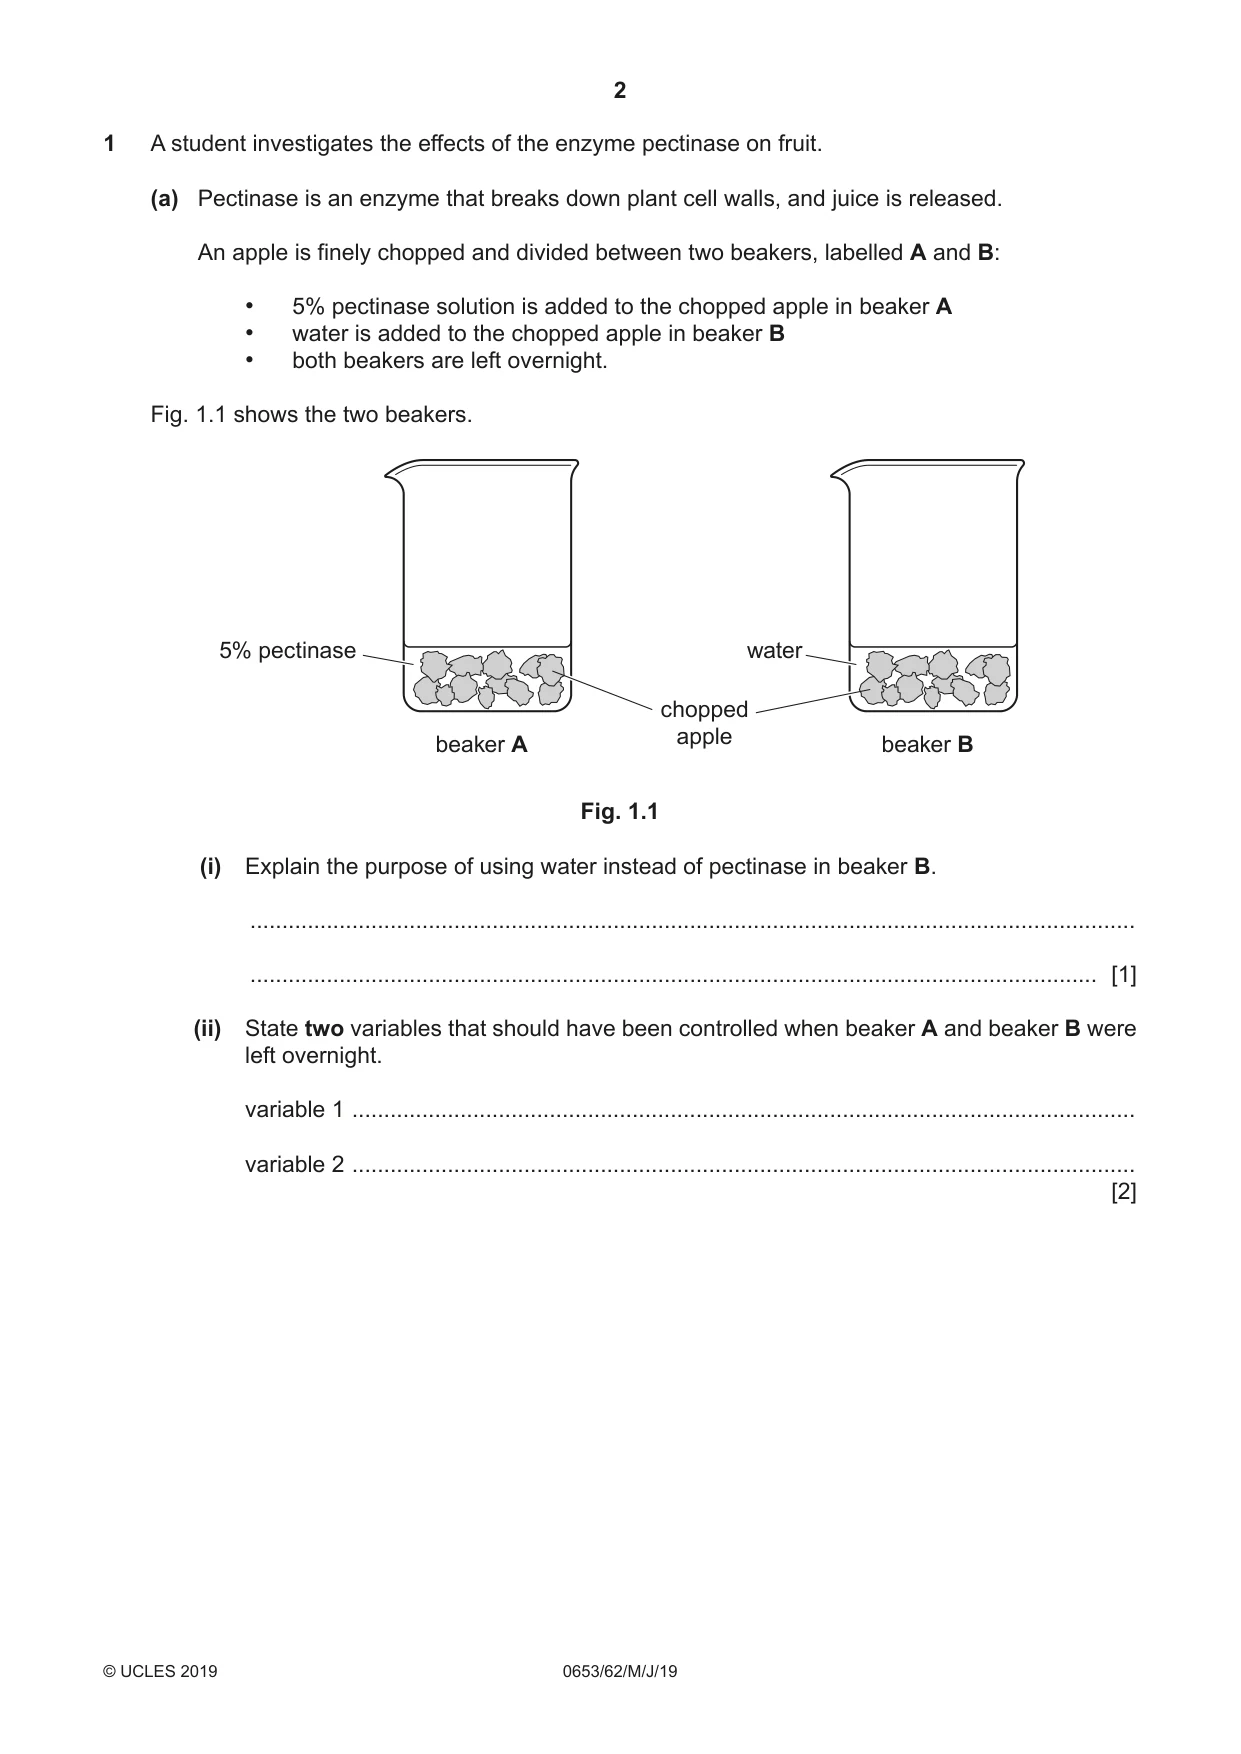
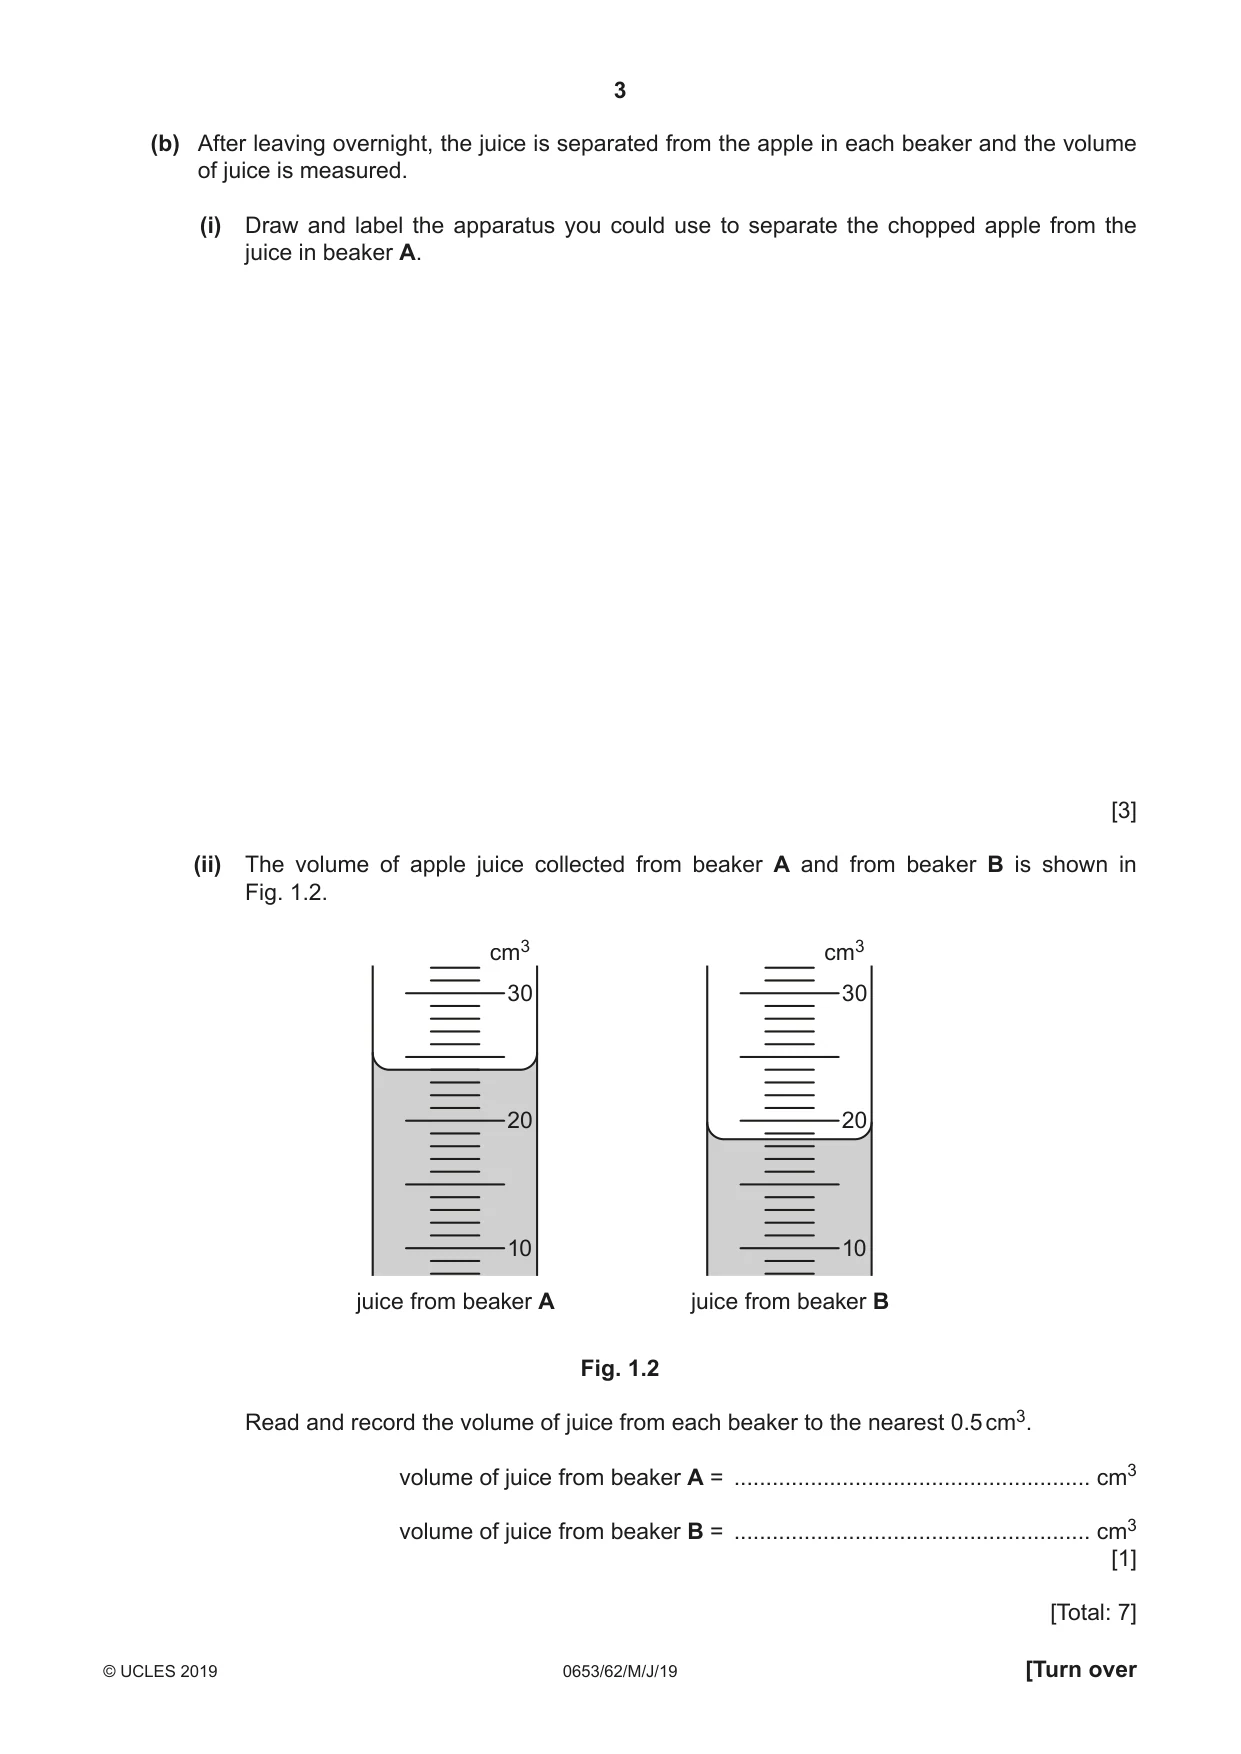
1 A student investigates the effects of the enzyme pectinase on fruit. (a) Pectinase is an enzyme that breaks down plant cell walls, and juice is released. An apple is finely chopped and divided between two beakers, labelled A and B: • 5% pectinase solution is added to the chopped apple in beaker A • water is added to the chopped apple in beaker B • both beakers are left overnight. Fig. 1.1 shows the two beakers. 5% pectinase water chopped apple beaker A beaker B Fig. 1.1 (i) Explain the purpose of using water instead of pectinase in beaker B. ........................................................................................................................................... ..................................................................................................................................... [1] (ii) State two variables that should have been controlled when beaker A and beaker B were left overnight. variable 1 ........................................................................................................................... variable 2 ........................................................................................................................... [2] (b) After leaving overnight, the juice is separated from the apple in each beaker and the volume of juice is measured. (i) Draw and label the apparatus you could use to separate the chopped apple from the juice in beaker A. [3] (ii) The volume of apple juice collected from beaker A and from beaker B is shown in Fig. 1.2. cm3 cm3 30 30 20 20 10 10 juice from beaker A juice from beaker B Fig. 1.2 Read and record the volume of juice from each beaker to the nearest 0.5 cm3. volume of juice from beaker A = ........................................................ cm3 volume of juice from beaker B = ........................................................ cm3 [1] [Total: 7]
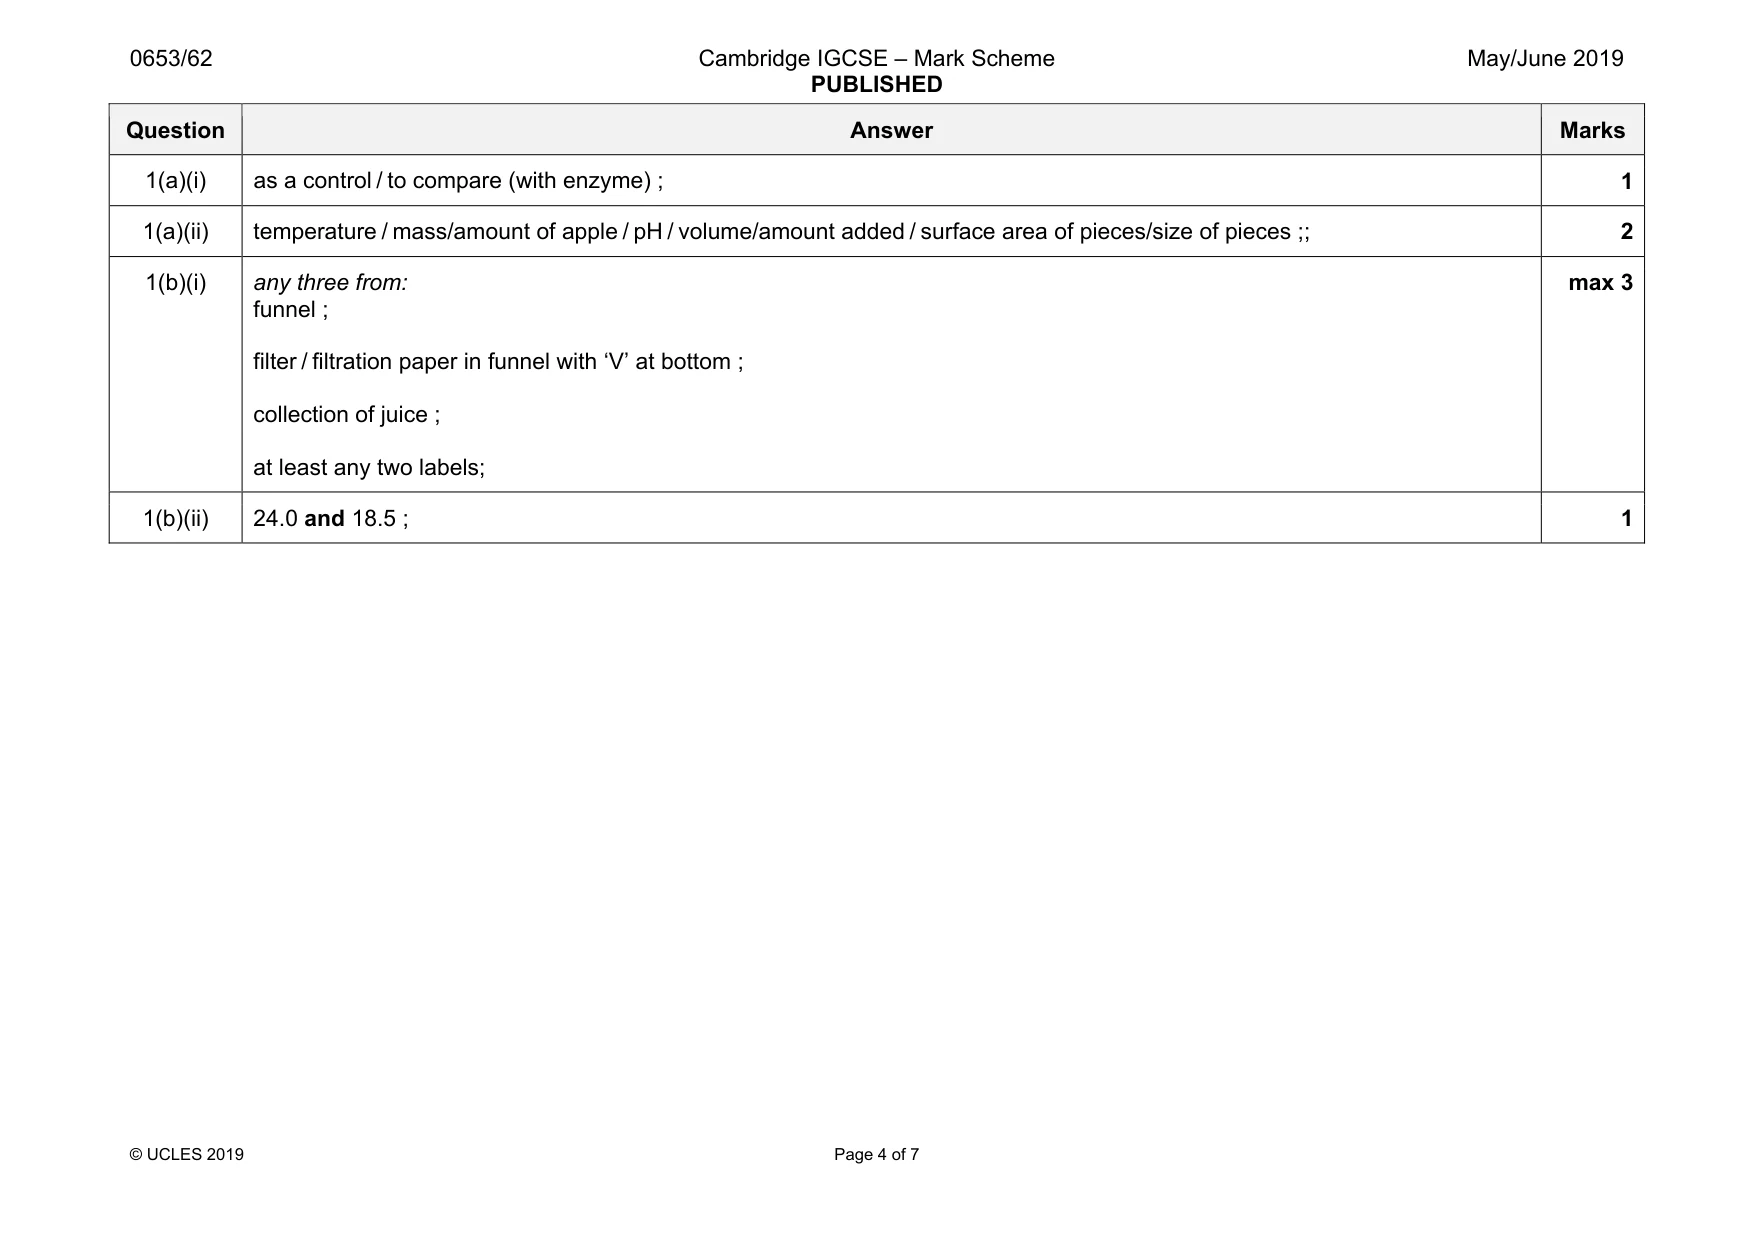
Mark scheme: 1(a)(i) as a control / to compare (with enzyme) ; 1 1(a)(ii) temperature / mass/amount of apple / pH / volume/amount added / surface area of pieces/size of pieces ;; 2 1(b)(i) any three from: funnel ; filter / filtration paper in funnel with ‘V’ at bottom ; collection of juice ; at least any two labels; max 3 1(b)(ii) 24.0 and 18.5 ; 1
Q2 · A plant loses water from its leaves through transpiration
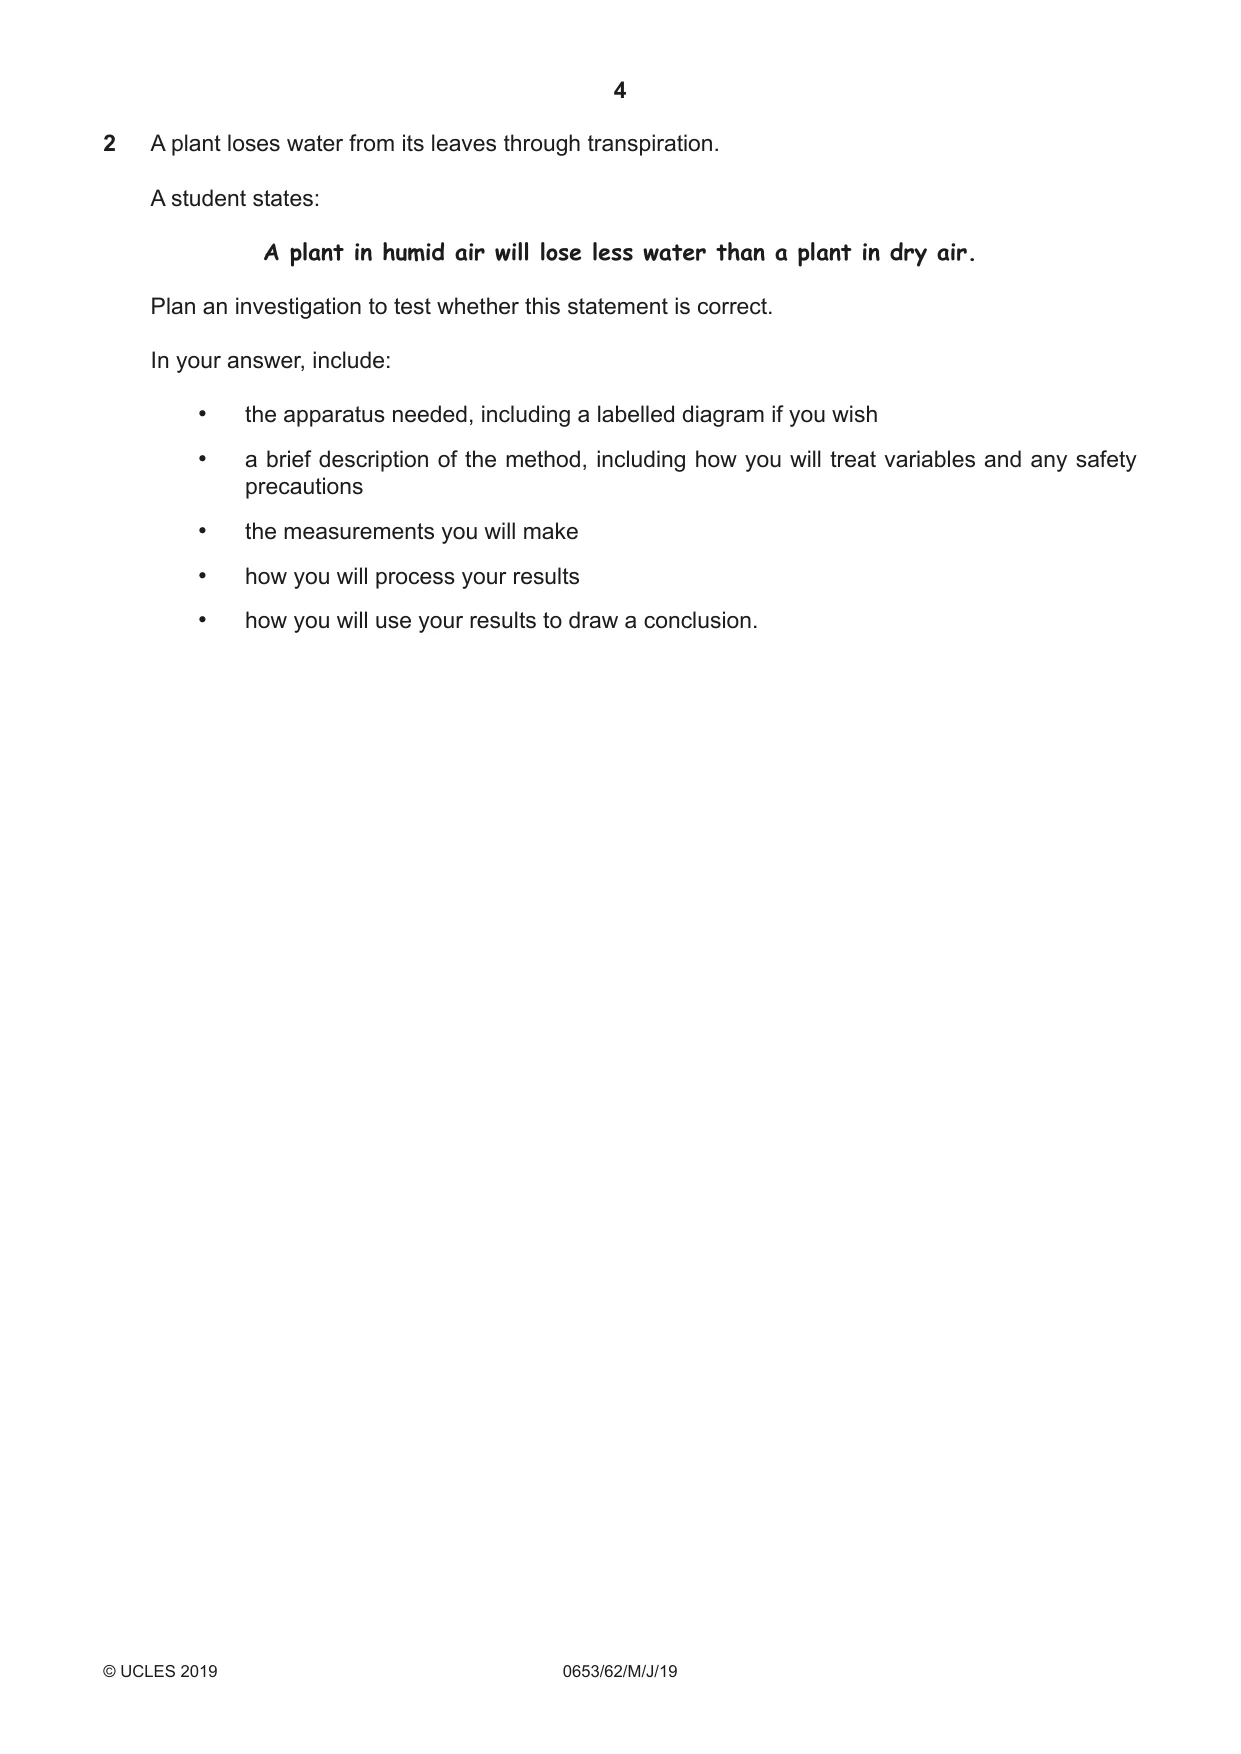
2 A plant loses water from its leaves through transpiration. A student states: A plant in humid air will lose less water than a plant in dry air. Plan an investigation to test whether this statement is correct. In your answer, include: • the apparatus needed, including a labelled diagram if you wish • a brief description of the method, including how you will treat variables and any safety precautions • the measurements you will make • how you will process your results • how you will use your results to draw a conclusion. ................................................................................................................................................... ................................................................................................................................................... ................................................................................................................................................... ................................................................................................................................................... ................................................................................................................................................... ................................................................................................................................................... ................................................................................................................................................... ................................................................................................................................................... ................................................................................................................................................... ................................................................................................................................................... ................................................................................................................................................... ............................................................................................................................................. [7]
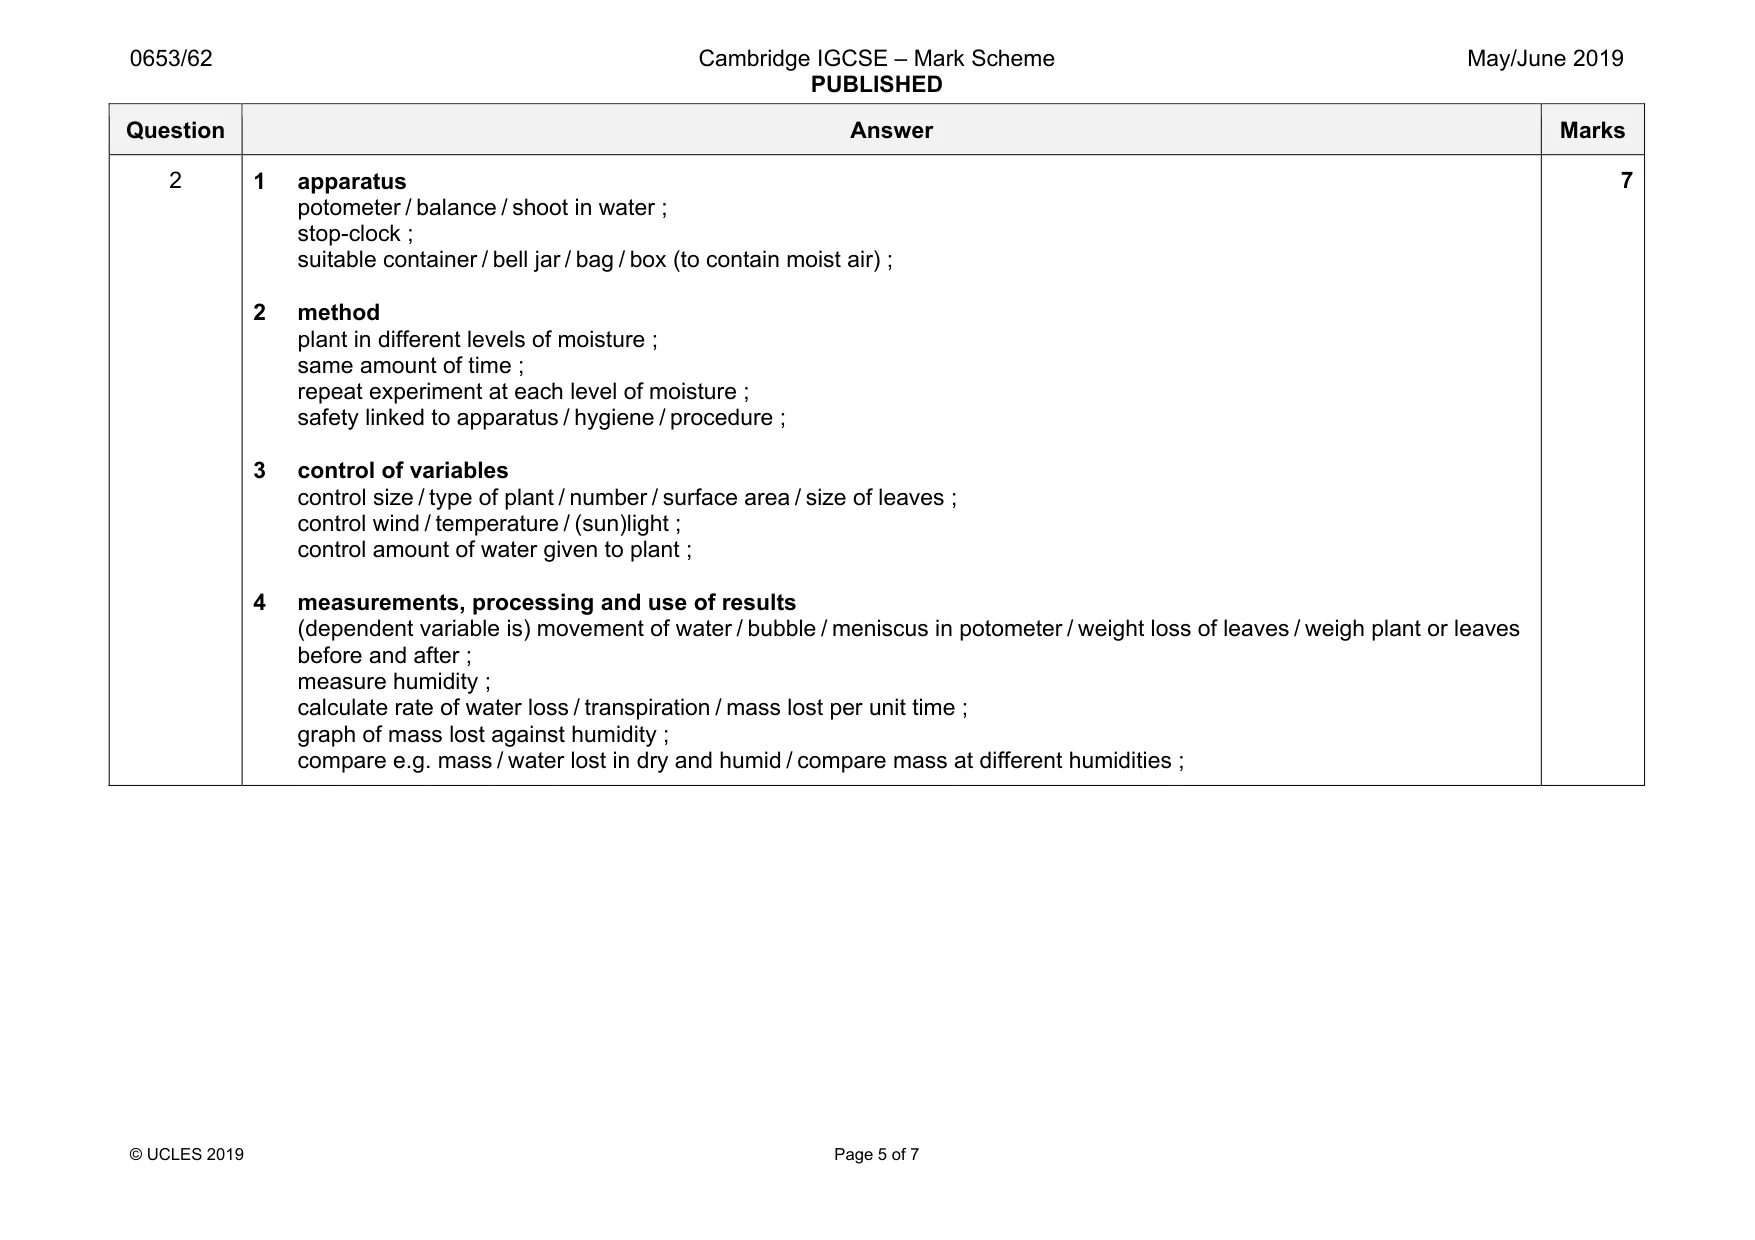
Mark scheme: 2 1 apparatus potometer / balance / shoot in water ; stop-clock ; suitable container / bell jar / bag / box (to contain moist air) ; 2 method plant in different levels of moisture ; same amount of time ; repeat experiment at each level of moisture ; safety linked to apparatus / hygiene / procedure ; 3 control of variables control size / type of plant / number / surface area / size of leaves ; control wind / temperature / (sun)light ; control amount of water given to plant ; 4 measurements, processing and use of results (dependent variable is) movement of water / bubble / meniscus in potometer / weight loss of leaves / weigh plant or leaves before and after ; measure humidity ; calculate rate of water loss / transpiration / mass lost per unit time ; graph of mass lost against humidity ; compare e.g. mass / water lost in dry and humid / compare mass at different humidities ; 7
Q3 · A student investigates the amount of precipitate formed when barium nitrate solution and…
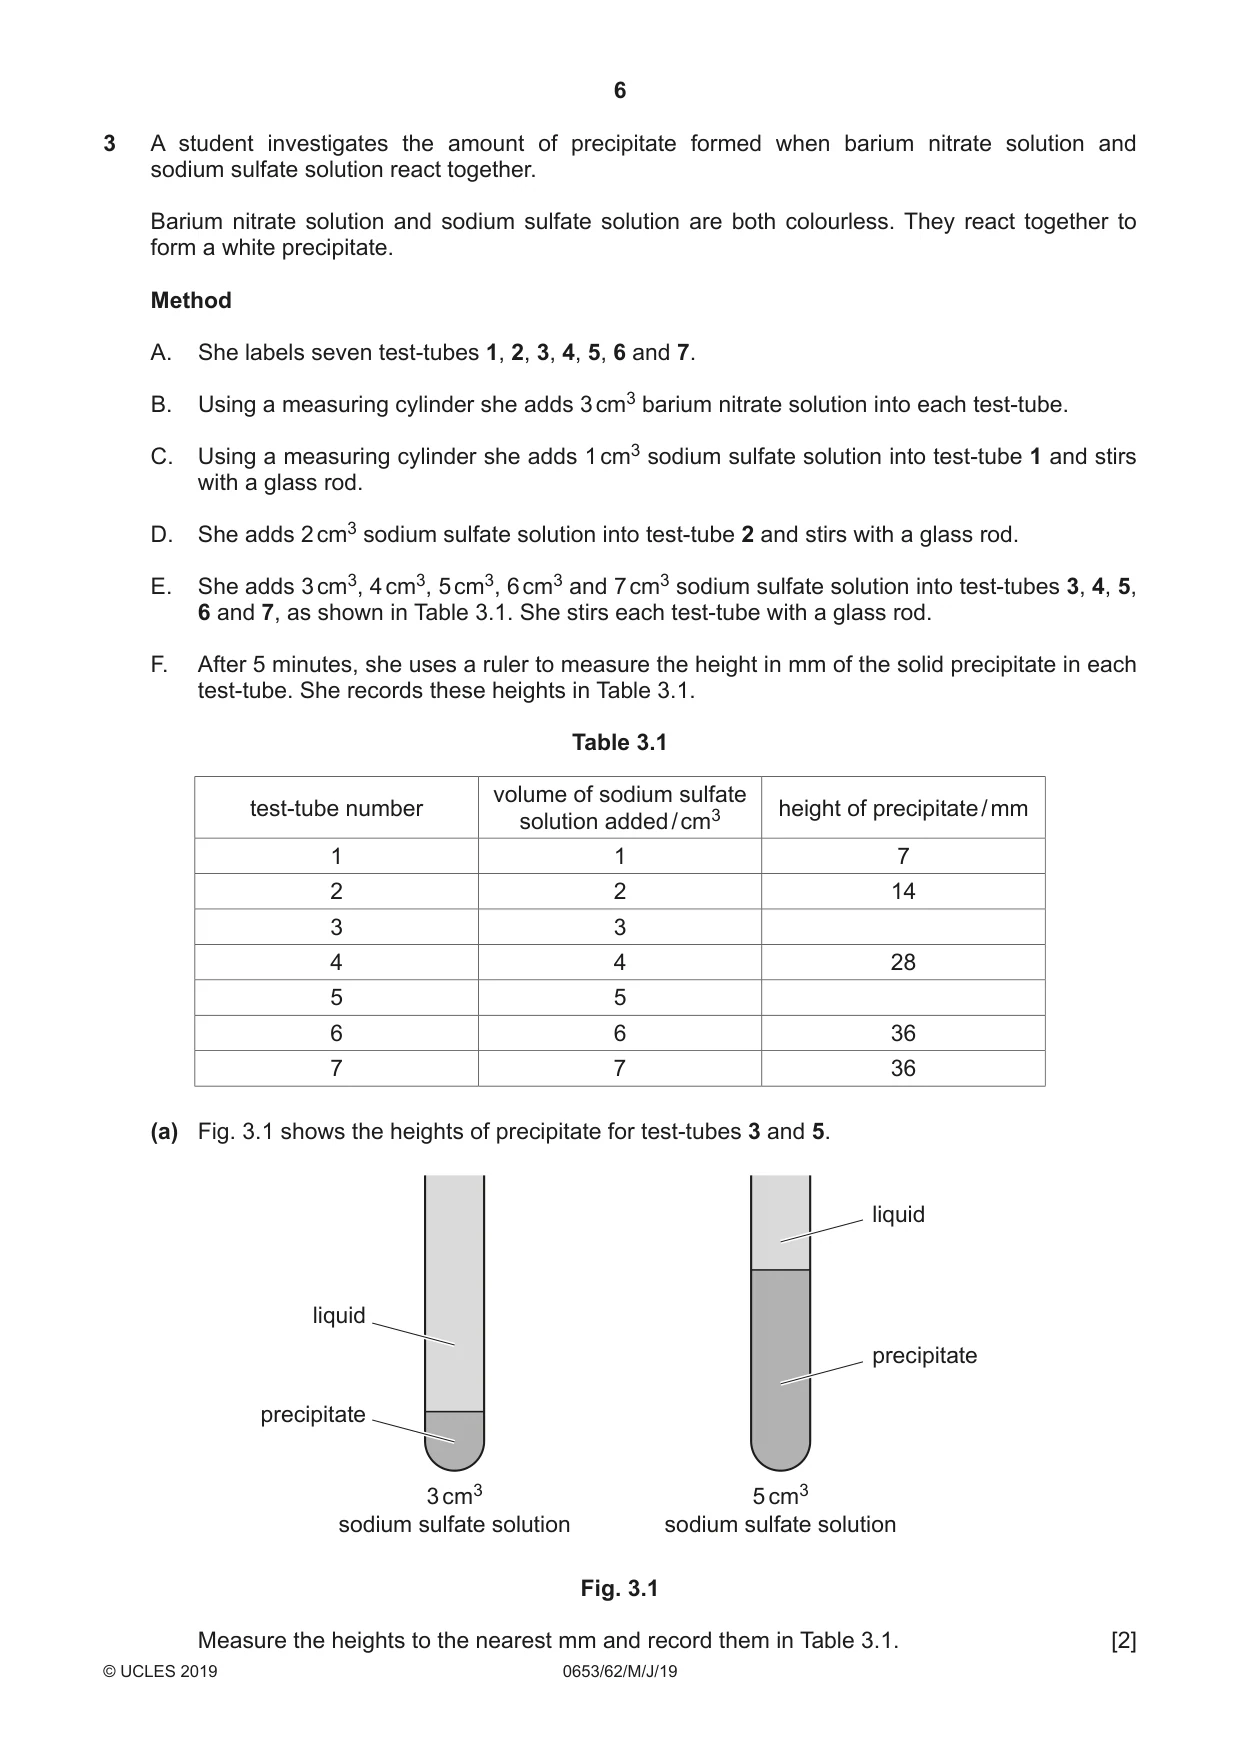
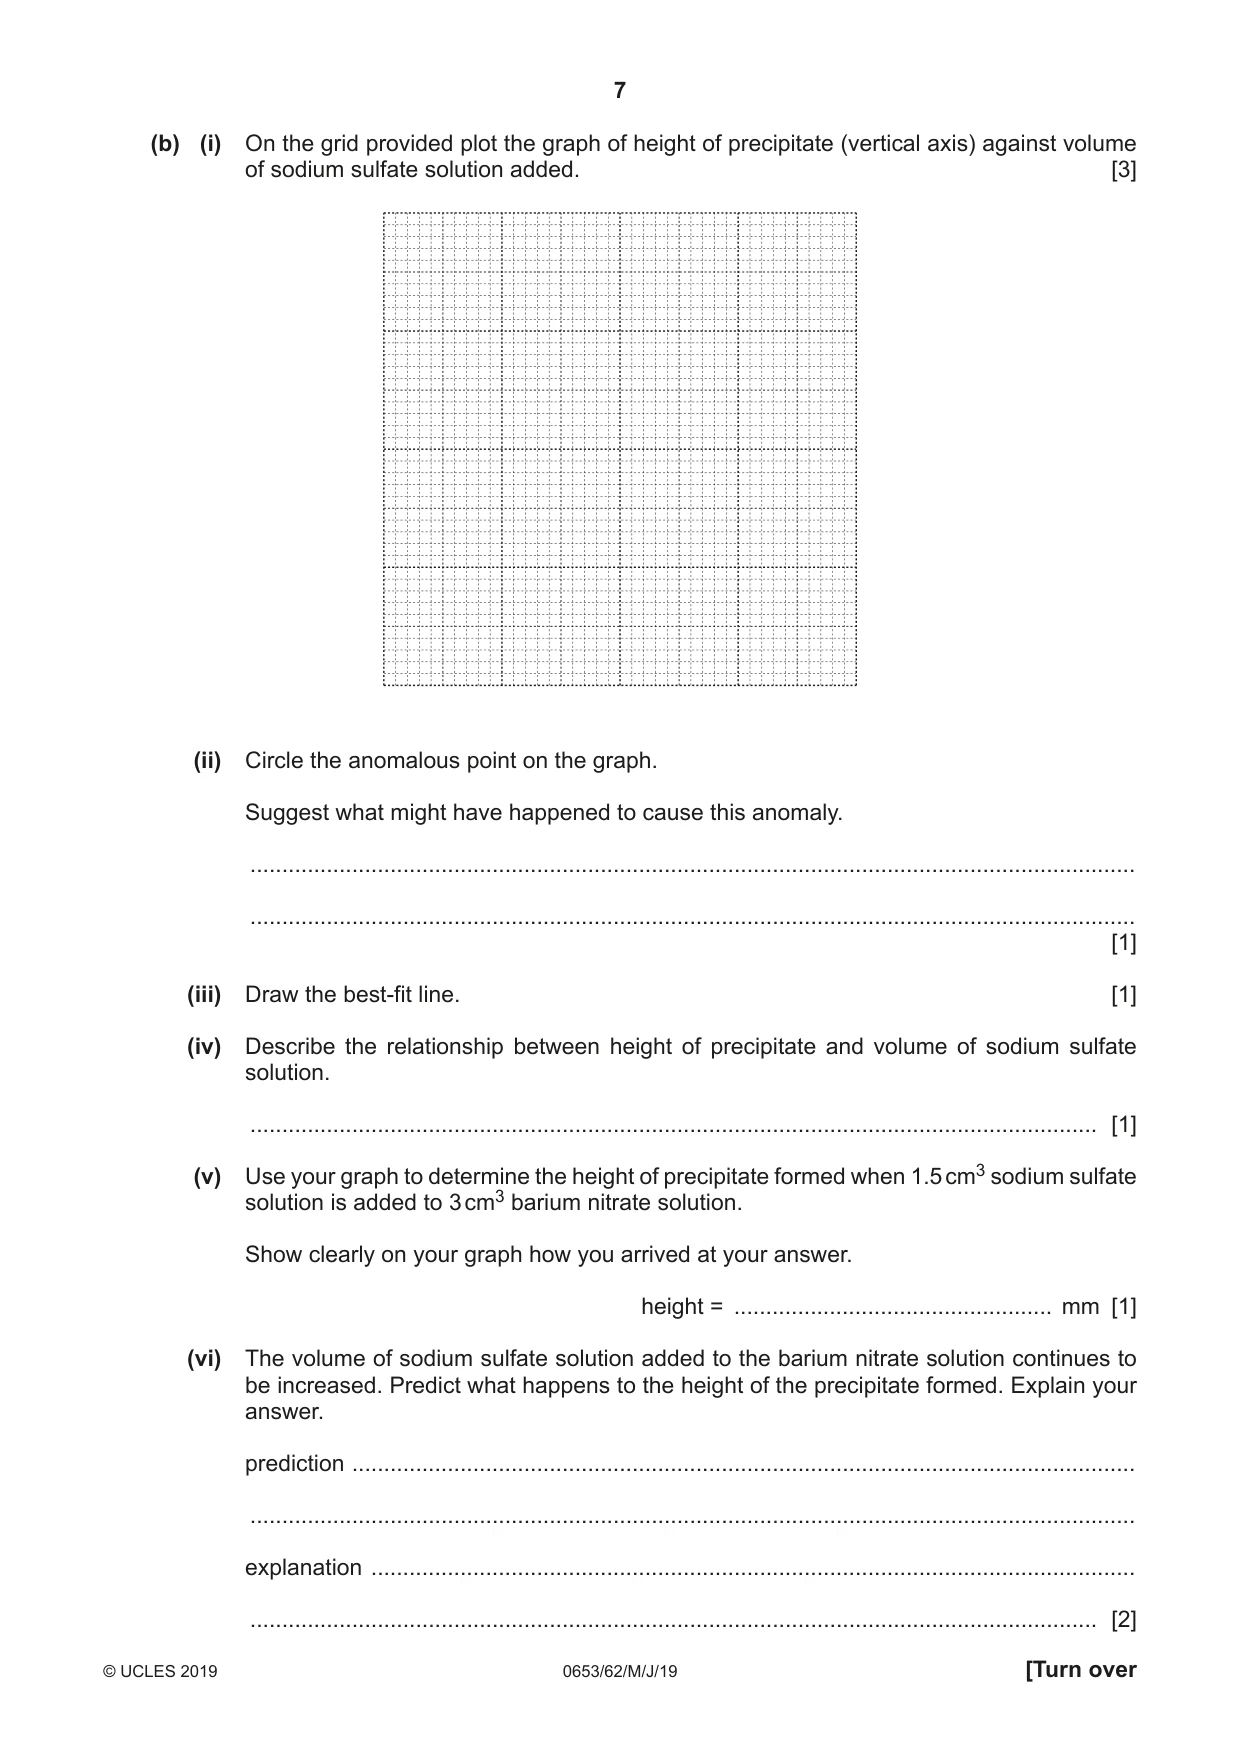
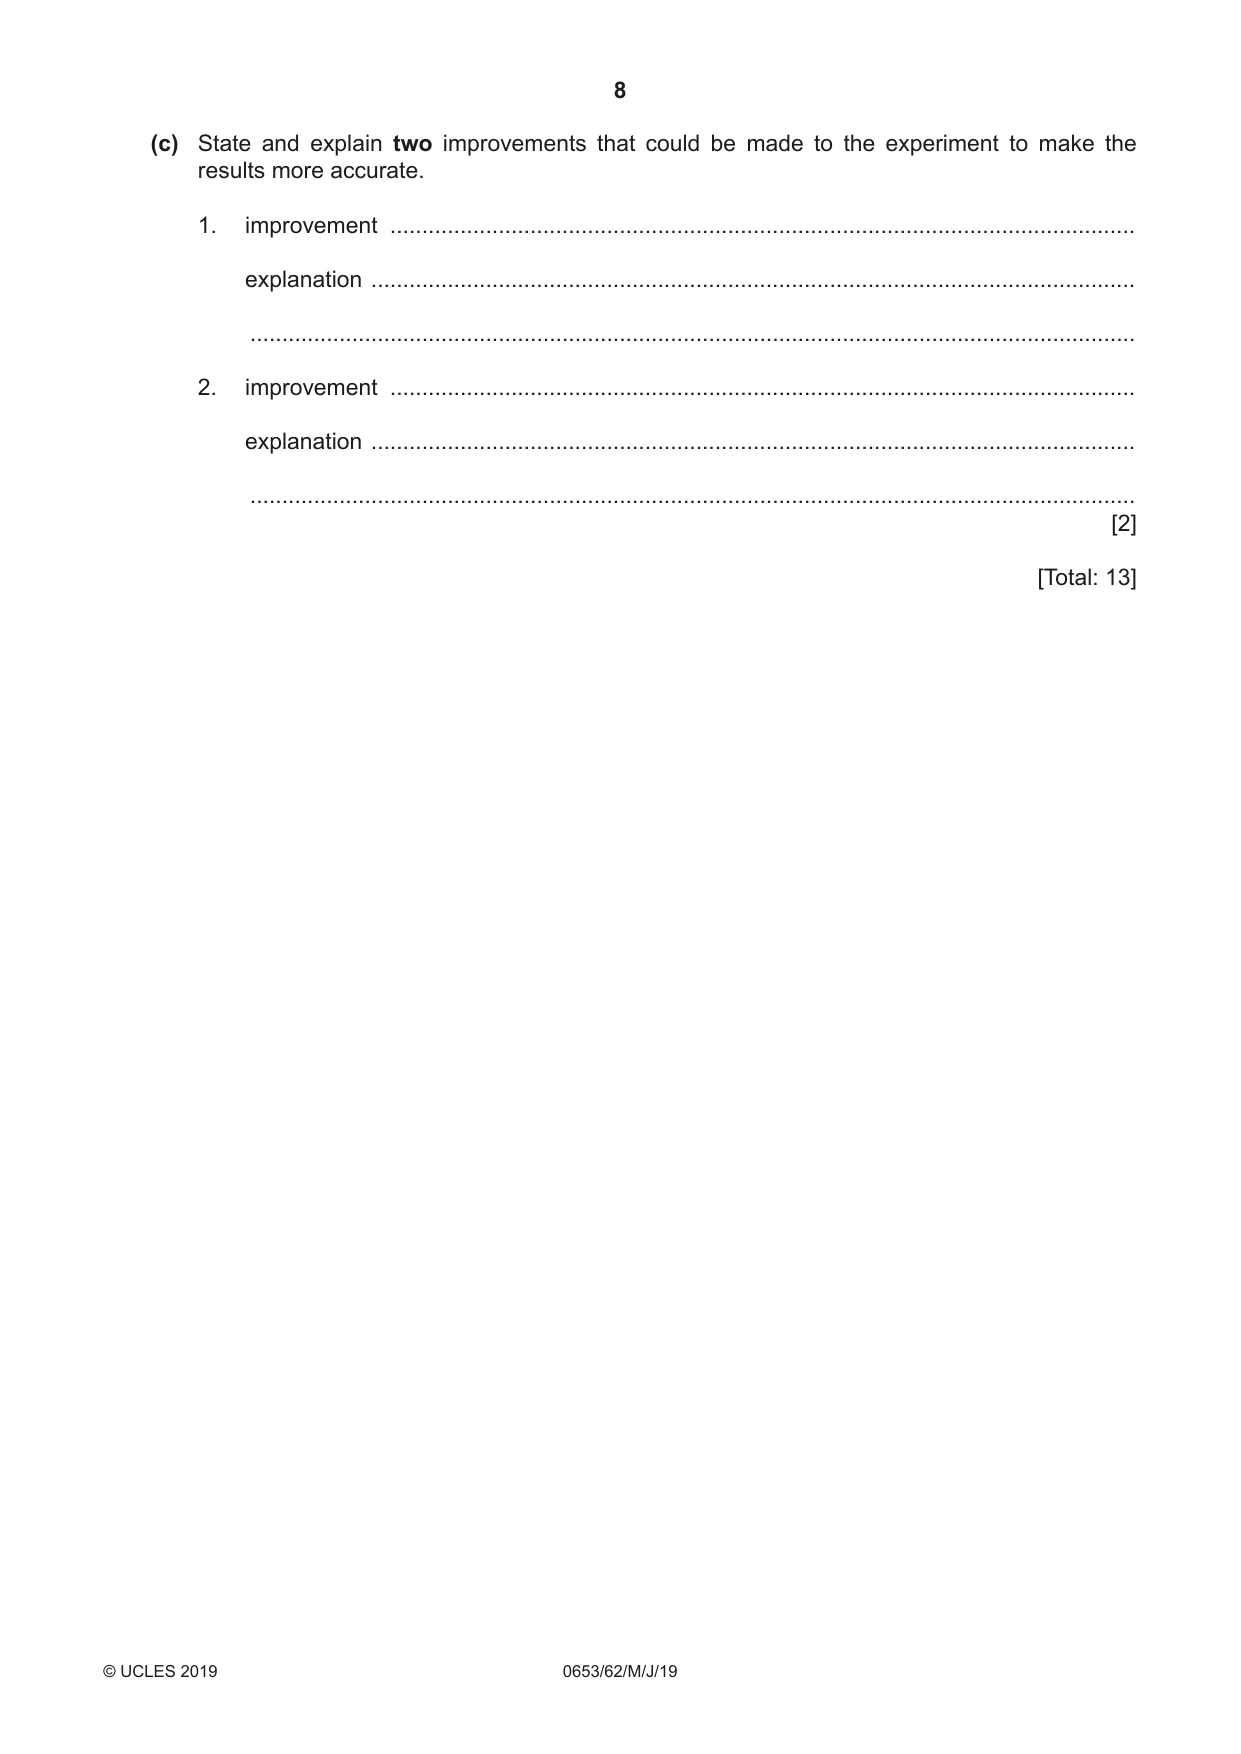
3 A student investigates the amount of precipitate formed when barium nitrate solution and sodium sulfate solution react together. Barium nitrate solution and sodium sulfate solution are both colourless. They react together to form a white precipitate. Method A. She labels seven test-tubes 1, 2, 3, 4, 5, 6 and 7. B. Using a measuring cylinder she adds 3 cm3 barium nitrate solution into each test-tube. C. Using a measuring cylinder she adds 1 cm3 sodium sulfate solution into test-tube 1 and stirs with a glass rod. D. She adds 2 cm3 sodium sulfate solution into test-tube 2 and stirs with a glass rod. E. She adds 3 cm3, 4 cm3, 5 cm3, 6 cm3 and 7 cm3 sodium sulfate solution into test-tubes 3, 4, 5, 6 and 7, as shown in Table 3.1. She stirs each test-tube with a glass rod. F. After 5 minutes, she uses a ruler to measure the height in mm of the solid precipitate in each test-tube. She records these heights in Table 3.1. Table 3.1 volume of sodium sulfate test-tube number height of precipitate / mm solution added / cm3 1 1 7 2 2 14 3 3 4 4 28 5 5 6 6 36 7 7 36 (a) Fig. 3.1 shows the heights of precipitate for test-tubes 3 and 5. liquid liquid precipitate precipitate 3 cm3 5 cm3 sodium sulfate solution sodium sulfate solution Fig. 3.1 Measure the heights to the nearest mm and record them in Table 3.1. [2] (b) (i) On the grid provided plot the graph of height of precipitate (vertical axis) against volume of sodium sulfate solution added. [3] (ii) Circle the anomalous point on the graph. Suggest what might have happened to cause this anomaly. ........................................................................................................................................... ........................................................................................................................................... [1] (iii) Draw the best-fit line. [1] (iv) Describe the relationship between height of precipitate and volume of sodium sulfate solution. ..................................................................................................................................... [1] (v) Use your graph to determine the height of precipitate formed when 1.5 cm3 sodium sulfate solution is added to 3 cm3 barium nitrate solution. Show clearly on your graph how you arrived at your answer. height = .................................................. mm [1] (vi) The volume of sodium sulfate solution added to the barium nitrate solution continues to be increased. Predict what happens to the height of the precipitate formed. Explain your answer. prediction ........................................................................................................................... ........................................................................................................................................... explanation ........................................................................................................................ ..................................................................................................................................... [2] (c) State and explain two improvements that could be made to the experiment to make the results more accurate. 1. improvement ..................................................................................................................... explanation ........................................................................................................................ ........................................................................................................................................... 2. improvement ..................................................................................................................... explanation ........................................................................................................................ ........................................................................................................................................... [2] [Total: 13]
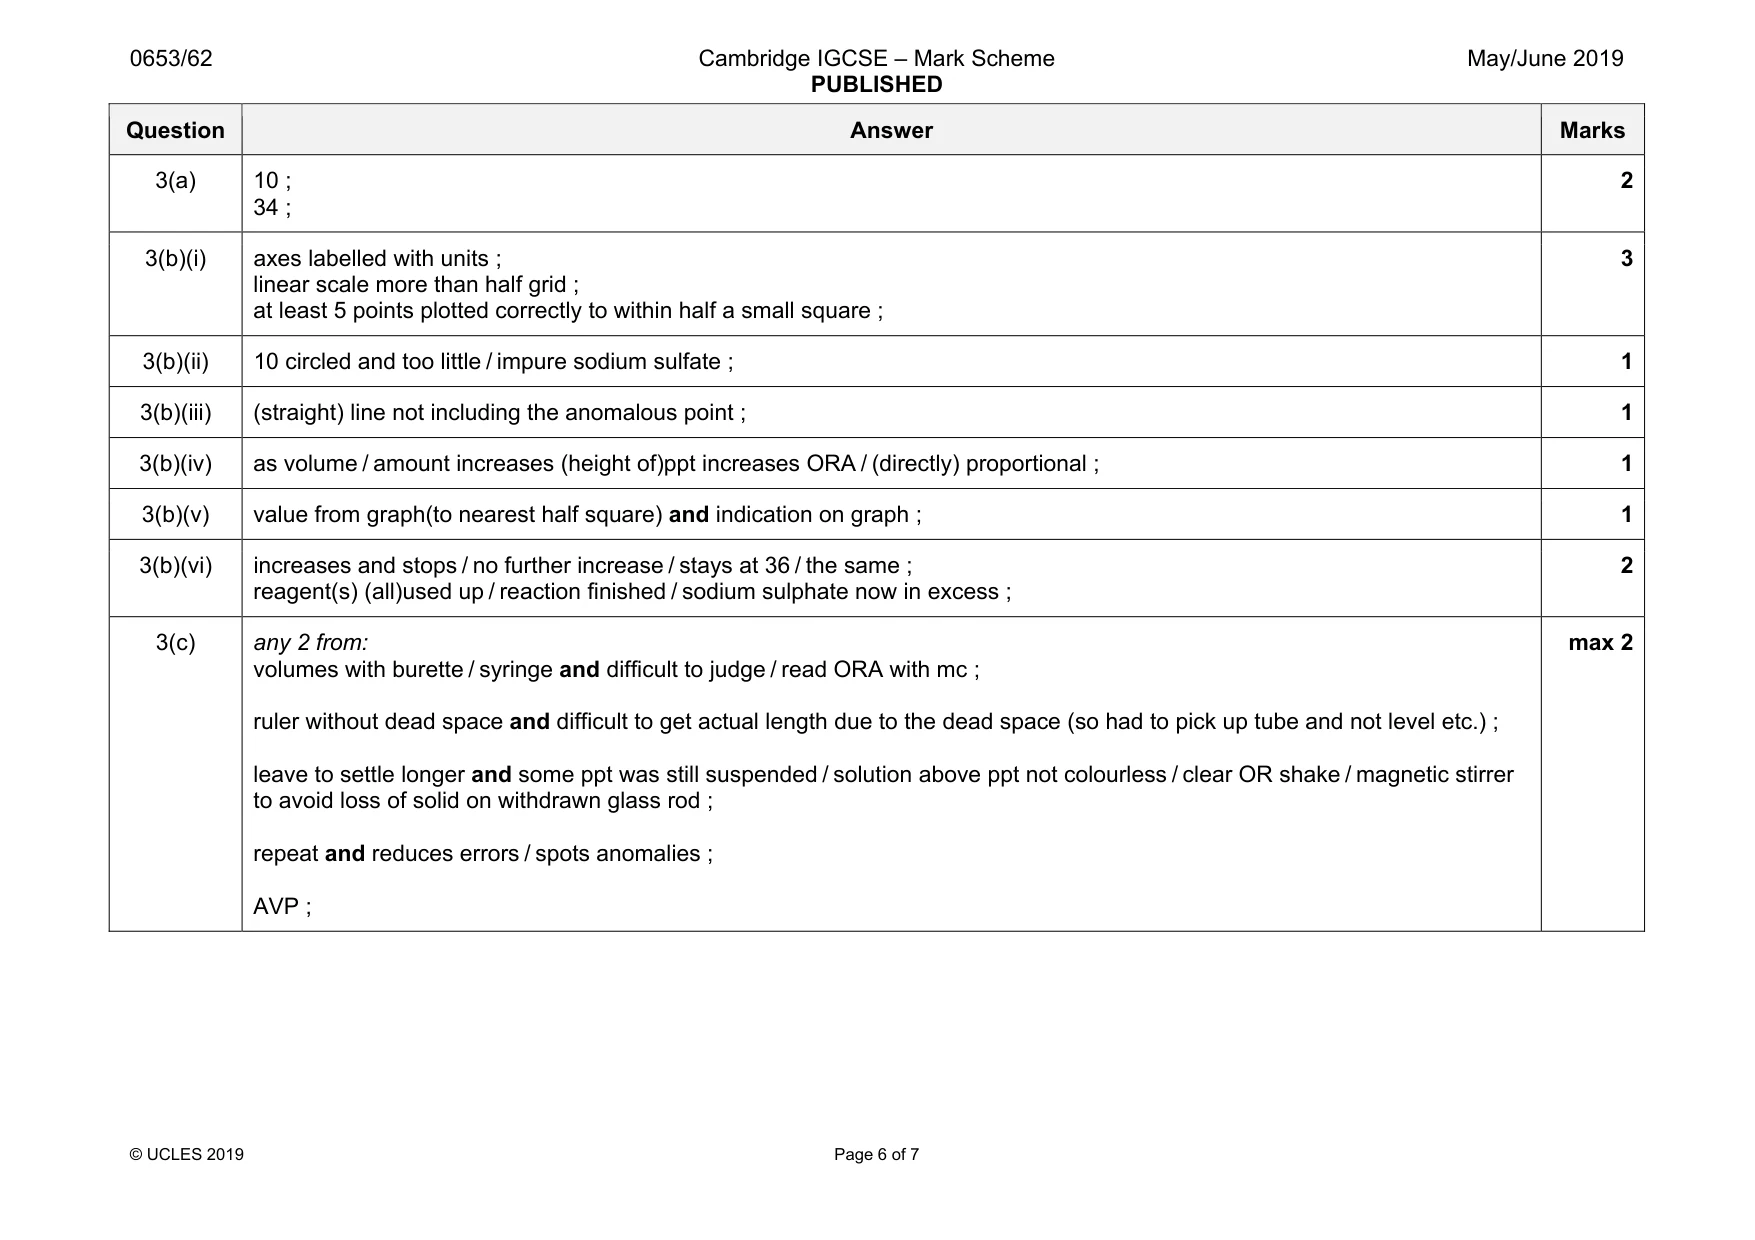
Mark scheme: 3(a) 10 ; 34 ; 2 3(b)(i) axes labelled with units ; linear scale more than half grid ; at least 5 points plotted correctly to within half a small square ; 3 3(b)(ii) 10 circled and too little / impure sodium sulfate ; 1 3(b)(iii) (straight) line not including the anomalous point ; 1 3(b)(iv) as volume / amount increases (height of)ppt increases ORA / (directly) proportional ; 1 3(b)(v) value from graph(to nearest half square) and indication on graph ; 1 3(b)(vi) increases and stops / no further increase / stays at 36 / the same ; reagent(s) (all)used up / reaction finished / sodium sulphate now in excess ; 2 3(c) any 2 from: volumes with burette / syringe and difficult to judge / read ORA with mc ; ruler without dead space and difficult to get actual length due to the dead space (so had to pick up tube and not level etc.) ; leave to settle longer and some ppt was still suspended / solution above ppt not colourless / clear OR shake / magnetic stirrer to avoid loss of solid on withdrawn glass rod ; repeat and reduces errors / spots anomalies ; AVP ; max 2
Q4 · A student investigates ice melting in a beaker of water
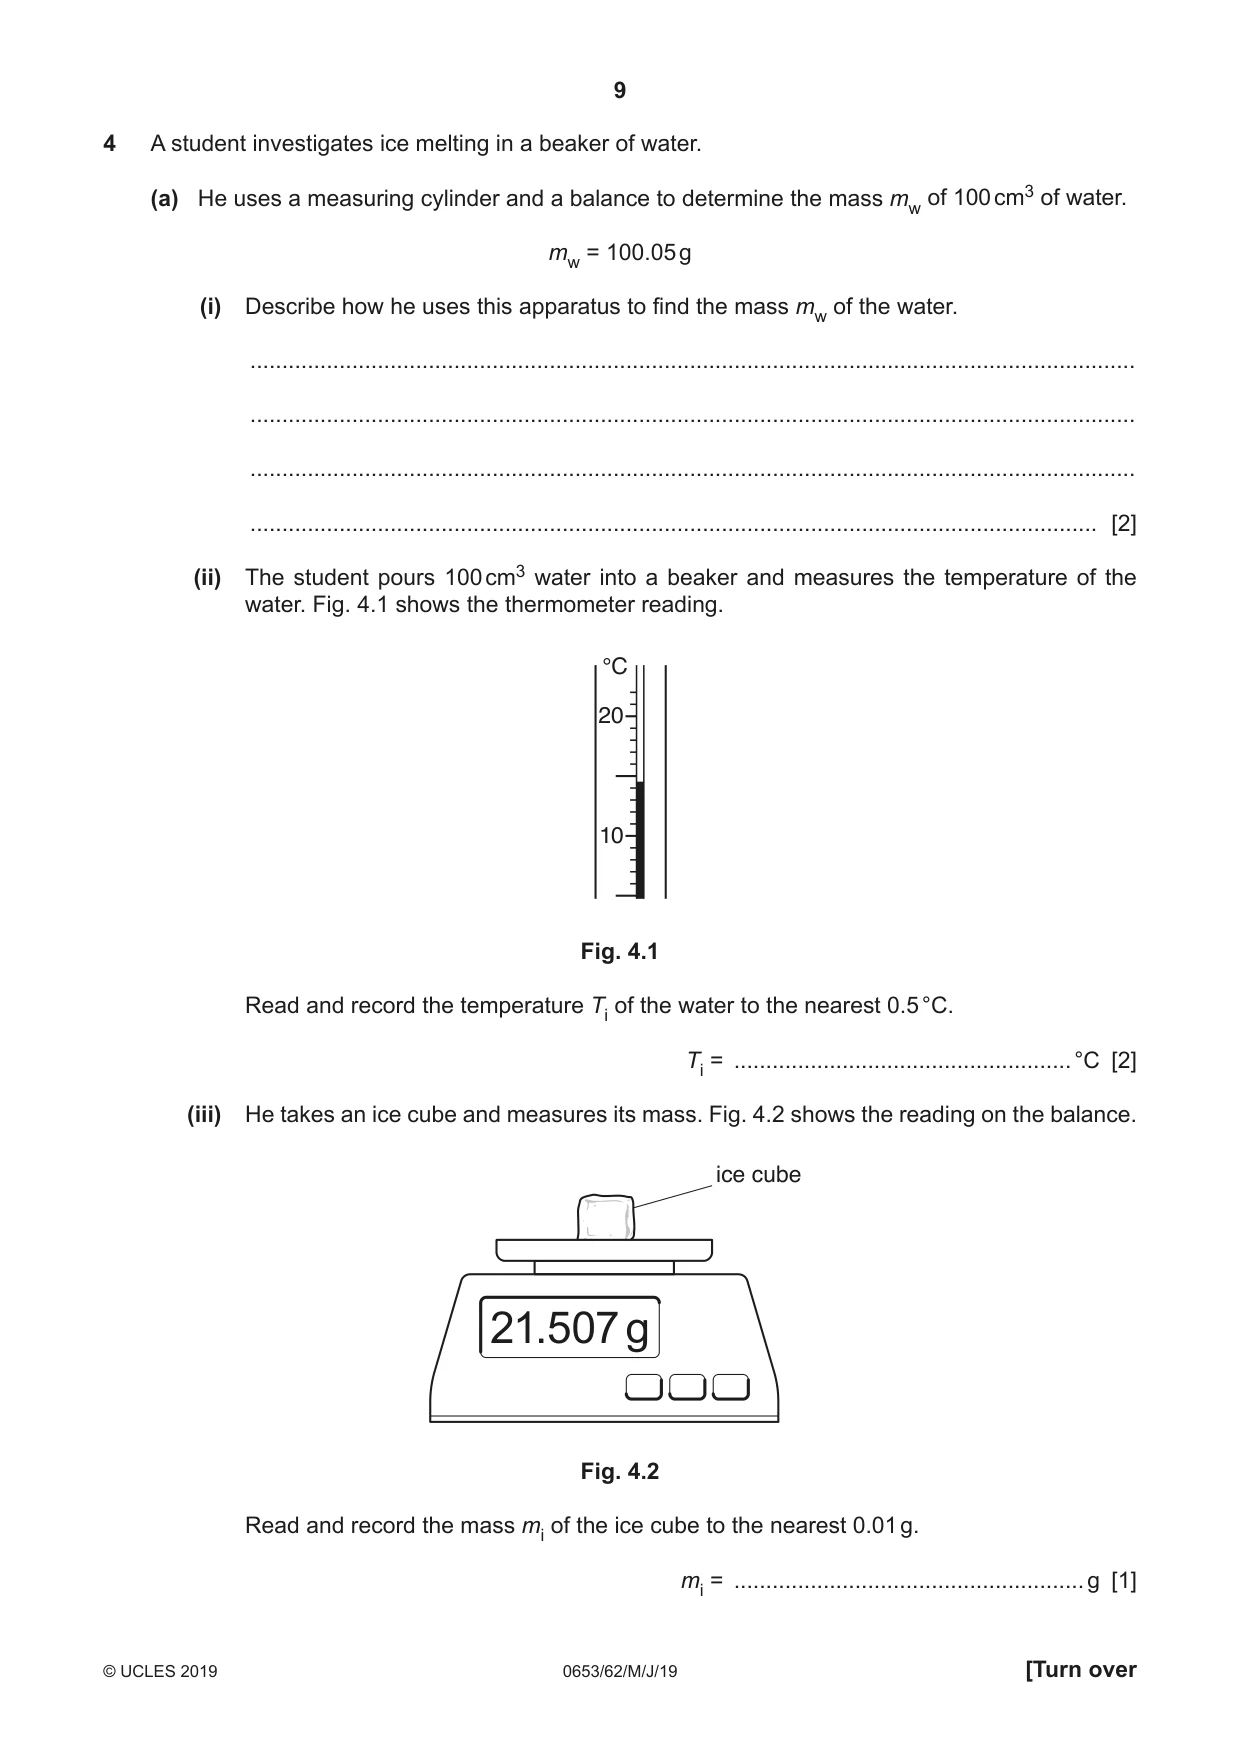
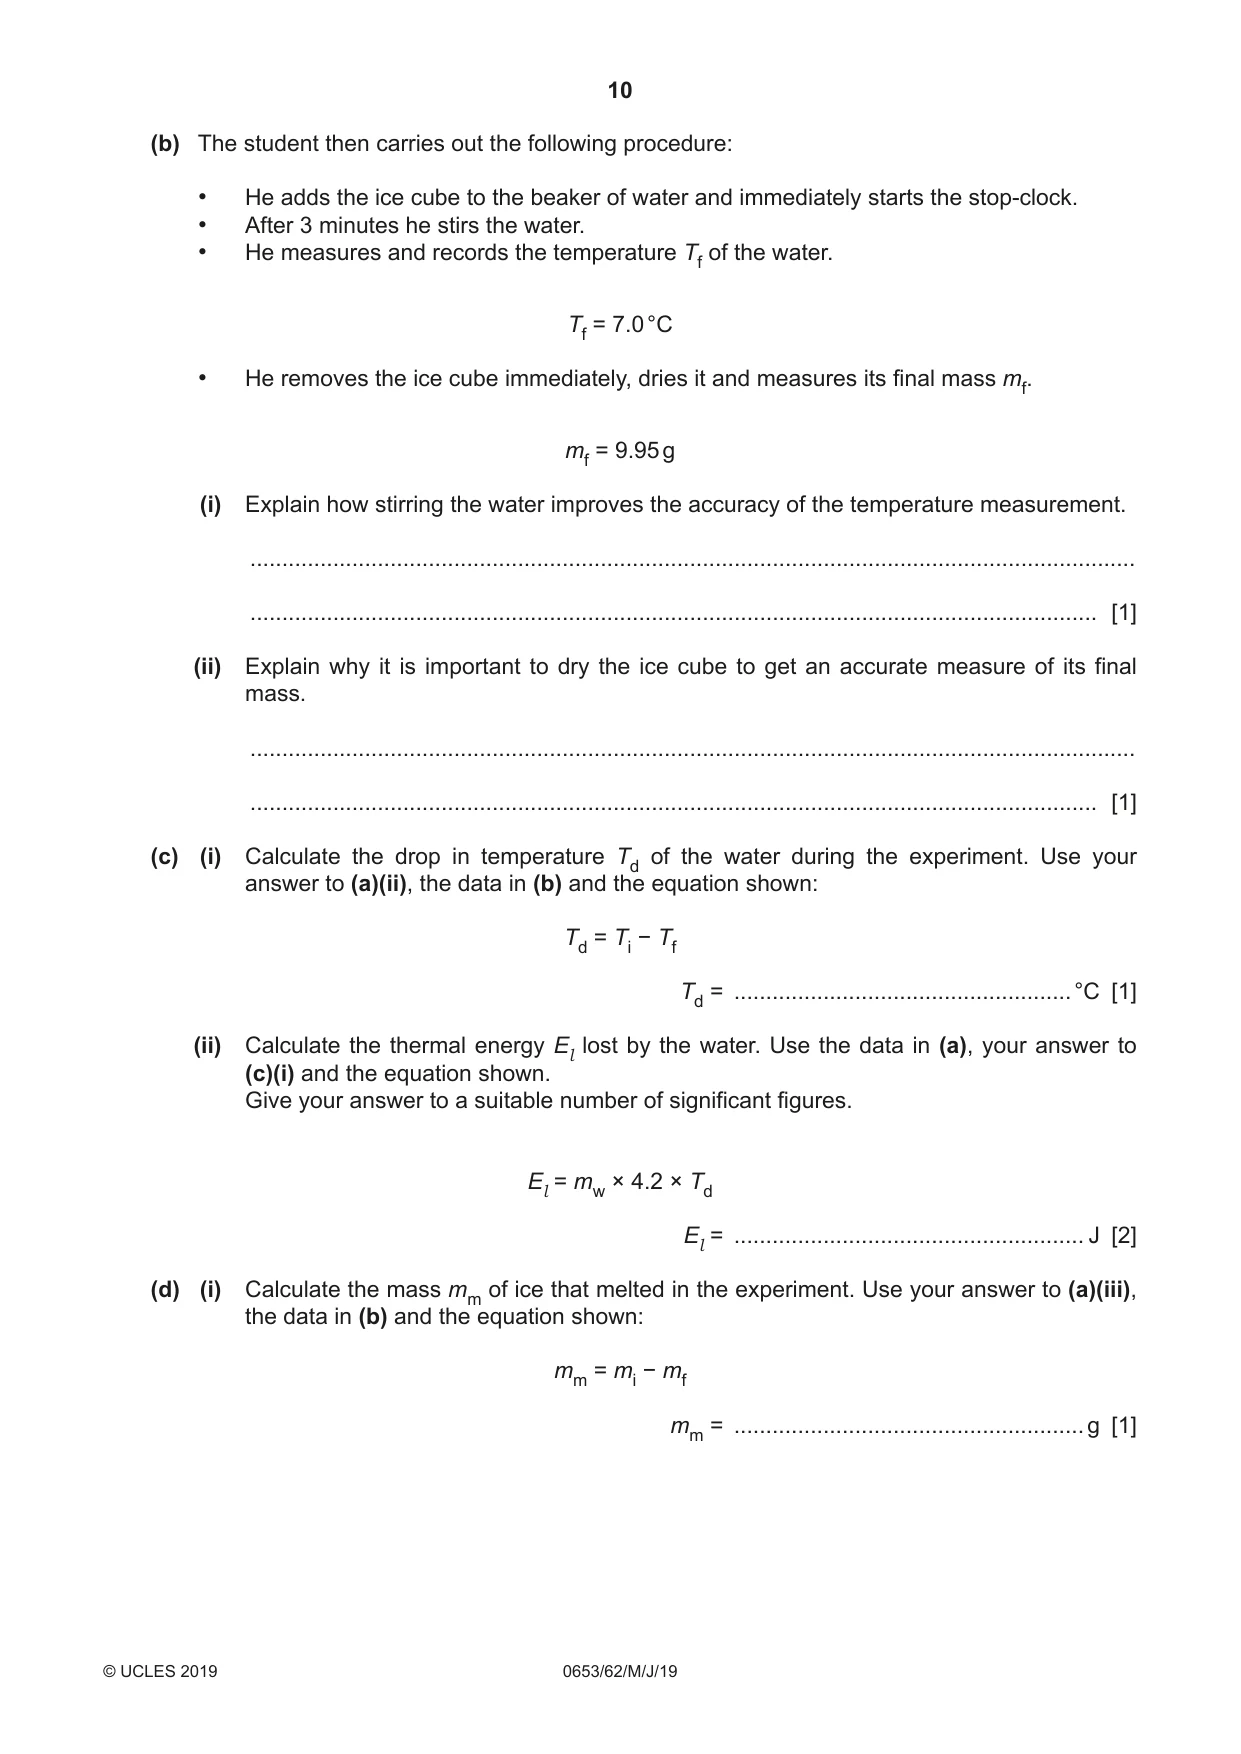
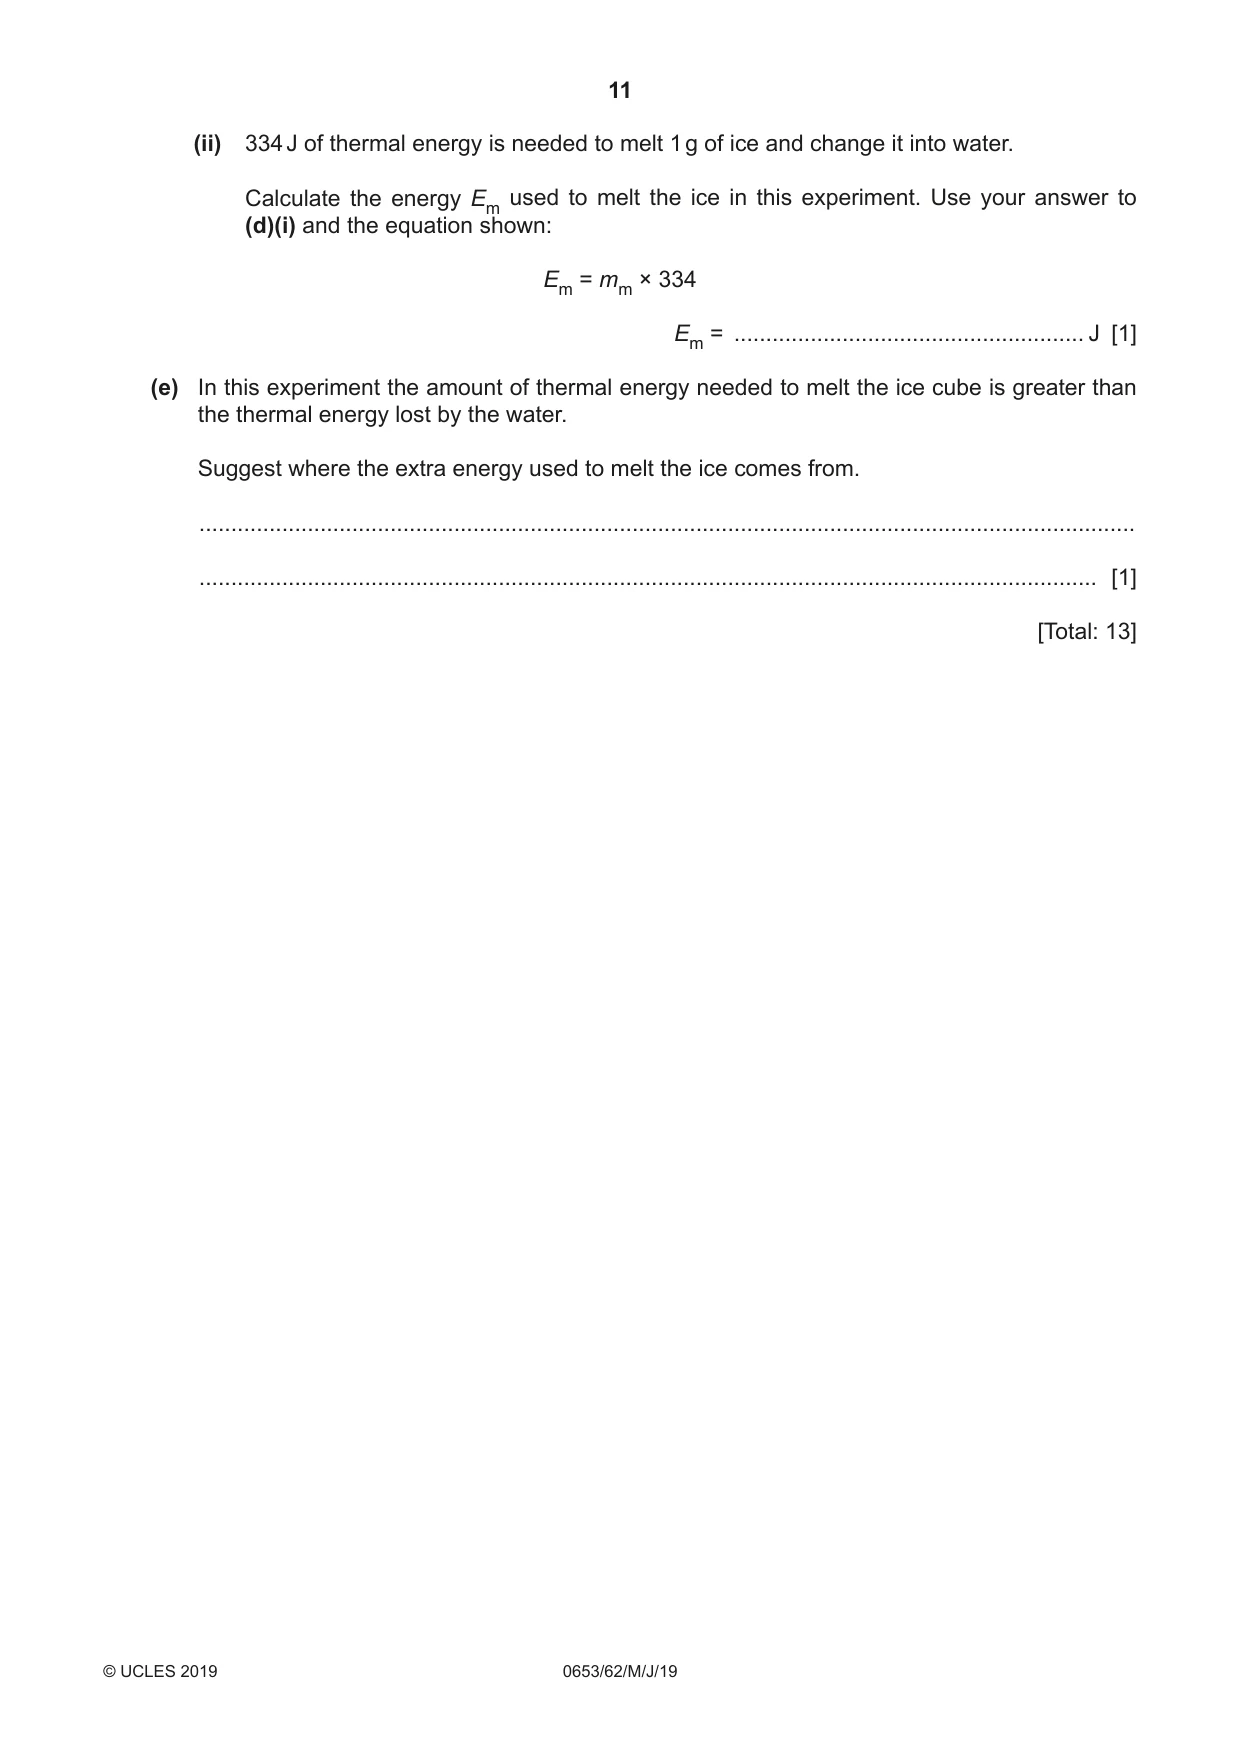
4 A student investigates ice melting in a beaker of water. (a) He uses a measuring cylinder and a balance to determine the mass mw of 100 cm3 of water. mw = 100.05 g (i) Describe how he uses this apparatus to find the mass mw of the water. ........................................................................................................................................... ........................................................................................................................................... ........................................................................................................................................... ..................................................................................................................................... [2] (ii) The student pours 100 cm3 water into a beaker and measures the temperature of the water. Fig. 4.1 shows the thermometer reading. °C 20 10 Fig. 4.1 Read and record the temperature Ti of the water to the nearest 0.5 °C. Ti = ..................................................... °C [2] (iii) He takes an ice cube and measures its mass. Fig. 4.2 shows the reading on the balance. ice cube 21.507 g Fig. 4.2 Read and record the mass mi of the ice cube to the nearest 0.01 g. mi = ....................................................... g [1] (b) The student then carries out the following procedure: • He adds the ice cube to the beaker of water and immediately starts the stop-clock. • After 3 minutes he stirs the water. • He measures and records the temperature Tf of the water. Tf = 7.0 °C • He removes the ice cube immediately, dries it and measures its final mass mf. mf = 9.95 g (i) Explain how stirring the water improves the accuracy of the temperature measurement. ........................................................................................................................................... ..................................................................................................................................... [1] (ii) Explain why it is important to dry the ice cube to get an accurate measure of its final mass. ........................................................................................................................................... ..................................................................................................................................... [1] (c) (i) Calculate the drop in temperature Td of the water during the experiment. Use your answer to (a)(ii), the data in (b) and the equation shown: Td = Ti − Tf Td = ..................................................... °C [1] (ii) Calculate the thermal energy El lost by the water. Use the data in (a), your answer to (c)(i) and the equation shown. Give your answer to a suitable number of significant figures. El = mw × 4.2 × Td El = ....................................................... J [2] (d) (i) Calculate the mass mm of ice that melted in the experiment. Use your answer to (a)(iii), the data in (b) and the equation shown: mm = mi − mf mm = ....................................................... g [1] (ii) 334 J of thermal energy is needed to melt 1 g of ice and change it into water. Calculate the energy Em used to melt the ice in this experiment. Use your answer to (d)(i) and the equation shown: Em = mm × 334 Em = ....................................................... J [1] (e) In this experiment the amount of thermal energy needed to melt the ice cube is greater than the thermal energy lost by the water. Suggest where the extra energy used to melt the ice comes from. ................................................................................................................................................... ............................................................................................................................................. [1] [Total: 13]
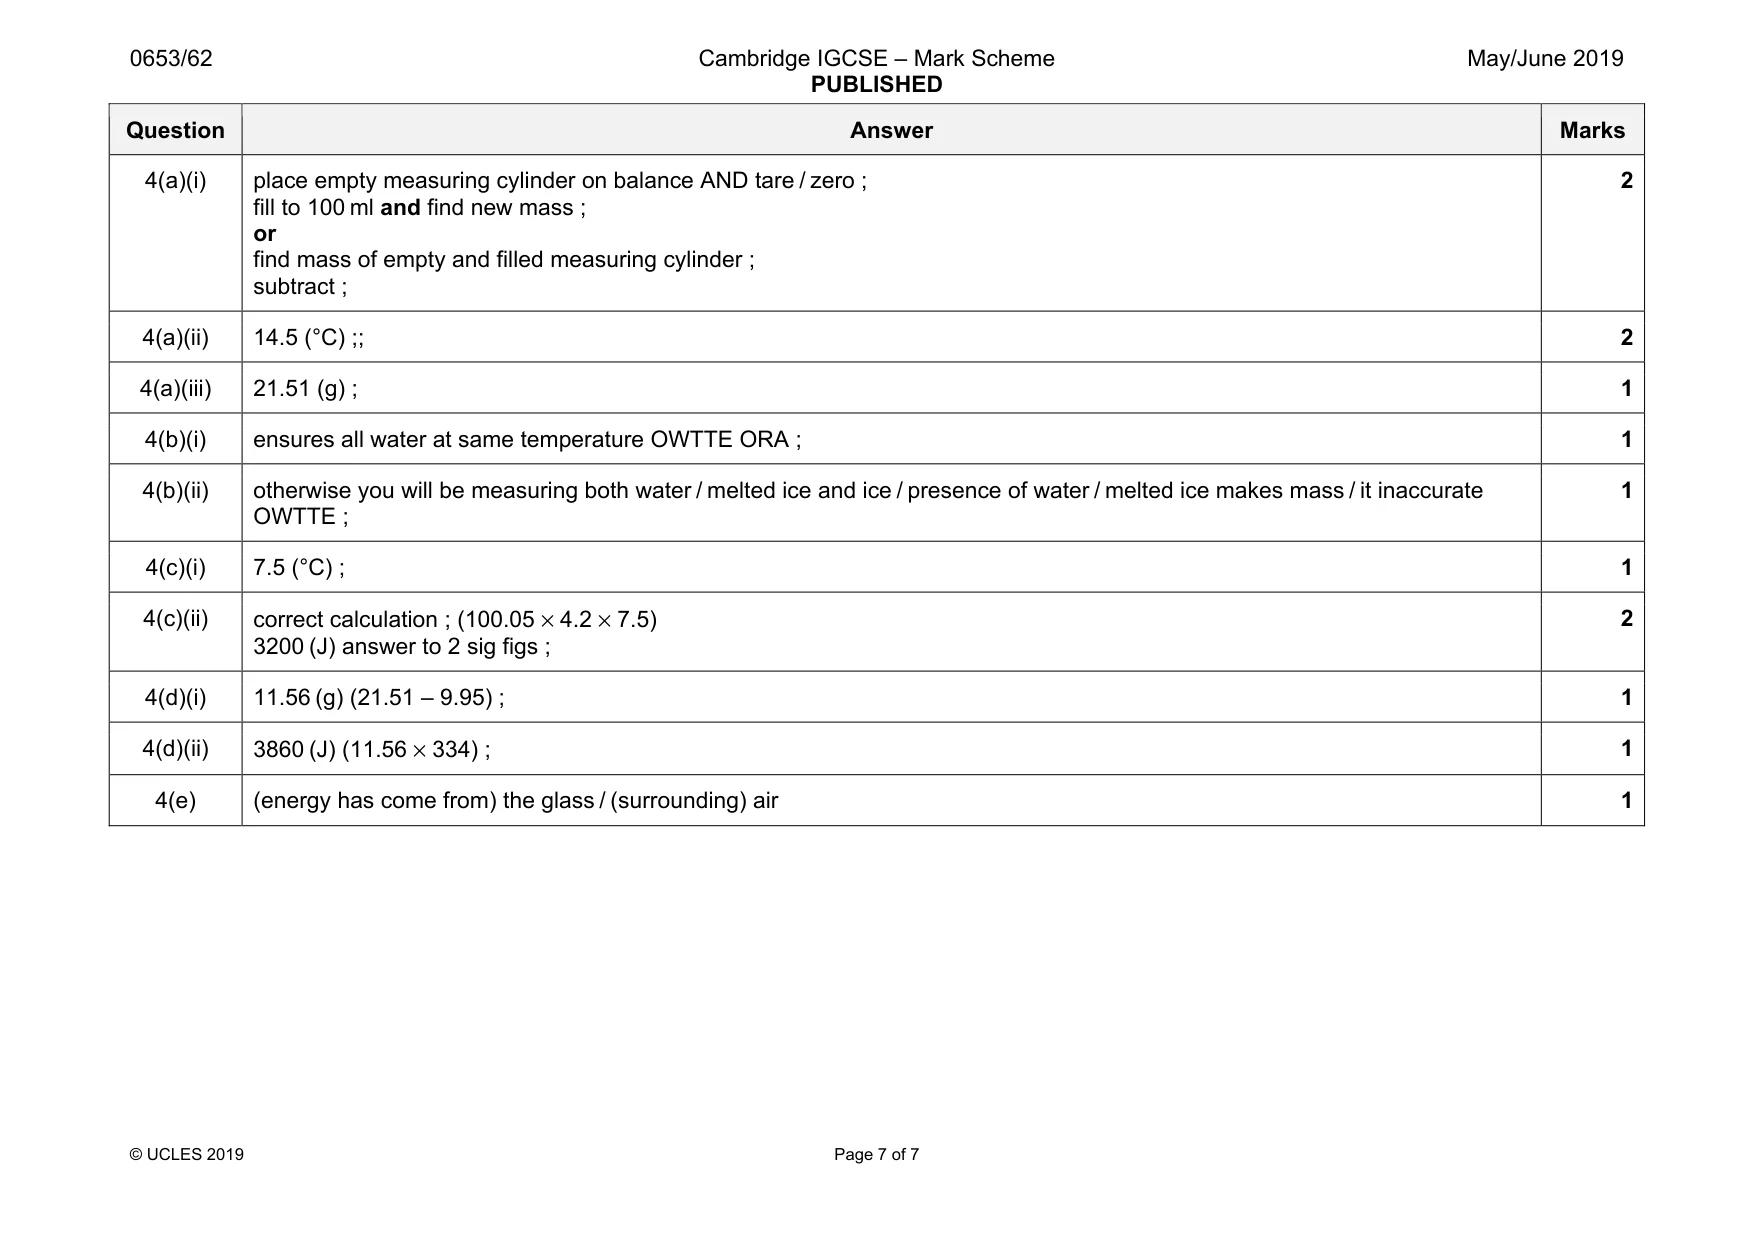
Mark scheme: 4(a)(i) place empty measuring cylinder on balance AND tare / zero ; fill to 100 ml and find new mass ; or find mass of empty and filled measuring cylinder ; subtract ; 2 4(a)(ii) 14.5 (°C) ;; 2 4(a)(iii) 21.51 (g) ; 1 4(b)(i) ensures all water at same temperature OWTTE ORA ; 1 4(b)(ii) otherwise you will be measuring both water / melted ice and ice / presence of water / melted ice makes mass / it inaccurate OWTTE ; 1 4(c)(i) 7.5 (°C) ; 1 4(c)(ii) correct calculation ; (100.05 × 4.2 × 7.5) 3200 (J) answer to 2 sig figs ; 2 4(d)(i) 11.56 (g) (21.51 – 9.95) ; 1 4(d)(ii) 3860 (J) (11.56 × 334) ; 1 4(e) (energy has come from) the glass / (surrounding) air 1
More questions on Physical quantities and measurement techniques
What was in this paper
The subtopics covered by these 4 questions, and how many questions each got. Open one in a new tab to see every Cambridge question on it.
What you needed in this session
Cambridge’s own grade thresholds for 2019 May/June, Paper 6 · Variant 2. A higher threshold means an easier paper — the bar moves with how the cohort did.