Cambridge IGCSE Science - Combined 0653 — 2018 May/June Paper 6 · Variant 3
0653/63/M/J/18 · 6 questions · 60 marks · ≈68 min
The question paper and its mark scheme, free to read here and free to download. This is Cambridge’s own paper, exactly as it was sat.
Question paper20 pages


Mark scheme9 pages
Answers below. Sit the paper first if you are practising.
Questions as text
Q1 · A student investigates the effect of temperature on the rate of photosynthesis using the…
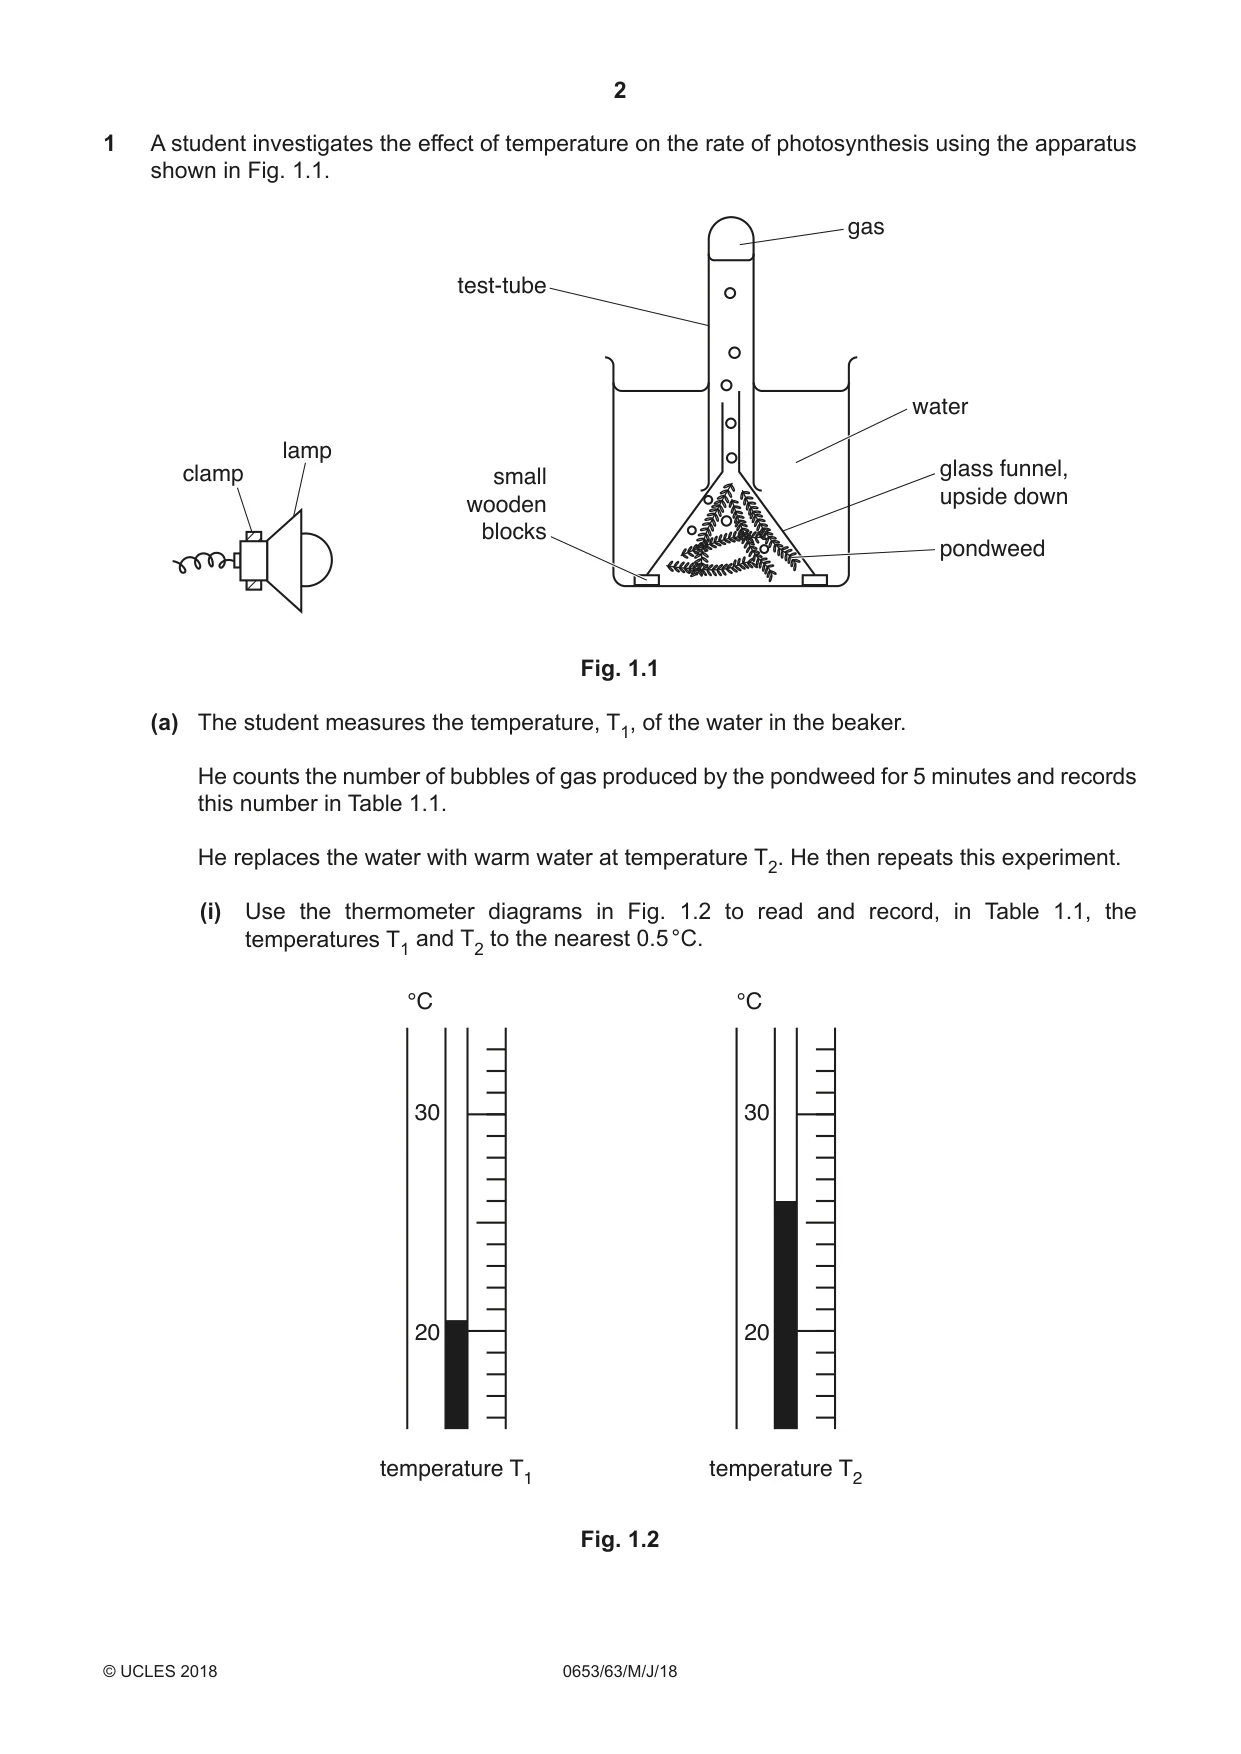
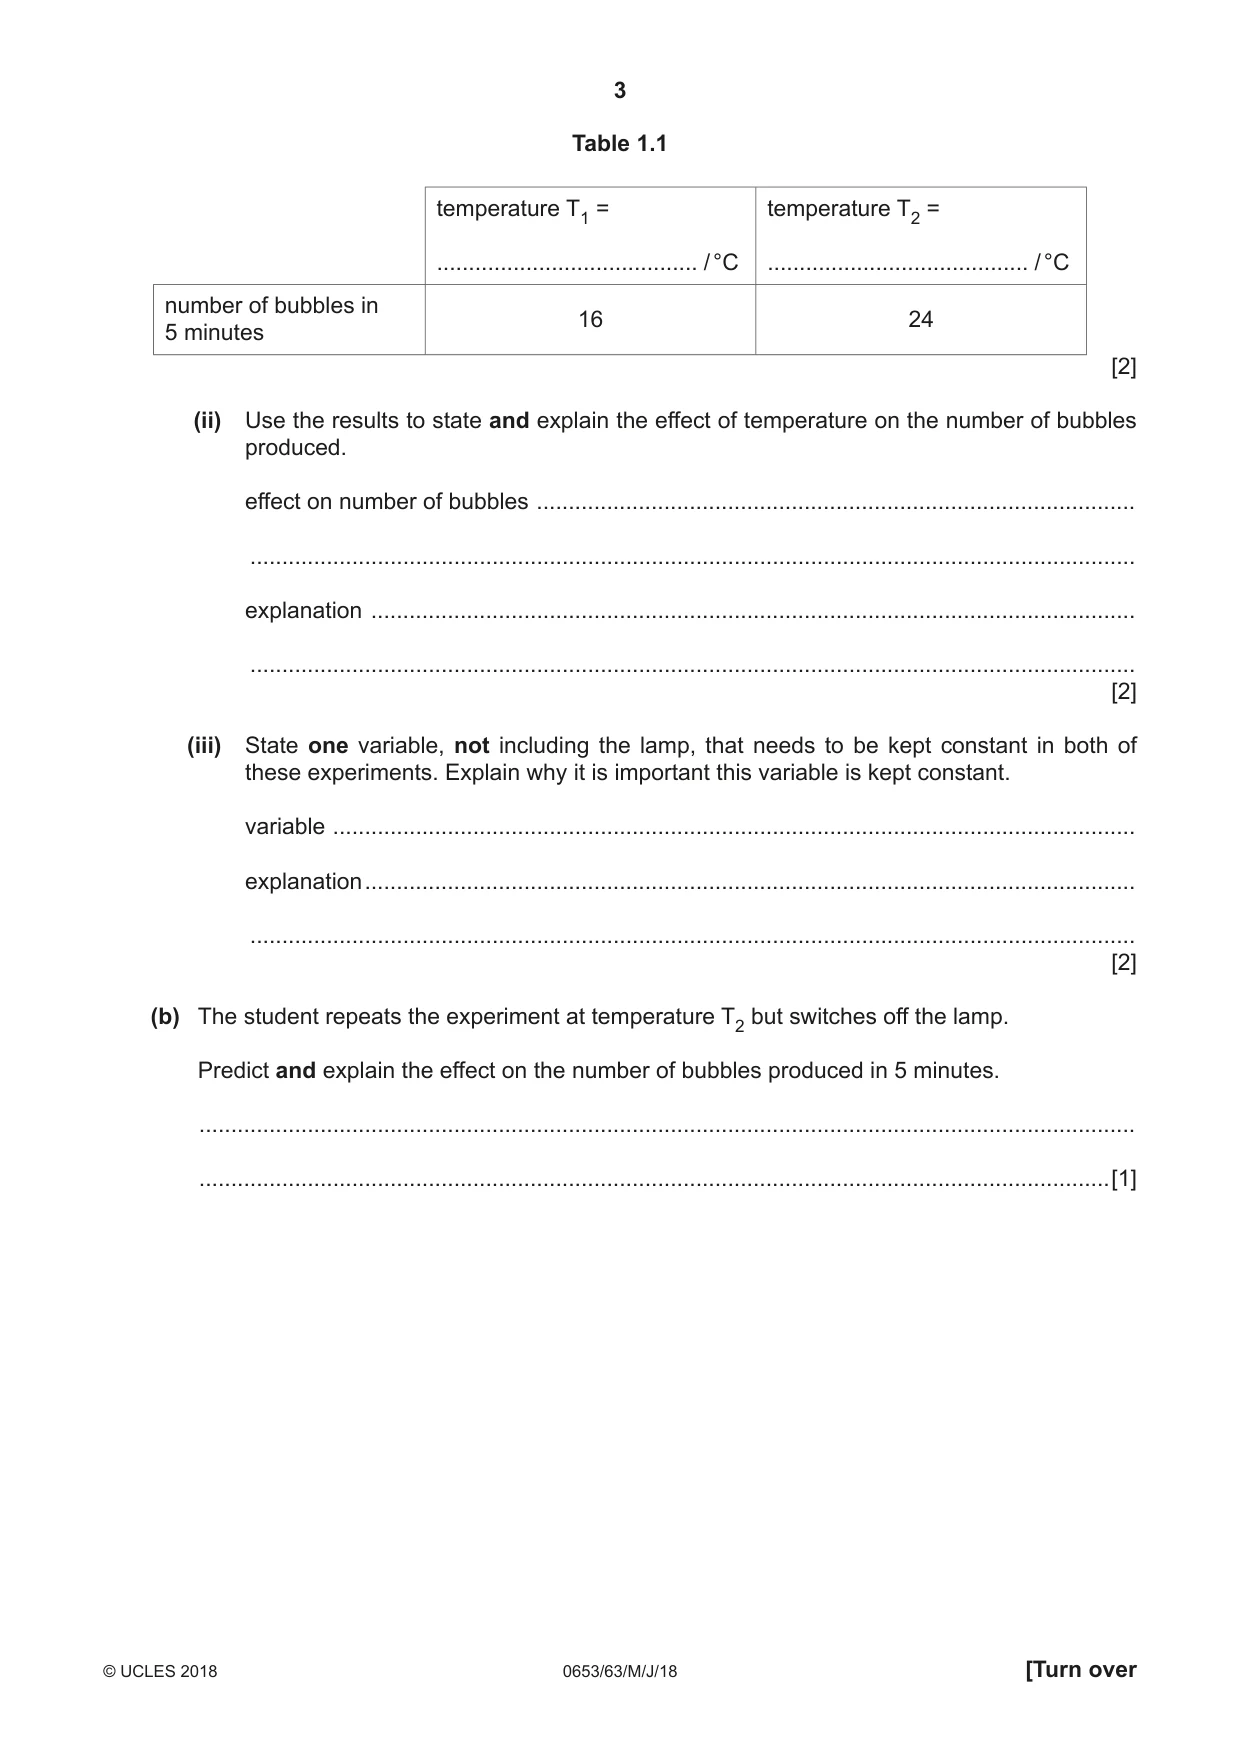
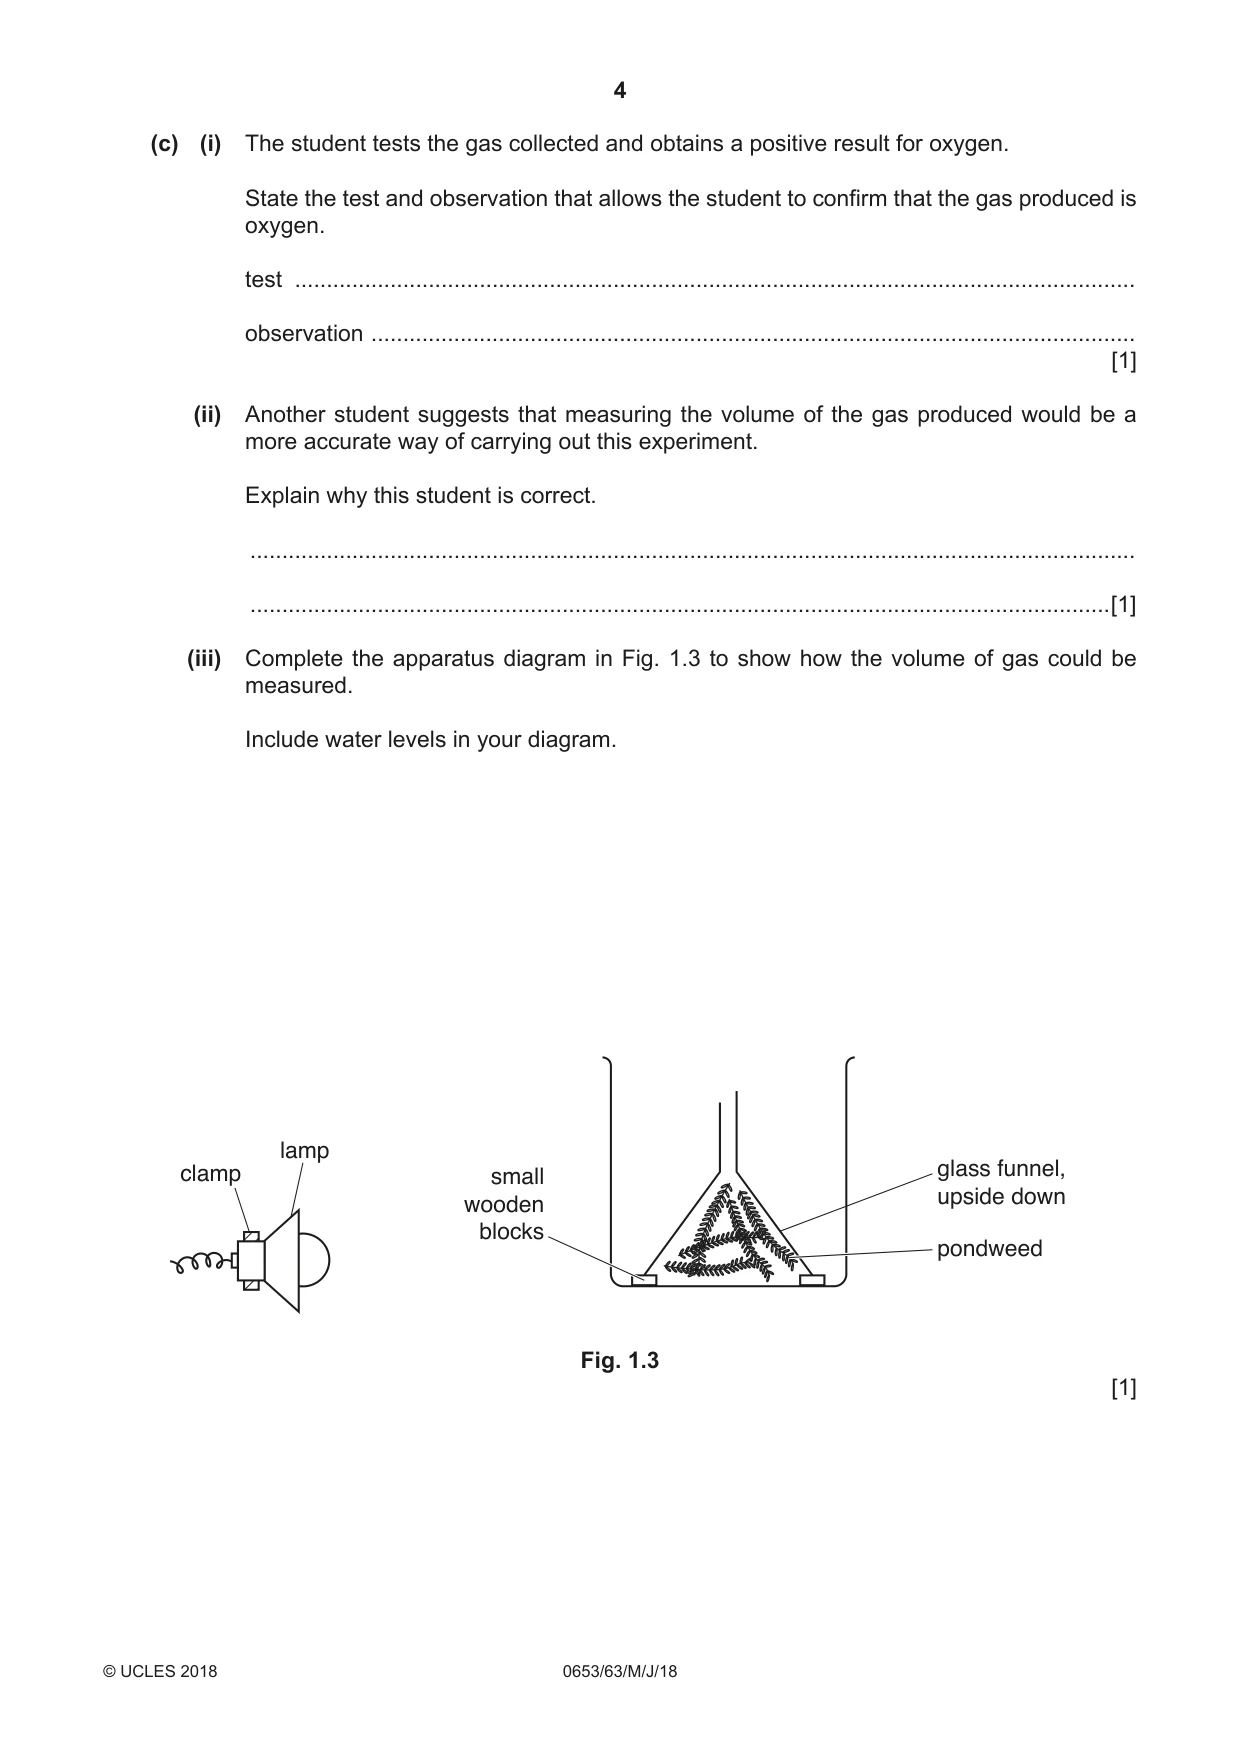
1 A student investigates the effect of temperature on the rate of photosynthesis using the apparatus shown in Fig. 1.1. gas test-tube water lamp clamp small glass funnel, upside down wooden blocks pondweed Fig. 1.1 (a) The student measures the temperature, T1, of the water in the beaker. He counts the number of bubbles of gas produced by the pondweed for 5 minutes and records this number in Table 1.1. He replaces the water with warm water at temperature T2. He then repeats this experiment. (i) Use the thermometer diagrams in Fig. 1.2 to read and record, in Table 1.1, the temperatures T1 and T2 to the nearest 0.5 °C. °C °C 30 30 20 20 temperature T1 temperature T2 Fig. 1.2 Table 1.1 temperature T1 = temperature T2 = ......................................... / °C ......................................... / °C number of bubbles in 16 24 5 minutes [2] (ii) Use the results to state and explain the effect of temperature on the number of bubbles produced. effect on number of bubbles .............................................................................................. ........................................................................................................................................... explanation ........................................................................................................................ ........................................................................................................................................... [2] (iii) State one variable, not including the lamp, that needs to be kept constant in both of these experiments. Explain why it is important this variable is kept constant. variable .............................................................................................................................. explanation ......................................................................................................................... ........................................................................................................................................... [2] (b) The student repeats the experiment at temperature T2 but switches off the lamp. Predict and explain the effect on the number of bubbles produced in 5 minutes. ................................................................................................................................................... ...............................................................................................................................................[1] (c) (i) The student tests the gas collected and obtains a positive result for oxygen. State the test and observation that allows the student to confirm that the gas produced is oxygen. test .................................................................................................................................... observation ........................................................................................................................ [1] (ii) Another student suggests that measuring the volume of the gas produced would be a more accurate way of carrying out this experiment. Explain why this student is correct. ........................................................................................................................................... .......................................................................................................................................[1] (iii) Complete the apparatus diagram in Fig. 1.3 to show how the volume of gas could be measured. Include water levels in your diagram. lamp clamp small glass funnel, upside down wooden blocks pondweed Fig. 1.3 [1]
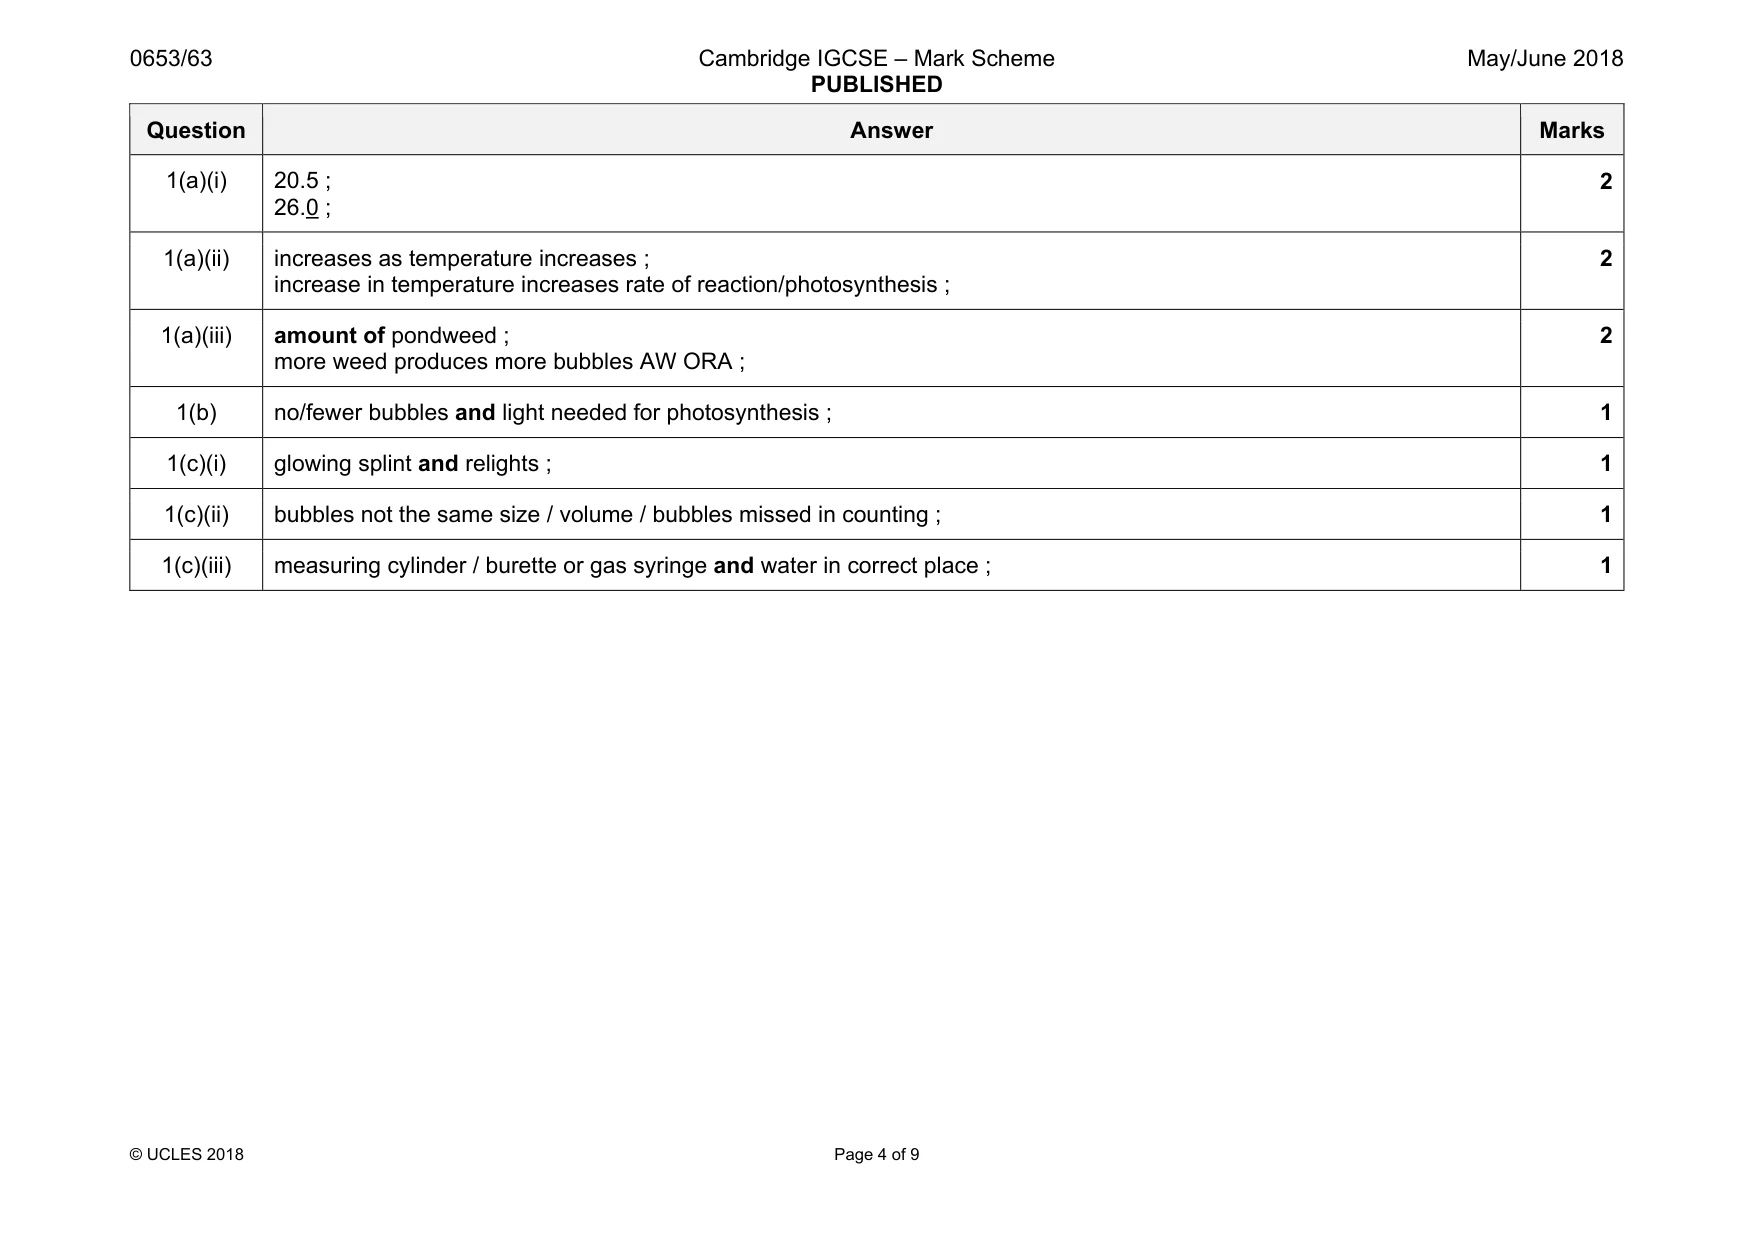
Mark scheme: 1(a)(i) 20.5 ; 26.0 ; 2 1(a)(ii) increases as temperature increases ; increase in temperature increases rate of reaction/photosynthesis ; 2 1(a)(iii) amount of pondweed ; more weed produces more bubbles AW ORA ; 2 1(b) no/fewer bubbles and light needed for photosynthesis ; 1 1(c)(i) glowing splint and relights ; 1 1(c)(ii) bubbles not the same size / volume / bubbles missed in counting ; 1 1(c)(iii) measuring cylinder / burette or gas syringe and water in correct place ; 1
Q2 · A student investigates the rate of reaction between zinc and hydrochloric acid
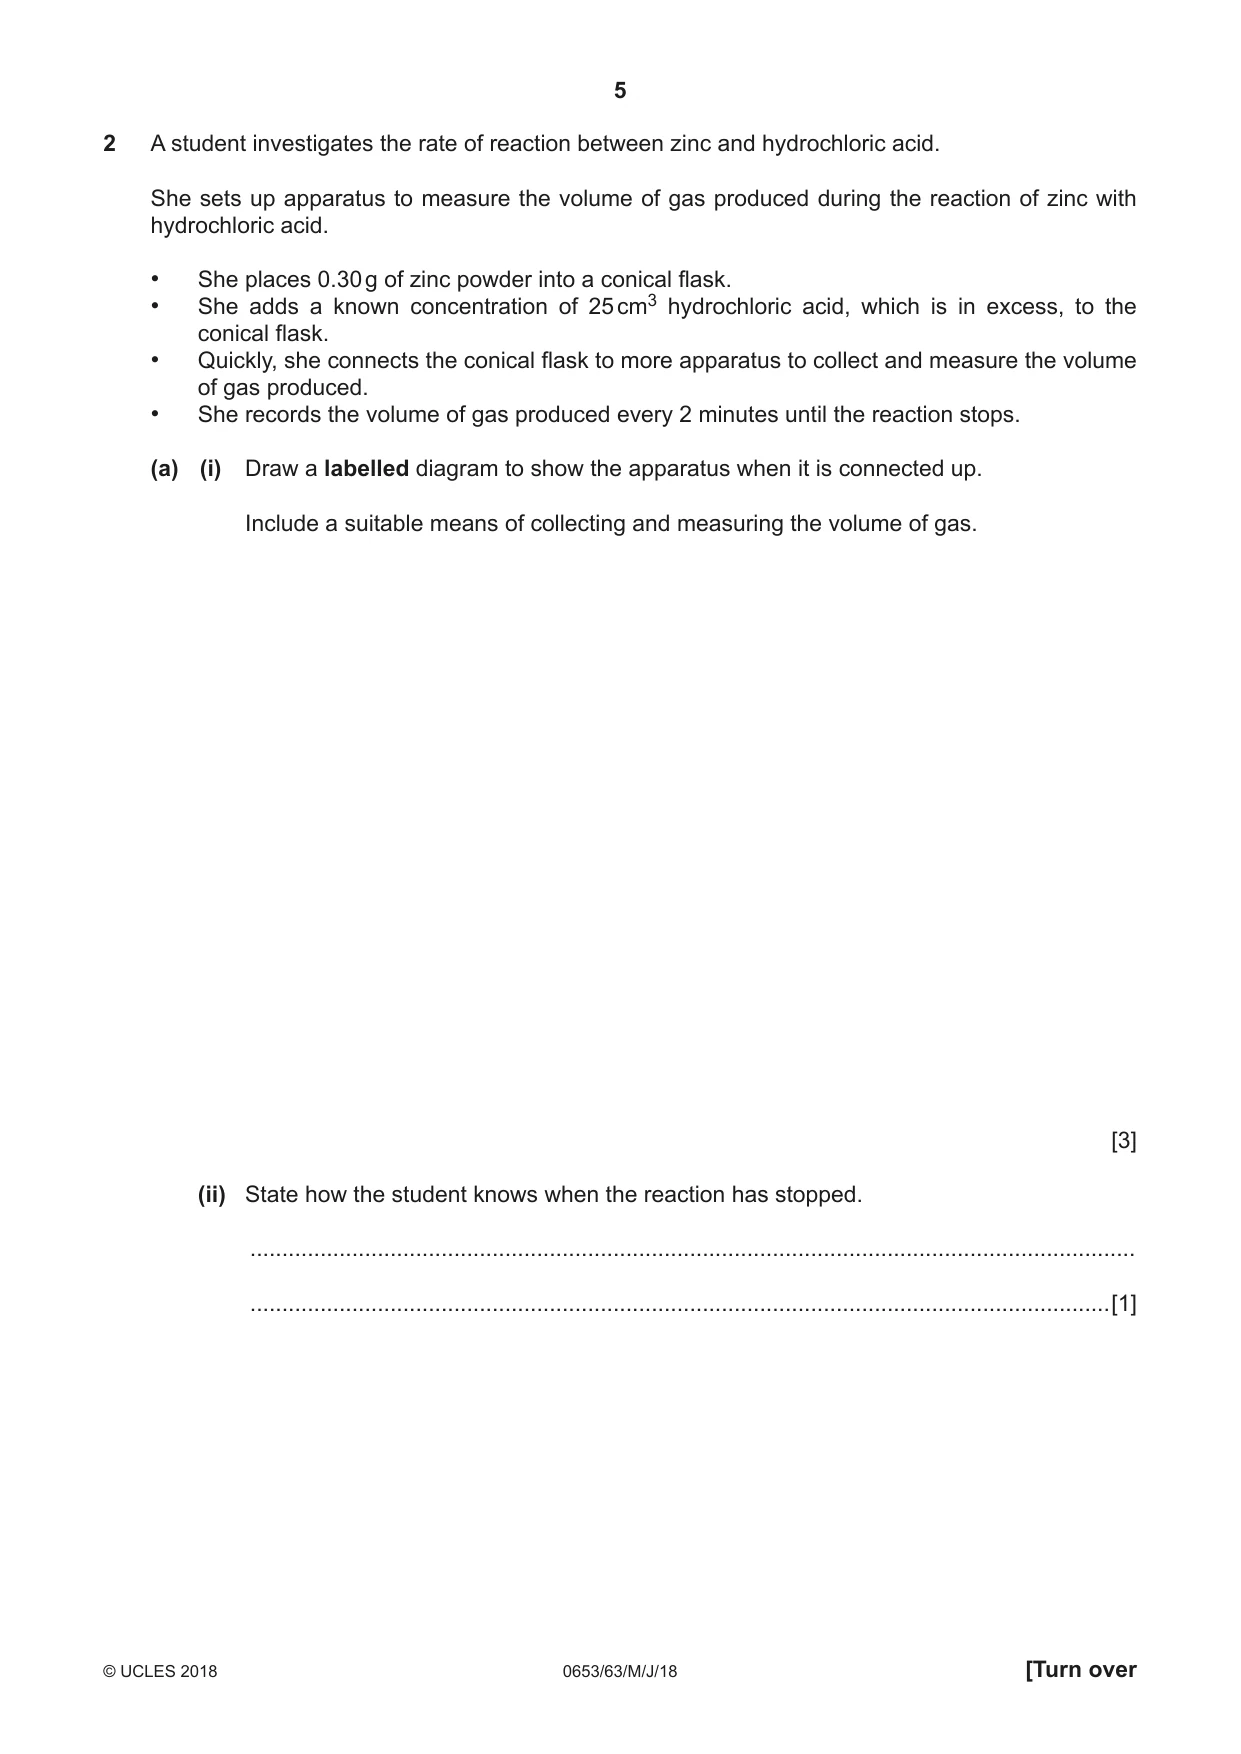
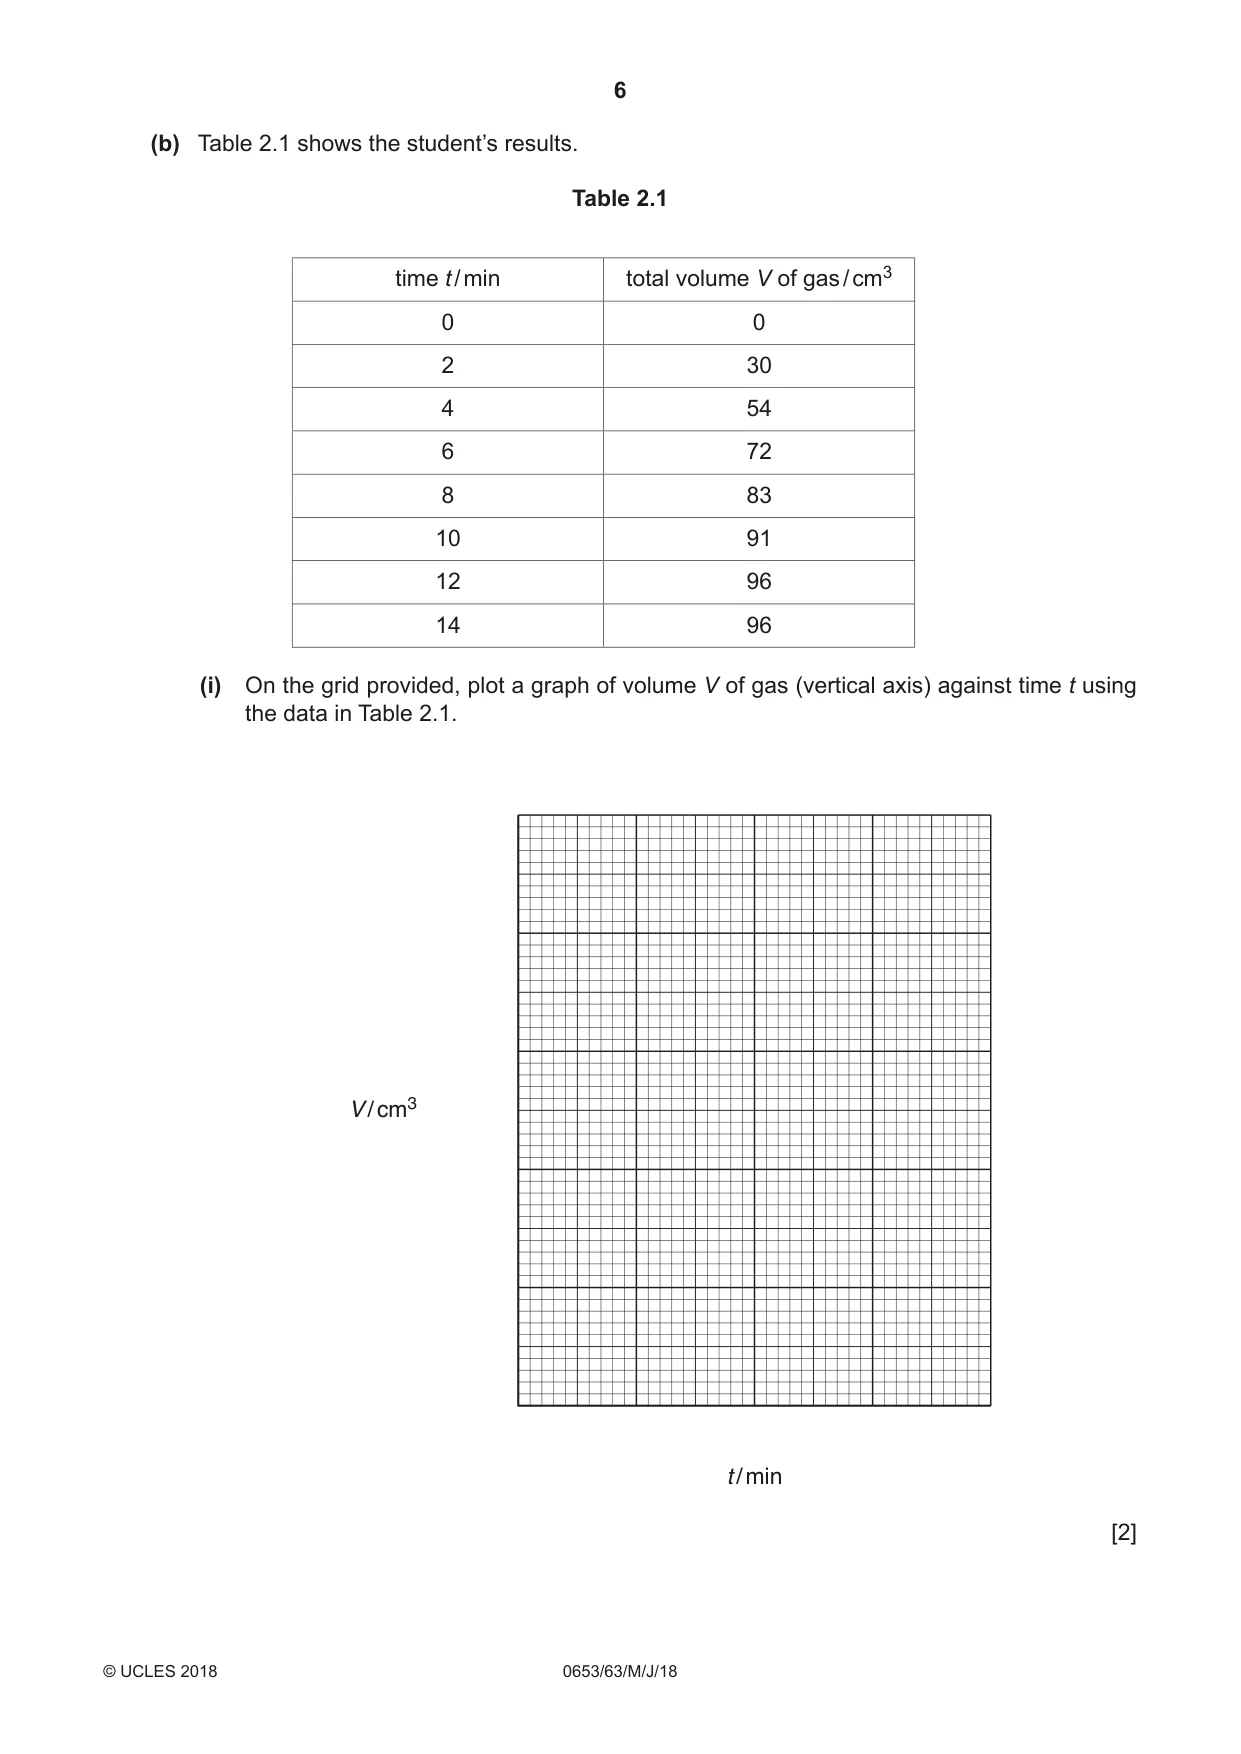
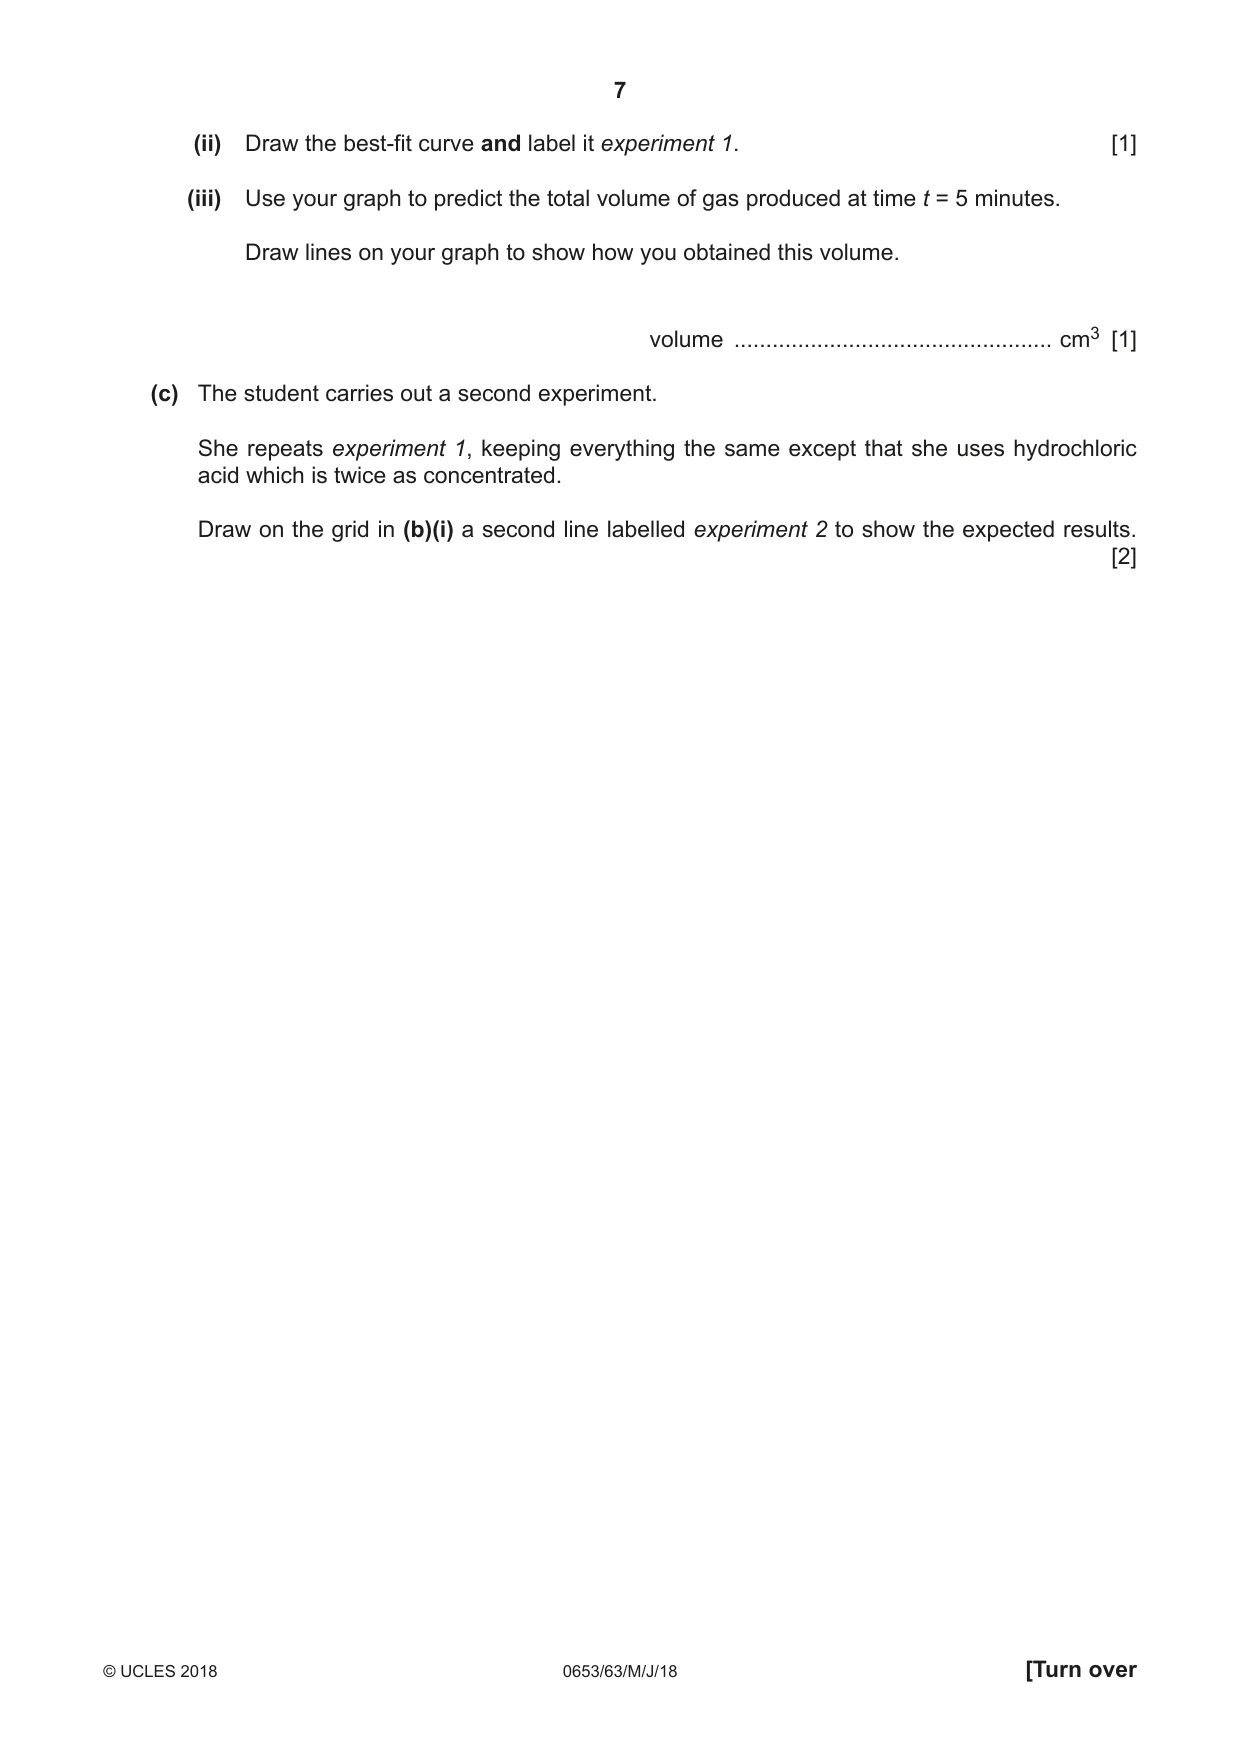
2 A student investigates the rate of reaction between zinc and hydrochloric acid. She sets up apparatus to measure the volume of gas produced during the reaction of zinc with hydrochloric acid. • She places 0.30 g of zinc powder into a conical flask. • She adds a known concentration of 25 cm3 hydrochloric acid, which is in excess, to the conical flask. • Quickly, she connects the conical flask to more apparatus to collect and measure the volume of gas produced. • She records the volume of gas produced every 2 minutes until the reaction stops. (a) (i) Draw a labelled diagram to show the apparatus when it is connected up. Include a suitable means of collecting and measuring the volume of gas. [3] (ii) State how the student knows when the reaction has stopped. ........................................................................................................................................... .......................................................................................................................................[1] (b) Table 2.1 shows the student’s results. Table 2.1 time t / min total volume V of gas / cm3 0 0 2 30 4 54 6 72 8 83 10 91 12 96 14 96 (i) On the grid provided, plot a graph of volume V of gas (vertical axis) against time t using the data in Table 2.1. V / cm3 t / min [2] (ii) Draw the best-fit curve and label it experiment 1. [1] (iii) Use your graph to predict the total volume of gas produced at time t = 5 minutes. Draw lines on your graph to show how you obtained this volume. volume .................................................. cm3 [1] (c) The student carries out a second experiment. She repeats experiment 1, keeping everything the same except that she uses hydrochloric acid which is twice as concentrated. Draw on the grid in (b)(i) a second line labelled experiment 2 to show the expected results. [2]
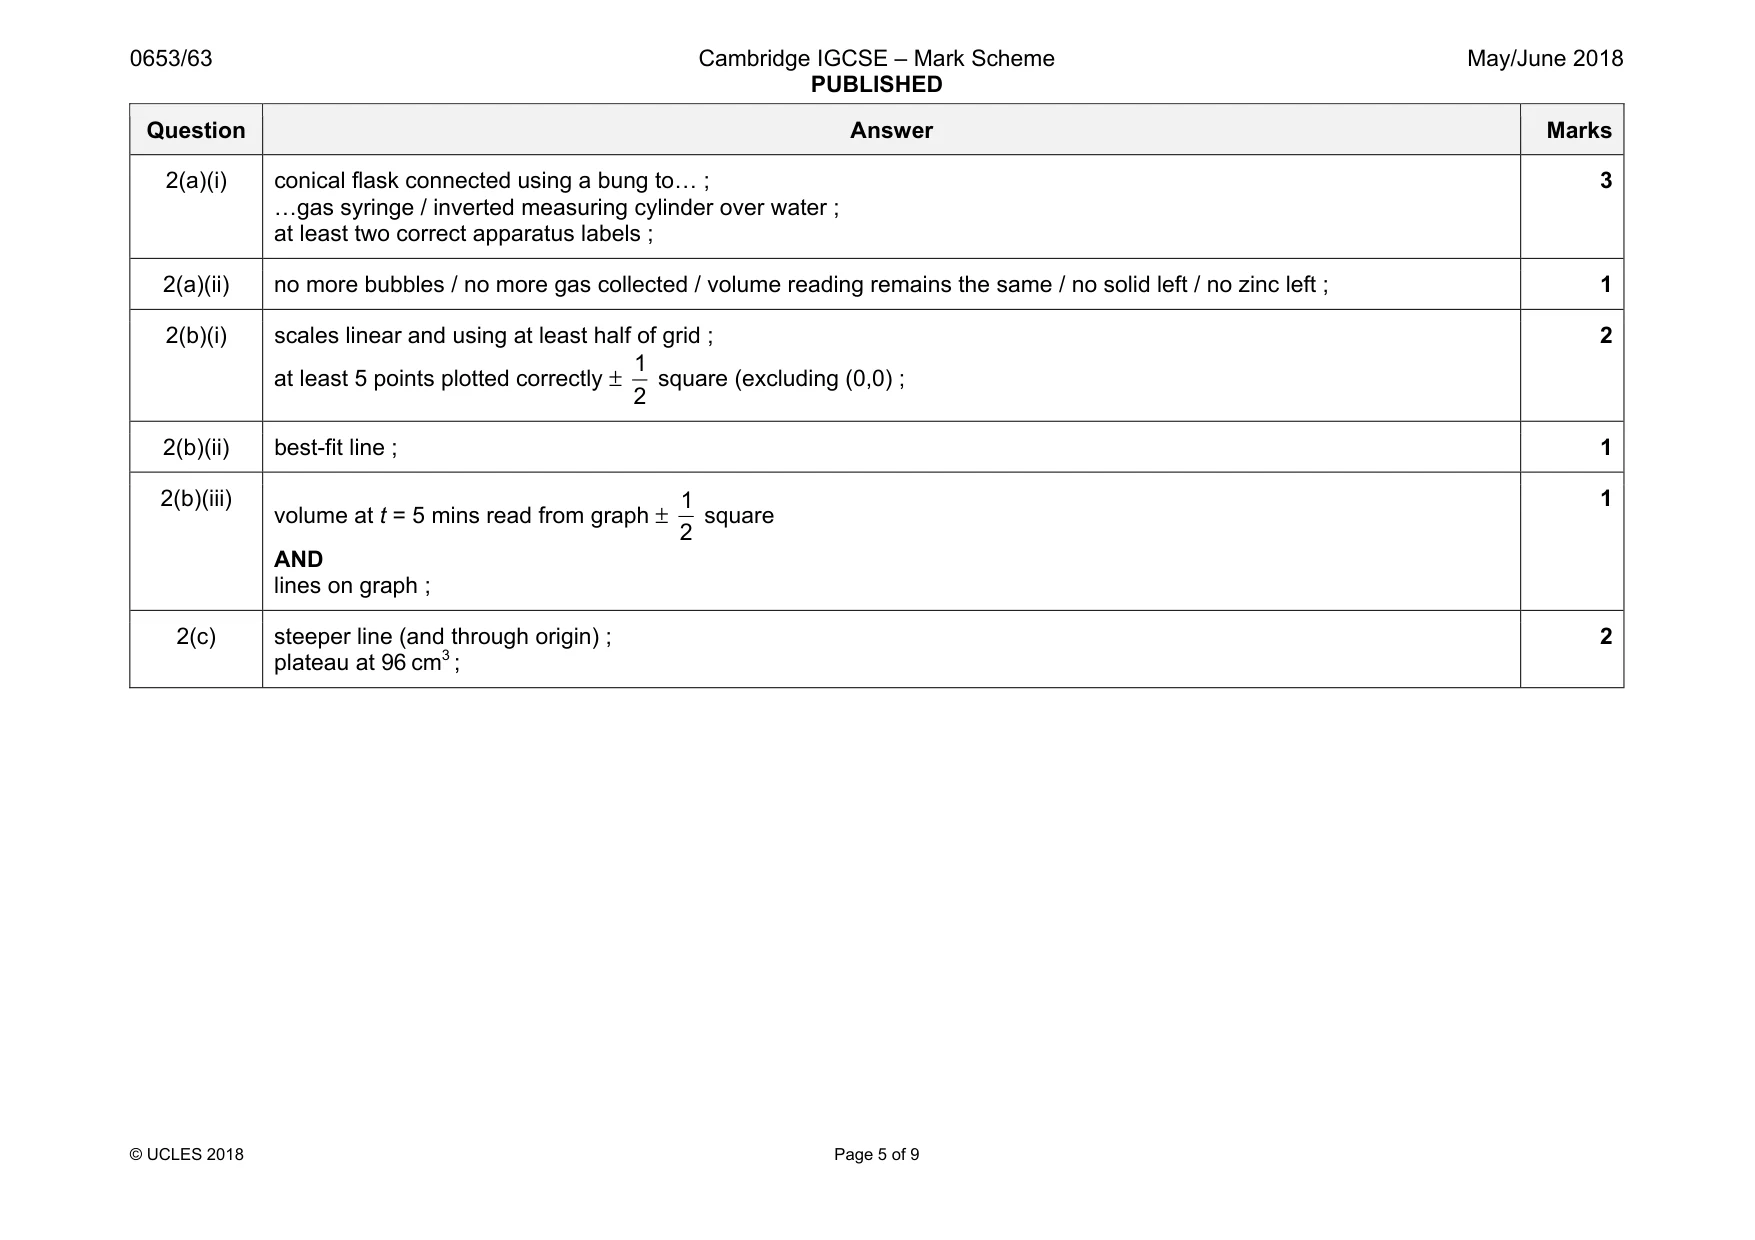
Mark scheme: 2(a)(i) conical flask connected using a bung to« ; «gas syringe / inverted measuring cylinder over water ; at least two correct apparatus labels ; 3 2(a)(ii) no more bubbles / no more gas collected / volume reading remains the same / no solid left / no zinc left ; 1 2(b)(i) scales linear and using at least half of grid ; at least 5 points plotted correctly ± 1 2 square (excluding (0,0) ; 2 2(b)(ii) best-fit line ; 1 2(b)(iii) volume at t = 5 mins read from graph ± 1 2 square AND lines on graph ; 1 2(c) steeper line (and through origin) ; plateau at 96 cm3 ; 2
Q3 · A student investigates the power output of lamps connected in series and in parallel
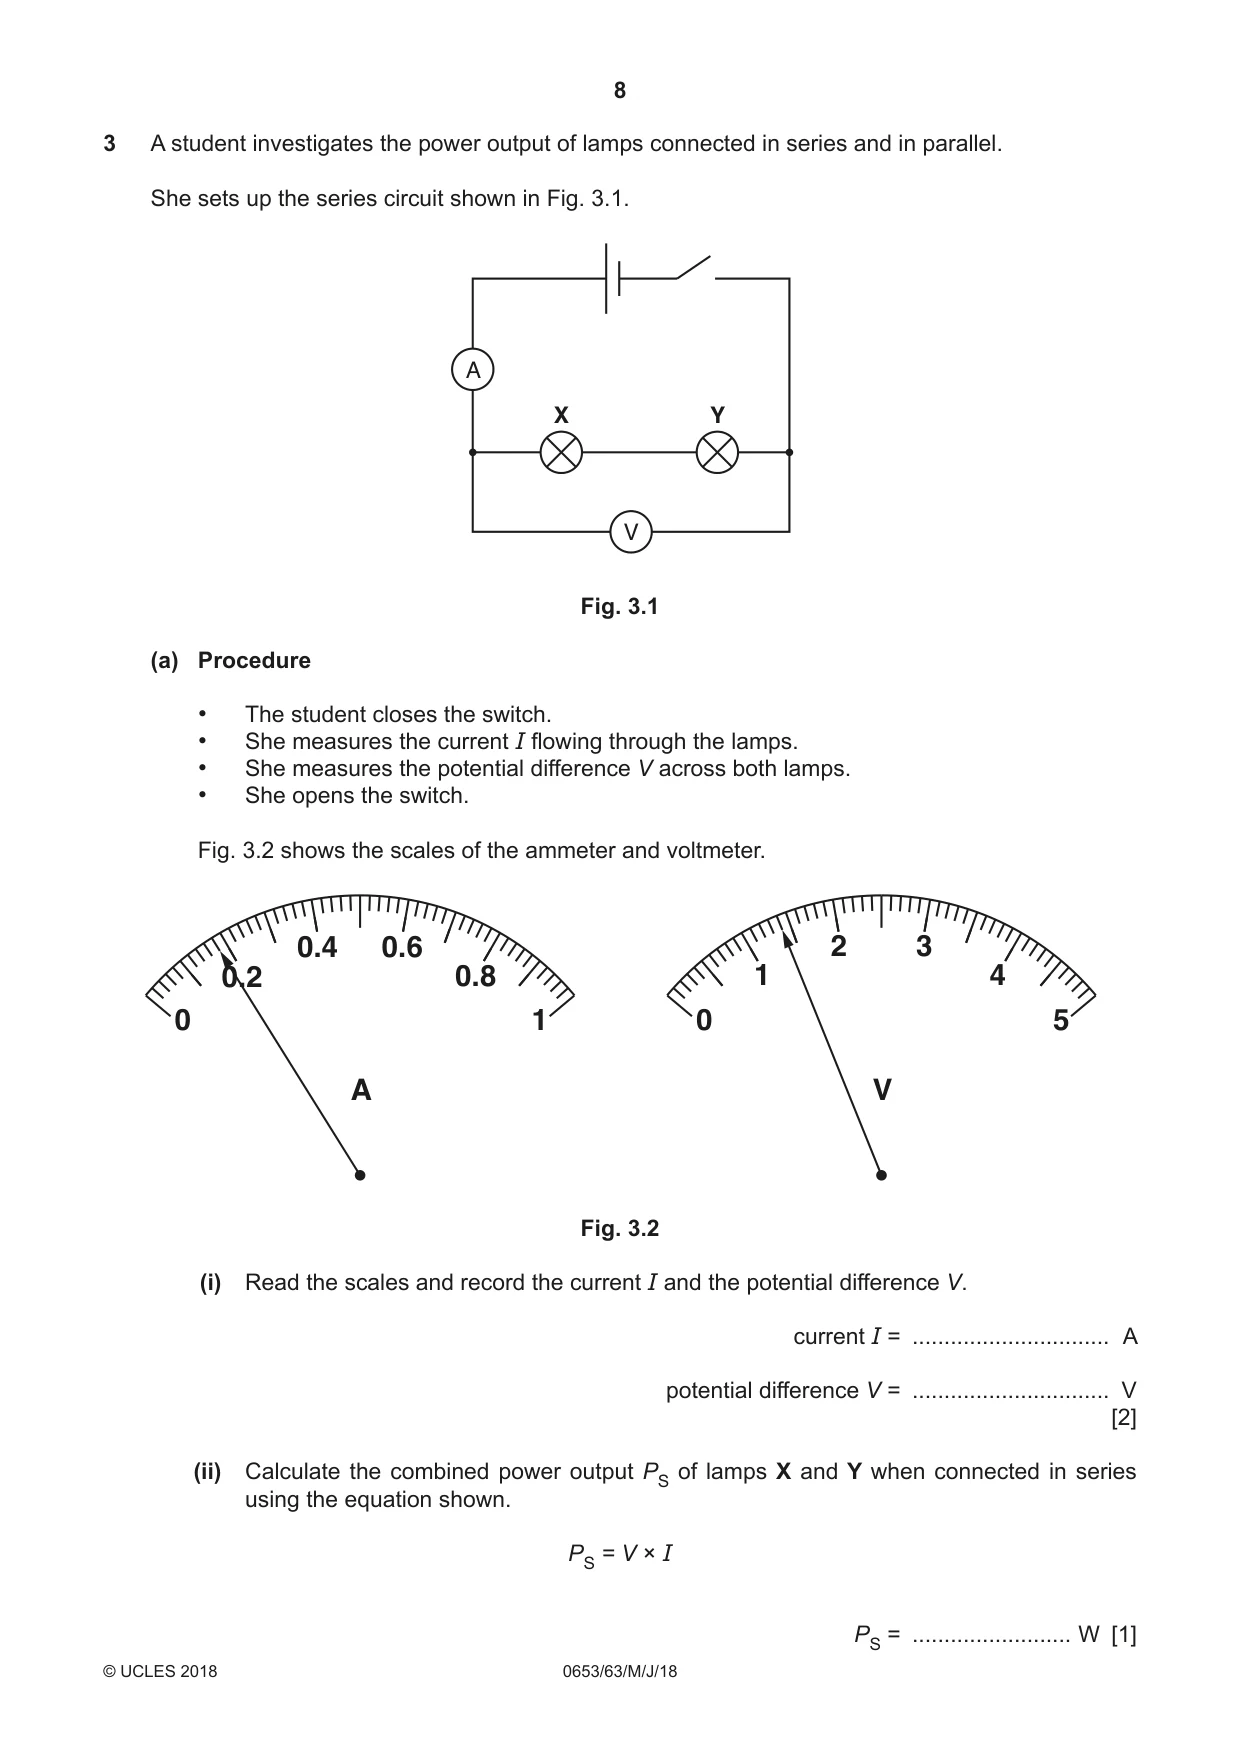
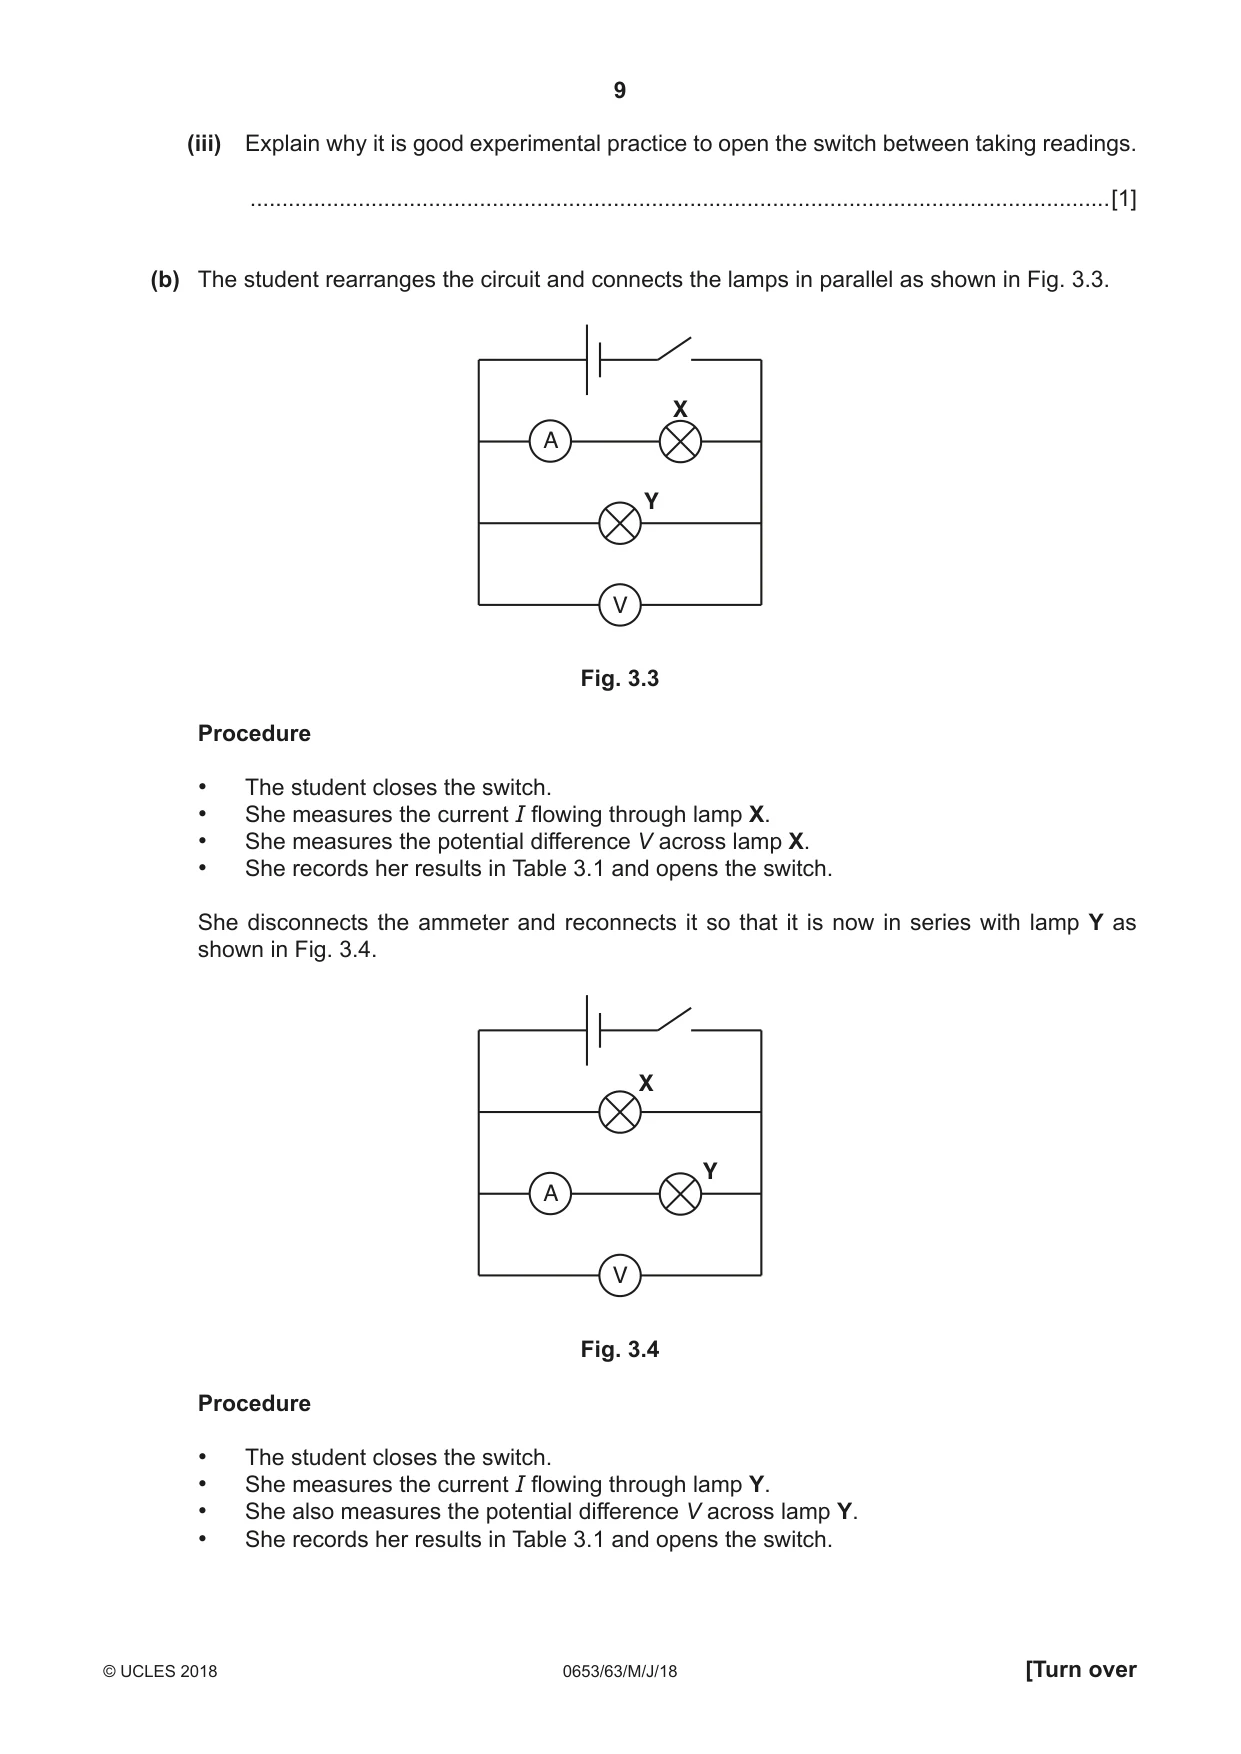
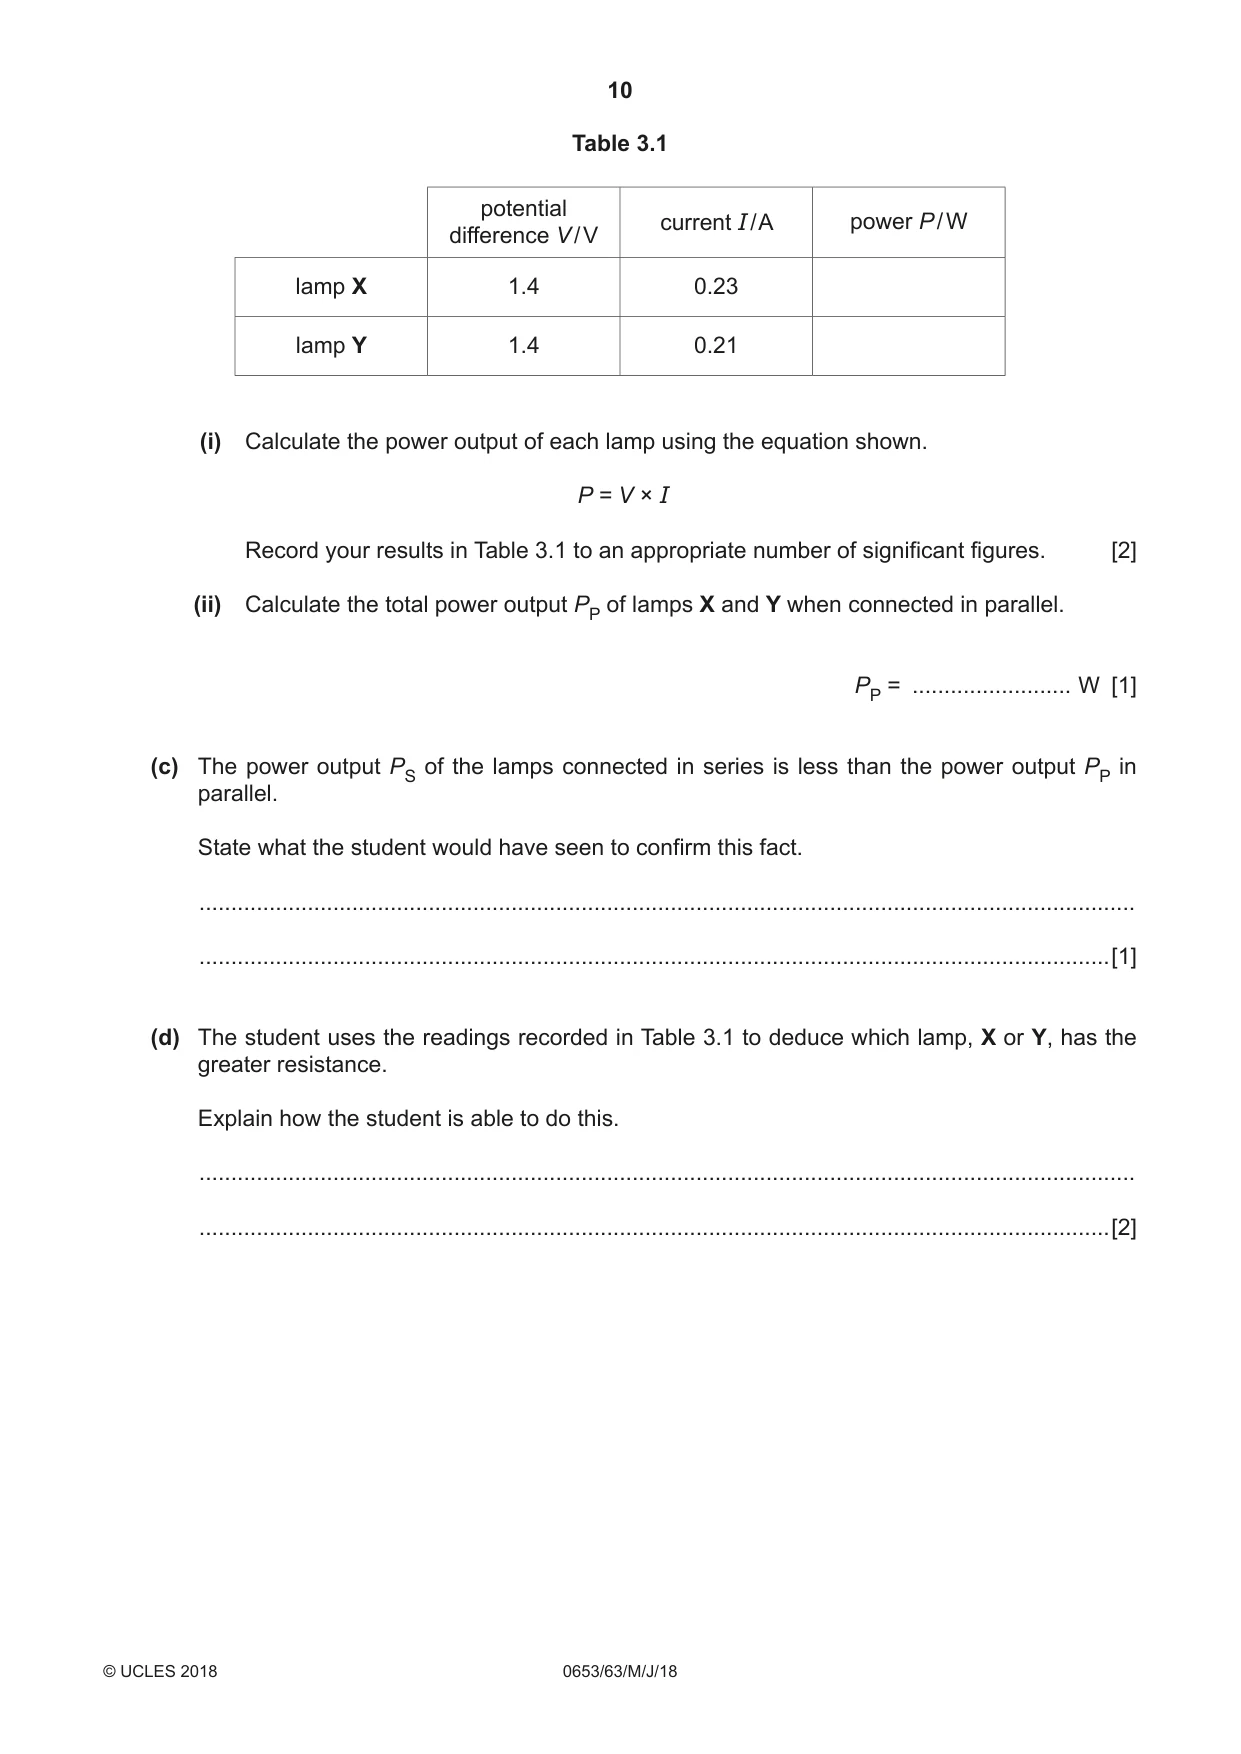
3 A student investigates the power output of lamps connected in series and in parallel. She sets up the series circuit shown in Fig. 3.1. A X Y V Fig. 3.1 (a) Procedure • The student closes the switch. • She measures the current I flowing through the lamps. • She measures the potential difference V across both lamps. • She opens the switch. Fig. 3.2 shows the scales of the ammeter and voltmeter. 0.4 0.6 2 3 0.2 0.8 1 4 0 1 0 5 A V Fig. 3.2 (i) Read the scales and record the current I and the potential difference V. current I = ............................... A potential difference V = ............................... V [2] (ii) Calculate the combined power output PS of lamps X and Y when connected in series using the equation shown. PS = V × I PS = ......................... W [1] (iii) Explain why it is good experimental practice to open the switch between taking readings. .......................................................................................................................................[1] (b) The student rearranges the circuit and connects the lamps in parallel as shown in Fig. 3.3. X A Y V Fig. 3.3 Procedure • The student closes the switch. • She measures the current I flowing through lamp X. • She measures the potential difference V across lamp X. • She records her results in Table 3.1 and opens the switch. She disconnects the ammeter and reconnects it so that it is now in series with lamp Y as shown in Fig. 3.4. X Y A V Fig. 3.4 Procedure • The student closes the switch. • She measures the current I flowing through lamp Y. • She also measures the potential difference V across lamp Y. • She records her results in Table 3.1 and opens the switch. Table 3.1 potential current I / A power P / W difference V / V lamp X 1.4 0.23 lamp Y 1.4 0.21 (i) Calculate the power output of each lamp using the equation shown. P = V × I Record your results in Table 3.1 to an appropriate number of significant figures. [2] (ii) Calculate the total power output PP of lamps X and Y when connected in parallel. PP = ......................... W [1] (c) The power output PS of the lamps connected in series is less than the power output PP in parallel. State what the student would have seen to confirm this fact. ................................................................................................................................................... ...............................................................................................................................................[1] (d) The student uses the readings recorded in Table 3.1 to deduce which lamp, X or Y, has the greater resistance. Explain how the student is able to do this. ................................................................................................................................................... ...............................................................................................................................................[2]
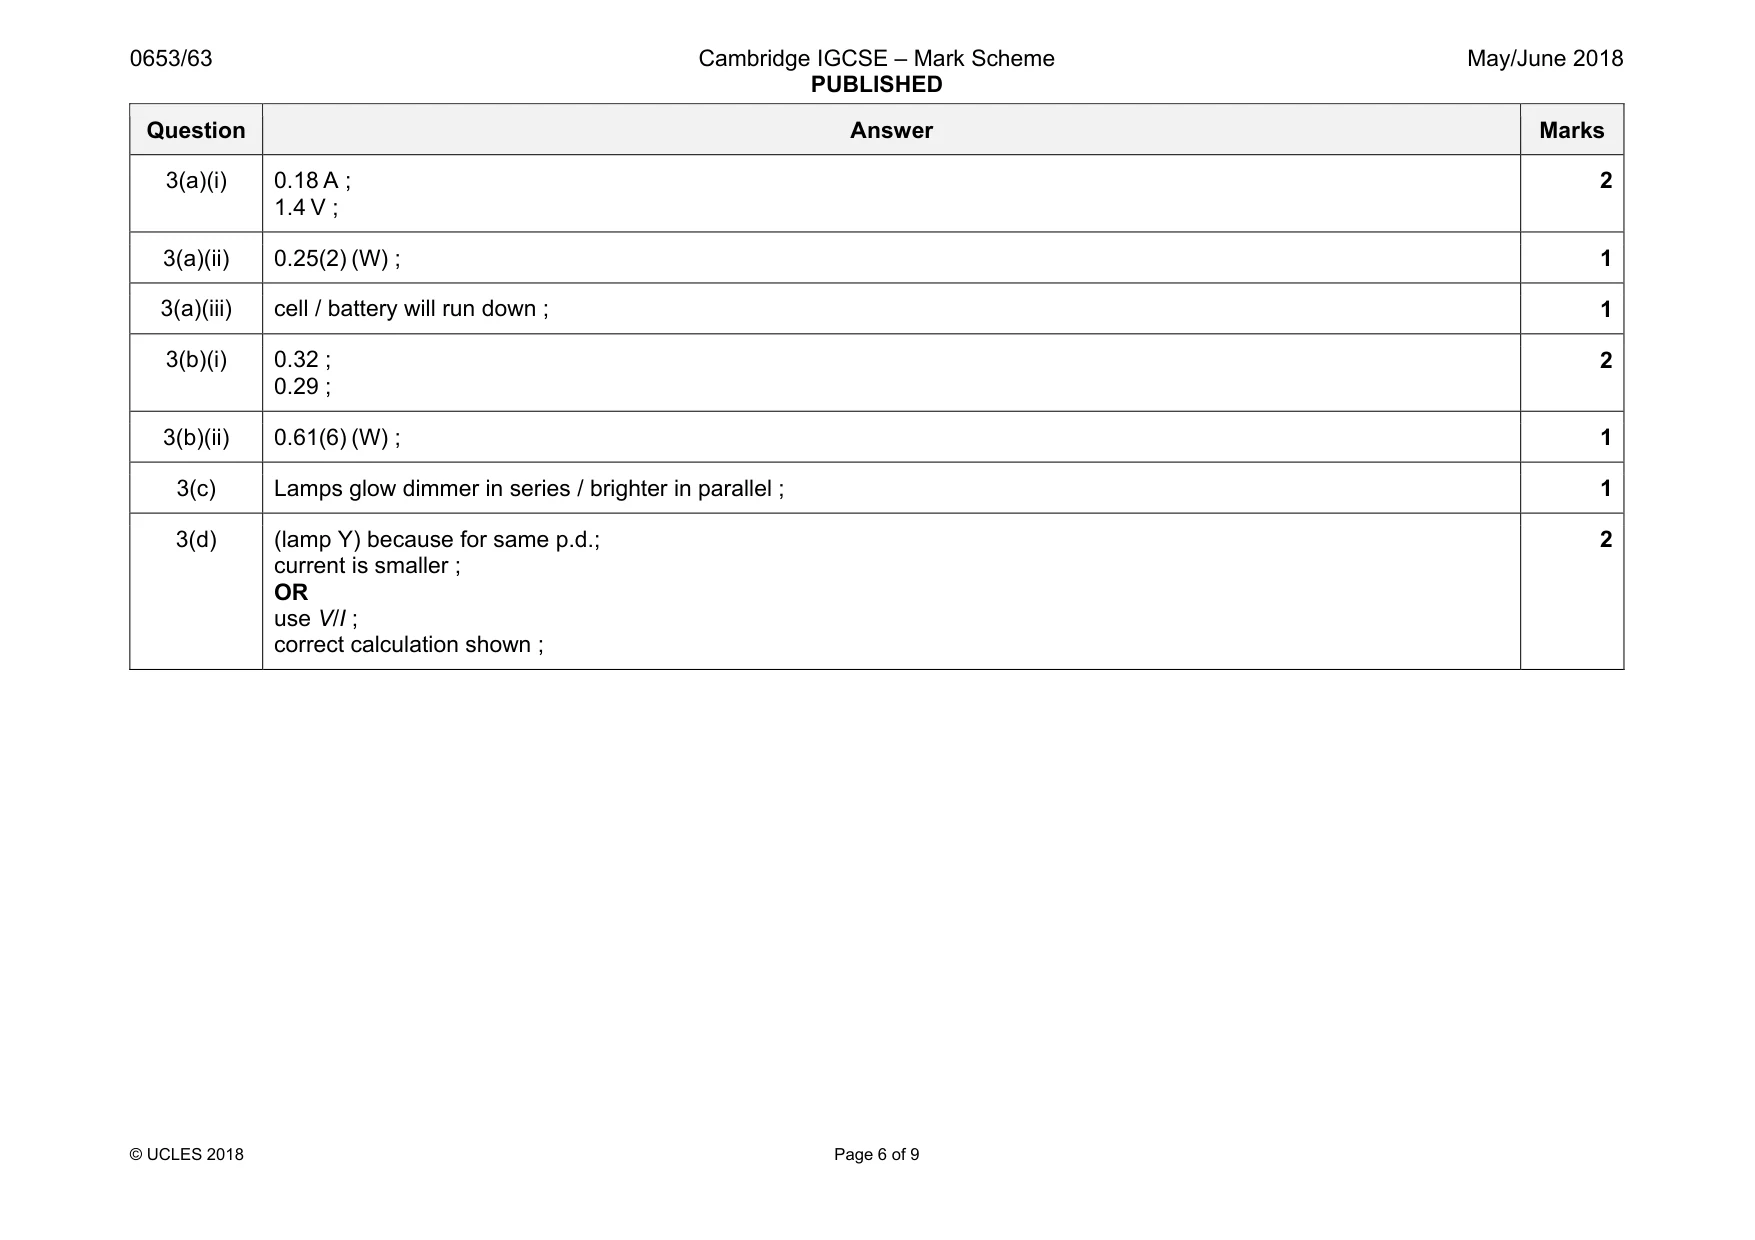
Mark scheme: 3(a)(i) 0.18 A ; 1.4 V ; 2 3(a)(ii) 0.25(2) (W) ; 1 3(a)(iii) cell / battery will run down ; 1 3(b)(i) 0.32 ; 0.29 ; 2 3(b)(ii) 0.61(6) (W) ; 1 3(c) Lamps glow dimmer in series / brighter in parallel ; 1 3(d) (lamp Y) because for same p.d.; current is smaller ; OR use V/I ; correct calculation shown ; 2
Q4 · A student investigates the effects of physical activity on breathing
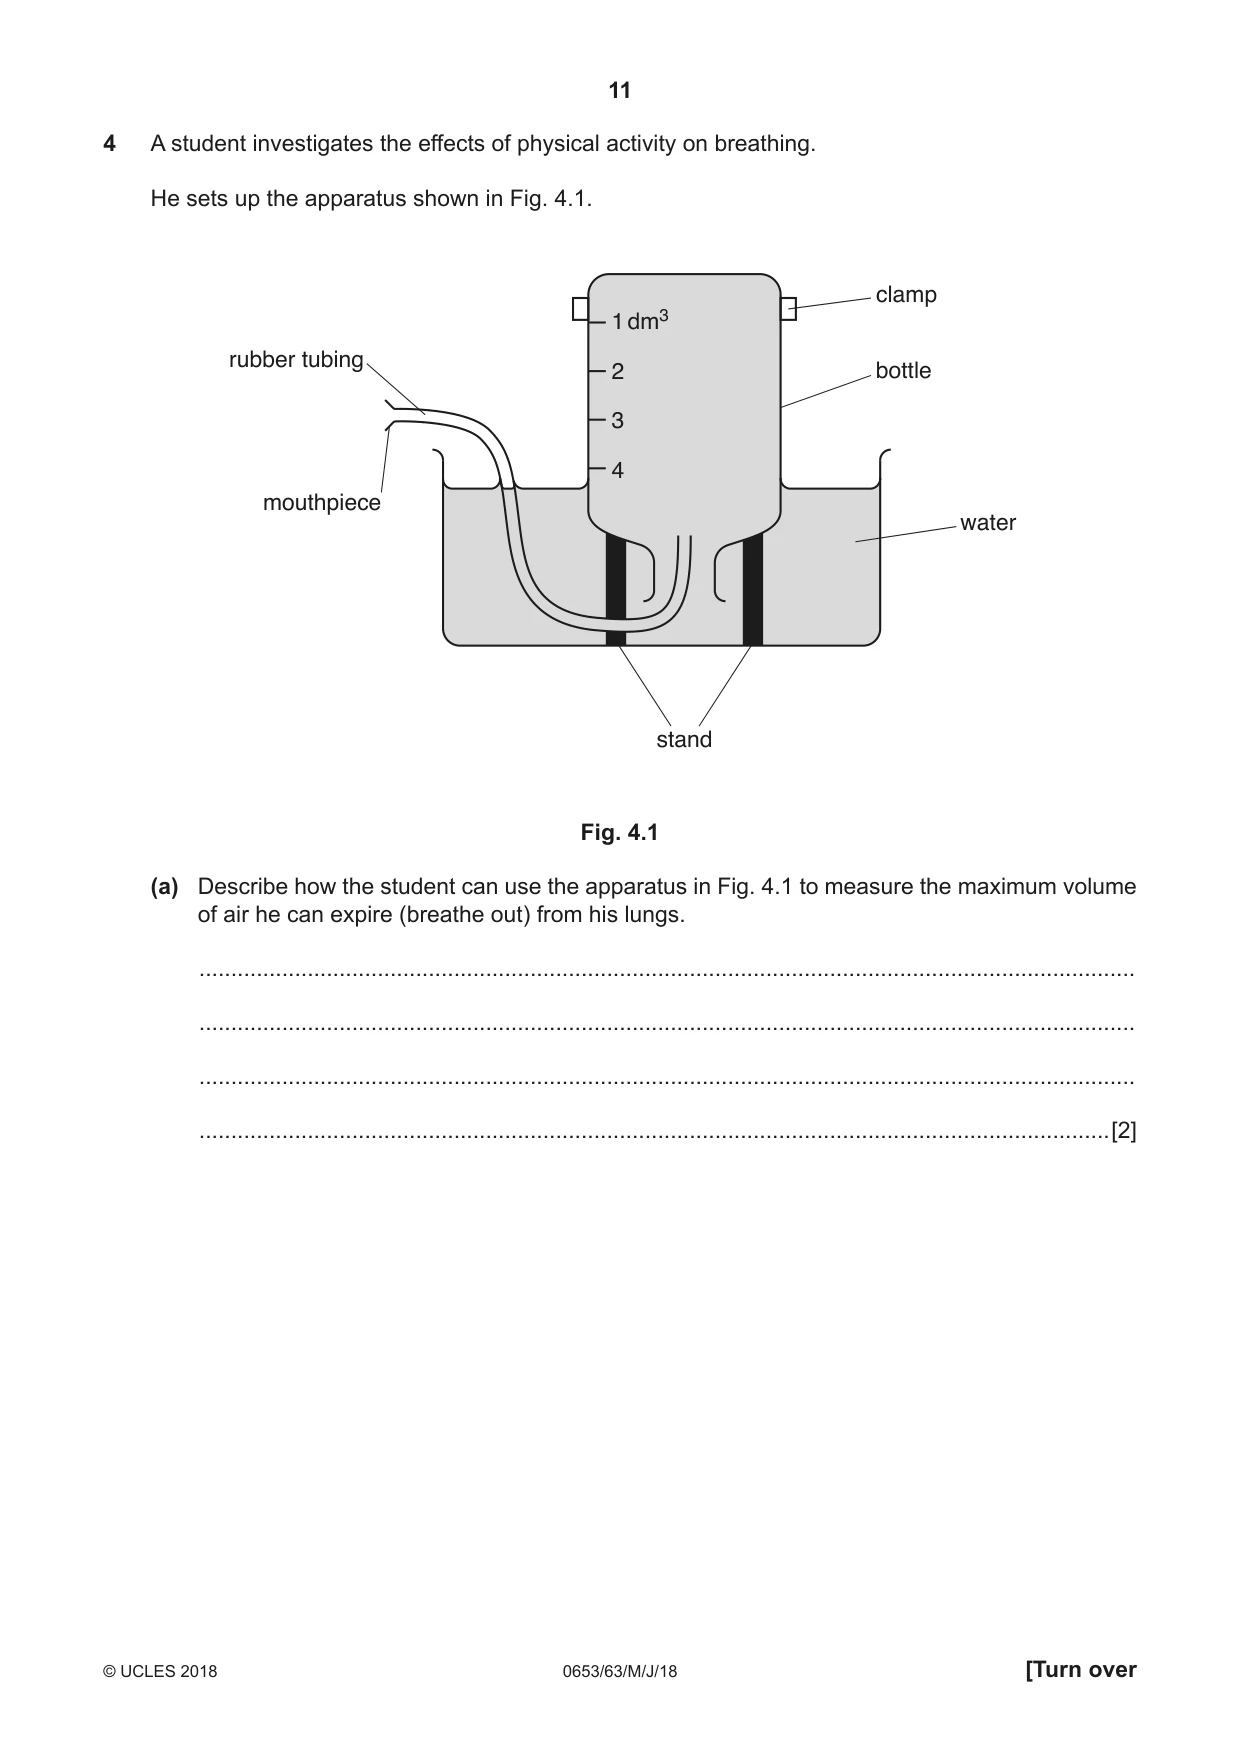
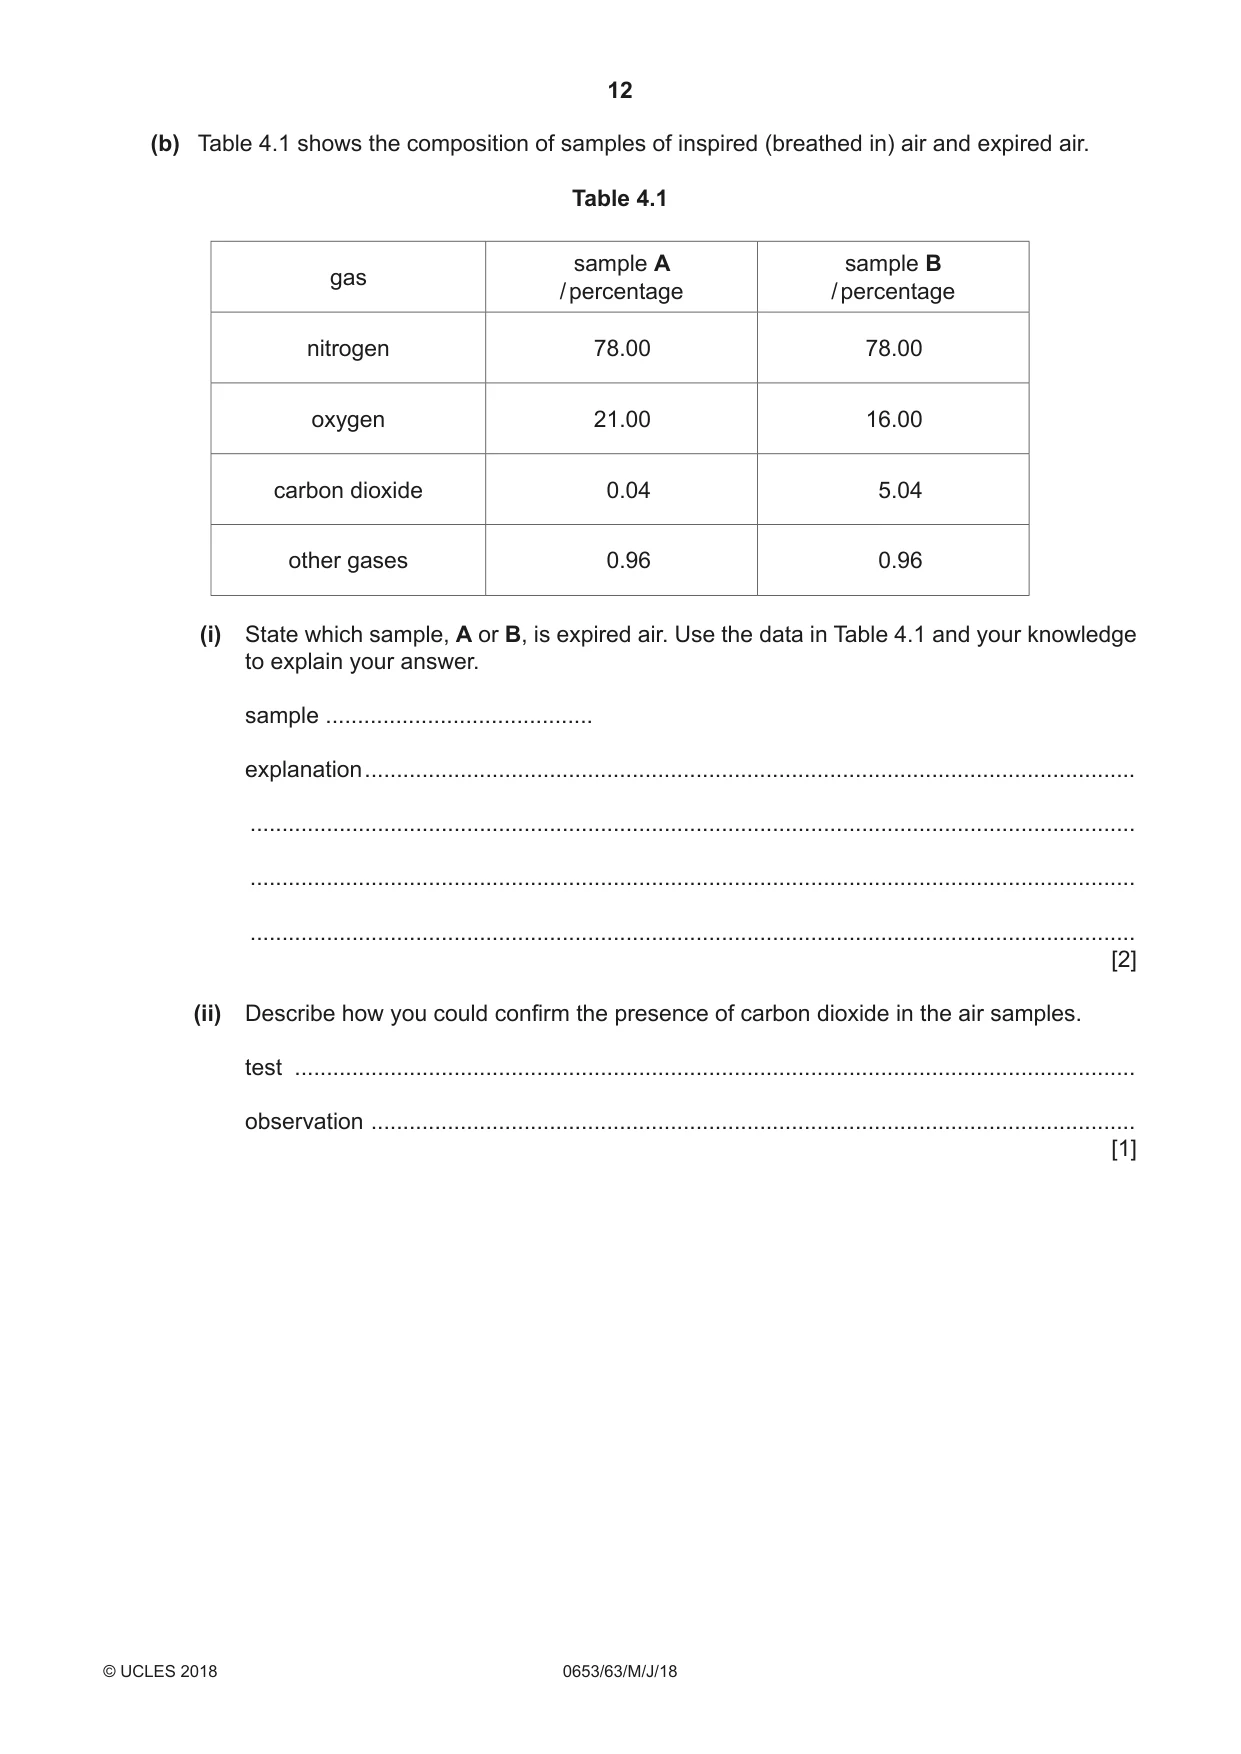
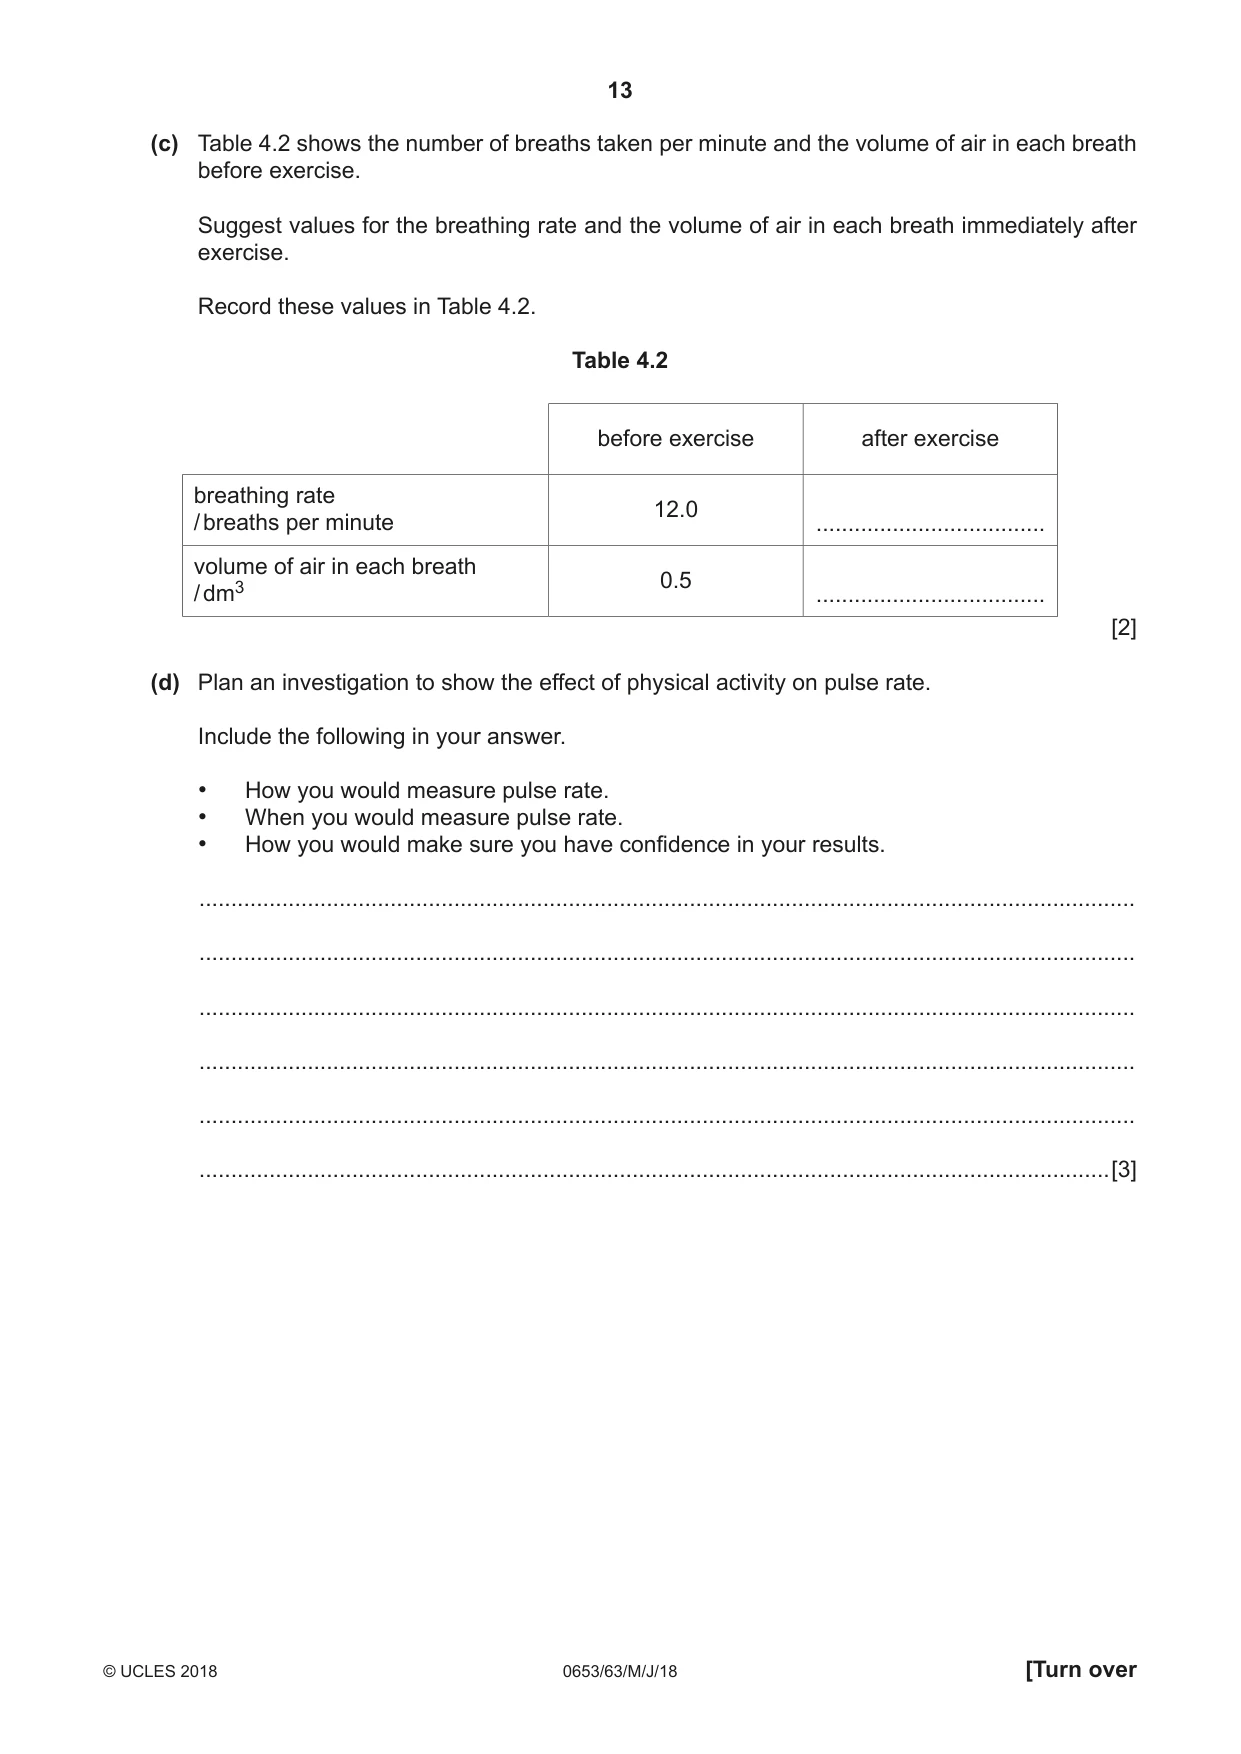
4 A student investigates the effects of physical activity on breathing. He sets up the apparatus shown in Fig. 4.1. clamp 1 dm3 rubber tubing 2 bottle 3 4 mouthpiece water stand Fig. 4.1 (a) Describe how the student can use the apparatus in Fig. 4.1 to measure the maximum volume of air he can expire (breathe out) from his lungs. ................................................................................................................................................... ................................................................................................................................................... ................................................................................................................................................... ...............................................................................................................................................[2] (b) Table 4.1 shows the composition of samples of inspired (breathed in) air and expired air. Table 4.1 sample A sample B gas / percentage / percentage nitrogen 78.00 78.00 oxygen 21.00 16.00 carbon dioxide 0.04 5.04 other gases 0.96 0.96 (i) State which sample, A or B, is expired air. Use the data in Table 4.1 and your knowledge to explain your answer. sample .......................................... explanation ......................................................................................................................... ........................................................................................................................................... ........................................................................................................................................... ........................................................................................................................................... [2] (ii) Describe how you could confirm the presence of carbon dioxide in the air samples. test .................................................................................................................................... observation ........................................................................................................................ [1] (c) Table 4.2 shows the number of breaths taken per minute and the volume of air in each breath before exercise. Suggest values for the breathing rate and the volume of air in each breath immediately after exercise. Record these values in Table 4.2. Table 4.2 before exercise after exercise breathing rate 12.0 / breaths per minute .................................... volume of air in each breath 0.5 / dm3 .................................... [2] (d) Plan an investigation to show the effect of physical activity on pulse rate. Include the following in your answer. • How you would measure pulse rate. • When you would measure pulse rate. • How you would make sure you have confidence in your results. ................................................................................................................................................... ................................................................................................................................................... ................................................................................................................................................... ................................................................................................................................................... ................................................................................................................................................... ...............................................................................................................................................[3]
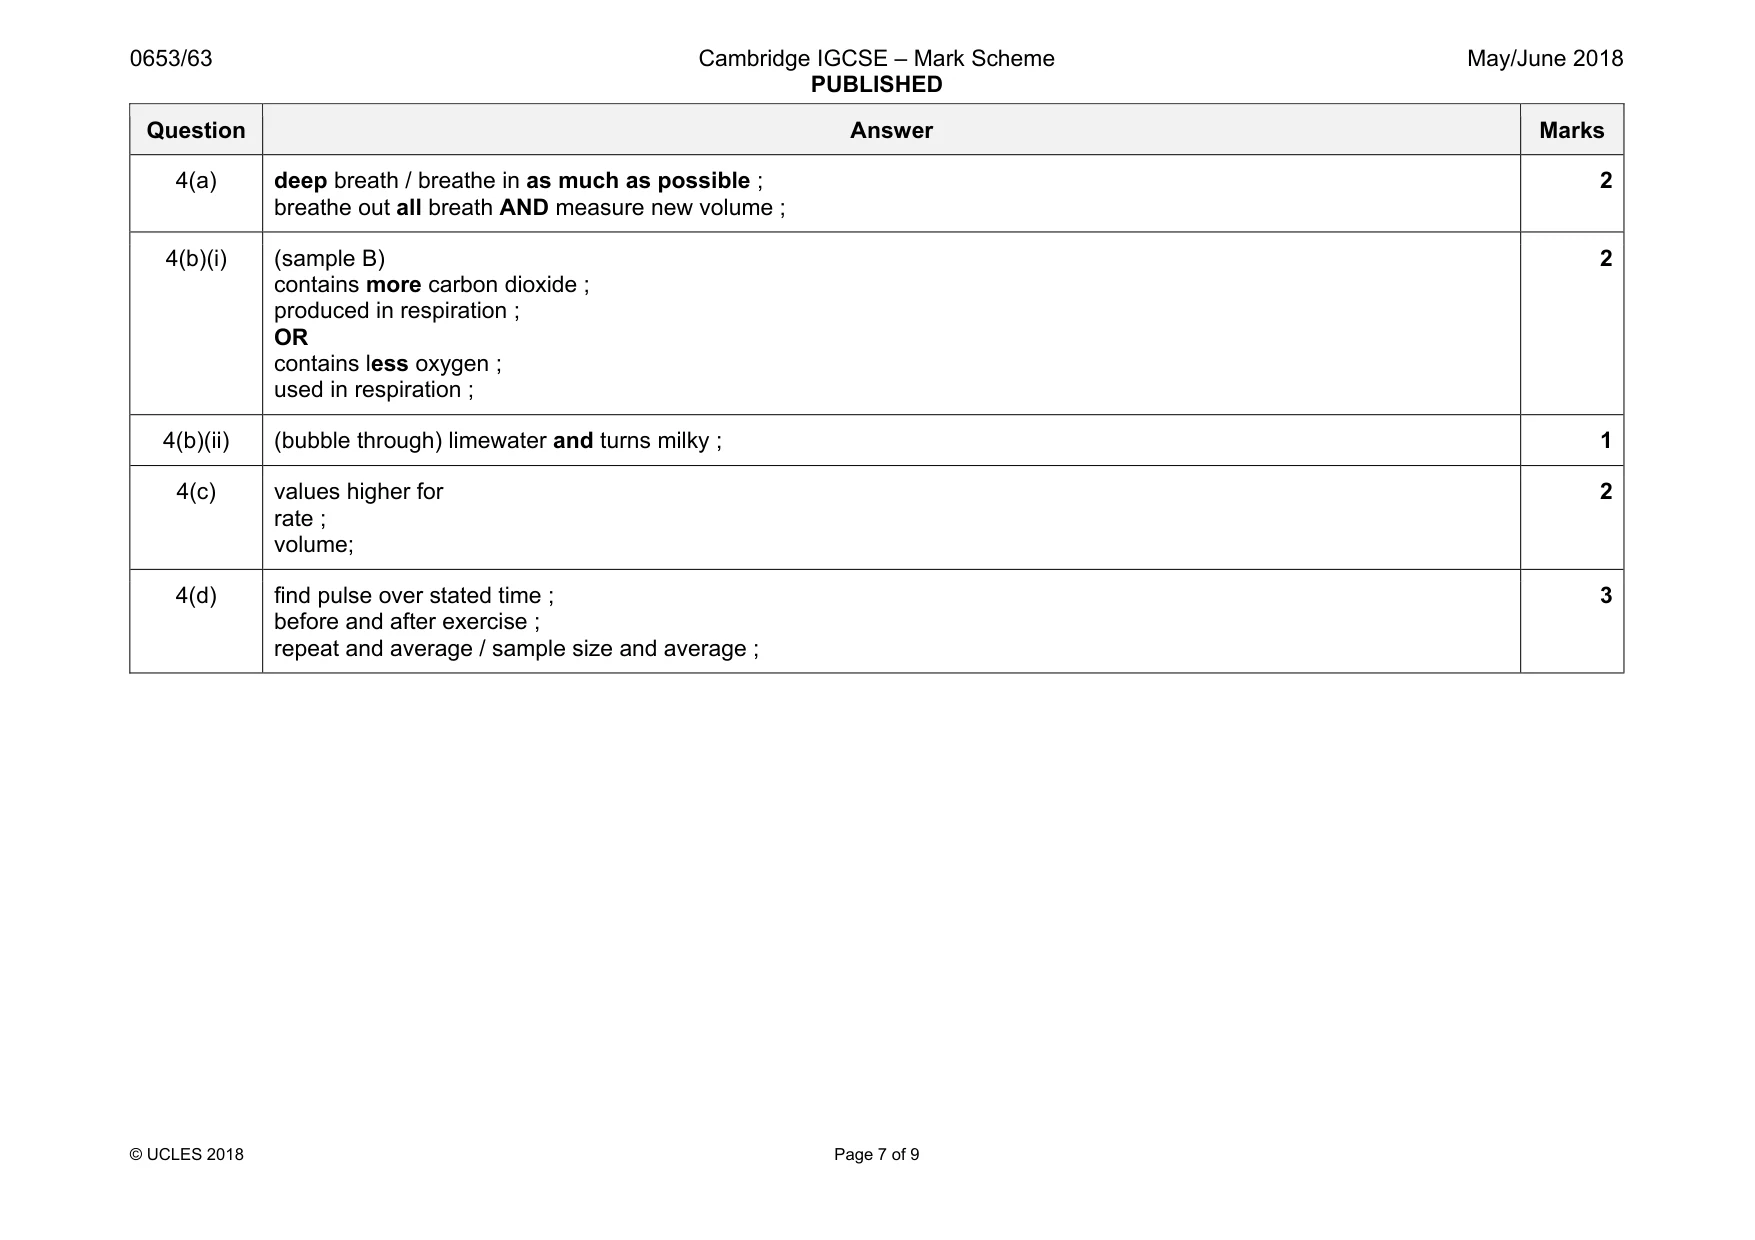
Mark scheme: 4(a) deep breath / breathe in as much as possible ; breathe out all breath AND measure new volume ; 2 4(b)(i) (sample B) contains more carbon dioxide ; produced in respiration ; OR contains less oxygen ; used in respiration ; 2 4(b)(ii) (bubble through) limewater and turns milky ; 1 4(c) values higher for rate ; volume; 2 4(d) find pulse over stated time ; before and after exercise ; repeat and average / sample size and average ; 3
Q5 · A group of students investigate the electrolysis of aqueous copper chloride using inert…
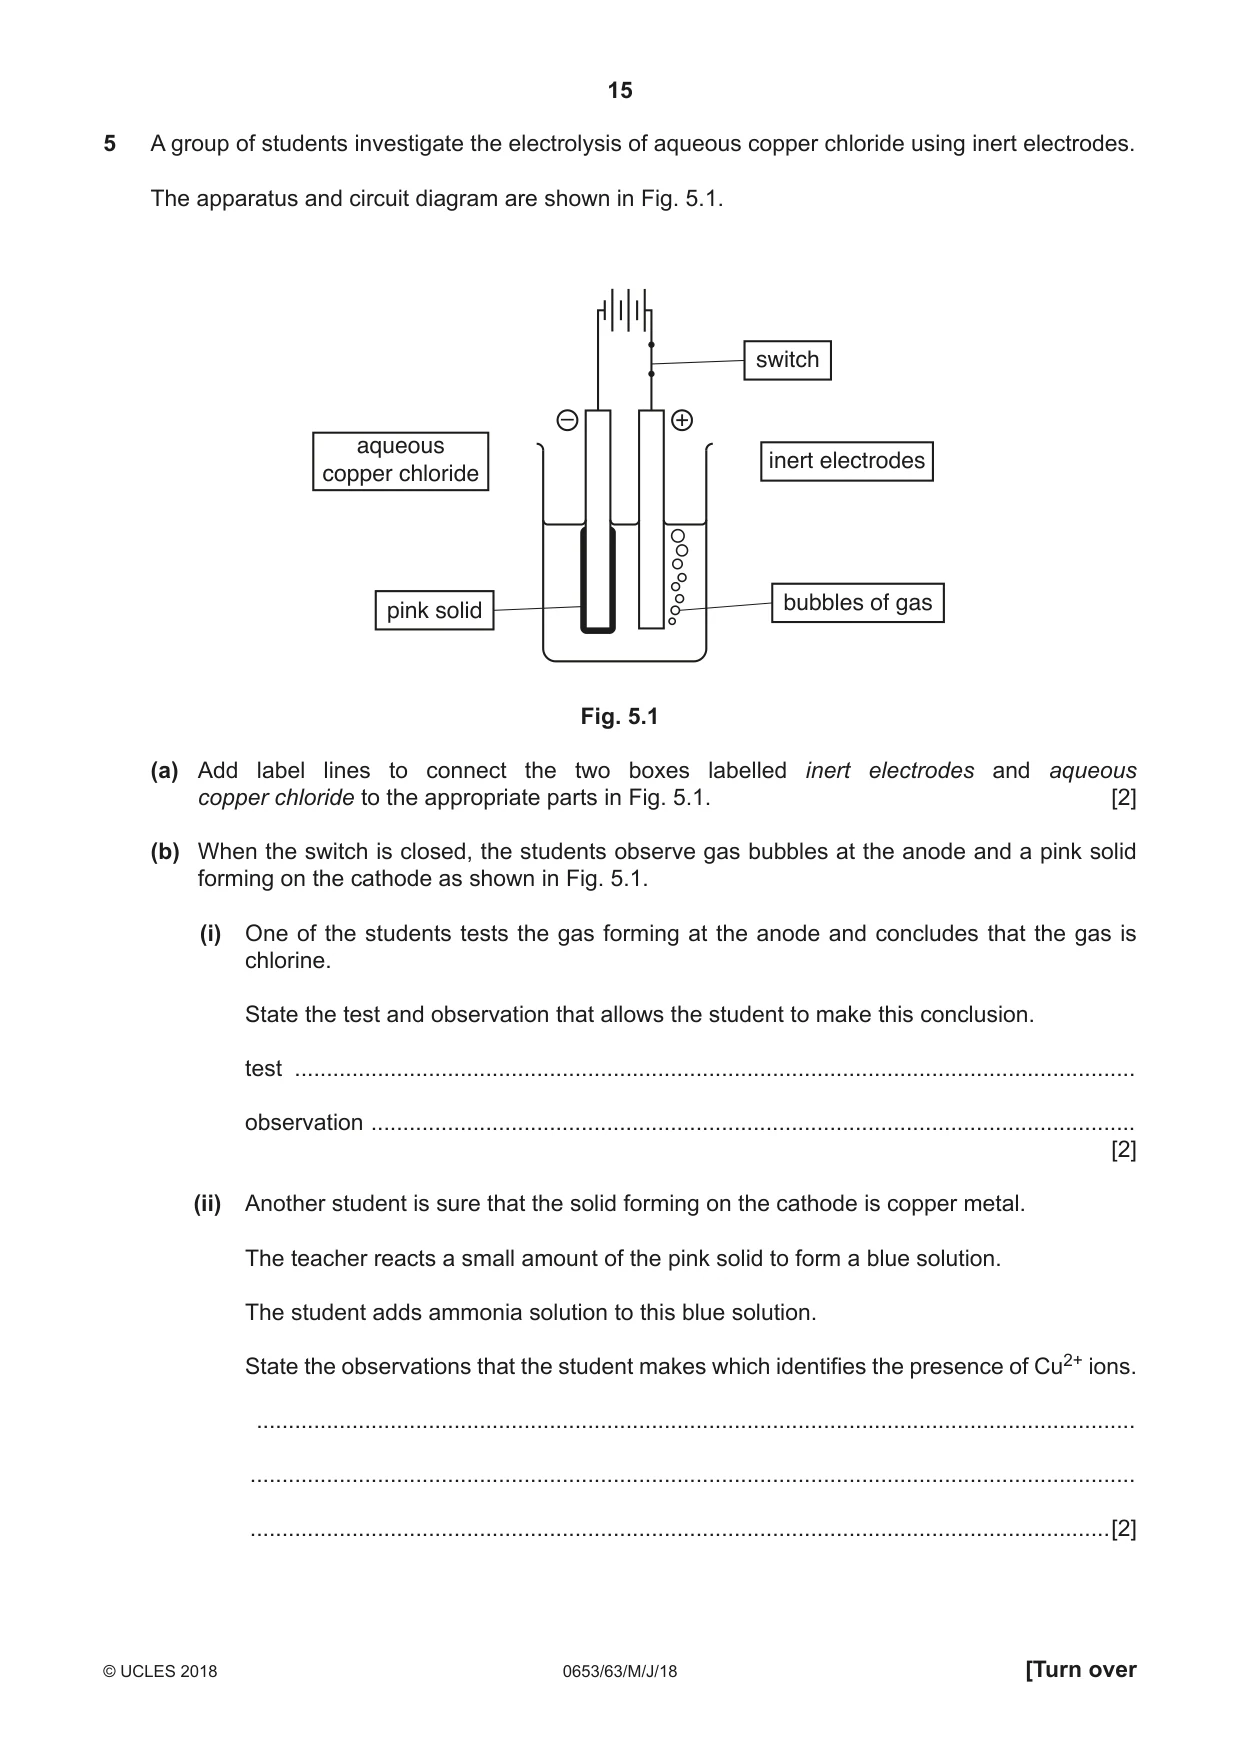
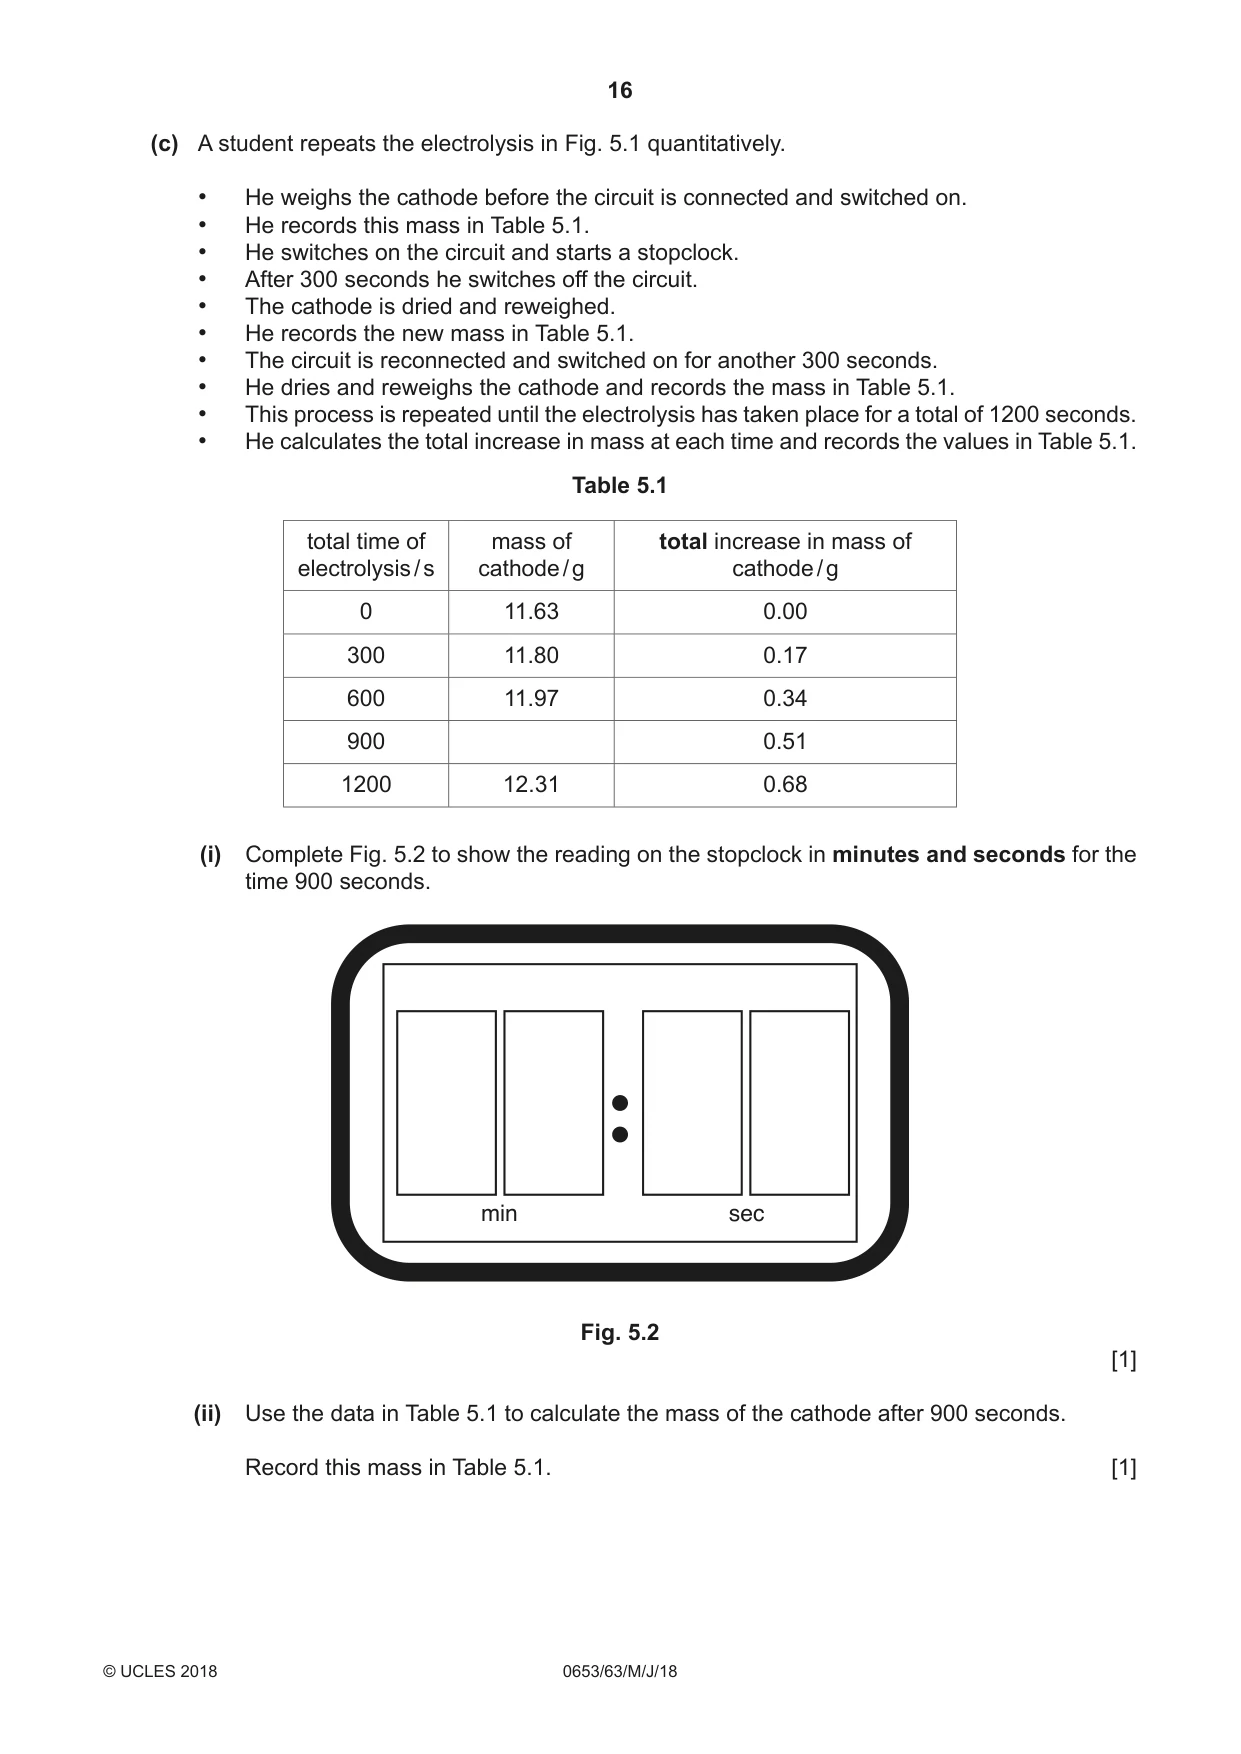
5 A group of students investigate the electrolysis of aqueous copper chloride using inert electrodes. The apparatus and circuit diagram are shown in Fig. 5.1. switch – + aqueous inert electrodes copper chloride bubbles of gas pink solid Fig. 5.1 (a) Add label lines to connect the two boxes labelled inert electrodes and aqueous copper chloride to the appropriate parts in Fig. 5.1. [2] (b) When the switch is closed, the students observe gas bubbles at the anode and a pink solid forming on the cathode as shown in Fig. 5.1. (i) One of the students tests the gas forming at the anode and concludes that the gas is chlorine. State the test and observation that allows the student to make this conclusion. test .................................................................................................................................... observation ........................................................................................................................ [2] (ii) Another student is sure that the solid forming on the cathode is copper metal. The teacher reacts a small amount of the pink solid to form a blue solution. The student adds ammonia solution to this blue solution. State the observations that the student makes which identifies the presence of Cu2+ ions. .......................................................................................................................................... ........................................................................................................................................... .......................................................................................................................................[2] (c) A student repeats the electrolysis in Fig. 5.1 quantitatively. • He weighs the cathode before the circuit is connected and switched on. • He records this mass in Table 5.1. • He switches on the circuit and starts a stopclock. • After 300 seconds he switches off the circuit. • The cathode is dried and reweighed. • He records the new mass in Table 5.1. • The circuit is reconnected and switched on for another 300 seconds. • He dries and reweighs the cathode and records the mass in Table 5.1. • This process is repeated until the electrolysis has taken place for a total of 1200 seconds. • He calculates the total increase in mass at each time and records the values in Table 5.1. Table 5.1 total time of mass of total increase in mass of electrolysis / s cathode / g cathode / g 0 11.63 0.00 300 11.80 0.17 600 11.97 0.34 900 0.51 1200 12.31 0.68 (i) Complete Fig. 5.2 to show the reading on the stopclock in minutes and seconds for the time 900 seconds. min sec Fig. 5.2 [1] (ii) Use the data in Table 5.1 to calculate the mass of the cathode after 900 seconds. Record this mass in Table 5.1. [1] (iii) Use the data in Table 5.1 to describe the relationship between the total time of electrolysis and the total mass of copper deposited at the cathode. Show how you have used the data to find this relationship. ........................................................................................................................................... ........................................................................................................................................... ........................................................................................................................................... .......................................................................................................................................[2]
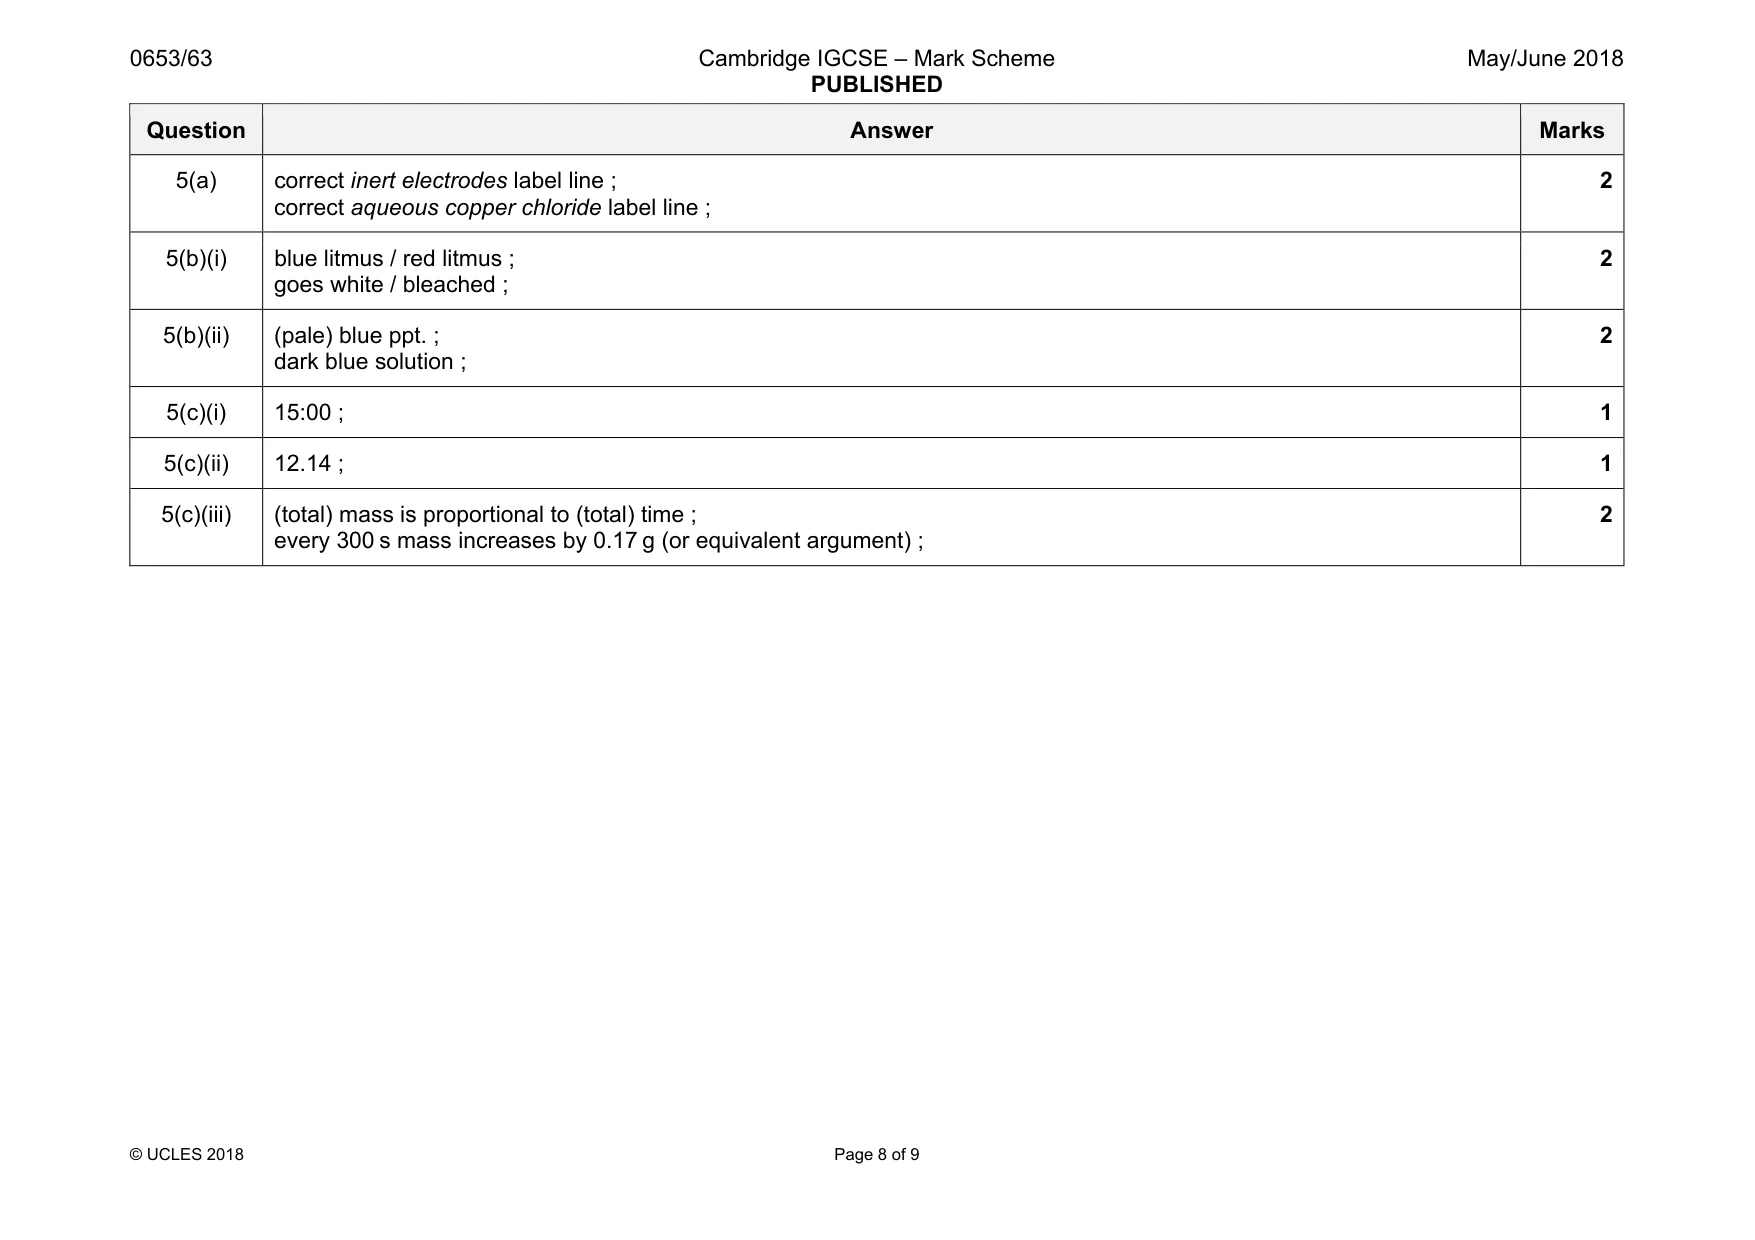
Mark scheme: 5(a) correct inert electrodes label line ; correct aqueous copper chloride label line ; 2 5(b)(i) blue litmus / red litmus ; goes white / bleached ; 2 5(b)(ii) (pale) blue ppt. ; dark blue solution ; 2 5(c)(i) 15:00 ; 1 5(c)(ii) 12.14 ; 1 5(c)(iii) (total) mass is proportional to (total) time ; every 300 s mass increases by 0.17 g (or equivalent argument) ; 2
Q6 · A student performs an experiment to measure an approximate value for the specific heat…
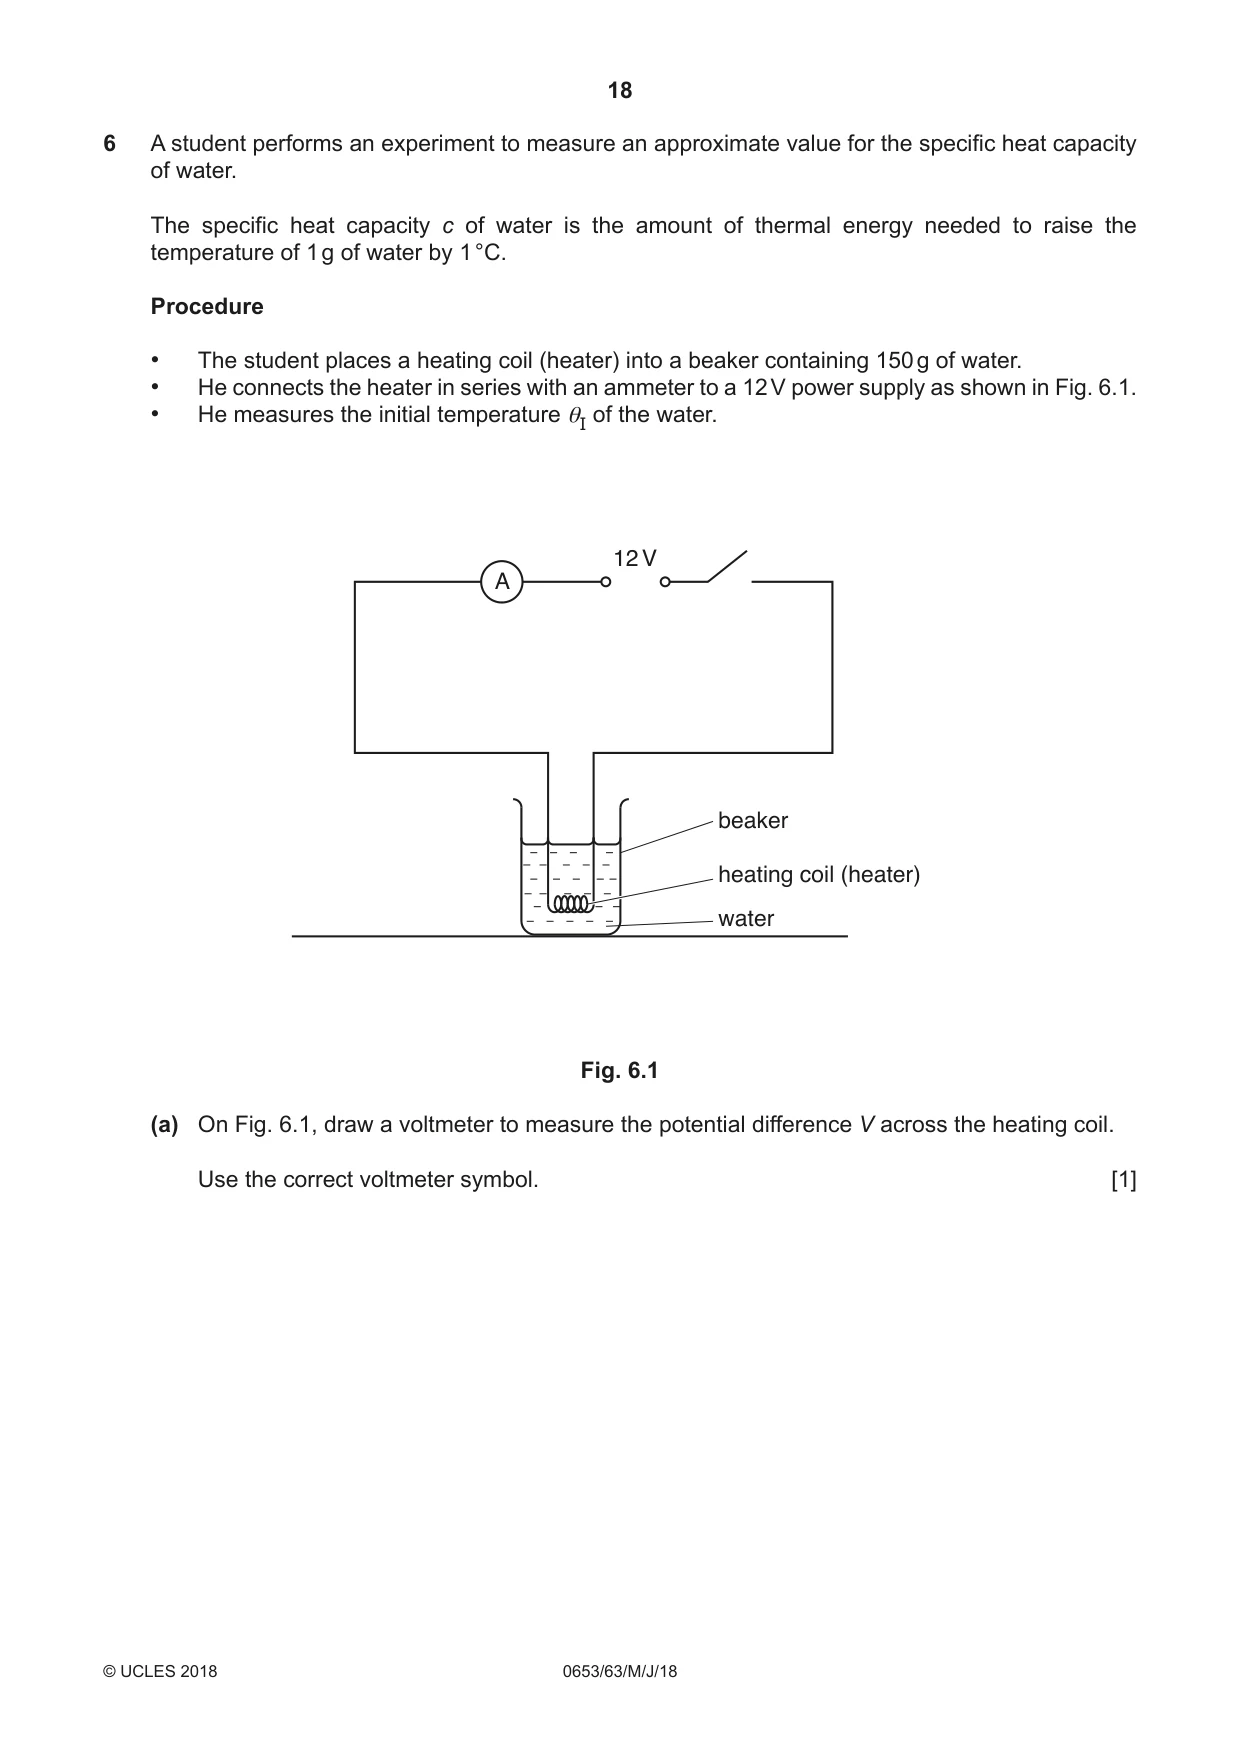
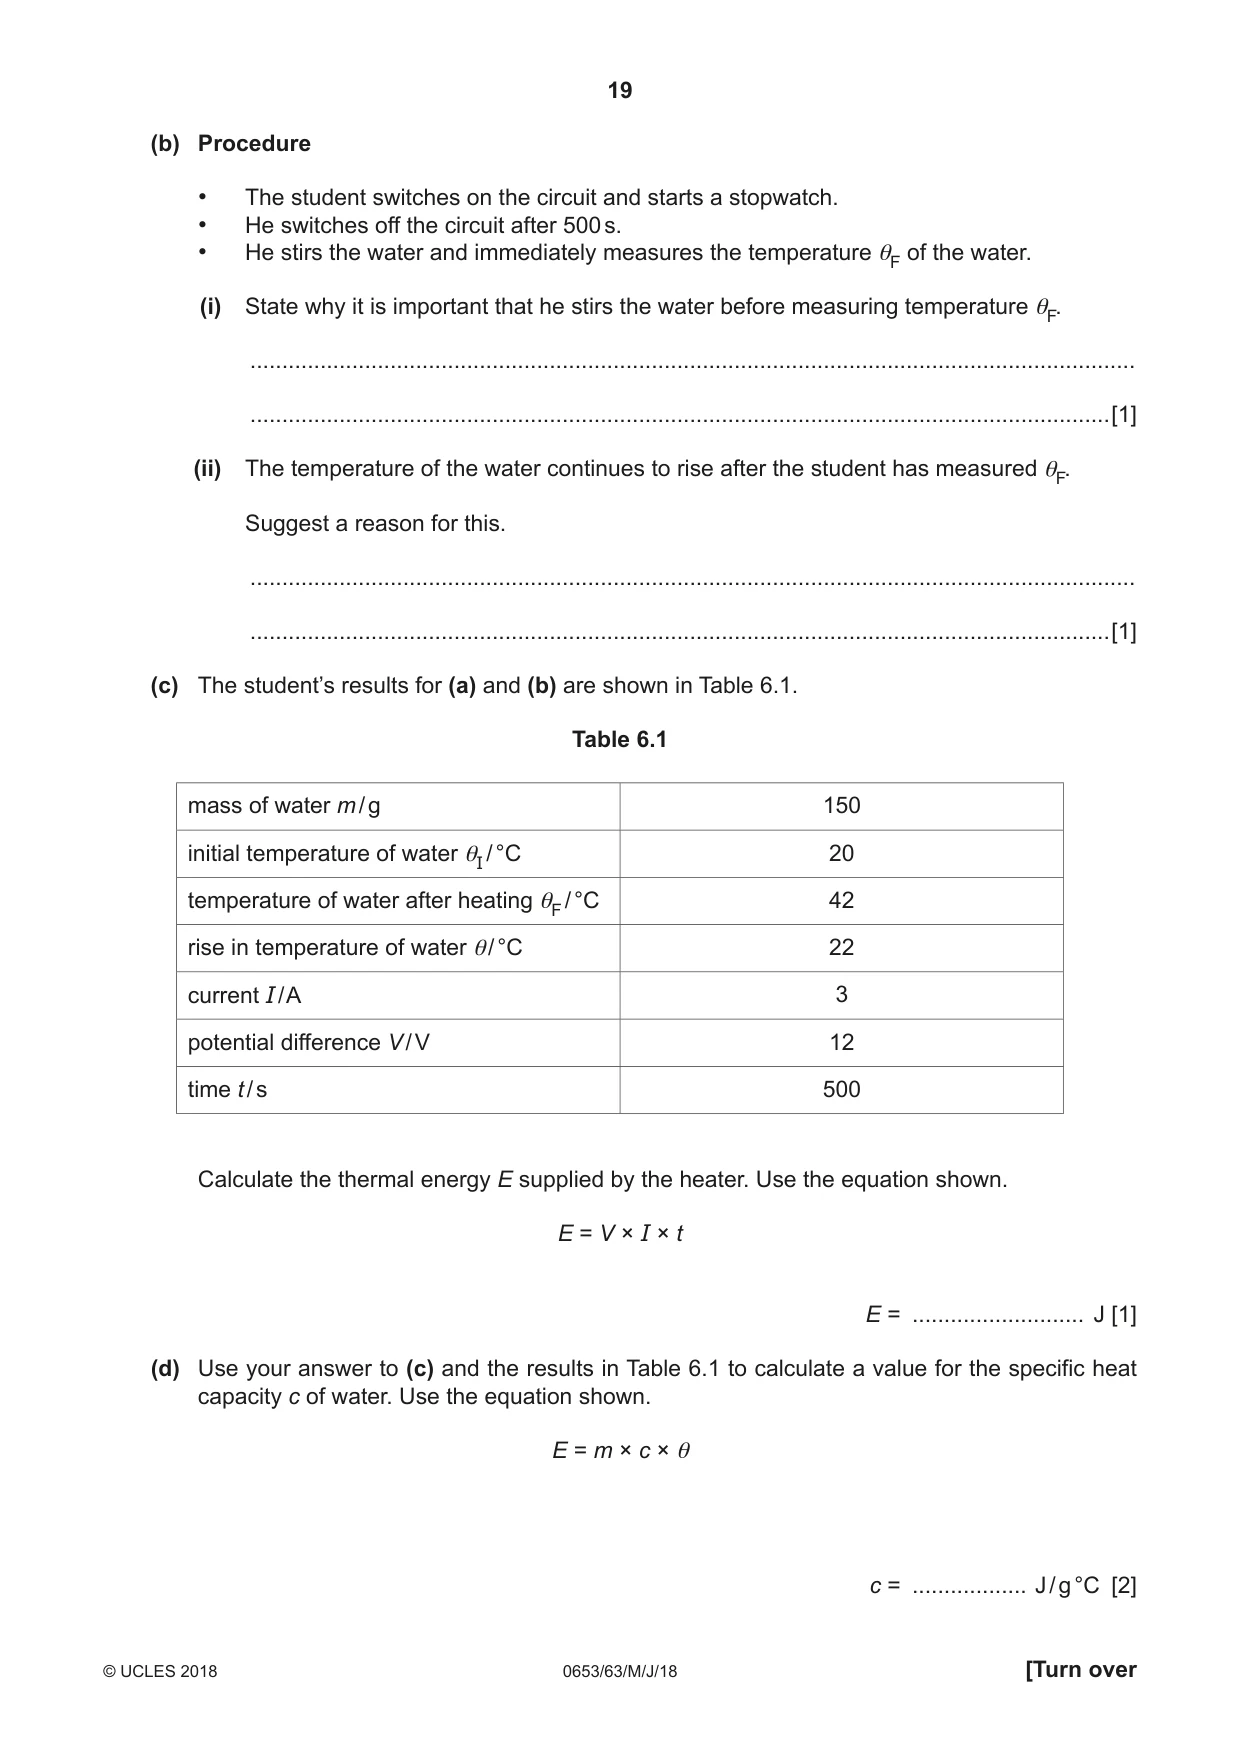
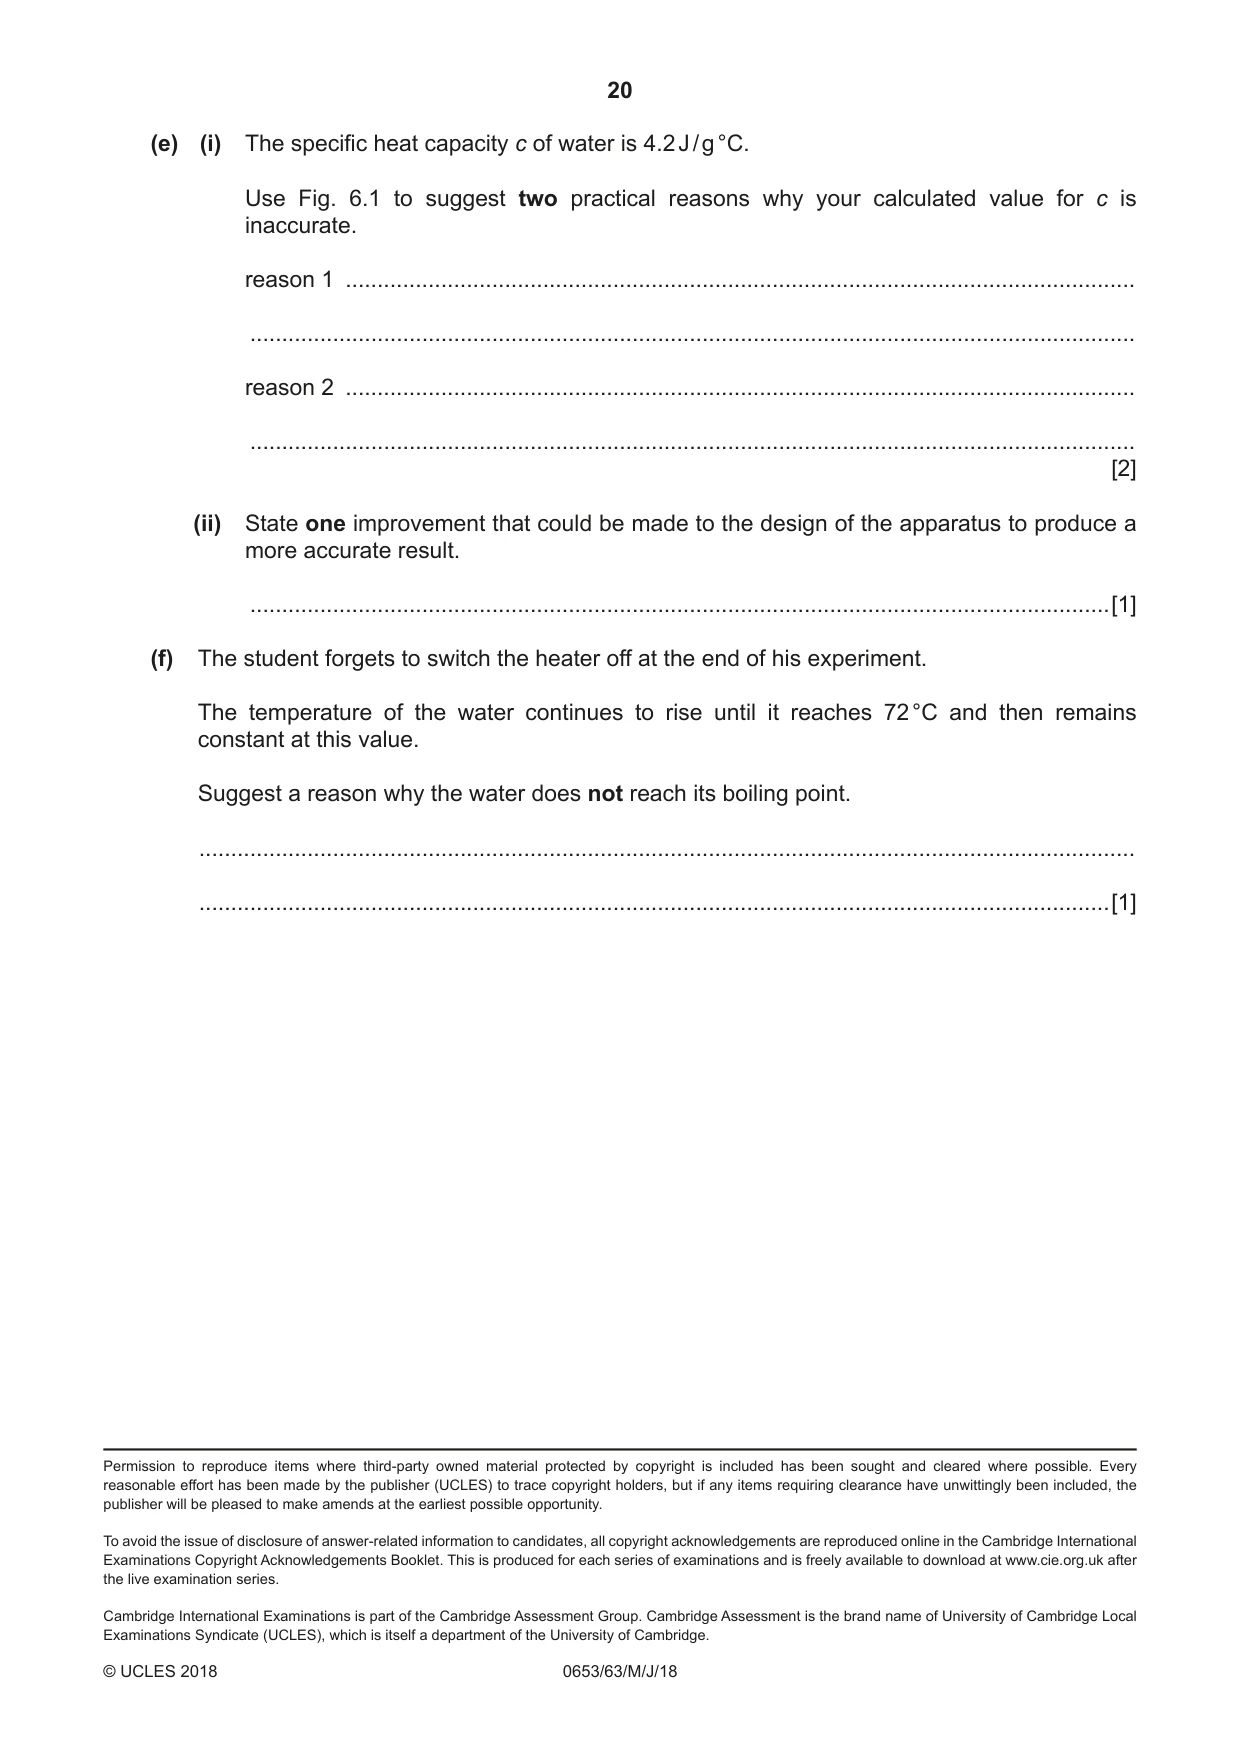
6 A student performs an experiment to measure an approximate value for the specific heat capacity of water. The specific heat capacity c of water is the amount of thermal energy needed to raise the temperature of 1 g of water by 1 °C. Procedure • The student places a heating coil (heater) into a beaker containing 150 g of water. • He connects the heater in series with an ammeter to a 12 V power supply as shown in Fig. 6.1. • He measures the initial temperature θI of the water. 12 V A beaker heating coil (heater) water Fig. 6.1 (a) On Fig. 6.1, draw a voltmeter to measure the potential difference V across the heating coil. Use the correct voltmeter symbol. [1] (b) Procedure • The student switches on the circuit and starts a stopwatch. • He switches off the circuit after 500 s. • He stirs the water and immediately measures the temperature θF of the water. (i) State why it is important that he stirs the water before measuring temperature θF. ........................................................................................................................................... .......................................................................................................................................[1] (ii) The temperature of the water continues to rise after the student has measured θF. Suggest a reason for this. ........................................................................................................................................... .......................................................................................................................................[1] (c) The student’s results for (a) and (b) are shown in Table 6.1. Table 6.1 mass of water m / g 150 initial temperature of water θI / °C 20 temperature of water after heating θF / °C 42 rise in temperature of water θ/ °C 22 current I / A 3 potential difference V / V 12 time t / s 500 Calculate the thermal energy E supplied by the heater. Use the equation shown. E = V × I × t E = ........................... J [1] (d) Use your answer to (c) and the results in Table 6.1 to calculate a value for the specific heat capacity c of water. Use the equation shown. E = m × c × θ c = .................. J / g °C [2] (e) (i) The specific heat capacity c of water is 4.2 J / g °C. Use Fig. 6.1 to suggest two practical reasons why your calculated value for c is inaccurate. reason 1 ............................................................................................................................ ........................................................................................................................................... reason 2 ............................................................................................................................ ........................................................................................................................................... [2] (ii) State one improvement that could be made to the design of the apparatus to produce a more accurate result. .......................................................................................................................................[1] (f) The student forgets to switch the heater off at the end of his experiment. The temperature of the water continues to rise until it reaches 72 °C and then remains constant at this value. Suggest a reason why the water does not reach its boiling point. ................................................................................................................................................... ...............................................................................................................................................[1]
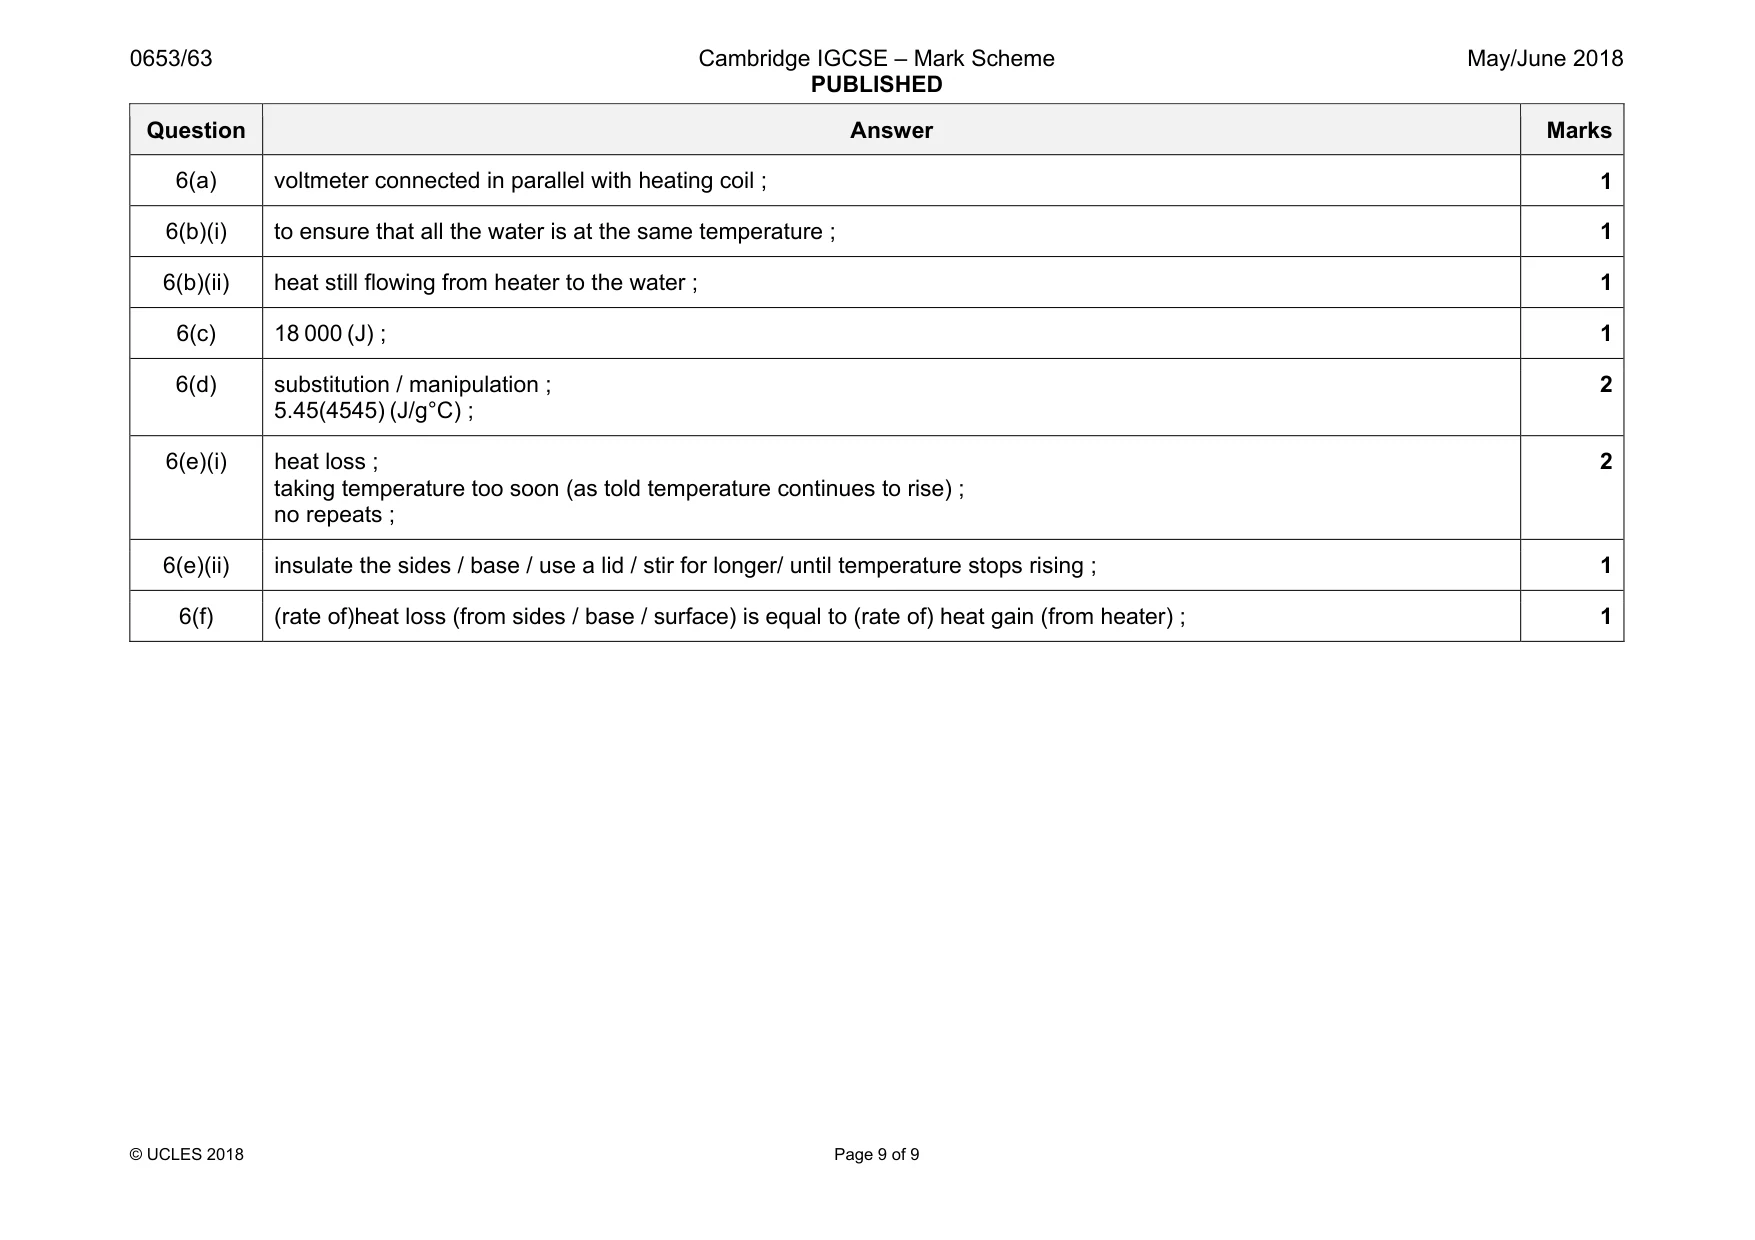
Mark scheme: 6(a) voltmeter connected in parallel with heating coil ; 1 6(b)(i) to ensure that all the water is at the same temperature ; 1 6(b)(ii) heat still flowing from heater to the water ; 1 6(c) 18 000 (J) ; 1 6(d) substitution / manipulation ; 5.45(4545) (J/g°C) ; 2 6(e)(i) heat loss ; taking temperature too soon (as told temperature continues to rise) ; no repeats ; 2 6(e)(ii) insulate the sides / base / use a lid / stir for longer/ until temperature stops rising ; 1 6(f) (rate of)heat loss (from sides / base / surface) is equal to (rate of) heat gain (from heater) ; 1
What was in this paper
The subtopics covered by these 6 questions, and how many questions each got. Open one in a new tab to see every Cambridge question on it.
What you needed in this session
Cambridge’s own grade thresholds for 2018 May/June, Paper 6 · Variant 3. A higher threshold means an easier paper — the bar moves with how the cohort did.