Cambridge IGCSE Science - Combined 0653 — 2018 May/June Paper 6 · Variant 1
0653/61/M/J/18 · 6 questions · 60 marks · ≈68 min
The question paper and its mark scheme, free to read here and free to download. This is Cambridge’s own paper, exactly as it was sat.
Question paper20 pages




Mark scheme9 pages
Answers below. Sit the paper first if you are practising.
Questions as text
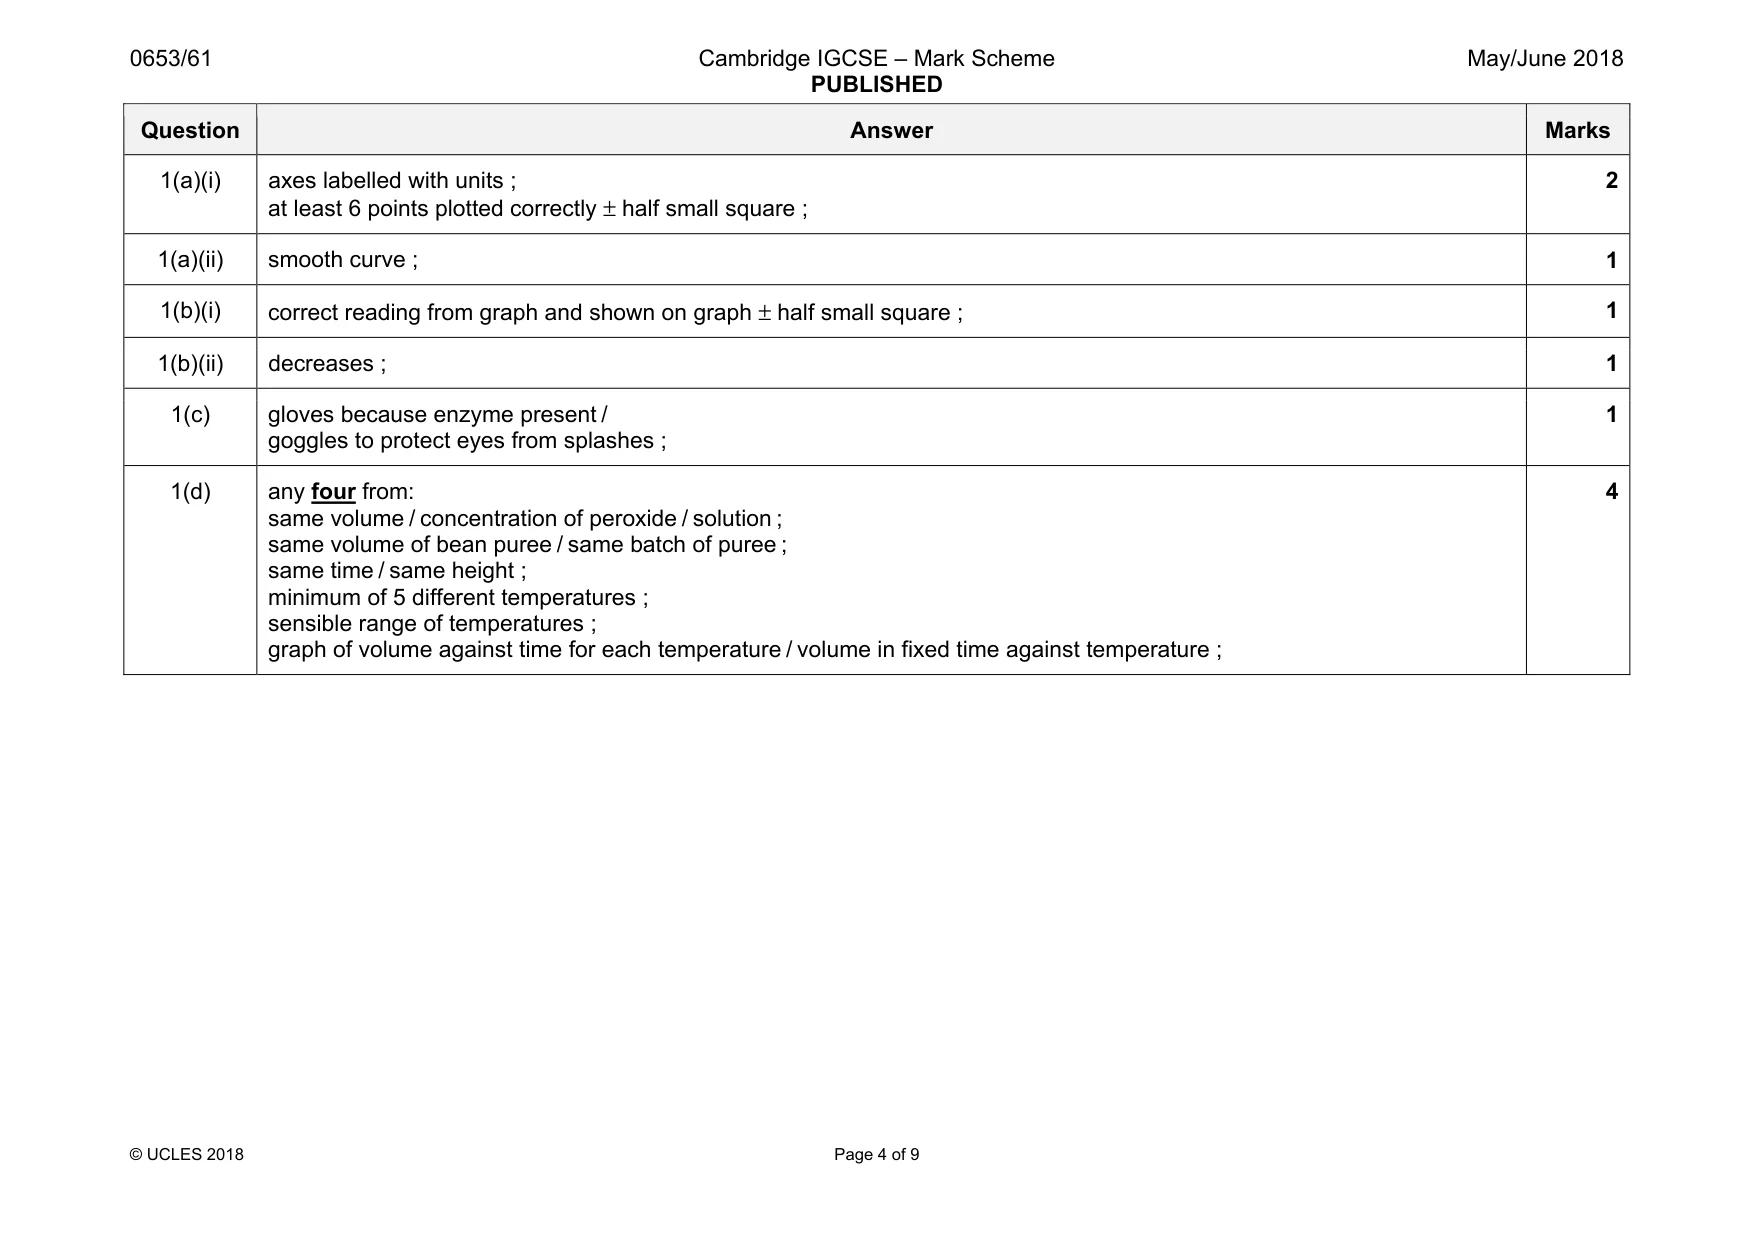
Q1 · A student investigates an enzyme-catalysed reaction
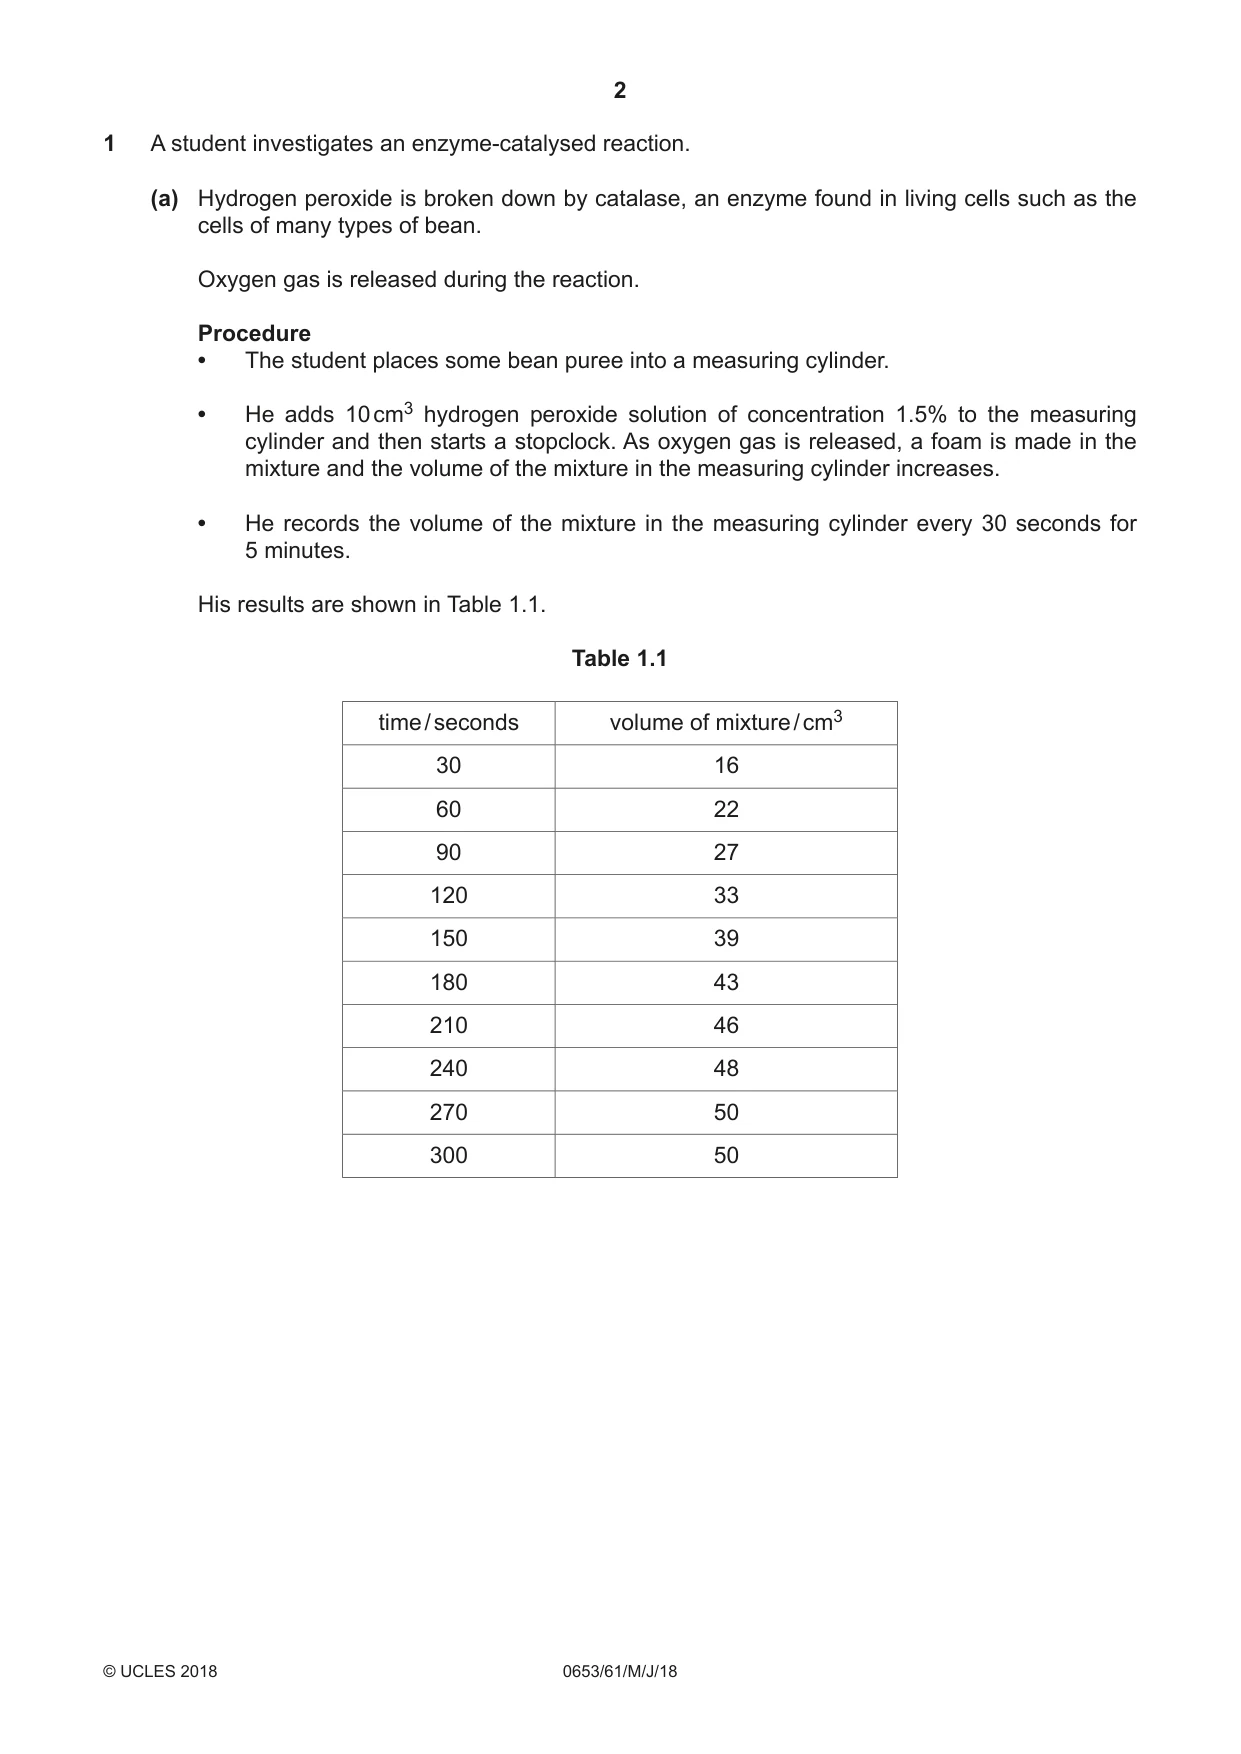
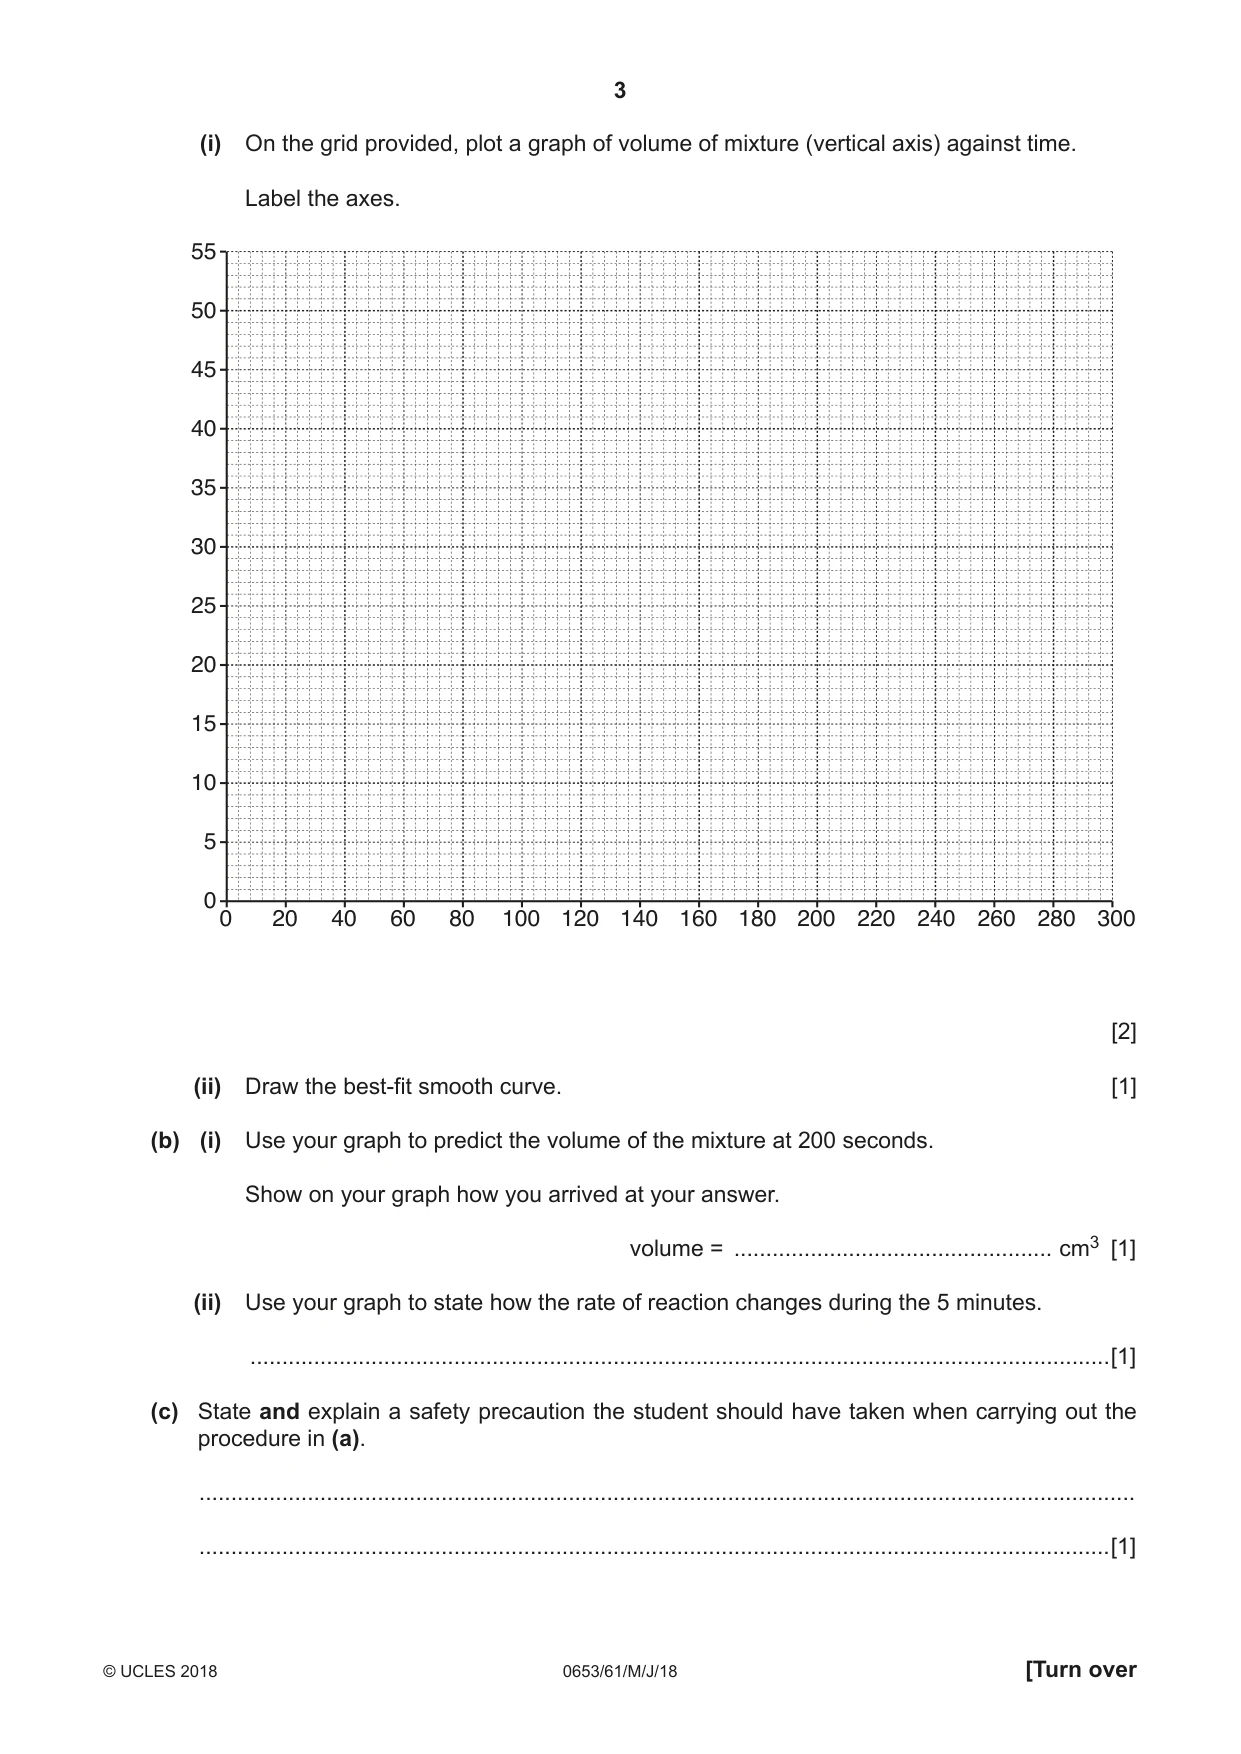
1 A student investigates an enzyme-catalysed reaction. (a) Hydrogen peroxide is broken down by catalase, an enzyme found in living cells such as the cells of many types of bean. Oxygen gas is released during the reaction. Procedure • The student places some bean puree into a measuring cylinder. • He adds 10 cm3 hydrogen peroxide solution of concentration 1.5% to the measuring cylinder and then starts a stopclock. As oxygen gas is released, a foam is made in the mixture and the volume of the mixture in the measuring cylinder increases. • He records the volume of the mixture in the measuring cylinder every 30 seconds for 5 minutes. His results are shown in Table 1.1. Table 1.1 time / seconds volume of mixture / cm3 30 16 60 22 90 27 120 33 150 39 180 43 210 46 240 48 270 50 300 50 (i) On the grid provided, plot a graph of volume of mixture (vertical axis) against time. Label the axes. 55 50 45 40 35 30 25 20 15 10 5 00 20 40 60 80 100 120 140 160 180 200 220 240 260 280 300 [2] (ii) Draw the best-fit smooth curve. [1] (b) (i) Use your graph to predict the volume of the mixture at 200 seconds. Show on your graph how you arrived at your answer. volume = .................................................. cm3 [1] (ii) Use your graph to state how the rate of reaction changes during the 5 minutes. .......................................................................................................................................[1] (c) State and explain a safety precaution the student should have taken when carrying out the procedure in (a). ................................................................................................................................................... ...............................................................................................................................................[1] (d) Plan an experiment, using the same method as in (a), to investigate the effect of changing the temperature of the hydrogen peroxide solution on the volume of the mixture. In your answer, you should include • variables you need to keep constant, • suggestions for values of the variable you are going to change, • how you would present your results on a graph. ................................................................................................................................................... ................................................................................................................................................... ................................................................................................................................................... ................................................................................................................................................... ................................................................................................................................................... ...............................................................................................................................................[4]
Mark scheme: 1(a)(i) axes labelled with units ; at least 6 points plotted correctly ± half small square ; 2 1(a)(ii) smooth curve ; 1 1(b)(i) correct reading from graph and shown on graph ± half small square ; 1 1(b)(ii) decreases ; 1 1(c) gloves because enzyme present / goggles to protect eyes from splashes ; 1 1(d) any four from: same volume / concentration of peroxide / solution ; same volume of bean puree / same batch of puree ; same time / same height ; minimum of 5 different temperatures ; sensible range of temperatures ; graph of volume against time for each temperature / volume in fixed time against temperature ; 4
Q2 · A student is given three colourless solutions, H, J and K
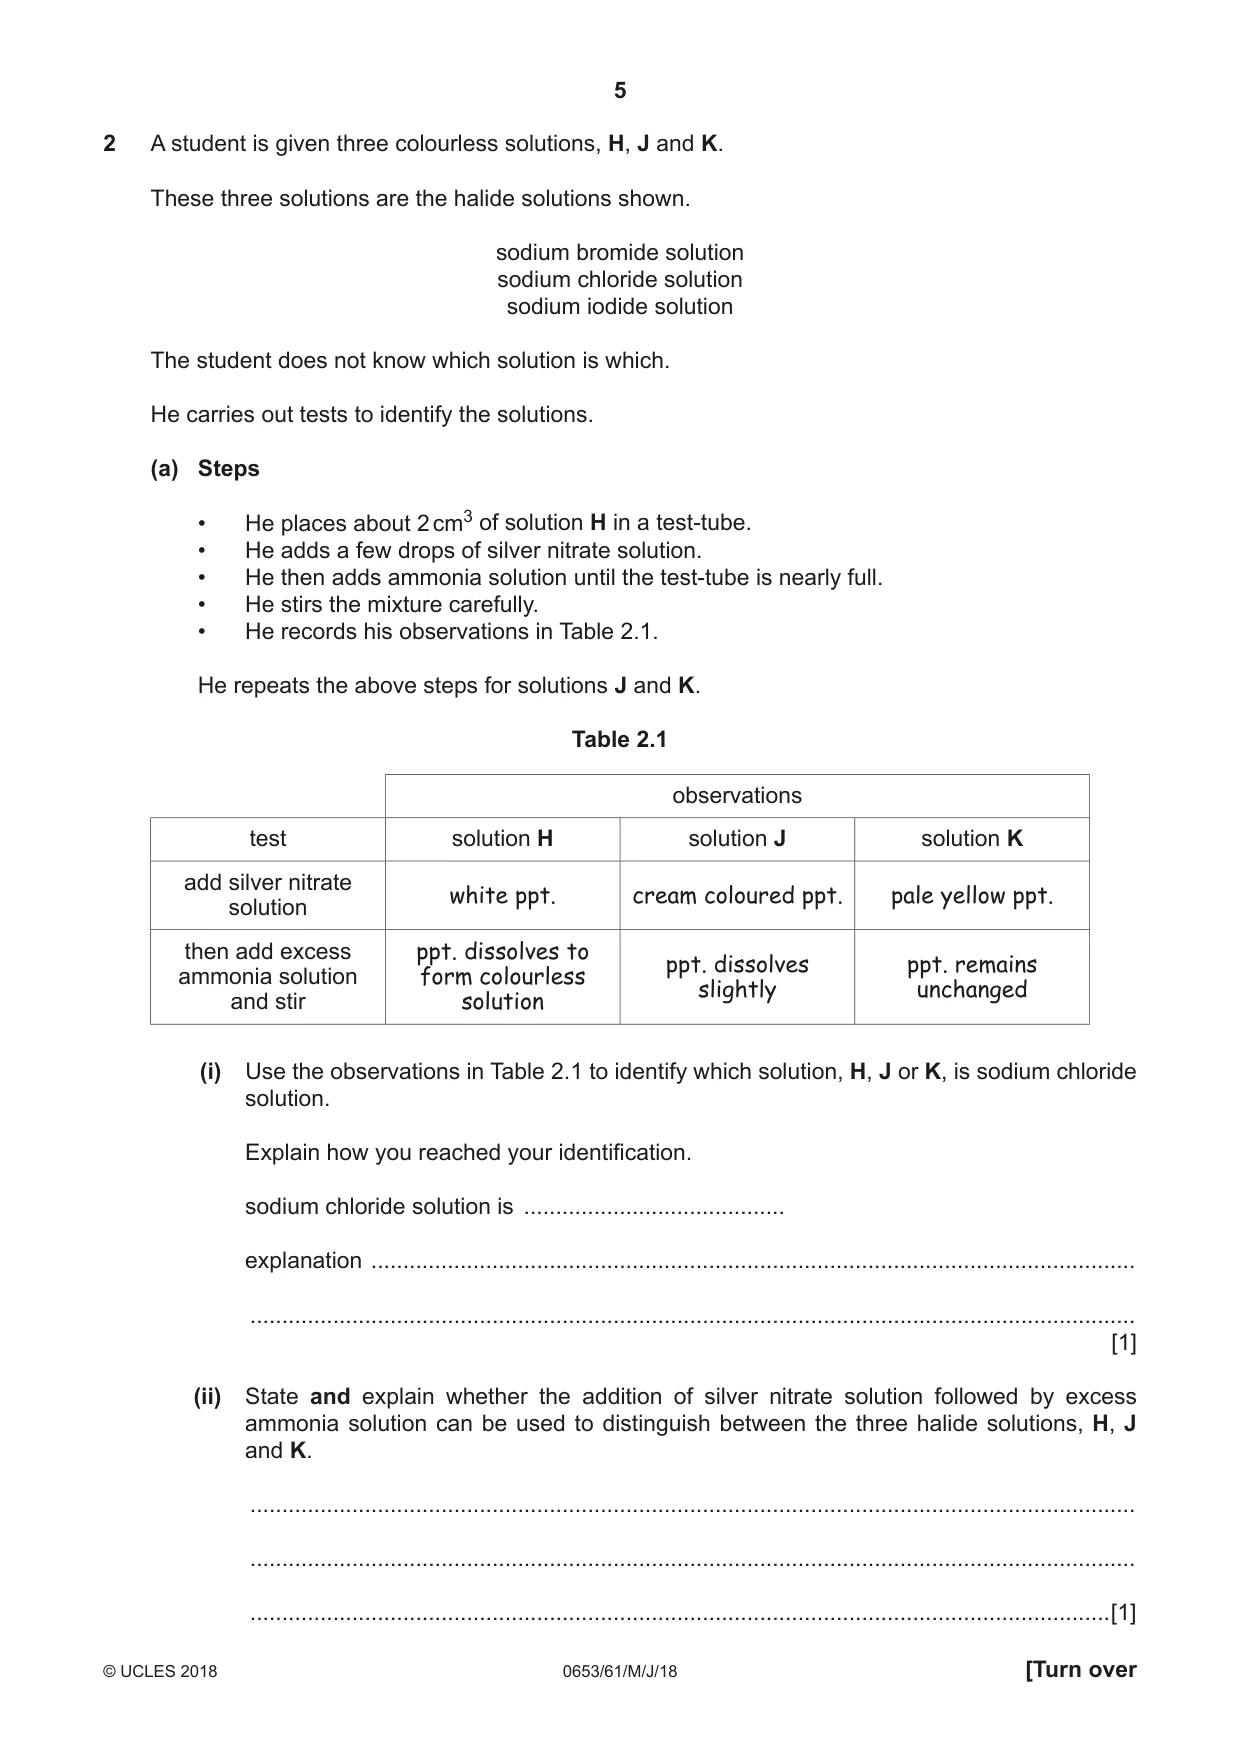
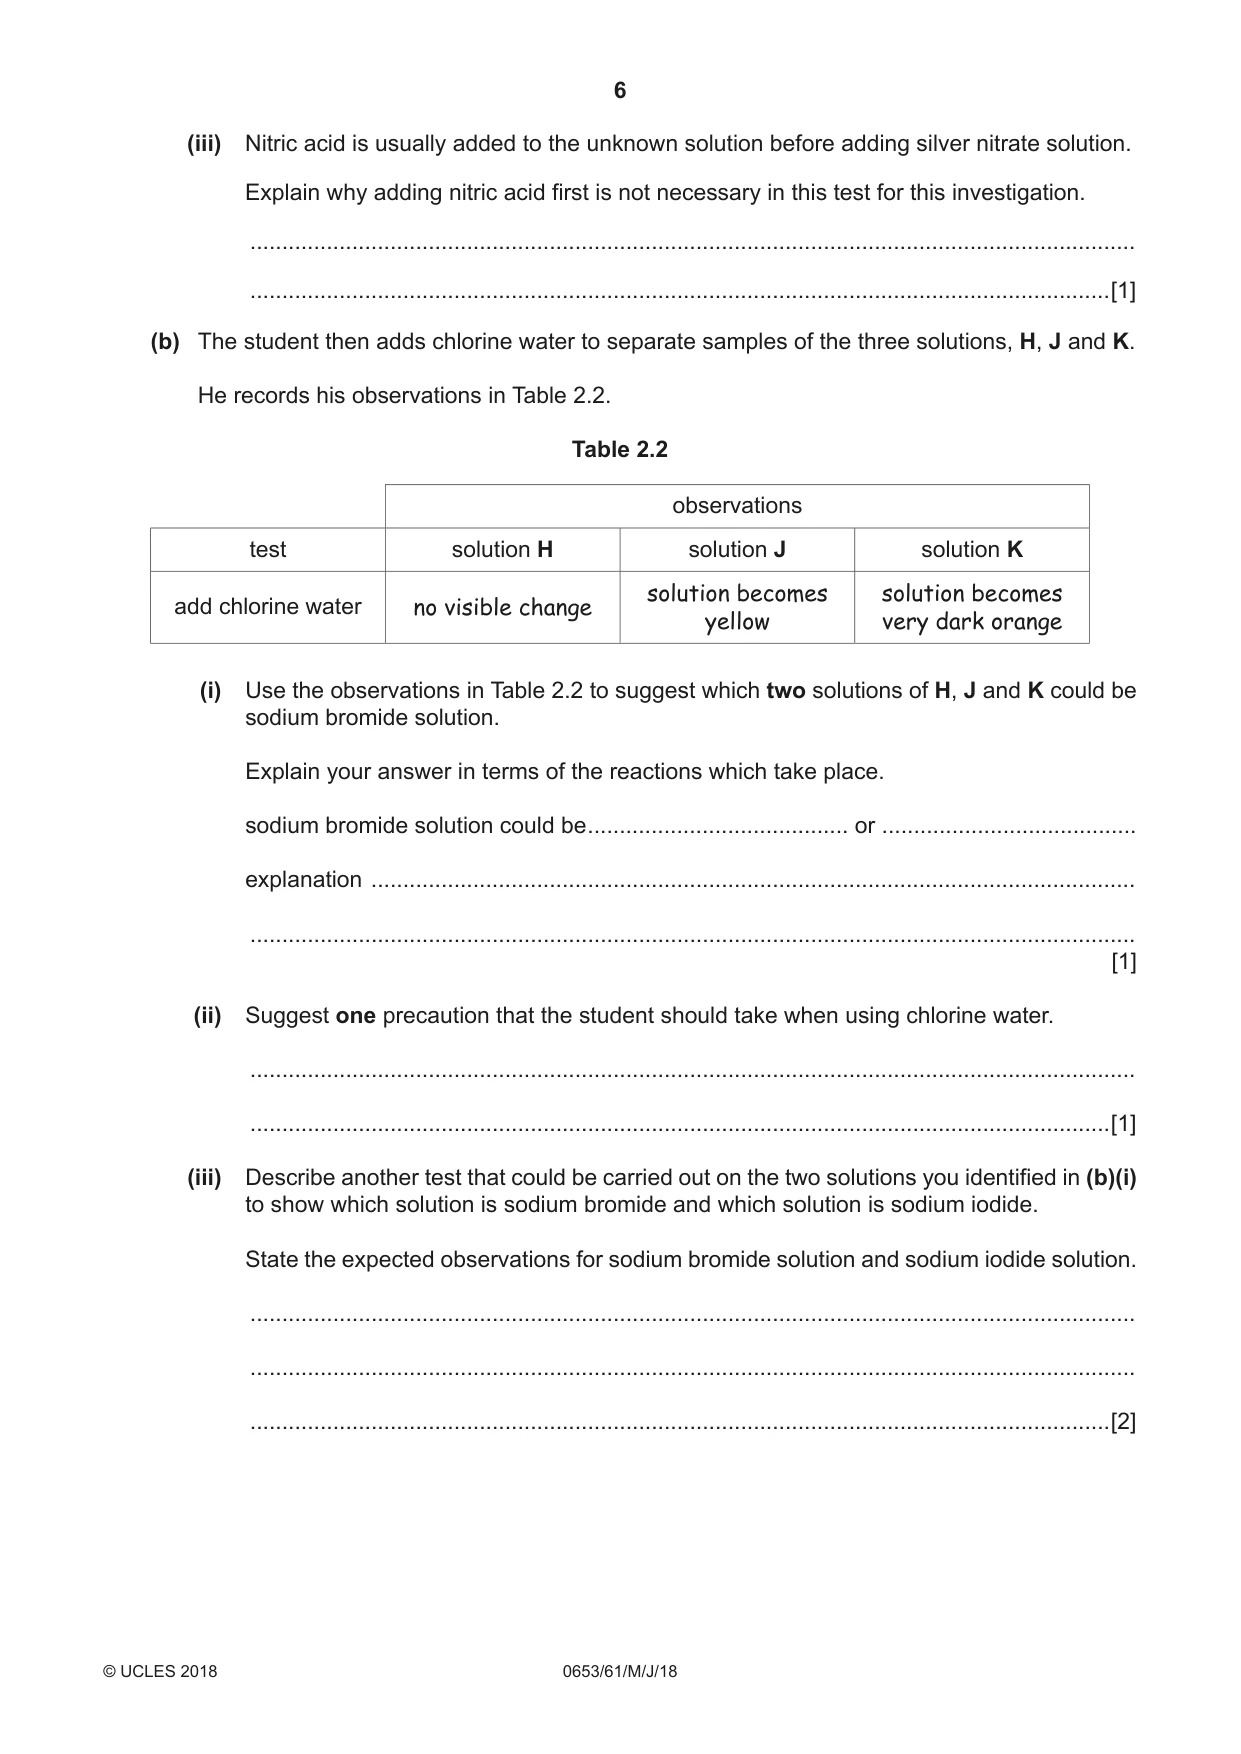
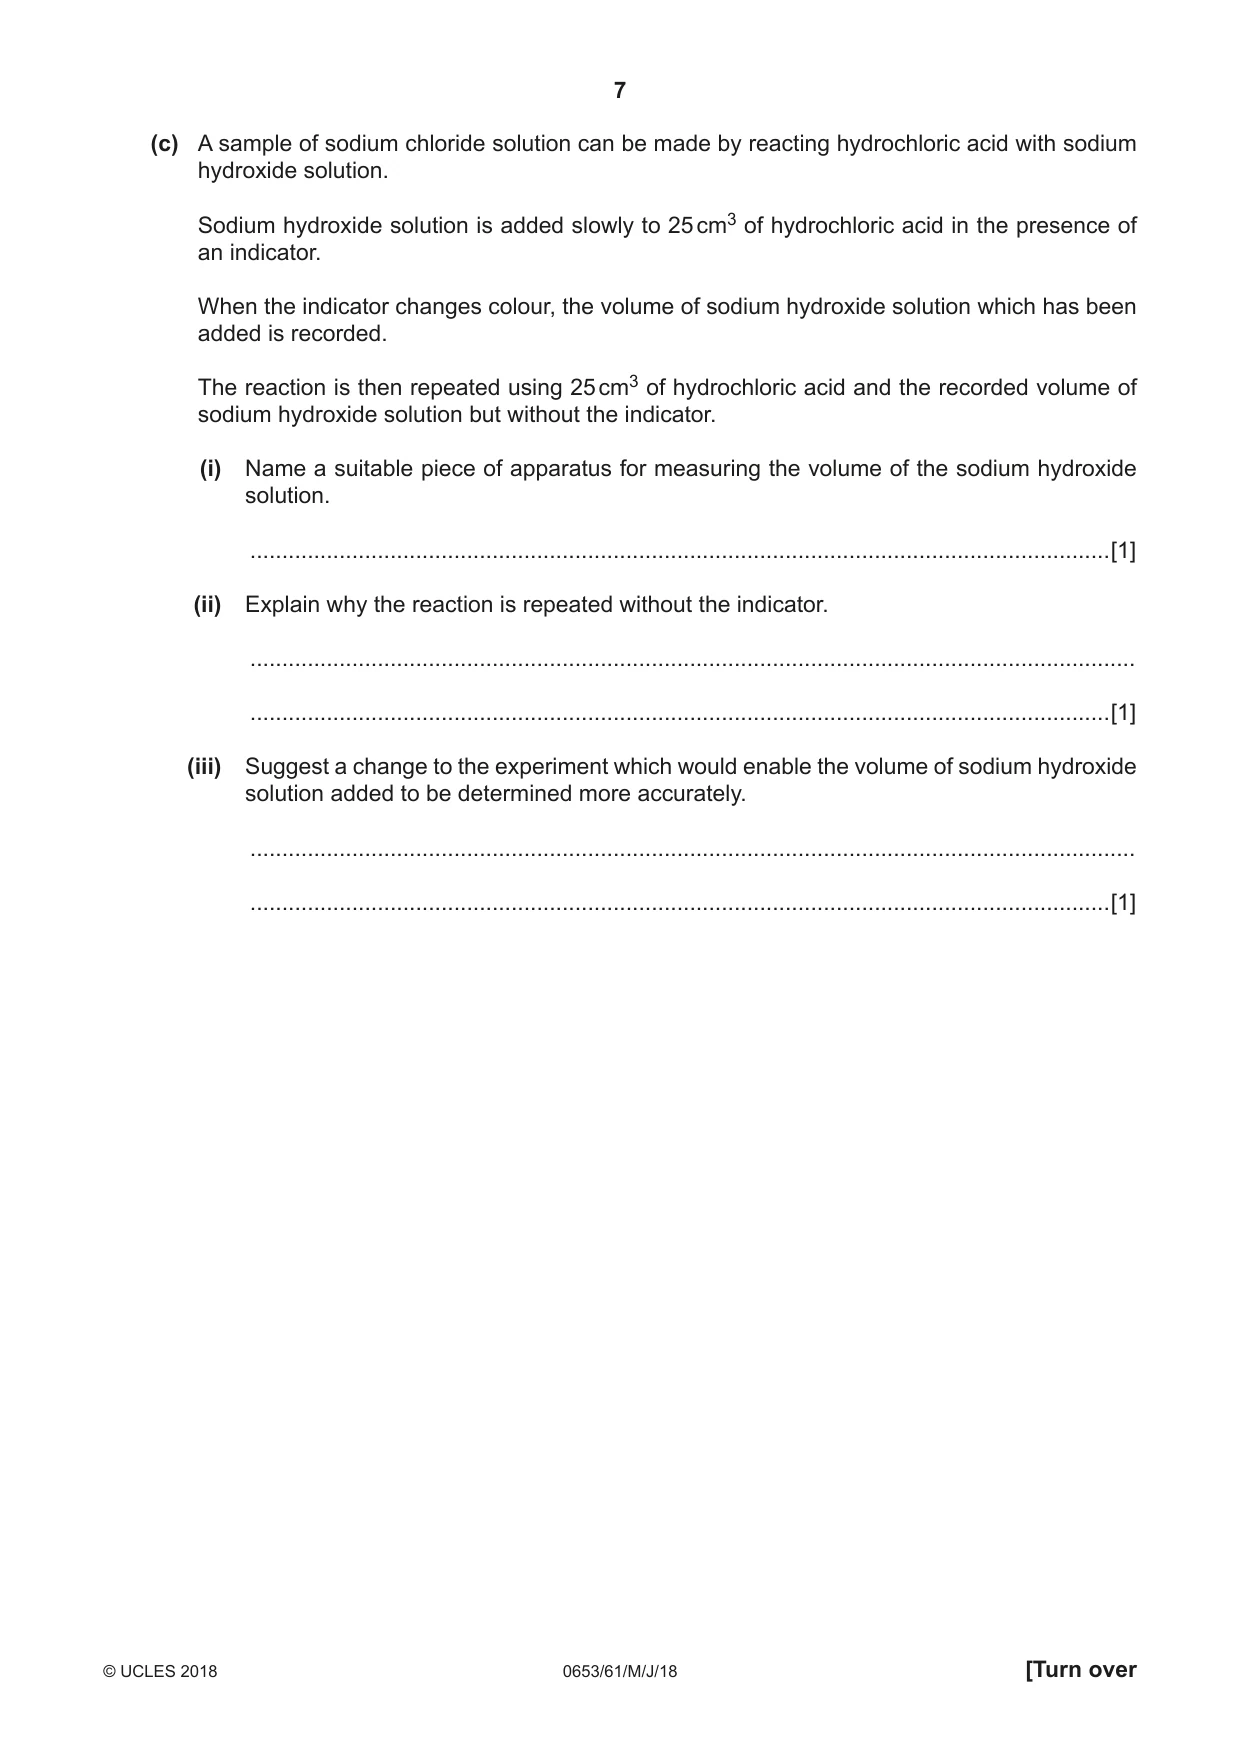
2 A student is given three colourless solutions, H, J and K. These three solutions are the halide solutions shown. sodium bromide solution sodium chloride solution sodium iodide solution The student does not know which solution is which. He carries out tests to identify the solutions. (a) Steps • He places about 2 cm3 of solution H in a test-tube. • He adds a few drops of silver nitrate solution. • He then adds ammonia solution until the test-tube is nearly full. • He stirs the mixture carefully. • He records his observations in Table 2.1. He repeats the above steps for solutions J and K. Table 2.1 observations test solution H solution J solution K add silver nitrate white ppt. cream coloured ppt. pale yellow ppt. solution then add excess ppt. dissolves to ppt. dissolves ppt. remains ammonia solution form colourless slightly unchanged and stir solution (i) Use the observations in Table 2.1 to identify which solution, H, J or K, is sodium chloride solution. Explain how you reached your identification. sodium chloride solution is ......................................... explanation ........................................................................................................................ ........................................................................................................................................... [1] (ii) State and explain whether the addition of silver nitrate solution followed by excess ammonia solution can be used to distinguish between the three halide solutions, H, J and K. ........................................................................................................................................... ........................................................................................................................................... .......................................................................................................................................[1] (iii) Nitric acid is usually added to the unknown solution before adding silver nitrate solution. Explain why adding nitric acid first is not necessary in this test for this investigation. ........................................................................................................................................... .......................................................................................................................................[1] (b) The student then adds chlorine water to separate samples of the three solutions, H, J and K. He records his observations in Table 2.2. Table 2.2 observations test solution H solution J solution K solution becomes solution becomes add chlorine water no visible change yellow very dark orange (i) Use the observations in Table 2.2 to suggest which two solutions of H, J and K could be sodium bromide solution. Explain your answer in terms of the reactions which take place. sodium bromide solution could be ......................................... or ........................................ explanation ........................................................................................................................ ........................................................................................................................................... [1] (ii) Suggest one precaution that the student should take when using chlorine water. ........................................................................................................................................... .......................................................................................................................................[1] (iii) Describe another test that could be carried out on the two solutions you identified in (b)(i) to show which solution is sodium bromide and which solution is sodium iodide. State the expected observations for sodium bromide solution and sodium iodide solution. ........................................................................................................................................... ........................................................................................................................................... .......................................................................................................................................[2] (c) A sample of sodium chloride solution can be made by reacting hydrochloric acid with sodium hydroxide solution. Sodium hydroxide solution is added slowly to 25 cm3 of hydrochloric acid in the presence of an indicator. When the indicator changes colour, the volume of sodium hydroxide solution which has been added is recorded. The reaction is then repeated using 25 cm3 of hydrochloric acid and the recorded volume of sodium hydroxide solution but without the indicator. (i) Name a suitable piece of apparatus for measuring the volume of the sodium hydroxide solution. .......................................................................................................................................[1] (ii) Explain why the reaction is repeated without the indicator. ........................................................................................................................................... .......................................................................................................................................[1] (iii) Suggest a change to the experiment which would enable the volume of sodium hydroxide solution added to be determined more accurately. ........................................................................................................................................... .......................................................................................................................................[1]
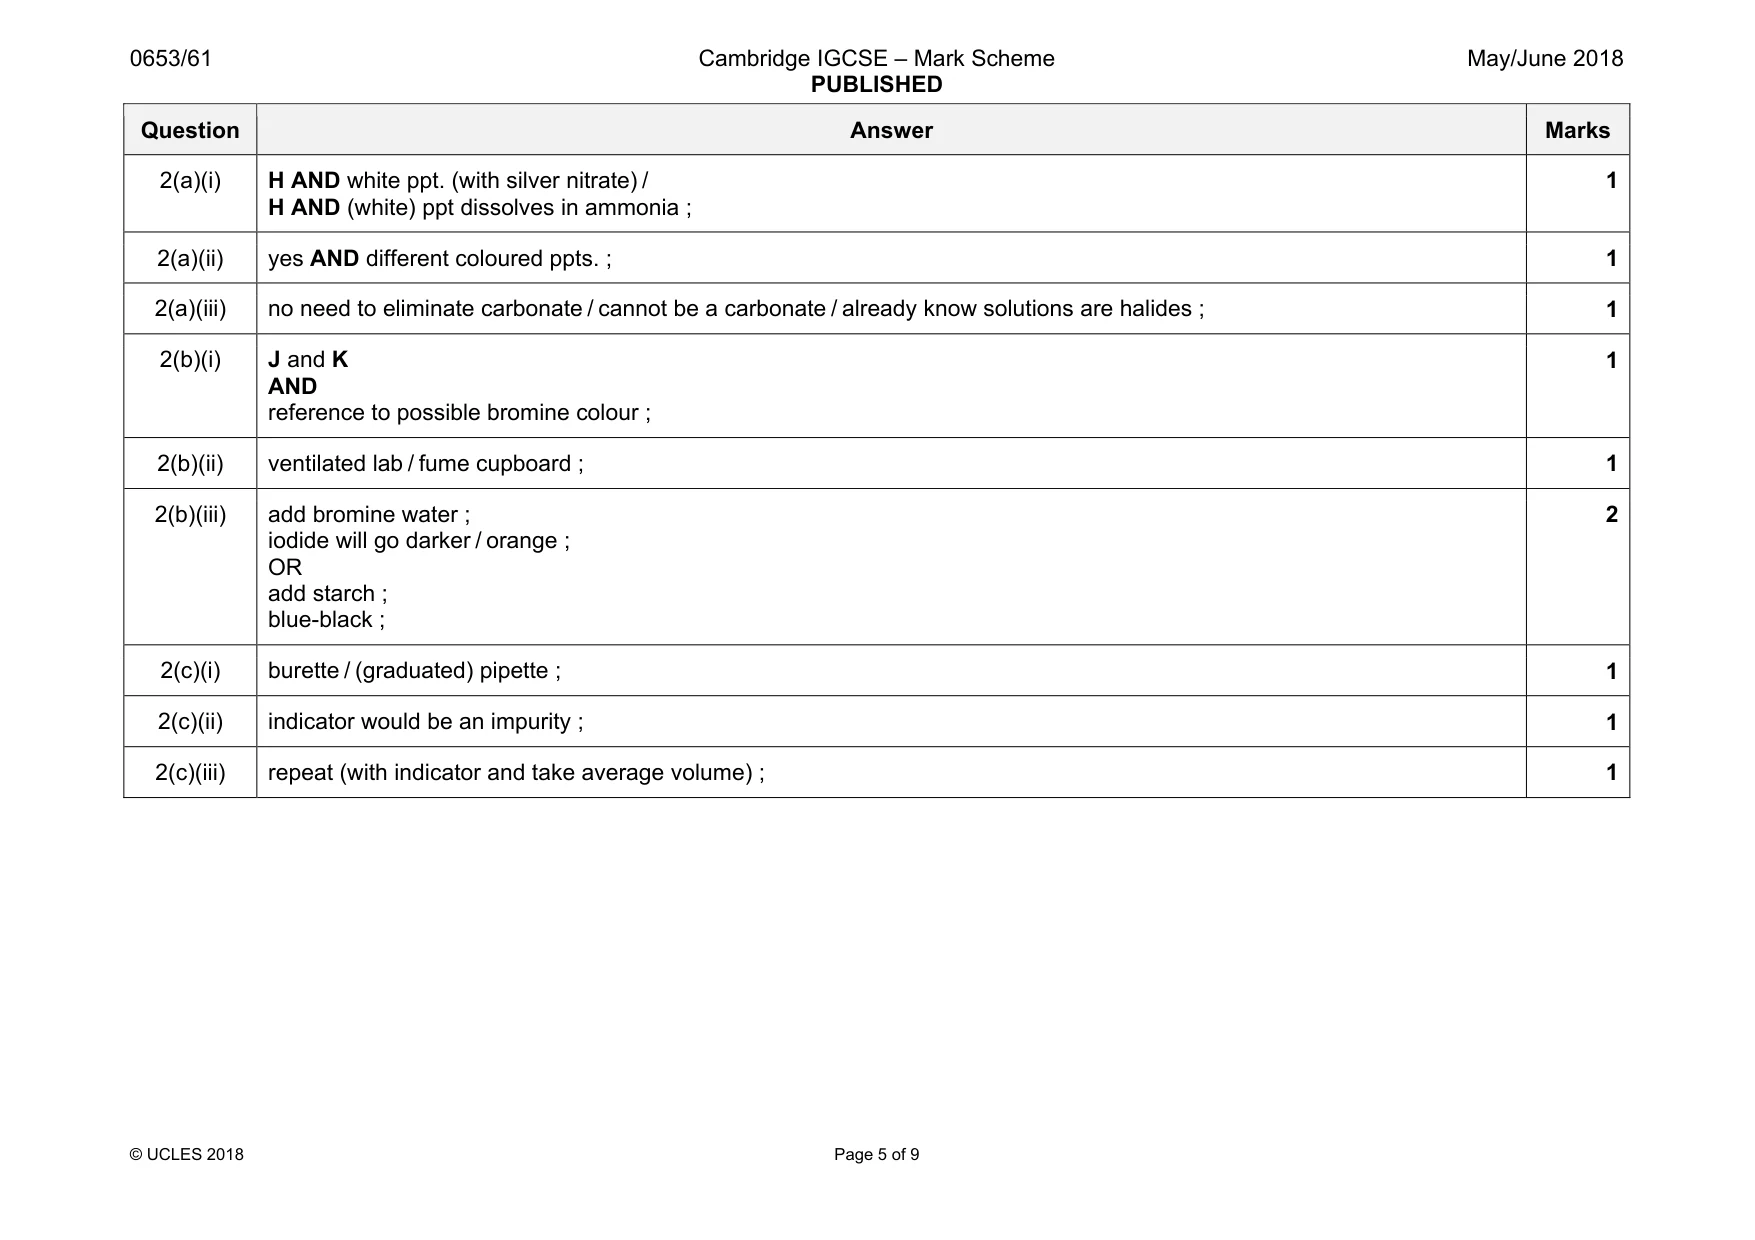
Mark scheme: 2(a)(i) H AND white ppt. (with silver nitrate) / H AND (white) ppt dissolves in ammonia ; 1 2(a)(ii) yes AND different coloured ppts. ; 1 2(a)(iii) no need to eliminate carbonate / cannot be a carbonate / already know solutions are halides ; 1 2(b)(i) J and K AND reference to possible bromine colour ; 1 2(b)(ii) ventilated lab / fume cupboard ; 1 2(b)(iii) add bromine water ; iodide will go darker / orange ; OR add starch ; blue-black ; 2 2(c)(i) burette / (graduated) pipette ; 1 2(c)(ii) indicator would be an impurity ; 1 2(c)(iii) repeat (with indicator and take average volume) ; 1
Q3 · A student investigates how the length l of a spring varies when different loads L are…
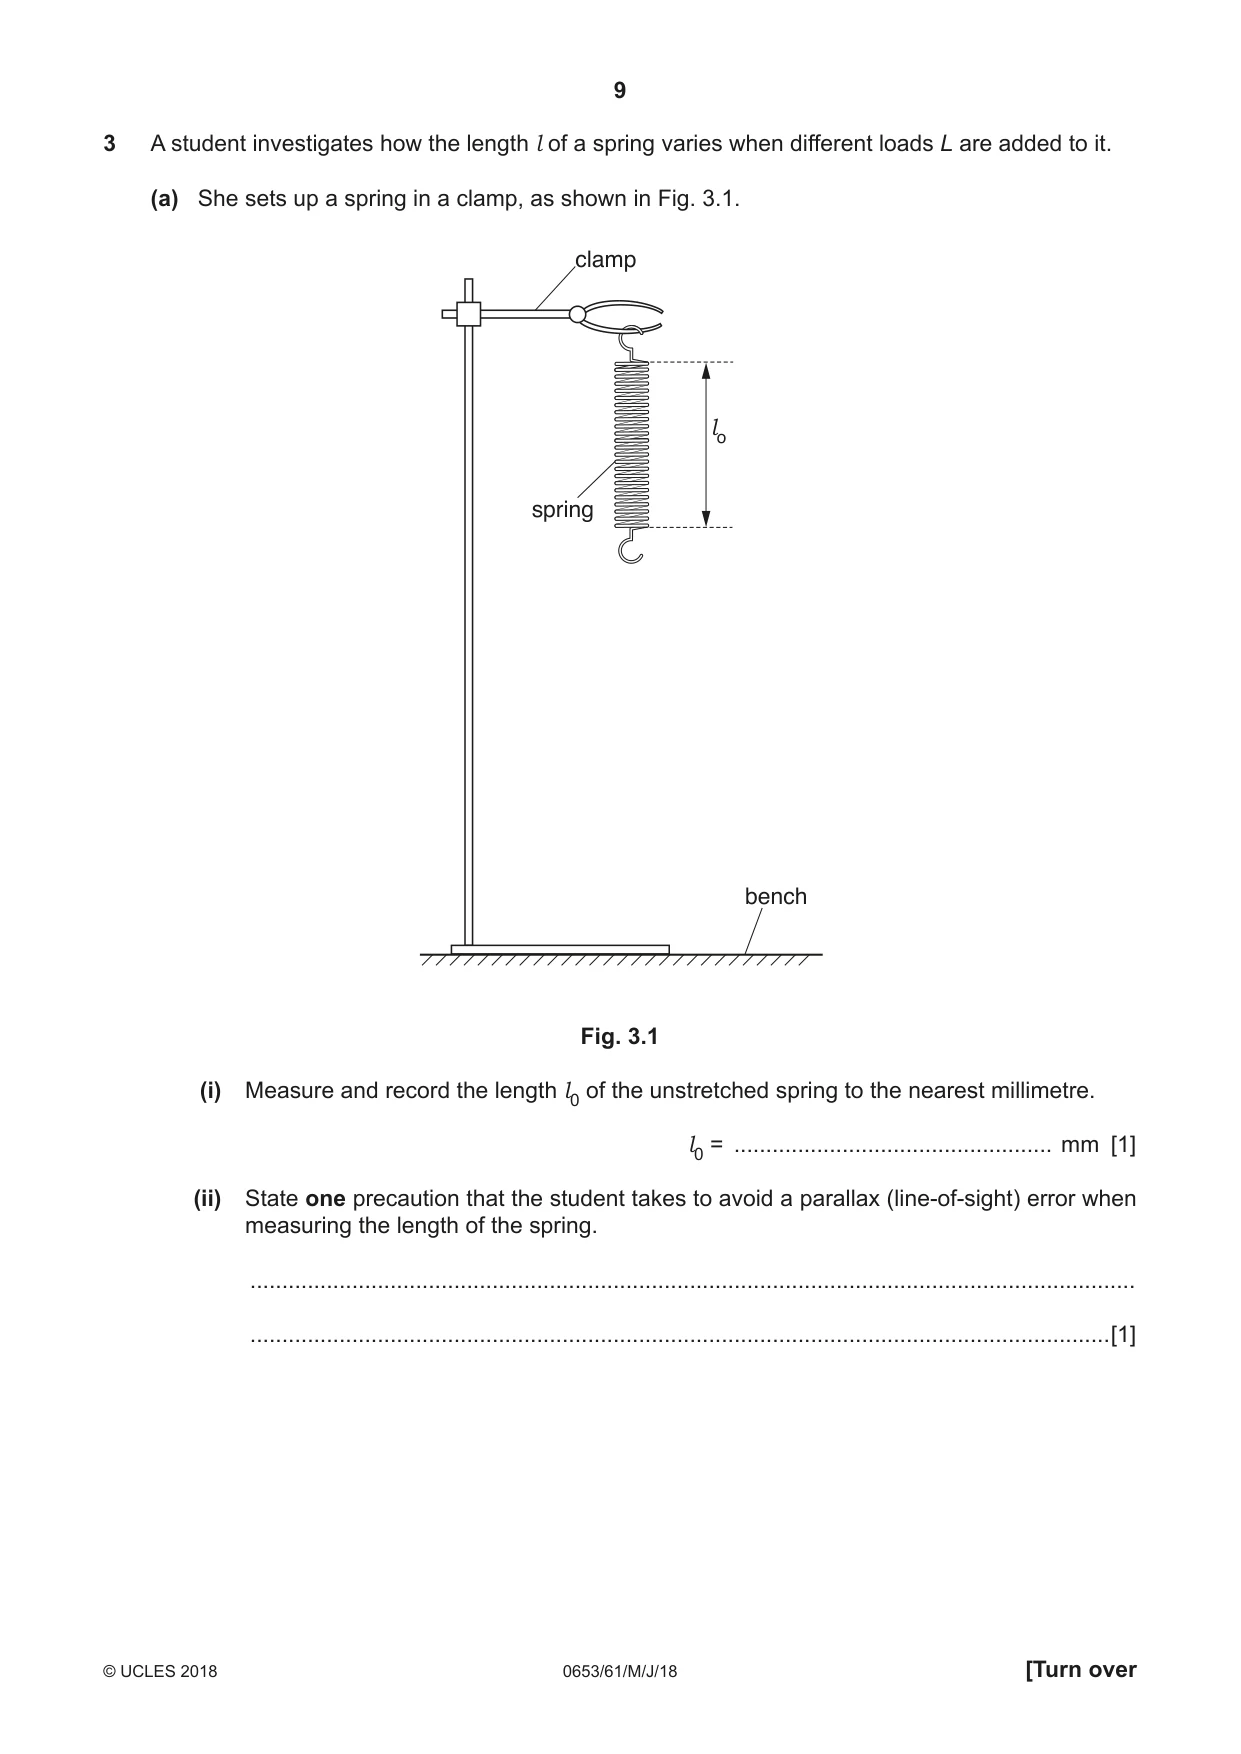
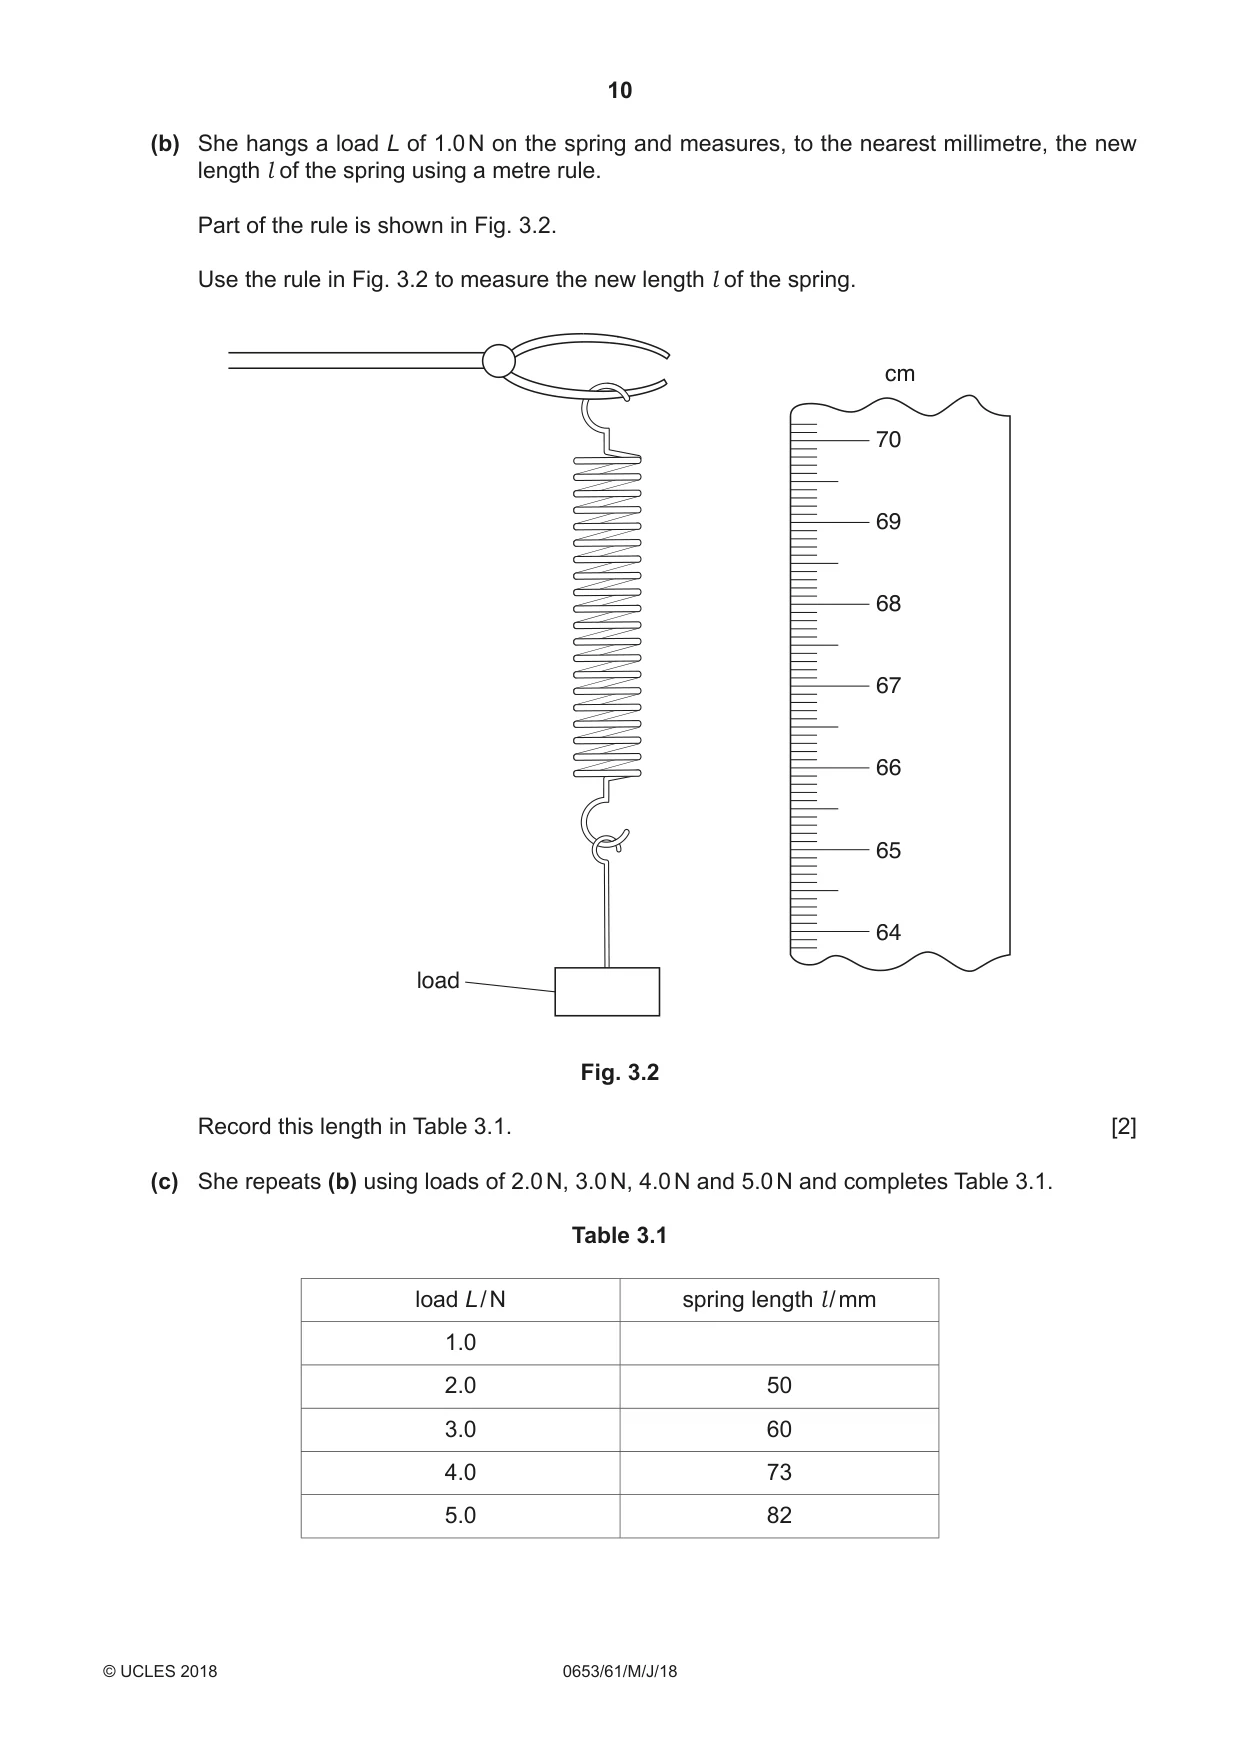
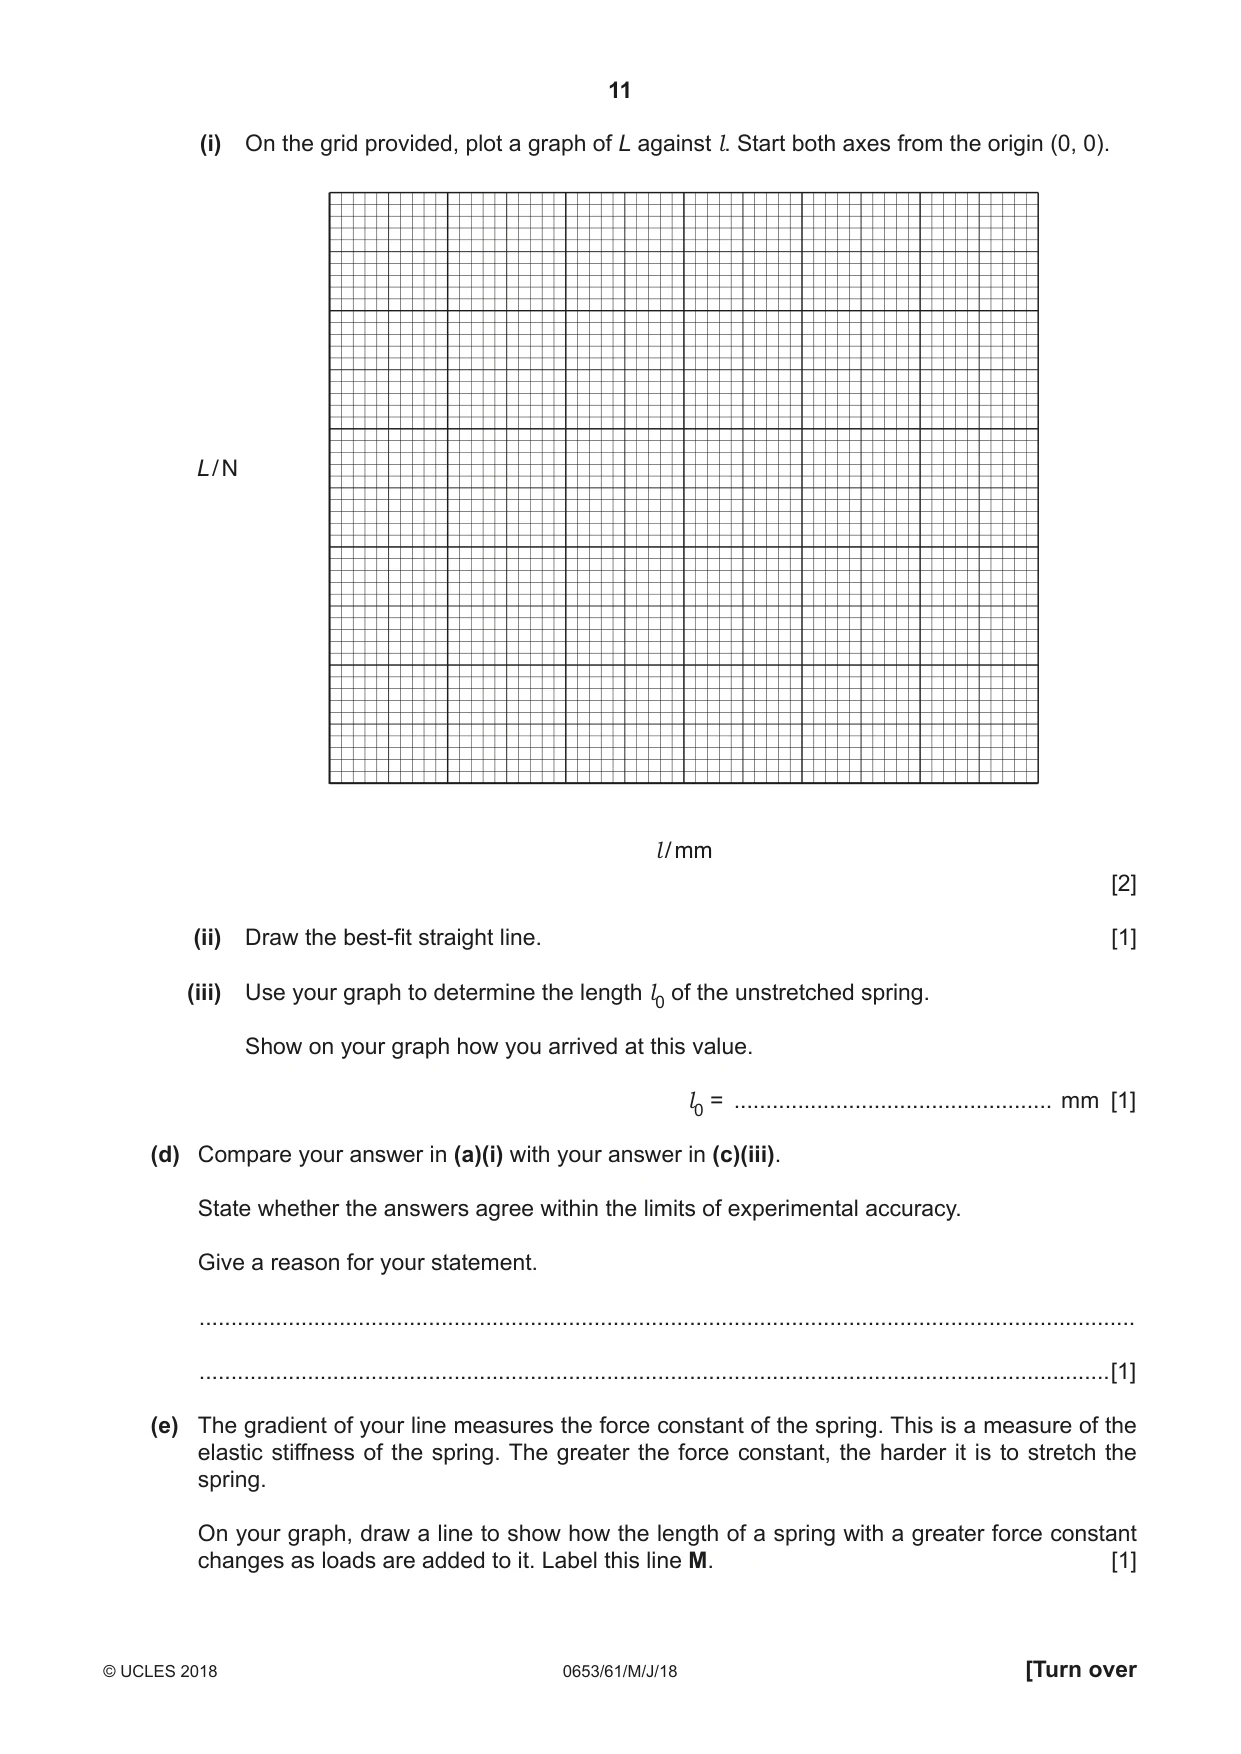
3 A student investigates how the length l of a spring varies when different loads L are added to it. (a) She sets up a spring in a clamp, as shown in Fig. 3.1. clamp lo spring bench Fig. 3.1 (i) Measure and record the length l0 of the unstretched spring to the nearest millimetre. l0 = .................................................. mm [1] (ii) State one precaution that the student takes to avoid a parallax (line-of-sight) error when measuring the length of the spring. ........................................................................................................................................... .......................................................................................................................................[1] (b) She hangs a load L of 1.0 N on the spring and measures, to the nearest millimetre, the new length l of the spring using a metre rule. Part of the rule is shown in Fig. 3.2. Use the rule in Fig. 3.2 to measure the new length l of the spring. cm 70 69 68 67 66 65 64 load Fig. 3.2 Record this length in Table 3.1. [2] (c) She repeats (b) using loads of 2.0 N, 3.0 N, 4.0 N and 5.0 N and completes Table 3.1. Table 3.1 load L / N spring length l / mm 1.0 2.0 50 3.0 60 4.0 73 5.0 82 (i) On the grid provided, plot a graph of L against l. Start both axes from the origin (0, 0). L / N l / mm [2] (ii) Draw the best-fit straight line. [1] (iii) Use your graph to determine the length l0 of the unstretched spring. Show on your graph how you arrived at this value. l0 = .................................................. mm [1] (d) Compare your answer in (a)(i) with your answer in (c)(iii). State whether the answers agree within the limits of experimental accuracy. Give a reason for your statement. ................................................................................................................................................... ...............................................................................................................................................[1] (e) The gradient of your line measures the force constant of the spring. This is a measure of the elastic stiffness of the spring. The greater the force constant, the harder it is to stretch the spring. On your graph, draw a line to show how the length of a spring with a greater force constant changes as loads are added to it. Label this line M. [1]
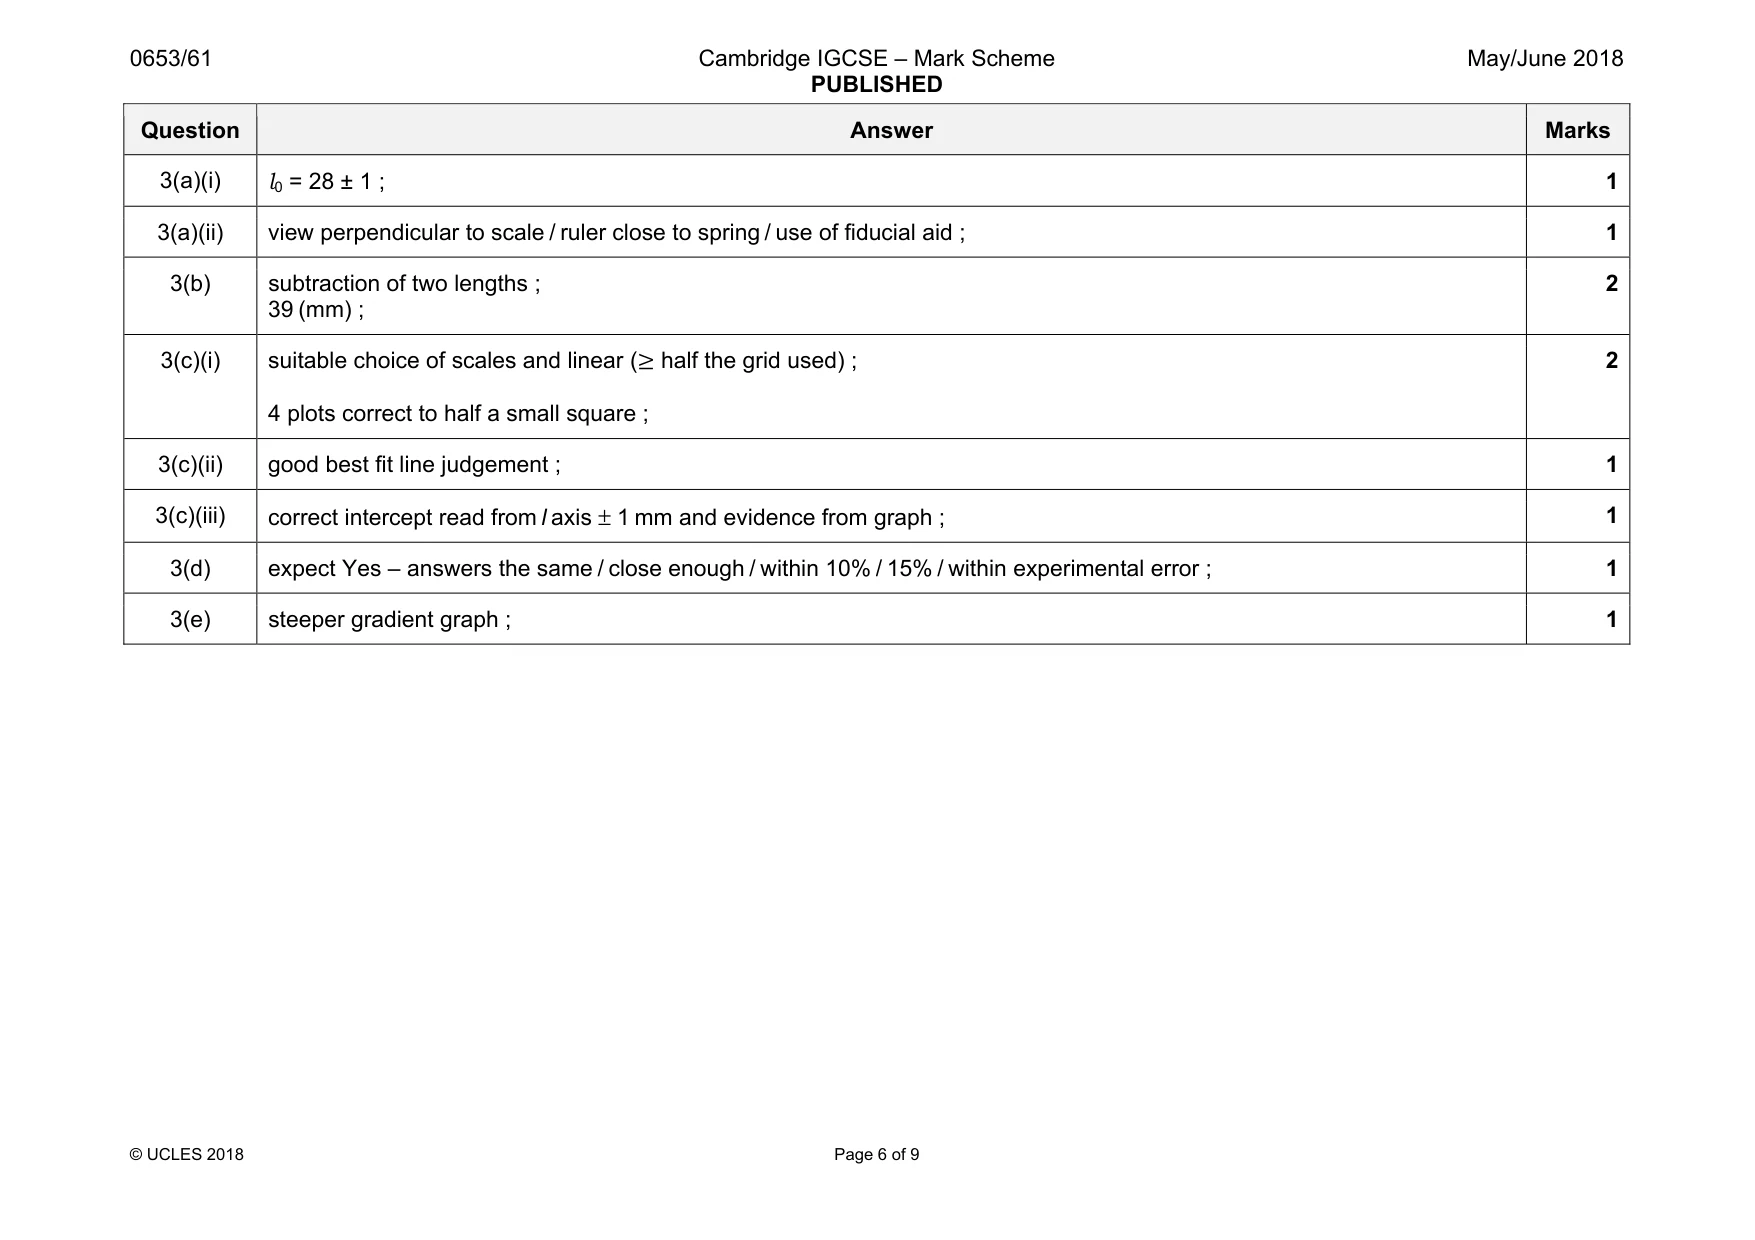
Mark scheme: 3(a)(i) 1 3(a)(ii) view perpendicular to scale / ruler close to spring / use of fiducial aid ; 1 3(b) subtraction of two lengths ; 39 (mm) ; 2 3(c)(i) suitable choice of scales and linear (≥ half the grid used) ; 4 plots correct to half a small square ; 2 3(c)(ii) good best fit line judgement ; 1 3(c)(iii) correct intercept read from l axis ± 1 mm and evidence from graph ; 1 3(d) expect Yes – answers the same / close enough / within 10% / 15% / within experimental error ; 1 3(e) steeper gradient graph ; 1
Q4 · A student is studying cells
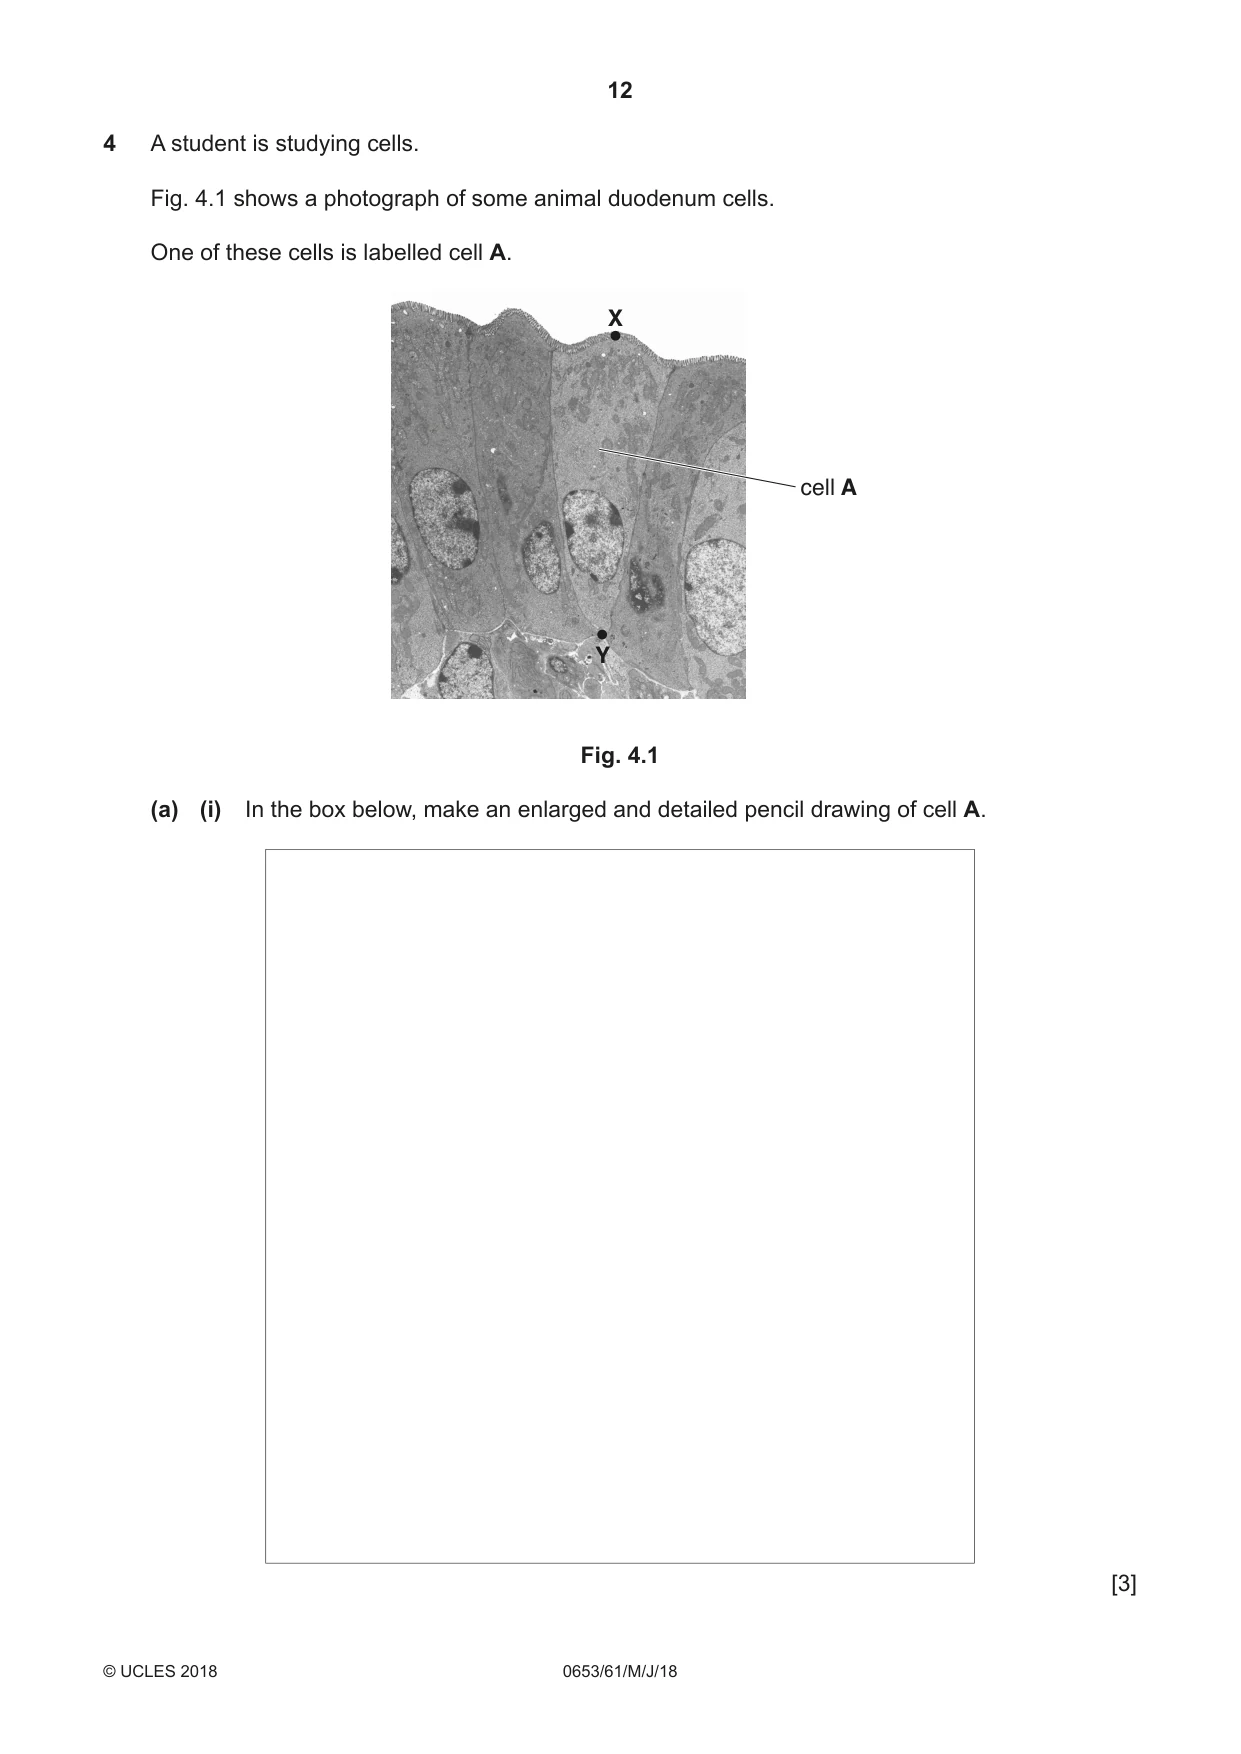
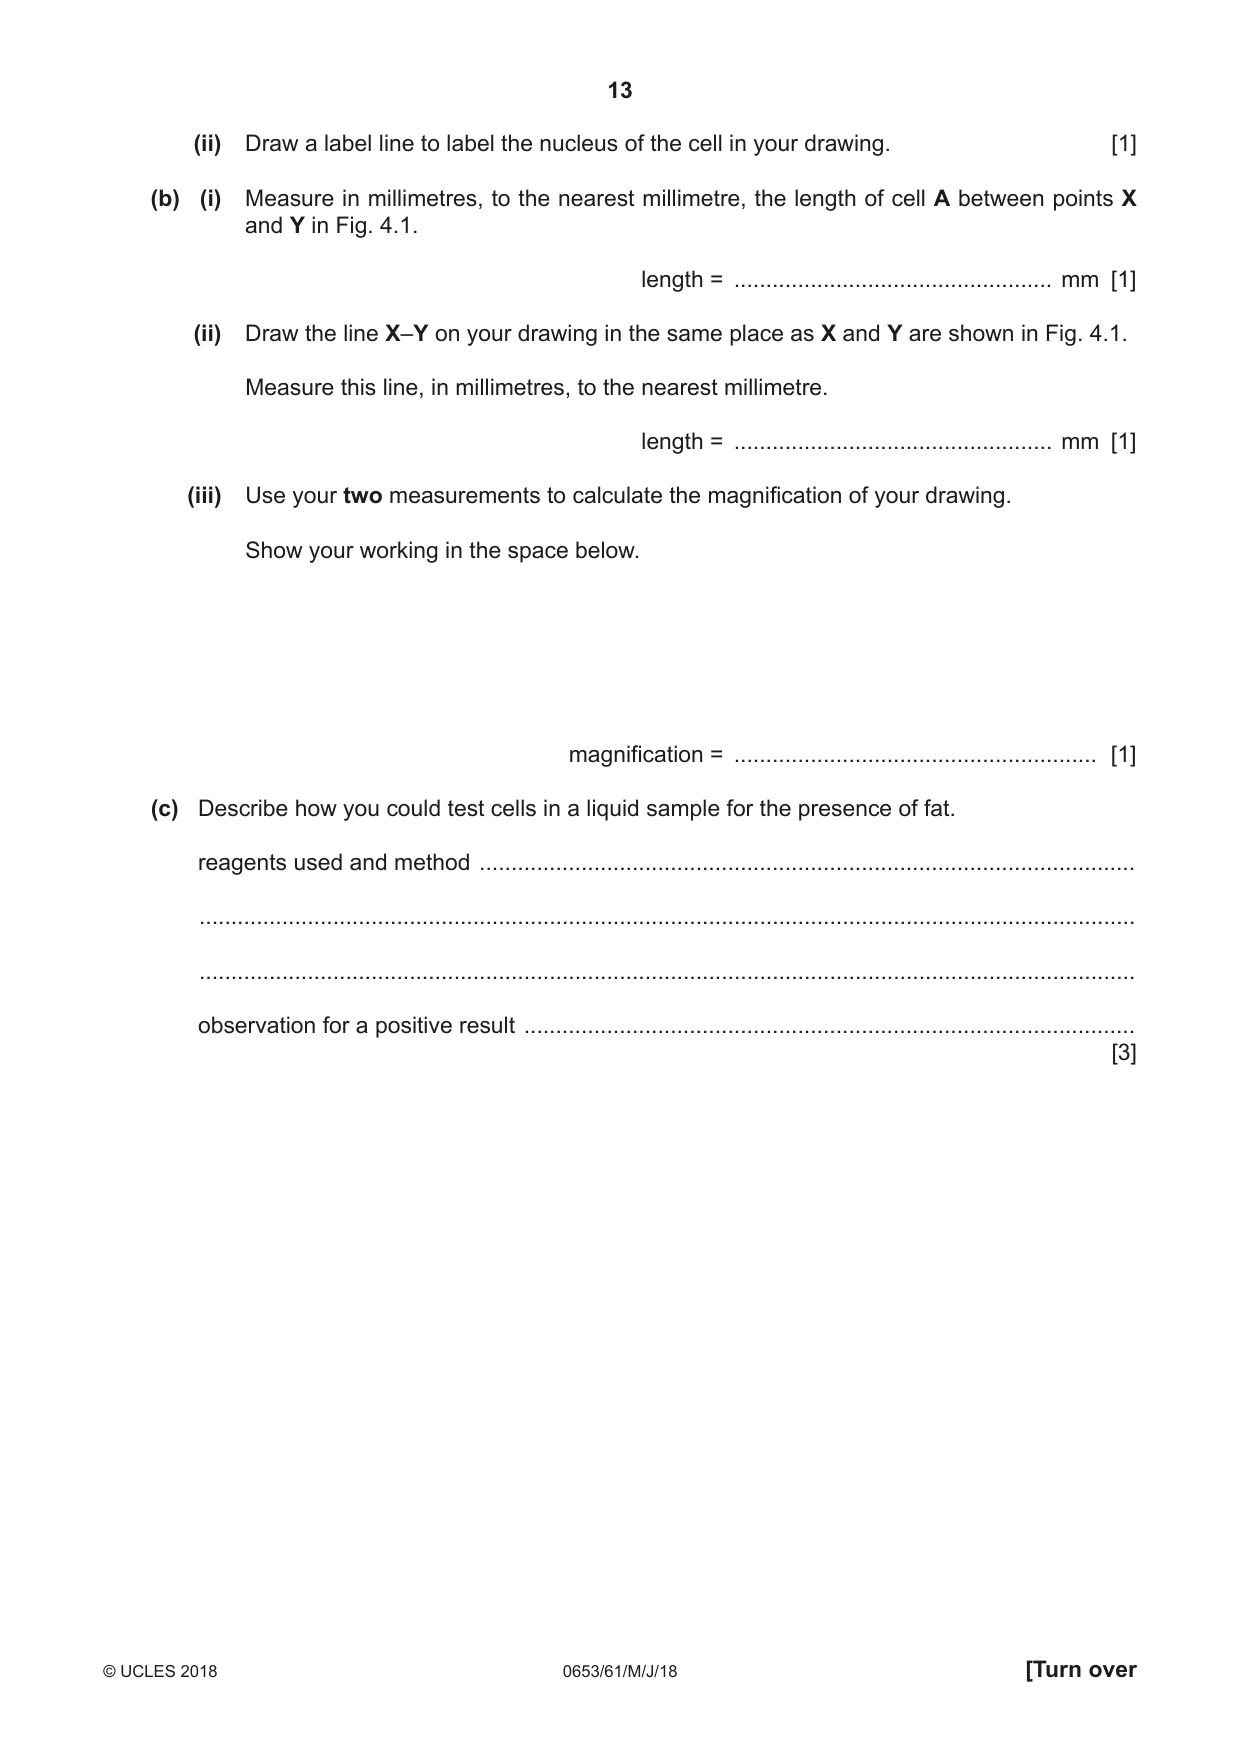
4 A student is studying cells. Fig. 4.1 shows a photograph of some animal duodenum cells. One of these cells is labelled cell A. X cell A Y Fig. 4.1 (a) (i) In the box below, make an enlarged and detailed pencil drawing of cell A. [3] (ii) Draw a label line to label the nucleus of the cell in your drawing. [1] (b) (i) Measure in millimetres, to the nearest millimetre, the length of cell A between points X and Y in Fig. 4.1. length = .................................................. mm [1] (ii) Draw the line X–Y on your drawing in the same place as X and Y are shown in Fig. 4.1. Measure this line, in millimetres, to the nearest millimetre. length = .................................................. mm [1] (iii) Use your two measurements to calculate the magnification of your drawing. Show your working in the space below. magnification = ......................................................... [1] (c) Describe how you could test cells in a liquid sample for the presence of fat. reagents used and method ....................................................................................................... ................................................................................................................................................... ................................................................................................................................................... observation for a positive result ................................................................................................ [3]
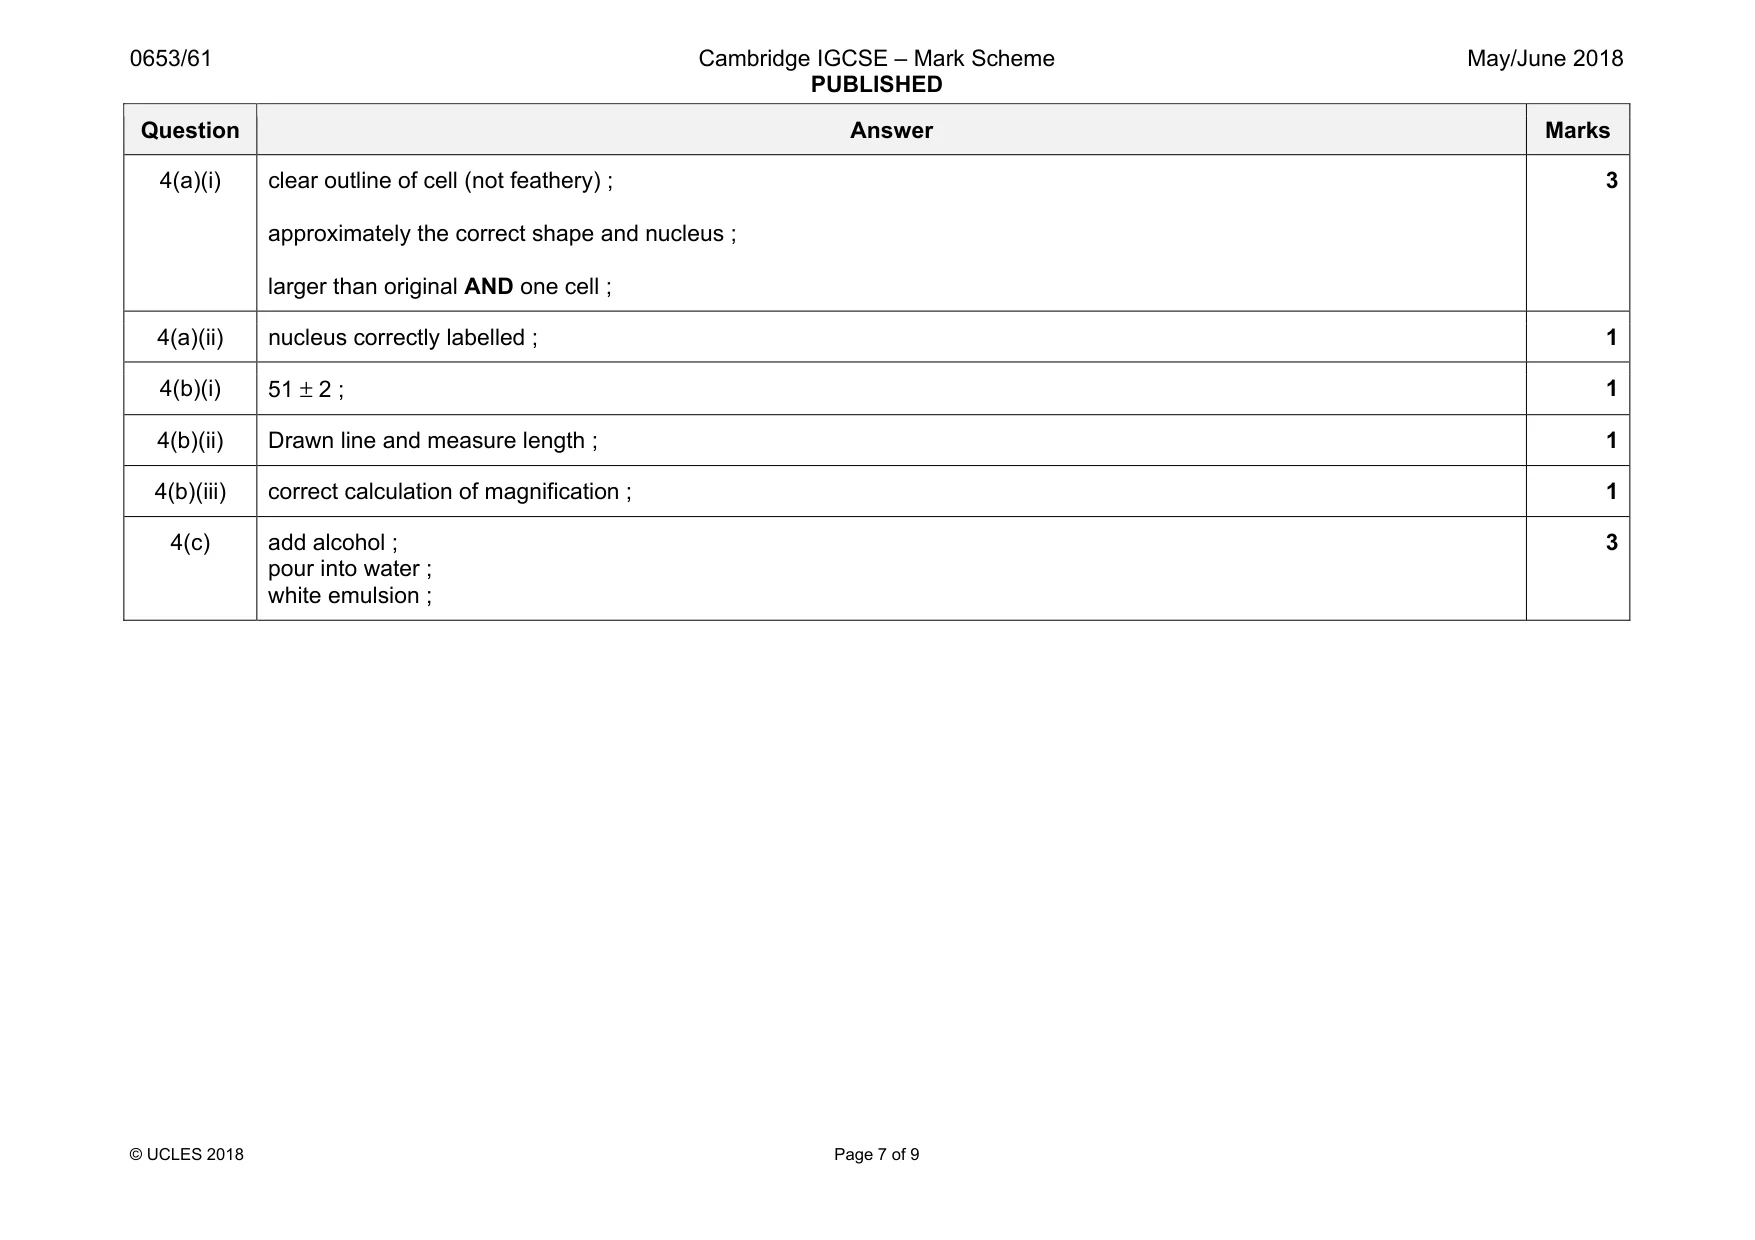
Mark scheme: 4(a)(i) clear outline of cell (not feathery) ; approximately the correct shape and nucleus ; larger than original AND one cell ; 3 4(a)(ii) nucleus correctly labelled ; 1 4(b)(i) 51 ± 2 ; 1 4(b)(ii) Drawn line and measure length ; 1 4(b)(iii) correct calculation of magnification ; 1 4(c) add alcohol ; pour into water ; white emulsion ; 3
Q5 · A student prepares a pure sample of blue copper sulfate crystals using copper carbonate…
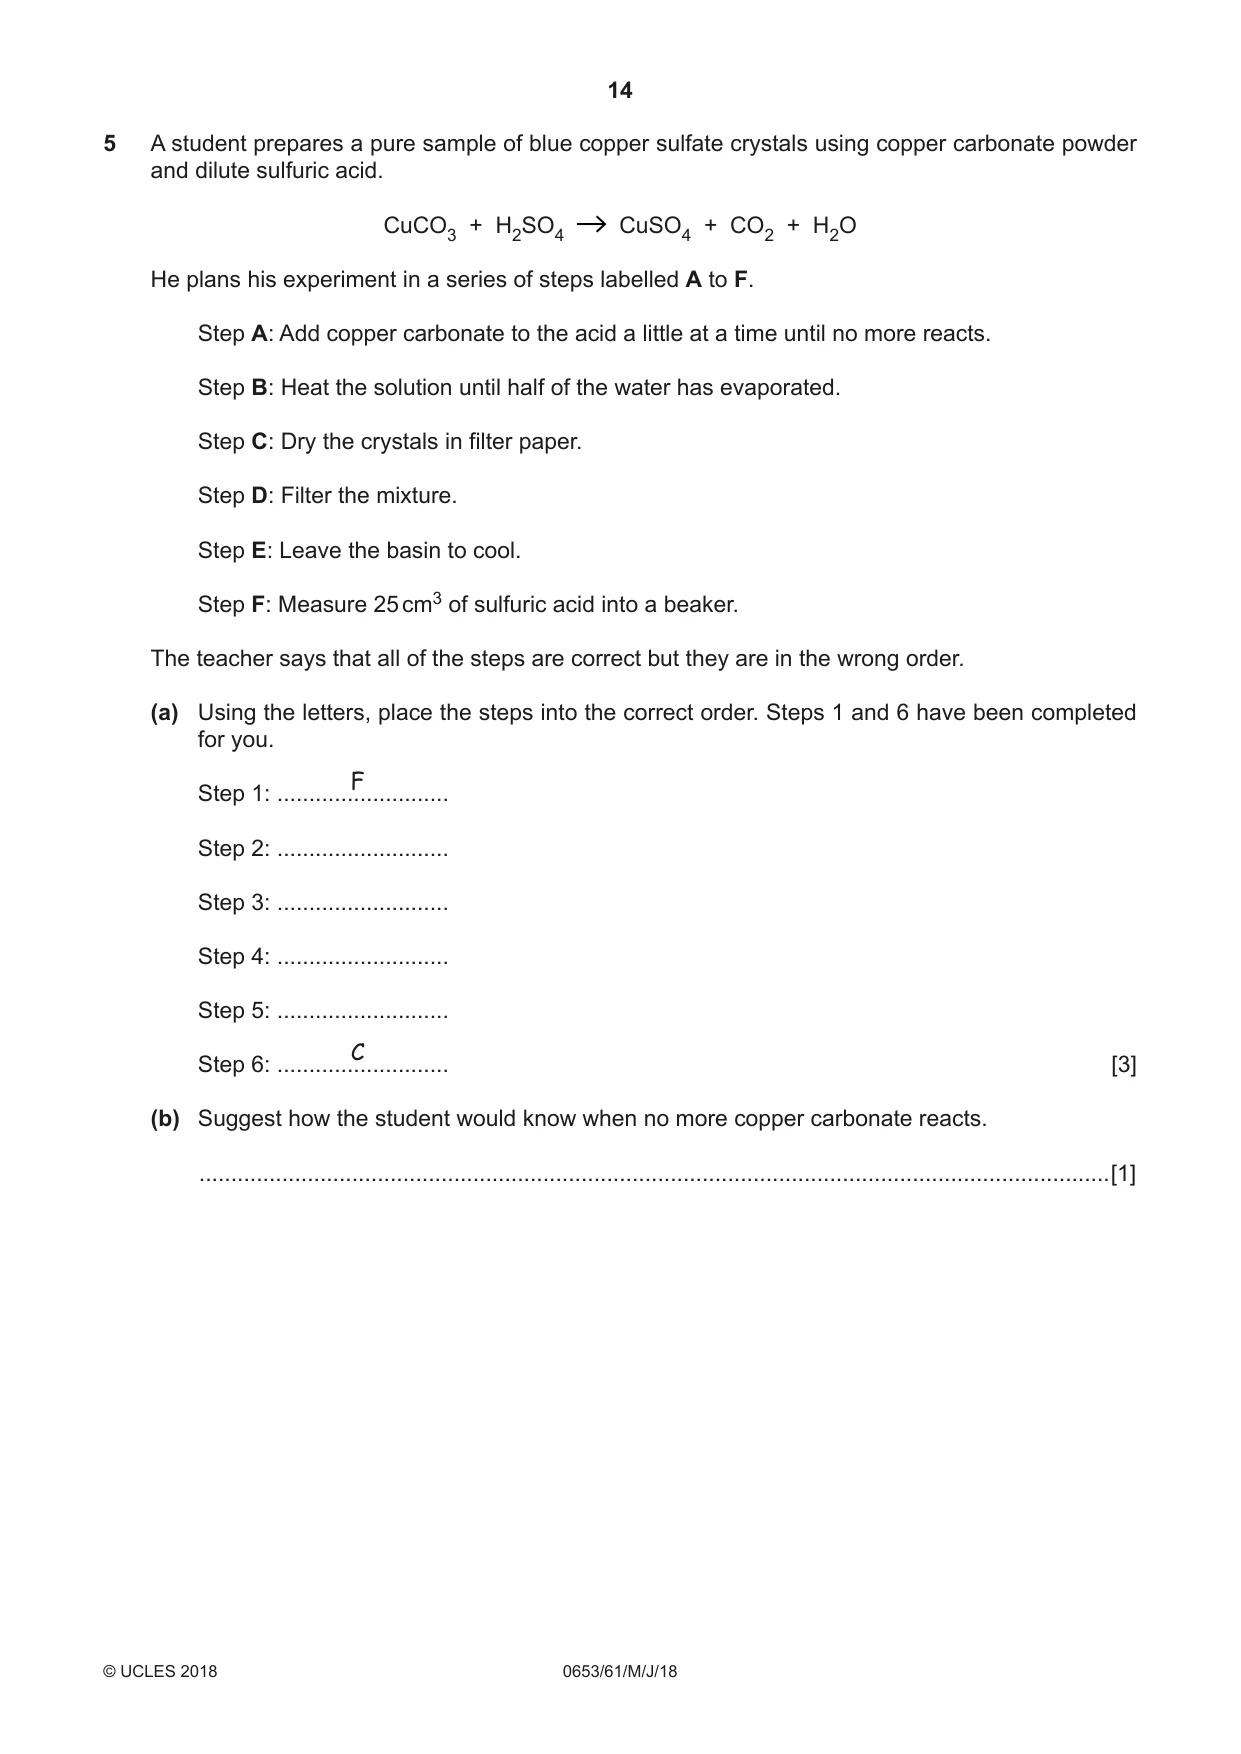
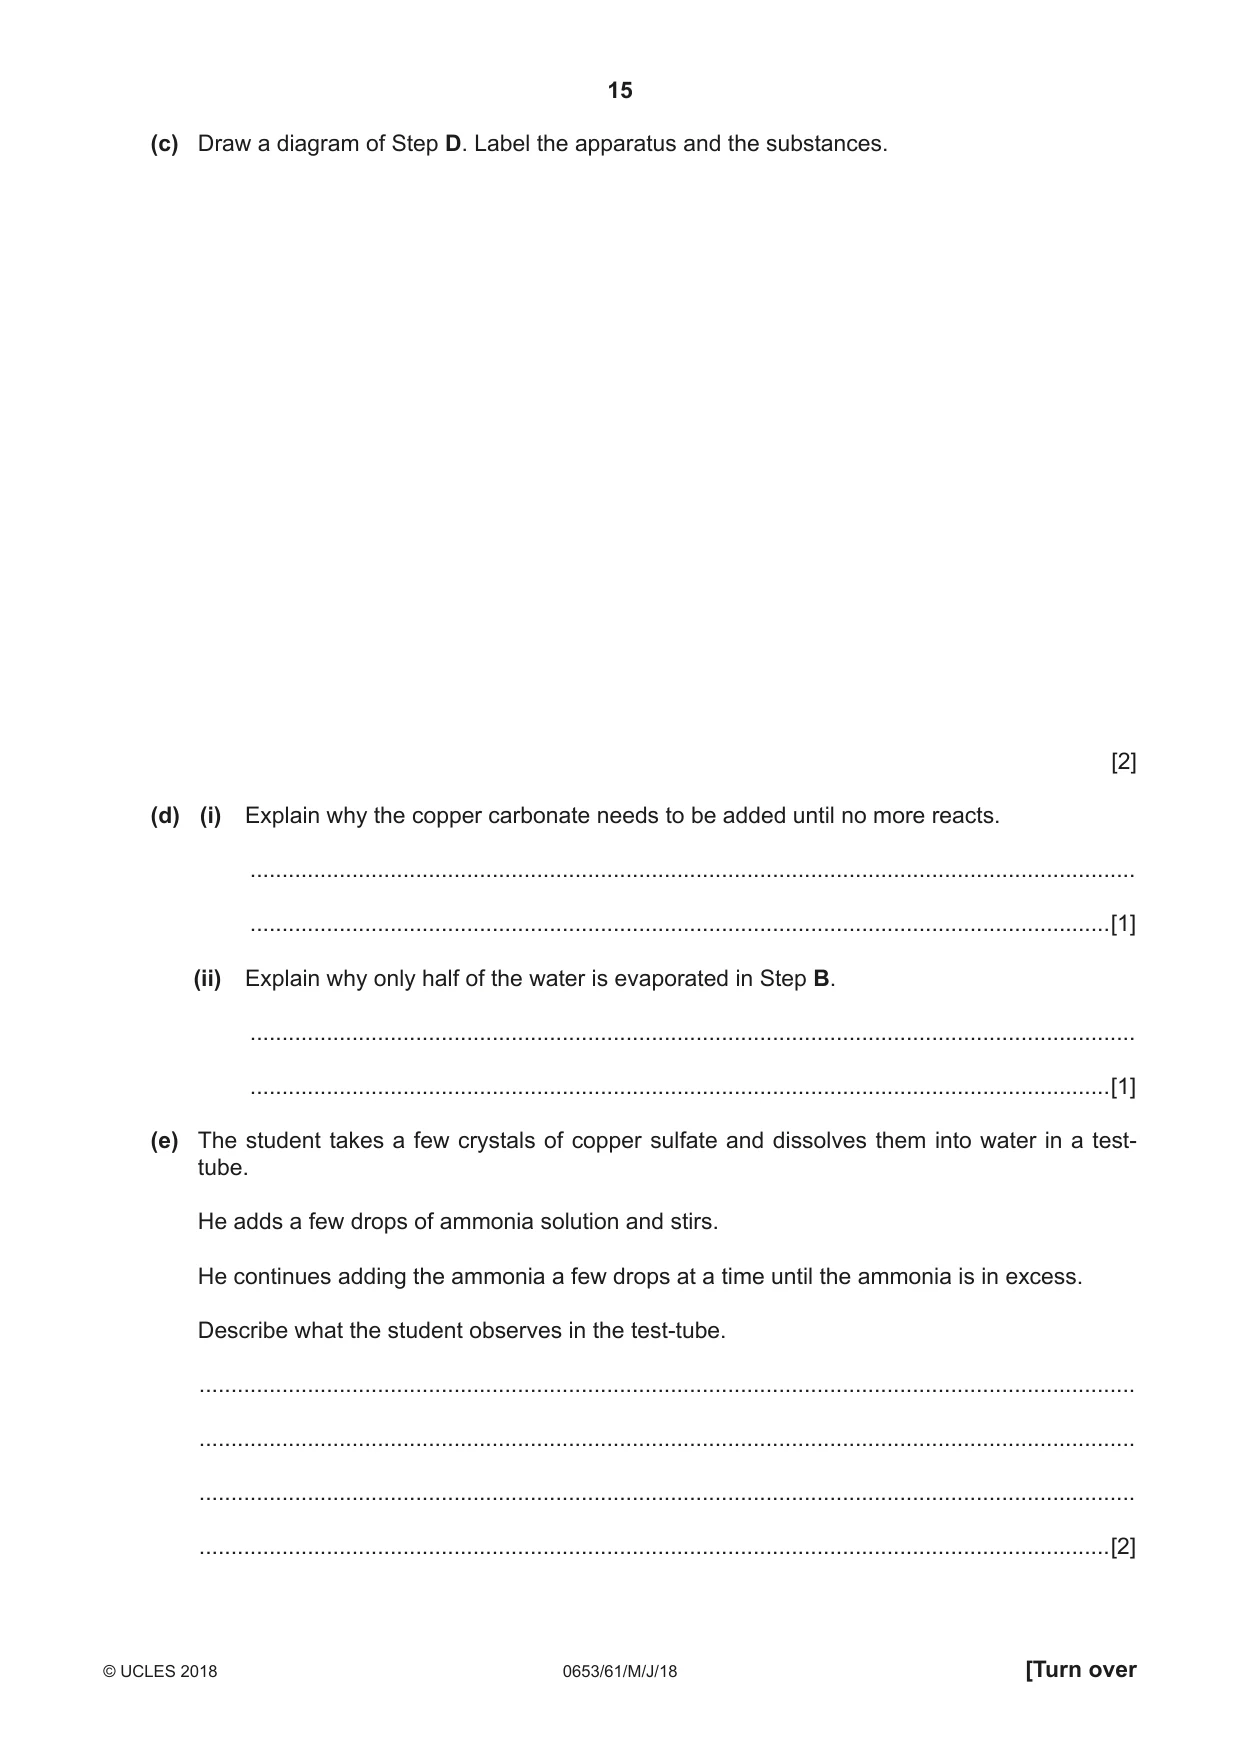
5 A student prepares a pure sample of blue copper sulfate crystals using copper carbonate powder and dilute sulfuric acid. CuCO3 + H2SO4 CuSO4 + CO2 + H2O He plans his experiment in a series of steps labelled A to F. Step A: Add copper carbonate to the acid a little at a time until no more reacts. Step B: Heat the solution until half of the water has evaporated. Step C: Dry the crystals in filter paper. Step D: Filter the mixture. Step E: Leave the basin to cool. Step F: Measure 25 cm3 of sulfuric acid into a beaker. The teacher says that all of the steps are correct but they are in the wrong order. (a) Using the letters, place the steps into the correct order. Steps 1 and 6 have been completed for you. F Step 1: ........................... Step 2: ........................... Step 3: ........................... Step 4: ........................... Step 5: ........................... C Step 6: ........................... [3] (b) Suggest how the student would know when no more copper carbonate reacts. ...............................................................................................................................................[1] (c) Draw a diagram of Step D. Label the apparatus and the substances. [2] (d) (i) Explain why the copper carbonate needs to be added until no more reacts. ........................................................................................................................................... .......................................................................................................................................[1] (ii) Explain why only half of the water is evaporated in Step B. ........................................................................................................................................... .......................................................................................................................................[1] (e) The student takes a few crystals of copper sulfate and dissolves them into water in a test- tube. He adds a few drops of ammonia solution and stirs. He continues adding the ammonia a few drops at a time until the ammonia is in excess. Describe what the student observes in the test-tube. ................................................................................................................................................... ................................................................................................................................................... ................................................................................................................................................... ...............................................................................................................................................[2]
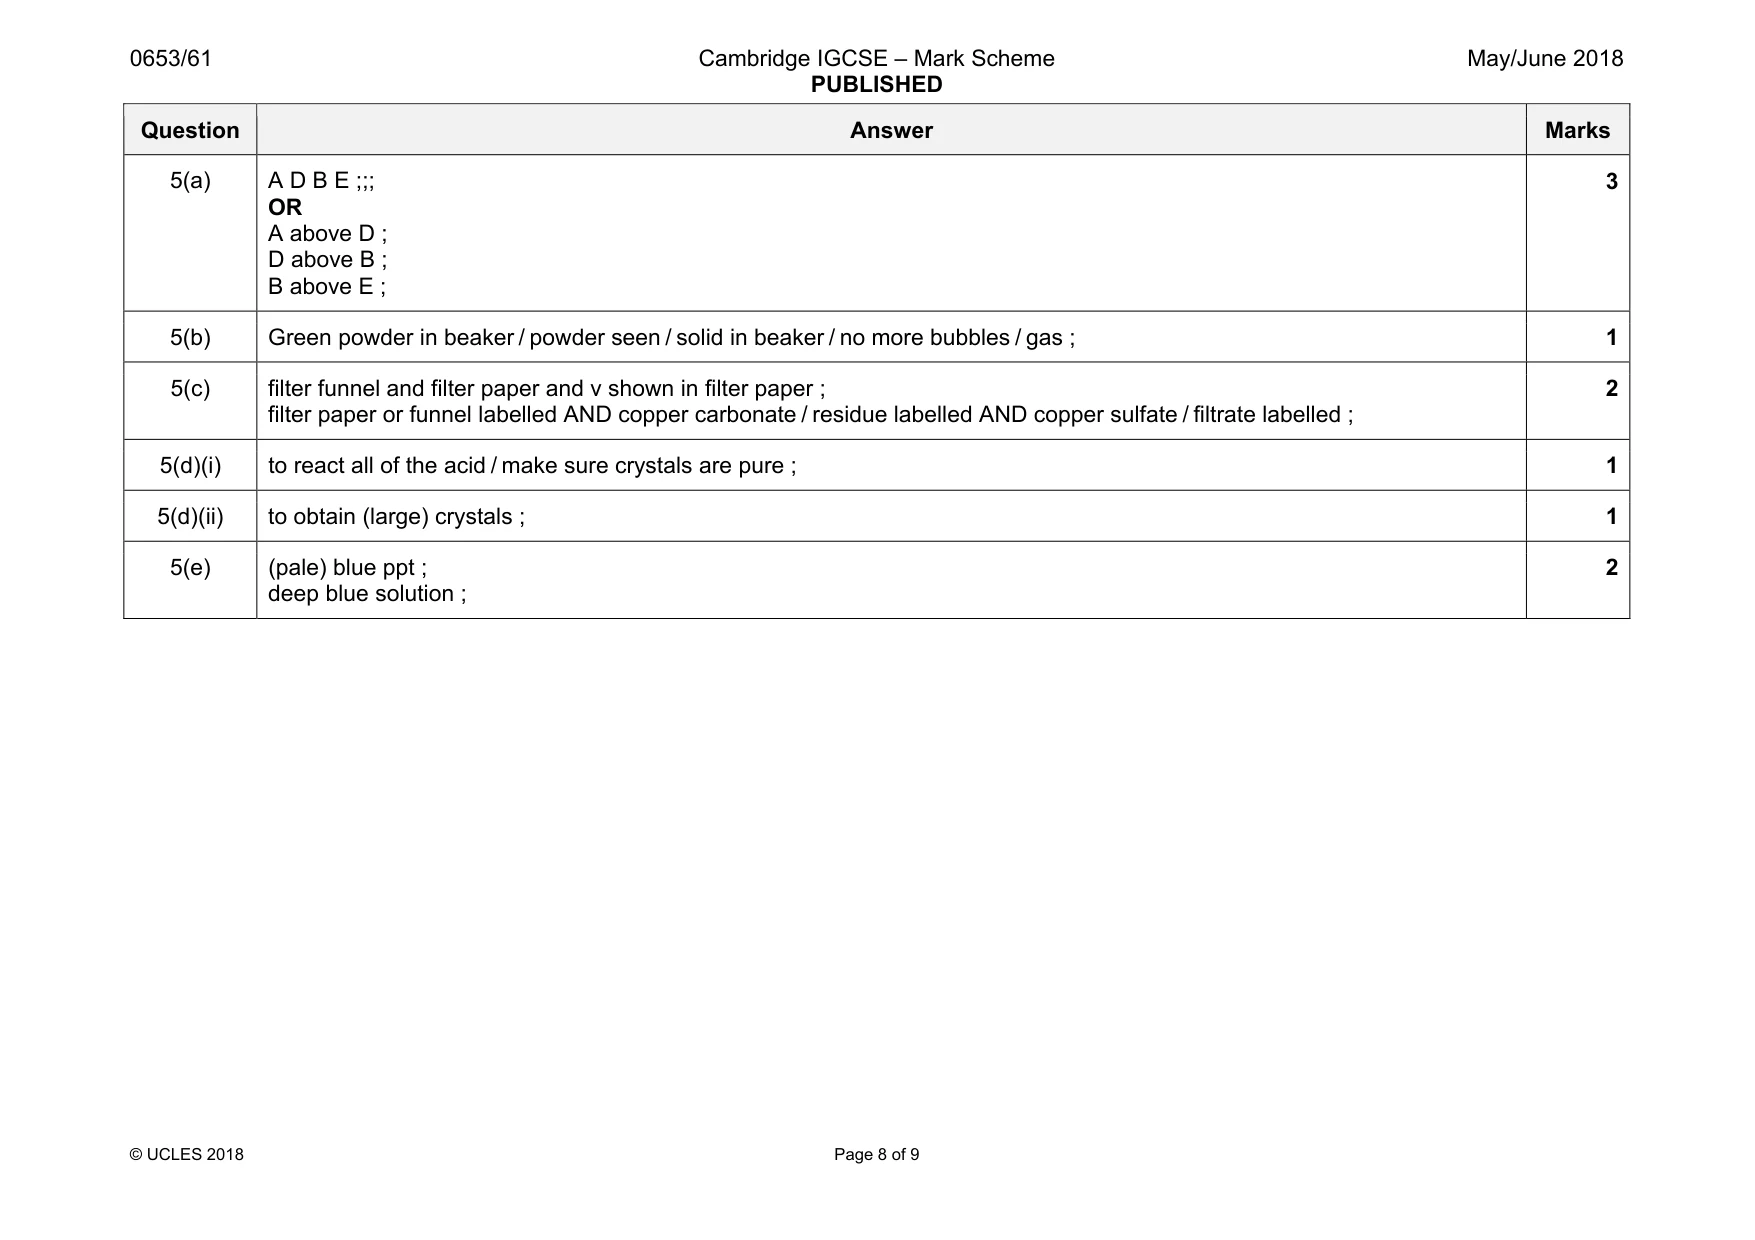
Mark scheme: 5(a) A D B E ;;; OR A above D ; D above B ; B above E ; 3 5(b) Green powder in beaker / powder seen / solid in beaker / no more bubbles / gas ; 1 5(c) filter funnel and filter paper and v shown in filter paper ; filter paper or funnel labelled AND copper carbonate / residue labelled AND copper sulfate / filtrate labelled ; 2 5(d)(i) to react all of the acid / make sure crystals are pure ; 1 5(d)(ii) to obtain (large) crystals ; 1 5(e) (pale) blue ppt ; deep blue solution ; 2
Q6 · A student investigates the energy efficiency of a model railway
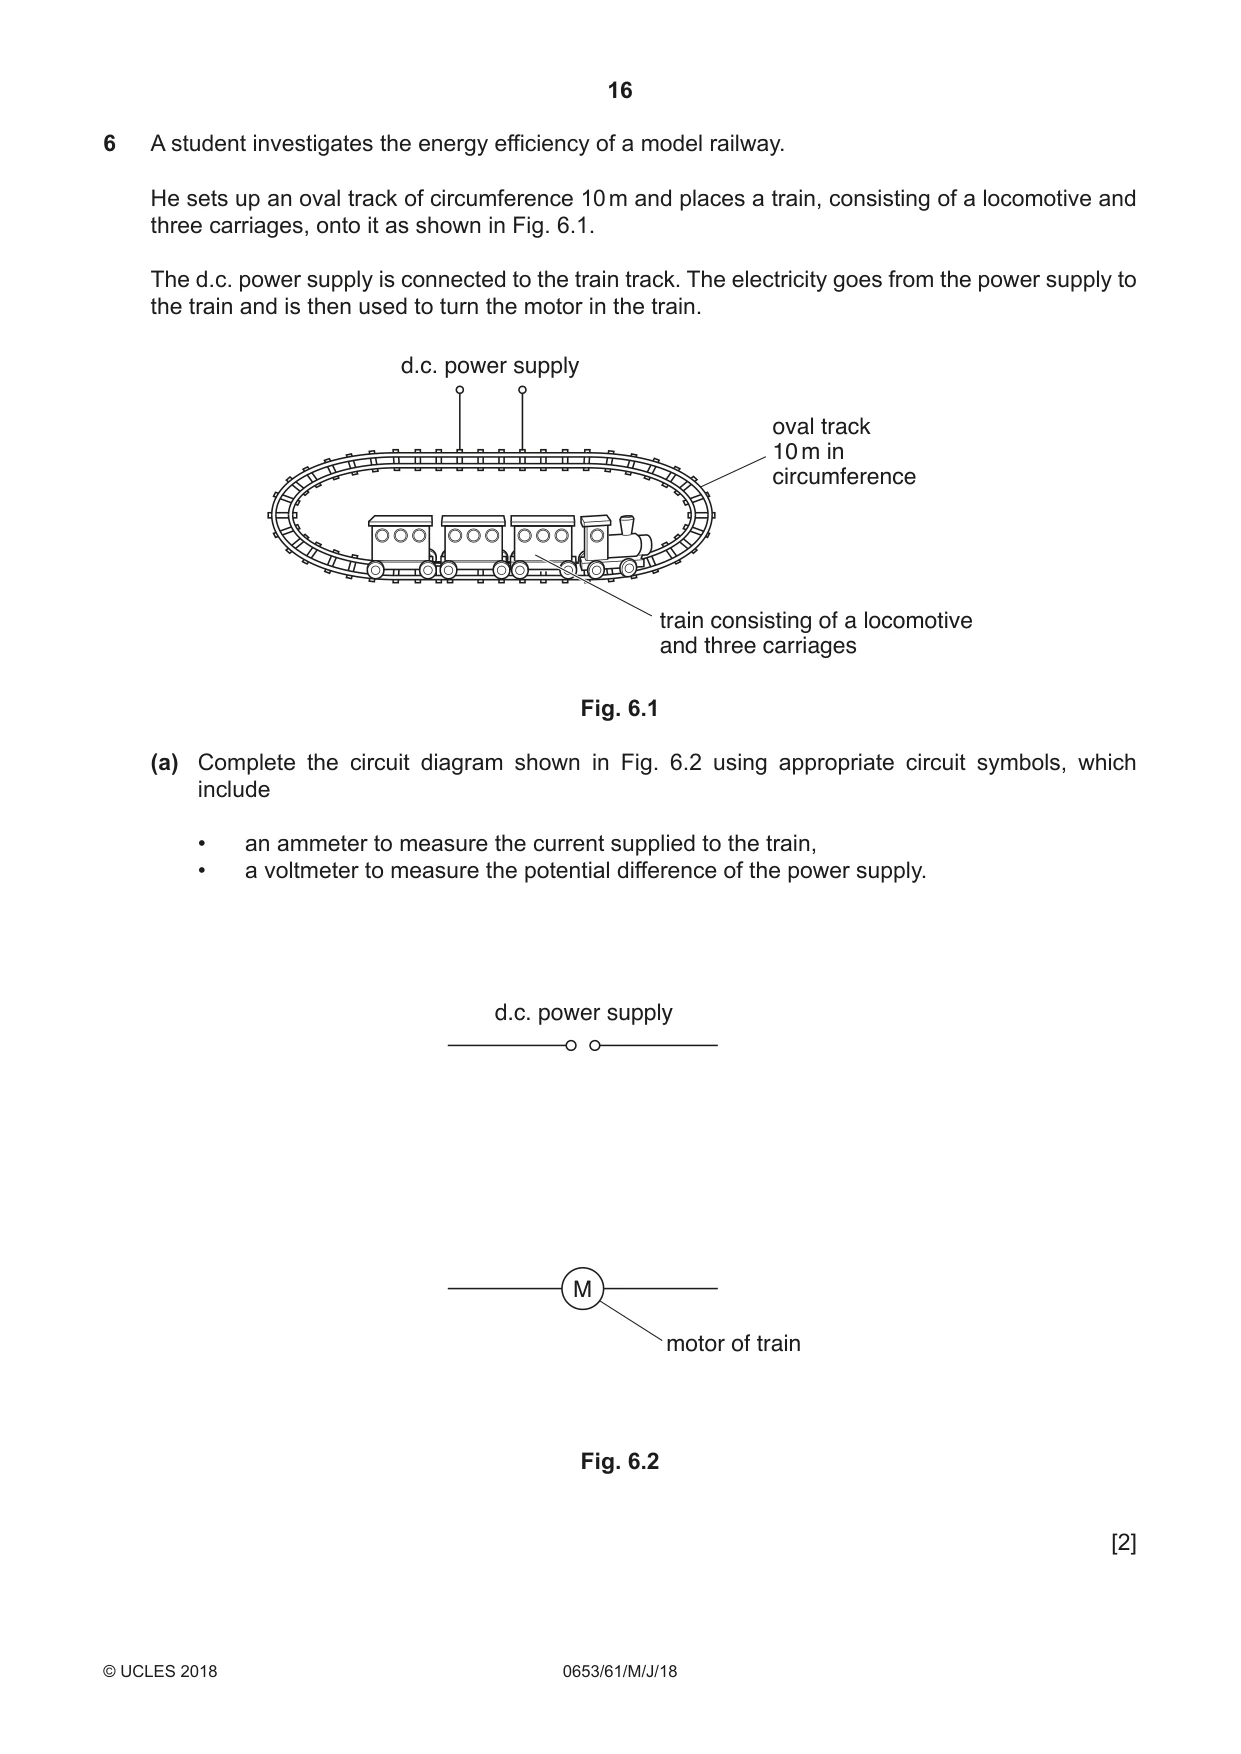
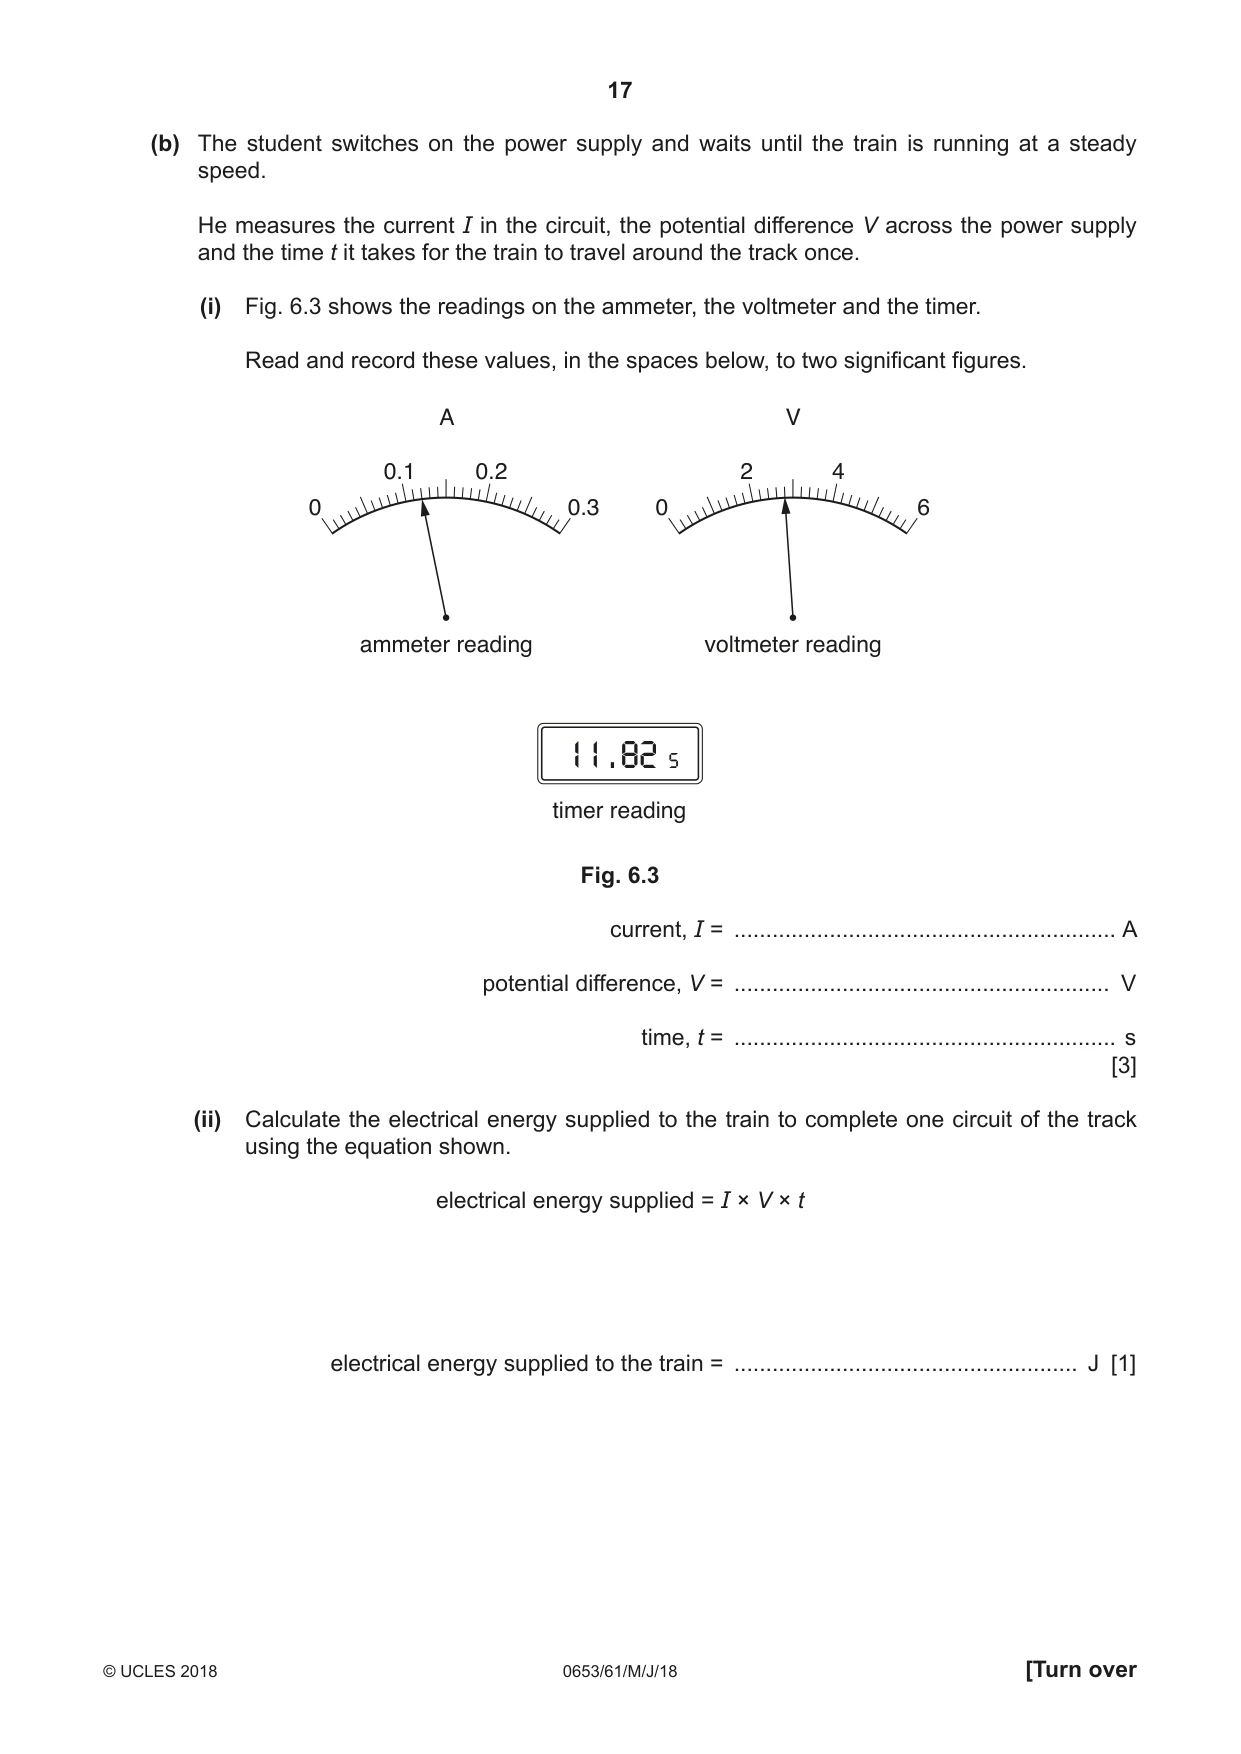
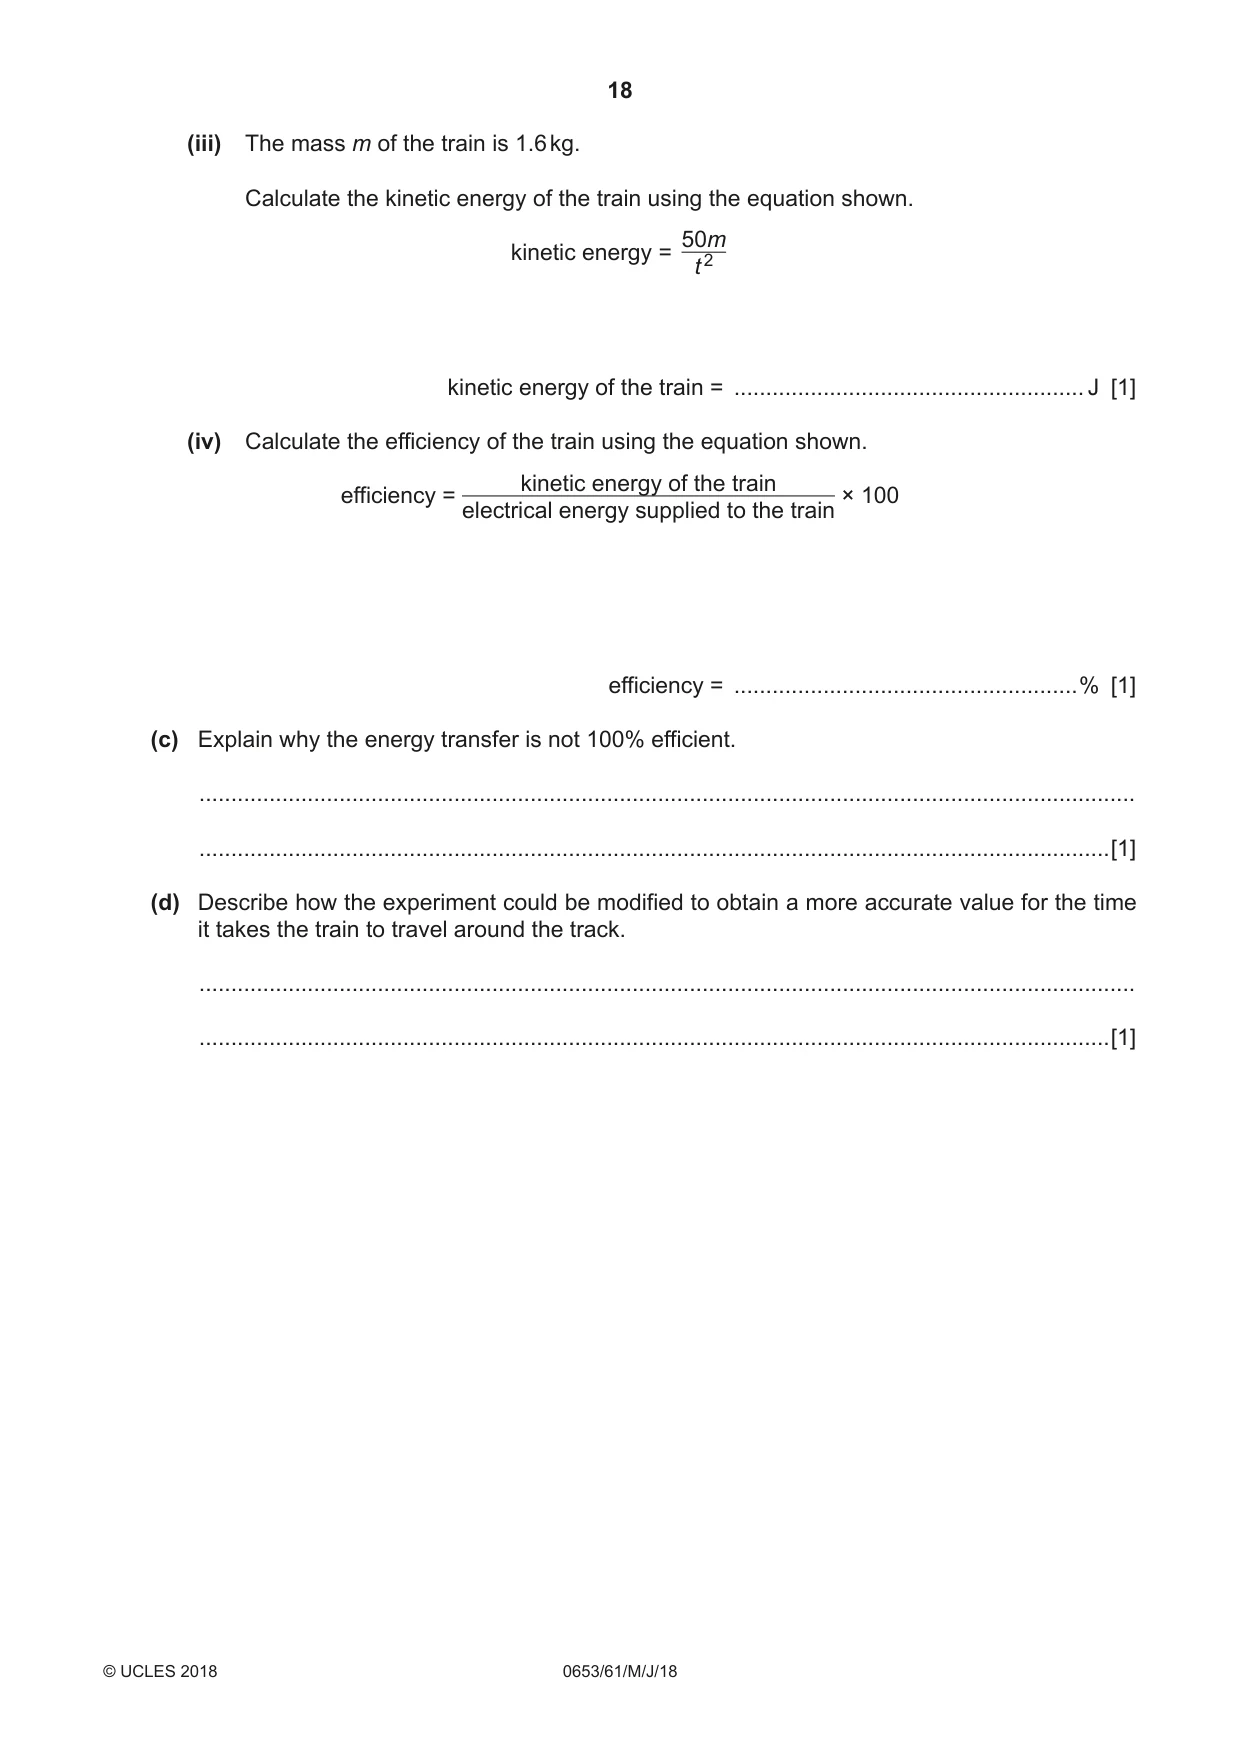
6 A student investigates the energy efficiency of a model railway. He sets up an oval track of circumference 10 m and places a train, consisting of a locomotive and three carriages, onto it as shown in Fig. 6.1. The d.c. power supply is connected to the train track. The electricity goes from the power supply to the train and is then used to turn the motor in the train. d.c. power supply oval track 10 m in circumference train consisting of a locomotive and three carriages Fig. 6.1 (a) Complete the circuit diagram shown in Fig. 6.2 using appropriate circuit symbols, which include • an ammeter to measure the current supplied to the train, • a voltmeter to measure the potential difference of the power supply. d.c. power supply M motor of train Fig. 6.2 [2] (b) The student switches on the power supply and waits until the train is running at a steady speed. He measures the current I in the circuit, the potential difference V across the power supply and the time t it takes for the train to travel around the track once. (i) Fig. 6.3 shows the readings on the ammeter, the voltmeter and the timer. Read and record these values, in the spaces below, to two significant figures. A V 0.1 0.2 2 4 0 0.3 0 6 ammeter reading voltmeter reading 11 . 82 s timer reading Fig. 6.3 current, I = ............................................................ A potential difference, V = ........................................................... V time, t = ............................................................ s [3] (ii) Calculate the electrical energy supplied to the train to complete one circuit of the track using the equation shown. electrical energy supplied = I × V × t electrical energy supplied to the train = ...................................................... J [1] (iii) The mass m of the train is 1.6 kg. Calculate the kinetic energy of the train using the equation shown. 50m kinetic energy = 2 t kinetic energy of the train = ....................................................... J [1] (iv) Calculate the efficiency of the train using the equation shown. kinetic energy of the train efficiency = × 100 electrical energy supplied to the train efficiency = ......................................................% [1] (c) Explain why the energy transfer is not 100% efficient. ................................................................................................................................................... ...............................................................................................................................................[1] (d) Describe how the experiment could be modified to obtain a more accurate value for the time it takes the train to travel around the track. ................................................................................................................................................... ...............................................................................................................................................[1]
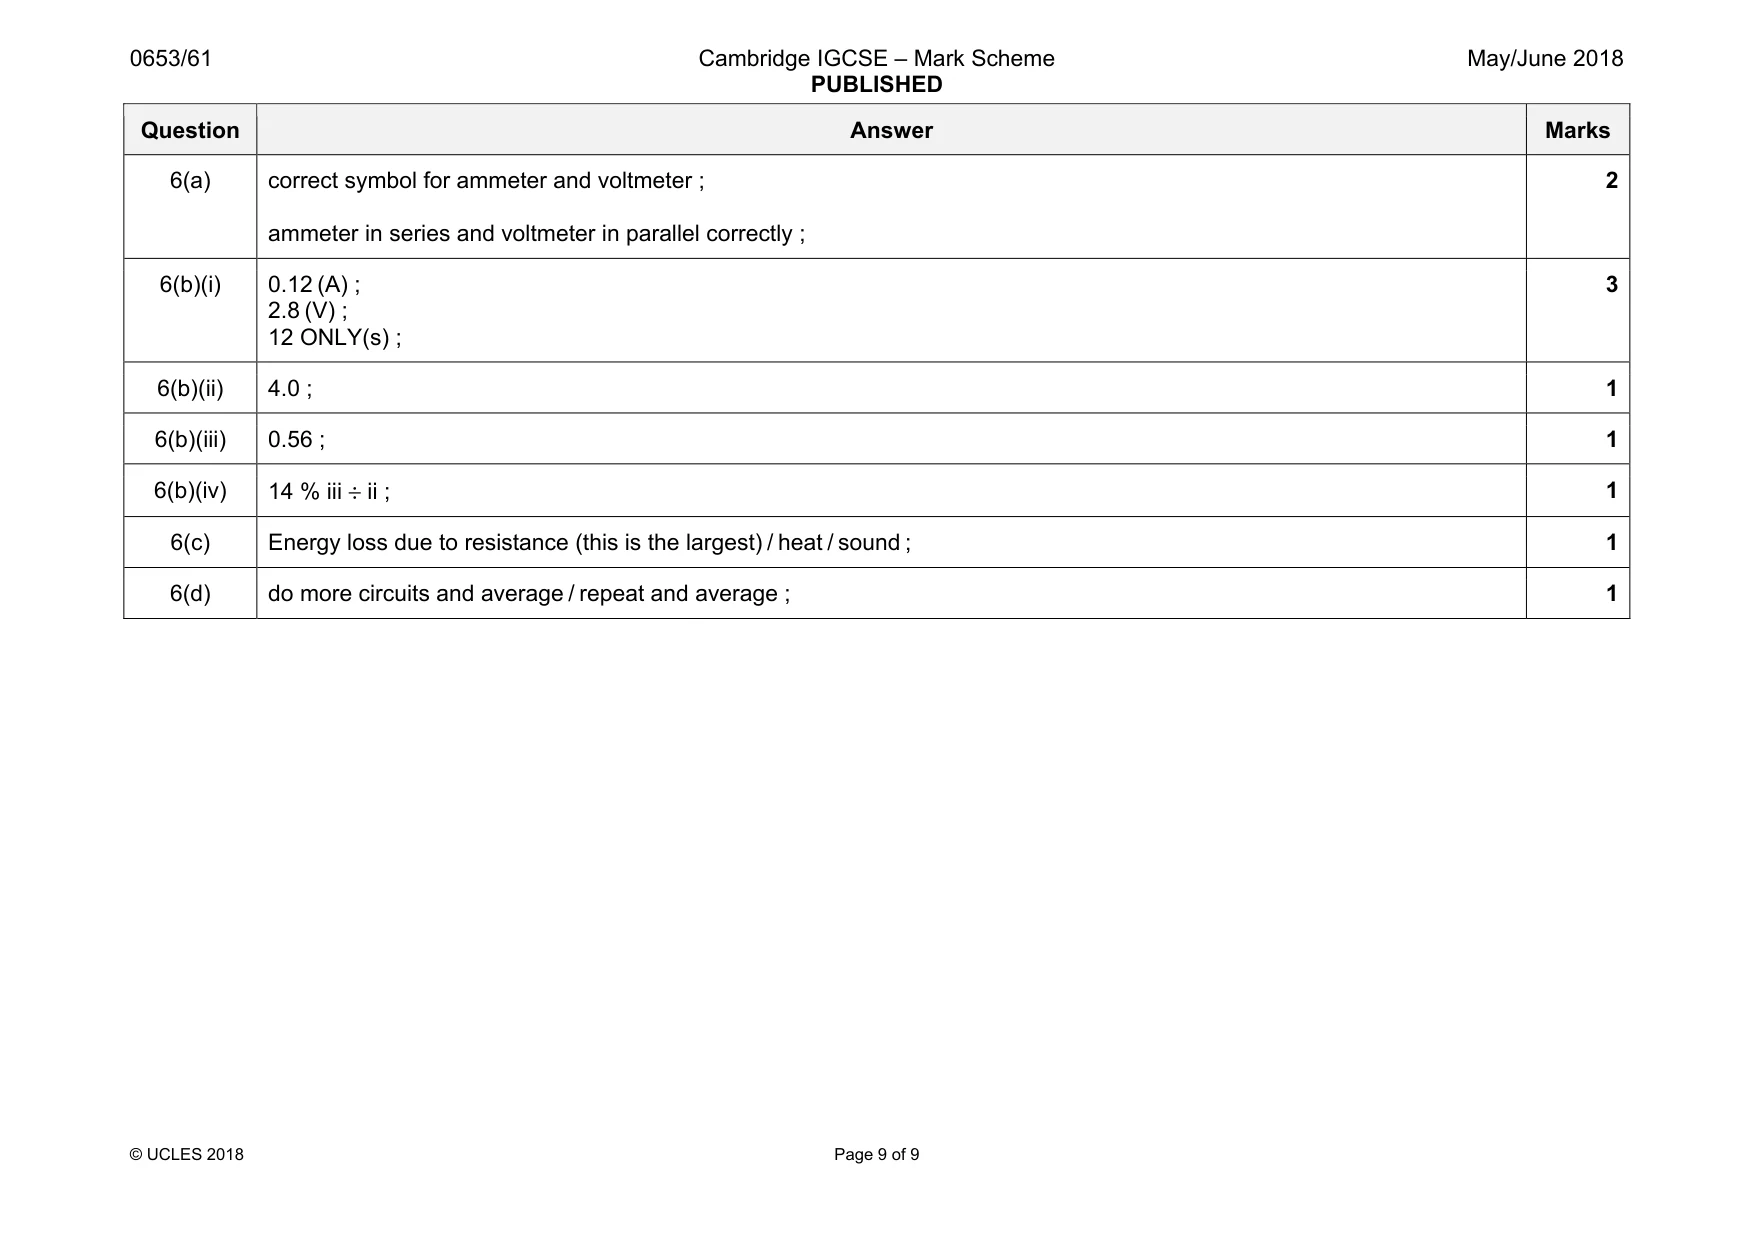
Mark scheme: 6(a) correct symbol for ammeter and voltmeter ; ammeter in series and voltmeter in parallel correctly ; 2 6(b)(i) 0.12 (A) ; 2.8 (V) ; 12 ONLY(s) ; 3 6(b)(ii) 4.0 ; 1 6(b)(iii) 0.56 ; 1 6(b)(iv) 14 % iii ÷ ii ; 1 6(c) Energy loss due to resistance (this is the largest) / heat / sound ; 1 6(d) do more circuits and average / repeat and average ; 1
What was in this paper
The subtopics covered by these 6 questions, and how many questions each got. Open one in a new tab to see every Cambridge question on it.
What you needed in this session
Cambridge’s own grade thresholds for 2018 May/June, Paper 6 · Variant 1. A higher threshold means an easier paper — the bar moves with how the cohort did.