Cambridge IGCSE Science - Combined 0653 — 2015 Oct/Nov Paper 6 · Variant 3
0653/63/O/N/15 · 60 marks · ≈68 min
The question paper and its mark scheme, free to read here and free to download. This is Cambridge’s own paper, exactly as it was sat.
Question paper20 pages


Mark scheme4 pages
Answers below. Sit the paper first if you are practising.
Paper as text
Question paper, page 1
This document consists of 19 printed pages and 1 blank page. IB15 11_0653_63/RP © UCLES 2015 [Turn over *9548043922* Cambridge International Examinations Cambridge International General Certificate of Secondary Education COMBINED SCIENCE 0653/63 Paper 6 Alternative to Practical October/November 2015 1 hour Candidates answer on the Question Paper. No Additional Materials are required. READ THESE INSTRUCTIONS FIRST Write your Centre number, candidate number and name on all the work you hand in. Write in dark blue or black pen. You may use an HB pencil for any diagrams or graphs. Do not use staples, paper clips, glue or correction fluid. DO NOT WRITE IN ANY BARCODES. Answer all questions. Electronic calculators may be used. You may lose marks if you do not show your working or if you do not use appropriate units. At the end of the examination, fasten all your work securely together. The number of marks is given in brackets [ ] at the end of each question or part question.
Question paper, page 2
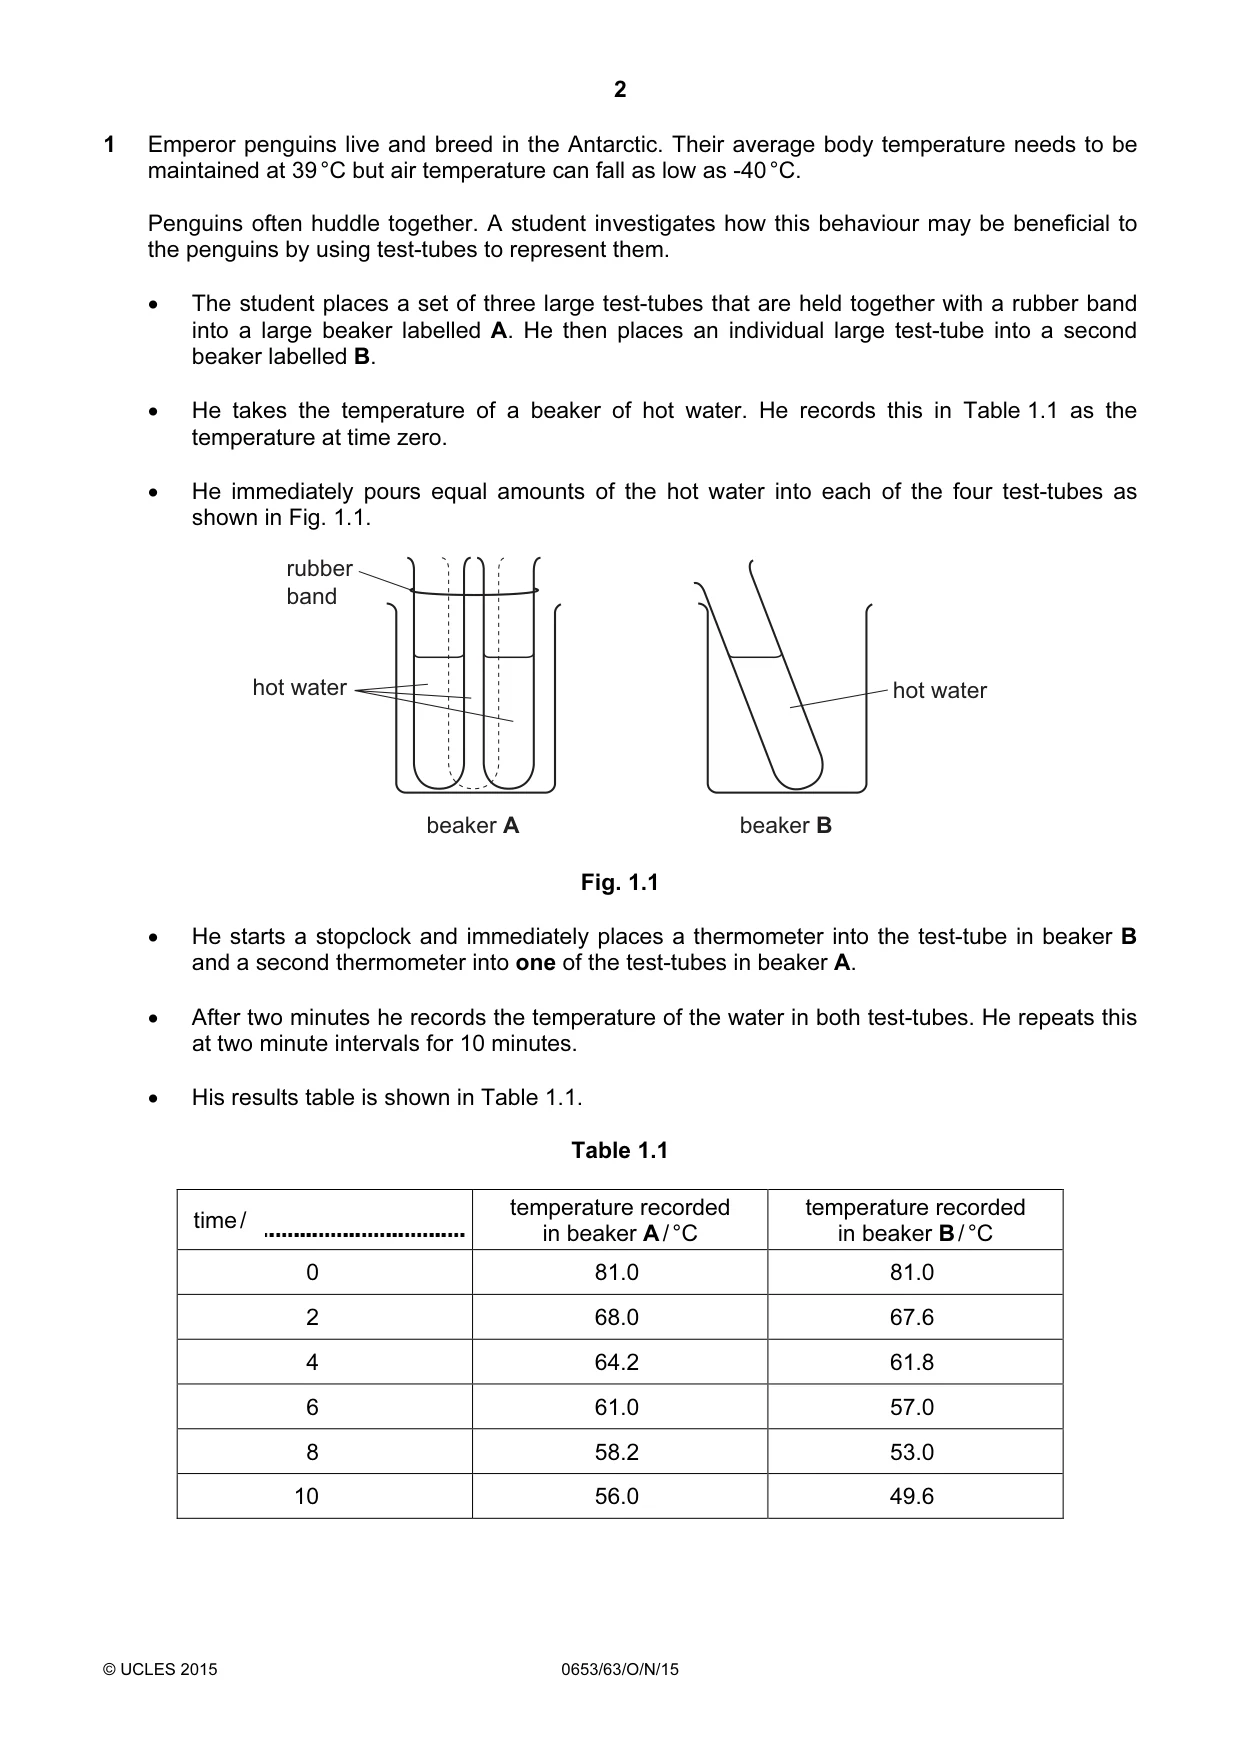
2 © UCLES 2015 0653/63/O/N/15 1 Emperor penguins live and breed in the Antarctic. Their average body temperature needs to be maintained at 39 °C but air temperature can fall as low as -40 °C. Penguins often huddle together. A student investigates how this behaviour may be beneficial to the penguins by using test-tubes to represent them. • The student places a set of three large test-tubes that are held together with a rubber band into a large beaker labelled A. He then places an individual large test-tube into a second beaker labelled B. • He takes the temperature of a beaker of hot water. He records this in Table 1.1 as the temperature at time zero. • He immediately pours equal amounts of the hot water into each of the four test-tubes as shown in Fig. 1.1. hot water hot water rubber band beaker B beaker A Fig. 1.1 • He starts a stopclock and immediately places a thermometer into the test-tube in beaker B and a second thermometer into one of the test-tubes in beaker A. • After two minutes he records the temperature of the water in both test-tubes. He repeats this at two minute intervals for 10 minutes. • His results table is shown in Table 1.1. Table 1.1 time / temperature recorded in beaker A / °C temperature recorded in beaker B / °C 0 81.0 81.0 2 68.0 67.6 4 64.2 61.8 6 61.0 57.0 8 58.2 53.0 10 56.0 49.6
Question paper, page 3
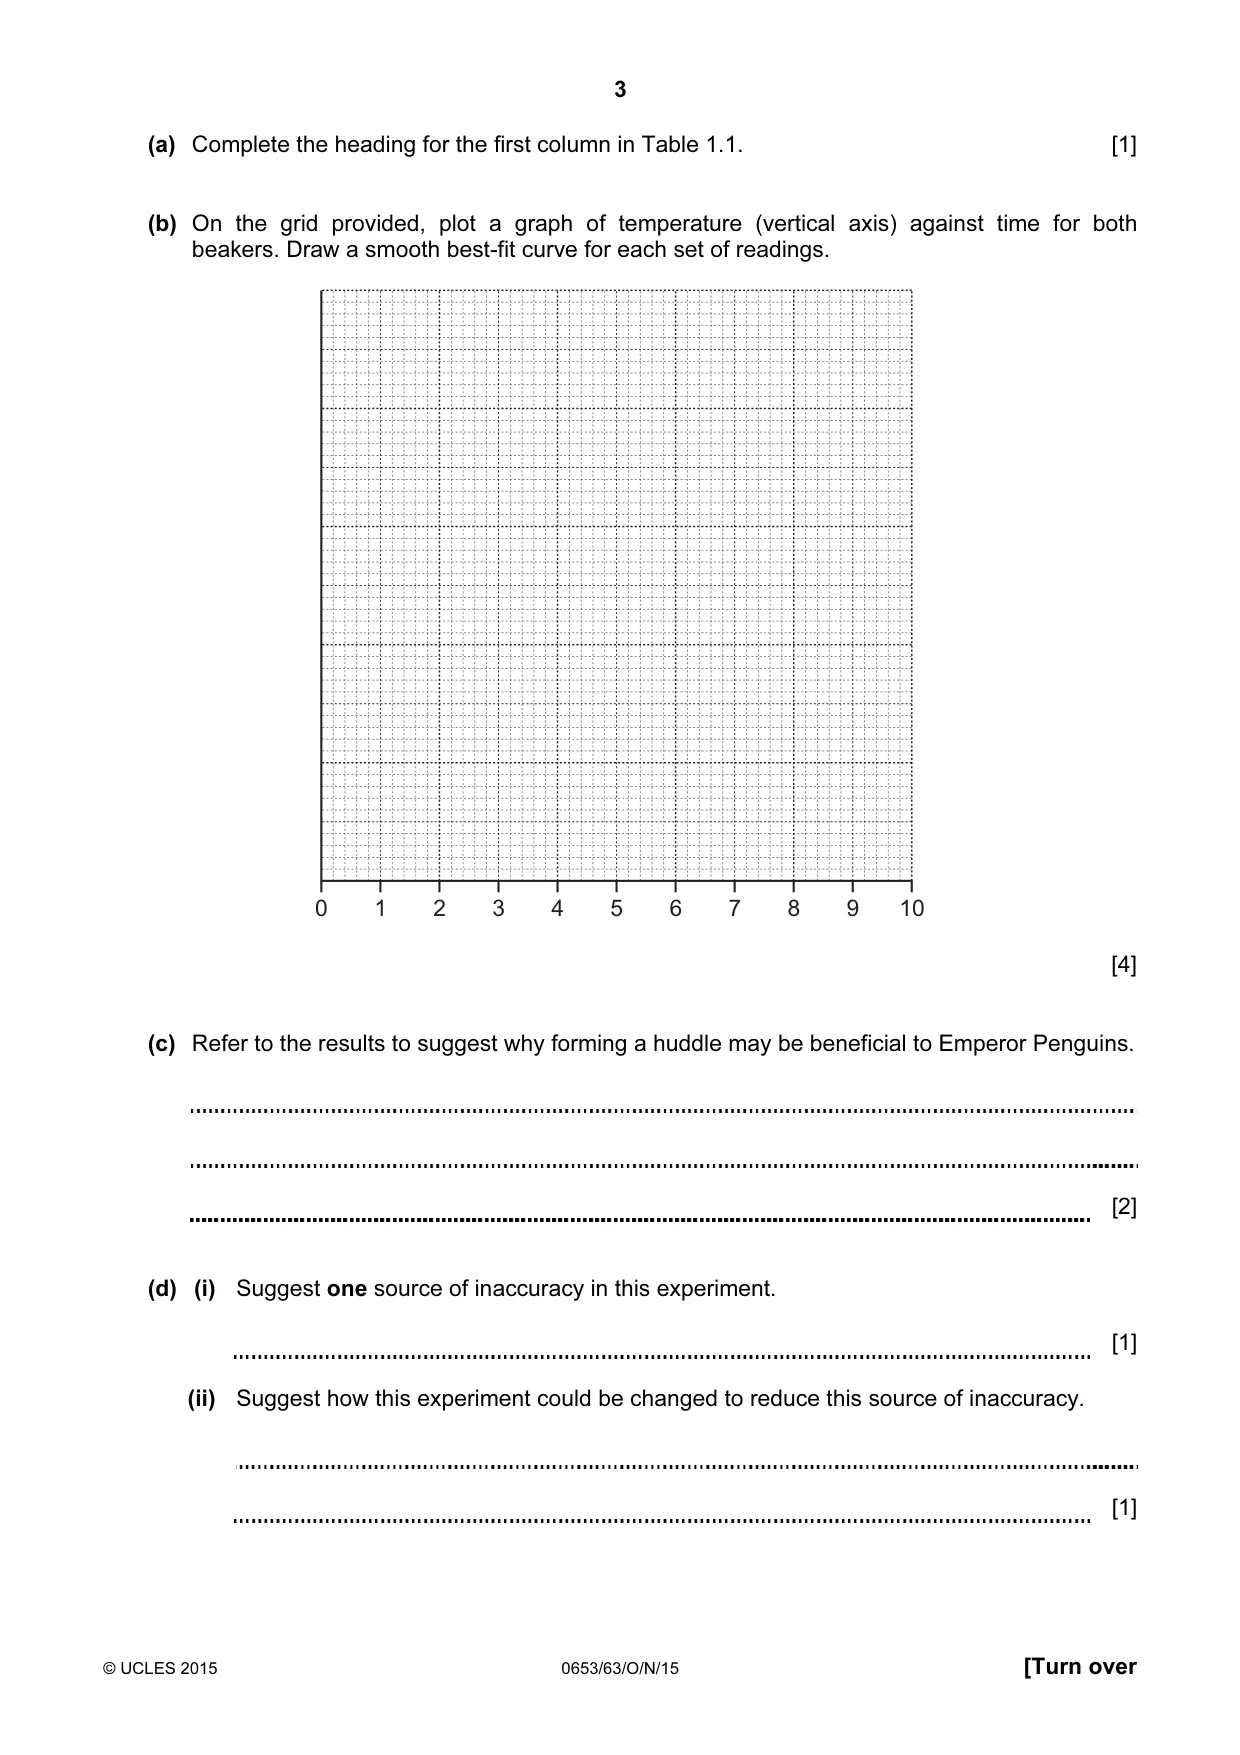
3 © UCLES 2015 0653/63/O/N/15 [Turn over (a) Complete the heading for the first column in Table 1.1. [1] (b) On the grid provided, plot a graph of temperature (vertical axis) against time for both beakers. Draw a smooth best-fit curve for each set of readings. 0 1 2 3 4 5 6 7 8 9 10 [4] (c) Refer to the results to suggest why forming a huddle may be beneficial to Emperor Penguins. [2] (d) (i) Suggest one source of inaccuracy in this experiment. [1] (ii) Suggest how this experiment could be changed to reduce this source of inaccuracy. [1]
Question paper, page 4
4 © UCLES 2015 0653/63/O/N/15 (e) Describe how the results from this experiment could be made more reliable. [1]
Question paper, page 5
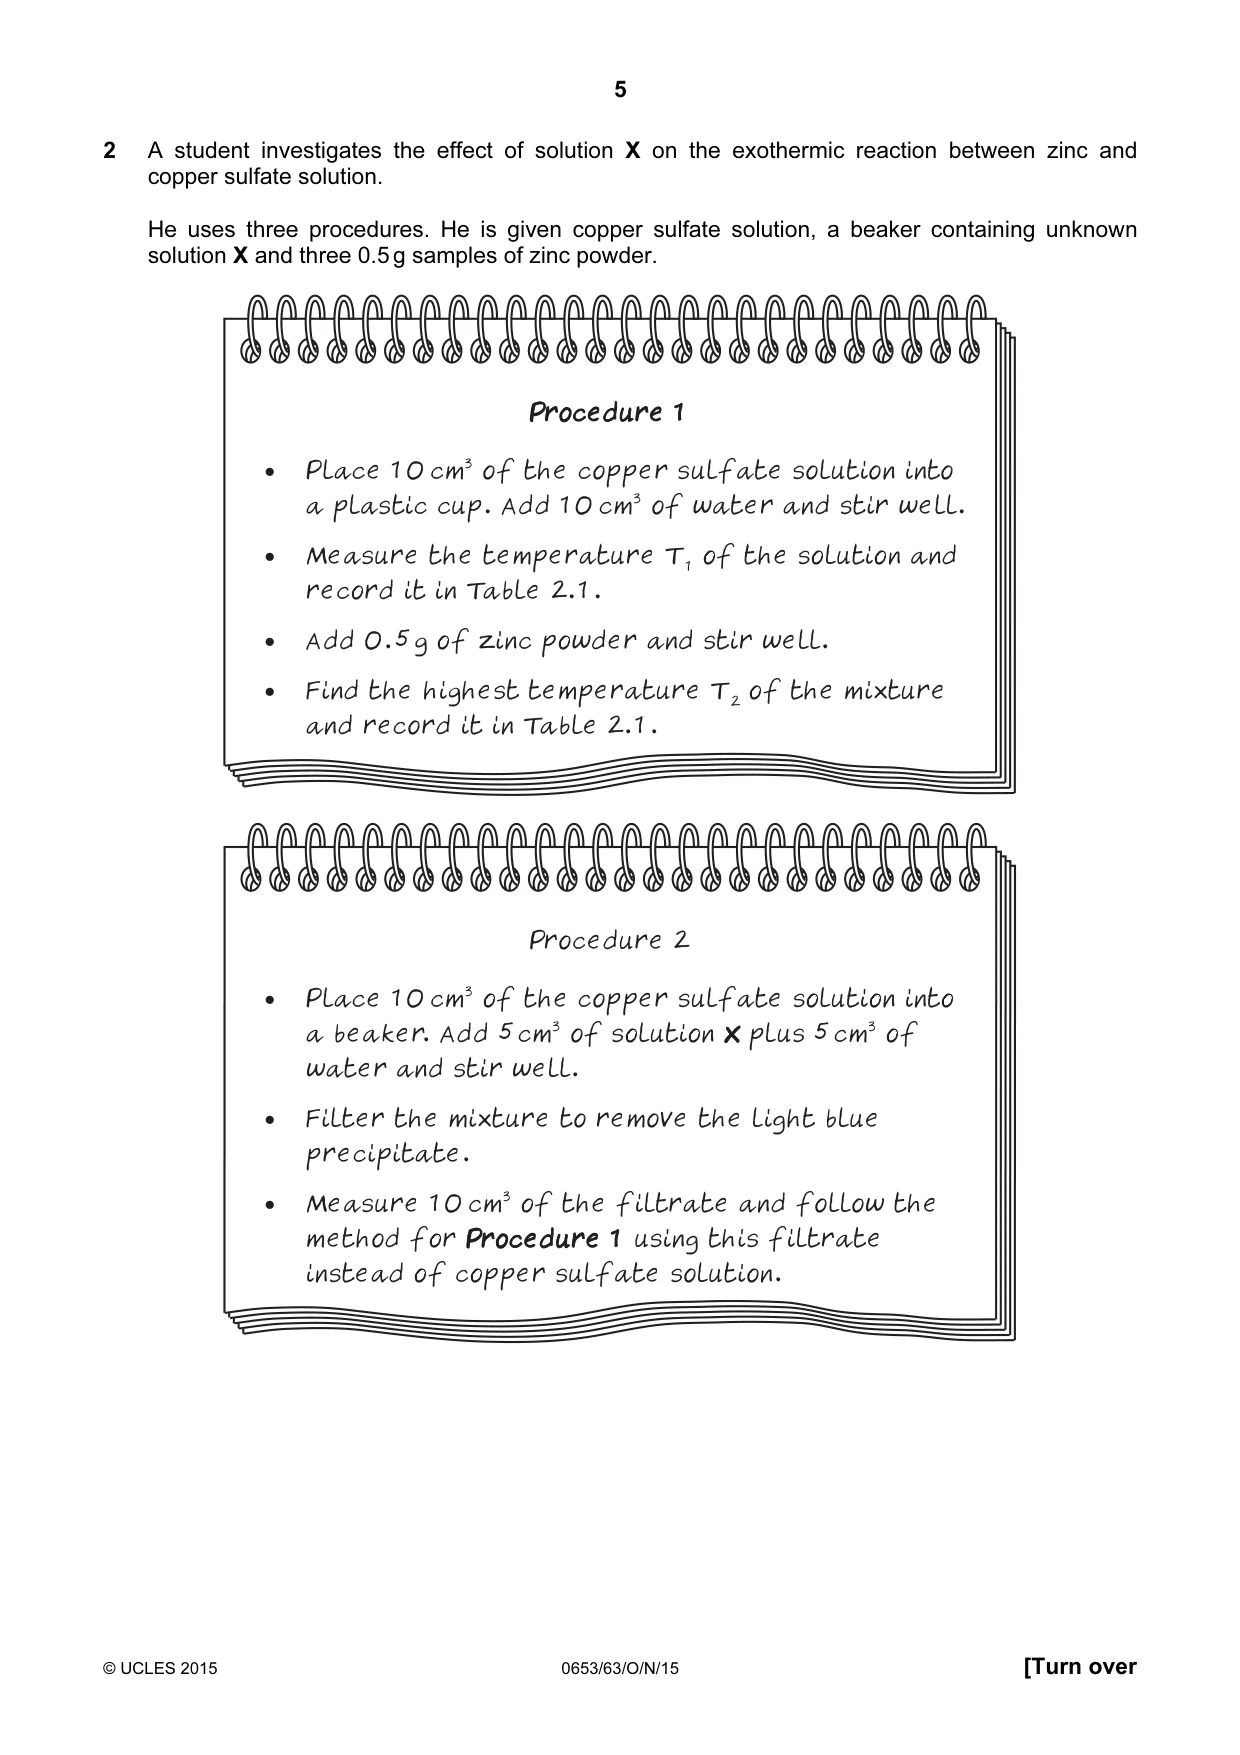
5 © UCLES 2015 0653/63/O/N/15 [Turn over 2 A student investigates the effect of solution X on the exothermic reaction between zinc and copper sulfate solution. He uses three procedures. He is given copper sulfate solution, a beaker containing unknown solution X and three 0.5 g samples of zinc powder. • Place 1O cm3 of the copper sulfate solution into a plastic cup. Add 1O cm3 of water and stir well. • Measure the temperature T1 of the solution and record it in Table 2.1. • Add O.5 g of zinc powder and stir well. • Find the highest temperature T2 of the mixture and record it in Table 2.1. Procedure 1 • Place 1O cm3 of the copper sulfate solution into a beaker. Add 5 cm3 of solution X plus 5 cm3 of water and stir well. • Filter the mixture to remove the light blue precipitate. • Measure 1O cm3 of the filtrate and follow the method for Procedure 1 using this filtrate instead of copper sulfate solution. Procedure 2
Question paper, page 6
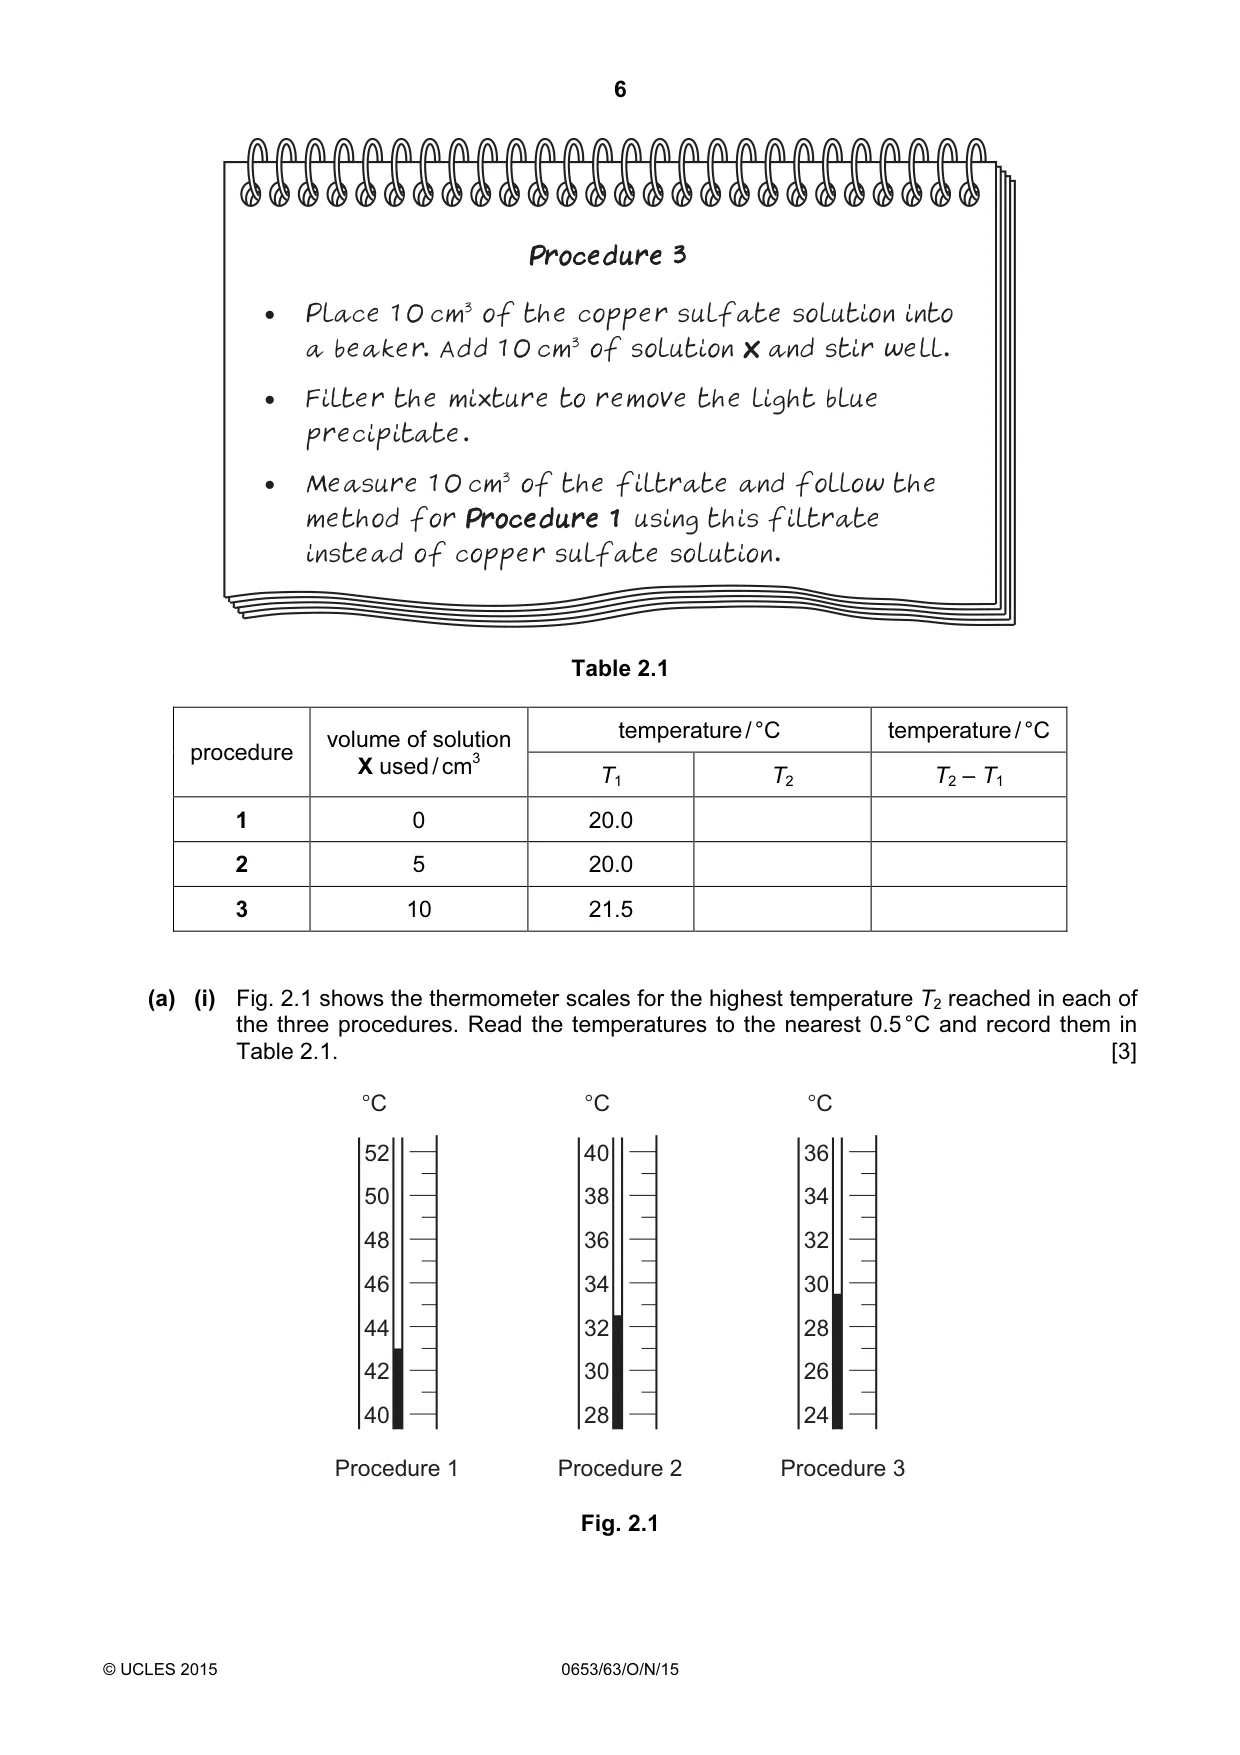
6 © UCLES 2015 0653/63/O/N/15 • Place 1O cm3 of the copper sulfate solution into a beaker. Add 1O cm3 of solution X and stir well. • Filter the mixture to remove the light blue precipitate. • Measure 1O cm3 of the filtrate and follow the method for Procedure 1 using this filtrate instead of copper sulfate solution. Procedure 3 Table 2.1 procedure volume of solution X used / cm3 temperature / °C temperature / °C T1 T2 T2 – T1 1 0 20.0 2 5 20.0 3 10 21.5 (a) (i) Fig. 2.1 shows the thermometer scales for the highest temperature T2 reached in each of the three procedures. Read the temperatures to the nearest 0.5 °C and record them in Table 2.1. [3] 52 50 48 46 44 42 40 40 38 36 34 32 30 28 36 34 32 30 28 26 24 °C Procedure 1 °C Procedure 2 °C Procedure 3 Fig. 2.1
Question paper, page 7
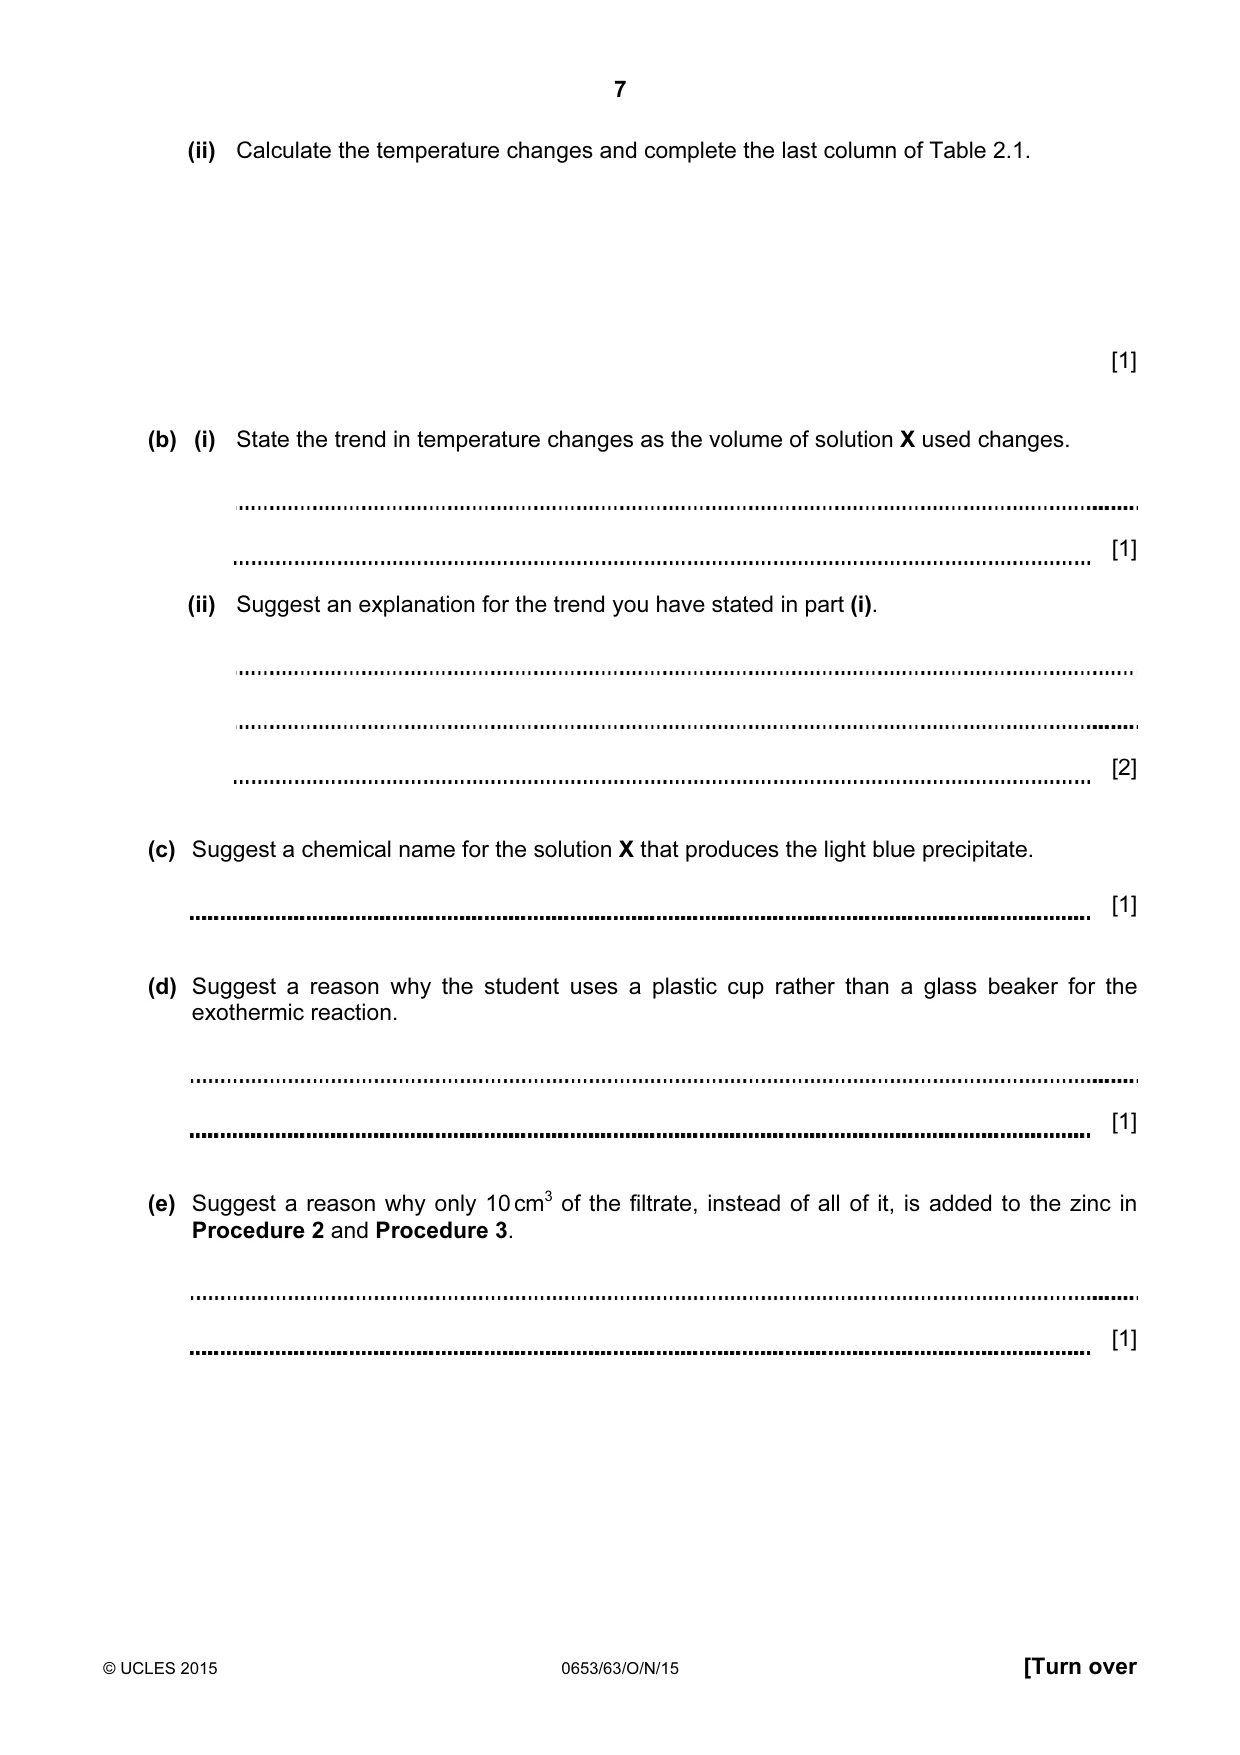
7 © UCLES 2015 0653/63/O/N/15 [Turn over (ii) Calculate the temperature changes and complete the last column of Table 2.1. [1] (b) (i) State the trend in temperature changes as the volume of solution X used changes. [1] (ii) Suggest an explanation for the trend you have stated in part (i). [2] (c) Suggest a chemical name for the solution X that produces the light blue precipitate. [1] (d) Suggest a reason why the student uses a plastic cup rather than a glass beaker for the exothermic reaction. [1] (e) Suggest a reason why only 10 cm3 of the filtrate, instead of all of it, is added to the zinc in Procedure 2 and Procedure 3. [1]
Question paper, page 8
8 © UCLES 2015 0653/63/O/N/15 BLANK PAGE
Question paper, page 9
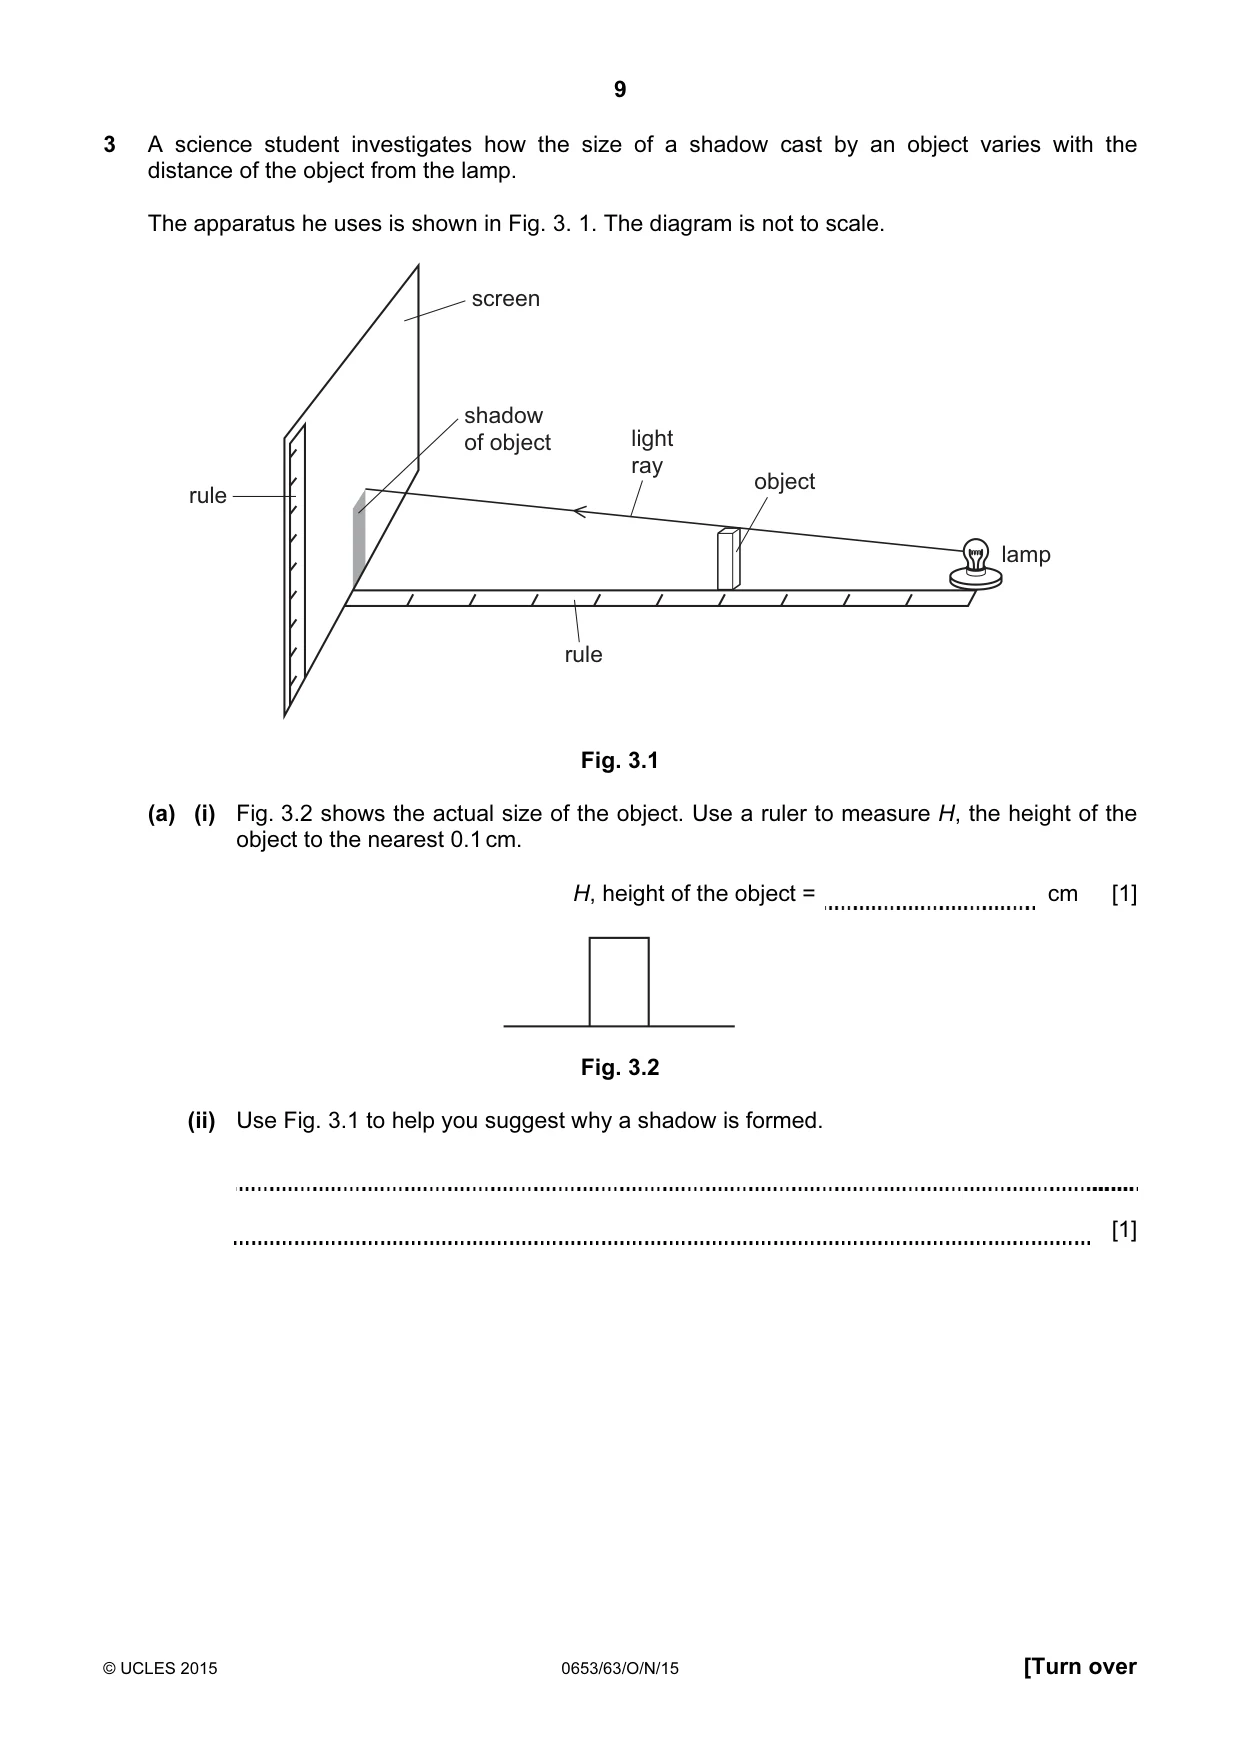
9 © UCLES 2015 0653/63/O/N/15 [Turn over 3 A science student investigates how the size of a shadow cast by an object varies with the distance of the object from the lamp. The apparatus he uses is shown in Fig. 3. 1. The diagram is not to scale. rule rule screen shadow of object light ray object lamp Fig. 3.1 (a) (i) Fig. 3.2 shows the actual size of the object. Use a ruler to measure H, the height of the object to the nearest 0.1 cm. H, height of the object = cm [1] Fig. 3.2 (ii) Use Fig. 3.1 to help you suggest why a shadow is formed. [1]
Question paper, page 10
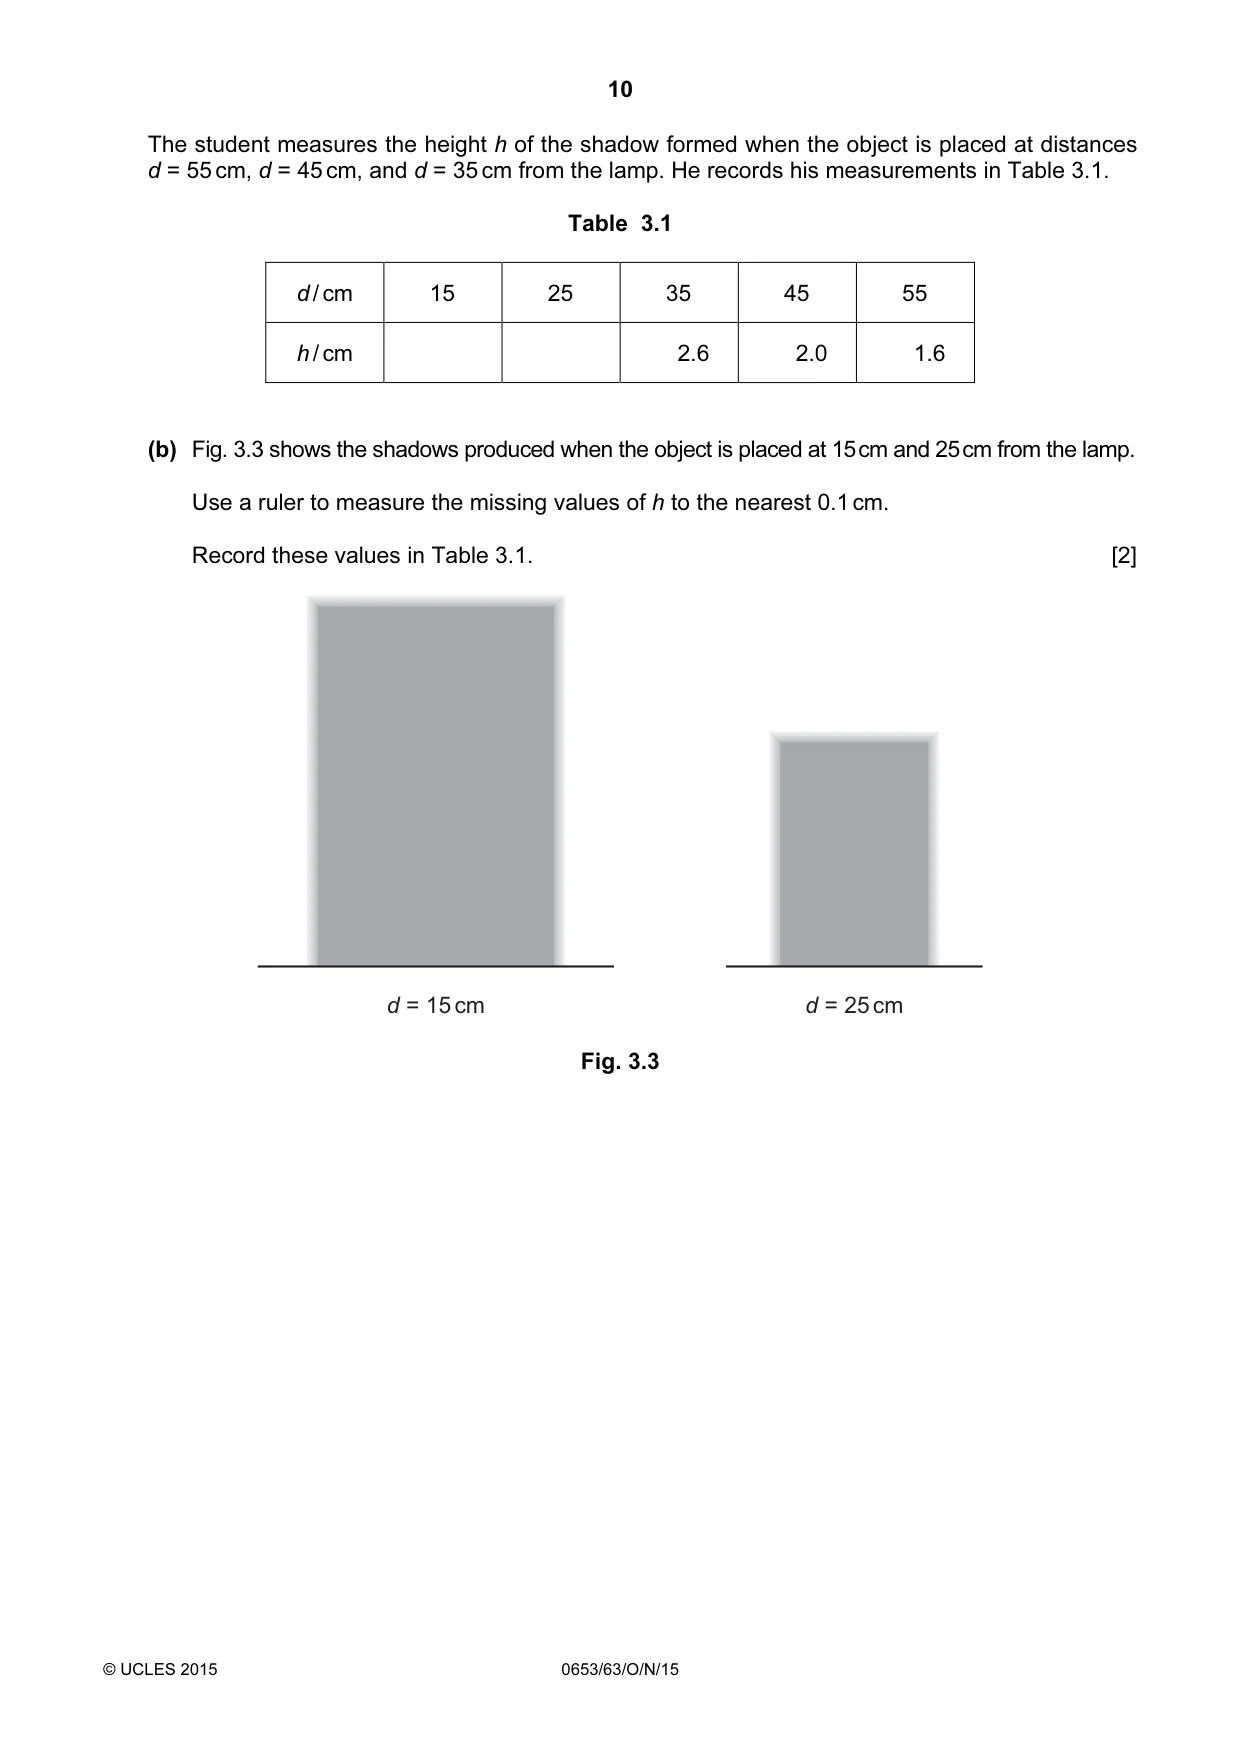
10 © UCLES 2015 0653/63/O/N/15 The student measures the height h of the shadow formed when the object is placed at distances d = 55 cm, d = 45 cm, and d = 35 cm from the lamp. He records his measurements in Table 3.1. Table 3.1 d / cm 15 25 35 45 55 h / cm 2.6 2.0 1.6 (b) Fig. 3.3 shows the shadows produced when the object is placed at 15 cm and 25 cm from the lamp. Use a ruler to measure the missing values of h to the nearest 0.1 cm. Record these values in Table 3.1. [2] d = 15 cm d = 25 cm Fig. 3.3
Question paper, page 11
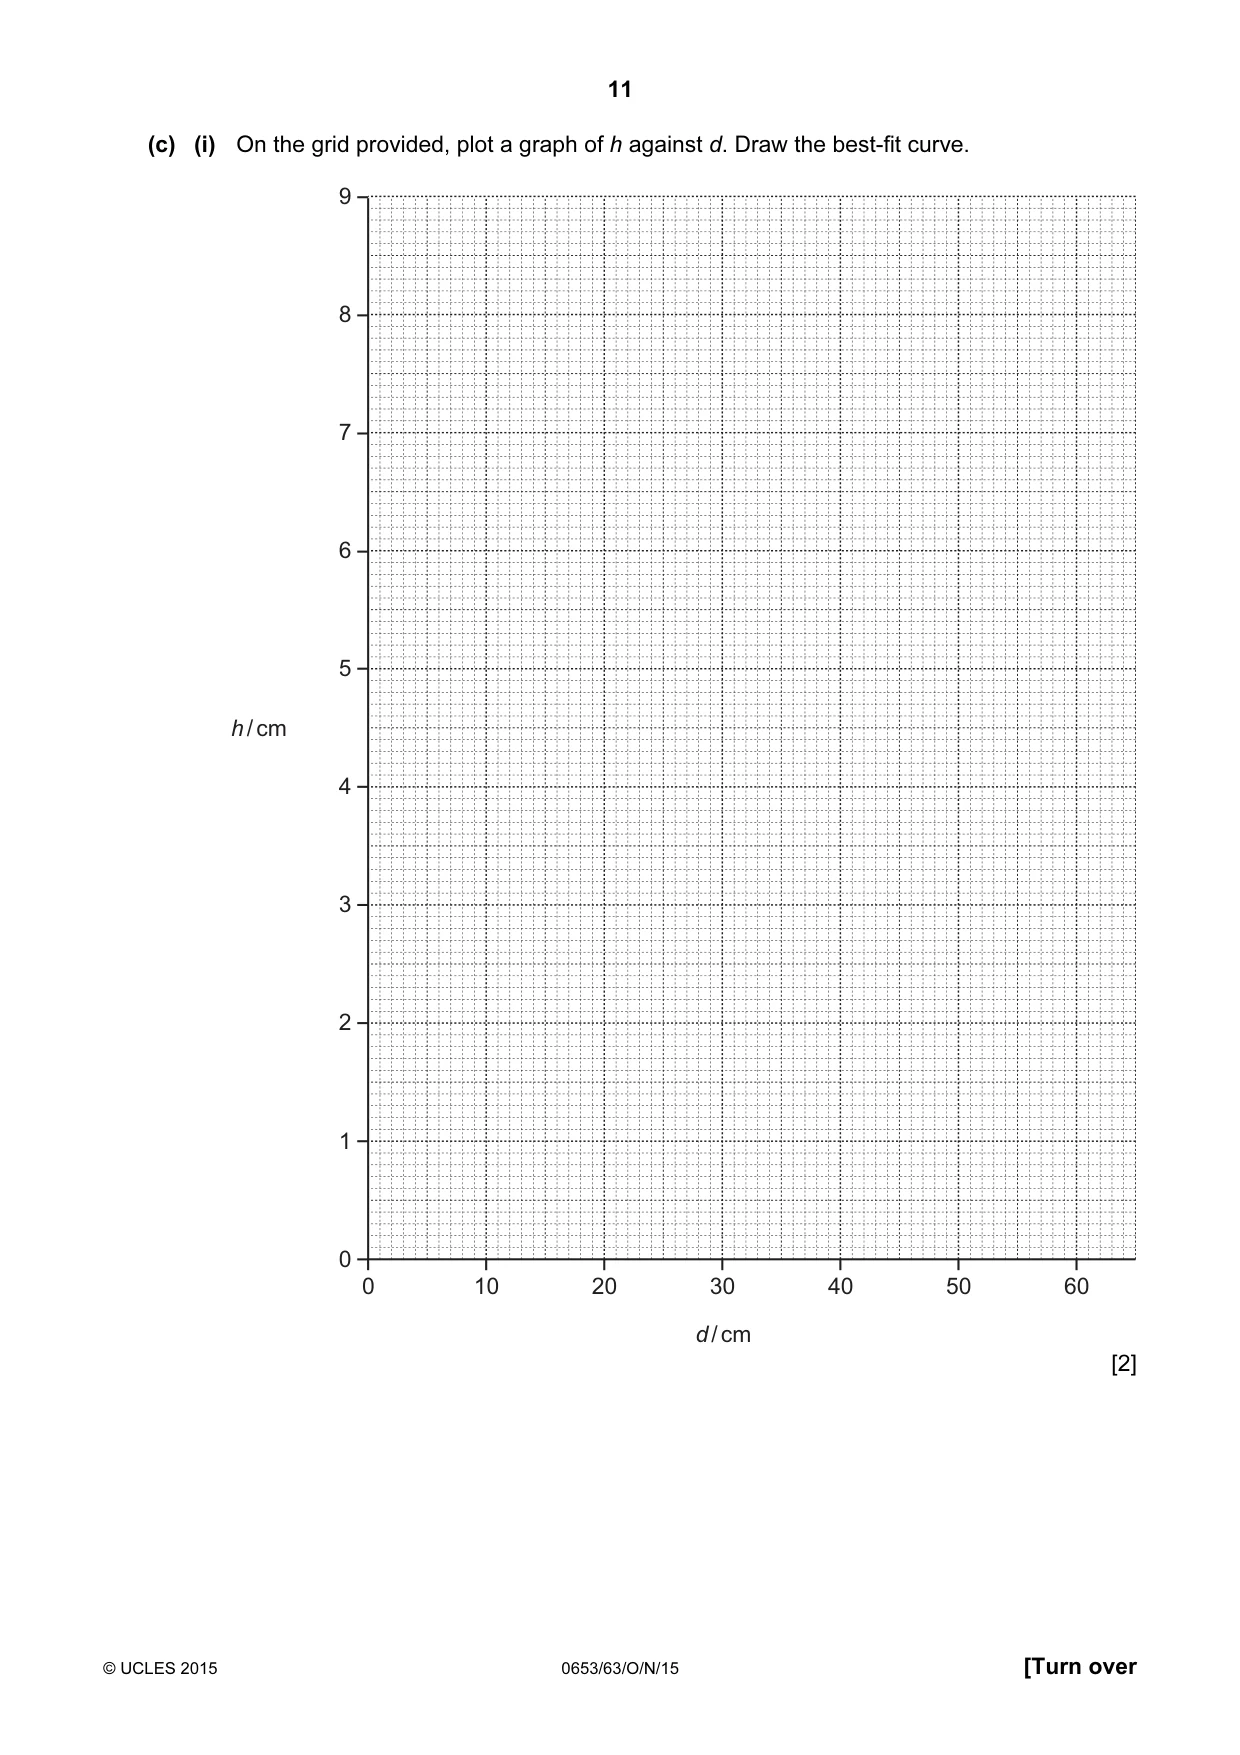
11 © UCLES 2015 0653/63/O/N/15 [Turn over (c) (i) On the grid provided, plot a graph of h against d. Draw the best-fit curve. 9 8 7 6 5 4 3 2 1 0 0 10 20 30 40 50 60 d / cm h / cm [2]
Question paper, page 12
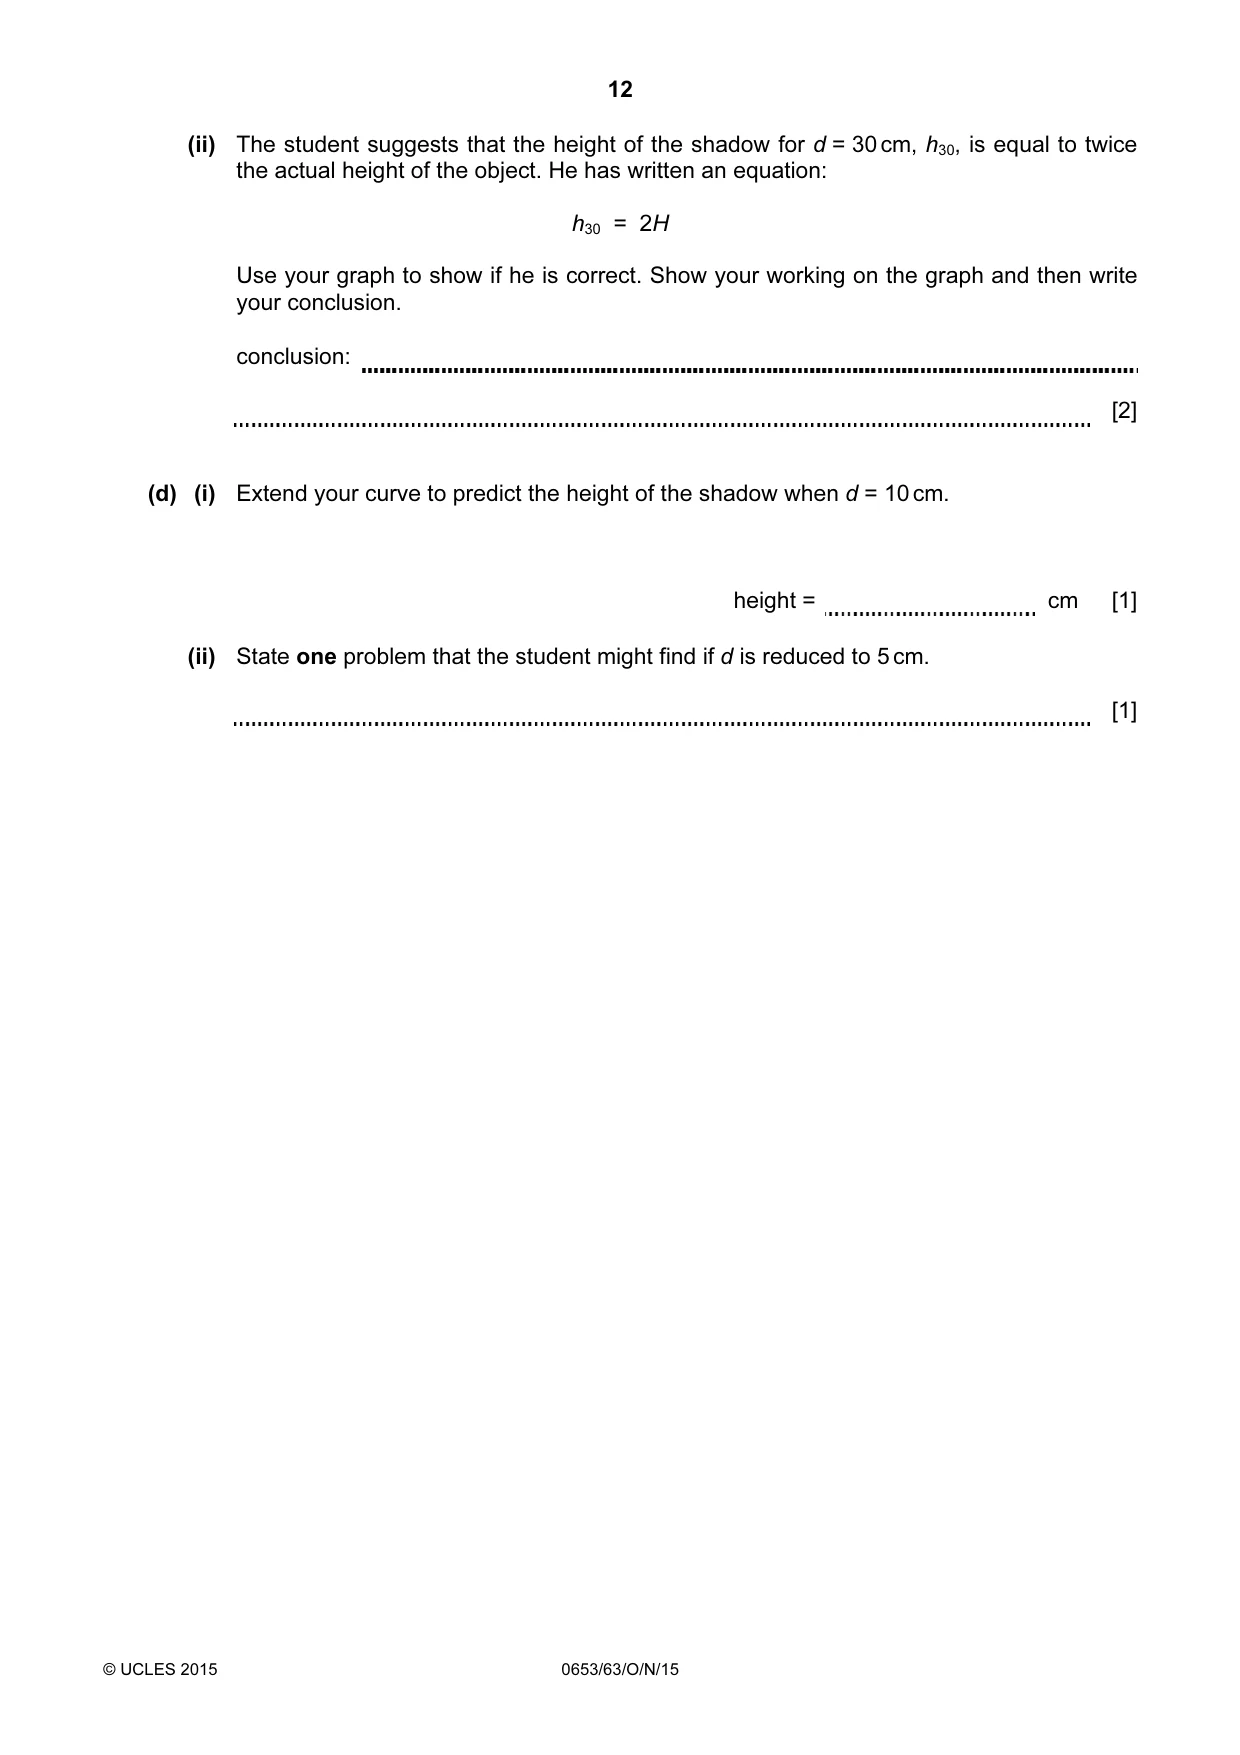
12 © UCLES 2015 0653/63/O/N/15 (ii) The student suggests that the height of the shadow for d = 30 cm, h30, is equal to twice the actual height of the object. He has written an equation: h30 = 2H Use your graph to show if he is correct. Show your working on the graph and then write your conclusion. conclusion: [2] (d) (i) Extend your curve to predict the height of the shadow when d = 10 cm. height = cm [1] (ii) State one problem that the student might find if d is reduced to 5 cm. [1]
Question paper, page 13
13 © UCLES 2015 0653/63/O/N/15 [Turn over Please turn over for Question 4.
Question paper, page 14
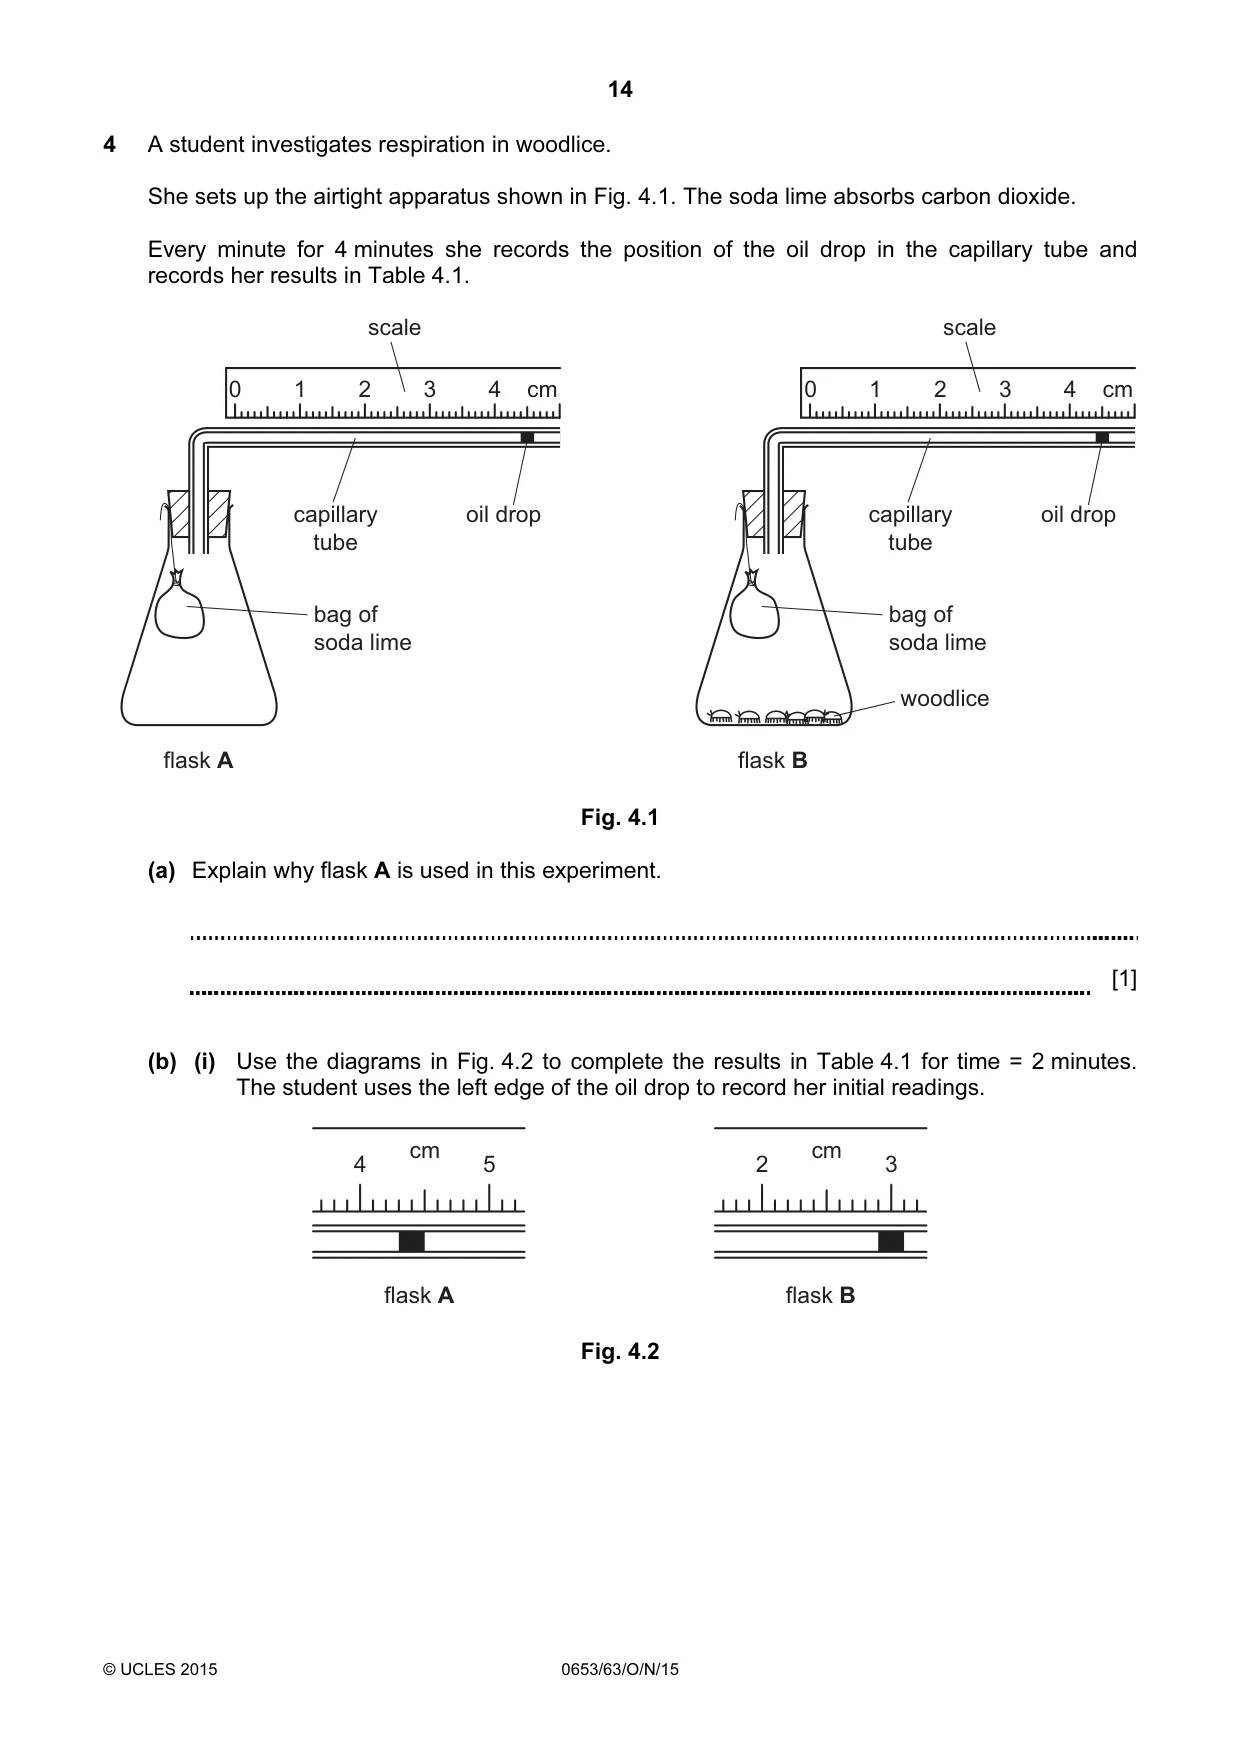
14 © UCLES 2015 0653/63/O/N/15 4 A student investigates respiration in woodlice. She sets up the airtight apparatus shown in Fig. 4.1. The soda lime absorbs carbon dioxide. Every minute for 4 minutes she records the position of the oil drop in the capillary tube and records her results in Table 4.1. scale capillary tube oil drop flask A bag of soda lime scale capillary tube oil drop flask B bag of soda lime woodlice 0 1 2 3 4 cm 0 1 2 3 4 cm Fig. 4.1 (a) Explain why flask A is used in this experiment. [1] (b) (i) Use the diagrams in Fig. 4.2 to complete the results in Table 4.1 for time = 2 minutes. The student uses the left edge of the oil drop to record her initial readings. 4 5 cm flask A 2 3 cm flask B Fig. 4.2
Question paper, page 15
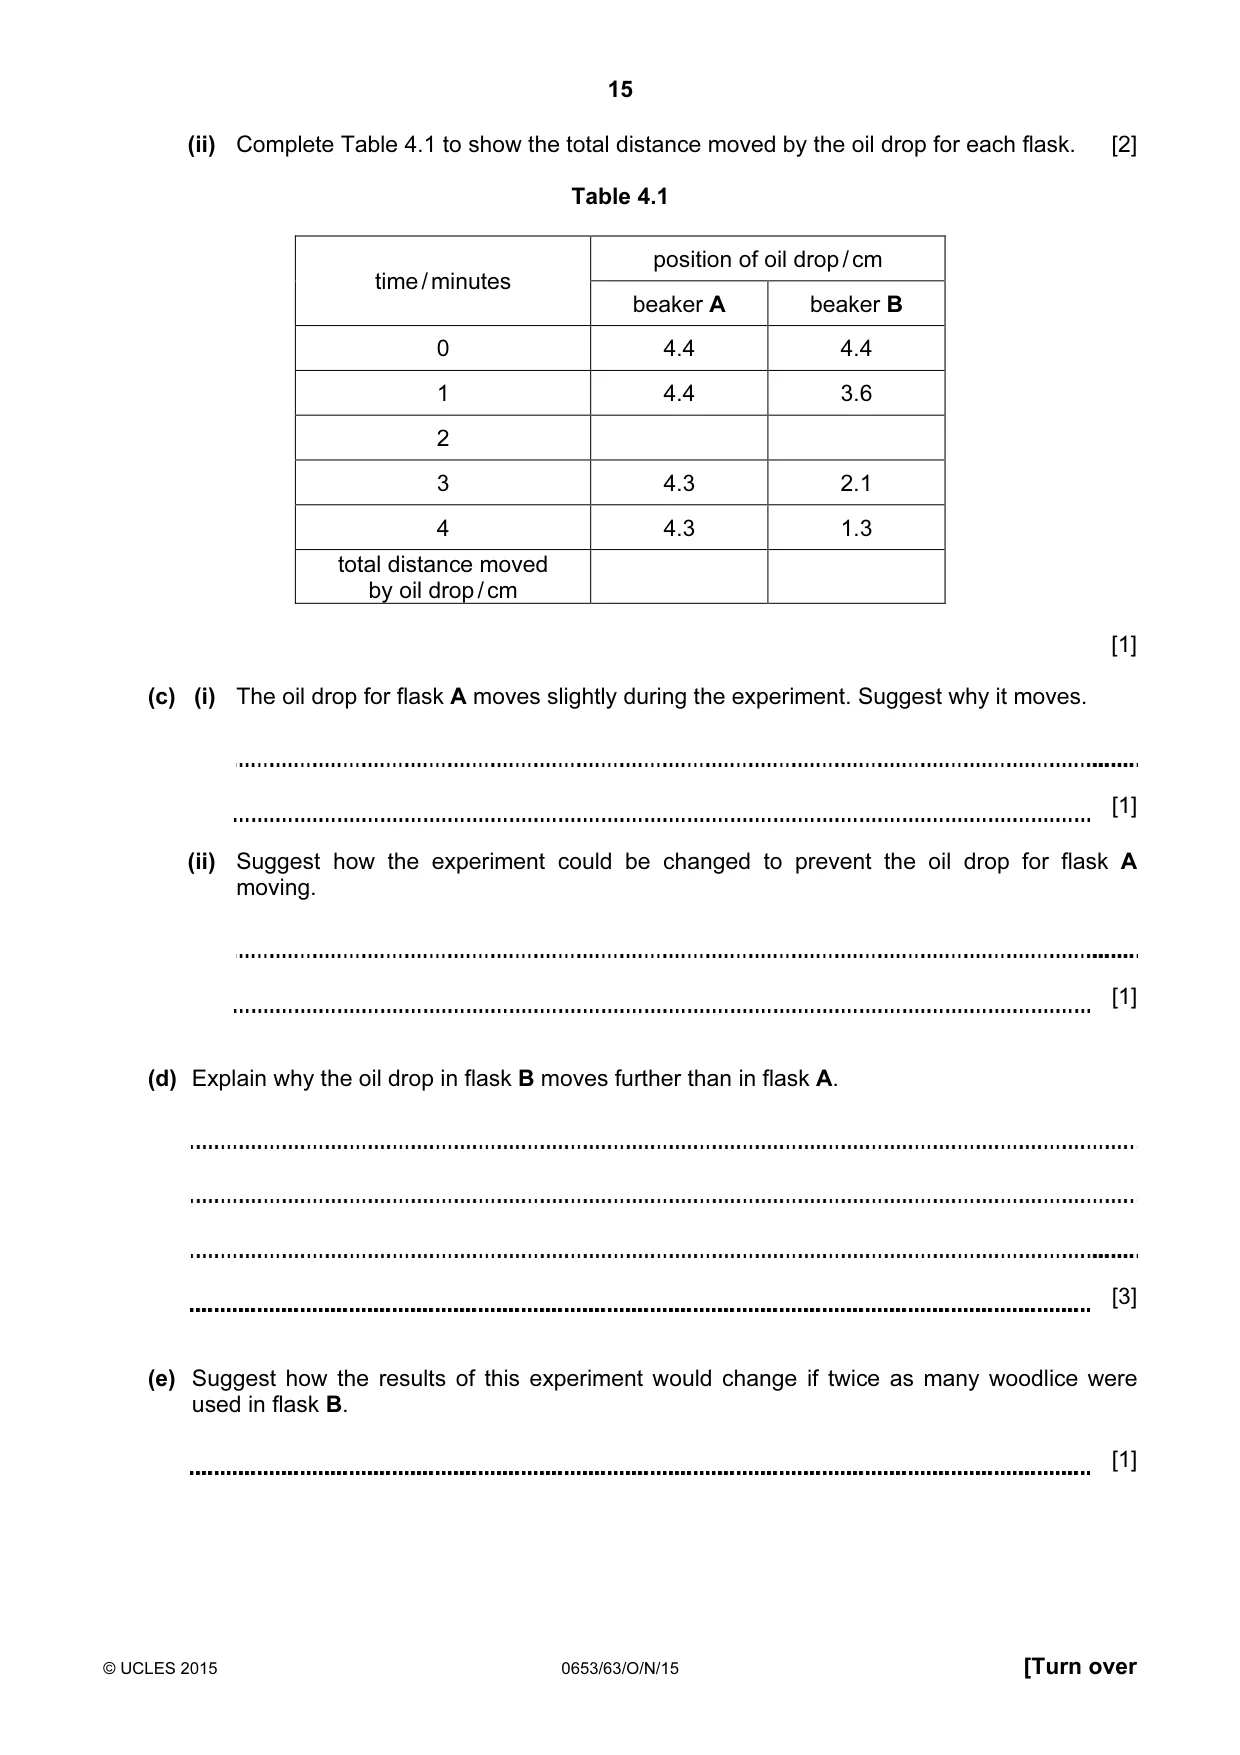
15 © UCLES 2015 0653/63/O/N/15 [Turn over (ii) Complete Table 4.1 to show the total distance moved by the oil drop for each flask. [2] Table 4.1 time / minutes position of oil drop / cm beaker A beaker B 0 4.4 4.4 1 4.4 3.6 2 3 4.3 2.1 4 4.3 1.3 total distance moved by oil drop / cm [1] (c) (i) The oil drop for flask A moves slightly during the experiment. Suggest why it moves. [1] (ii) Suggest how the experiment could be changed to prevent the oil drop for flask A moving. [1] (d) Explain why the oil drop in flask B moves further than in flask A. [3] (e) Suggest how the results of this experiment would change if twice as many woodlice were used in flask B. [1]
Question paper, page 16
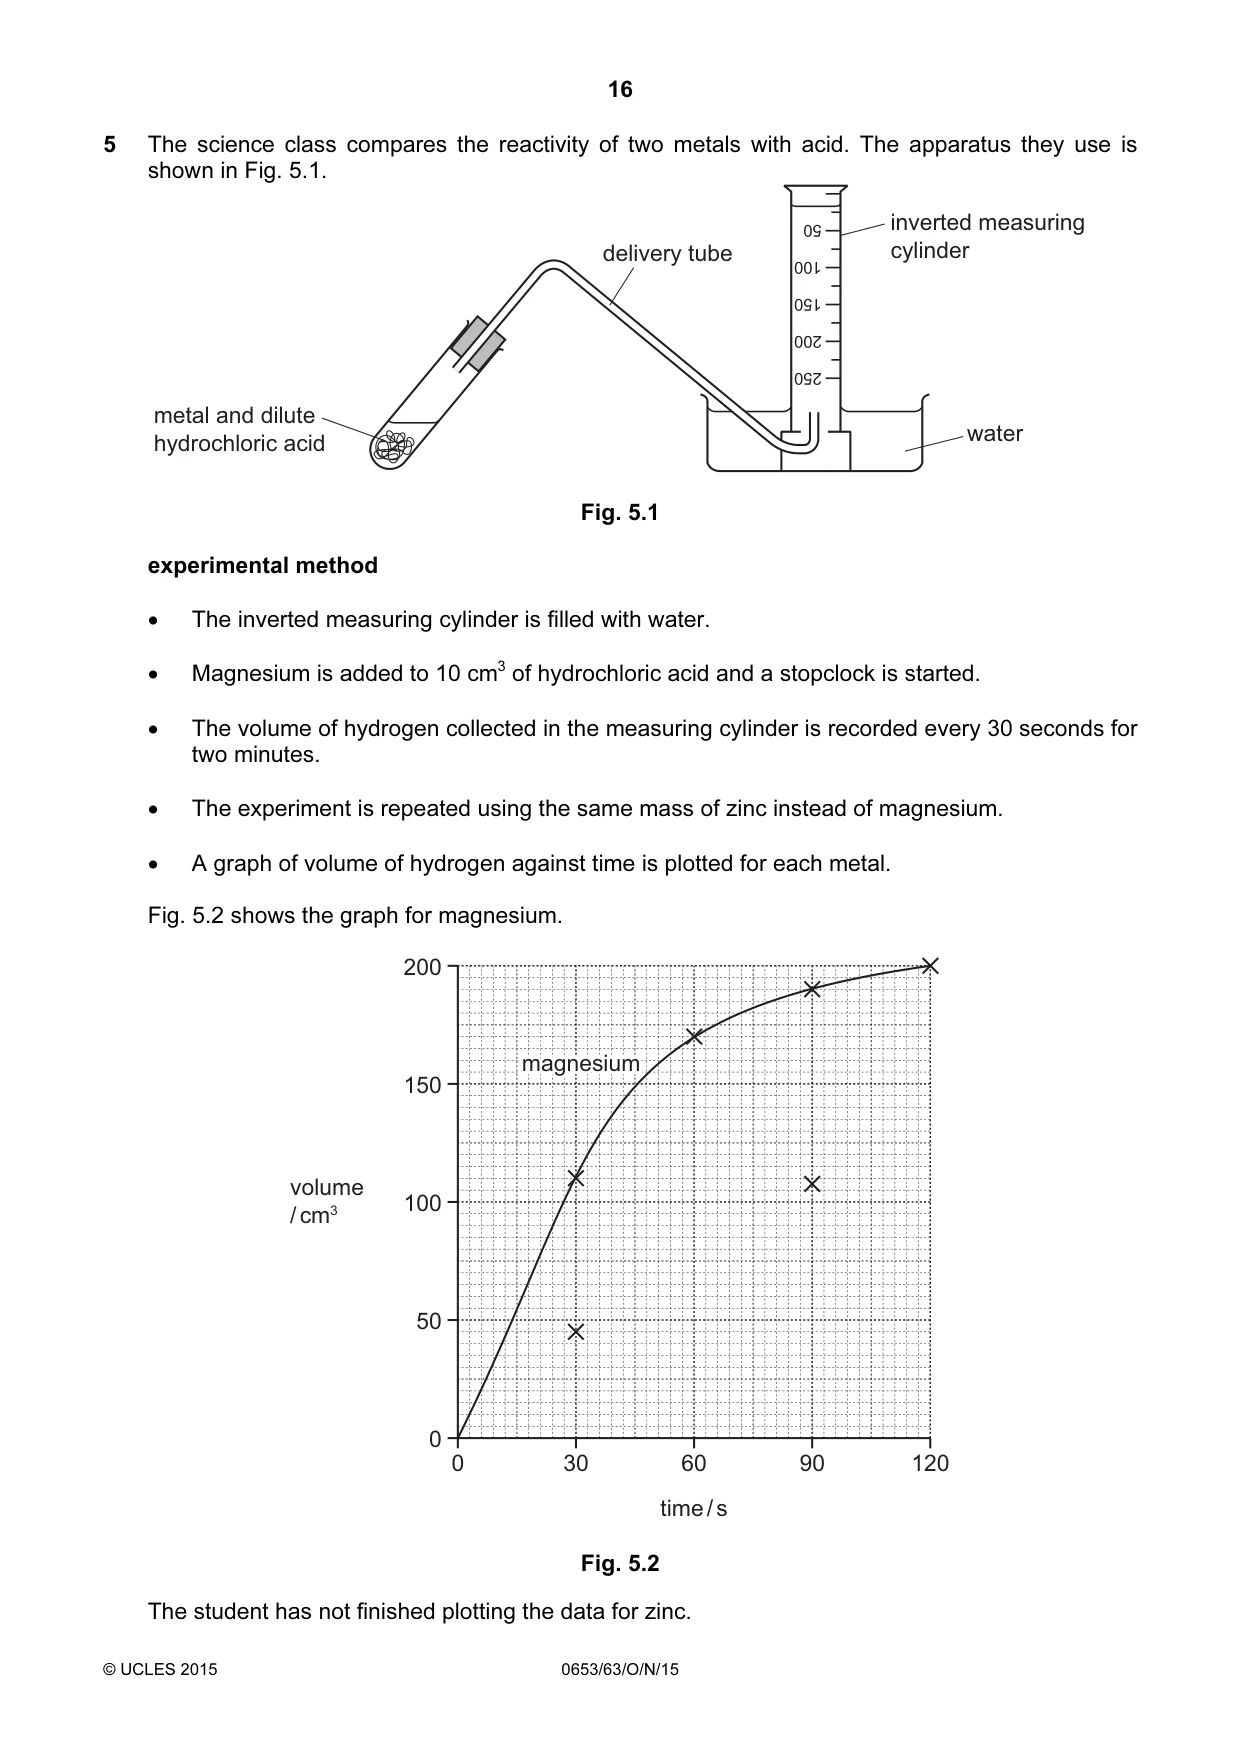
16 © UCLES 2015 0653/63/O/N/15 5 The science class compares the reactivity of two metals with acid. The apparatus they use is shown in Fig. 5.1. water 250 200 150 100 50 metal and dilute hydrochloric acid delivery tube inverted measuring cylinder Fig. 5.1 experimental method • The inverted measuring cylinder is filled with water. • Magnesium is added to 10 cm3 of hydrochloric acid and a stopclock is started. • The volume of hydrogen collected in the measuring cylinder is recorded every 30 seconds for two minutes. • The experiment is repeated using the same mass of zinc instead of magnesium. • A graph of volume of hydrogen against time is plotted for each metal. Fig. 5.2 shows the graph for magnesium. 200 150 100 50 0 0 30 60 time / s 90 120 volume / cm3 magnesium magnesium magnesium Fig. 5.2 The student has not finished plotting the data for zinc.
Question paper, page 17
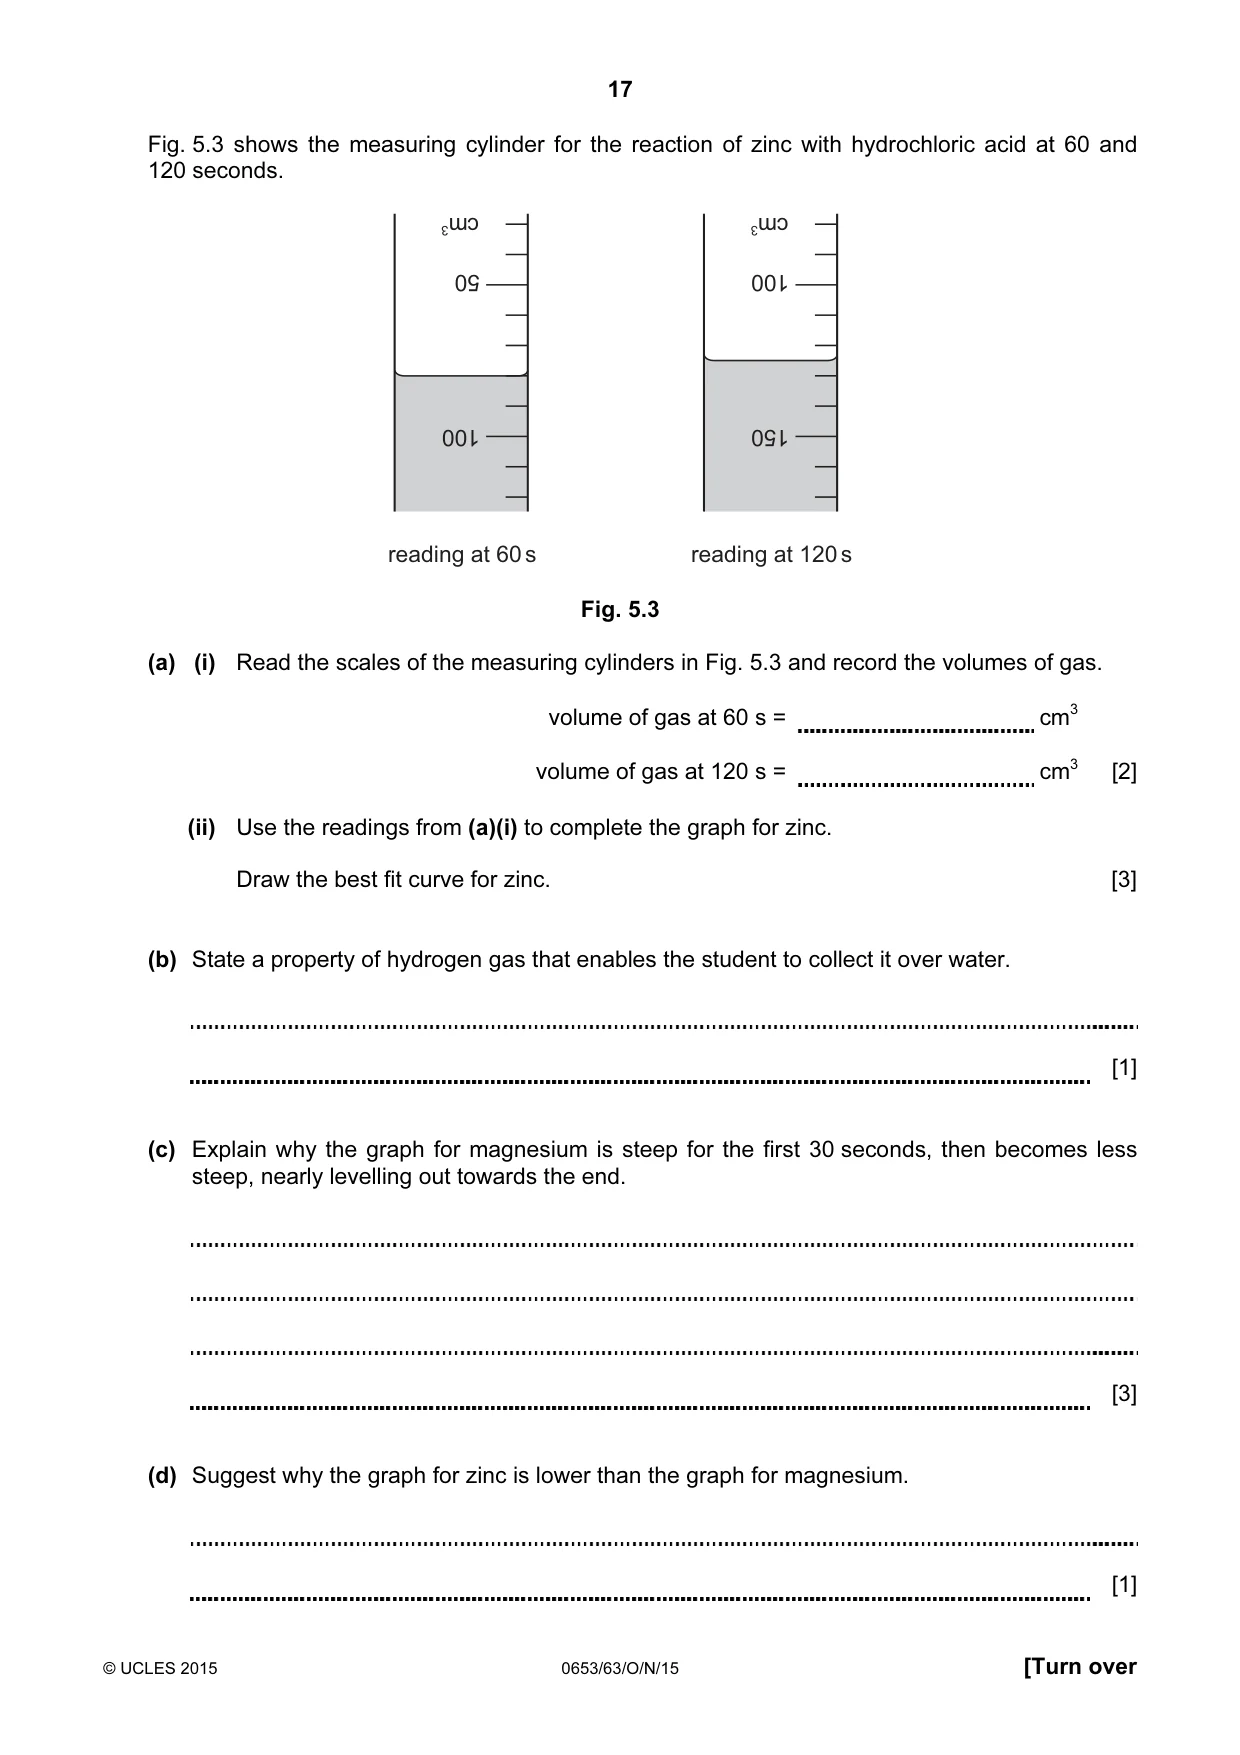
17 © UCLES 2015 0653/63/O/N/15 [Turn over Fig. 5.3 shows the measuring cylinder for the reaction of zinc with hydrochloric acid at 60 and 120 seconds. 100 50 reading at 60 s cm3 150 100 reading at 120 s cm3 Fig. 5.3 (a) (i) Read the scales of the measuring cylinders in Fig. 5.3 and record the volumes of gas. volume of gas at 60 s = cm3 volume of gas at 120 s = cm3 [2] (ii) Use the readings from (a)(i) to complete the graph for zinc. Draw the best fit curve for zinc. [3] (b) State a property of hydrogen gas that enables the student to collect it over water. [1] (c) Explain why the graph for magnesium is steep for the first 30 seconds, then becomes less steep, nearly levelling out towards the end. [3] (d) Suggest why the graph for zinc is lower than the graph for magnesium. [1]
Question paper, page 18
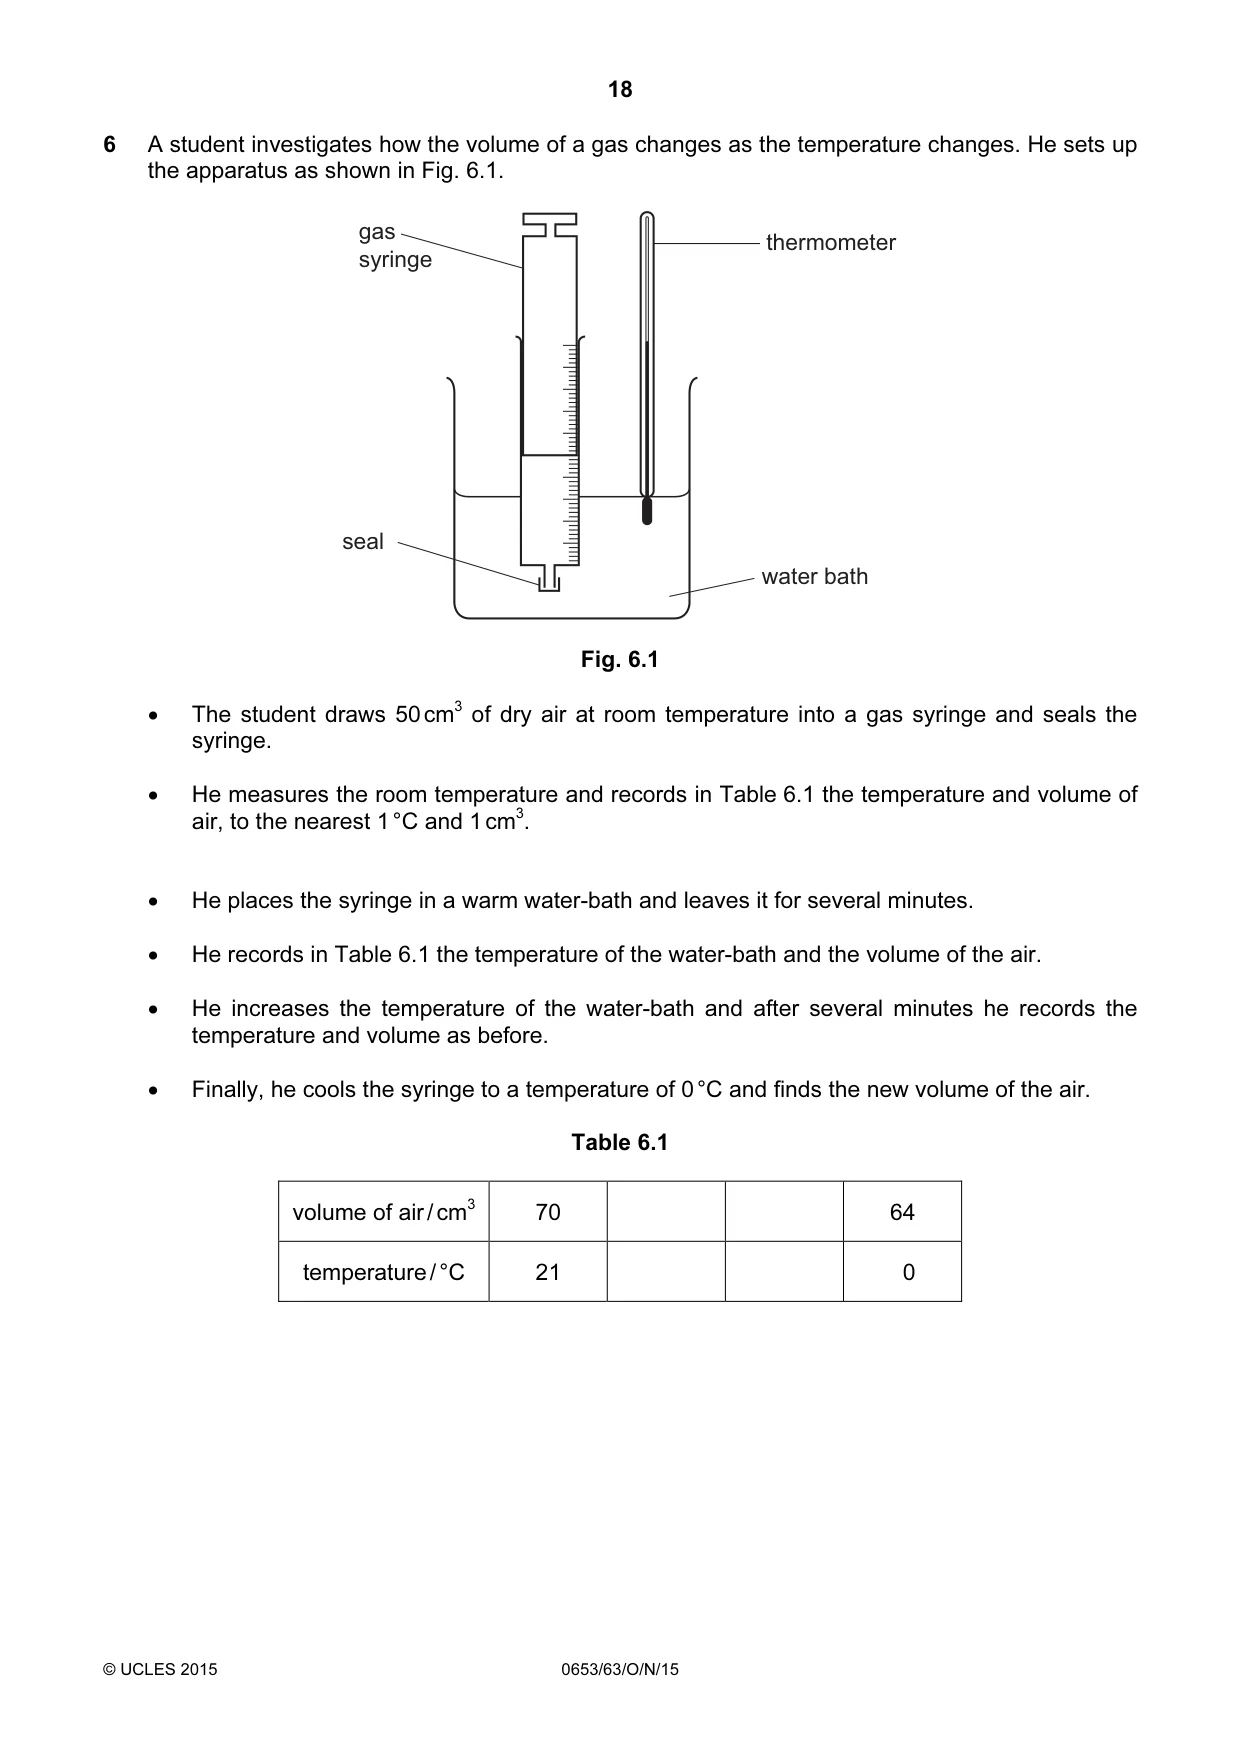
18 © UCLES 2015 0653/63/O/N/15 6 A student investigates how the volume of a gas changes as the temperature changes. He sets up the apparatus as shown in Fig. 6.1. seal gas syringe thermometer water bath Fig. 6.1 • The student draws 50 cm3 of dry air at room temperature into a gas syringe and seals the syringe. • He measures the room temperature and records in Table 6.1 the temperature and volume of air, to the nearest 1 °C and 1 cm3. • He places the syringe in a warm water-bath and leaves it for several minutes. • He records in Table 6.1 the temperature of the water-bath and the volume of the air. • He increases the temperature of the water-bath and after several minutes he records the temperature and volume as before. • Finally, he cools the syringe to a temperature of 0 °C and finds the new volume of the air. Table 6.1 volume of air / cm3 70 64 temperature / °C 21 0
Question paper, page 19
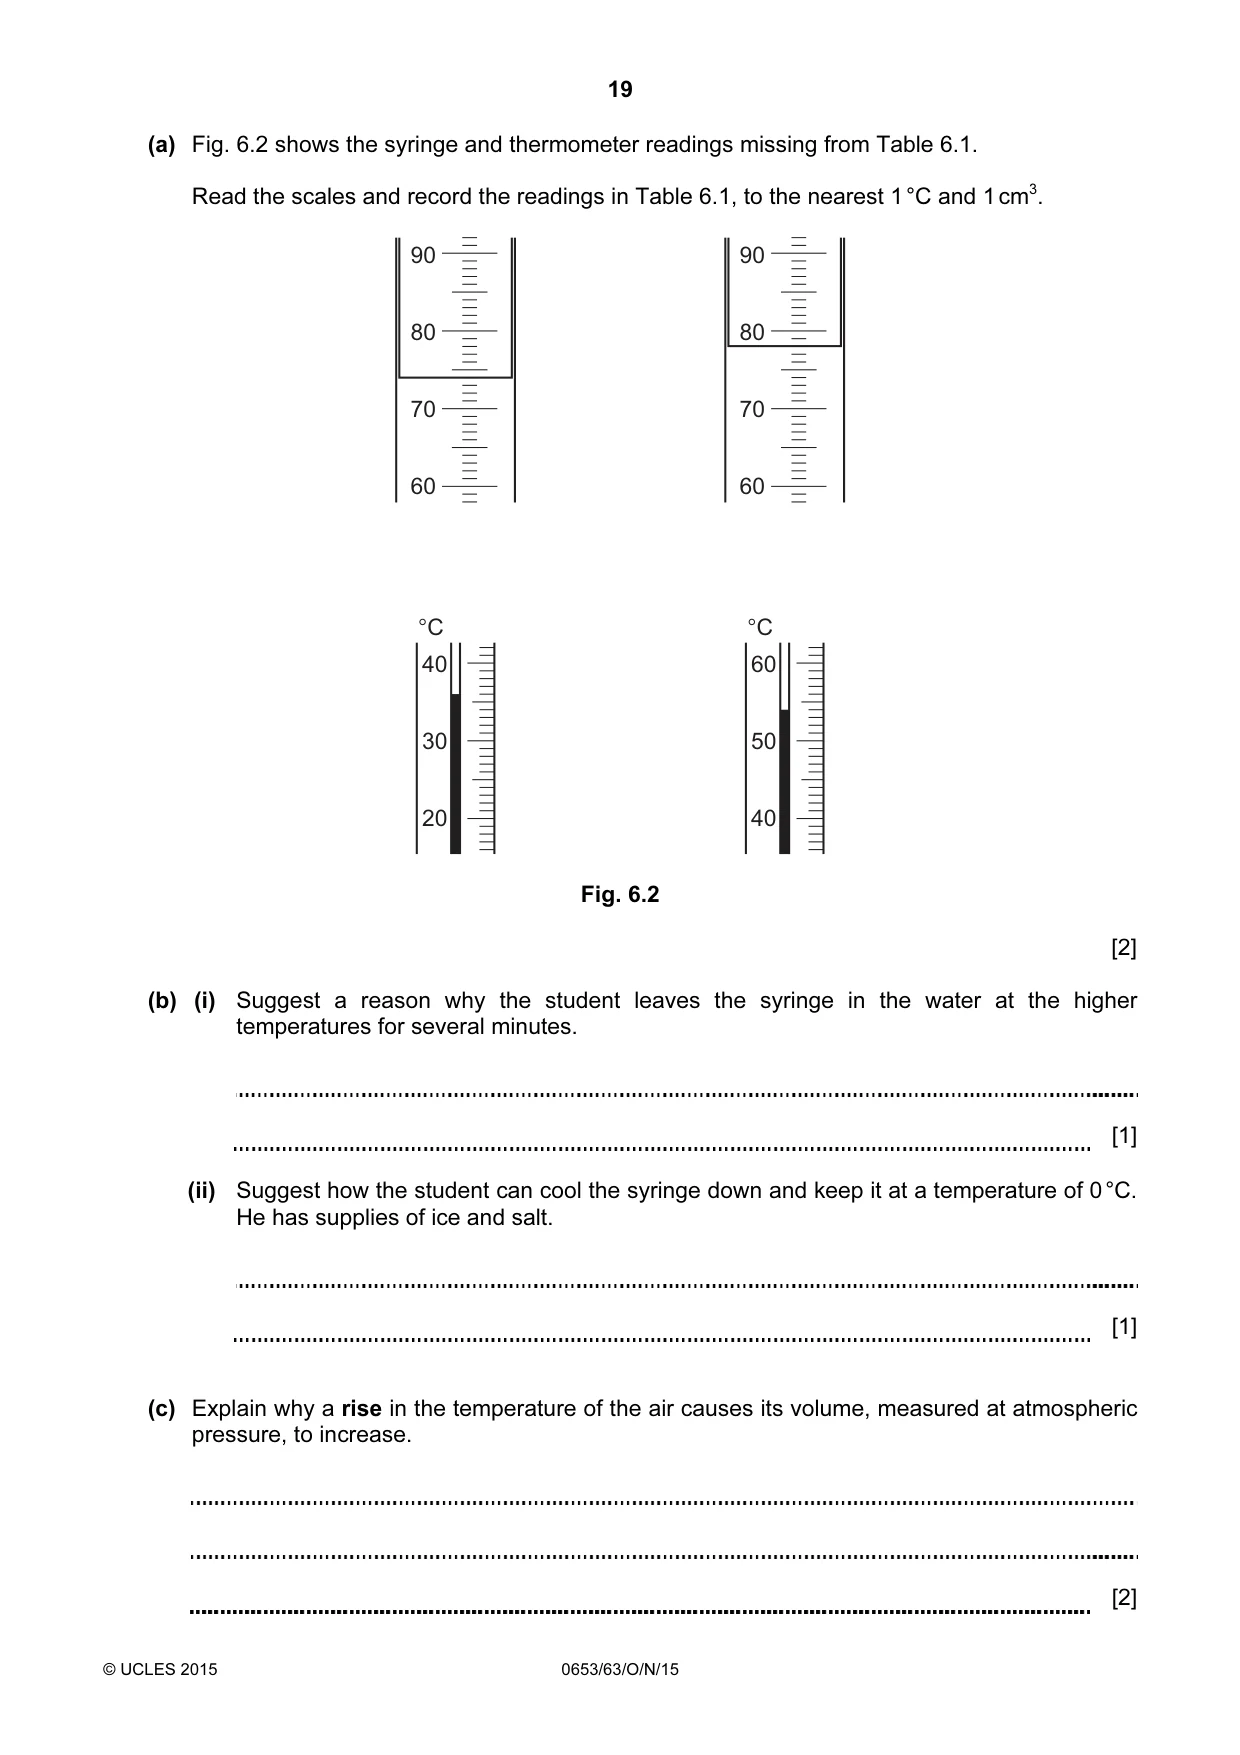
19 © UCLES 2015 0653/63/O/N/15 (a) Fig. 6.2 shows the syringe and thermometer readings missing from Table 6.1. Read the scales and record the readings in Table 6.1, to the nearest 1 °C and 1 cm3. 40 30 20 °C 60 50 40 °C 90 80 70 60 90 80 70 60 Fig. 6.2 [2] (b) (i) Suggest a reason why the student leaves the syringe in the water at the higher temperatures for several minutes. [1] (ii) Suggest how the student can cool the syringe down and keep it at a temperature of 0 °C. He has supplies of ice and salt. [1] (c) Explain why a rise in the temperature of the air causes its volume, measured at atmospheric pressure, to increase. [2]
Question paper, page 20
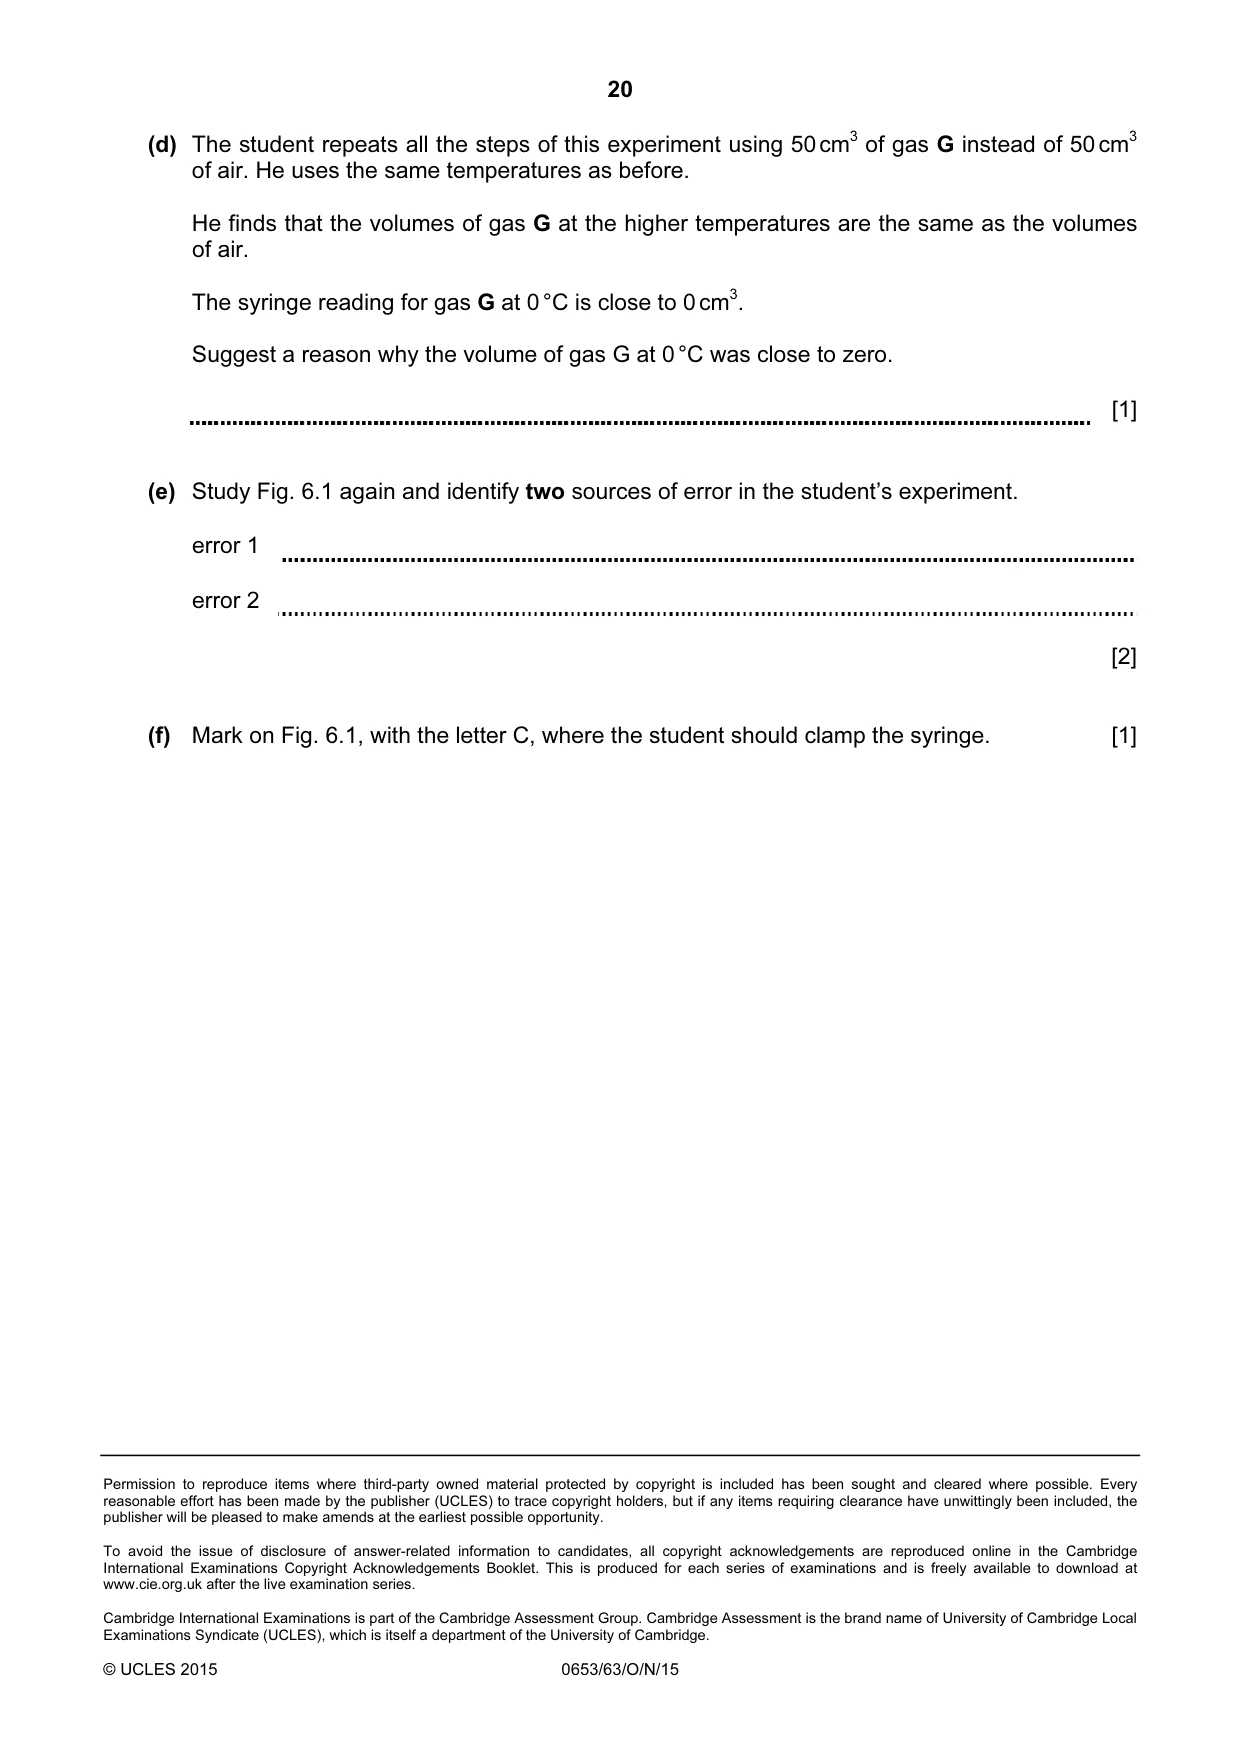
20 Permission to reproduce items where third-party owned material protected by copyright is included has been sought and cleared where possible. Every reasonable effort has been made by the publisher (UCLES) to trace copyright holders, but if any items requiring clearance have unwittingly been included, the publisher will be pleased to make amends at the earliest possible opportunity. To avoid the issue of disclosure of answer-related information to candidates, all copyright acknowledgements are reproduced online in the Cambridge International Examinations Copyright Acknowledgements Booklet. This is produced for each series of examinations and is freely available to download at www.cie.org.uk after the live examination series. Cambridge International Examinations is part of the Cambridge Assessment Group. Cambridge Assessment is the brand name of University of Cambridge Local Examinations Syndicate (UCLES), which is itself a department of the University of Cambridge. © UCLES 2015 0653/63/O/N/15 (d) The student repeats all the steps of this experiment using 50 cm3 of gas G instead of 50 cm3 of air. He uses the same temperatures as before. He finds that the volumes of gas G at the higher temperatures are the same as the volumes of air. The syringe reading for gas G at 0 °C is close to 0 cm3. Suggest a reason why the volume of gas G at 0 °C was close to zero. [1] (e) Study Fig. 6.1 again and identify two sources of error in the student’s experiment. error 1 error 2 [2] (f) Mark on Fig. 6.1, with the letter C, where the student should clamp the syringe. [1]
Mark scheme, page 1
® IGCSE is the registered trademark of Cambridge International Examinations. CAMBRIDGE INTERNATIONAL EXAMINATIONS Cambridge International General Certificate of Secondary Education MARK SCHEME for the October/November 2015 series 0653 COMBINED SCIENCE 0653/63 Paper 6 (Alternative to Practical), maximum raw mark 60 This mark scheme is published as an aid to teachers and candidates, to indicate the requirements of the examination. It shows the basis on which Examiners were instructed to award marks. It does not indicate the details of the discussions that took place at an Examiners’ meeting before marking began, which would have considered the acceptability of alternative answers. Mark schemes should be read in conjunction with the question paper and the Principal Examiner Report for Teachers. Cambridge will not enter into discussions about these mark schemes. Cambridge is publishing the mark schemes for the October/November 2015 series for most Cambridge IGCSE®, Cambridge International A and AS Level components and some Cambridge O Level components.
Mark scheme, page 2
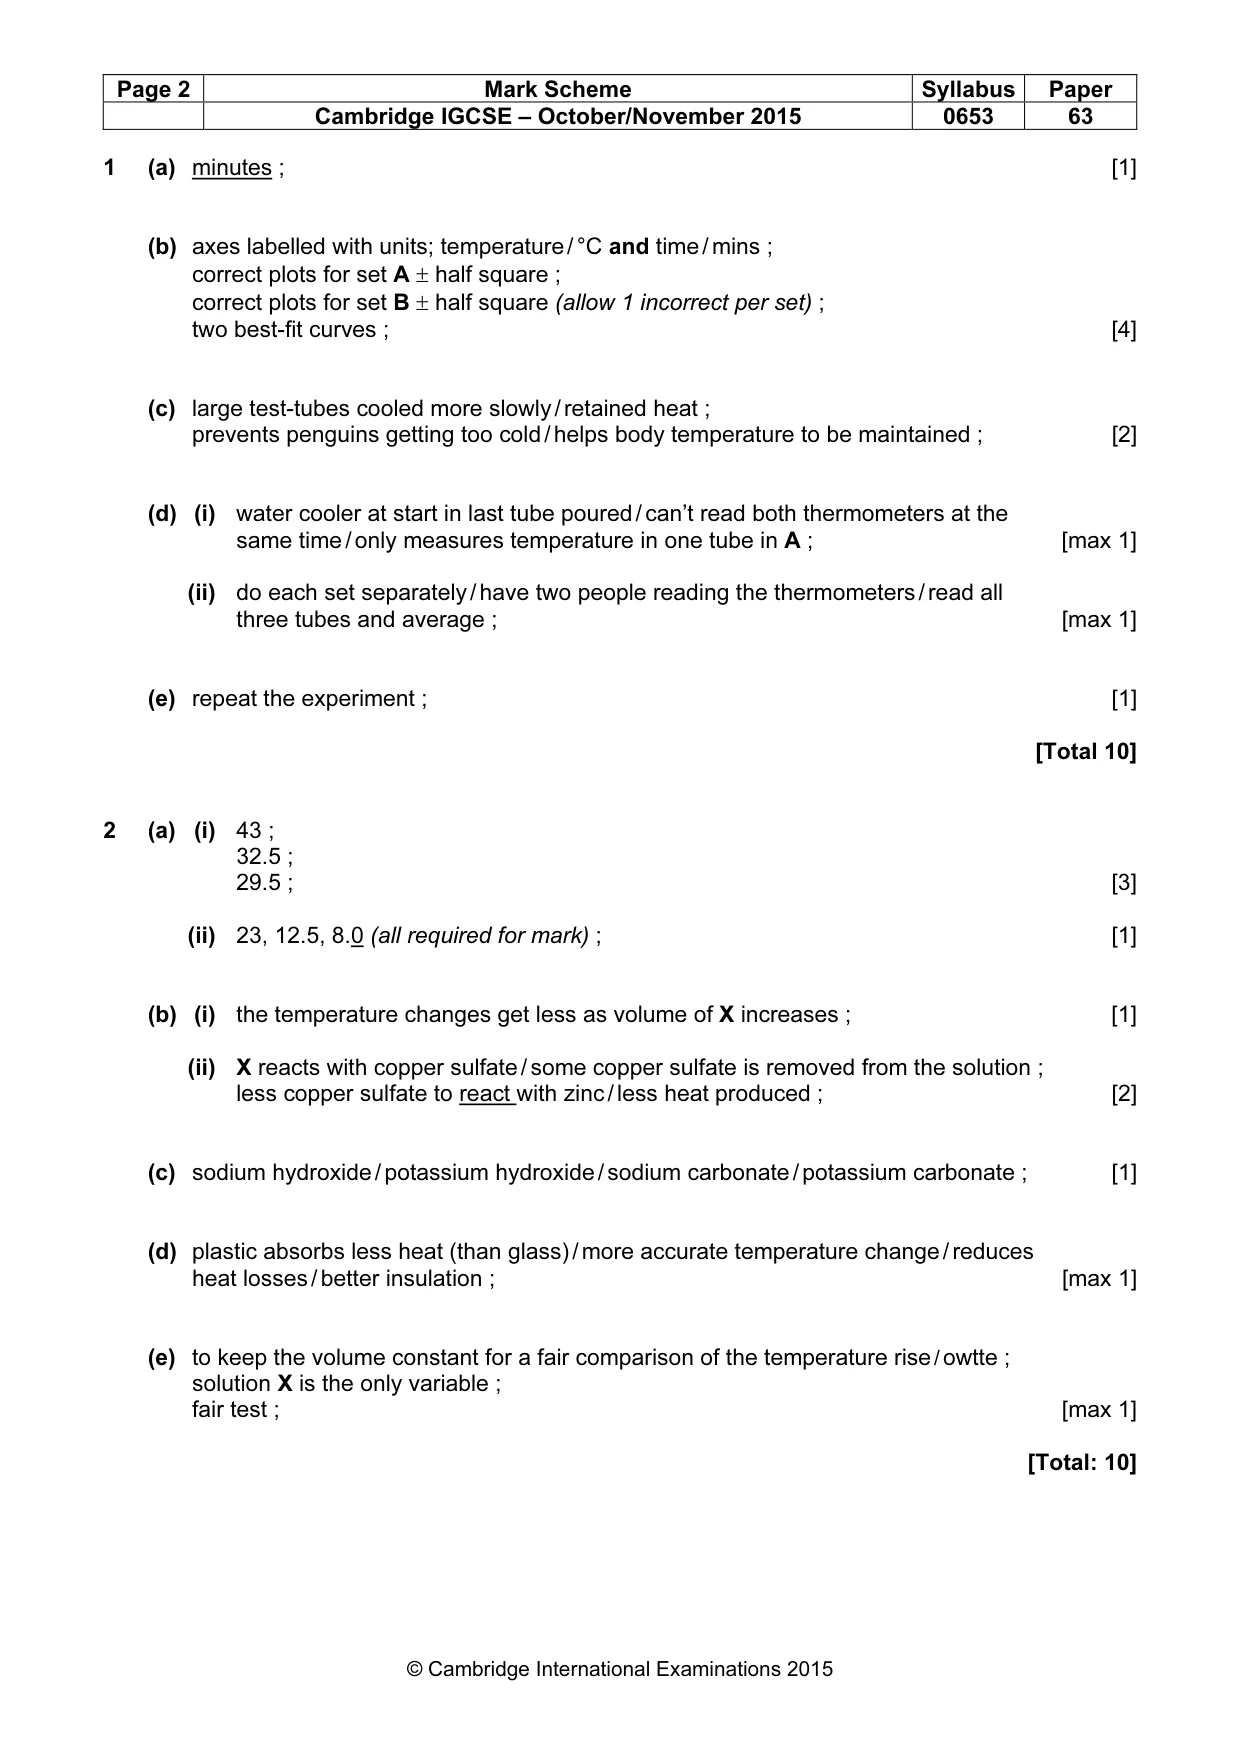
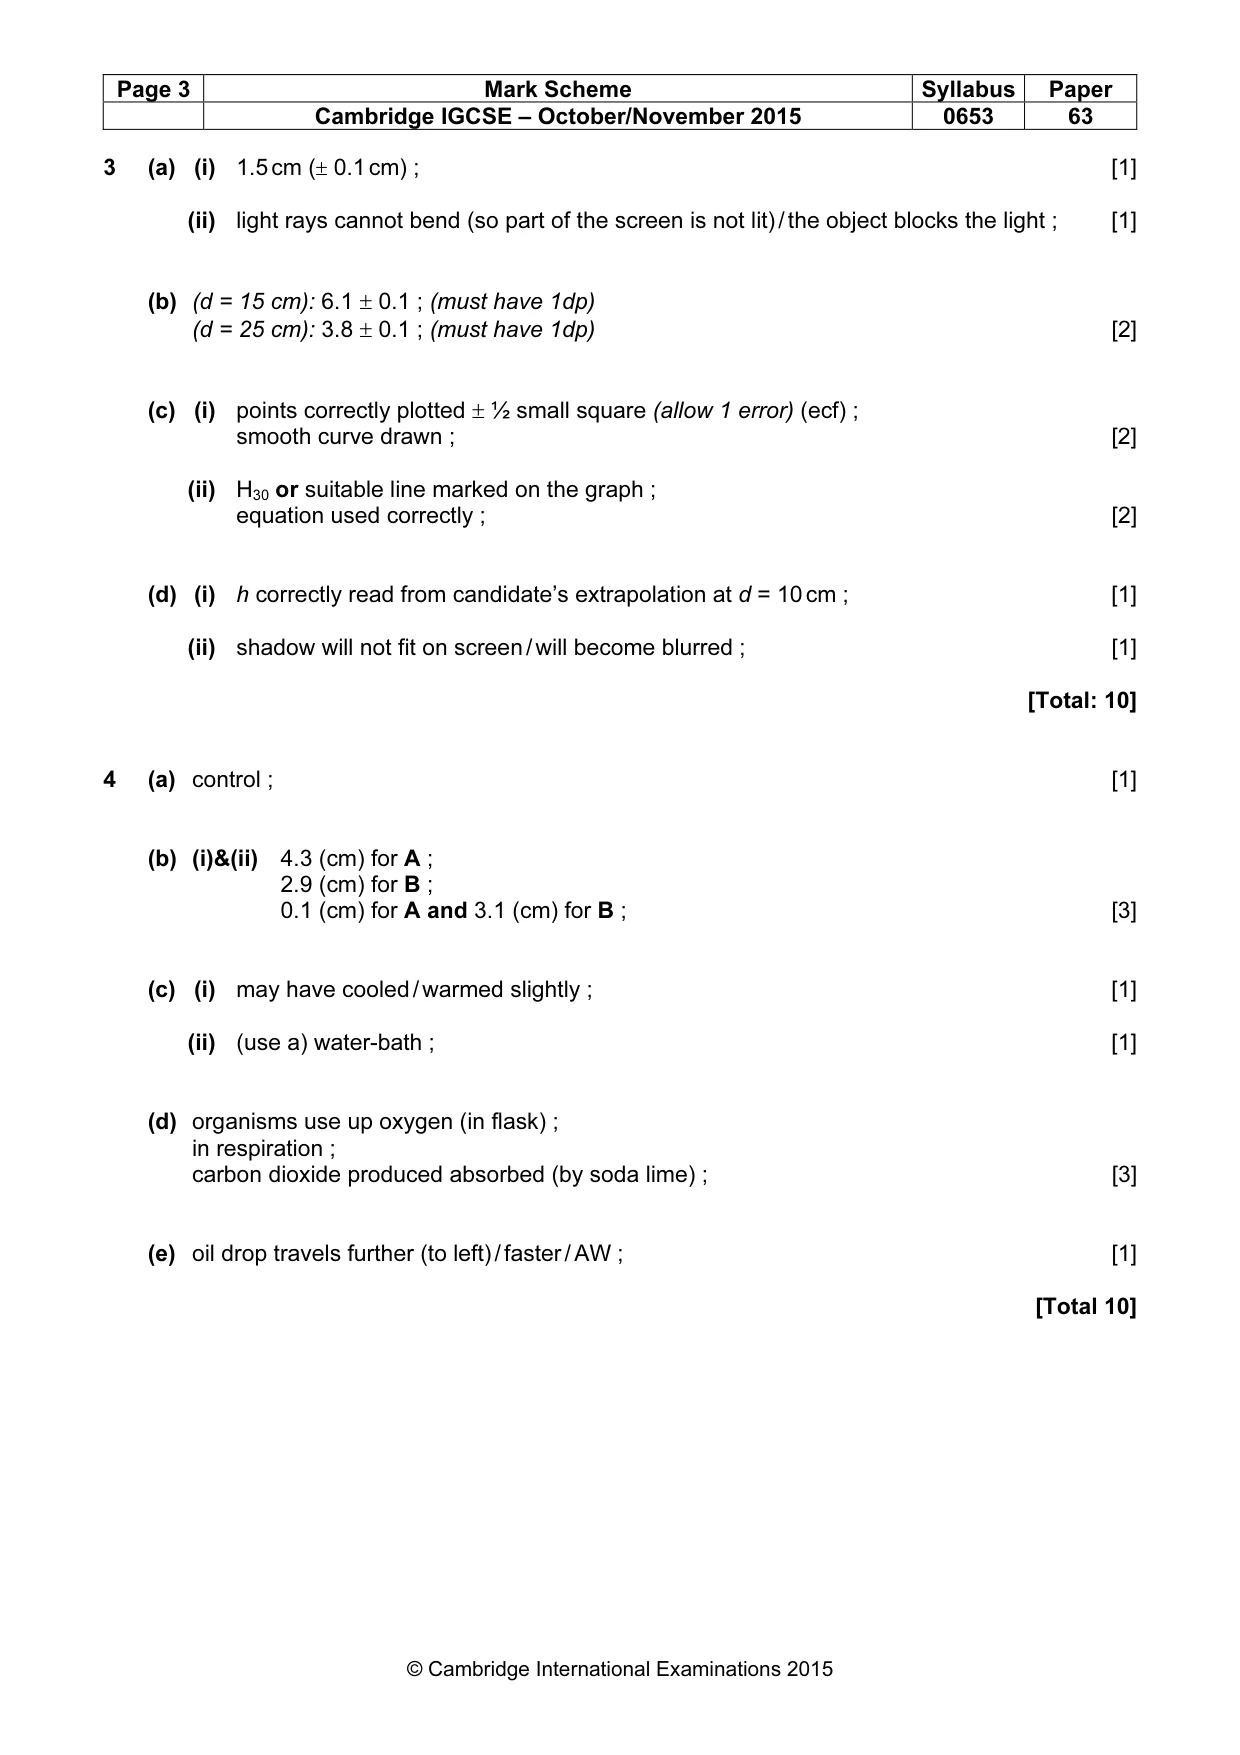
Page 2 Mark Scheme Syllabus Paper Cambridge IGCSE – October/November 2015 0653 63 © Cambridge International Examinations 2015 1 (a) minutes ; [1] (b) axes labelled with units; temperature / °C and time / mins ; correct plots for set A ± half square ; correct plots for set B ± half square (allow 1 incorrect per set) ; two best-fit curves ; [4] (c) large test-tubes cooled more slowly / retained heat ; prevents penguins getting too cold / helps body temperature to be maintained ; [2] (d) (i) water cooler at start in last tube poured / can’t read both thermometers at the same time / only measures temperature in one tube in A ; [max 1] (ii) do each set separately / have two people reading the thermometers / read all three tubes and average ; [max 1] (e) repeat the experiment ; [1] [Total 10] 2 (a) (i) 43 ; 32.5 ; 29.5 ; [3] (ii) 23, 12.5, 8.0 (all required for mark) ; [1] (b) (i) the temperature changes get less as volume of X increases ; [1] (ii) X reacts with copper sulfate / some copper sulfate is removed from the solution ; less copper sulfate to react with zinc / less heat produced ; [2] (c) sodium hydroxide / potassium hydroxide / sodium carbonate / potassium carbonate ; [1] (d) plastic absorbs less heat (than glass) / more accurate temperature change / reduces heat losses / better insulation ; [max 1] (e) to keep the volume constant for a fair comparison of the temperature rise / owtte ; solution X is the only variable ; fair test ; [max 1] [Total: 10]
Mark scheme, page 3
Page 3 Mark Scheme Syllabus Paper Cambridge IGCSE – October/November 2015 0653 63 © Cambridge International Examinations 2015 3 (a) (i) 1.5 cm (± 0.1 cm) ; [1] (ii) light rays cannot bend (so part of the screen is not lit) / the object blocks the light ; [1] (b) (d = 15 cm): 6.1 ± 0.1 ; (must have 1dp) (d = 25 cm): 3.8 ± 0.1 ; (must have 1dp) [2] (c) (i) points correctly plotted ± ½ small square (allow 1 error) (ecf) ; smooth curve drawn ; [2] (ii) H30 or suitable line marked on the graph ; equation used correctly ; [2] (d) (i) h correctly read from candidate’s extrapolation at d = 10 cm ; [1] (ii) shadow will not fit on screen / will become blurred ; [1] [Total: 10] 4 (a) control ; [1] (b) (i)&(ii) 4.3 (cm) for A ; 2.9 (cm) for B ; 0.1 (cm) for A and 3.1 (cm) for B ; [3] (c) (i) may have cooled / warmed slightly ; [1] (ii) (use a) water-bath ; [1] (d) organisms use up oxygen (in flask) ; in respiration ; carbon dioxide produced absorbed (by soda lime) ; [3] (e) oil drop travels further (to left) / faster / AW ; [1] [Total 10]
Mark scheme, page 4
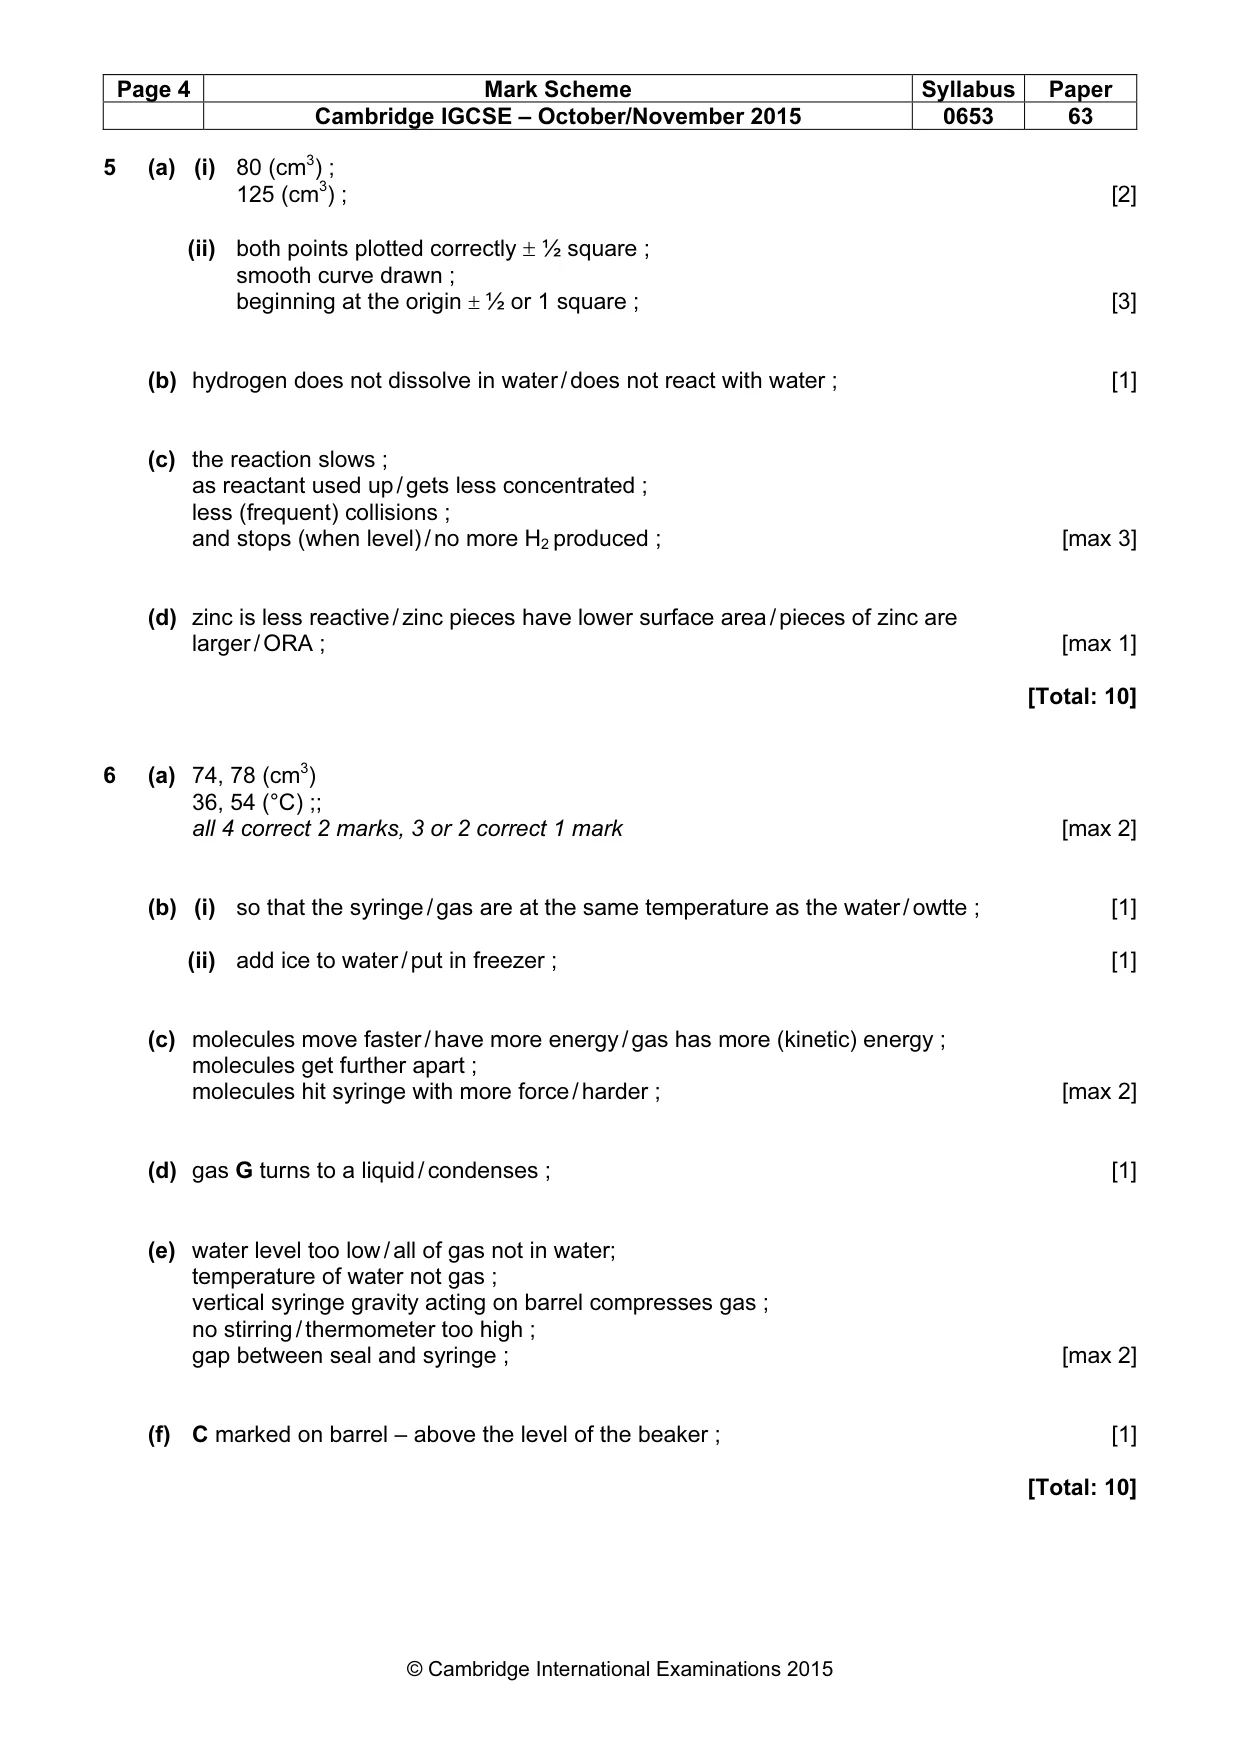
Page 4 Mark Scheme Syllabus Paper Cambridge IGCSE – October/November 2015 0653 63 © Cambridge International Examinations 2015 5 (a) (i) 80 (cm3) ; 125 (cm3) ; [2] (ii) both points plotted correctly ± ½ square ; smooth curve drawn ; beginning at the origin ± ½ or 1 square ; [3] (b) hydrogen does not dissolve in water / does not react with water ; [1] (c) the reaction slows ; as reactant used up / gets less concentrated ; less (frequent) collisions ; and stops (when level) / no more H2 produced ; [max 3] (d) zinc is less reactive / zinc pieces have lower surface area / pieces of zinc are larger / ORA ; [max 1] [Total: 10] 6 (a) 74, 78 (cm3) 36, 54 (°C) ;; all 4 correct 2 marks, 3 or 2 correct 1 mark [max 2] (b) (i) so that the syringe / gas are at the same temperature as the water / owtte ; [1] (ii) add ice to water / put in freezer ; [1] (c) molecules move faster / have more energy / gas has more (kinetic) energy ; molecules get further apart ; molecules hit syringe with more force / harder ; [max 2] (d) gas G turns to a liquid / condenses ; [1] (e) water level too low / all of gas not in water; temperature of water not gas ; vertical syringe gravity acting on barrel compresses gas ; no stirring / thermometer too high ; gap between seal and syringe ; [max 2] (f) C marked on barrel – above the level of the beaker ; [1] [Total: 10]
What you needed in this session
Cambridge’s own grade thresholds for 2015 Oct/Nov, Paper 6 · Variant 3. A higher threshold means an easier paper — the bar moves with how the cohort did.