Cambridge IGCSE Science - Combined 0653 — 2015 Oct/Nov Paper 6 · Variant 1
0653/61/O/N/15 · 60 marks · ≈68 min
The question paper and its mark scheme, free to read here and free to download. This is Cambridge’s own paper, exactly as it was sat.
Question paper16 pages

Mark scheme5 pages
Answers below. Sit the paper first if you are practising.
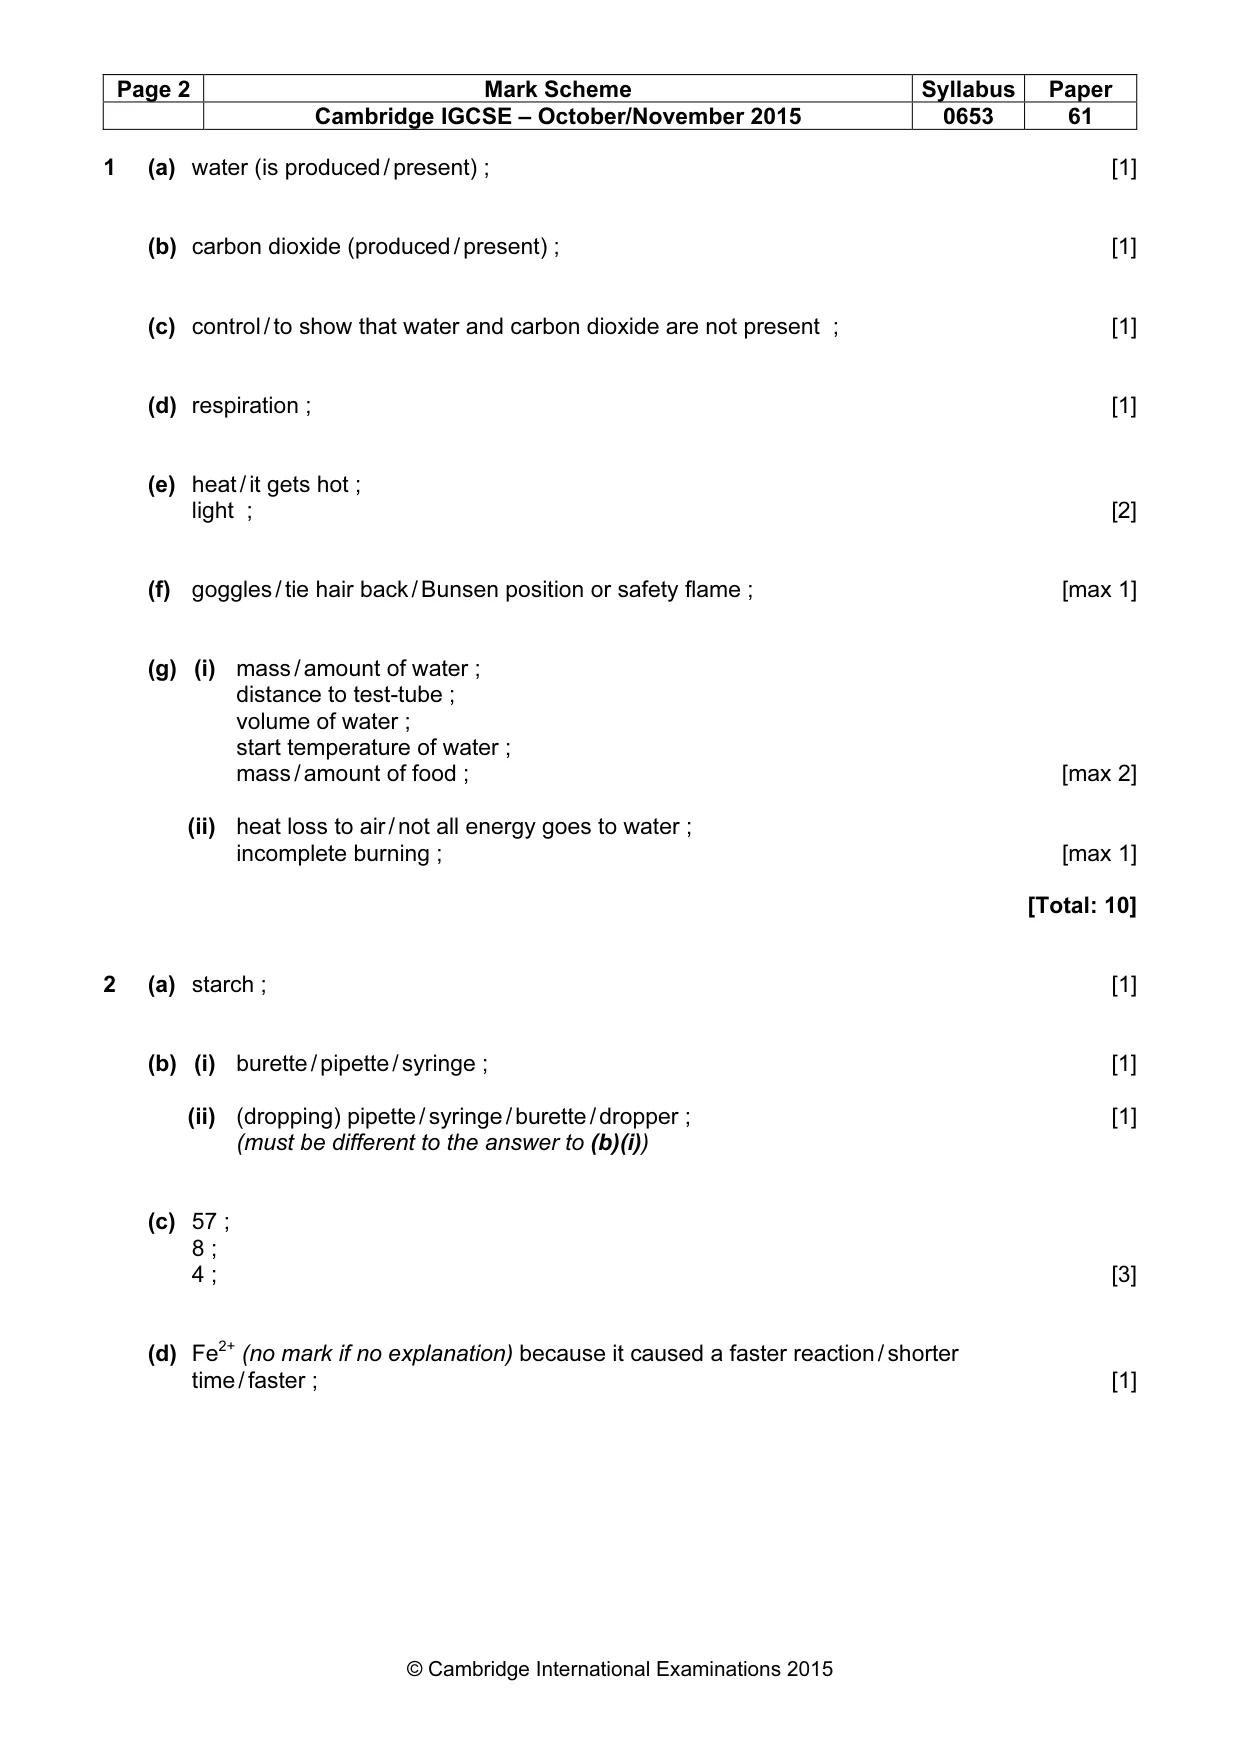
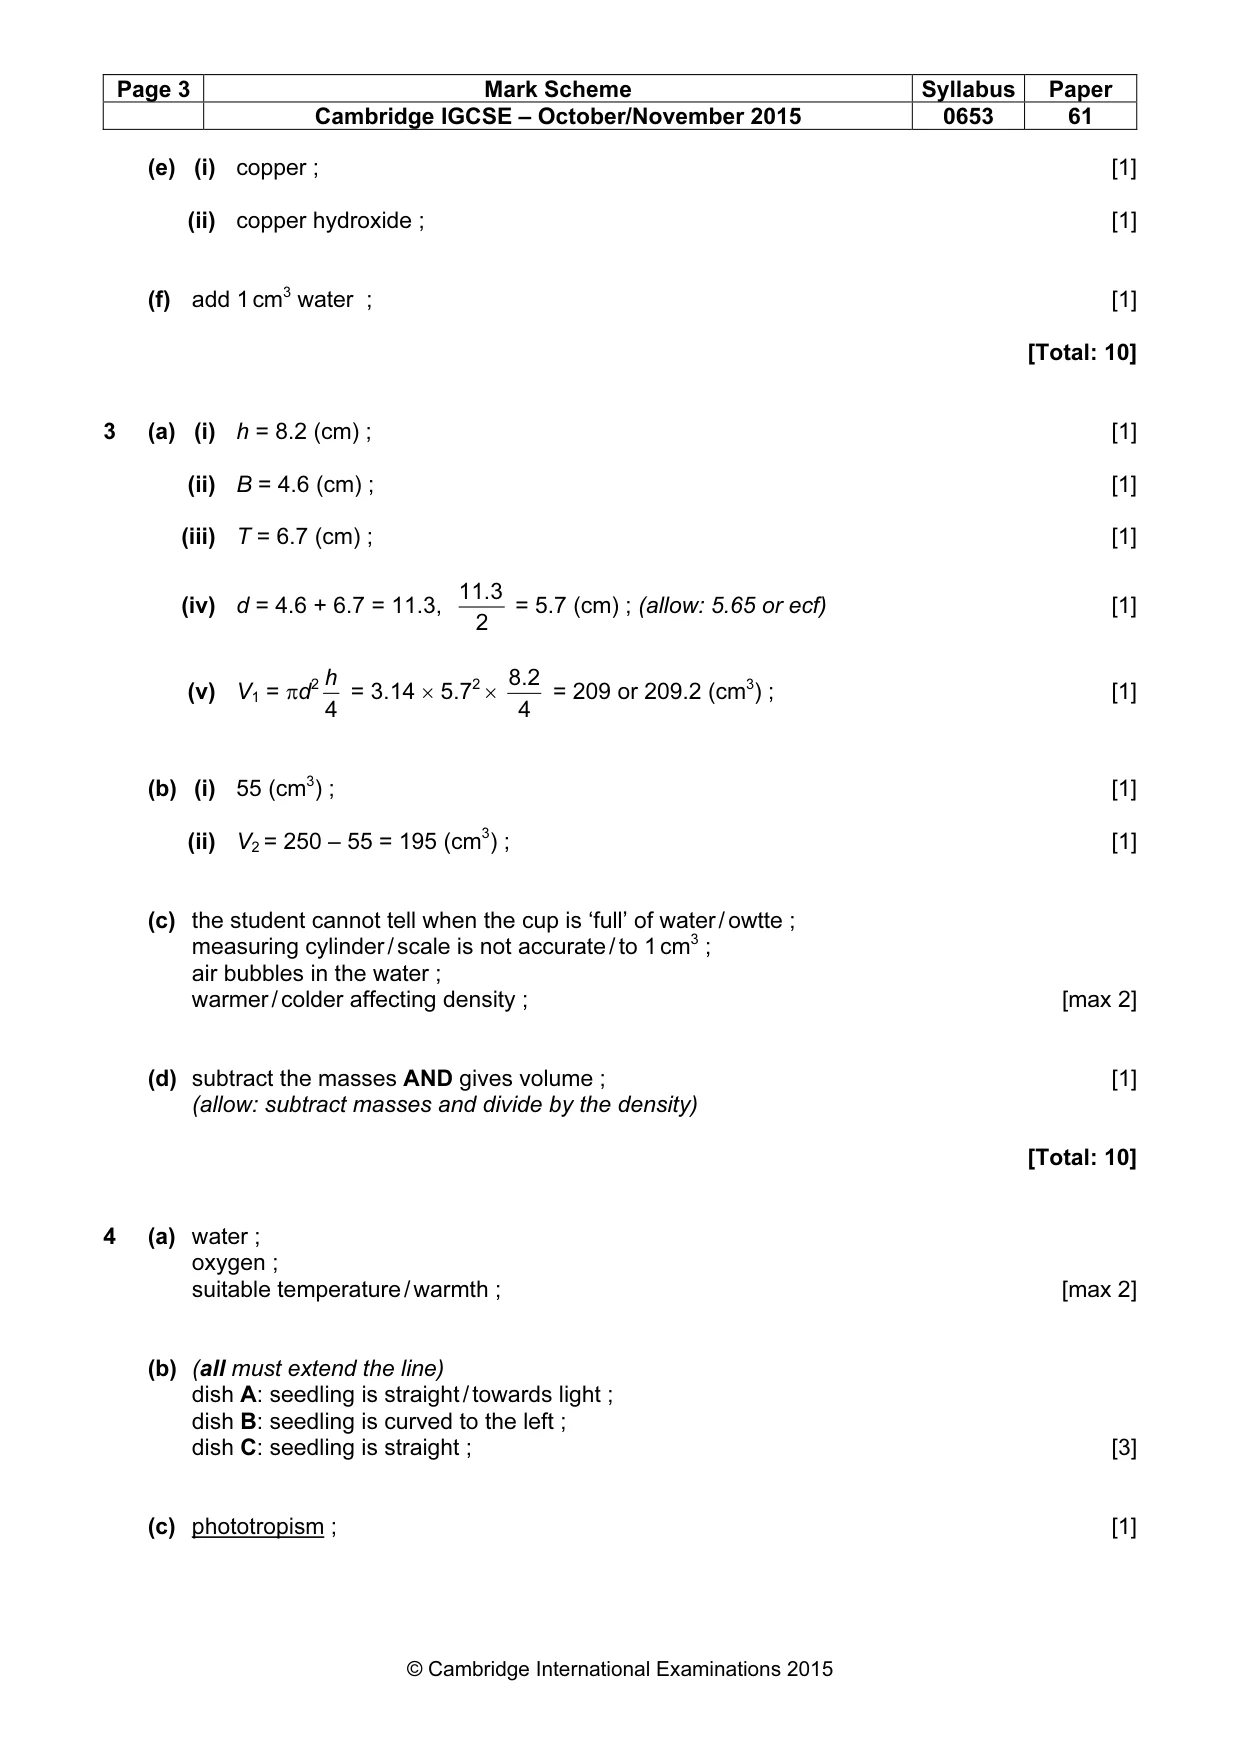
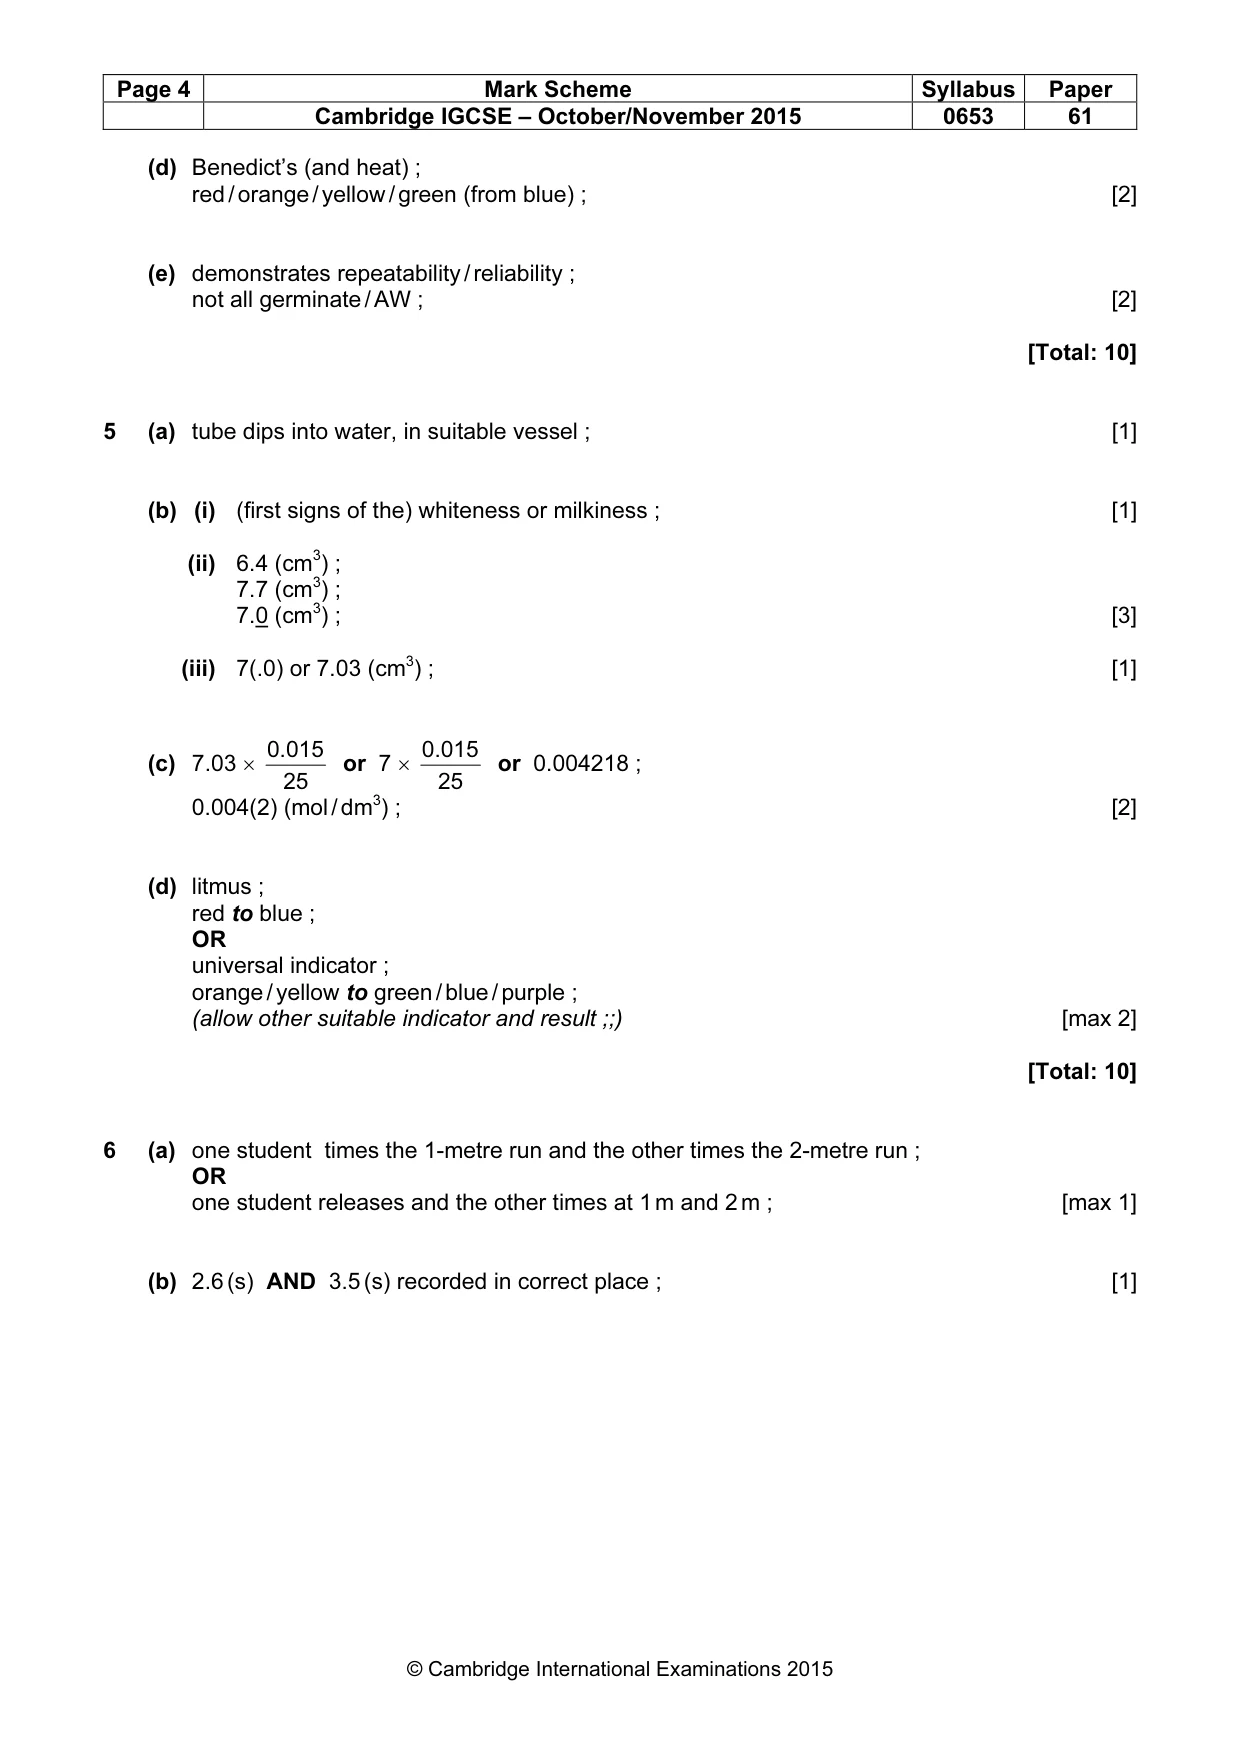
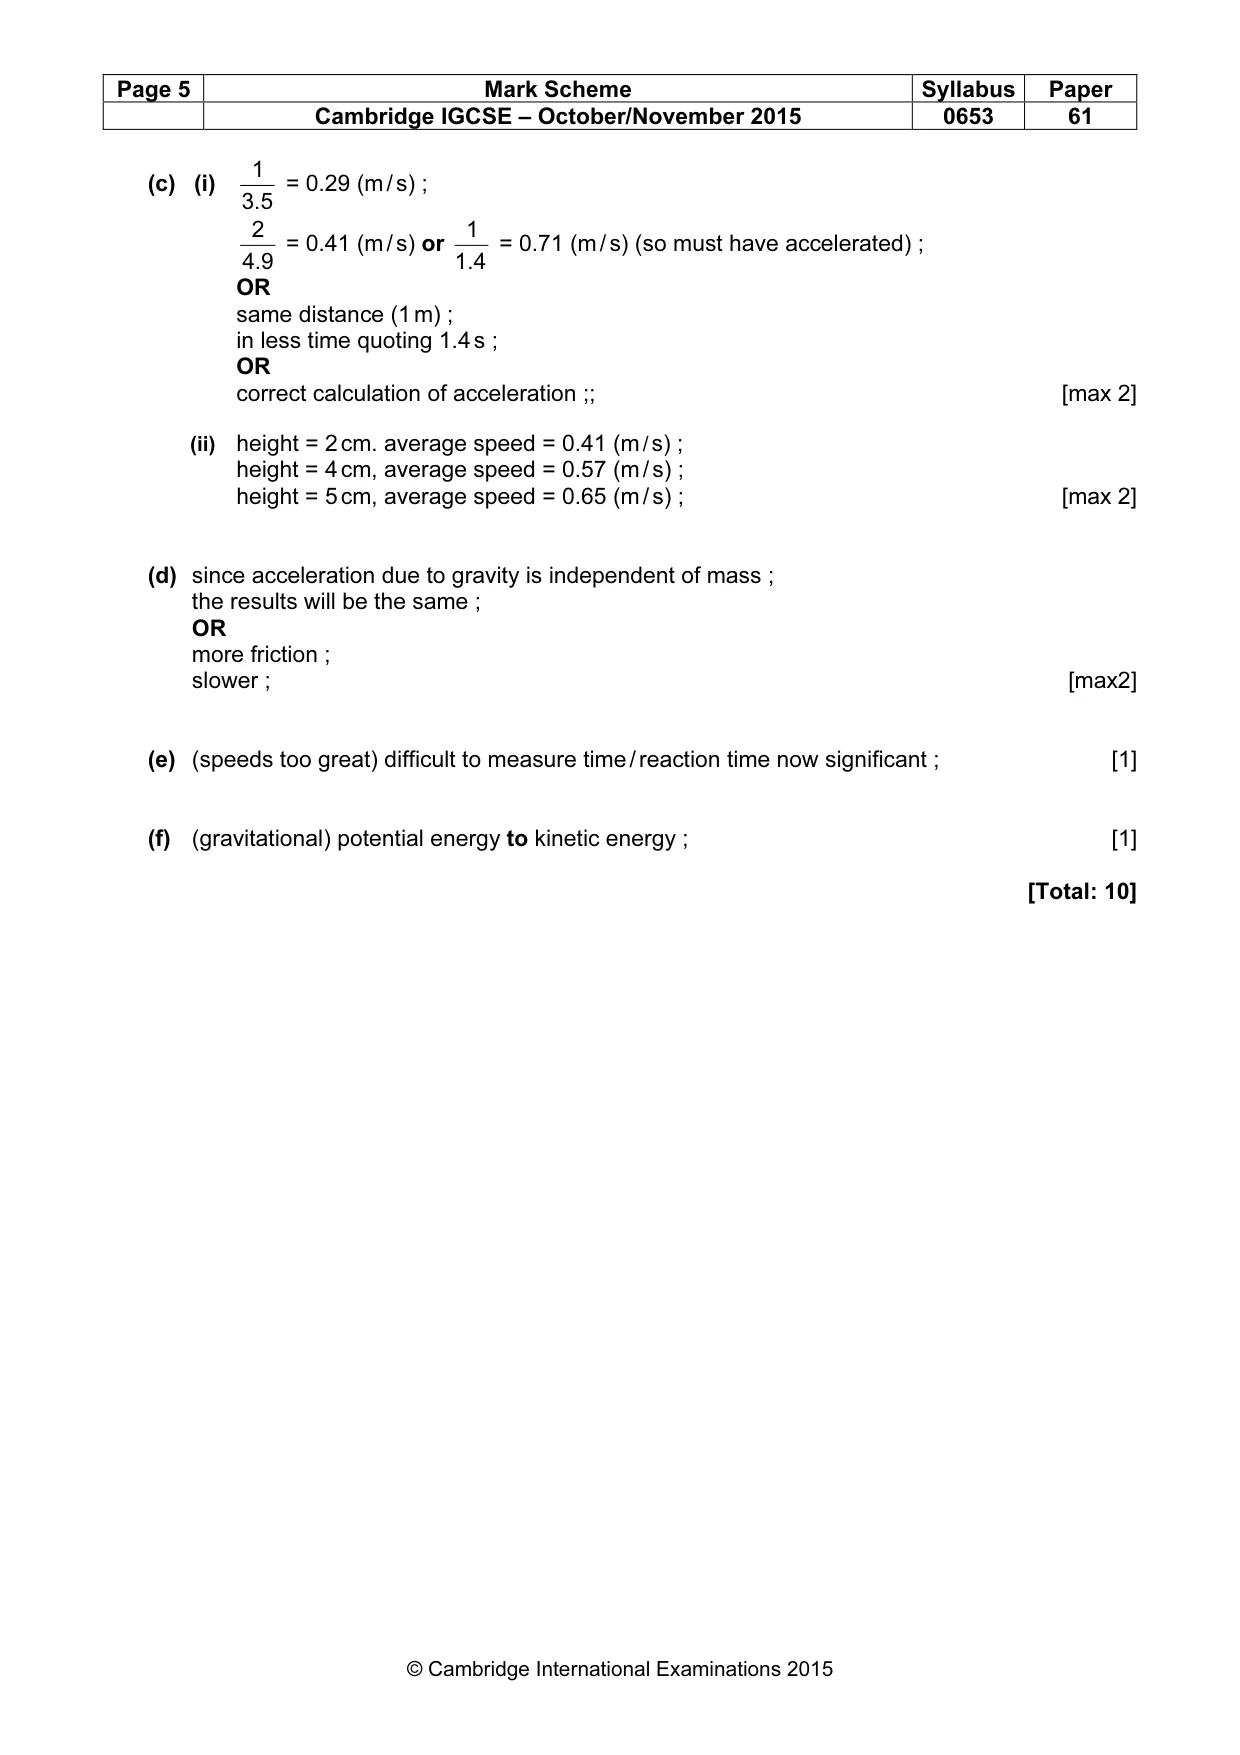
Paper as text
Question paper, page 1
This document consists of 15 printed pages and 1 blank page. IB15 11_0653_61/FP © UCLES 2015 [Turn over *6978205171* Cambridge International Examinations Cambridge International General Certificate of Secondary Education COMBINED SCIENCE 0653/61 Paper 6 Alternative to Practical October/November 2015 1 hour Candidates answer on the Question Paper. No Additional Materials are required. READ THESE INSTRUCTIONS FIRST Write your Centre number, candidate number and name on all the work you hand in. Write in dark blue or black pen. You may use an HB pencil for any diagrams or graphs. Do not use staples, paper clips, glue or correction fluid. DO NOT WRITE IN ANY BARCODES. Answer all questions. Electronic calculators may be used. You may lose marks if you do not show your working or if you do not use appropriate units. At the end of the examination, fasten all your work securely together. The number of marks is given in brackets [ ] at the end of each question or part question.
Question paper, page 2
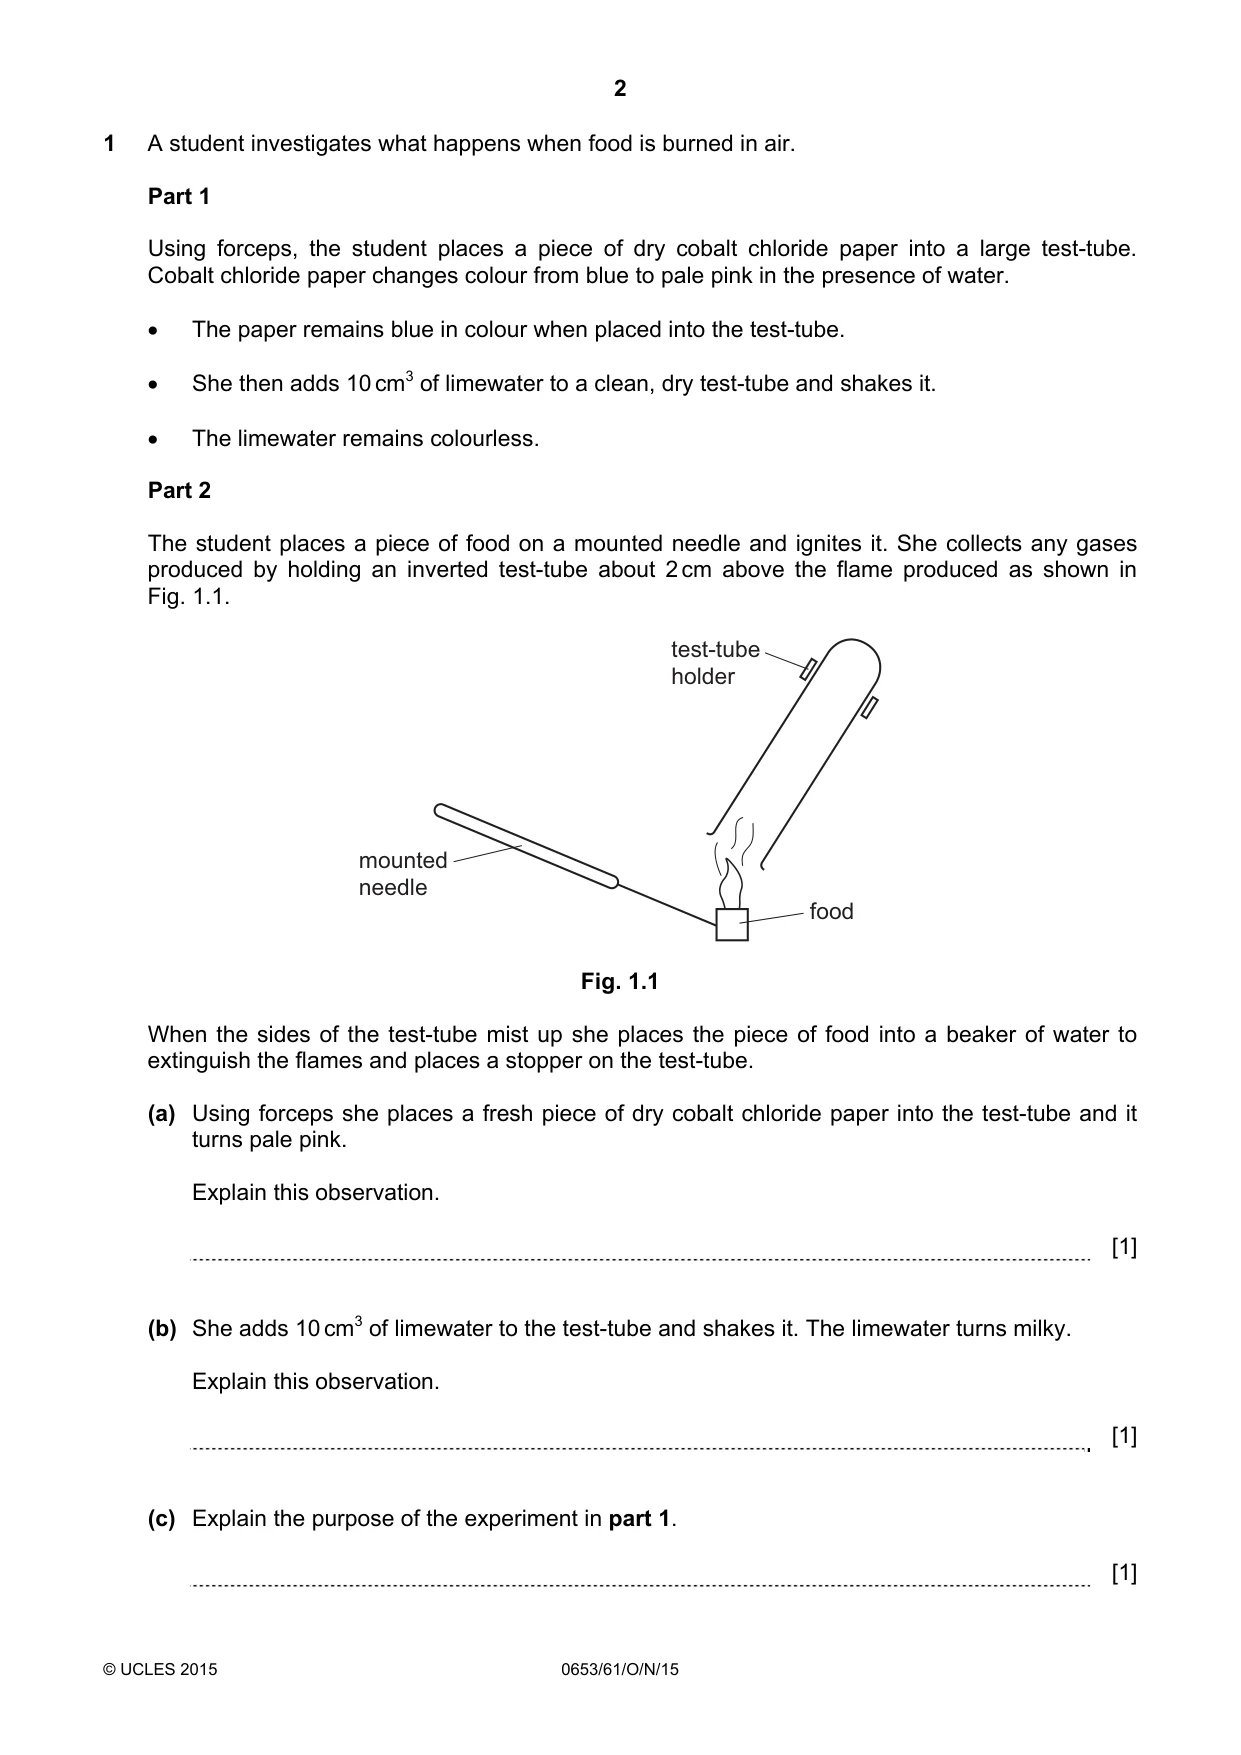
2 © UCLES 2015 0653/61/O/N/15 1 A student investigates what happens when food is burned in air. Part 1 Using forceps, the student places a piece of dry cobalt chloride paper into a large test-tube. Cobalt chloride paper changes colour from blue to pale pink in the presence of water. • The paper remains blue in colour when placed into the test-tube. • She then adds 10 cm3 of limewater to a clean, dry test-tube and shakes it. • The limewater remains colourless. Part 2 The student places a piece of food on a mounted needle and ignites it. She collects any gases produced by holding an inverted test-tube about 2 cm above the flame produced as shown in Fig. 1.1. mounted needle food test-tube holder Fig. 1.1 When the sides of the test-tube mist up she places the piece of food into a beaker of water to extinguish the flames and places a stopper on the test-tube. (a) Using forceps she places a fresh piece of dry cobalt chloride paper into the test-tube and it turns pale pink. Explain this observation. [1] (b) She adds 10 cm3 of limewater to the test-tube and shakes it. The limewater turns milky. Explain this observation. [1] (c) Explain the purpose of the experiment in part 1. [1]
Question paper, page 3
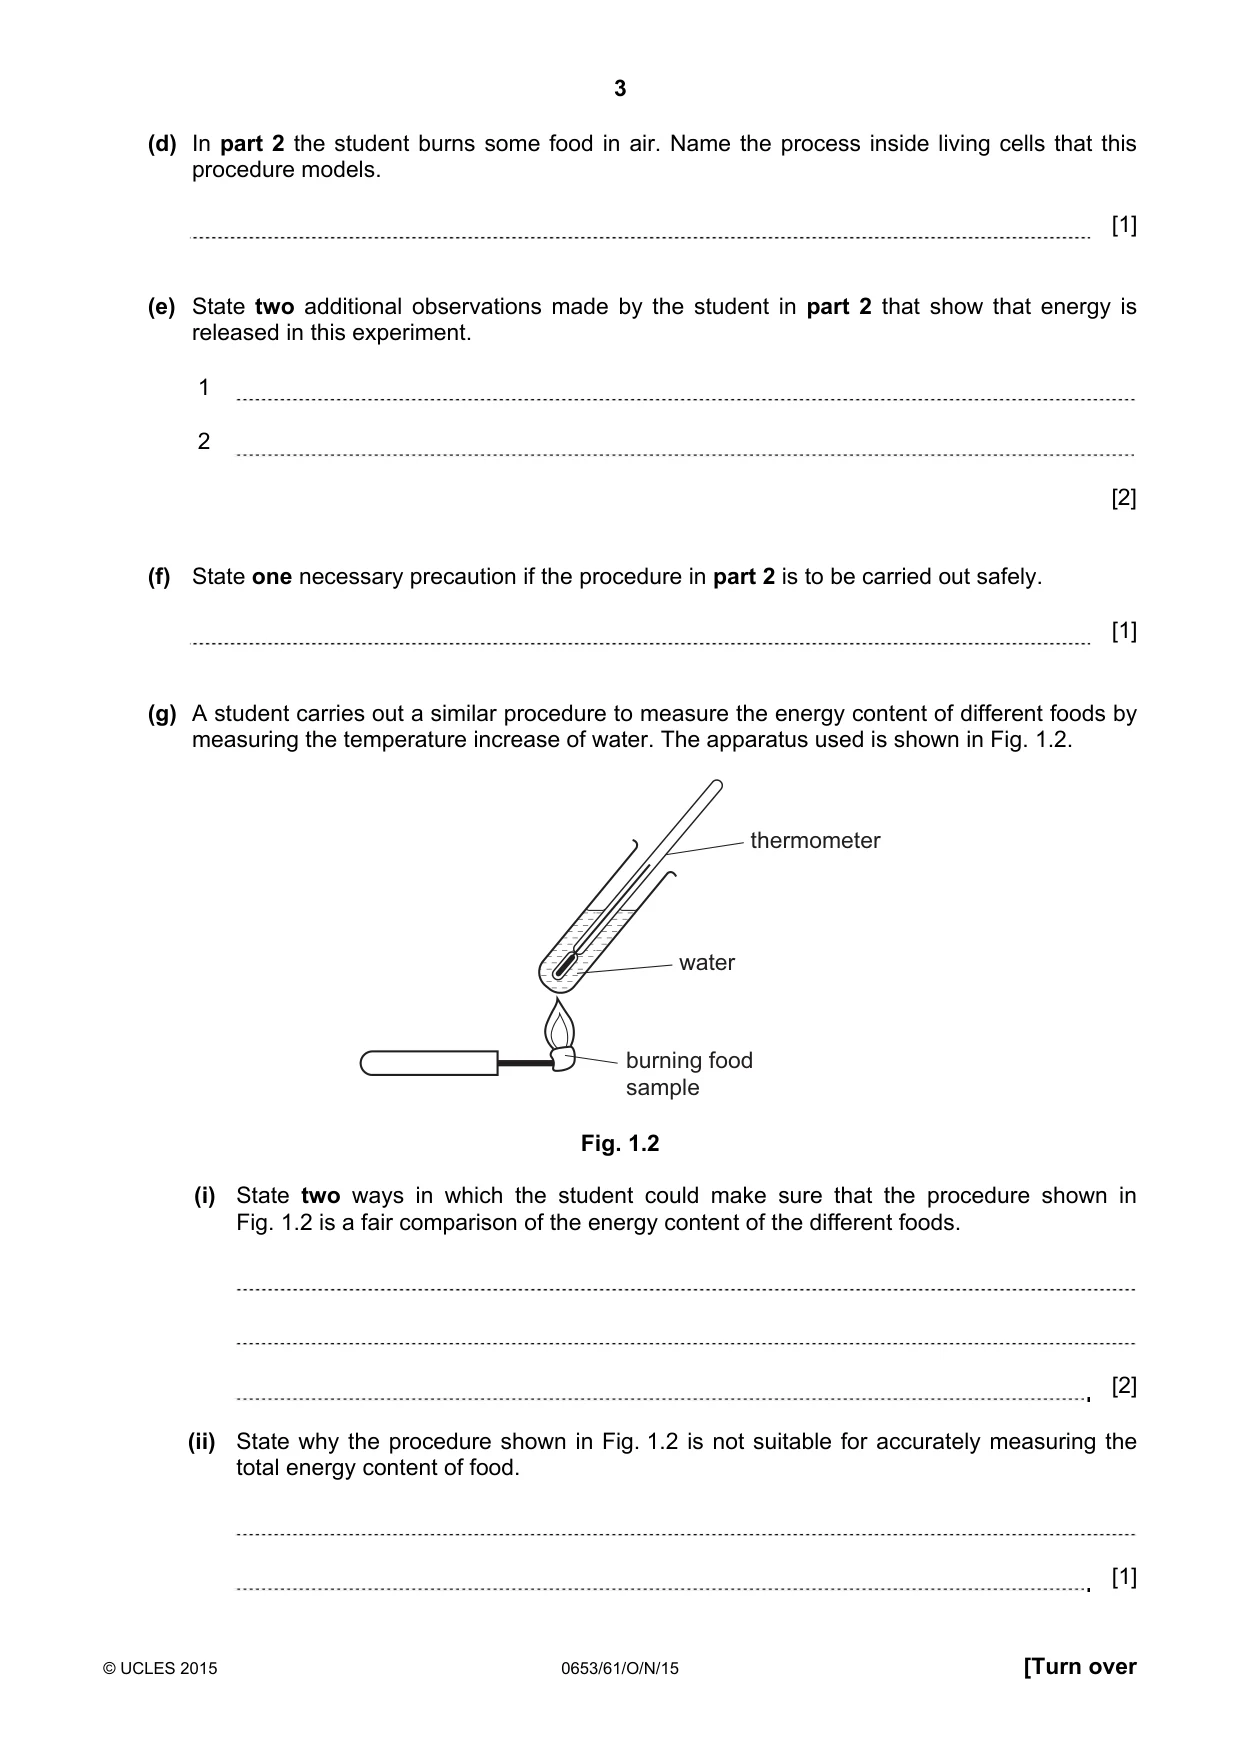
3 © UCLES 2015 0653/61/O/N/15 [Turn over (d) In part 2 the student burns some food in air. Name the process inside living cells that this procedure models. [1] (e) State two additional observations made by the student in part 2 that show that energy is released in this experiment. 1 2 [2] (f) State one necessary precaution if the procedure in part 2 is to be carried out safely. [1] (g) A student carries out a similar procedure to measure the energy content of different foods by measuring the temperature increase of water. The apparatus used is shown in Fig. 1.2. thermometer water burning food sample Fig. 1.2 (i) State two ways in which the student could make sure that the procedure shown in Fig. 1.2 is a fair comparison of the energy content of the different foods. [2] (ii) State why the procedure shown in Fig. 1.2 is not suitable for accurately measuring the total energy content of food. [1]
Question paper, page 4
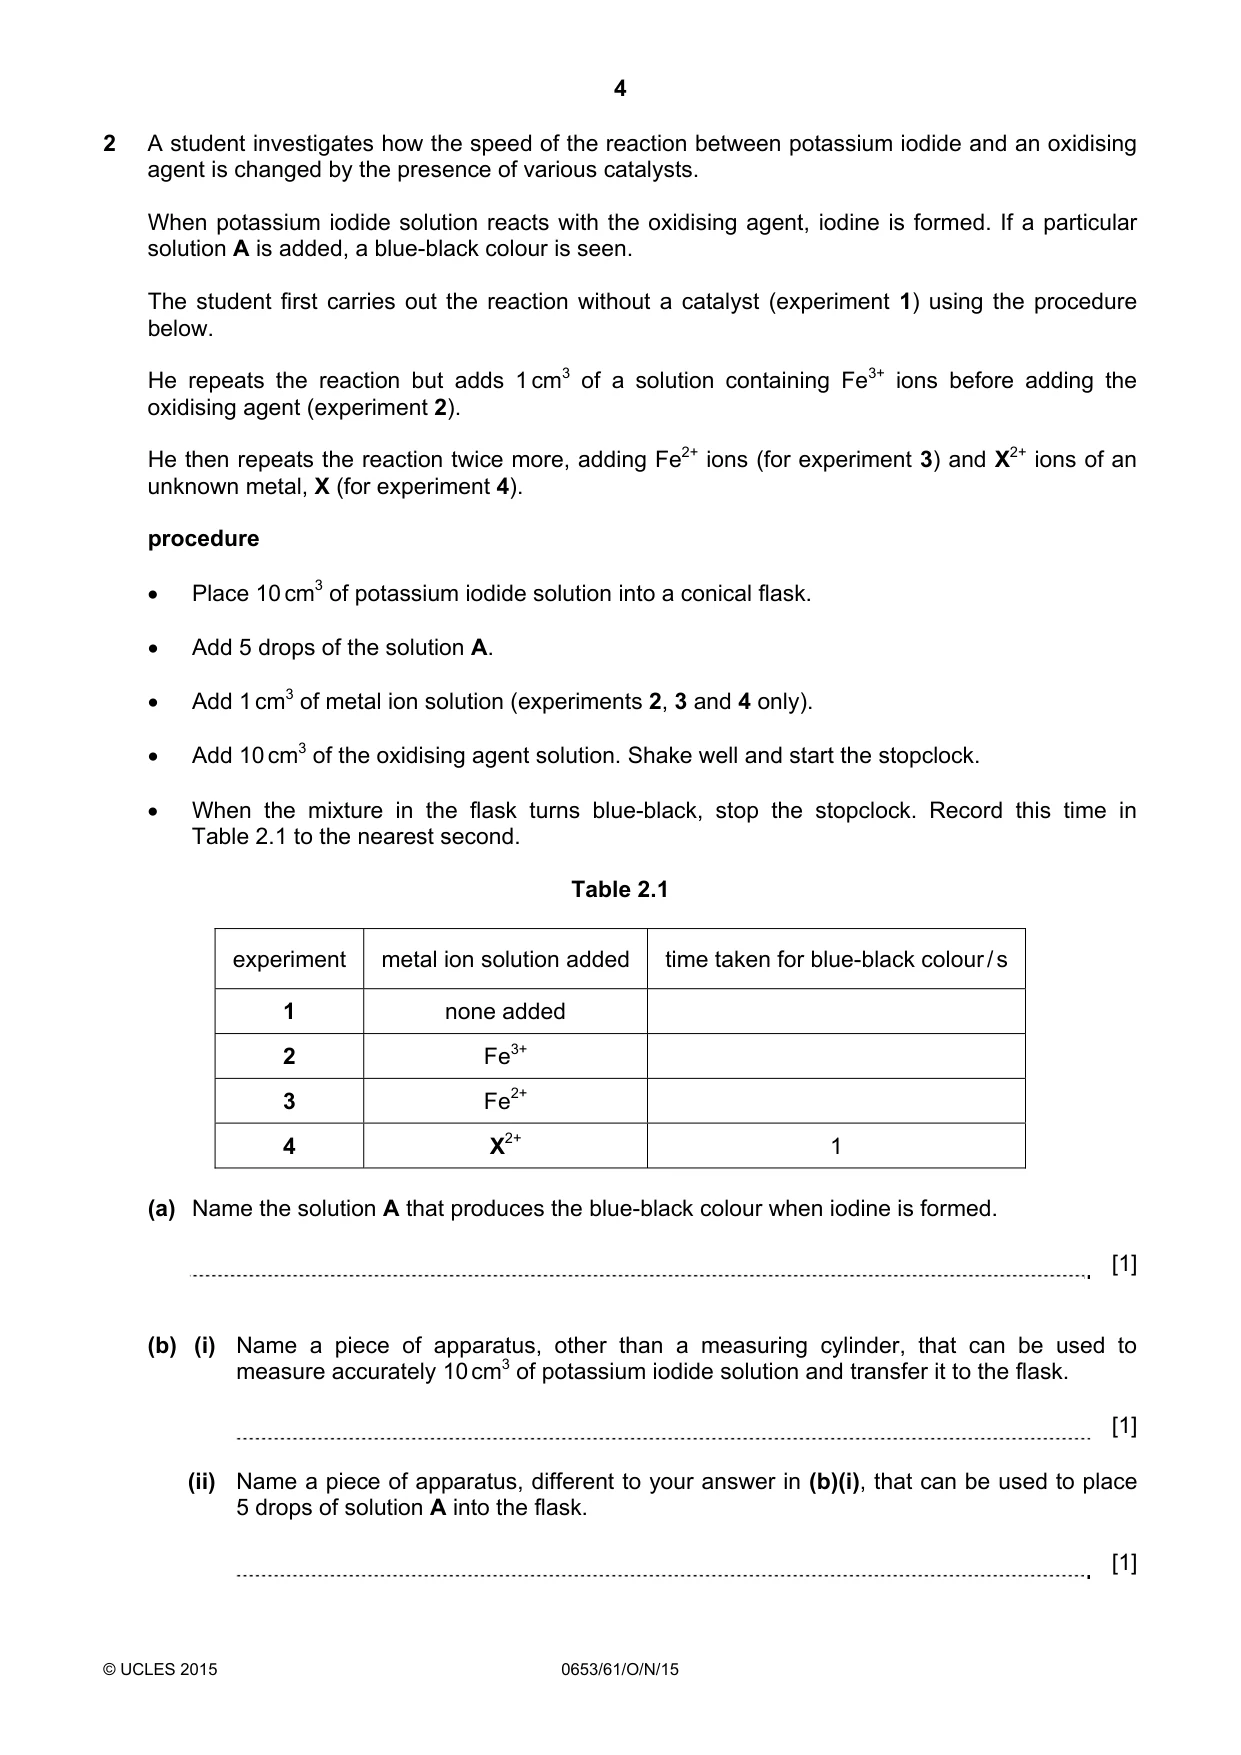
4 © UCLES 2015 0653/61/O/N/15 2 A student investigates how the speed of the reaction between potassium iodide and an oxidising agent is changed by the presence of various catalysts. When potassium iodide solution reacts with the oxidising agent, iodine is formed. If a particular solution A is added, a blue-black colour is seen. The student first carries out the reaction without a catalyst (experiment 1) using the procedure below. He repeats the reaction but adds 1 cm3 of a solution containing Fe3+ ions before adding the oxidising agent (experiment 2). He then repeats the reaction twice more, adding Fe2+ ions (for experiment 3) and X2+ ions of an unknown metal, X (for experiment 4). procedure • Place 10 cm3 of potassium iodide solution into a conical flask. • Add 5 drops of the solution A. • Add 1 cm3 of metal ion solution (experiments 2, 3 and 4 only). • Add 10 cm3 of the oxidising agent solution. Shake well and start the stopclock. • When the mixture in the flask turns blue-black, stop the stopclock. Record this time in Table 2.1 to the nearest second. Table 2.1 experiment metal ion solution added time taken for blue-black colour / s 1 none added 2 Fe3+ 3 Fe2+ 4 X2+ 1 (a) Name the solution A that produces the blue-black colour when iodine is formed. [1] (b) (i) Name a piece of apparatus, other than a measuring cylinder, that can be used to measure accurately 10 cm3 of potassium iodide solution and transfer it to the flask. [1] (ii) Name a piece of apparatus, different to your answer in (b)(i), that can be used to place 5 drops of solution A into the flask. [1]
Question paper, page 5
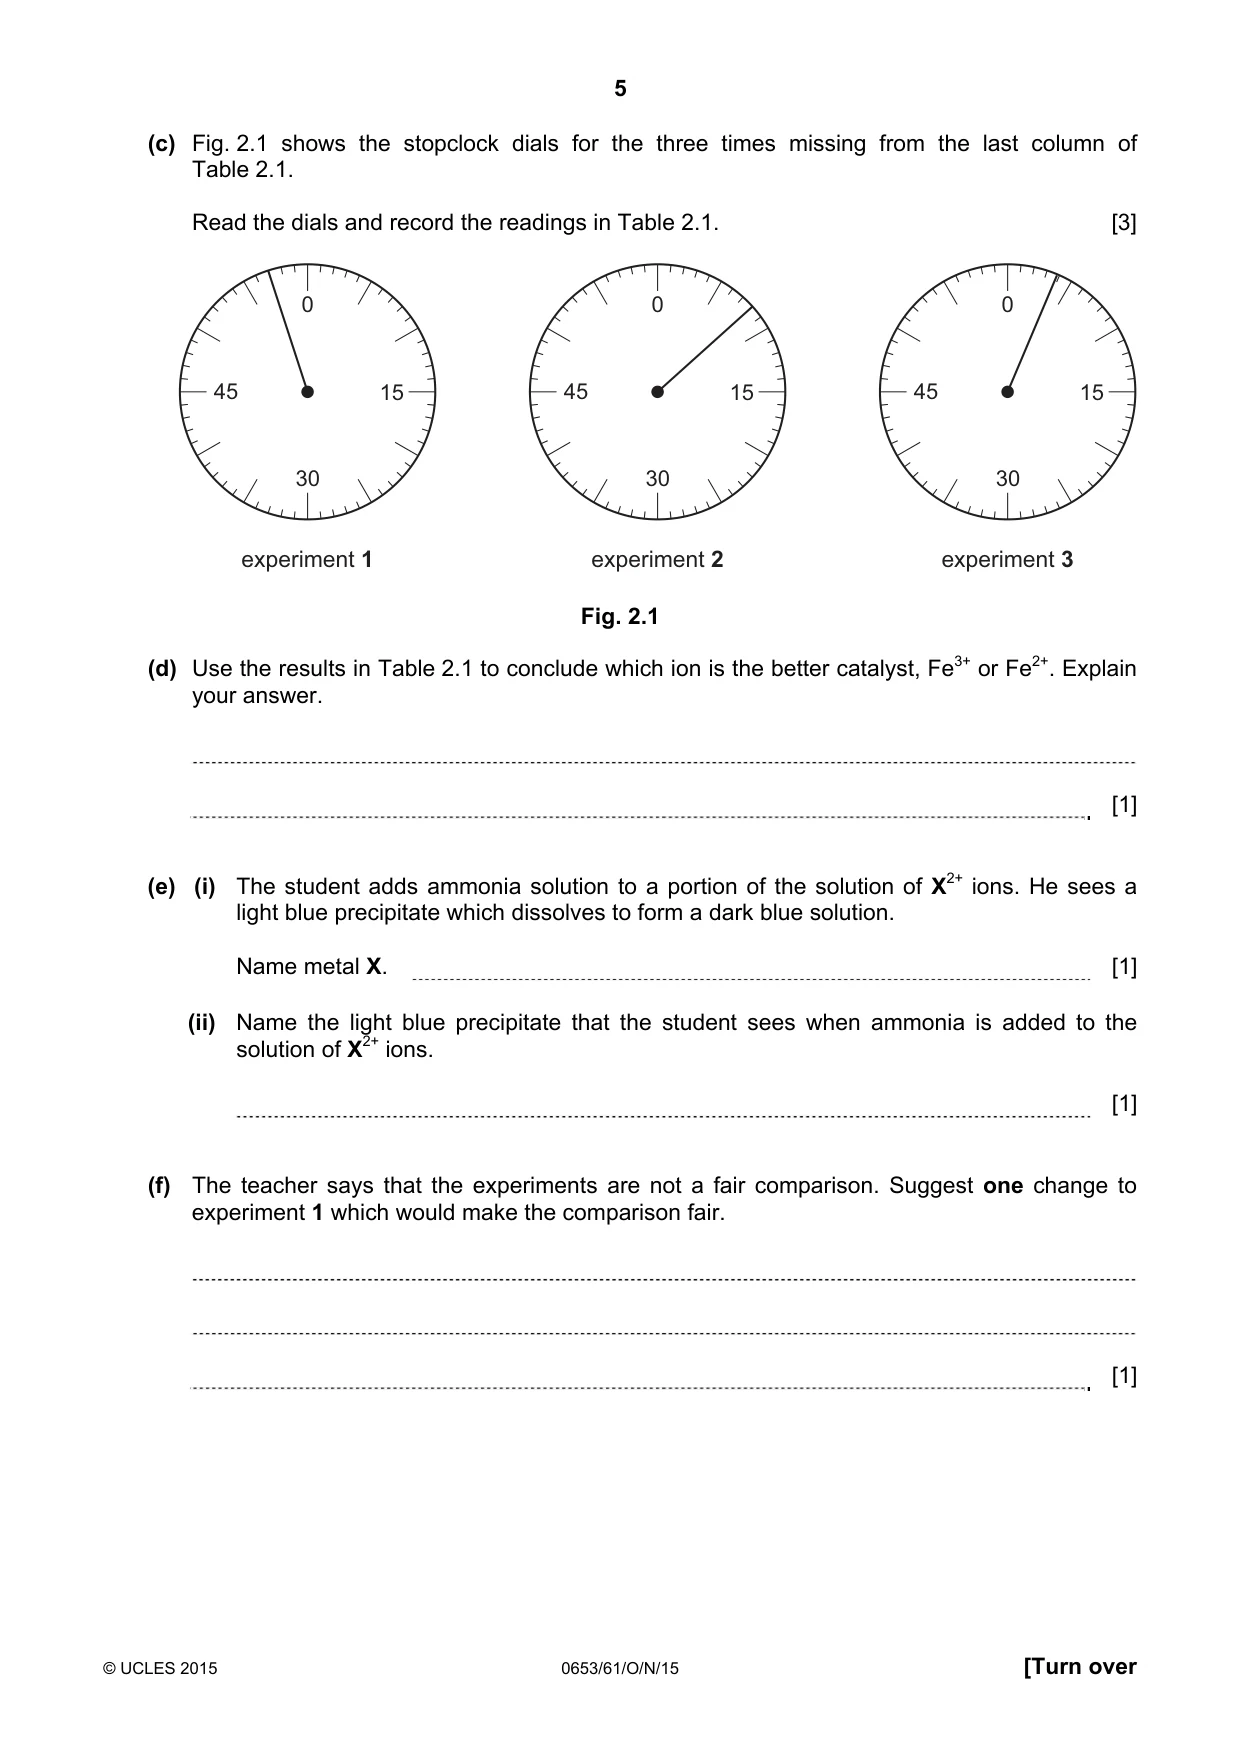
5 © UCLES 2015 0653/61/O/N/15 [Turn over (c) Fig. 2.1 shows the stopclock dials for the three times missing from the last column of Table 2.1. Read the dials and record the readings in Table 2.1. [3] 0 15 30 45 experiment 3 0 15 30 45 experiment 2 0 15 30 45 experiment 1 Fig. 2.1 (d) Use the results in Table 2.1 to conclude which ion is the better catalyst, Fe3+ or Fe2+. Explain your answer. [1] (e) (i) The student adds ammonia solution to a portion of the solution of X2+ ions. He sees a light blue precipitate which dissolves to form a dark blue solution. Name metal X. [1] (ii) Name the light blue precipitate that the student sees when ammonia is added to the solution of X2+ ions. [1] (f) The teacher says that the experiments are not a fair comparison. Suggest one change to experiment 1 which would make the comparison fair. [1]
Question paper, page 6
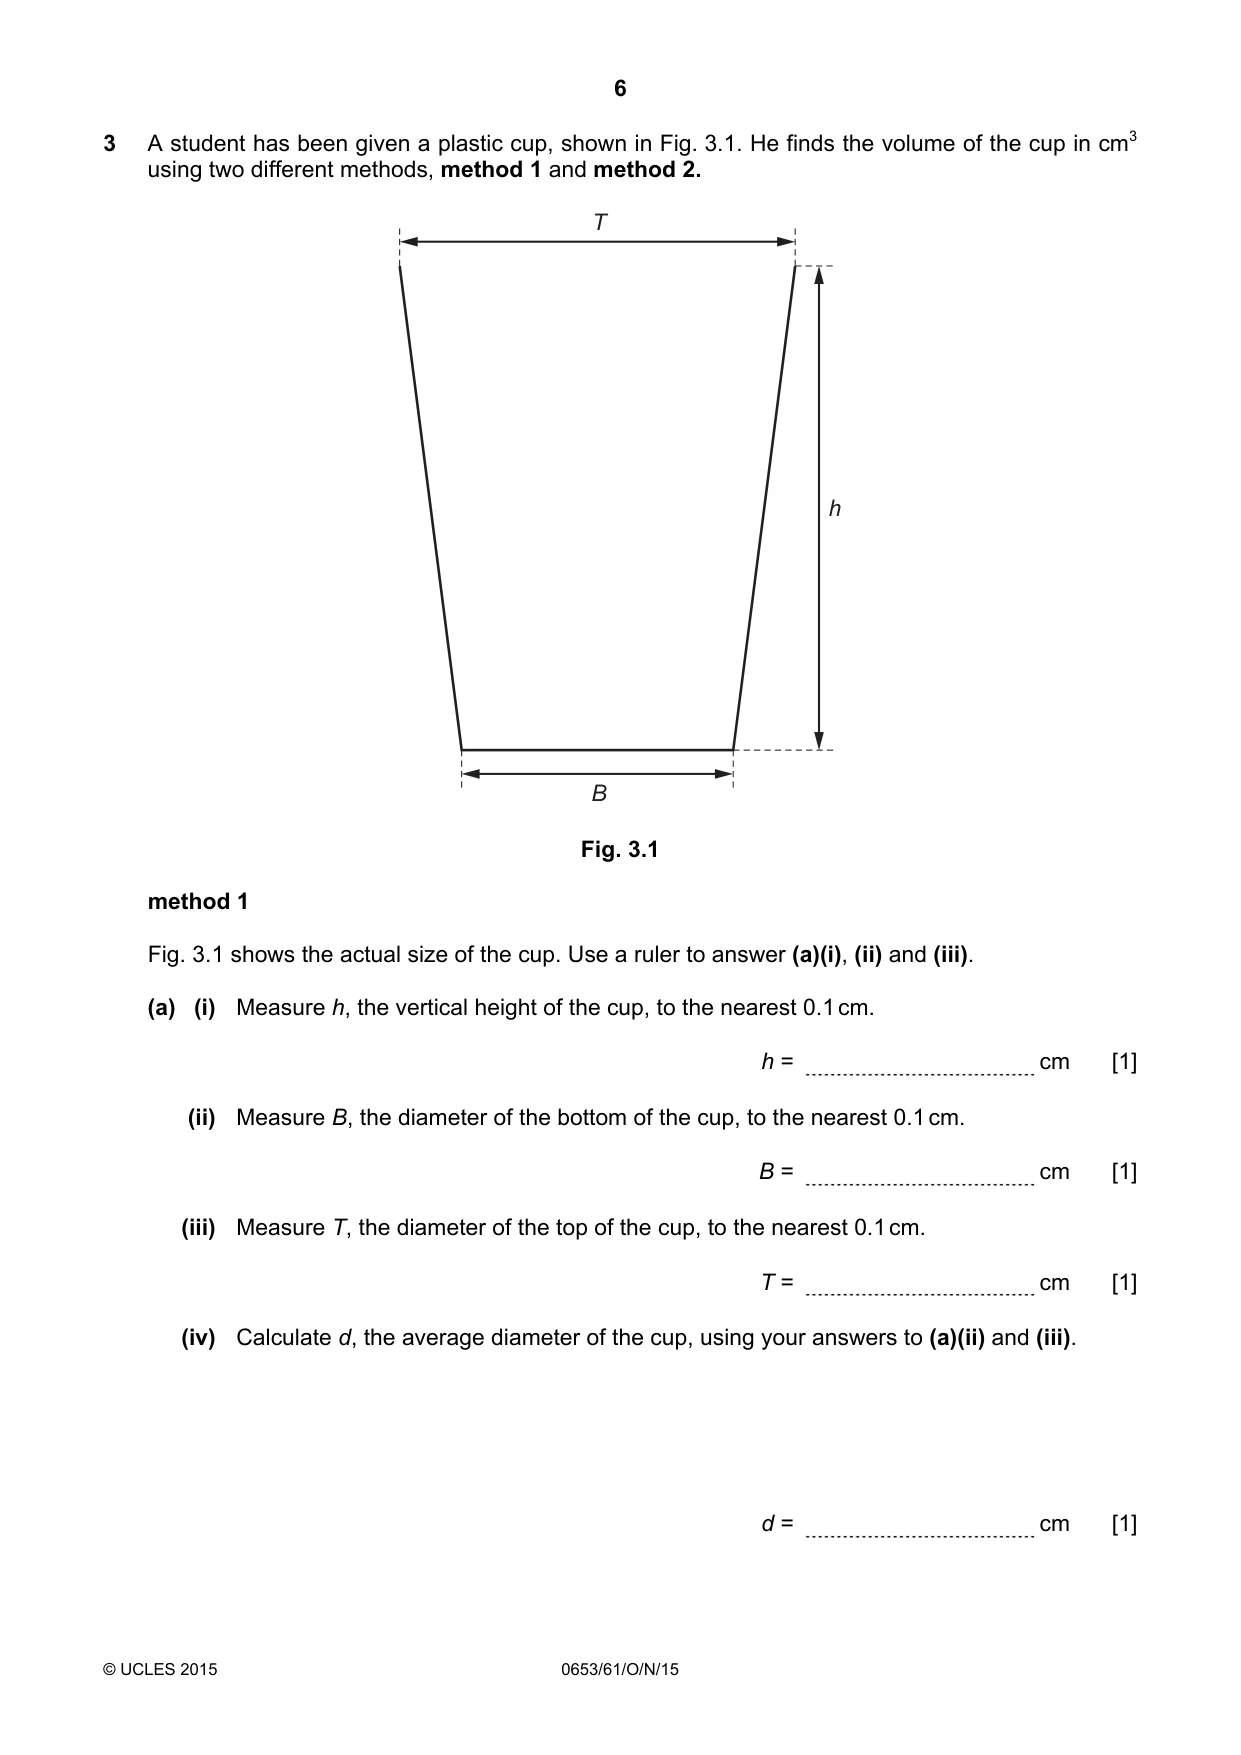
6 © UCLES 2015 0653/61/O/N/15 3 A student has been given a plastic cup, shown in Fig. 3.1. He finds the volume of the cup in cm3 using two different methods, method 1 and method 2. T B h Fig. 3.1 method 1 Fig. 3.1 shows the actual size of the cup. Use a ruler to answer (a)(i), (ii) and (iii). (a) (i) Measure h, the vertical height of the cup, to the nearest 0.1 cm. h = cm [1] (ii) Measure B, the diameter of the bottom of the cup, to the nearest 0.1 cm. B = cm [1] (iii) Measure T, the diameter of the top of the cup, to the nearest 0.1 cm. T = cm [1] (iv) Calculate d, the average diameter of the cup, using your answers to (a)(ii) and (iii). d = cm [1]
Question paper, page 7
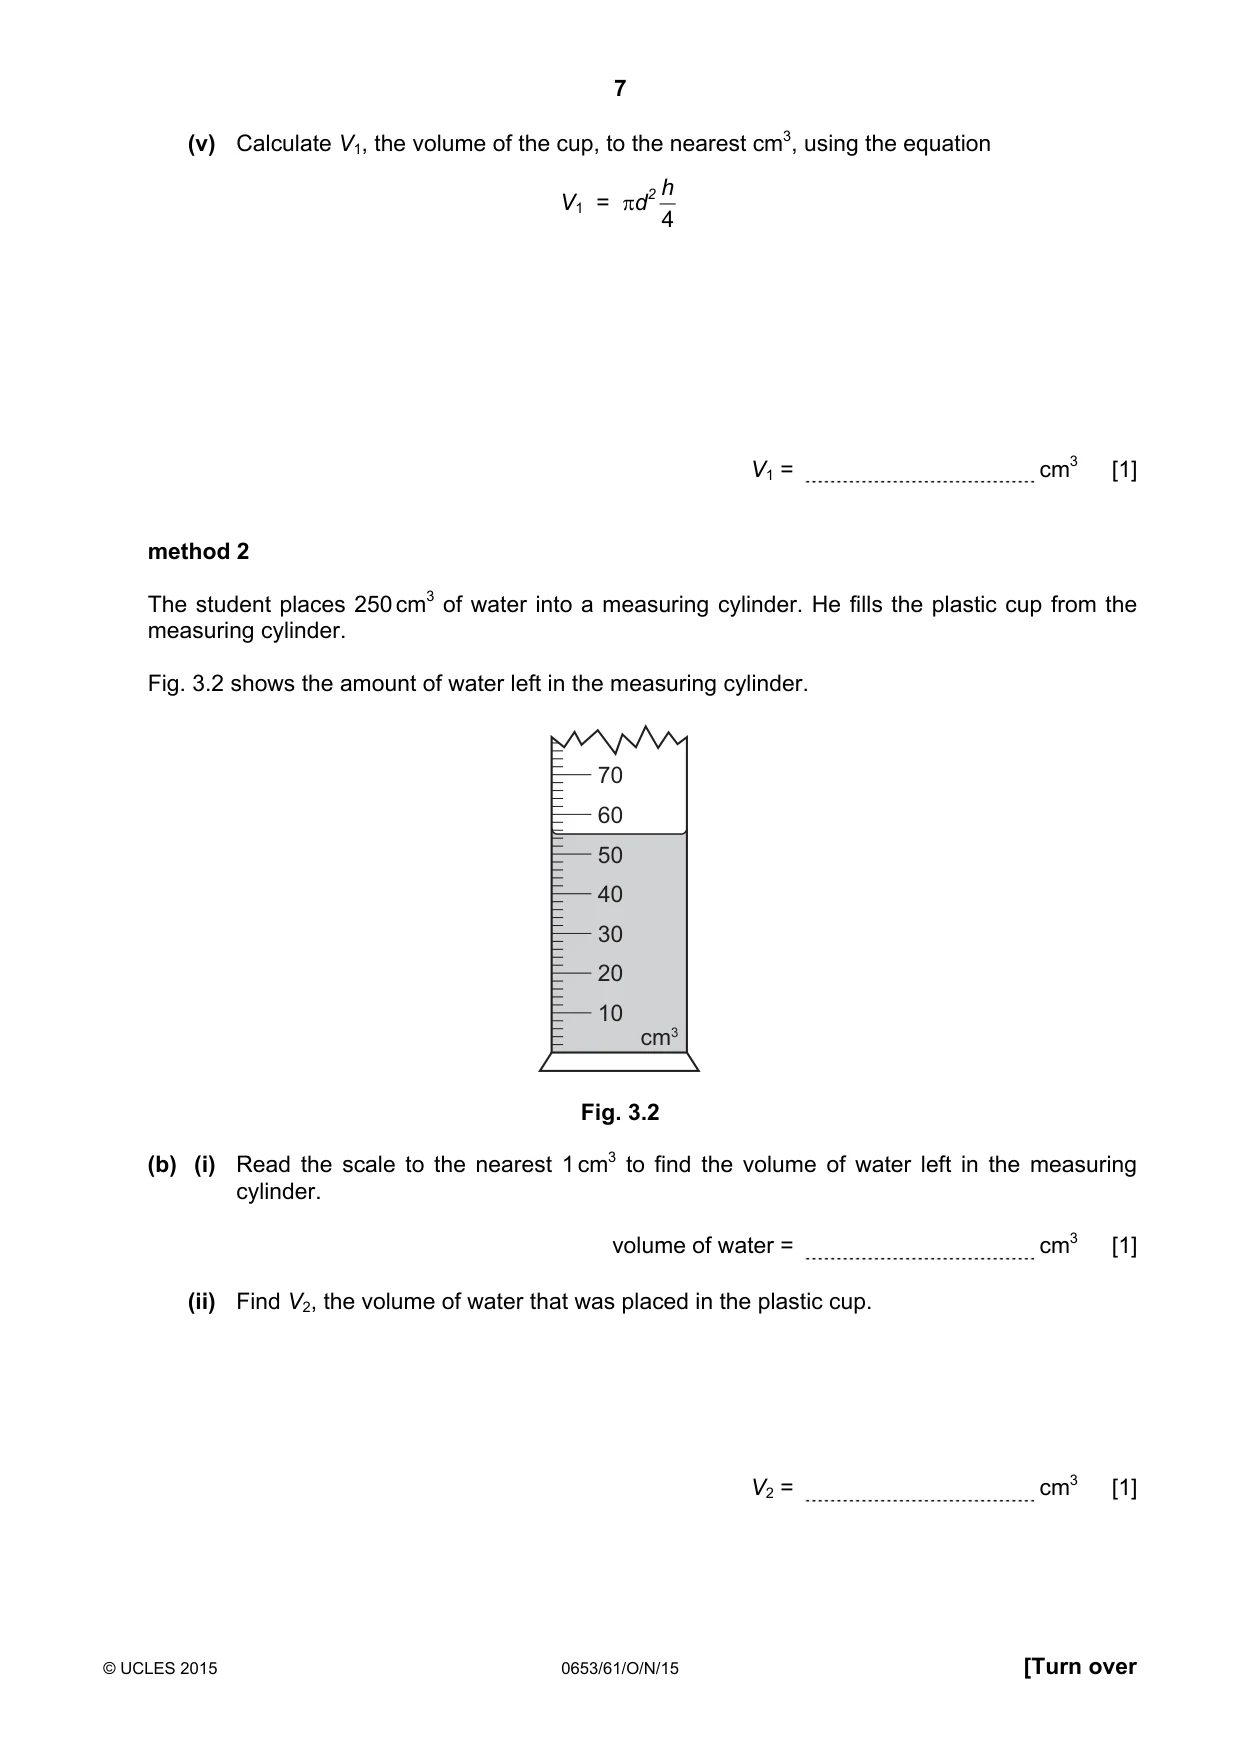
7 © UCLES 2015 0653/61/O/N/15 [Turn over (v) Calculate V1, the volume of the cup, to the nearest cm3, using the equation V1 = πd2 4 h V1 = cm3 [1] method 2 The student places 250 cm3 of water into a measuring cylinder. He fills the plastic cup from the measuring cylinder. Fig. 3.2 shows the amount of water left in the measuring cylinder. 70 60 50 40 30 20 10 cm3 Fig. 3.2 (b) (i) Read the scale to the nearest 1 cm3 to find the volume of water left in the measuring cylinder. volume of water = cm3 [1] (ii) Find V2, the volume of water that was placed in the plastic cup. V2 = cm3 [1]
Question paper, page 8
8 © UCLES 2015 0653/61/O/N/15 (c) The student thinks that method 2 is less accurate than method 1. Suggest two sources of inaccuracy in method 2. 1 2 [2] (d) Another student finds the mass in grams of the empty plastic cup. Then he finds its mass when it is full of water. Explain how he can use these two masses to find the volume of water in the cup. [1]
Question paper, page 9
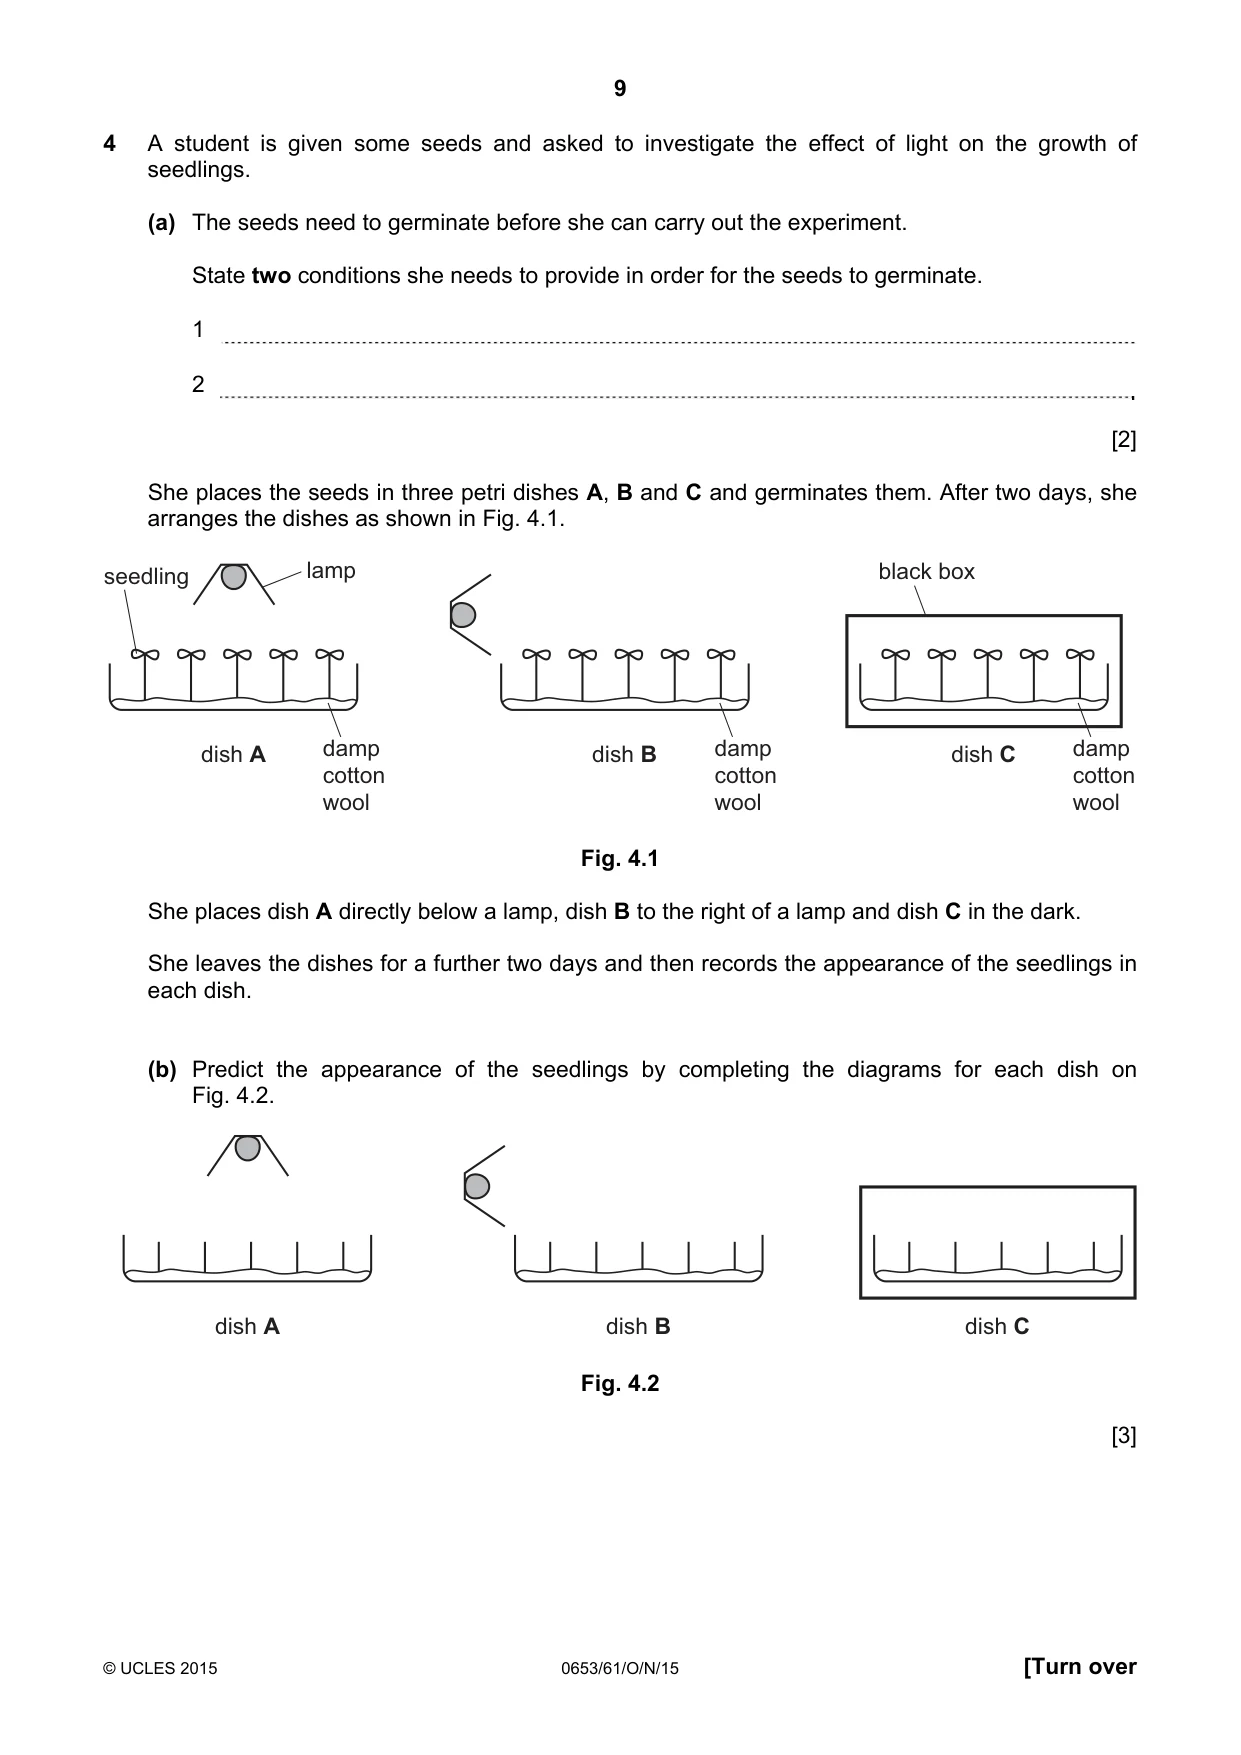
9 © UCLES 2015 0653/61/O/N/15 [Turn over 4 A student is given some seeds and asked to investigate the effect of light on the growth of seedlings. (a) The seeds need to germinate before she can carry out the experiment. State two conditions she needs to provide in order for the seeds to germinate. 1 2 [2] She places the seeds in three petri dishes A, B and C and germinates them. After two days, she arranges the dishes as shown in Fig. 4.1. dish A dish B dish C lamp damp cotton wool seedling damp cotton wool damp cotton wool black box Fig. 4.1 She places dish A directly below a lamp, dish B to the right of a lamp and dish C in the dark. She leaves the dishes for a further two days and then records the appearance of the seedlings in each dish. (b) Predict the appearance of the seedlings by completing the diagrams for each dish on Fig. 4.2. dish A dish B dish C Fig. 4.2 [3]
Question paper, page 10
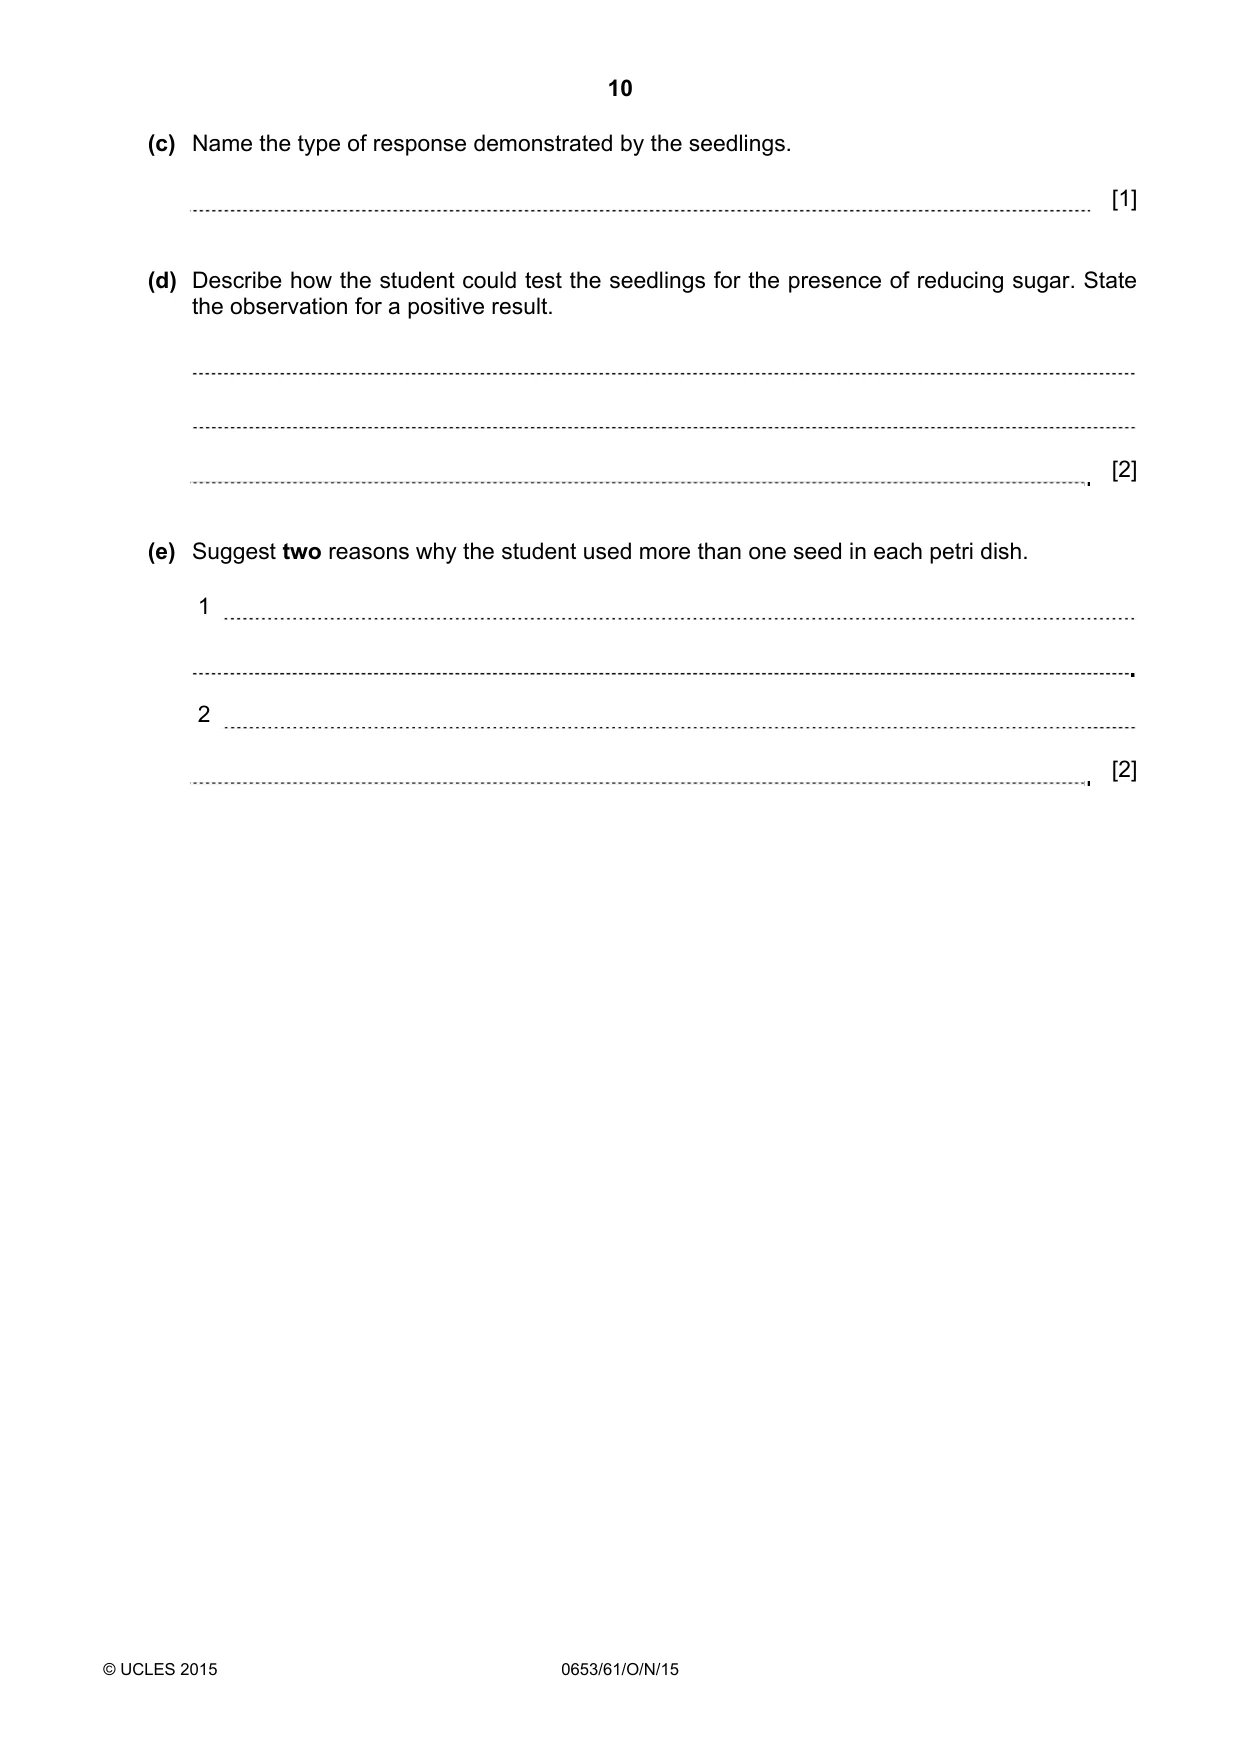
10 © UCLES 2015 0653/61/O/N/15 (c) Name the type of response demonstrated by the seedlings. [1] (d) Describe how the student could test the seedlings for the presence of reducing sugar. State the observation for a positive result. [2] (e) Suggest two reasons why the student used more than one seed in each petri dish. 1 2 [2]
Question paper, page 11
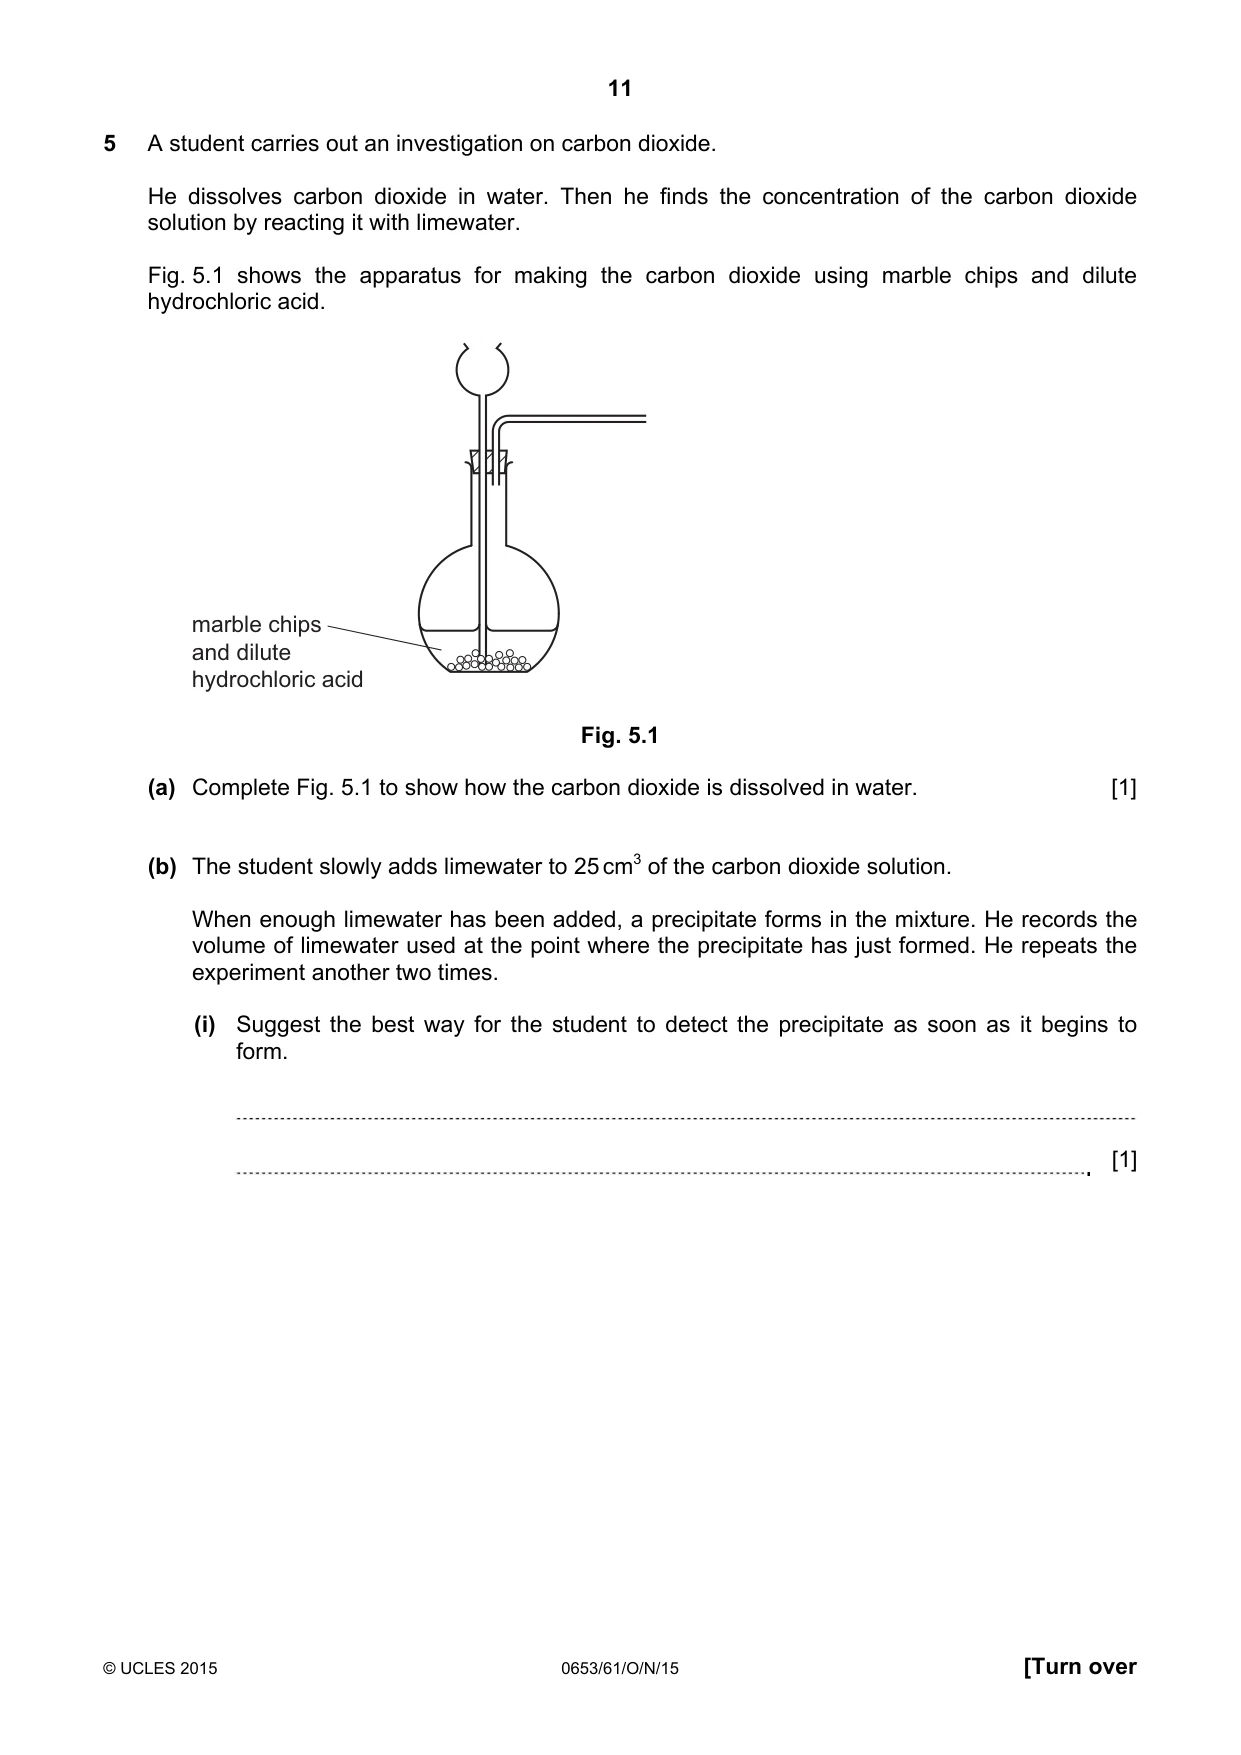
11 © UCLES 2015 0653/61/O/N/15 [Turn over 5 A student carries out an investigation on carbon dioxide. He dissolves carbon dioxide in water. Then he finds the concentration of the carbon dioxide solution by reacting it with limewater. Fig. 5.1 shows the apparatus for making the carbon dioxide using marble chips and dilute hydrochloric acid. marble chips and dilute hydrochloric acid Fig. 5.1 (a) Complete Fig. 5.1 to show how the carbon dioxide is dissolved in water. [1] (b) The student slowly adds limewater to 25 cm3 of the carbon dioxide solution. When enough limewater has been added, a precipitate forms in the mixture. He records the volume of limewater used at the point where the precipitate has just formed. He repeats the experiment another two times. (i) Suggest the best way for the student to detect the precipitate as soon as it begins to form. [1]
Question paper, page 12
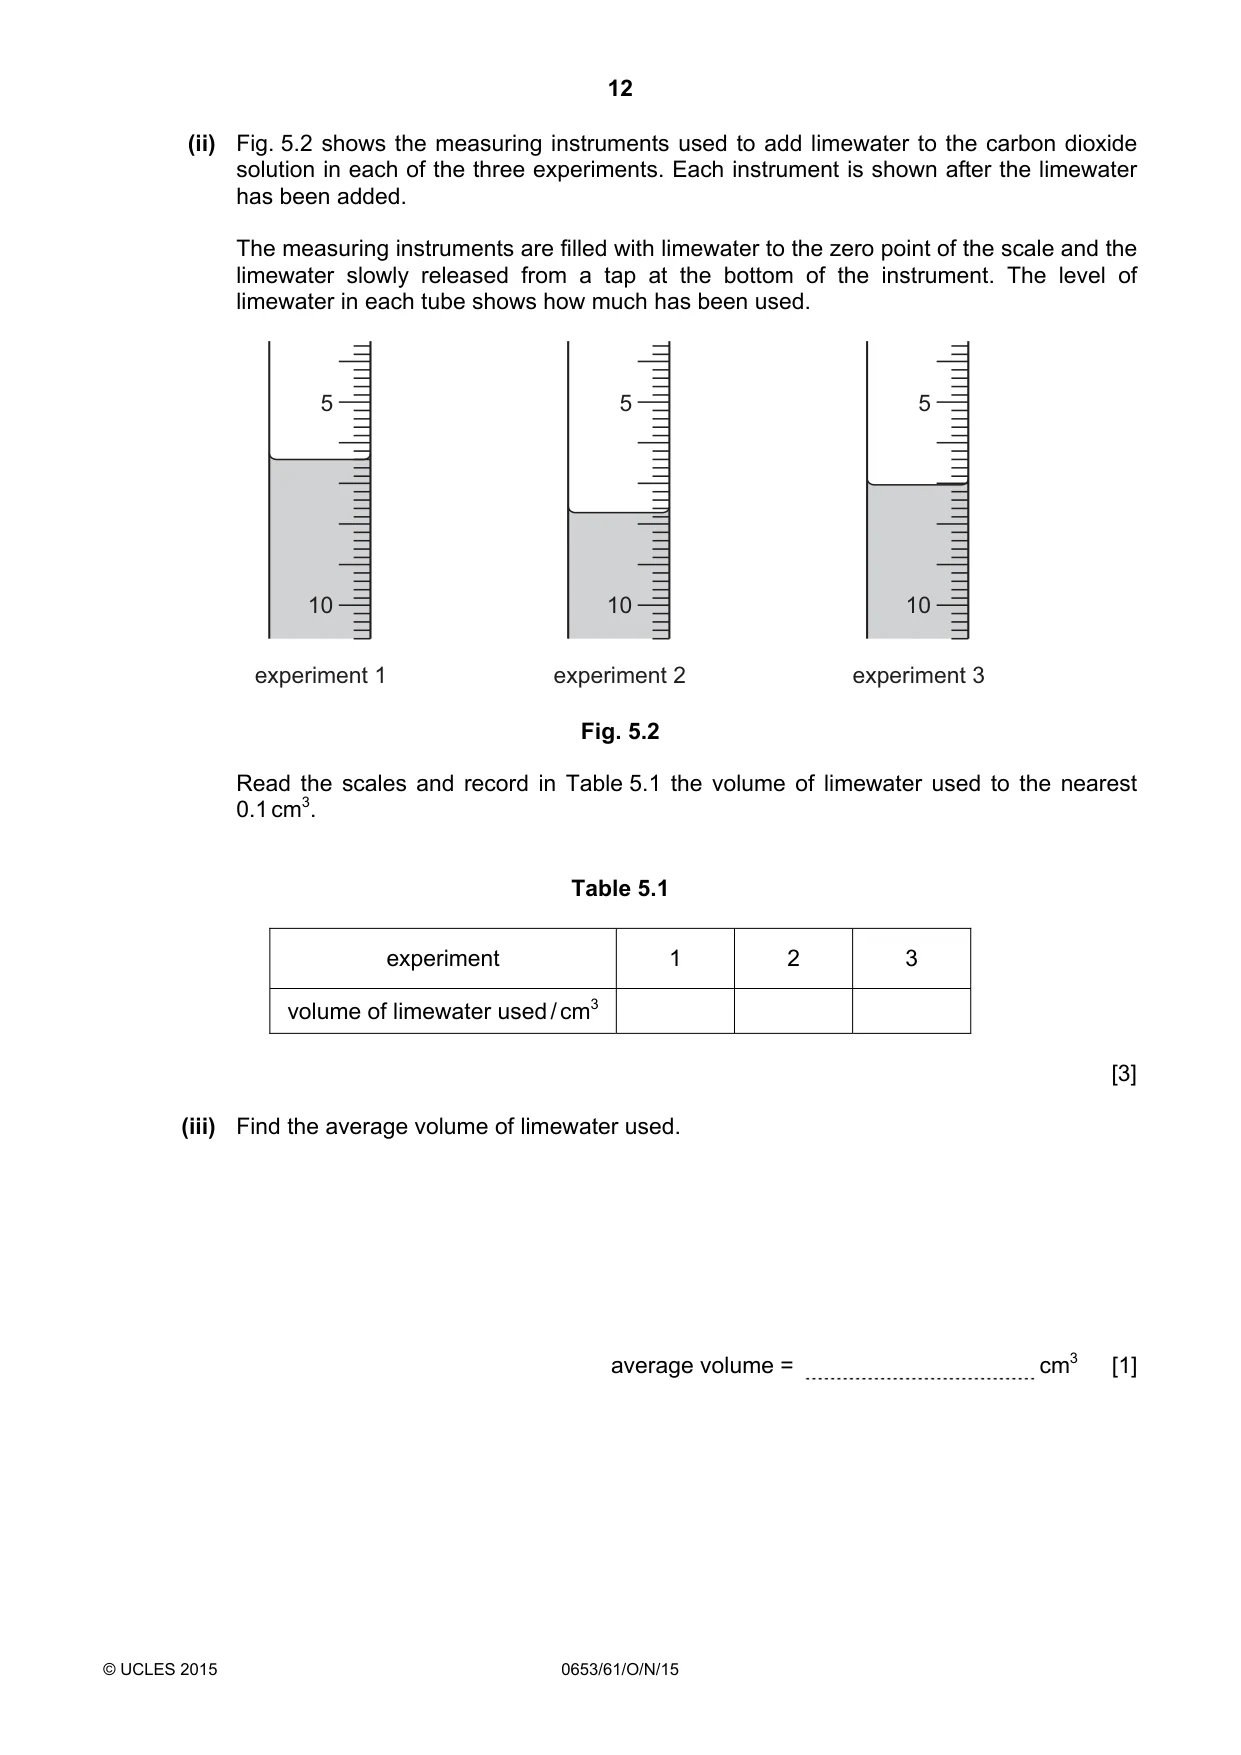
12 © UCLES 2015 0653/61/O/N/15 (ii) Fig. 5.2 shows the measuring instruments used to add limewater to the carbon dioxide solution in each of the three experiments. Each instrument is shown after the limewater has been added. The measuring instruments are filled with limewater to the zero point of the scale and the limewater slowly released from a tap at the bottom of the instrument. The level of limewater in each tube shows how much has been used. 5 10 experiment 1 5 10 experiment 2 5 10 experiment 3 Fig. 5.2 Read the scales and record in Table 5.1 the volume of limewater used to the nearest 0.1 cm3. Table 5.1 experiment 1 2 3 volume of limewater used / cm3 [3] (iii) Find the average volume of limewater used. average volume = cm3 [1]
Question paper, page 13
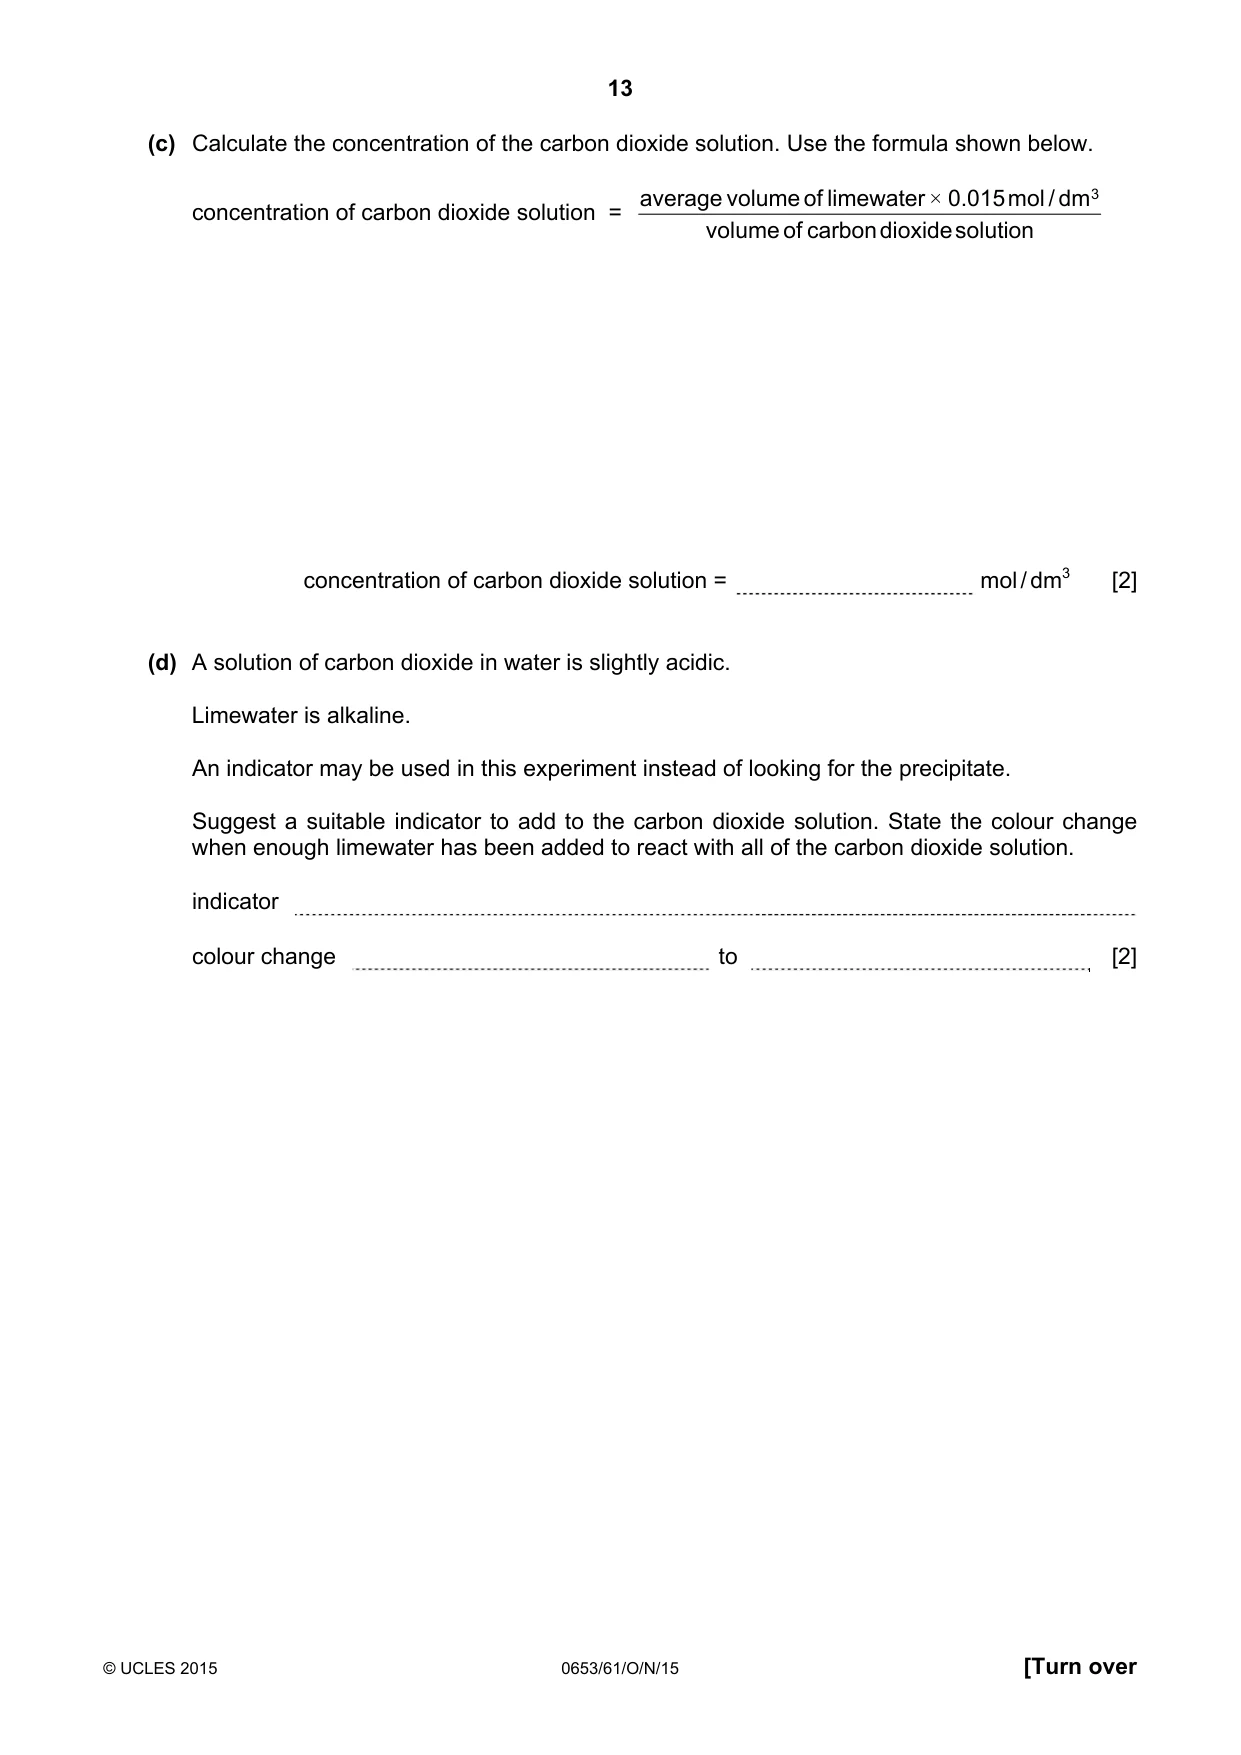
13 © UCLES 2015 0653/61/O/N/15 [Turn over (c) Calculate the concentration of the carbon dioxide solution. Use the formula shown below. concentration of carbon dioxide solution = solution dioxide carbon of volume dm / mol 0.015 limewater of volume average 3 × concentration of carbon dioxide solution = mol / dm3 [2] (d) A solution of carbon dioxide in water is slightly acidic. Limewater is alkaline. An indicator may be used in this experiment instead of looking for the precipitate. Suggest a suitable indicator to add to the carbon dioxide solution. State the colour change when enough limewater has been added to react with all of the carbon dioxide solution. indicator colour change to [2]
Question paper, page 14
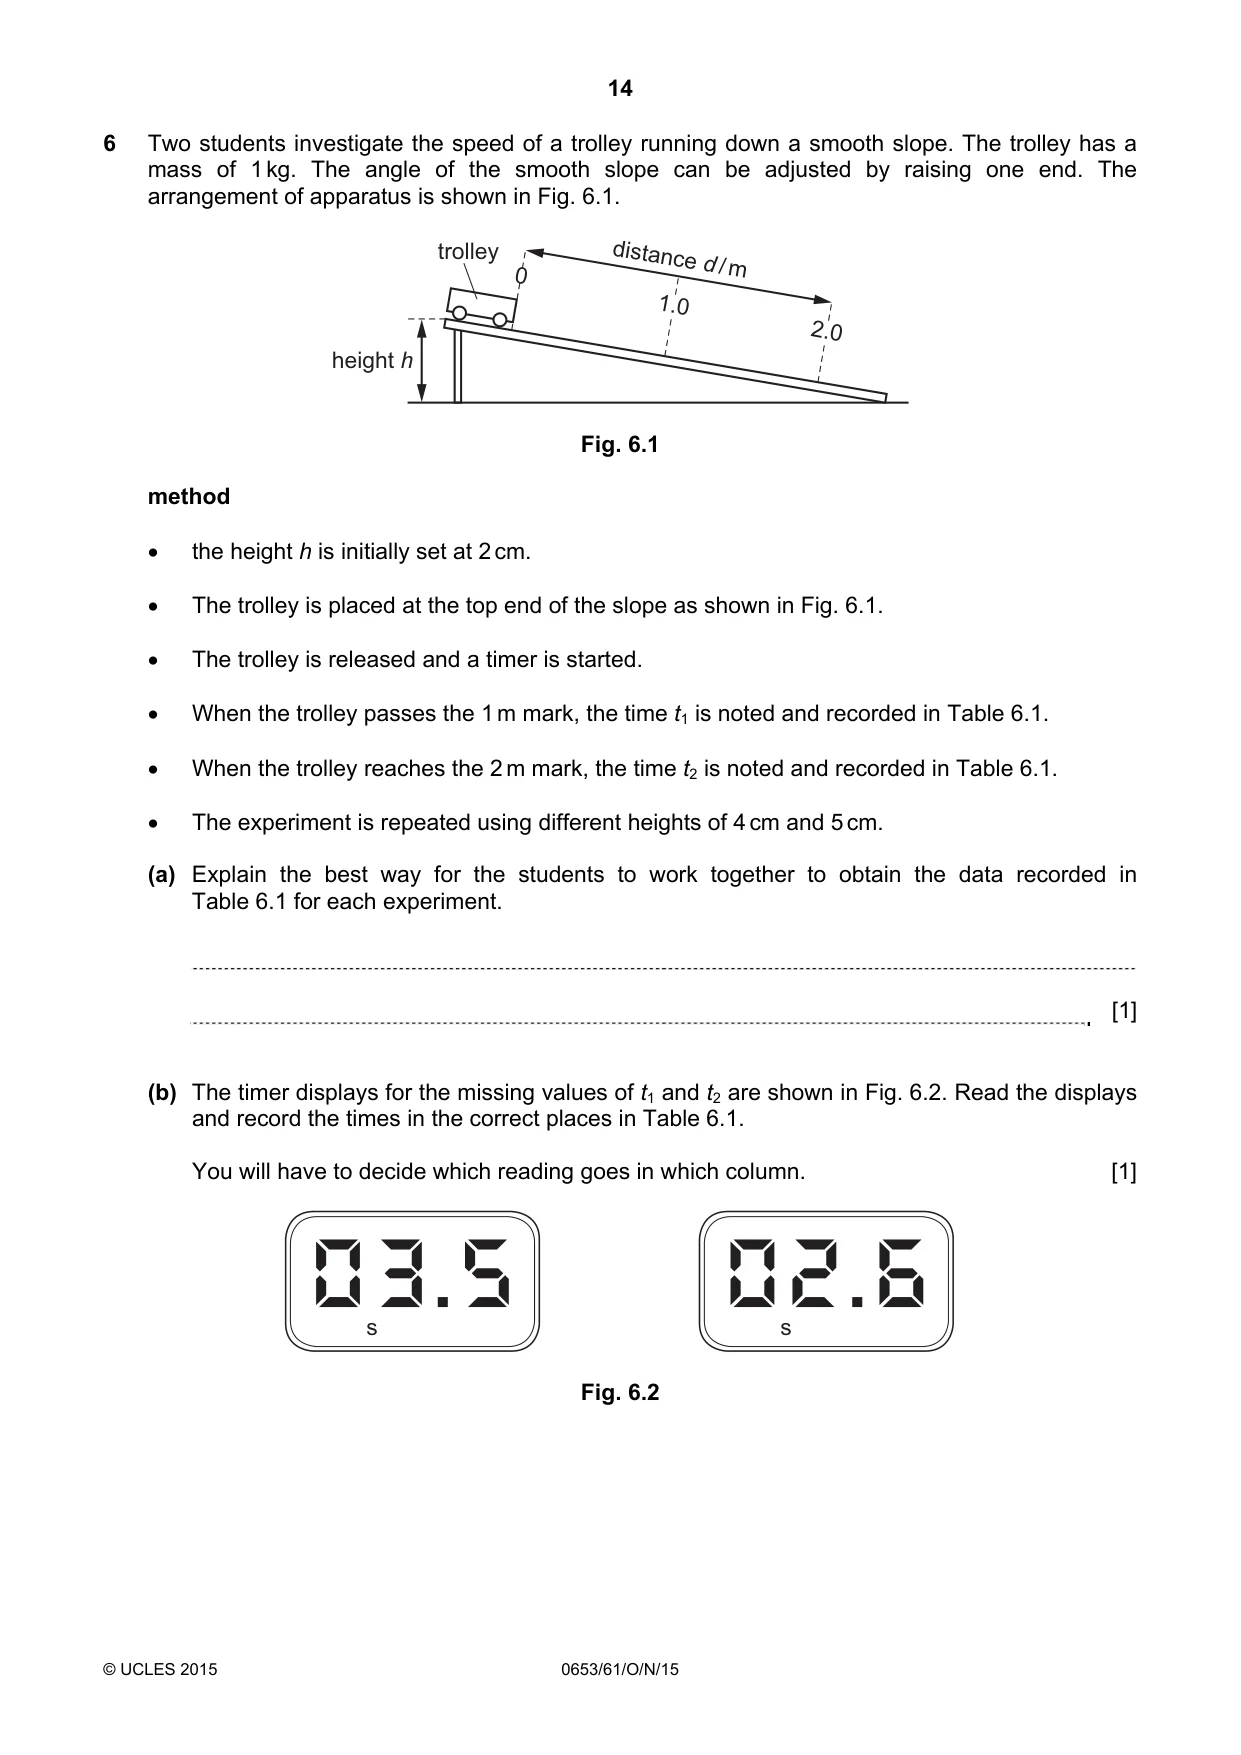
14 © UCLES 2015 0653/61/O/N/15 6 Two students investigate the speed of a trolley running down a smooth slope. The trolley has a mass of 1 kg. The angle of the smooth slope can be adjusted by raising one end. The arrangement of apparatus is shown in Fig. 6.1. height h trolley 0 1.0 2.0 distance d / m Fig. 6.1 method • the height h is initially set at 2 cm. • The trolley is placed at the top end of the slope as shown in Fig. 6.1. • The trolley is released and a timer is started. • When the trolley passes the 1 m mark, the time t1 is noted and recorded in Table 6.1. • When the trolley reaches the 2 m mark, the time t2 is noted and recorded in Table 6.1. • The experiment is repeated using different heights of 4 cm and 5 cm. (a) Explain the best way for the students to work together to obtain the data recorded in Table 6.1 for each experiment. [1] (b) The timer displays for the missing values of t1 and t2 are shown in Fig. 6.2. Read the displays and record the times in the correct places in Table 6.1. You will have to decide which reading goes in which column. [1] s s Fig. 6.2
Question paper, page 15
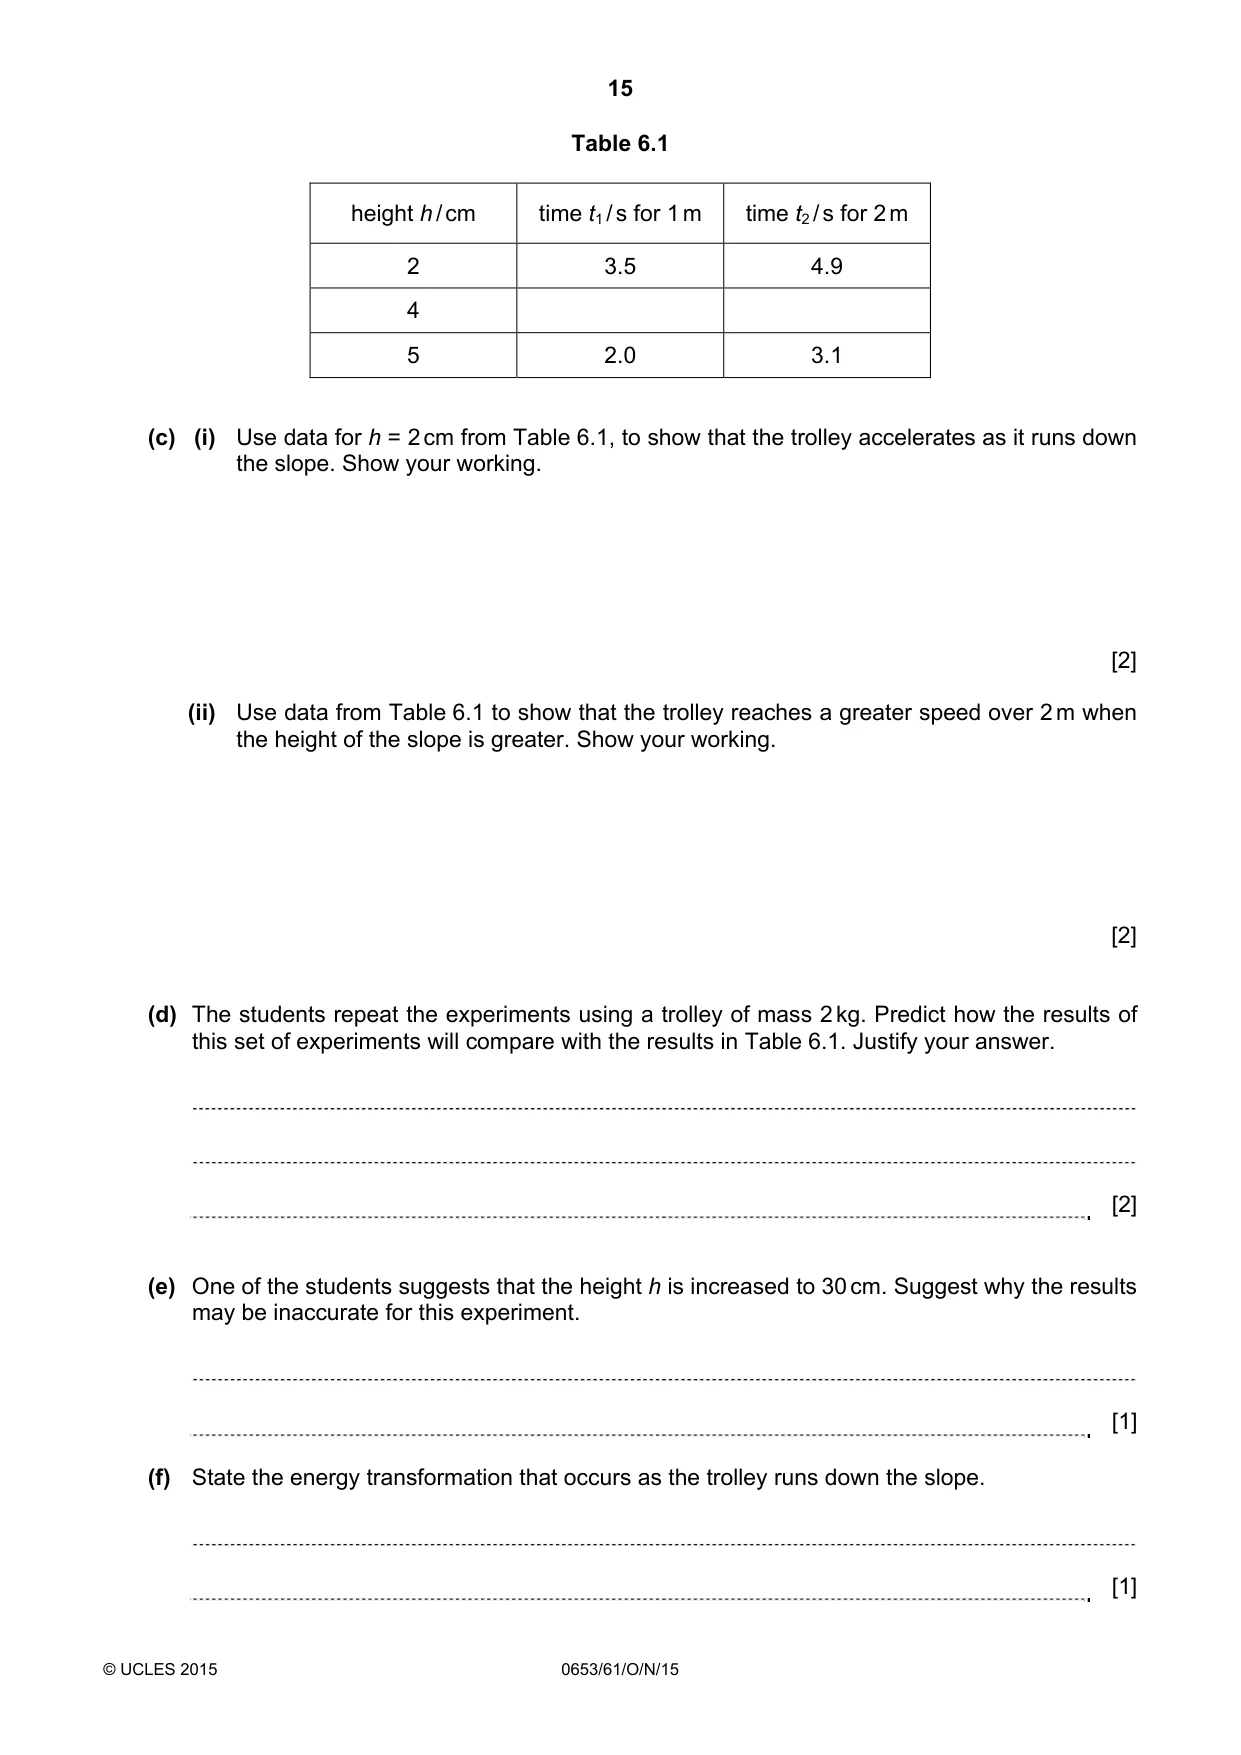
15 © UCLES 2015 0653/61/O/N/15 Table 6.1 height h / cm time t1 / s for 1 m time t2 / s for 2 m 2 3.5 4.9 4 5 2.0 3.1 (c) (i) Use data for h = 2 cm from Table 6.1, to show that the trolley accelerates as it runs down the slope. Show your working. [2] (ii) Use data from Table 6.1 to show that the trolley reaches a greater speed over 2 m when the height of the slope is greater. Show your working. [2] (d) The students repeat the experiments using a trolley of mass 2 kg. Predict how the results of this set of experiments will compare with the results in Table 6.1. Justify your answer. [2] (e) One of the students suggests that the height h is increased to 30 cm. Suggest why the results may be inaccurate for this experiment. [1] (f) State the energy transformation that occurs as the trolley runs down the slope. [1]
Question paper, page 16
16 Permission to reproduce items where third-party owned material protected by copyright is included has been sought and cleared where possible. Every reasonable effort has been made by the publisher (UCLES) to trace copyright holders, but if any items requiring clearance have unwittingly been included, the publisher will be pleased to make amends at the earliest possible opportunity. To avoid the issue of disclosure of answer-related information to candidates, all copyright acknowledgements are reproduced online in the Cambridge International Examinations Copyright Acknowledgements Booklet. This is produced for each series of examinations and is freely available to download at www.cie.org.uk after the live examination series. Cambridge International Examinations is part of the Cambridge Assessment Group. Cambridge Assessment is the brand name of University of Cambridge Local Examinations Syndicate (UCLES), which is itself a department of the University of Cambridge. © UCLES 2015 0653/61/O/N/15 BLANK PAGE
Mark scheme, page 1
® IGCSE is the registered trademark of Cambridge International Examinations. CAMBRIDGE INTERNATIONAL EXAMINATIONS Cambridge International General Certificate of Secondary Education MARK SCHEME for the October/November 2015 series 0653 COMBINED SCIENCE 0653/61 Paper 6 (Alternative to Practical), maximum raw mark 60 This mark scheme is published as an aid to teachers and candidates, to indicate the requirements of the examination. It shows the basis on which Examiners were instructed to award marks. It does not indicate the details of the discussions that took place at an Examiners’ meeting before marking began, which would have considered the acceptability of alternative answers. Mark schemes should be read in conjunction with the question paper and the Principal Examiner Report for Teachers. Cambridge will not enter into discussions about these mark schemes. Cambridge is publishing the mark schemes for the October/November 2015 series for most Cambridge IGCSE®, Cambridge International A and AS Level components and some Cambridge O Level components.
Mark scheme, page 2
Page 2 Mark Scheme Syllabus Paper Cambridge IGCSE – October/November 2015 0653 61 © Cambridge International Examinations 2015 1 (a) water (is produced / present) ; [1] (b) carbon dioxide (produced / present) ; [1] (c) control / to show that water and carbon dioxide are not present ; [1] (d) respiration ; [1] (e) heat / it gets hot ; light ; [2] (f) goggles / tie hair back / Bunsen position or safety flame ; [max 1] (g) (i) mass / amount of water ; distance to test-tube ; volume of water ; start temperature of water ; mass / amount of food ; [max 2] (ii) heat loss to air / not all energy goes to water ; incomplete burning ; [max 1] [Total: 10] 2 (a) starch ; [1] (b) (i) burette / pipette / syringe ; [1] (ii) (dropping) pipette / syringe / burette / dropper ; [1] (must be different to the answer to (b)(i)) (c) 57 ; 8 ; 4 ; [3] (d) Fe2+ (no mark if no explanation) because it caused a faster reaction / shorter time / faster ; [1]
Mark scheme, page 3
Page 3 Mark Scheme Syllabus Paper Cambridge IGCSE – October/November 2015 0653 61 © Cambridge International Examinations 2015 (e) (i) copper ; [1] (ii) copper hydroxide ; [1] (f) add 1 cm3 water ; [1] [Total: 10] 3 (a) (i) h = 8.2 (cm) ; [1] (ii) B = 4.6 (cm) ; [1] (iii) T = 6.7 (cm) ; [1] (iv) d = 4.6 + 6.7 = 11.3, 2 11.3 = 5.7 (cm) ; (allow: 5.65 or ecf) [1] (v) V1 = πd2 4 h = 3.14 × 5.72 × 4 8.2 = 209 or 209.2 (cm3) ; [1] (b) (i) 55 (cm3) ; [1] (ii) V2 = 250 – 55 = 195 (cm3) ; [1] (c) the student cannot tell when the cup is ‘full’ of water / owtte ; measuring cylinder / scale is not accurate / to 1 cm3 ; air bubbles in the water ; warmer / colder affecting density ; [max 2] (d) subtract the masses AND gives volume ; [1] (allow: subtract masses and divide by the density) [Total: 10] 4 (a) water ; oxygen ; suitable temperature / warmth ; [max 2] (b) (all must extend the line) dish A: seedling is straight / towards light ; dish B: seedling is curved to the left ; dish C: seedling is straight ; [3] (c) phototropism ; [1]
Mark scheme, page 4
Page 4 Mark Scheme Syllabus Paper Cambridge IGCSE – October/November 2015 0653 61 © Cambridge International Examinations 2015 (d) Benedict’s (and heat) ; red / orange / yellow / green (from blue) ; [2] (e) demonstrates repeatability / reliability ; not all germinate / AW ; [2] [Total: 10] 5 (a) tube dips into water, in suitable vessel ; [1] (b) (i) (first signs of the) whiteness or milkiness ; [1] (ii) 6.4 (cm3) ; 7.7 (cm3) ; 7.0 (cm3) ; [3] (iii) 7(.0) or 7.03 (cm3) ; [1] (c) 7.03 × 25 0.015 or 7 × 25 0.015 or 0.004218 ; 0.004(2) (mol / dm3) ; [2] (d) litmus ; red to blue ; OR universal indicator ; orange / yellow to green / blue / purple ; (allow other suitable indicator and result ;;) [max 2] [Total: 10] 6 (a) one student times the 1-metre run and the other times the 2-metre run ; OR one student releases and the other times at 1 m and 2 m ; [max 1] (b) 2.6 (s) AND 3.5 (s) recorded in correct place ; [1]
Mark scheme, page 5
Page 5 Mark Scheme Syllabus Paper Cambridge IGCSE – October/November 2015 0653 61 © Cambridge International Examinations 2015 (c) (i) 3.5 1 = 0.29 (m / s) ; 4.9 2 = 0.41 (m / s) or 1.4 1 = 0.71 (m / s) (so must have accelerated) ; OR same distance (1 m) ; in less time quoting 1.4 s ; OR correct calculation of acceleration ;; [max 2] (ii) height = 2 cm. average speed = 0.41 (m / s) ; height = 4 cm, average speed = 0.57 (m / s) ; height = 5 cm, average speed = 0.65 (m / s) ; [max 2] (d) since acceleration due to gravity is independent of mass ; the results will be the same ; OR more friction ; slower ; [max2] (e) (speeds too great) difficult to measure time / reaction time now significant ; [1] (f) (gravitational) potential energy to kinetic energy ; [1] [Total: 10]
What you needed in this session
Cambridge’s own grade thresholds for 2015 Oct/Nov, Paper 6 · Variant 1. A higher threshold means an easier paper — the bar moves with how the cohort did.