Cambridge IGCSE Science - Combined 0653 — 2014 Oct/Nov Paper 6 · Variant 3
0653/63/O/N/14 · 60 marks · ≈68 min
The question paper and its mark scheme, free to read here and free to download. This is Cambridge’s own paper, exactly as it was sat.
Question paper20 pages


Mark scheme5 pages
Answers below. Sit the paper first if you are practising.
Paper as text
Question paper, page 1
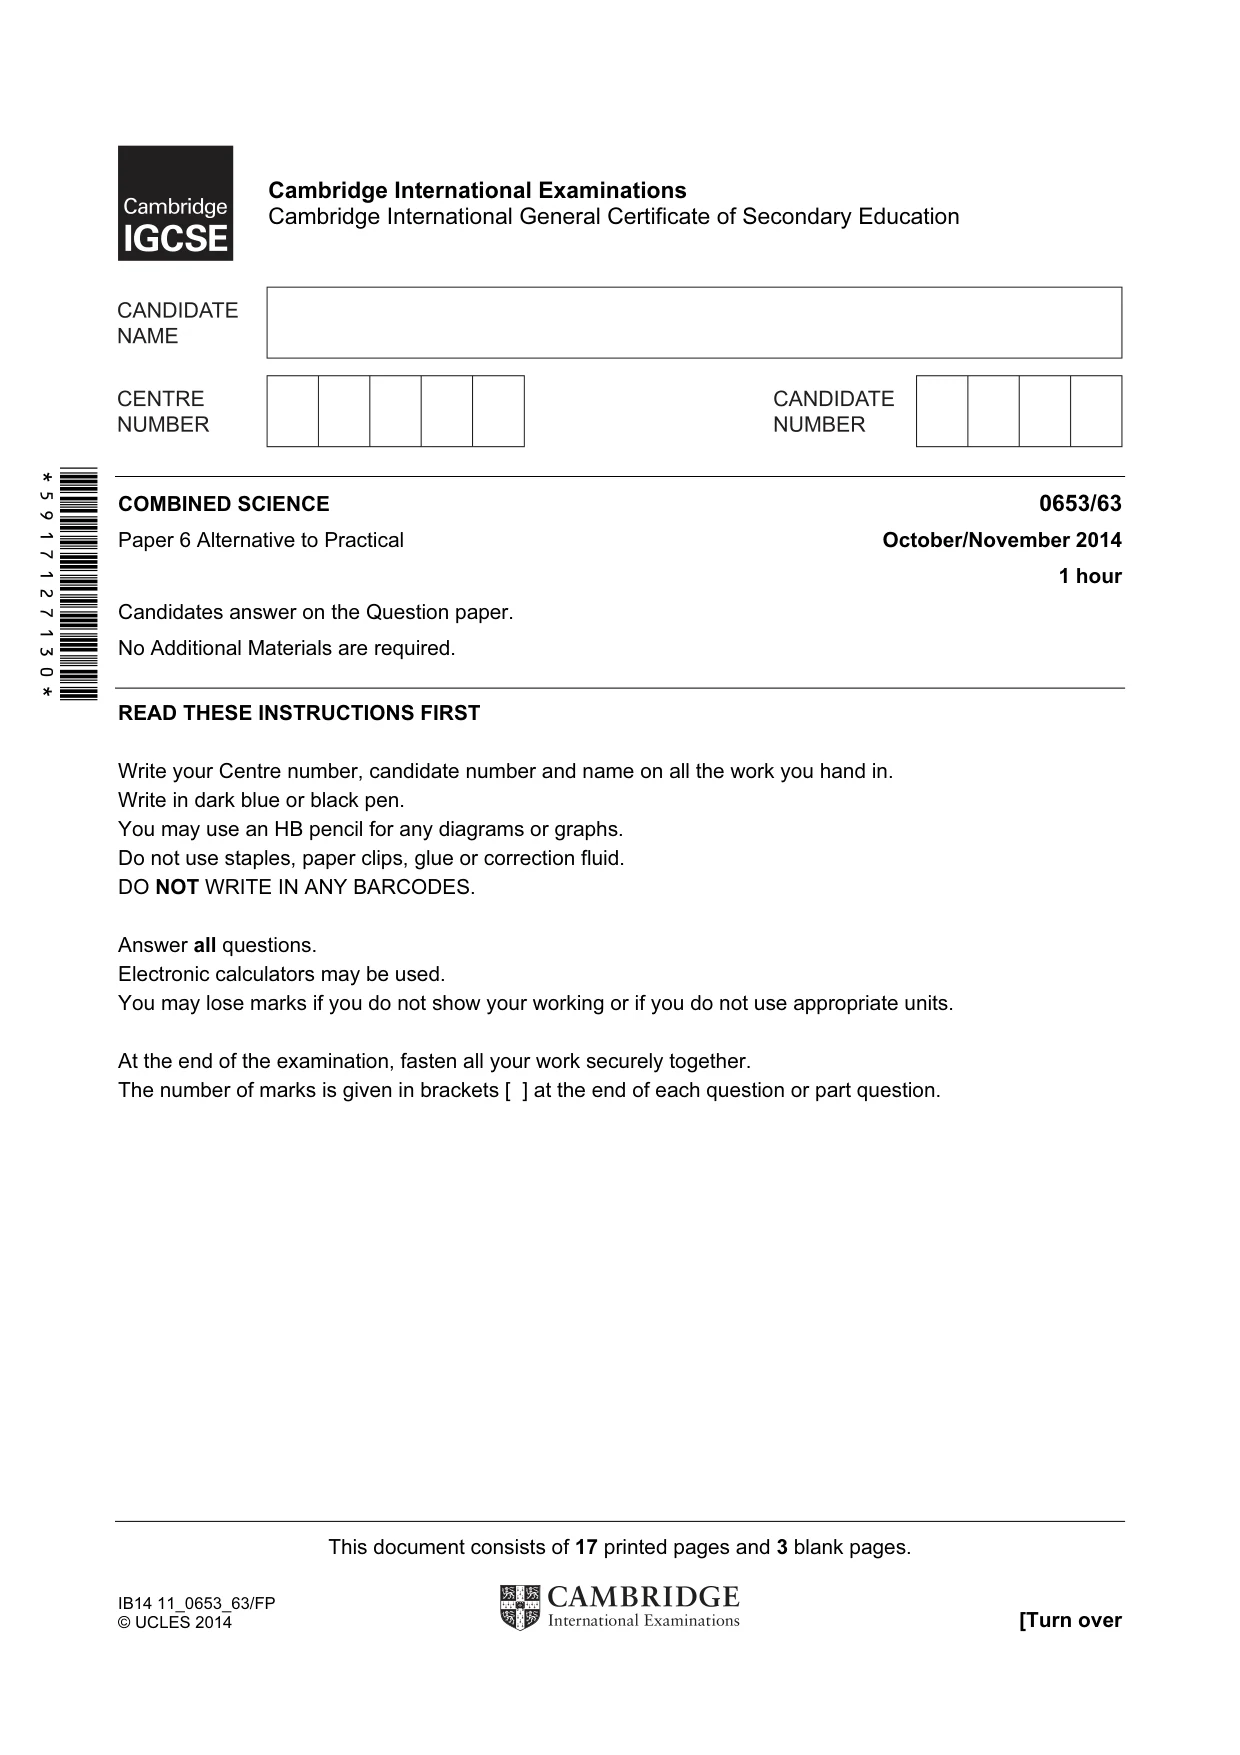
This document consists of 17 printed pages and 3 blank pages. IB14 11_0653_63/FP © UCLES 2014 [Turn over *5917127130* Cambridge International Examinations Cambridge International General Certificate of Secondary Education COMBINED SCIENCE 0653/63 Paper 6 Alternative to Practical October/November 2014 1 hour Candidates answer on the Question paper. No Additional Materials are required. READ THESE INSTRUCTIONS FIRST Write your Centre number, candidate number and name on all the work you hand in. Write in dark blue or black pen. You may use an HB pencil for any diagrams or graphs. Do not use staples, paper clips, glue or correction fluid. DO NOT WRITE IN ANY BARCODES. Answer all questions. Electronic calculators may be used. You may lose marks if you do not show your working or if you do not use appropriate units. At the end of the examination, fasten all your work securely together. The number of marks is given in brackets [ ] at the end of each question or part question.
Question paper, page 2
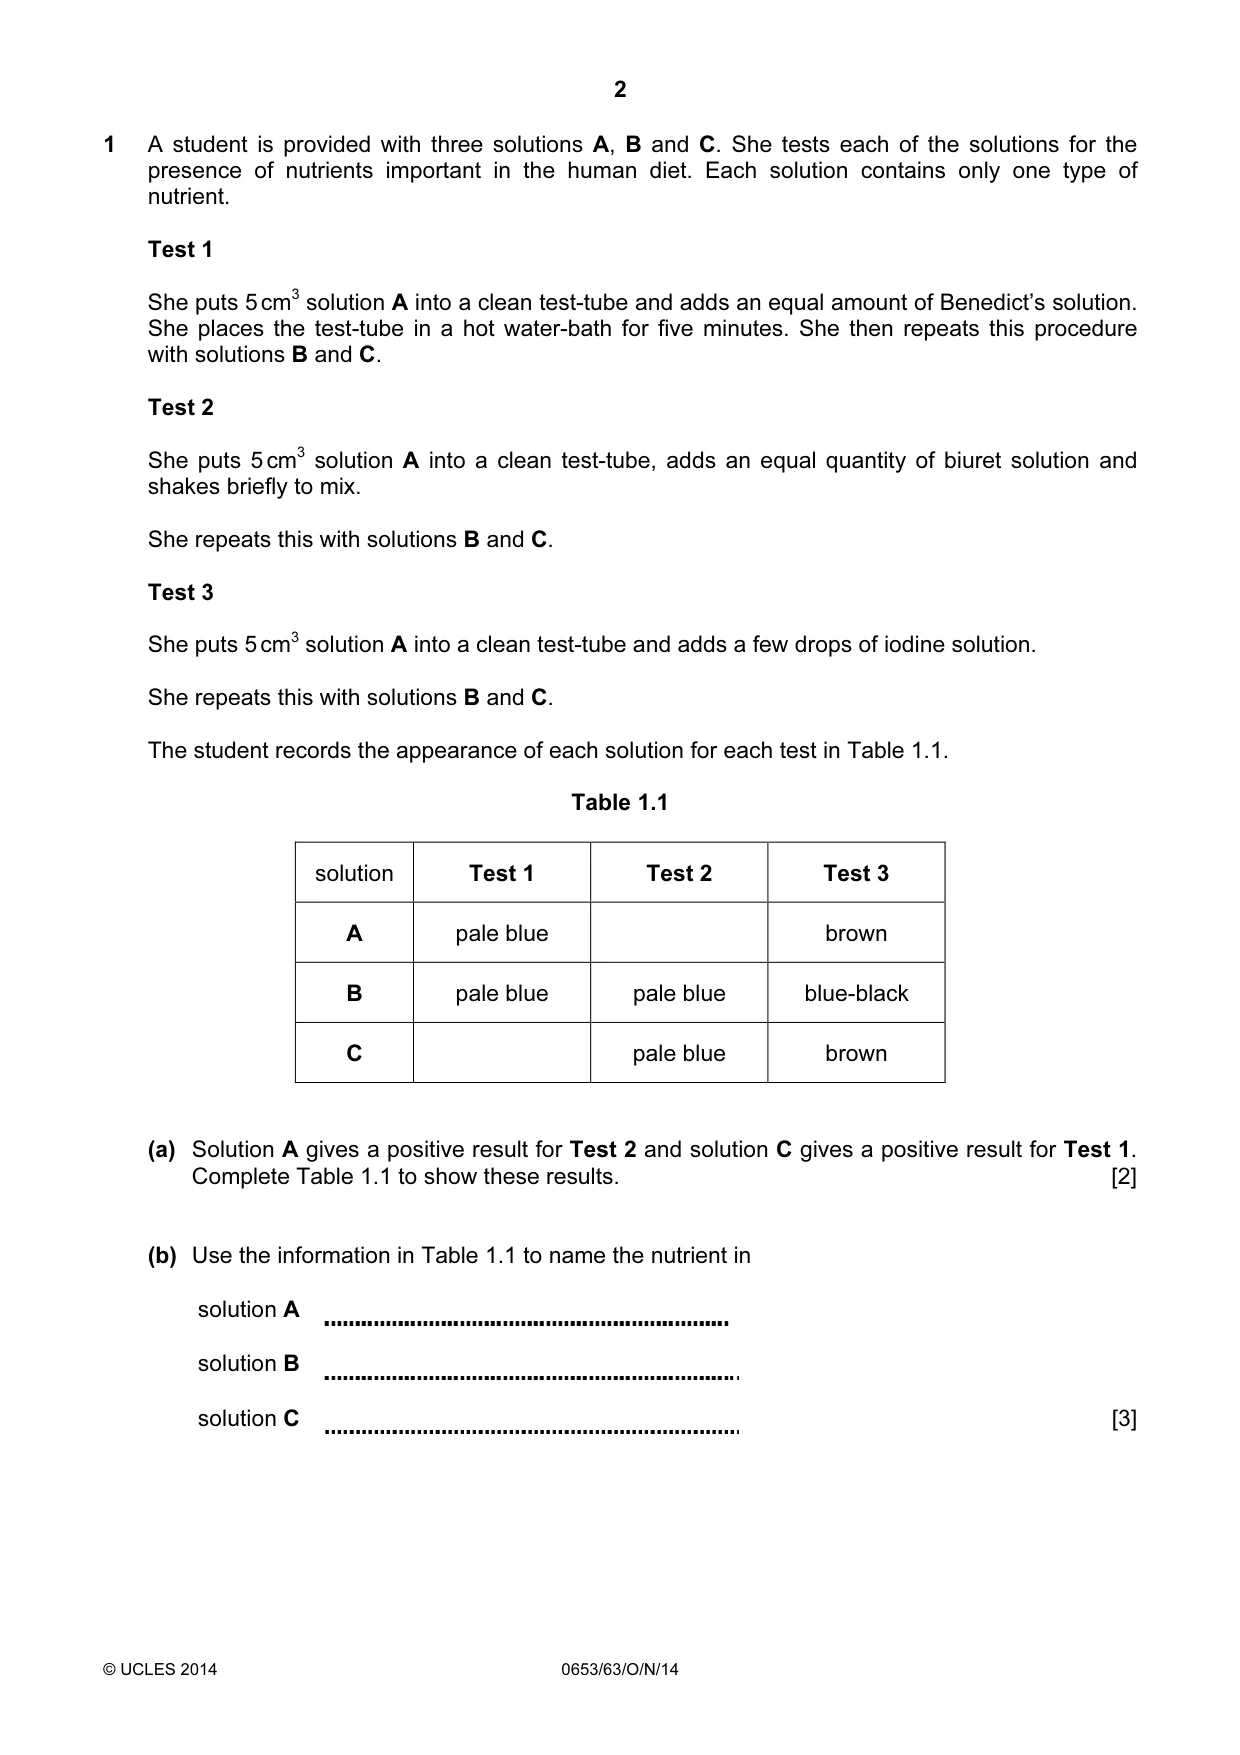
2 © UCLES 2014 0653/63/O/N/14 1 A student is provided with three solutions A, B and C. She tests each of the solutions for the presence of nutrients important in the human diet. Each solution contains only one type of nutrient. Test 1 She puts 5 cm3 solution A into a clean test-tube and adds an equal amount of Benedict’s solution. She places the test-tube in a hot water-bath for five minutes. She then repeats this procedure with solutions B and C. Test 2 She puts 5 cm3 solution A into a clean test-tube, adds an equal quantity of biuret solution and shakes briefly to mix. She repeats this with solutions B and C. Test 3 She puts 5 cm3 solution A into a clean test-tube and adds a few drops of iodine solution. She repeats this with solutions B and C. The student records the appearance of each solution for each test in Table 1.1. Table 1.1 solution Test 1 Test 2 Test 3 A pale blue brown B pale blue pale blue blue-black C pale blue brown (a) Solution A gives a positive result for Test 2 and solution C gives a positive result for Test 1. Complete Table 1.1 to show these results. [2] (b) Use the information in Table 1.1 to name the nutrient in solution A solution B solution C [3]
Question paper, page 3
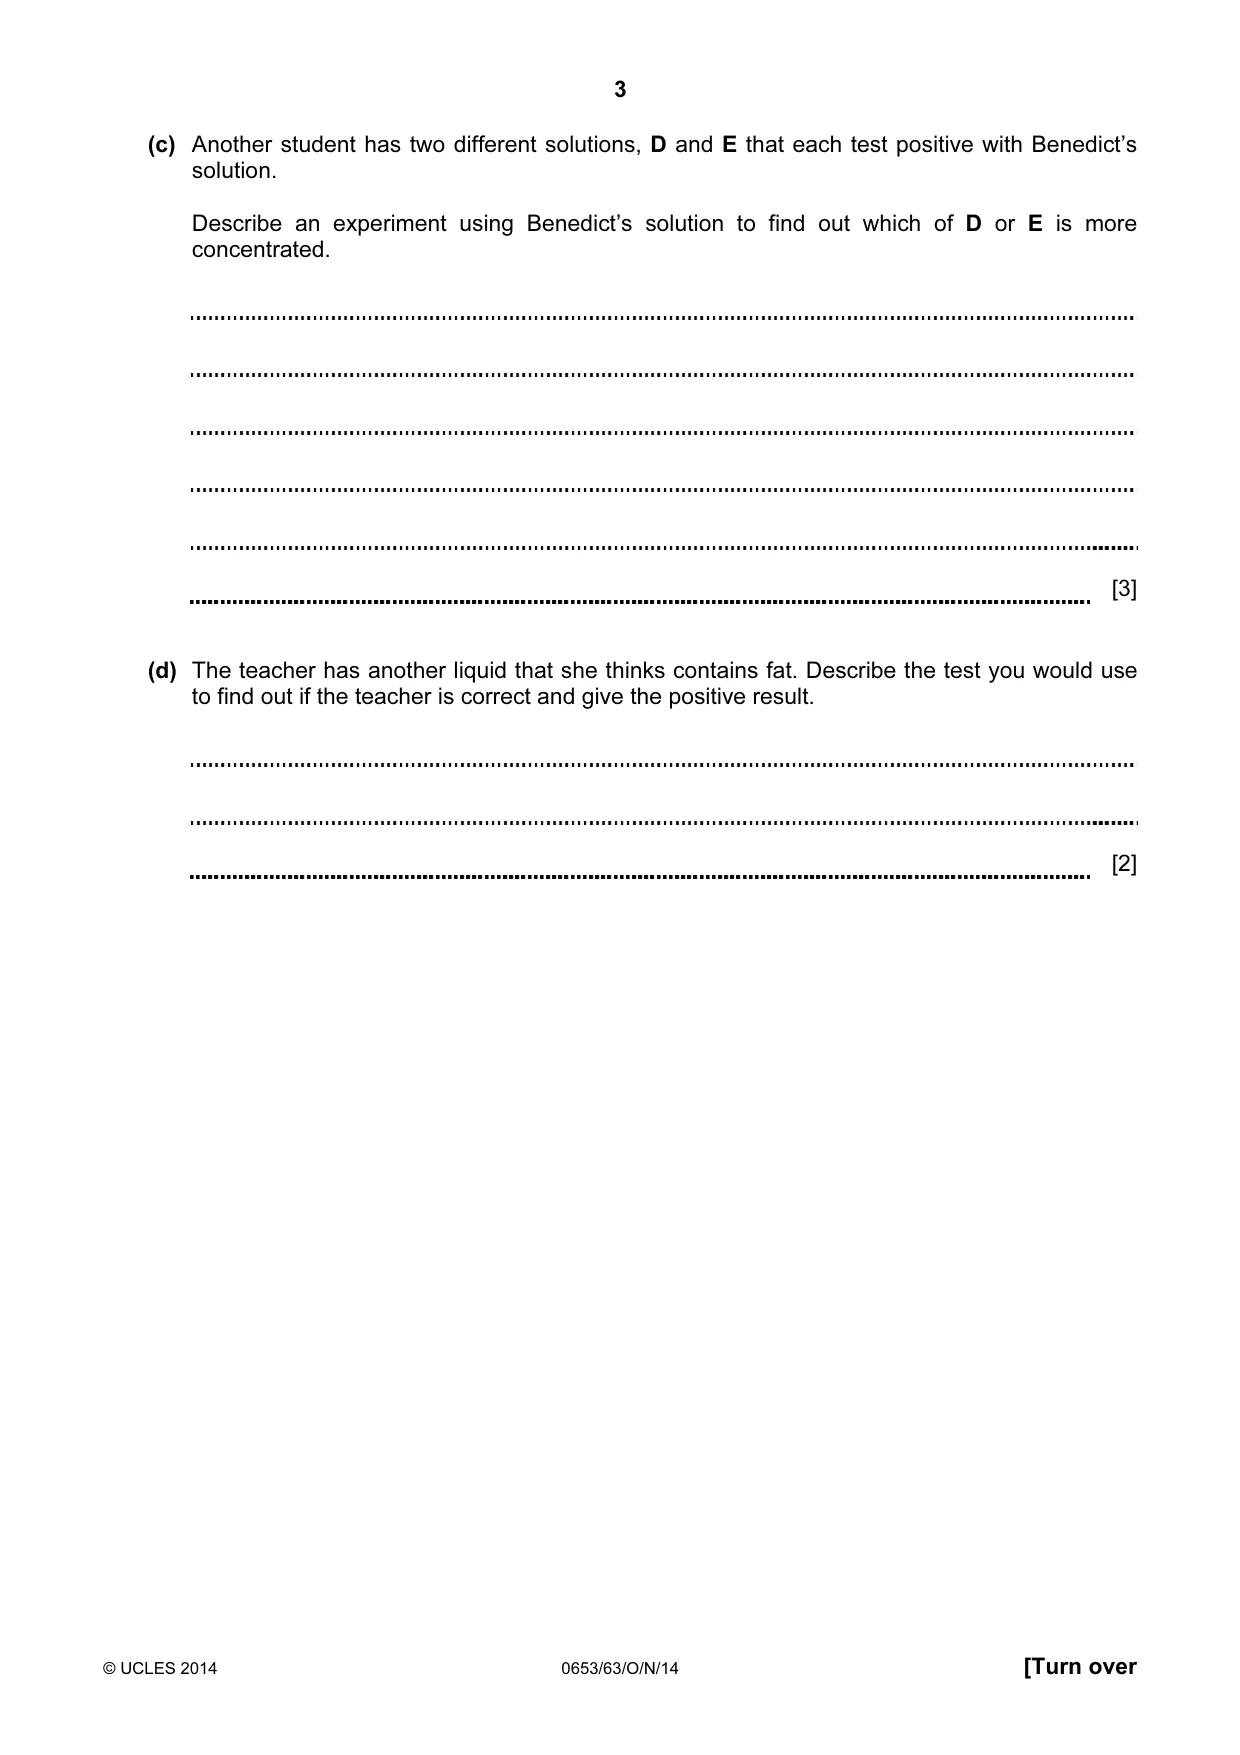
3 © UCLES 2014 0653/63/O/N/14 [Turn over (c) Another student has two different solutions, D and E that each test positive with Benedict’s solution. Describe an experiment using Benedict’s solution to find out which of D or E is more concentrated. [3] (d) The teacher has another liquid that she thinks contains fat. Describe the test you would use to find out if the teacher is correct and give the positive result. [2]
Question paper, page 4
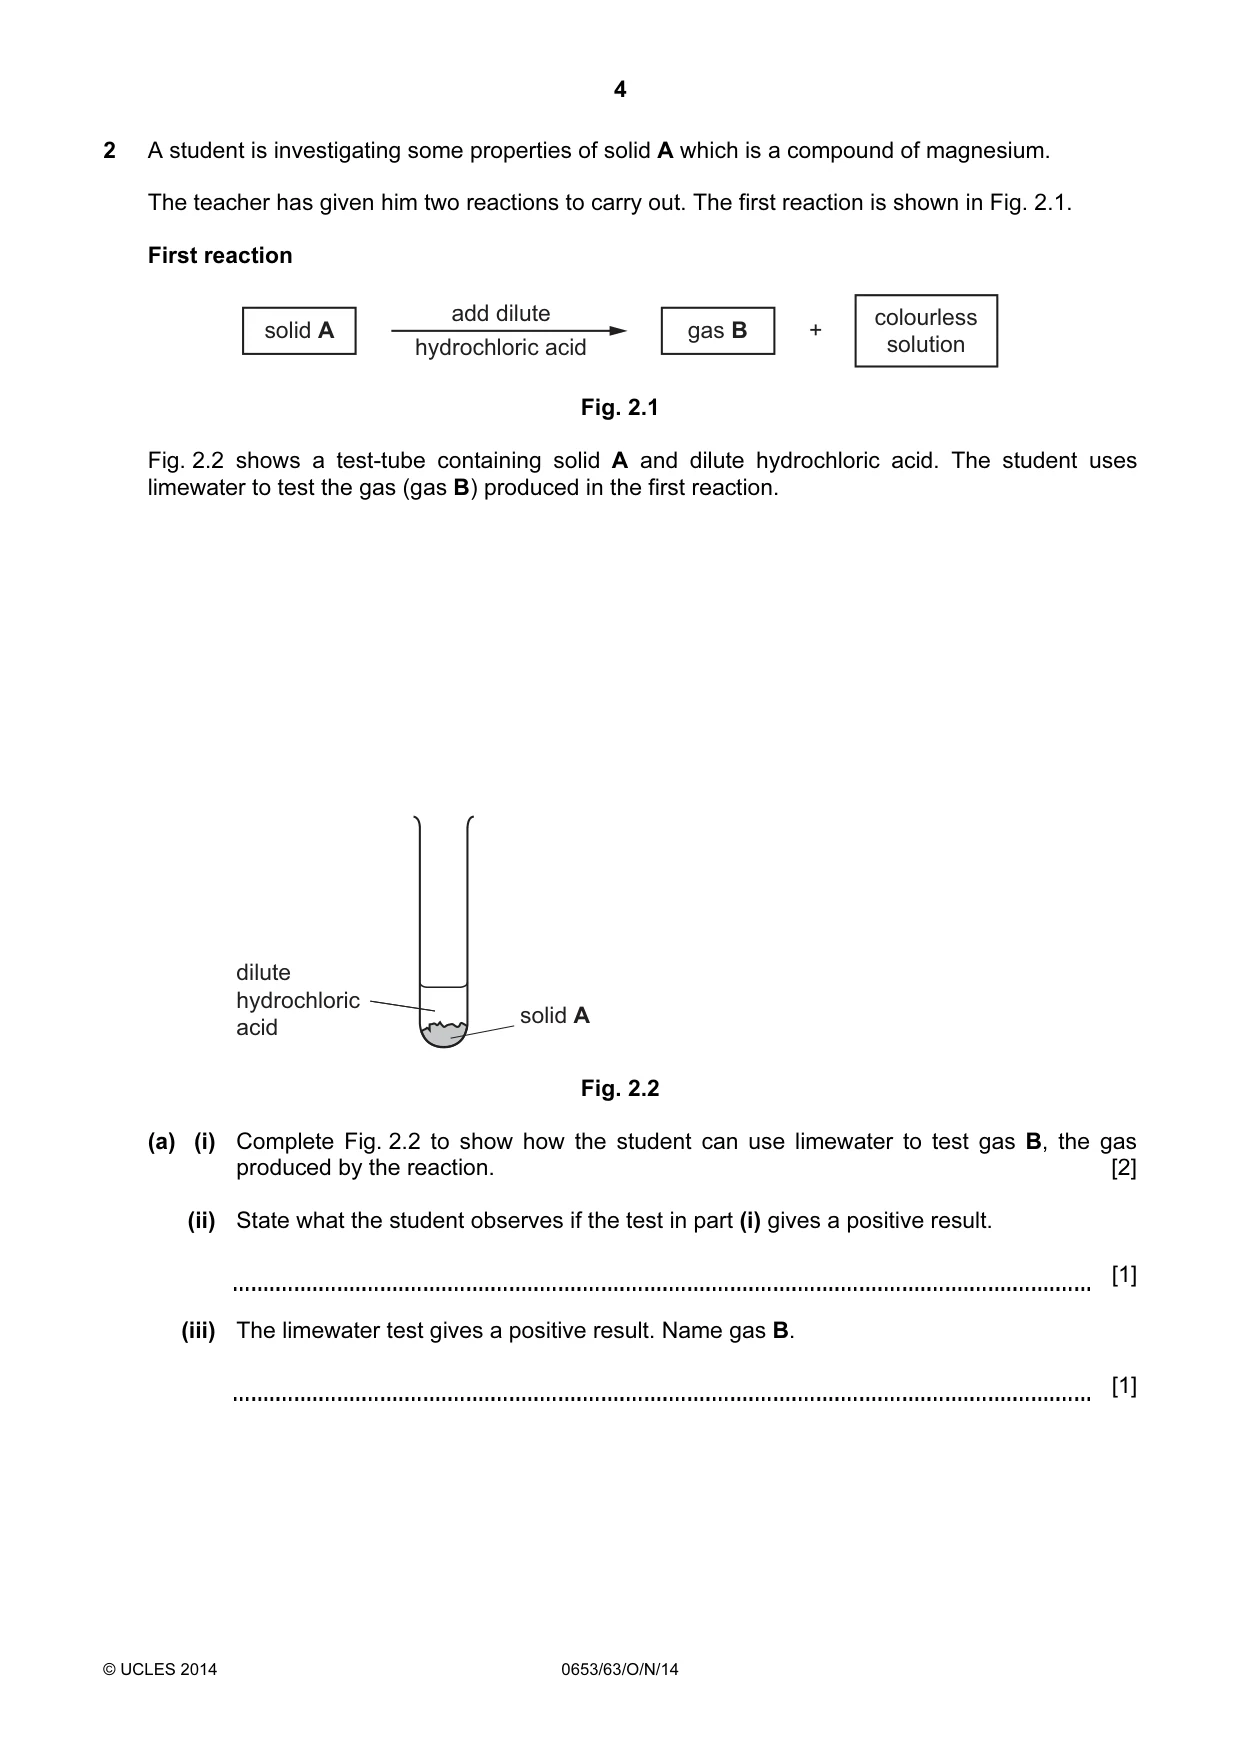
4 © UCLES 2014 0653/63/O/N/14 2 A student is investigating some properties of solid A which is a compound of magnesium. The teacher has given him two reactions to carry out. The first reaction is shown in Fig. 2.1. First reaction solid A gas B + colourless solution add dilute hydrochloric acid Fig. 2.1 Fig. 2.2 shows a test-tube containing solid A and dilute hydrochloric acid. The student uses limewater to test the gas (gas B) produced in the first reaction. dilute hydrochloric acid solid A Fig. 2.2 (a) (i) Complete Fig. 2.2 to show how the student can use limewater to test gas B, the gas produced by the reaction. [2] (ii) State what the student observes if the test in part (i) gives a positive result. [1] (iii) The limewater test gives a positive result. Name gas B. [1]
Question paper, page 5
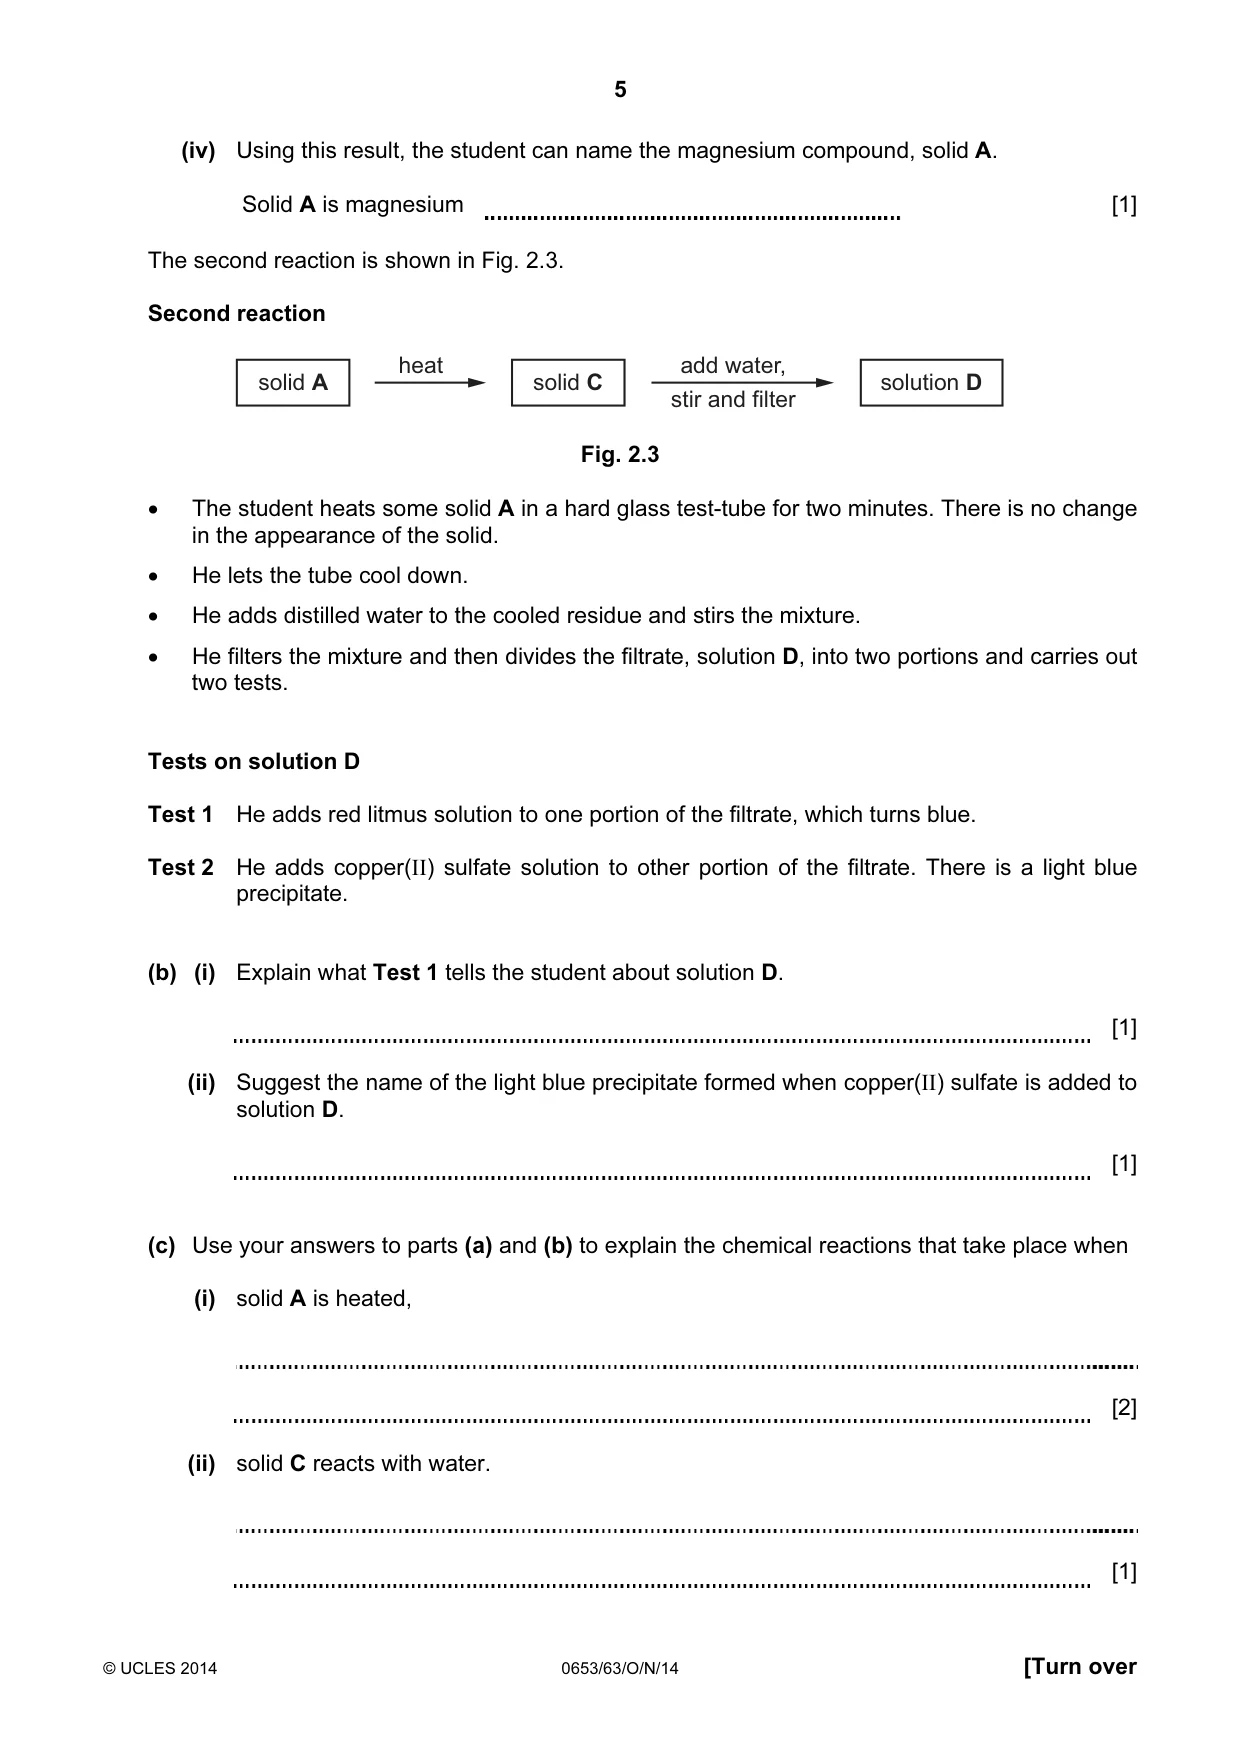
5 © UCLES 2014 0653/63/O/N/14 [Turn over (iv) Using this result, the student can name the magnesium compound, solid A. Solid A is magnesium [1] The second reaction is shown in Fig. 2.3. Second reaction solid A solid C heat solution D add water, stir and filter Fig. 2.3 • The student heats some solid A in a hard glass test-tube for two minutes. There is no change in the appearance of the solid. • He lets the tube cool down. • He adds distilled water to the cooled residue and stirs the mixture. • He filters the mixture and then divides the filtrate, solution D, into two portions and carries out two tests. Tests on solution D Test 1 He adds red litmus solution to one portion of the filtrate, which turns blue. Test 2 He adds copper(II) sulfate solution to other portion of the filtrate. There is a light blue precipitate. (b) (i) Explain what Test 1 tells the student about solution D. [1] (ii) Suggest the name of the light blue precipitate formed when copper(II) sulfate is added to solution D. [1] (c) Use your answers to parts (a) and (b) to explain the chemical reactions that take place when (i) solid A is heated, [2] (ii) solid C reacts with water. [1]
Question paper, page 6
6 © UCLES 2014 0653/63/O/N/14 BLANK PAGE
Question paper, page 7
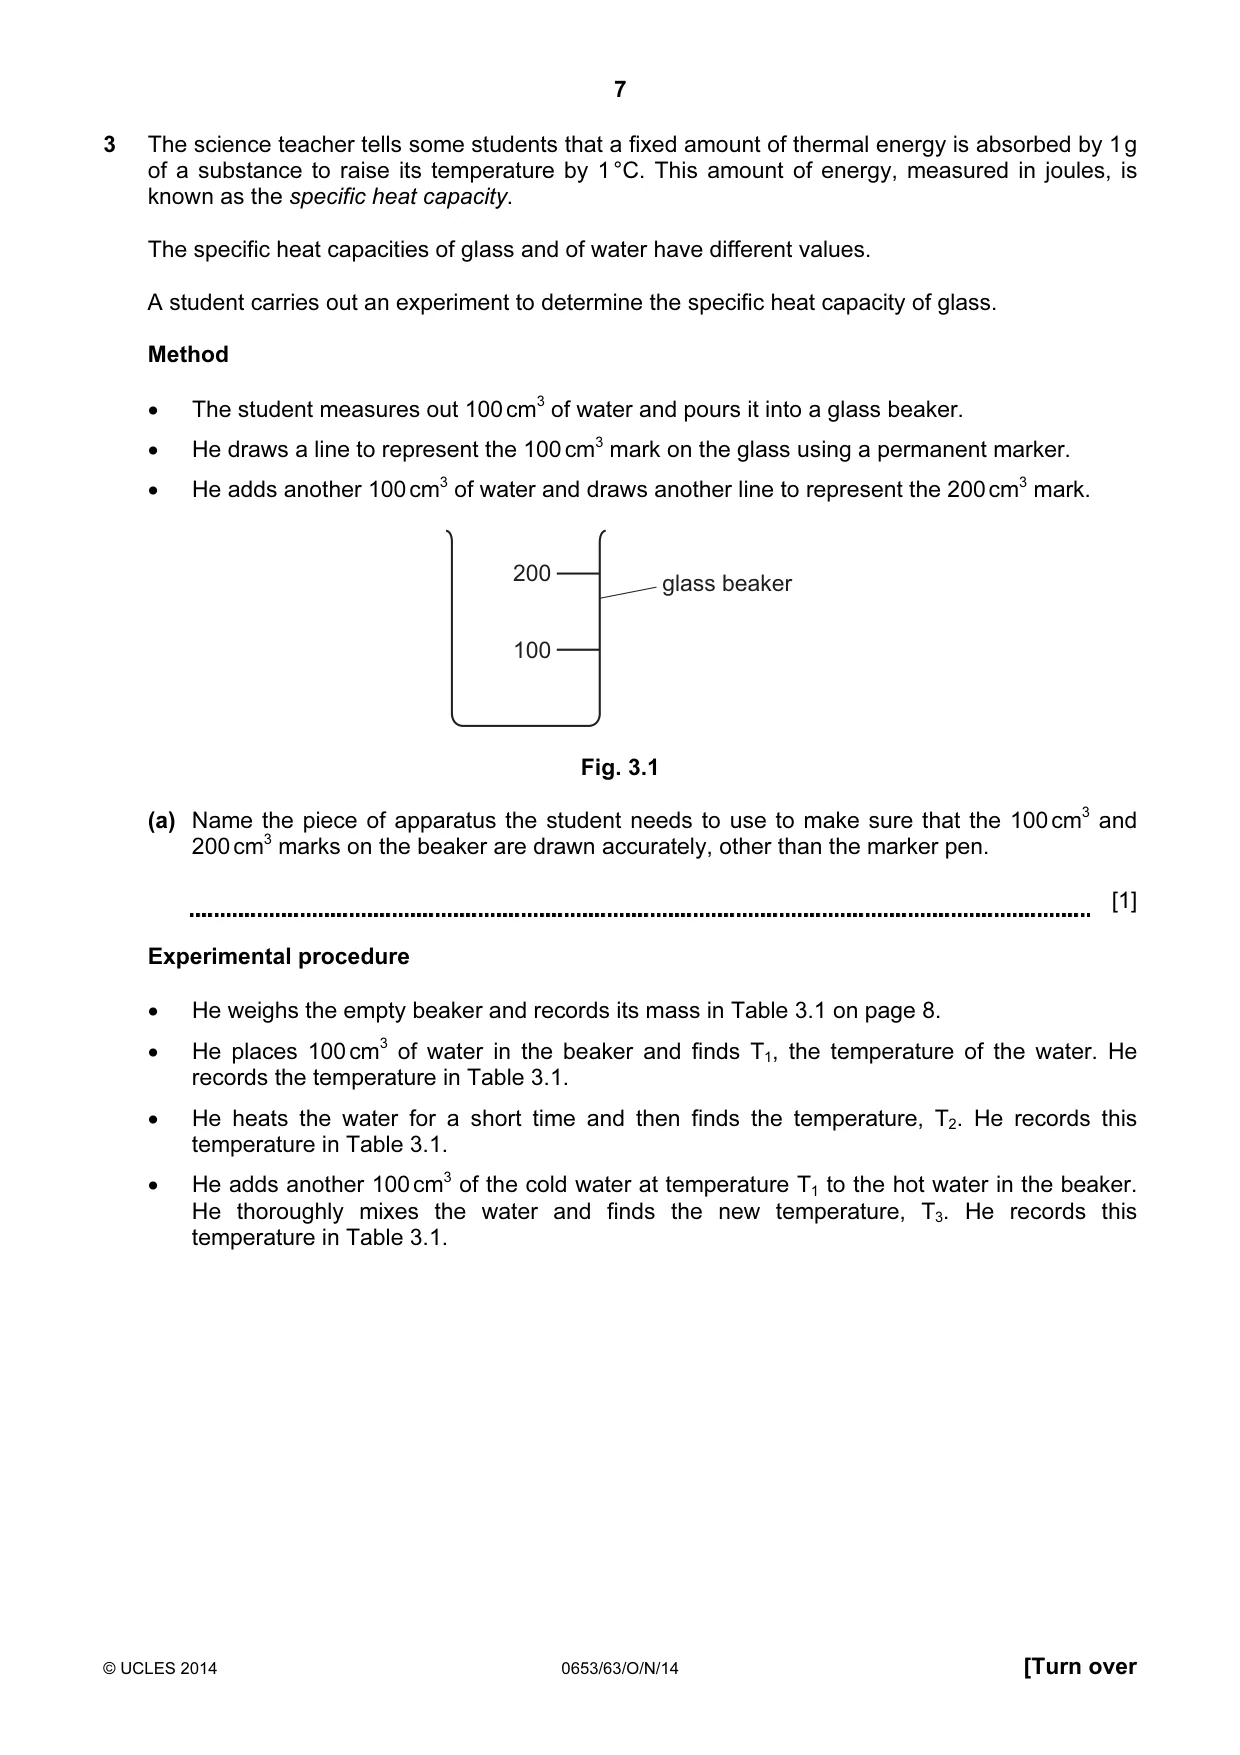
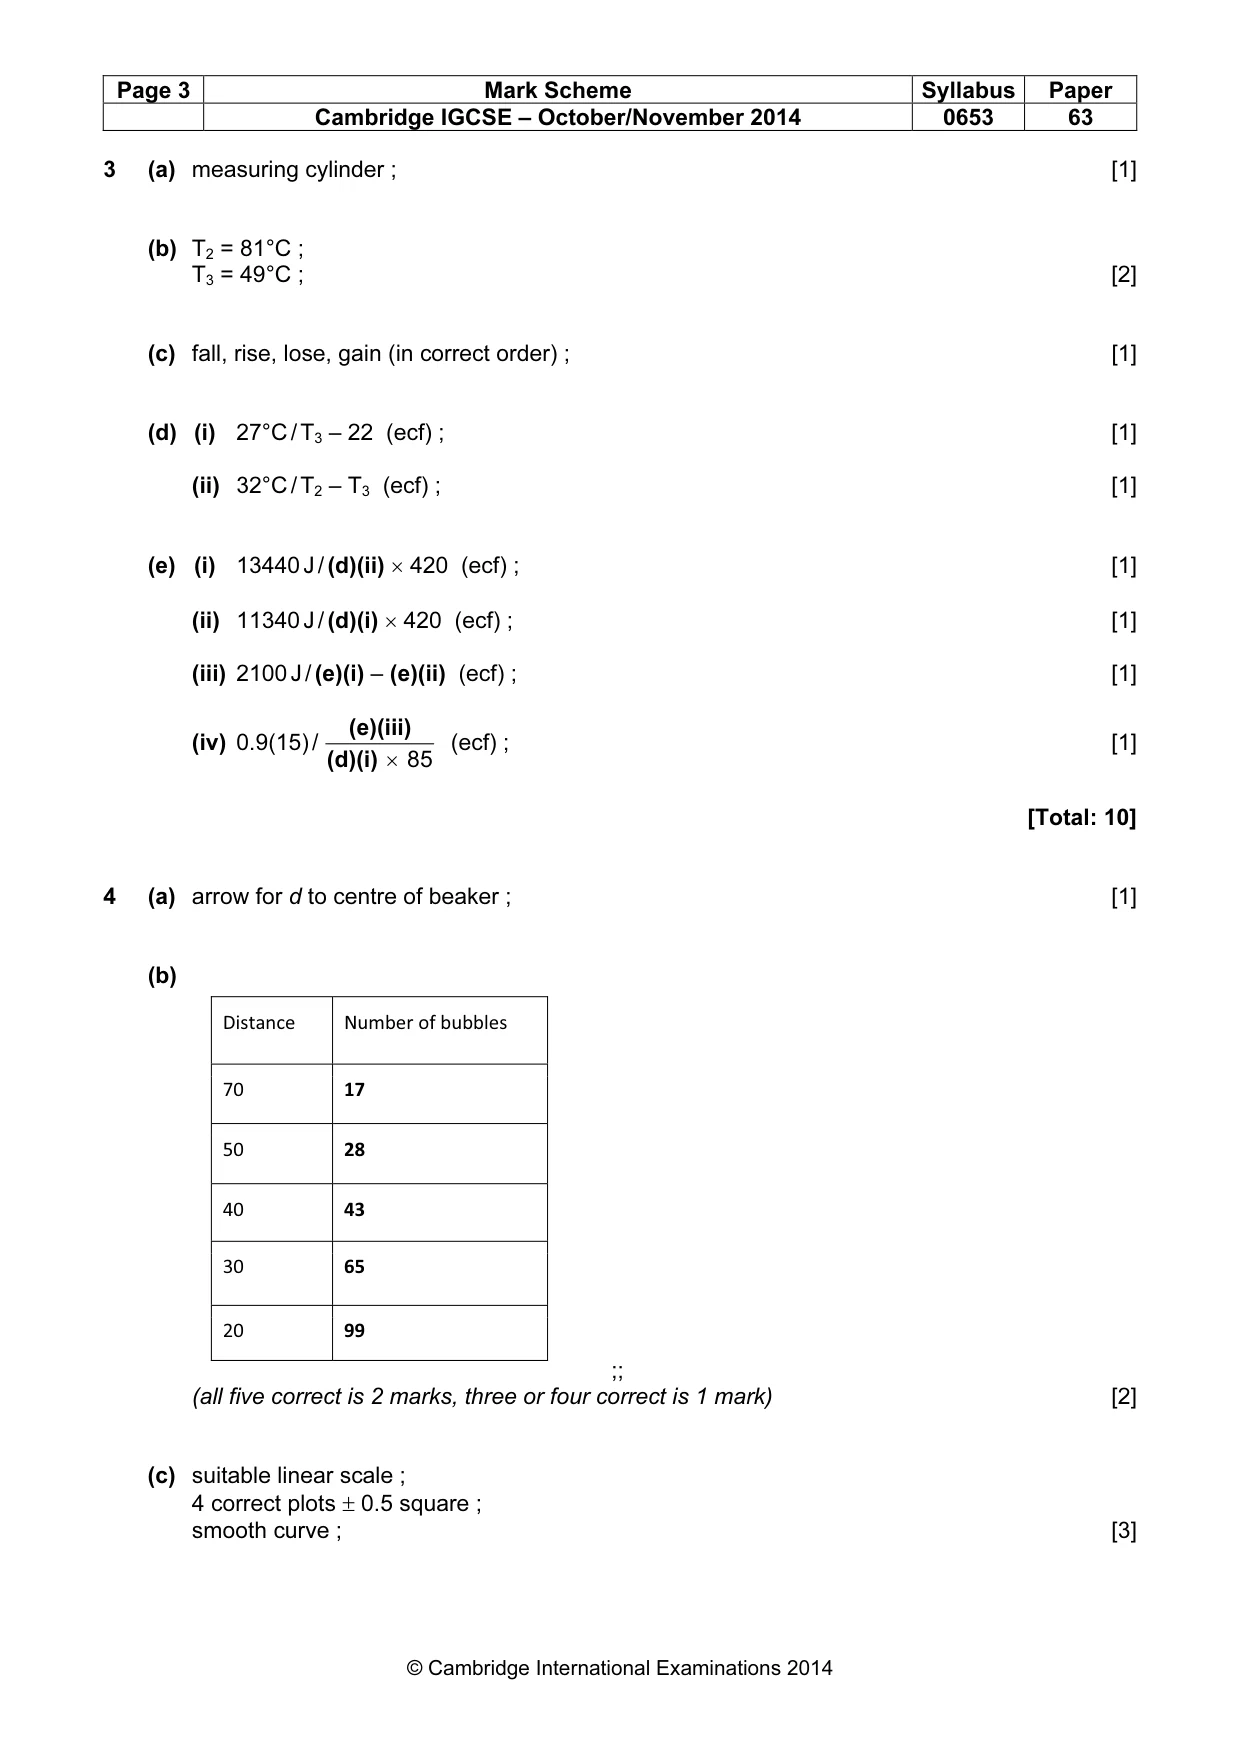
7 © UCLES 2014 0653/63/O/N/14 [Turn over 3 The science teacher tells some students that a fixed amount of thermal energy is absorbed by 1 g of a substance to raise its temperature by 1 °C. This amount of energy, measured in joules, is known as the specific heat capacity. The specific heat capacities of glass and of water have different values. A student carries out an experiment to determine the specific heat capacity of glass. Method • The student measures out 100 cm3 of water and pours it into a glass beaker. • He draws a line to represent the 100 cm3 mark on the glass using a permanent marker. • He adds another 100 cm3 of water and draws another line to represent the 200 cm3 mark. 200 100 glass beaker Fig. 3.1 (a) Name the piece of apparatus the student needs to use to make sure that the 100 cm3 and 200 cm3 marks on the beaker are drawn accurately, other than the marker pen. [1] Experimental procedure • He weighs the empty beaker and records its mass in Table 3.1 on page 8. • He places 100 cm3 of water in the beaker and finds T1, the temperature of the water. He records the temperature in Table 3.1. • He heats the water for a short time and then finds the temperature, T2. He records this temperature in Table 3.1. • He adds another 100 cm3 of the cold water at temperature T1 to the hot water in the beaker. He thoroughly mixes the water and finds the new temperature, T3. He records this temperature in Table 3.1.
Question paper, page 8
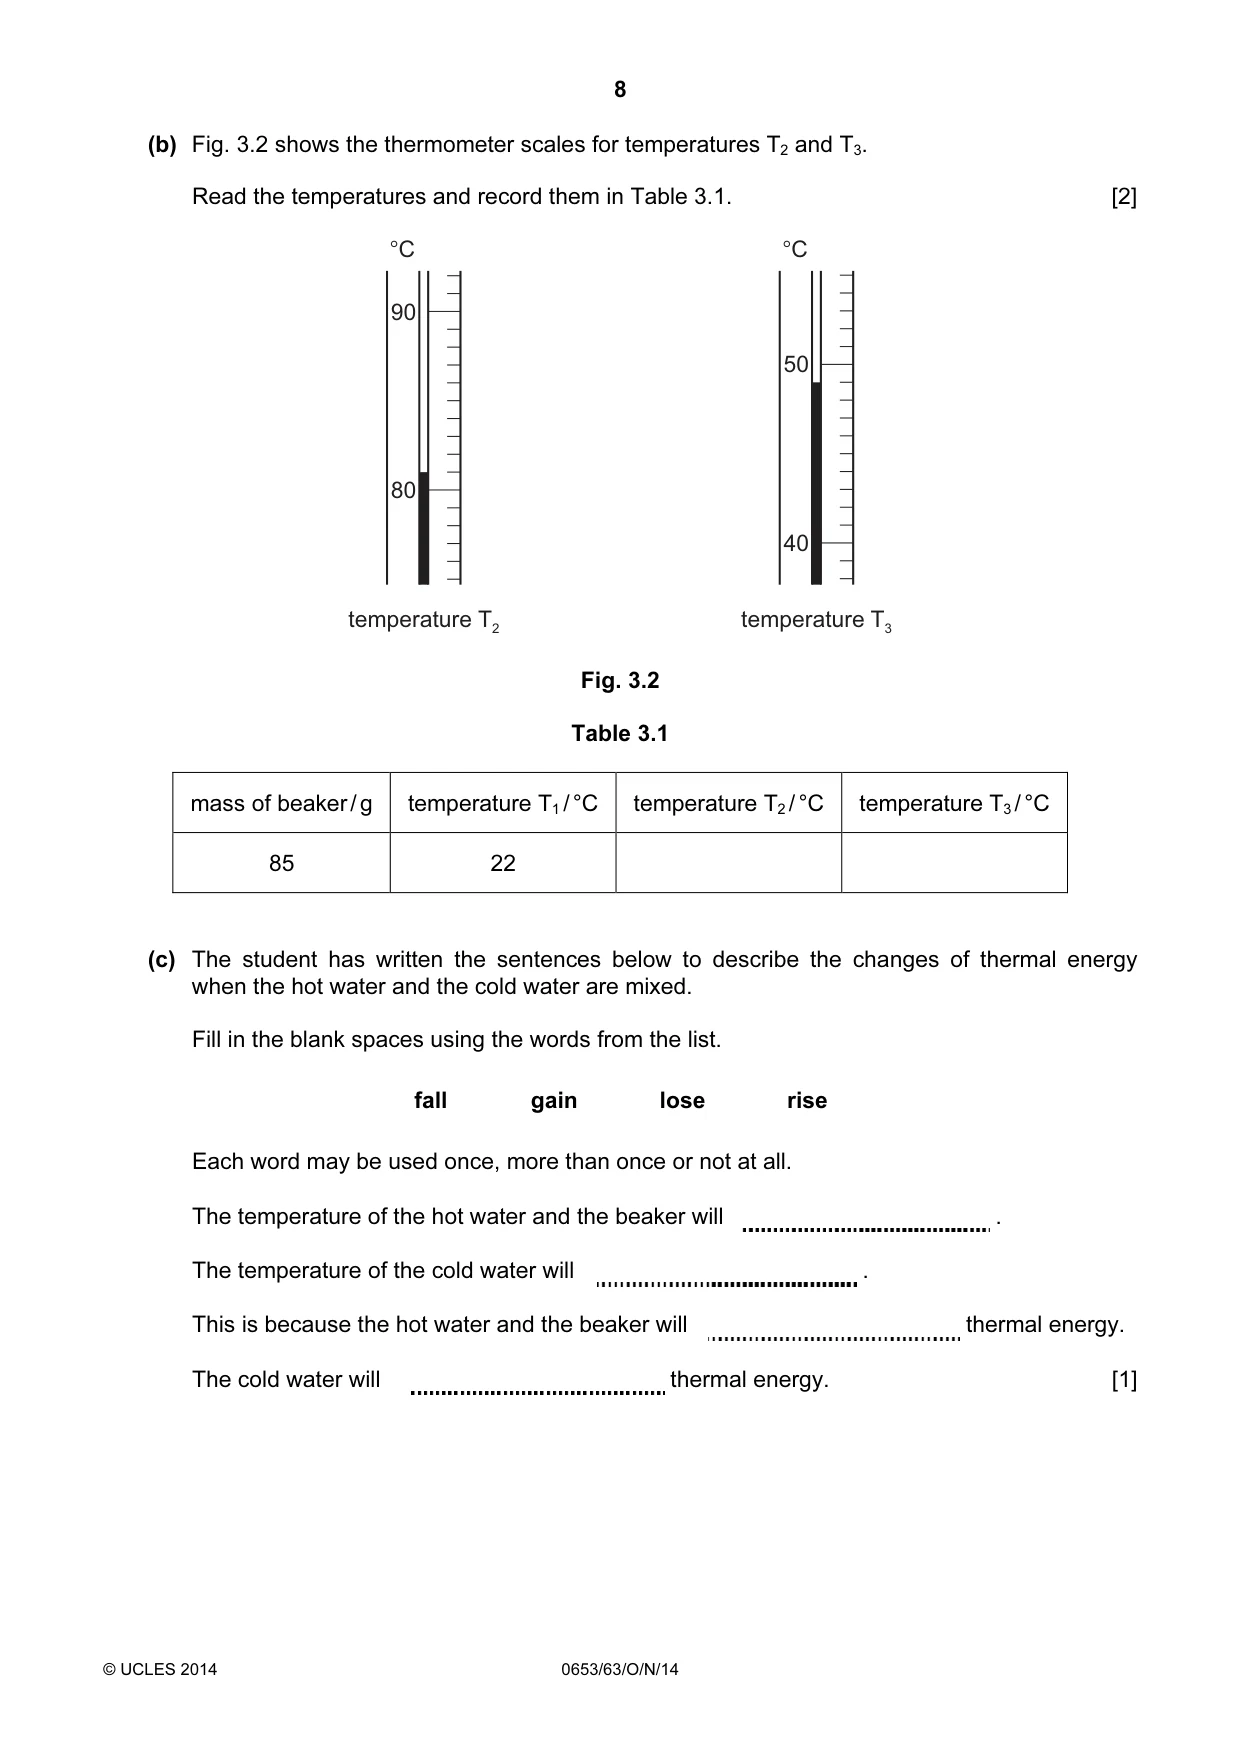
8 © UCLES 2014 0653/63/O/N/14 (b) Fig. 3.2 shows the thermometer scales for temperatures T2 and T3. Read the temperatures and record them in Table 3.1. [2] 90 80 °C temperature T2 50 40 temperature T3 °C Fig. 3.2 Table 3.1 mass of beaker / g temperature T1 / °C temperature T2 / °C temperature T3 / °C 85 22 (c) The student has written the sentences below to describe the changes of thermal energy when the hot water and the cold water are mixed. Fill in the blank spaces using the words from the list. fall gain lose rise Each word may be used once, more than once or not at all. The temperature of the hot water and the beaker will . The temperature of the cold water will . This is because the hot water and the beaker will thermal energy. The cold water will thermal energy. [1]
Question paper, page 9
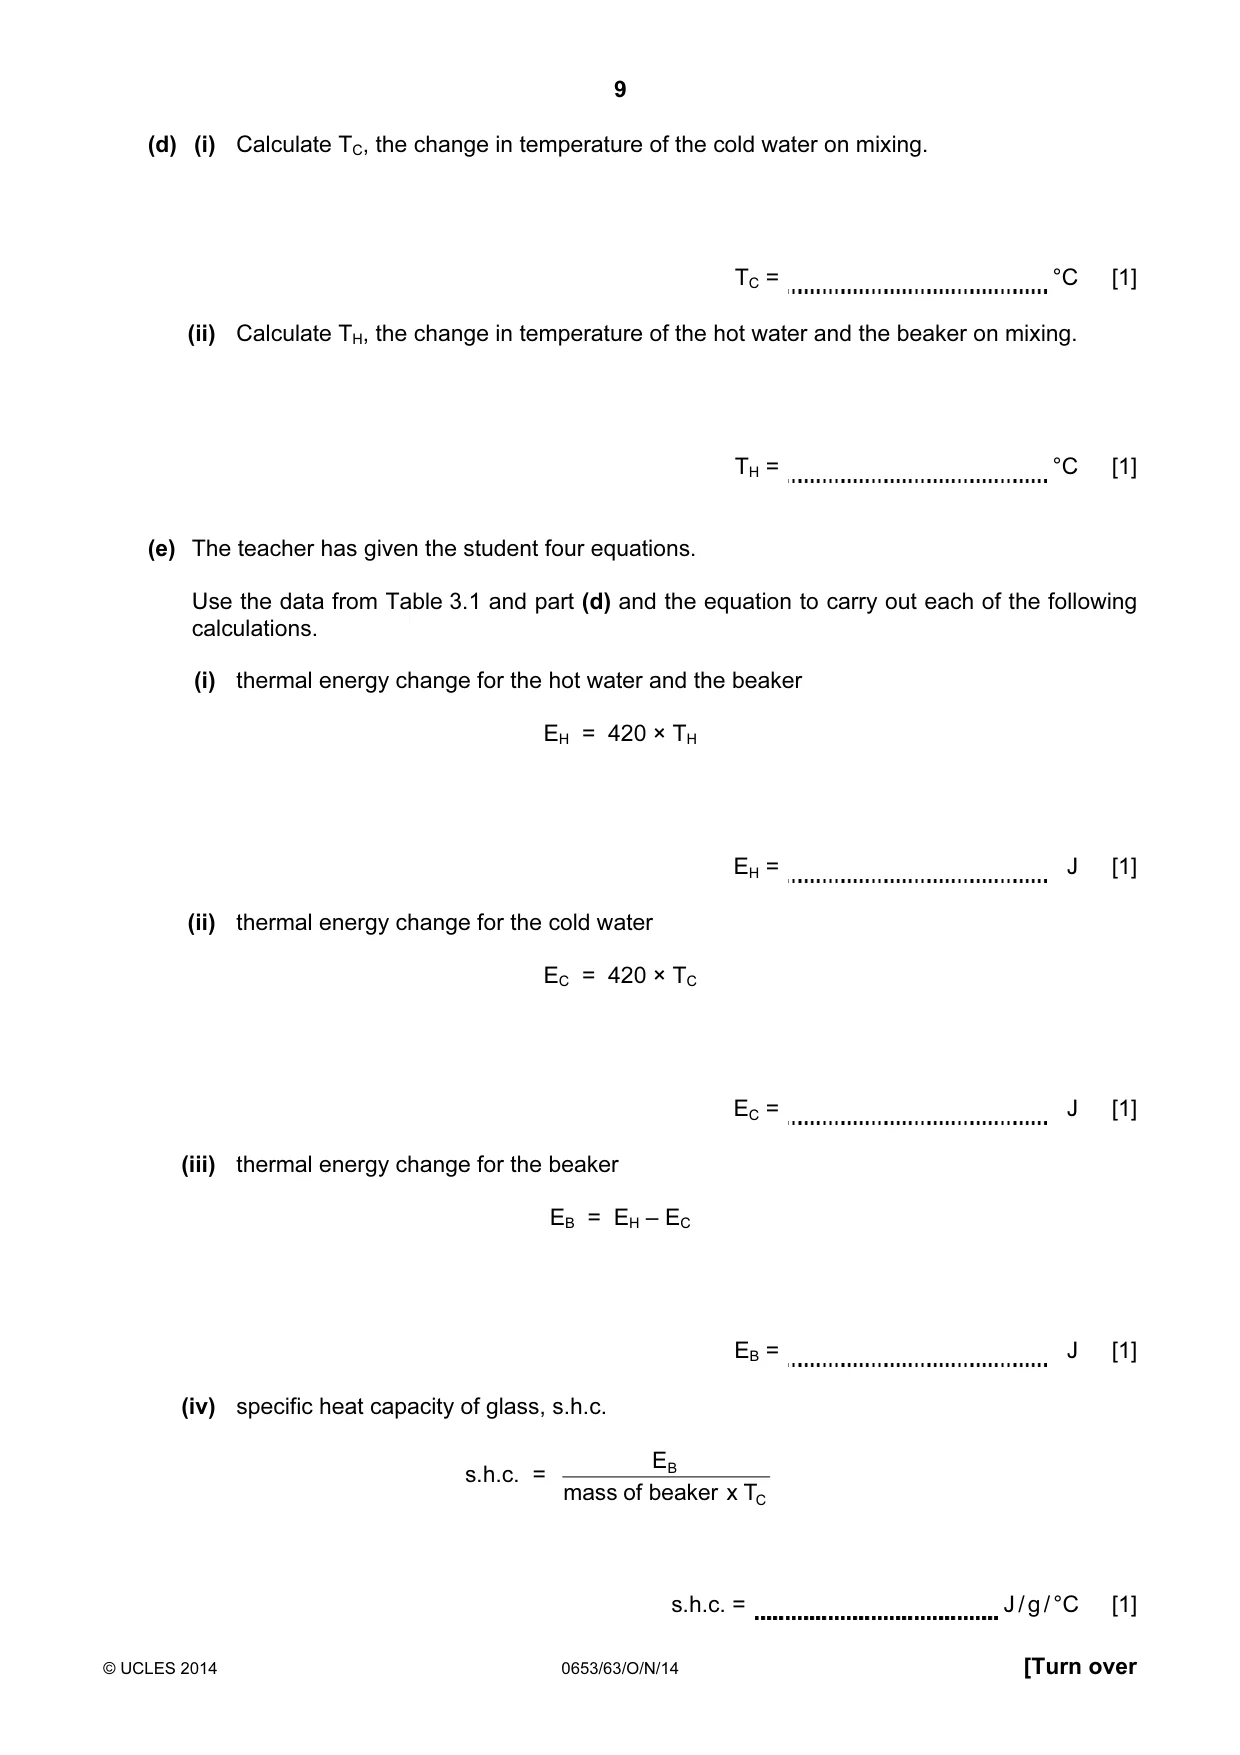
9 © UCLES 2014 0653/63/O/N/14 [Turn over (d) (i) Calculate TC, the change in temperature of the cold water on mixing. TC = °C [1] (ii) Calculate TH, the change in temperature of the hot water and the beaker on mixing. TH = °C [1] (e) The teacher has given the student four equations. Use the data from Table 3.1 and part (d) and the equation to carry out each of the following calculations. (i) thermal energy change for the hot water and the beaker EH = 420 × TH EH = J [1] (ii) thermal energy change for the cold water EC = 420 × TC EC = J [1] (iii) thermal energy change for the beaker EB = EH – EC EB = J [1] (iv) specific heat capacity of glass, s.h.c. s.h.c. = C B T x beaker of mass E s.h.c. = J / g / °C [1]
Question paper, page 10
10 © UCLES 2014 0653/63/O/N/14 BLANK PAGE
Question paper, page 11
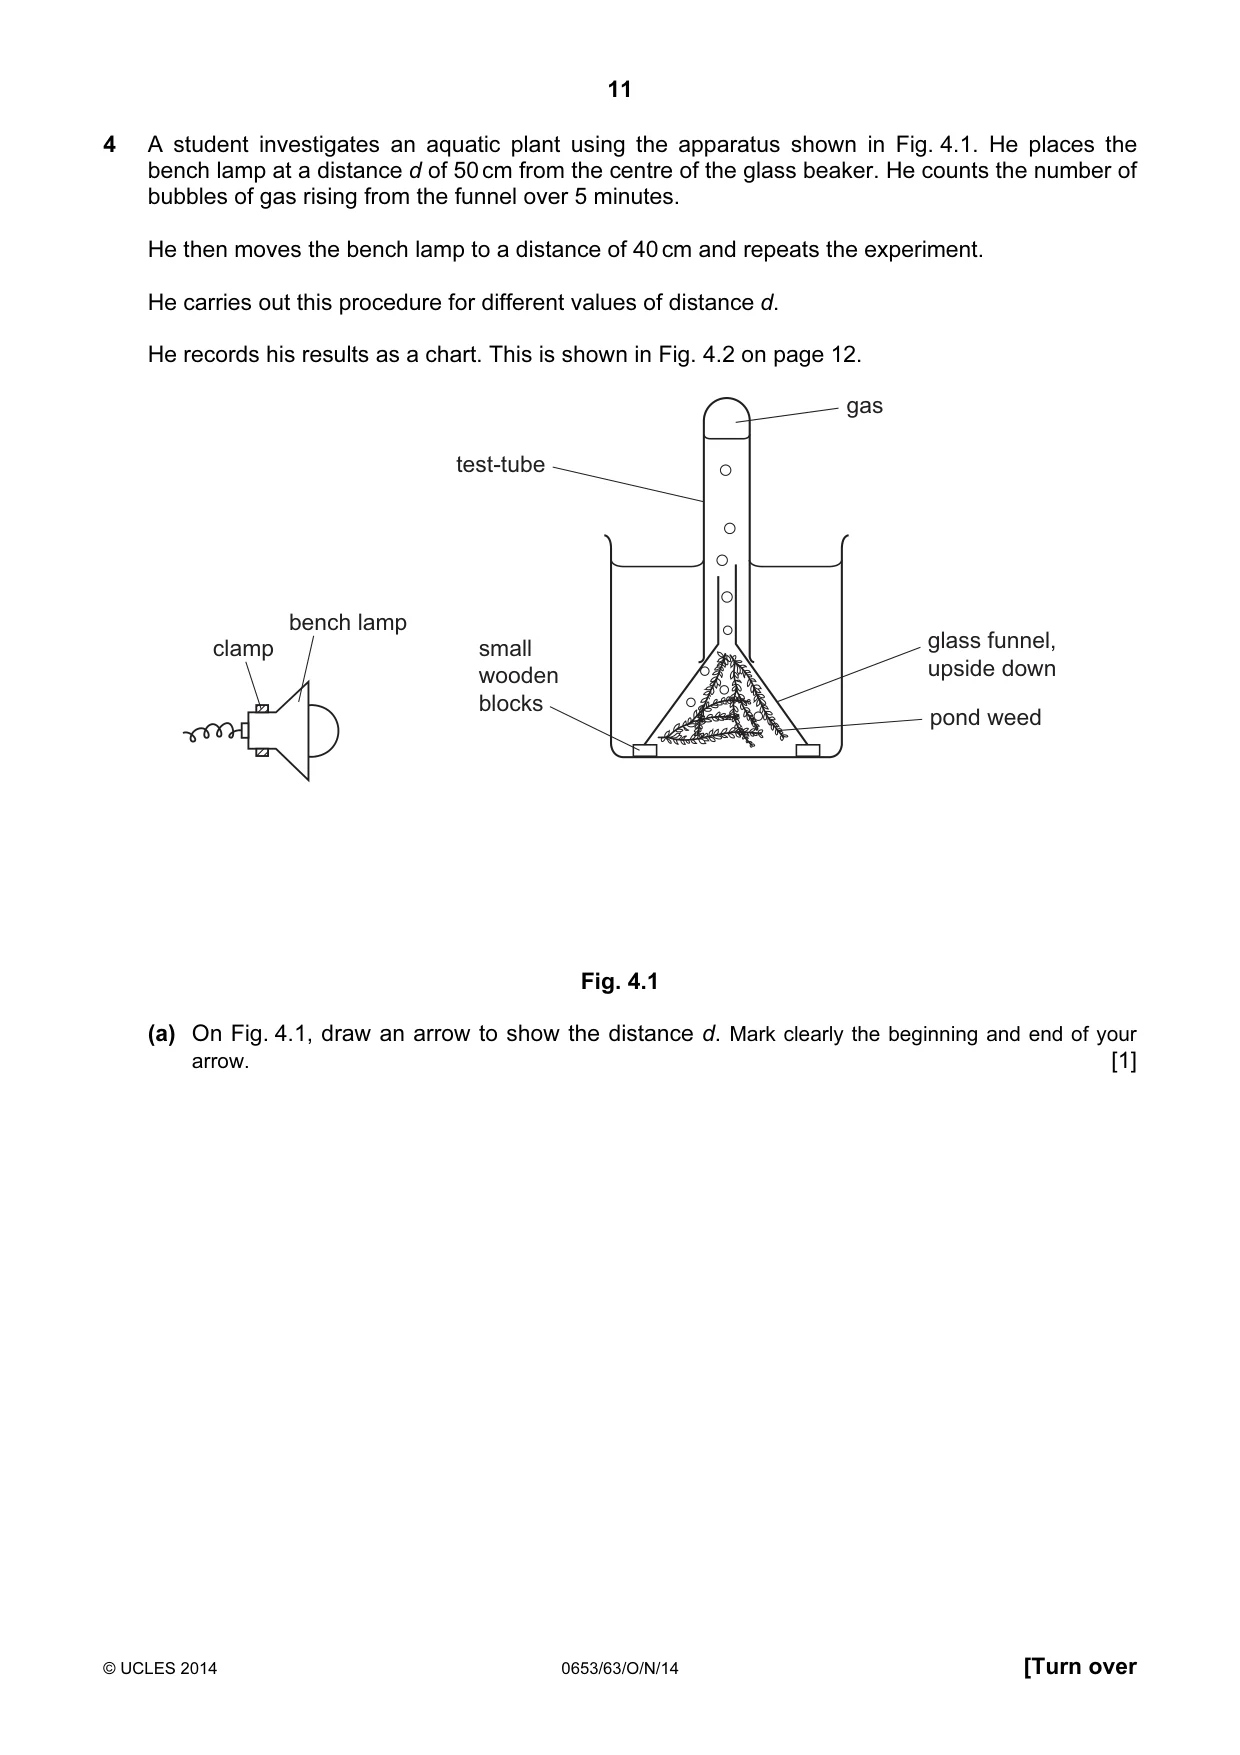
11 © UCLES 2014 0653/63/O/N/14 [Turn over 4 A student investigates an aquatic plant using the apparatus shown in Fig. 4.1. He places the bench lamp at a distance d of 50 cm from the centre of the glass beaker. He counts the number of bubbles of gas rising from the funnel over 5 minutes. He then moves the bench lamp to a distance of 40 cm and repeats the experiment. He carries out this procedure for different values of distance d. He records his results as a chart. This is shown in Fig. 4.2 on page 12. test-tube gas glass funnel, upside down pond weed small wooden blocks clamp bench lamp Fig. 4.1 (a) On Fig. 4.1, draw an arrow to show the distance d. Mark clearly the beginning and end of your arrow. [1]
Question paper, page 12
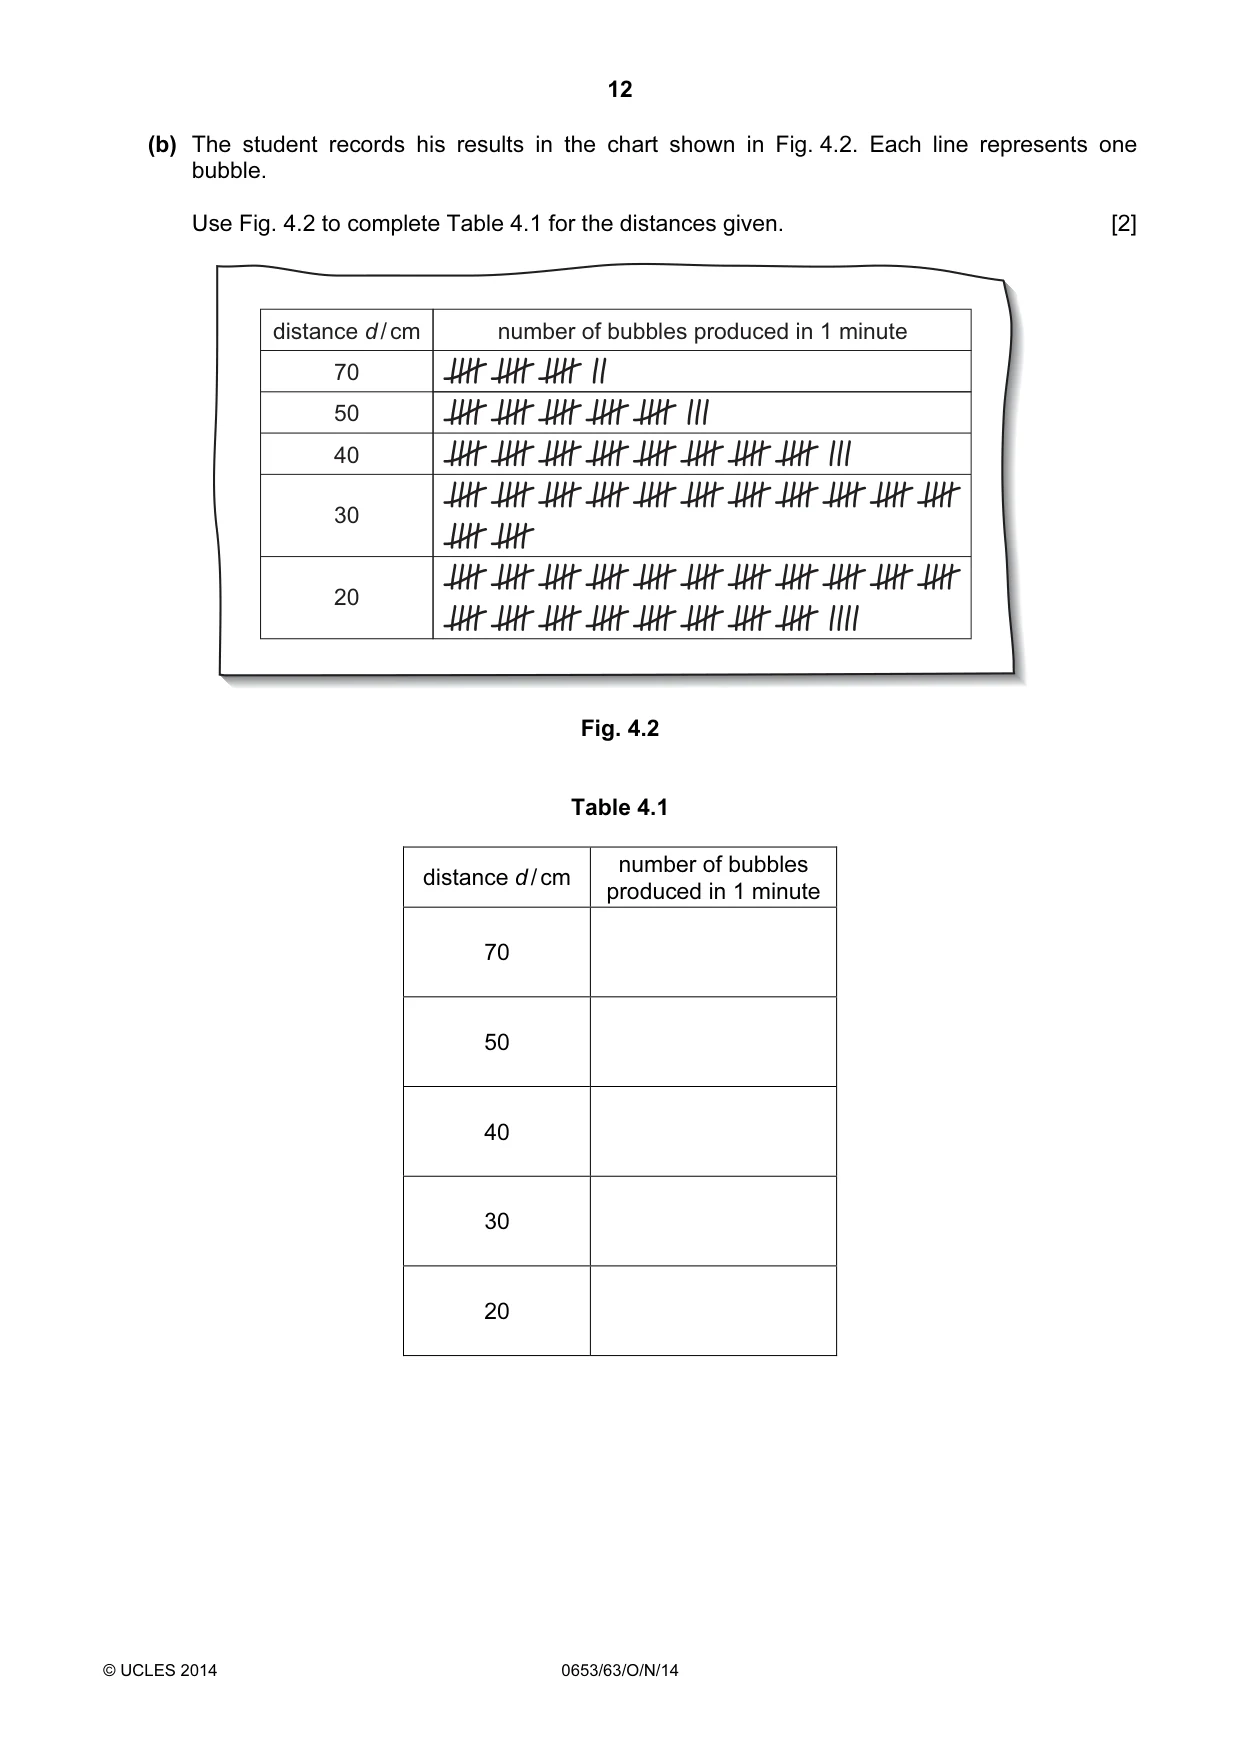
12 © UCLES 2014 0653/63/O/N/14 (b) The student records his results in the chart shown in Fig. 4.2. Each line represents one bubble. Use Fig. 4.2 to complete Table 4.1 for the distances given. [2] distance d / cm 70 50 40 30 20 number of bubbles produced in 1 minute Fig. 4.2 Table 4.1 distance d / cm number of bubbles produced in 1 minute 70 50 40 30 20
Question paper, page 13
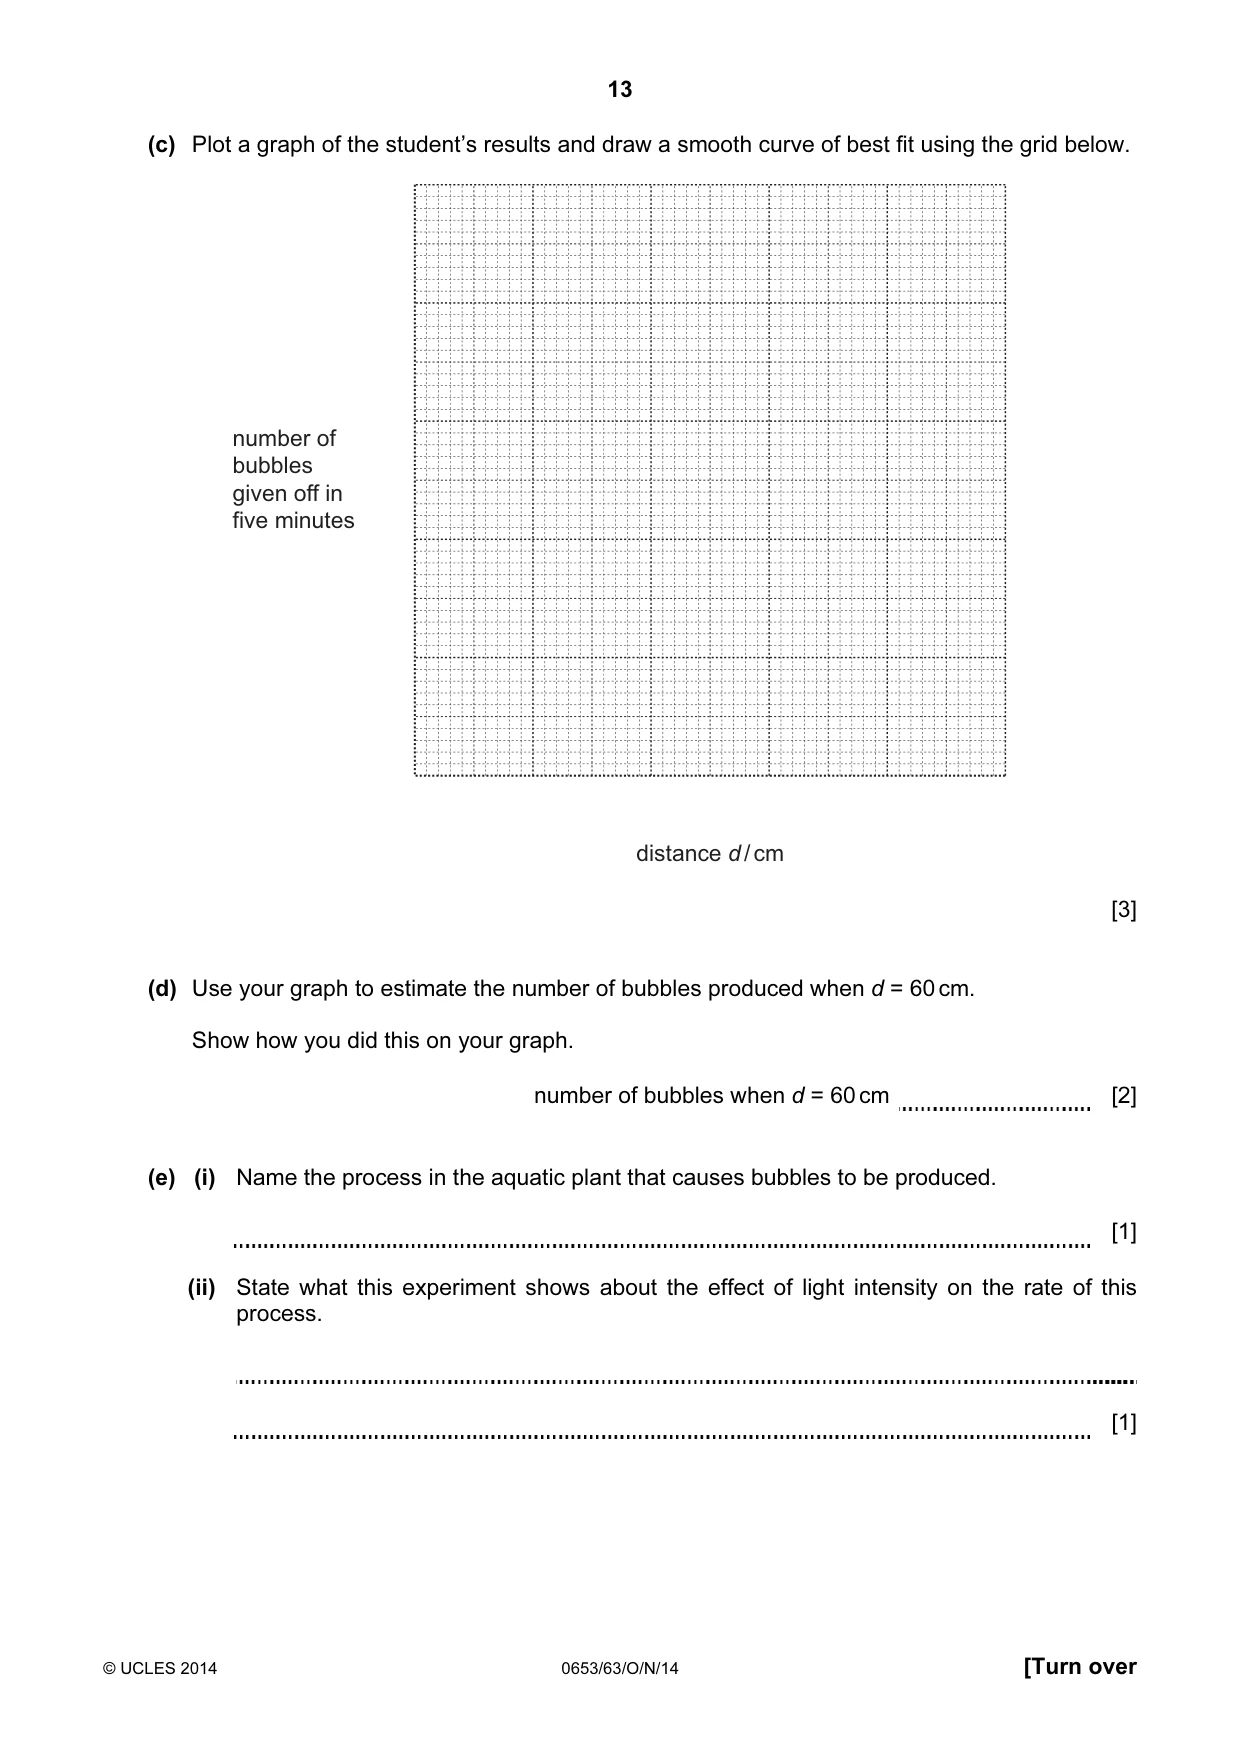
13 © UCLES 2014 0653/63/O/N/14 [Turn over (c) Plot a graph of the student’s results and draw a smooth curve of best fit using the grid below. distance d / cm number of bubbles given off in five minutes [3] (d) Use your graph to estimate the number of bubbles produced when d = 60 cm. Show how you did this on your graph. number of bubbles when d = 60 cm [2] (e) (i) Name the process in the aquatic plant that causes bubbles to be produced. [1] (ii) State what this experiment shows about the effect of light intensity on the rate of this process. [1]
Question paper, page 14
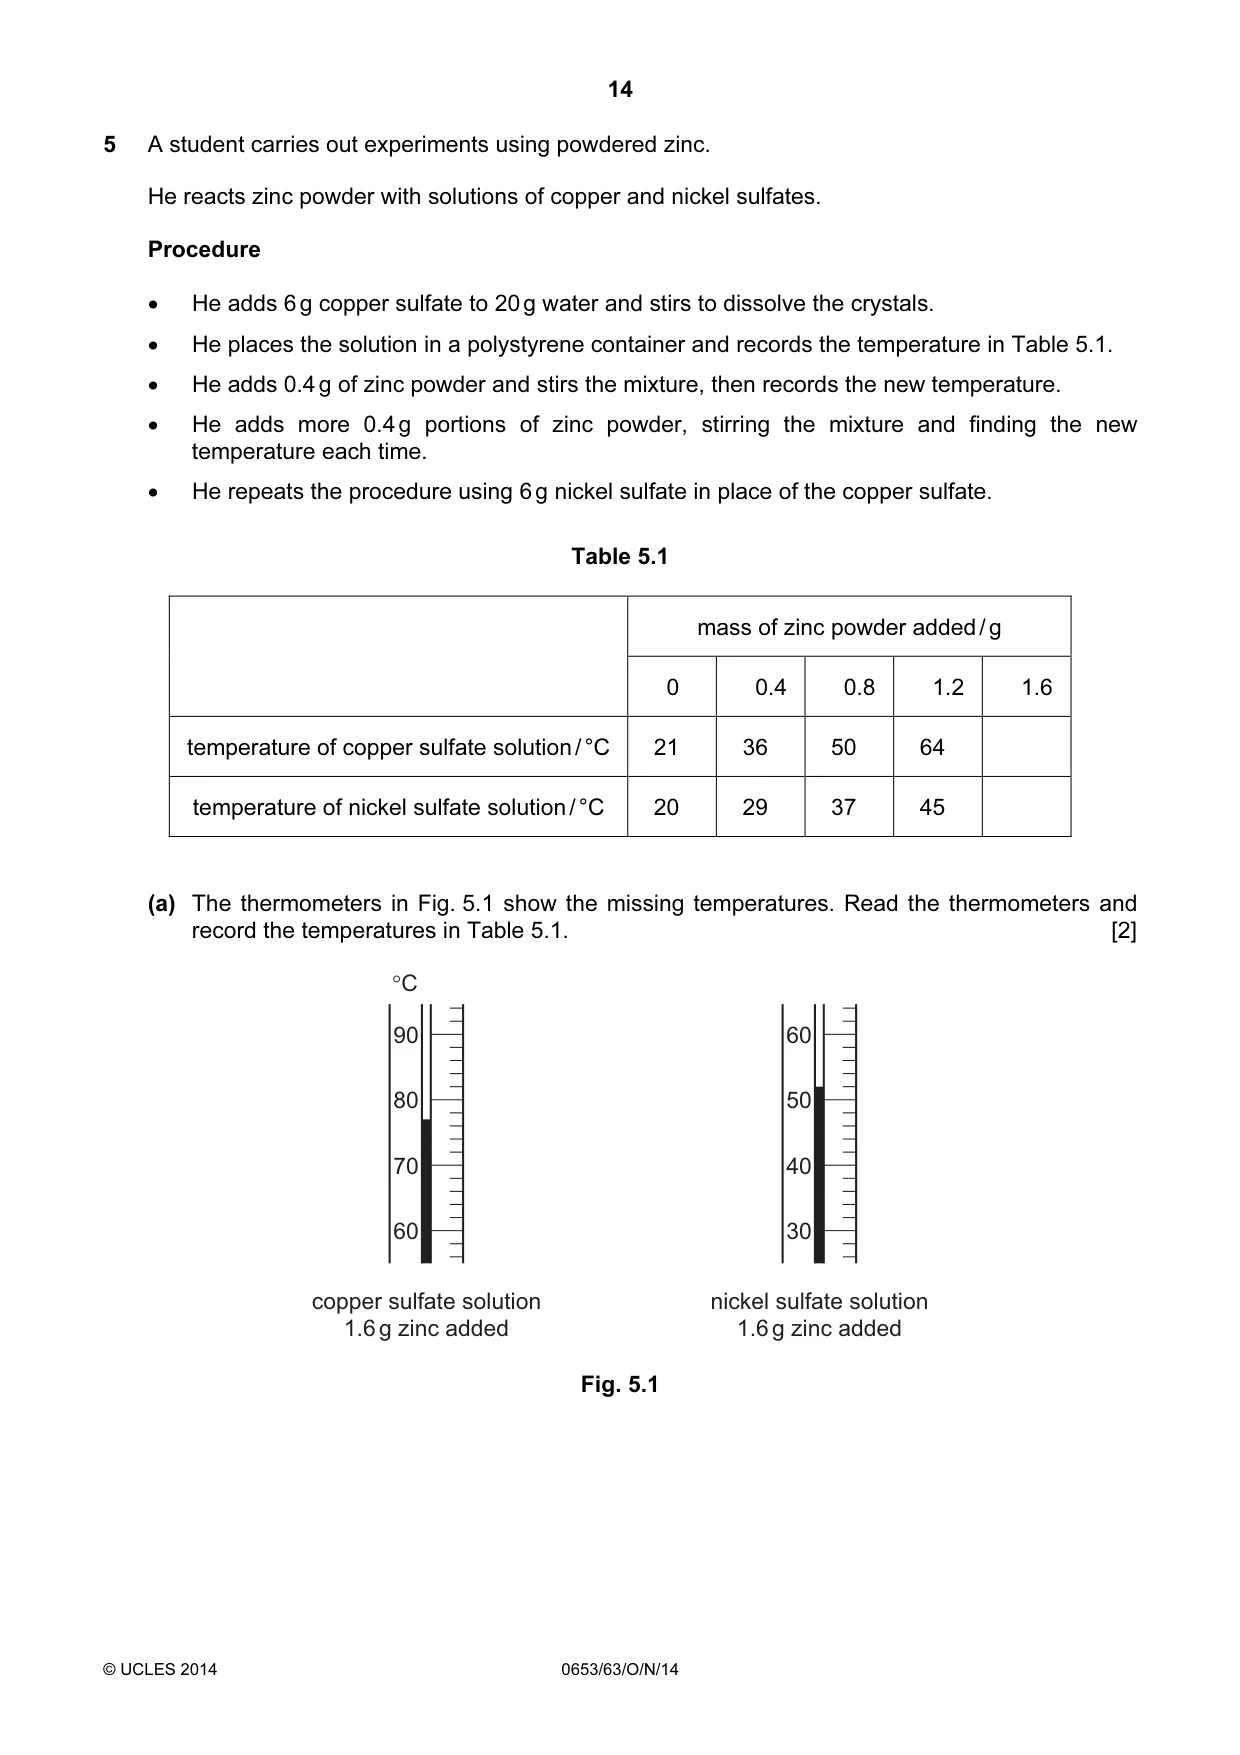
14 © UCLES 2014 0653/63/O/N/14 5 A student carries out experiments using powdered zinc. He reacts zinc powder with solutions of copper and nickel sulfates. Procedure • He adds 6 g copper sulfate to 20 g water and stirs to dissolve the crystals. • He places the solution in a polystyrene container and records the temperature in Table 5.1. • He adds 0.4 g of zinc powder and stirs the mixture, then records the new temperature. • He adds more 0.4 g portions of zinc powder, stirring the mixture and finding the new temperature each time. • He repeats the procedure using 6 g nickel sulfate in place of the copper sulfate. Table 5.1 mass of zinc powder added / g 0 0.4 0.8 1.2 1.6 temperature of copper sulfate solution / °C 21 36 50 64 temperature of nickel sulfate solution / °C 20 29 37 45 (a) The thermometers in Fig. 5.1 show the missing temperatures. Read the thermometers and record the temperatures in Table 5.1. [2] 90 80 70 60 60 50 40 30 °C copper sulfate solution 1.6 g zinc added nickel sulfate solution 1.6 g zinc added Fig. 5.1
Question paper, page 15
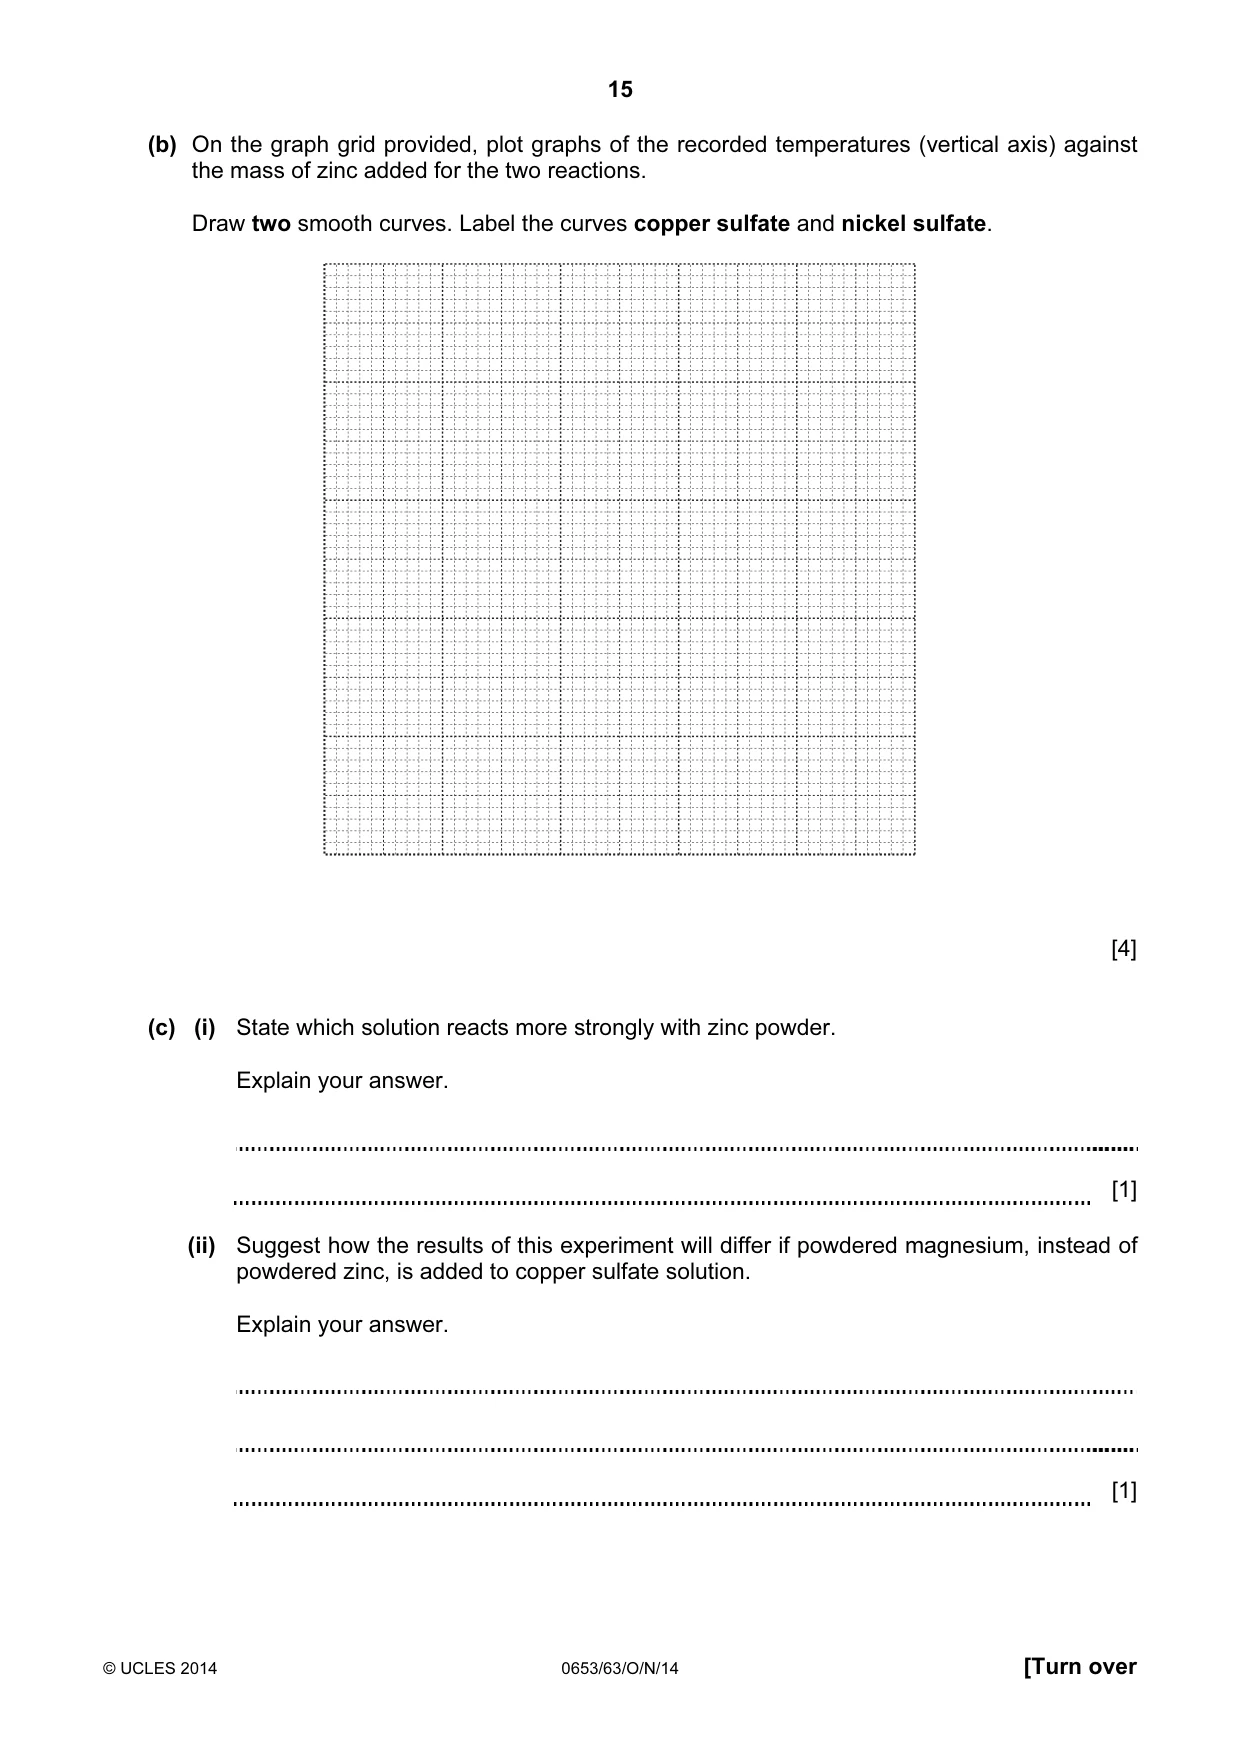
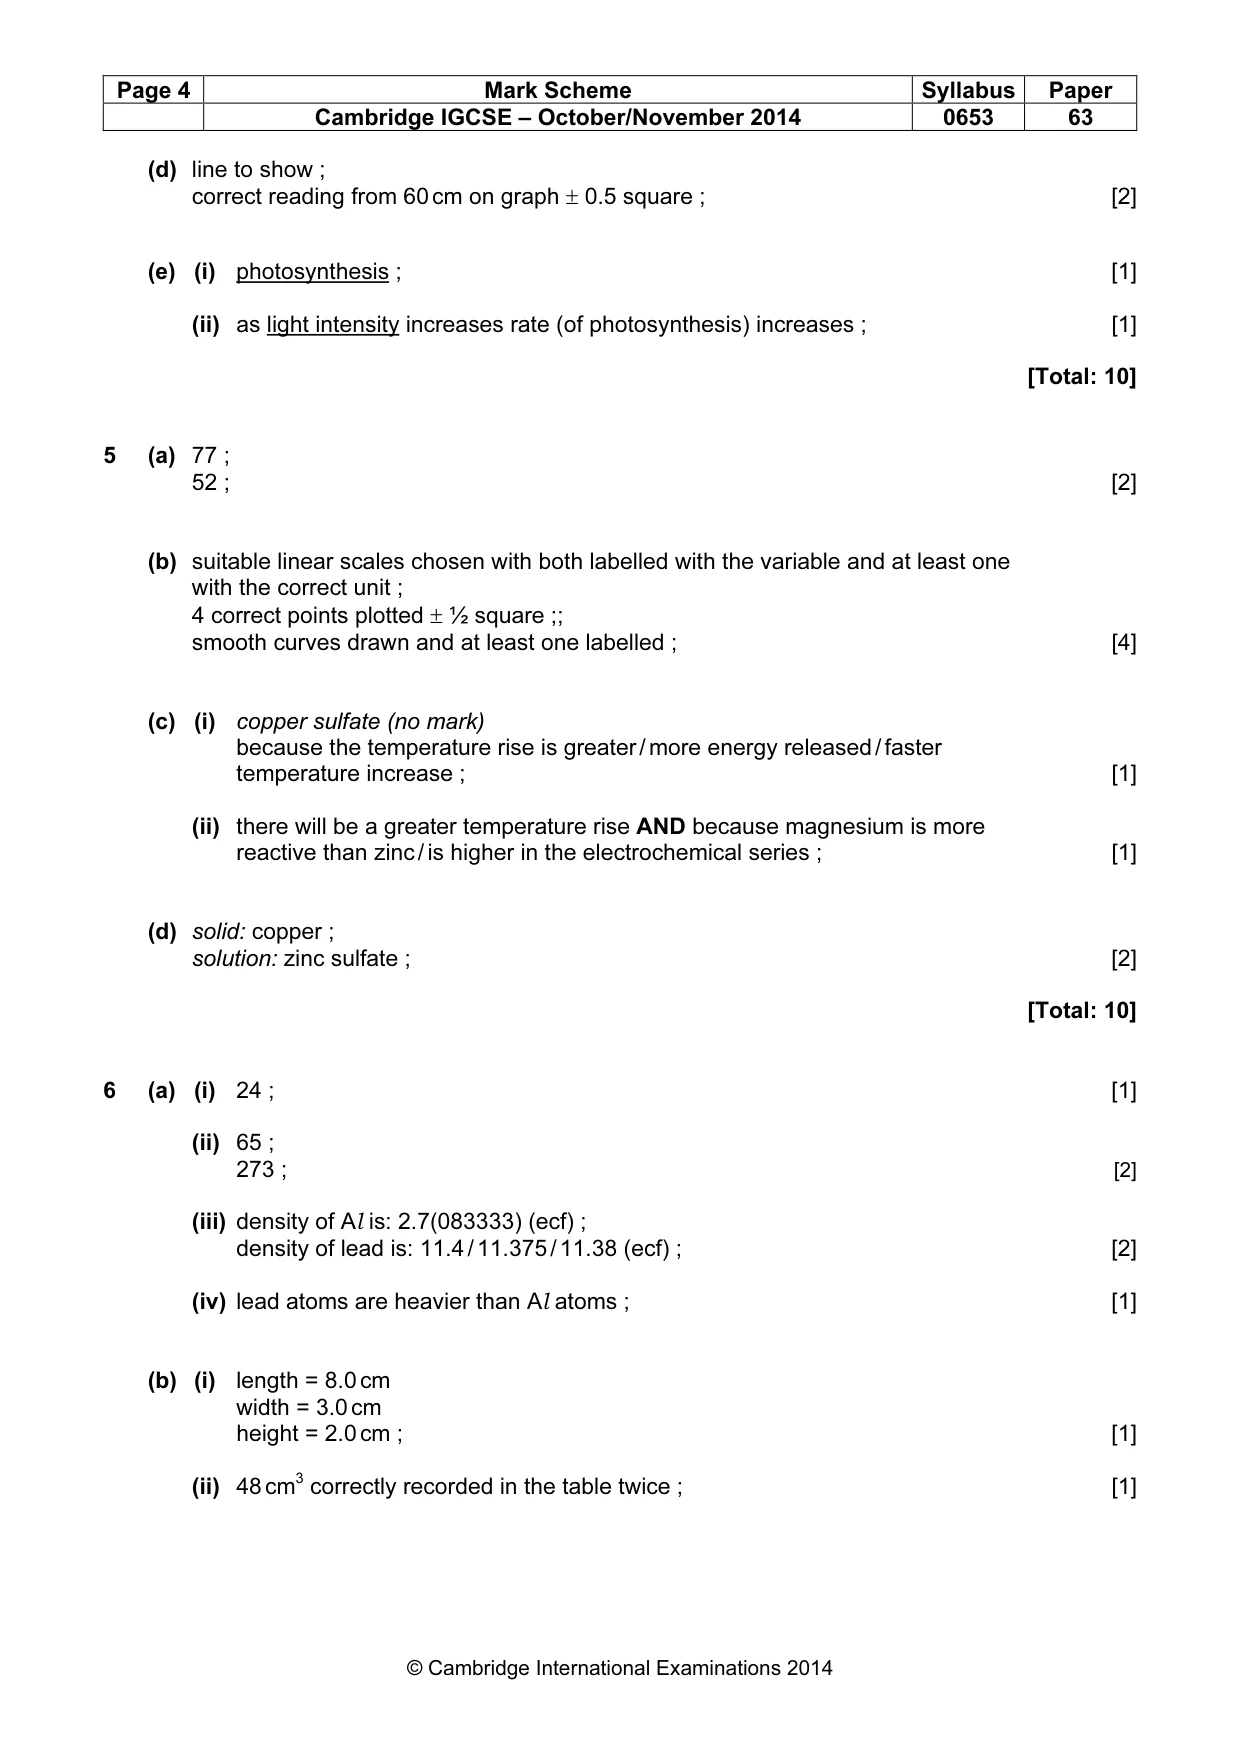
15 © UCLES 2014 0653/63/O/N/14 [Turn over (b) On the graph grid provided, plot graphs of the recorded temperatures (vertical axis) against the mass of zinc added for the two reactions. Draw two smooth curves. Label the curves copper sulfate and nickel sulfate. [4] (c) (i) State which solution reacts more strongly with zinc powder. Explain your answer. [1] (ii) Suggest how the results of this experiment will differ if powdered magnesium, instead of powdered zinc, is added to copper sulfate solution. Explain your answer. [1]
Question paper, page 16
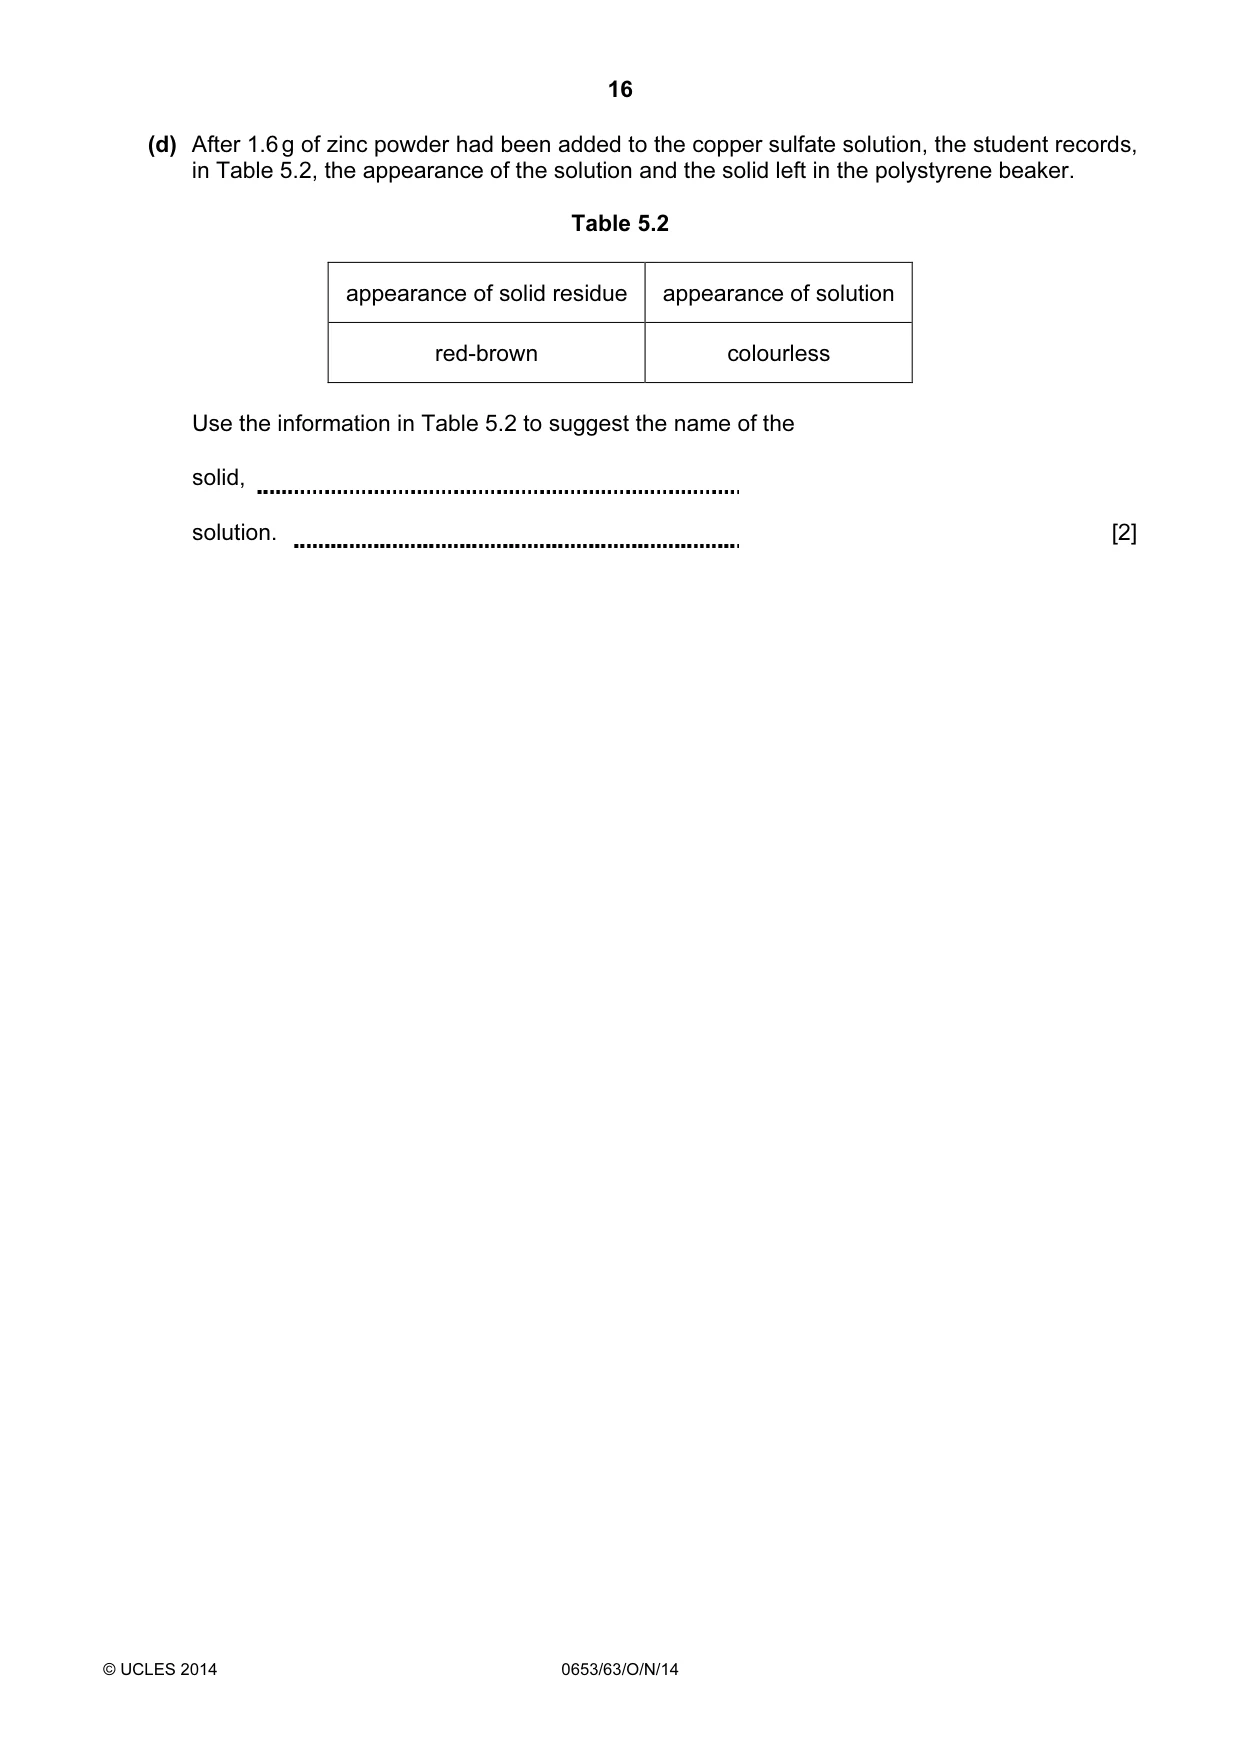
16 © UCLES 2014 0653/63/O/N/14 (d) After 1.6 g of zinc powder had been added to the copper sulfate solution, the student records, in Table 5.2, the appearance of the solution and the solid left in the polystyrene beaker. Table 5.2 appearance of solid residue appearance of solution red-brown colourless Use the information in Table 5.2 to suggest the name of the solid, solution. [2]
Question paper, page 17
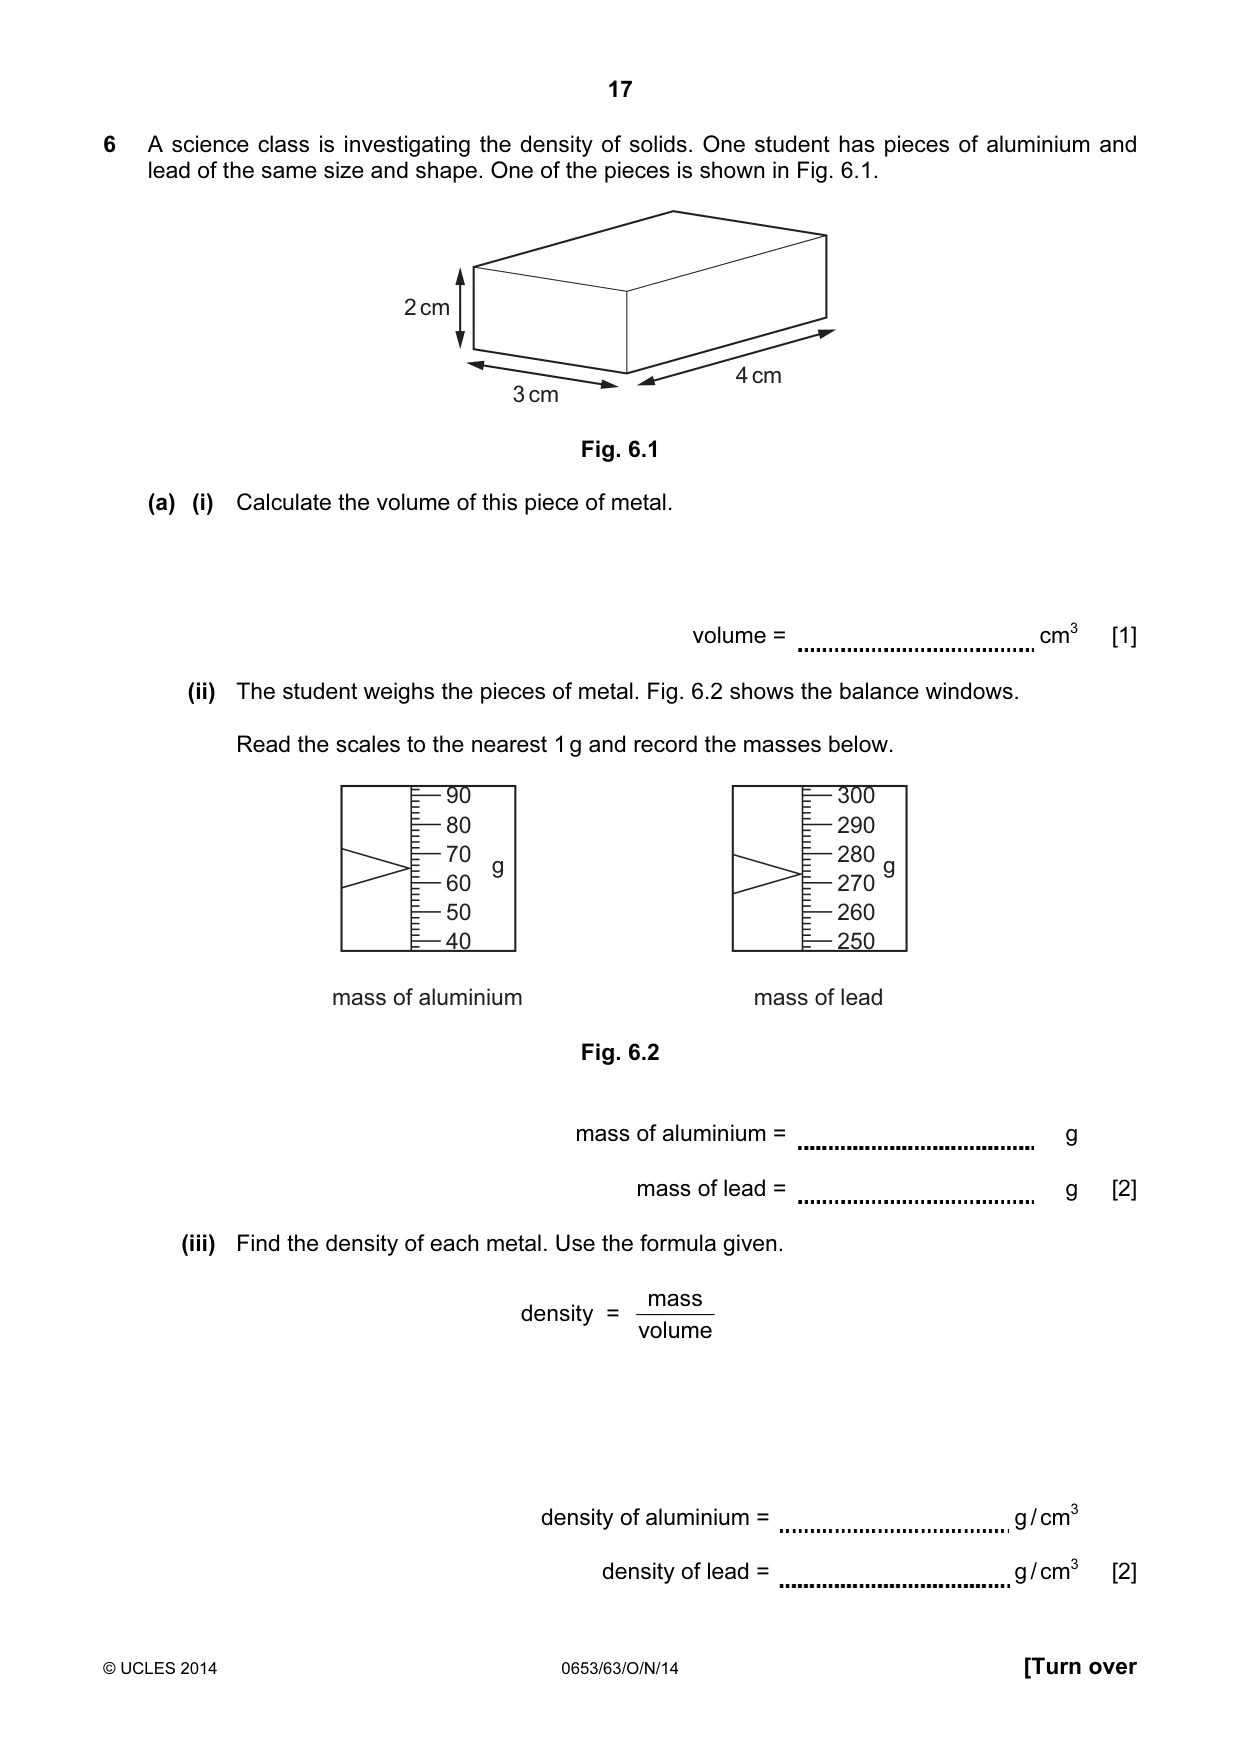
17 © UCLES 2014 0653/63/O/N/14 [Turn over 6 A science class is investigating the density of solids. One student has pieces of aluminium and lead of the same size and shape. One of the pieces is shown in Fig. 6.1. 2 cm 3 cm 4 cm Fig. 6.1 (a) (i) Calculate the volume of this piece of metal. volume = cm3 [1] (ii) The student weighs the pieces of metal. Fig. 6.2 shows the balance windows. Read the scales to the nearest 1 g and record the masses below. 90 80 70 60 50 40 g mass of aluminium 300 290 280 270 260 250 g mass of lead Fig. 6.2 mass of aluminium = g mass of lead = g [2] (iii) Find the density of each metal. Use the formula given. density = volume mass density of aluminium = g / cm3 density of lead = g / cm3 [2]
Question paper, page 18
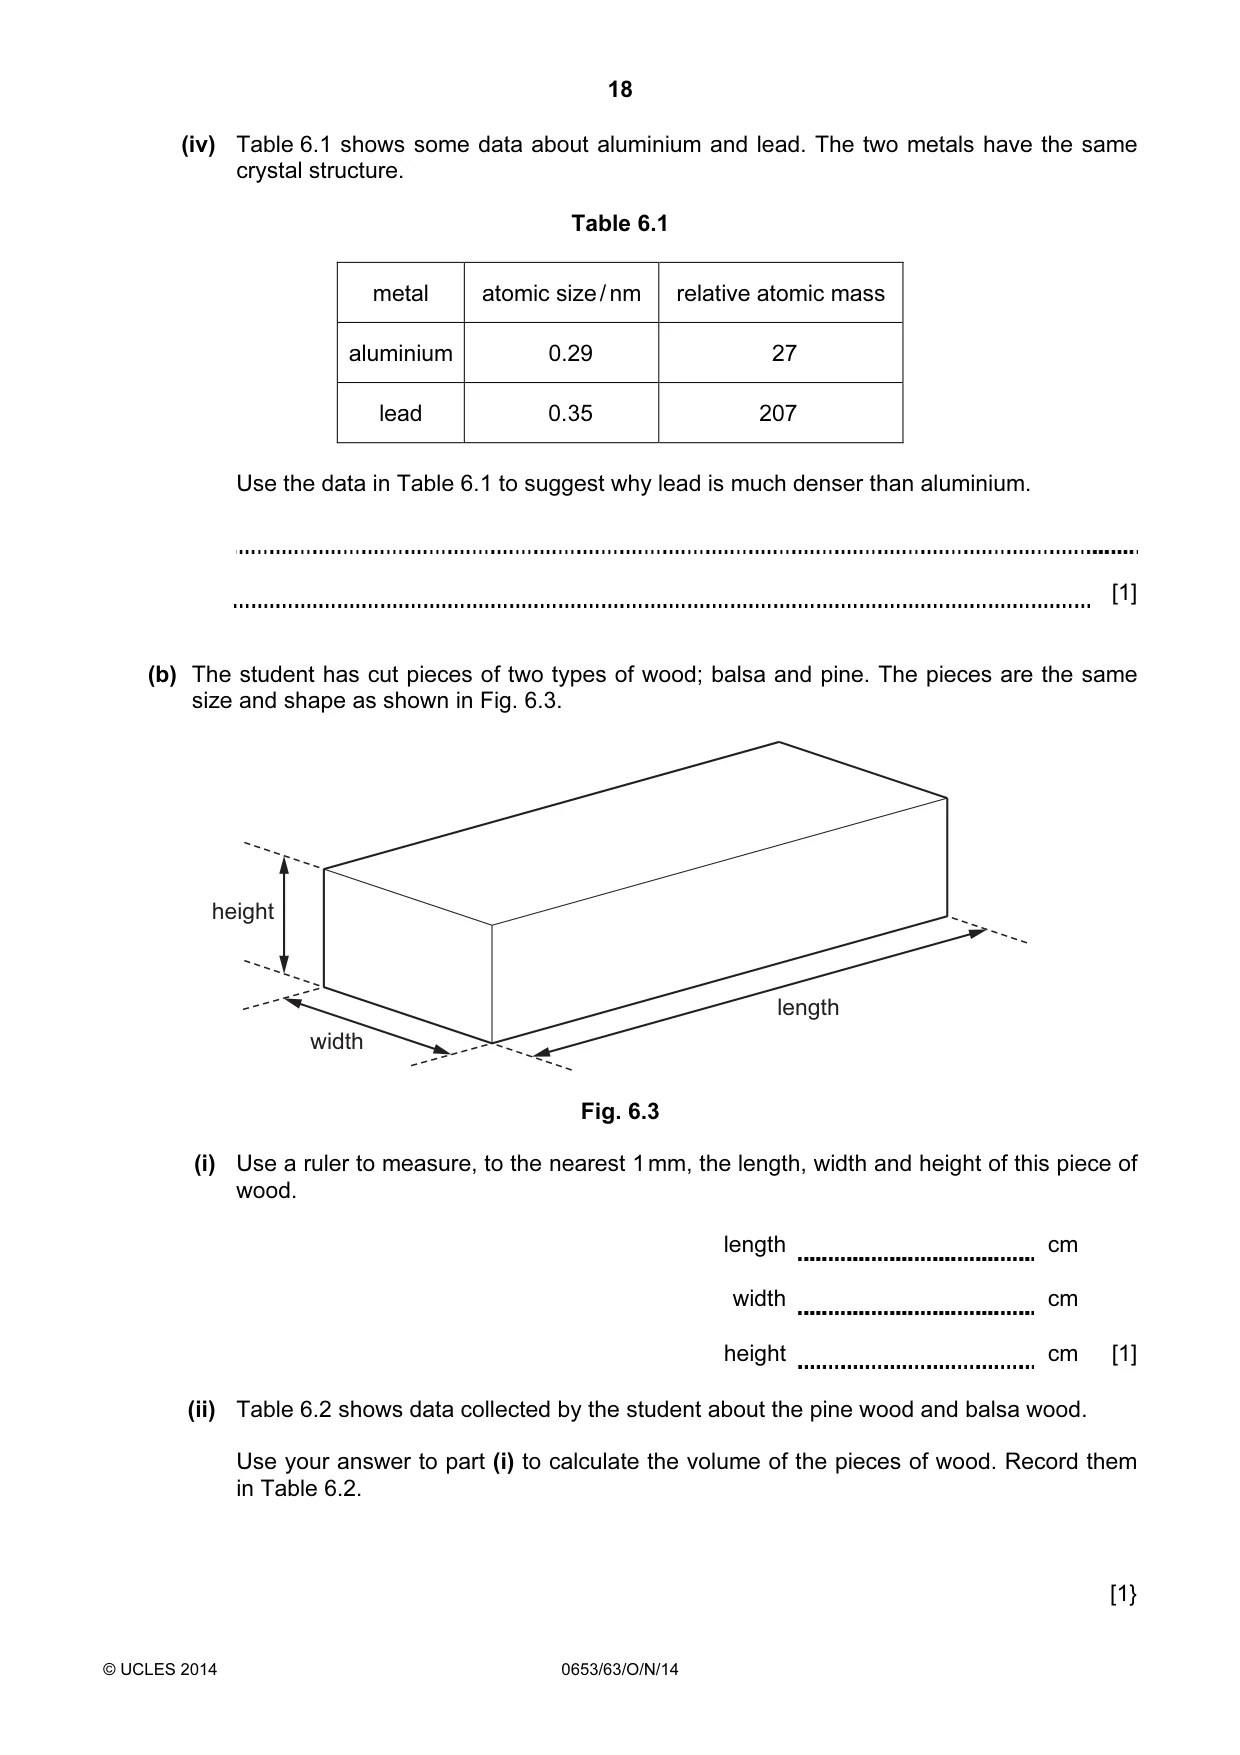
18 © UCLES 2014 0653/63/O/N/14 (iv) Table 6.1 shows some data about aluminium and lead. The two metals have the same crystal structure. Table 6.1 metal atomic size / nm relative atomic mass aluminium 0.29 27 lead 0.35 207 Use the data in Table 6.1 to suggest why lead is much denser than aluminium. [1] (b) The student has cut pieces of two types of wood; balsa and pine. The pieces are the same size and shape as shown in Fig. 6.3. length width height Fig. 6.3 (i) Use a ruler to measure, to the nearest 1 mm, the length, width and height of this piece of wood. length cm width cm height cm [1] (ii) Table 6.2 shows data collected by the student about the pine wood and balsa wood. Use your answer to part (i) to calculate the volume of the pieces of wood. Record them in Table 6.2. [1}
Question paper, page 19
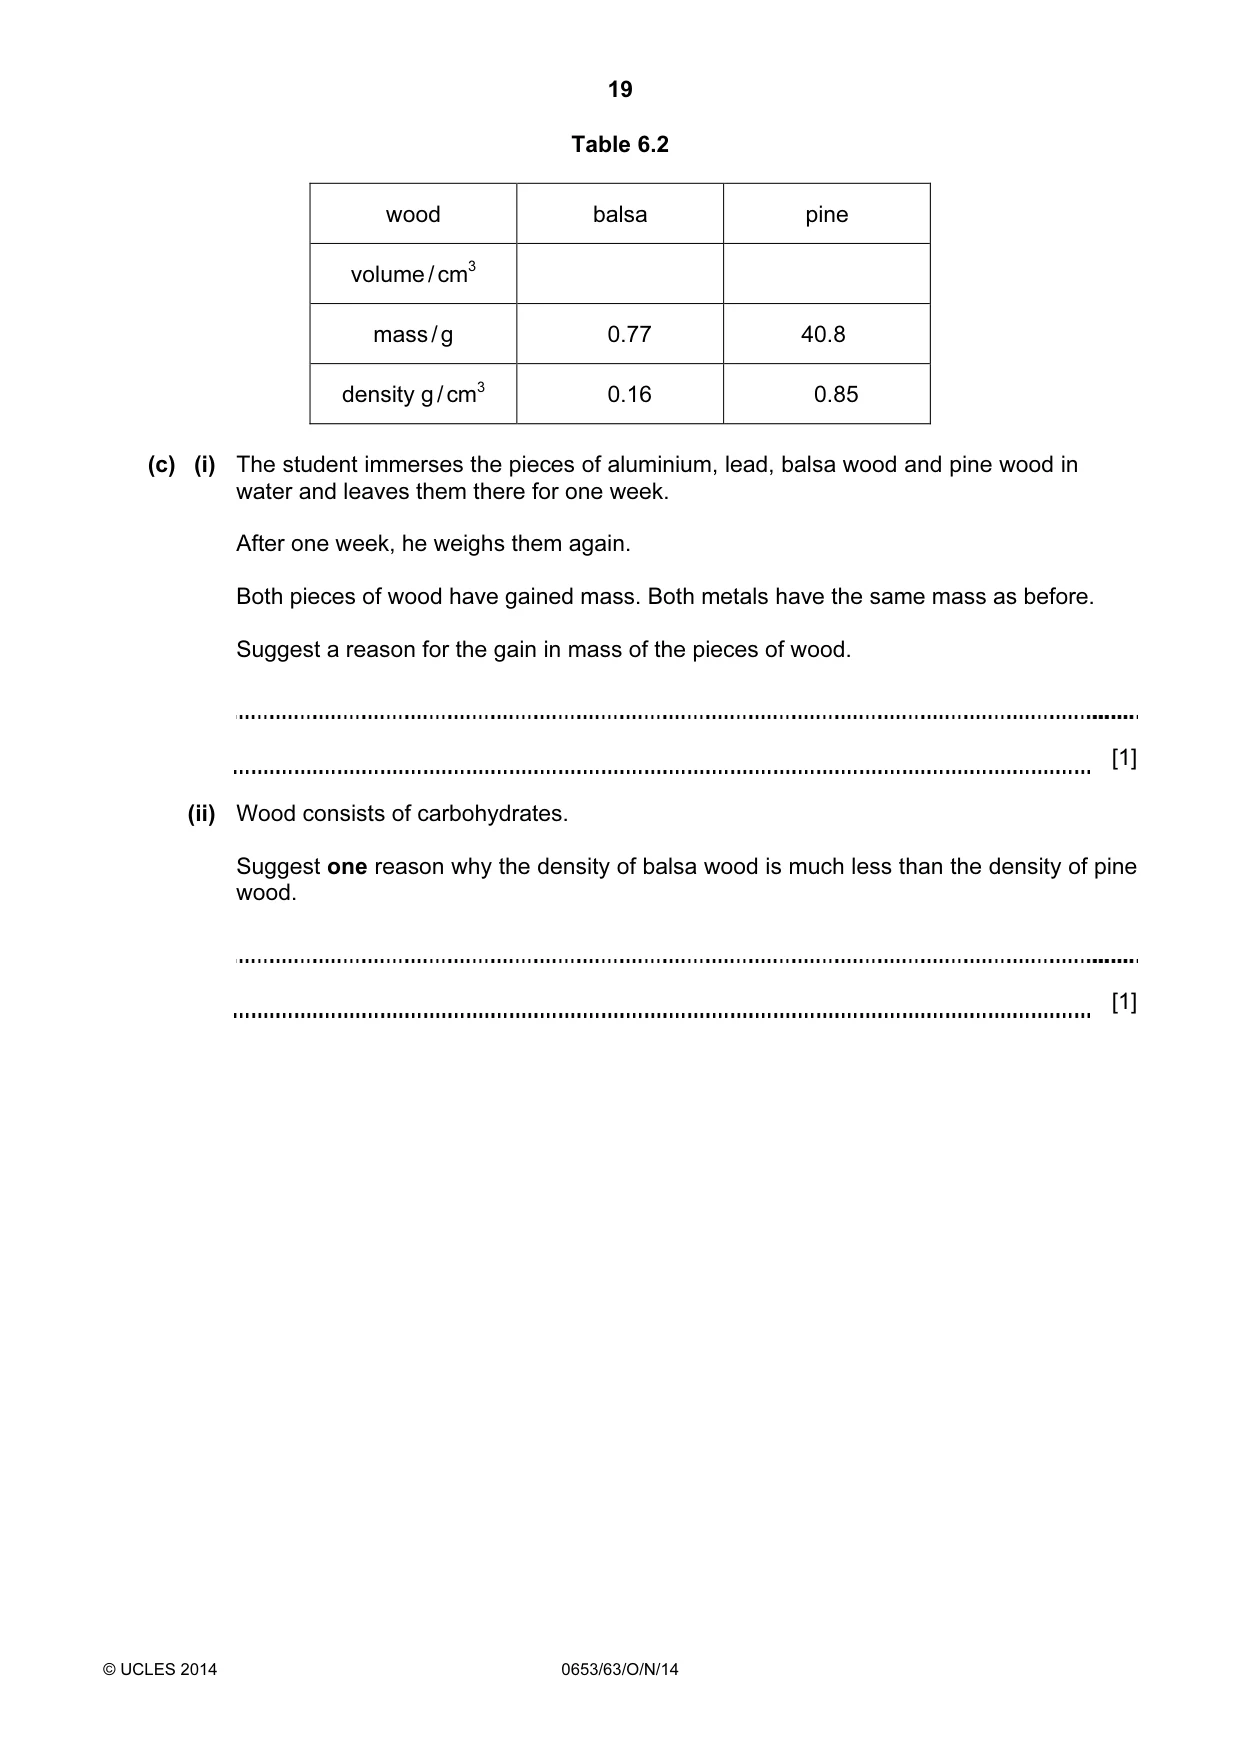
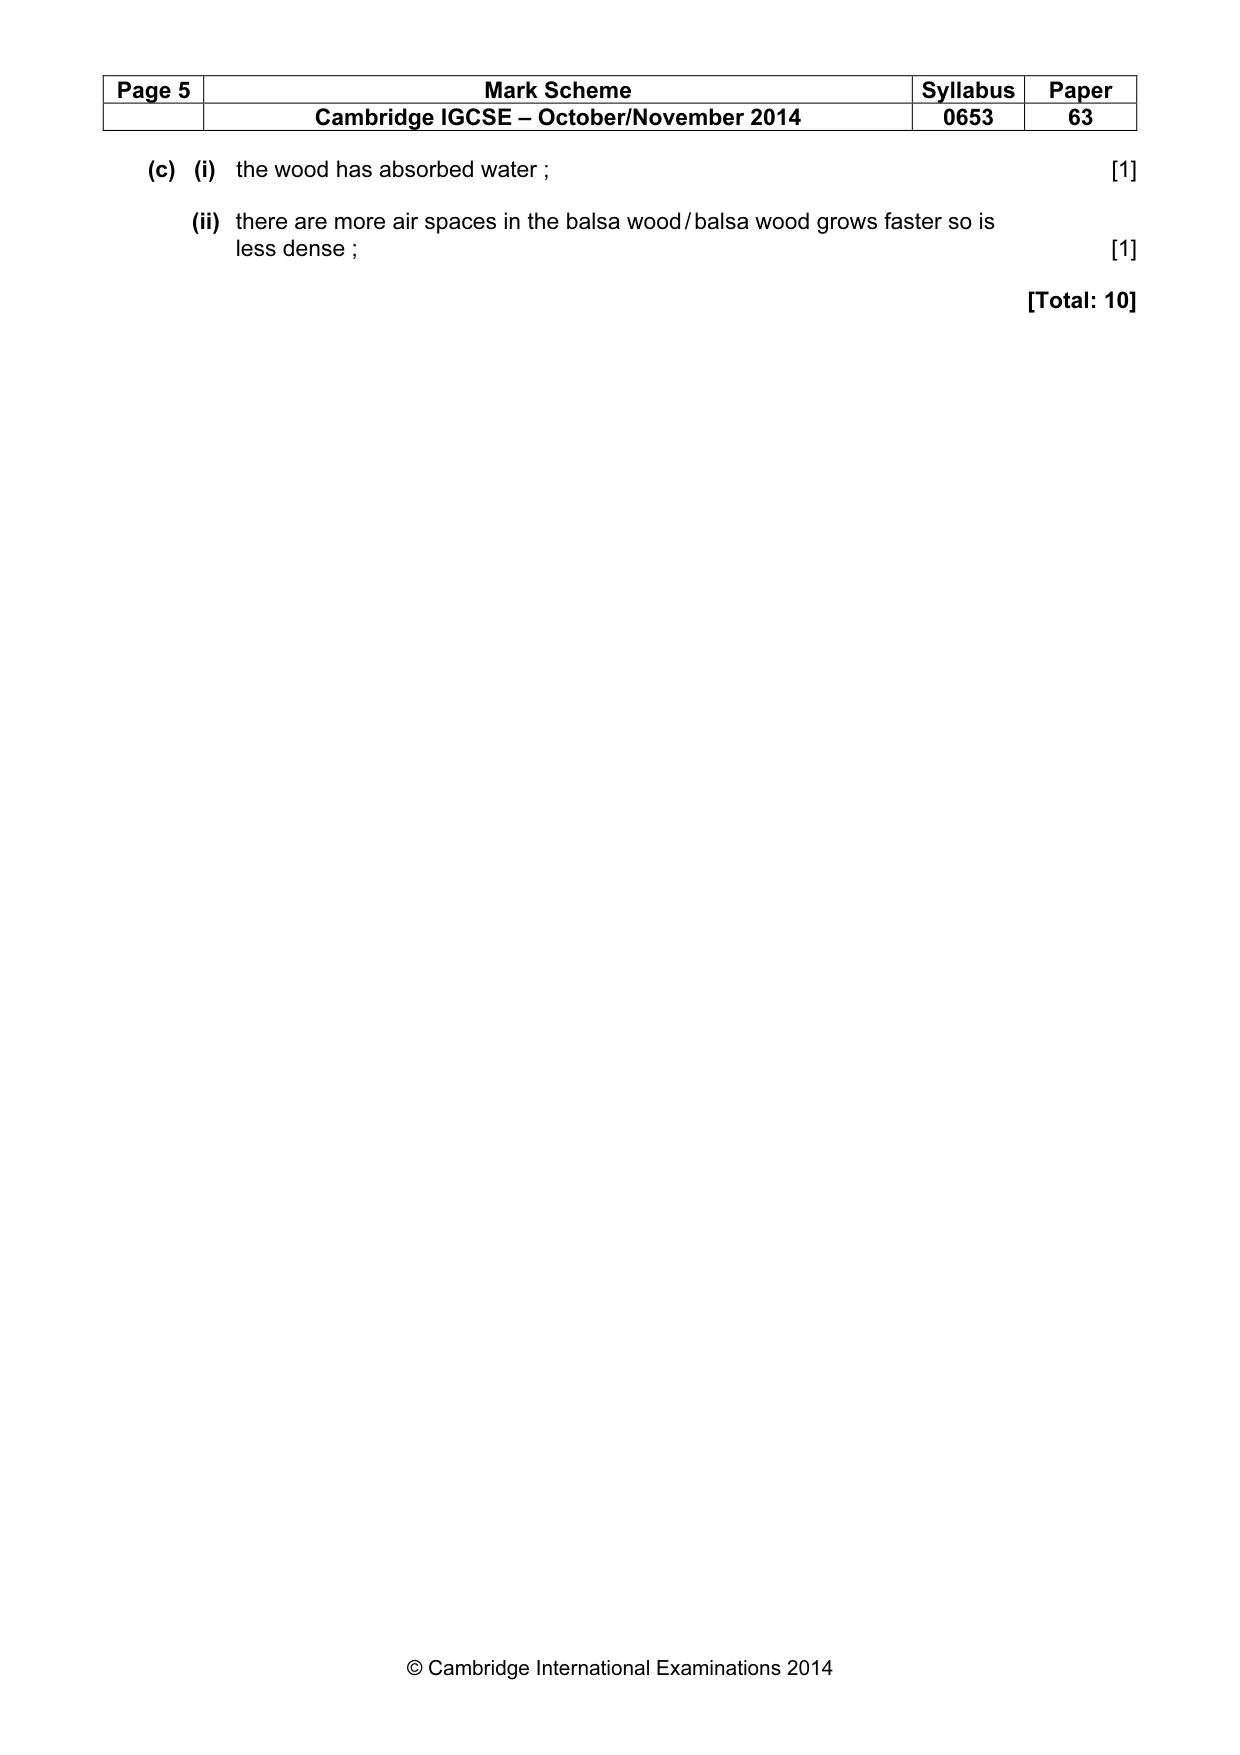
19 © UCLES 2014 0653/63/O/N/14 Table 6.2 wood balsa pine volume / cm3 mass / g 0.77 40.8 density g / cm3 0.16 0.85 (c) (i) The student immerses the pieces of aluminium, lead, balsa wood and pine wood in water and leaves them there for one week. After one week, he weighs them again. Both pieces of wood have gained mass. Both metals have the same mass as before. Suggest a reason for the gain in mass of the pieces of wood. [1] (ii) Wood consists of carbohydrates. Suggest one reason why the density of balsa wood is much less than the density of pine wood. [1]
Question paper, page 20
20 Permission to reproduce items where third-party owned material protected by copyright is included has been sought and cleared where possible. Every reasonable effort has been made by the publisher (UCLES) to trace copyright holders, but if any items requiring clearance have unwittingly been included, the publisher will be pleased to make amends at the earliest possible opportunity. Cambridge International Examinations is part of the Cambridge Assessment Group. Cambridge Assessment is the brand name of University of Cambridge Local Examinations Syndicate (UCLES), which is itself a department of the University of Cambridge. © UCLES 2014 0653/63/O/N/14 BLANK PAGE
Mark scheme, page 1
® IGCSE is the registered trademark of Cambridge International Examinations. CAMBRIDGE INTERNATIONAL EXAMINATIONS Cambridge International General Certificate of Secondary Education MARK SCHEME for the October/November 2014 series 0653 COMBINED SCIENCE 0653/63 Paper 6 (Alternative to Practical), maximum raw mark 60 This mark scheme is published as an aid to teachers and candidates, to indicate the requirements of the examination. It shows the basis on which Examiners were instructed to award marks. It does not indicate the details of the discussions that took place at an Examiners’ meeting before marking began, which would have considered the acceptability of alternative answers. Mark schemes should be read in conjunction with the question paper and the Principal Examiner Report for Teachers. Cambridge will not enter into discussions about these mark schemes. Cambridge is publishing the mark schemes for the October/November 2014 series for most Cambridge IGCSE®, Cambridge International A and AS Level components and some Cambridge O Level components.
Mark scheme, page 2
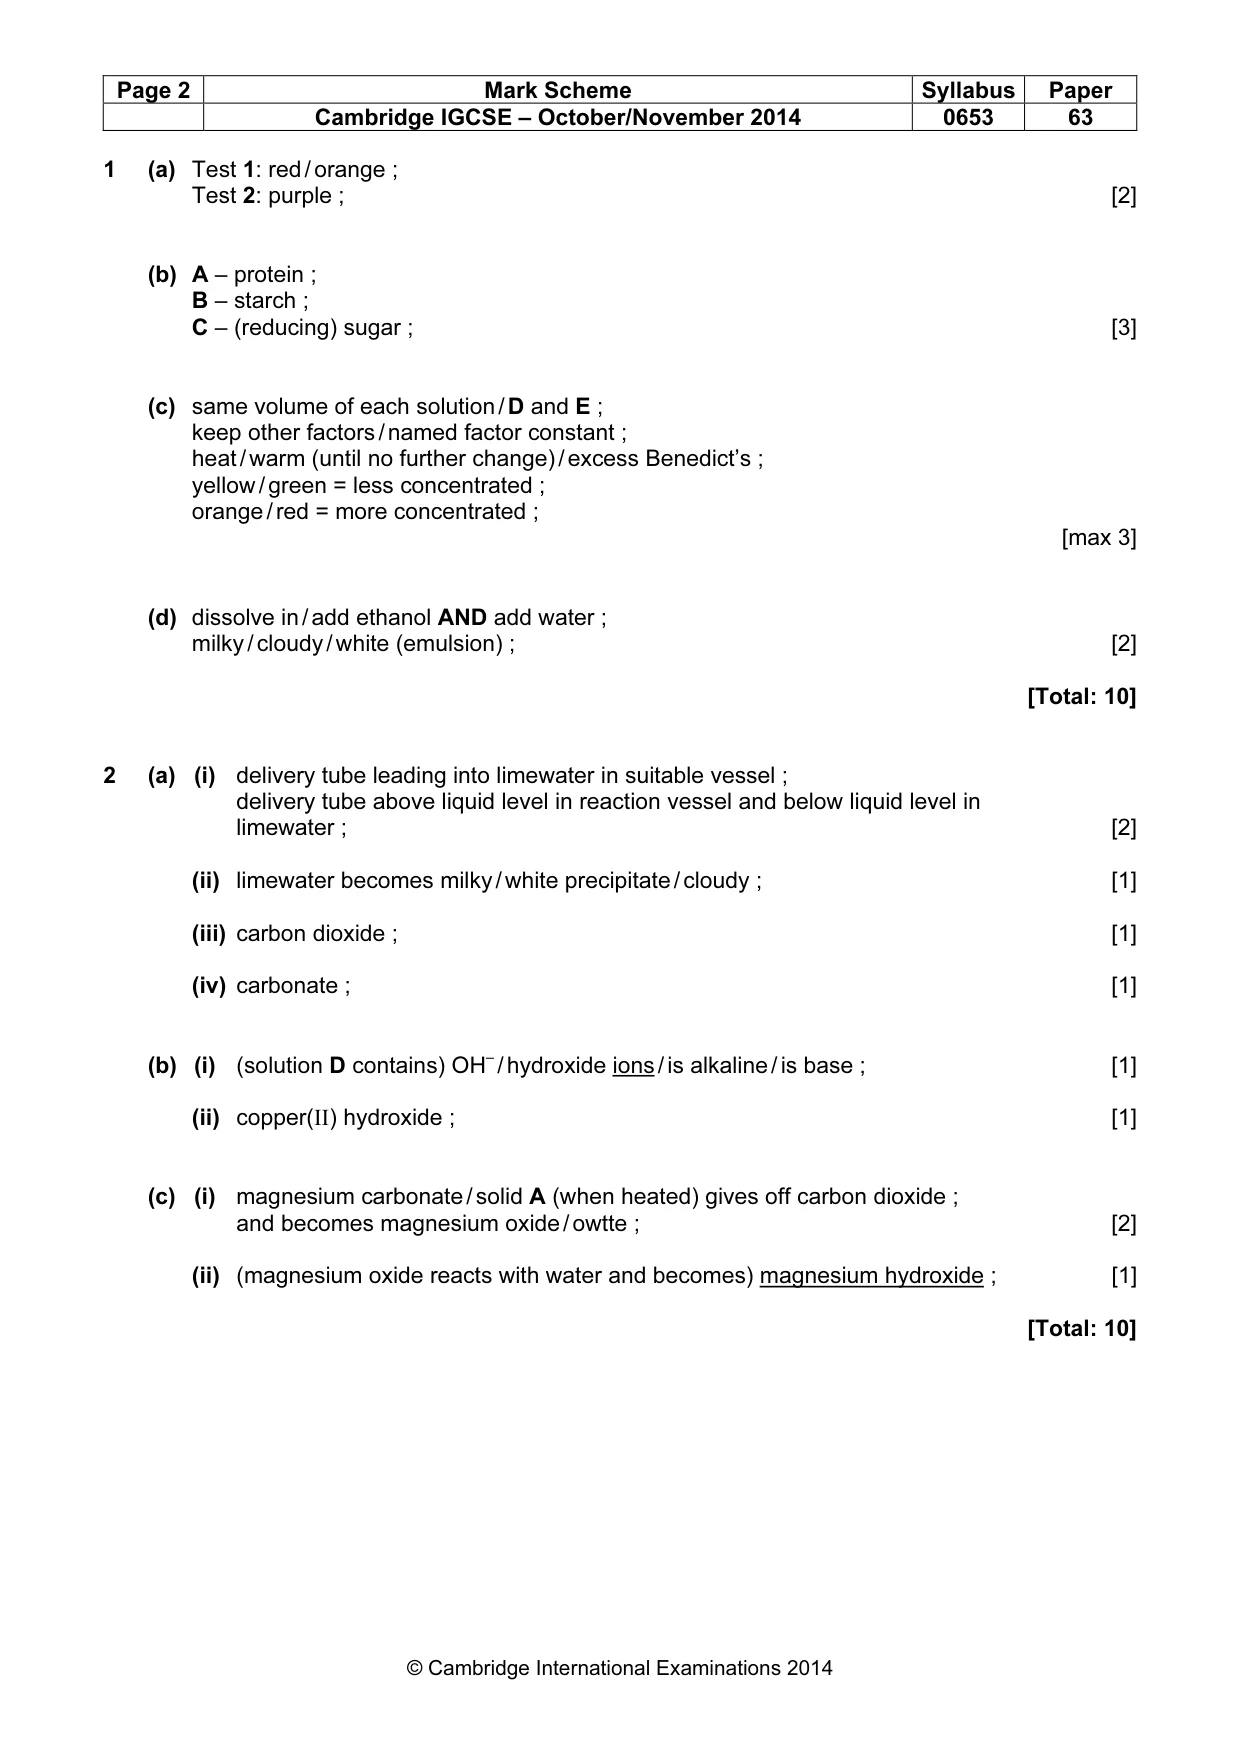
Page 2 Mark Scheme Syllabus Paper Cambridge IGCSE – October/November 2014 0653 63 © Cambridge International Examinations 2014 1 (a) Test 1: red / orange ; Test 2: purple ; [2] (b) A – protein ; B – starch ; C – (reducing) sugar ; [3] (c) same volume of each solution / D and E ; keep other factors / named factor constant ; heat / warm (until no further change) / excess Benedict’s ; yellow / green = less concentrated ; orange / red = more concentrated ; [max 3] (d) dissolve in / add ethanol AND add water ; milky / cloudy / white (emulsion) ; [2] [Total: 10] 2 (a) (i) delivery tube leading into limewater in suitable vessel ; delivery tube above liquid level in reaction vessel and below liquid level in limewater ; [2] (ii) limewater becomes milky / white precipitate / cloudy ; [1] (iii) carbon dioxide ; [1] (iv) carbonate ; [1] (b) (i) (solution D contains) OH– / hydroxide ions / is alkaline / is base ; [1] (ii) copper(II) hydroxide ; [1] (c) (i) magnesium carbonate / solid A (when heated) gives off carbon dioxide ; and becomes magnesium oxide / owtte ; [2] (ii) (magnesium oxide reacts with water and becomes) magnesium hydroxide ; [1] [Total: 10]
Mark scheme, page 3
Page 3 Mark Scheme Syllabus Paper Cambridge IGCSE – October/November 2014 0653 63 © Cambridge International Examinations 2014 3 (a) measuring cylinder ; [1] (b) T2 = 81°C ; T3 = 49°C ; [2] (c) fall, rise, lose, gain (in correct order) ; [1] (d) (i) 27°C / T3 – 22 (ecf) ; [1] (ii) 32°C / T2 – T3 (ecf) ; [1] (e) (i) 13440 J / (d)(ii) × 420 (ecf) ; [1] (ii) 11340 J / (d)(i) × 420 (ecf) ; [1] (iii) 2100 J / (e)(i) – (e)(ii) (ecf) ; [1] (iv) 0.9(15) / 85 × (d)(i) (e)(iii) (ecf) ; [1] [Total: 10] 4 (a) arrow for d to centre of beaker ; [1] (b) ;; (all five correct is 2 marks, three or four correct is 1 mark) [2] (c) suitable linear scale ; 4 correct plots ± 0.5 square ; smooth curve ; [3] Distance Number of bubbles 70 17 50 28 40 43 30 65 20 99
Mark scheme, page 4
Page 4 Mark Scheme Syllabus Paper Cambridge IGCSE – October/November 2014 0653 63 © Cambridge International Examinations 2014 (d) line to show ; correct reading from 60 cm on graph ± 0.5 square ; [2] (e) (i) photosynthesis ; [1] (ii) as light intensity increases rate (of photosynthesis) increases ; [1] [Total: 10] 5 (a) 77 ; 52 ; [2] (b) suitable linear scales chosen with both labelled with the variable and at least one with the correct unit ; 4 correct points plotted ± ½ square ;; smooth curves drawn and at least one labelled ; [4] (c) (i) copper sulfate (no mark) because the temperature rise is greater / more energy released / faster temperature increase ; [1] (ii) there will be a greater temperature rise AND because magnesium is more reactive than zinc / is higher in the electrochemical series ; [1] (d) solid: copper ; solution: zinc sulfate ; [2] [Total: 10] 6 (a) (i) 24 ; [1] (ii) 65 ; 273 ; [2] (iii) density of Al is: 2.7(083333) (ecf) ; density of lead is: 11.4 / 11.375 / 11.38 (ecf) ; [2] (iv) lead atoms are heavier than Al atoms ; [1] (b) (i) length = 8.0 cm width = 3.0 cm height = 2.0 cm ; [1] (ii) 48 cm3 correctly recorded in the table twice ; [1]
Mark scheme, page 5
Page 5 Mark Scheme Syllabus Paper Cambridge IGCSE – October/November 2014 0653 63 © Cambridge International Examinations 2014 (c) (i) the wood has absorbed water ; [1] (ii) there are more air spaces in the balsa wood / balsa wood grows faster so is less dense ; [1] [Total: 10]
What you needed in this session
Cambridge’s own grade thresholds for 2014 Oct/Nov, Paper 6 · Variant 3. A higher threshold means an easier paper — the bar moves with how the cohort did.