Cambridge IGCSE Science - Combined 0653 — 2014 Oct/Nov Paper 6 · Variant 1
0653/61/O/N/14 · 60 marks · ≈68 min
The question paper and its mark scheme, free to read here and free to download. This is Cambridge’s own paper, exactly as it was sat.
Question paper24 pages



Mark scheme4 pages
Answers below. Sit the paper first if you are practising.
Paper as text
Question paper, page 1
This document consists of 21 printed pages and 3 blank pages. IB14 11_0653_61/FP © UCLES 2014 [Turn over *5100026536* Cambridge International Examinations Cambridge International General Certificate of Secondary Education COMBINED SCIENCE 0653/61 Paper 6 Alternative to Practical October/November 2014 1 hour Candidates answer on the Question Paper. No Additional Materials are required. READ THESE INSTRUCTIONS FIRST Write your Centre number, candidate number and name on all the work you hand in. Write in dark blue or black pen. You may use an HB pencil for any diagrams or graphs. Do not use staples, paper clips, glue or correction fluid. DO NOT WRITE IN ANY BARCODES. Answer all questions. Electronic calculators may be used. You may lose marks if you do not show your working or if you do not use appropriate units. At the end of the examination, fasten all your work securely together. The number of marks is given in brackets [ ] at the end of each question or part question.
Question paper, page 2
2 © UCLES 2014 0653/61/O/N/14 BLANK PAGE
Question paper, page 3
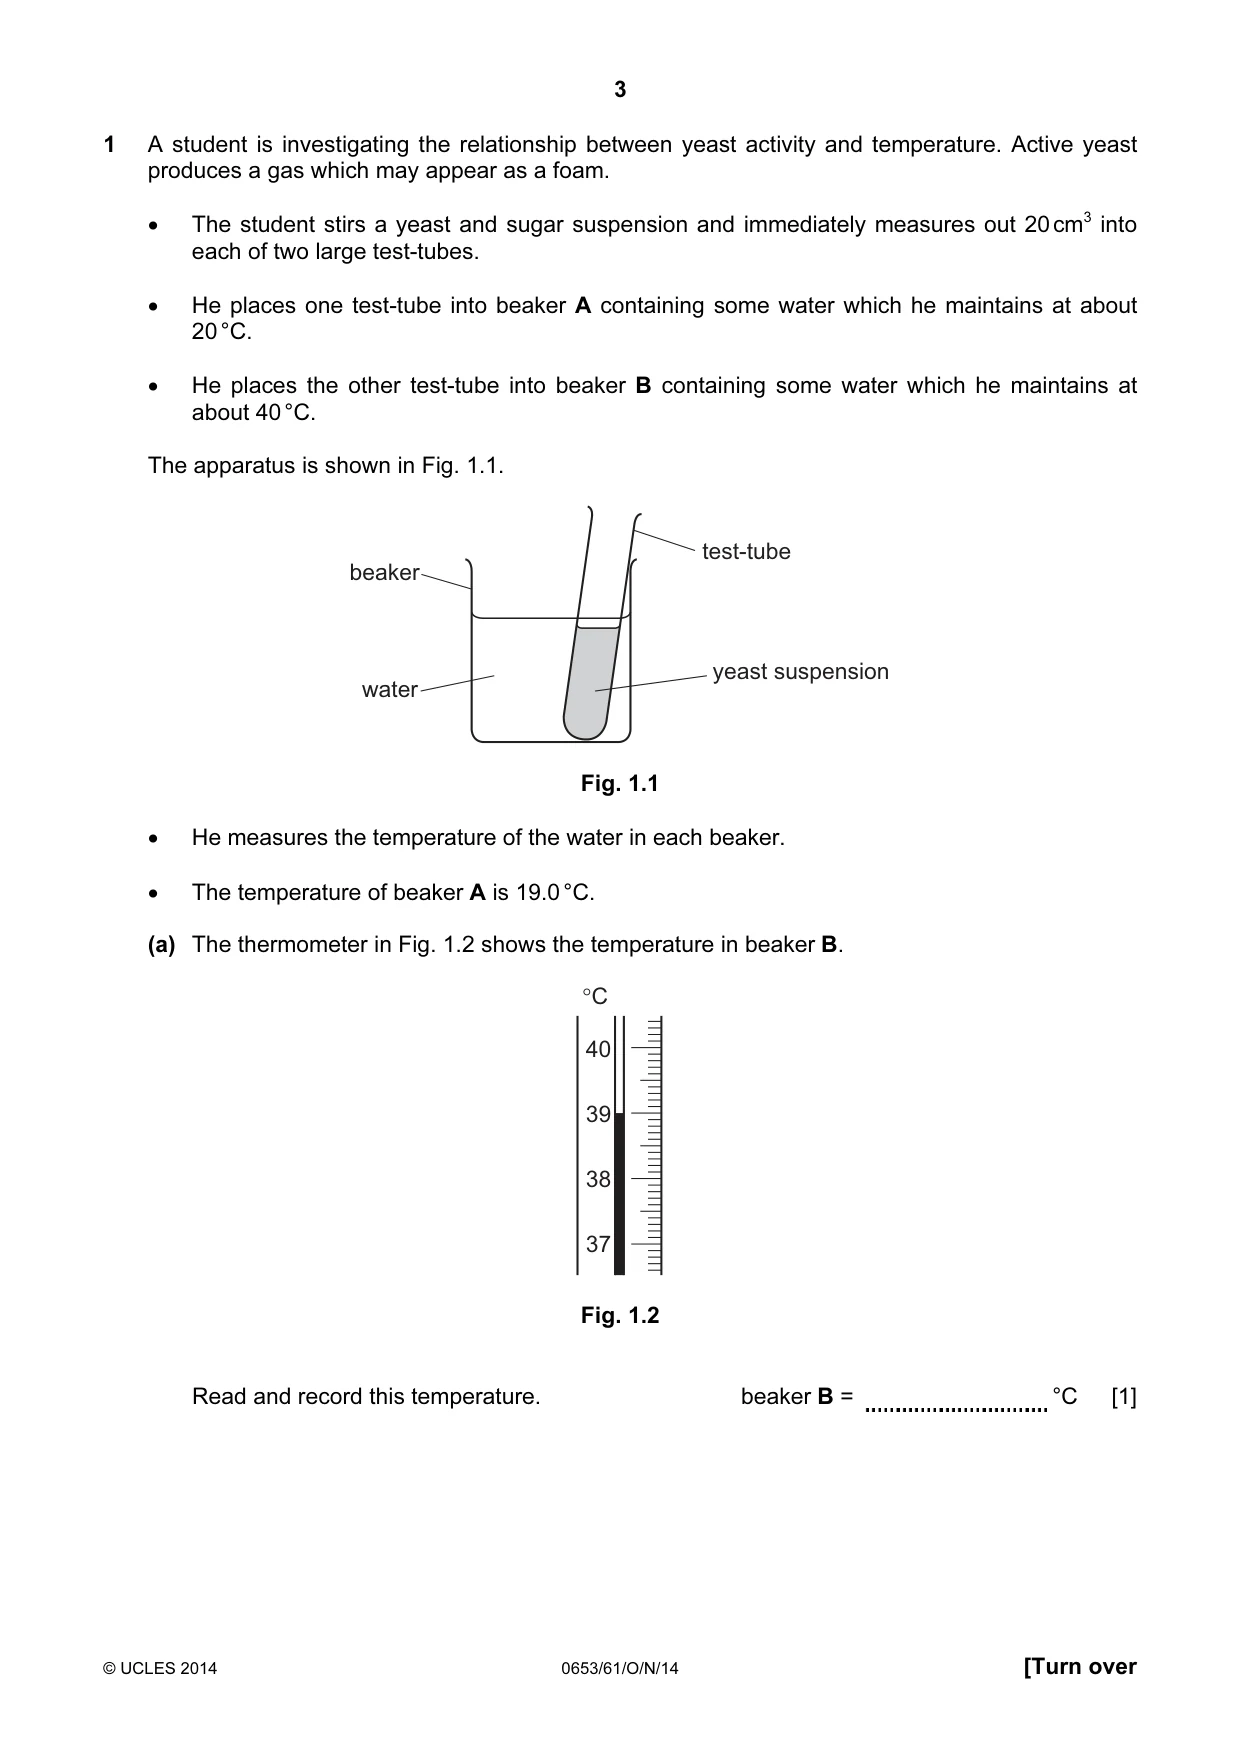
3 © UCLES 2014 0653/61/O/N/14 [Turn over 1 A student is investigating the relationship between yeast activity and temperature. Active yeast produces a gas which may appear as a foam. • The student stirs a yeast and sugar suspension and immediately measures out 20 cm3 into each of two large test-tubes. • He places one test-tube into beaker A containing some water which he maintains at about 20 °C. • He places the other test-tube into beaker B containing some water which he maintains at about 40 °C. The apparatus is shown in Fig. 1.1. beaker water test-tube yeast suspension Fig. 1.1 • He measures the temperature of the water in each beaker. • The temperature of beaker A is 19.0 °C. (a) The thermometer in Fig. 1.2 shows the temperature in beaker B. 40 39 38 37 °C Fig. 1.2 Read and record this temperature. beaker B = °C [1]
Question paper, page 4
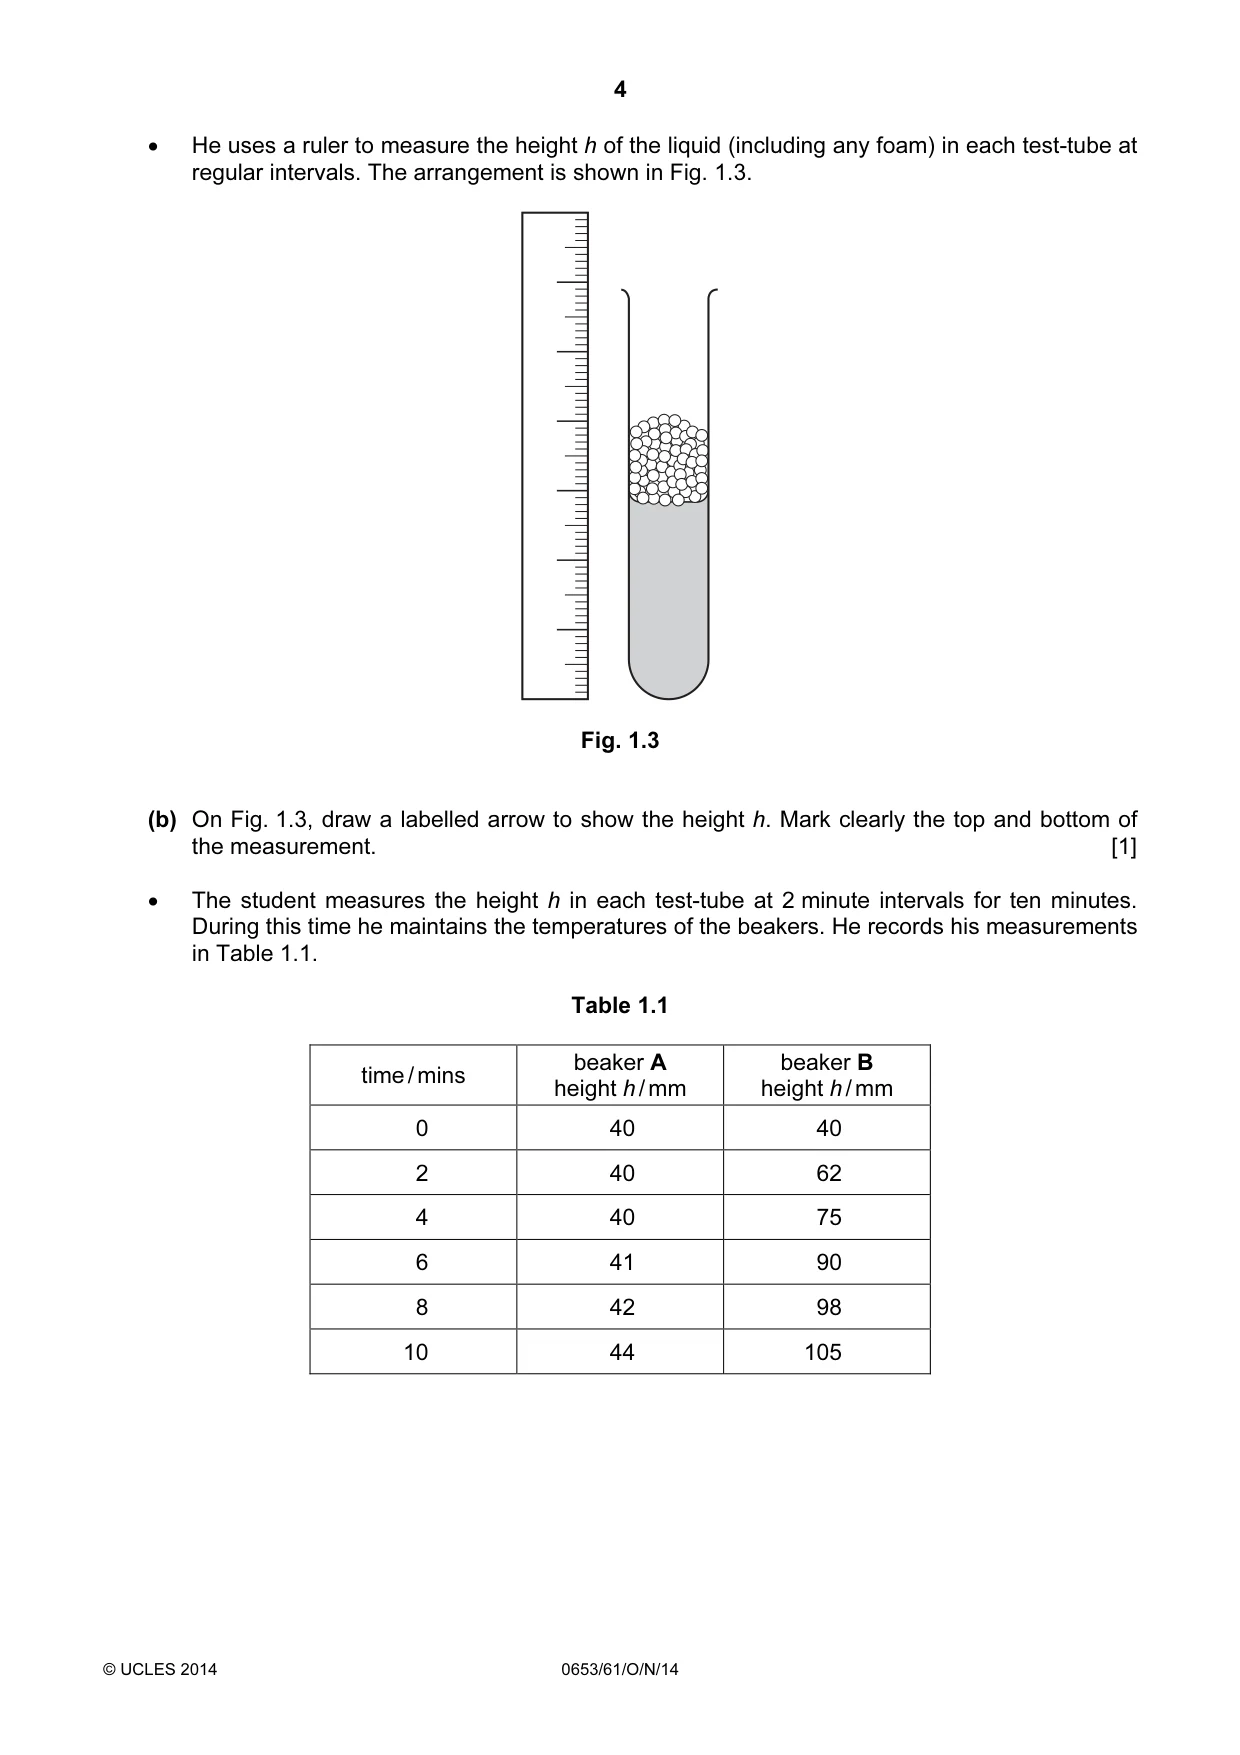
4 © UCLES 2014 0653/61/O/N/14 • He uses a ruler to measure the height h of the liquid (including any foam) in each test-tube at regular intervals. The arrangement is shown in Fig. 1.3. Fig. 1.3 (b) On Fig. 1.3, draw a labelled arrow to show the height h. Mark clearly the top and bottom of the measurement. [1] • The student measures the height h in each test-tube at 2 minute intervals for ten minutes. During this time he maintains the temperatures of the beakers. He records his measurements in Table 1.1. Table 1.1 time / mins beaker A height h / mm beaker B height h / mm 0 40 40 2 40 62 4 40 75 6 41 90 8 42 98 10 44 105
Question paper, page 5
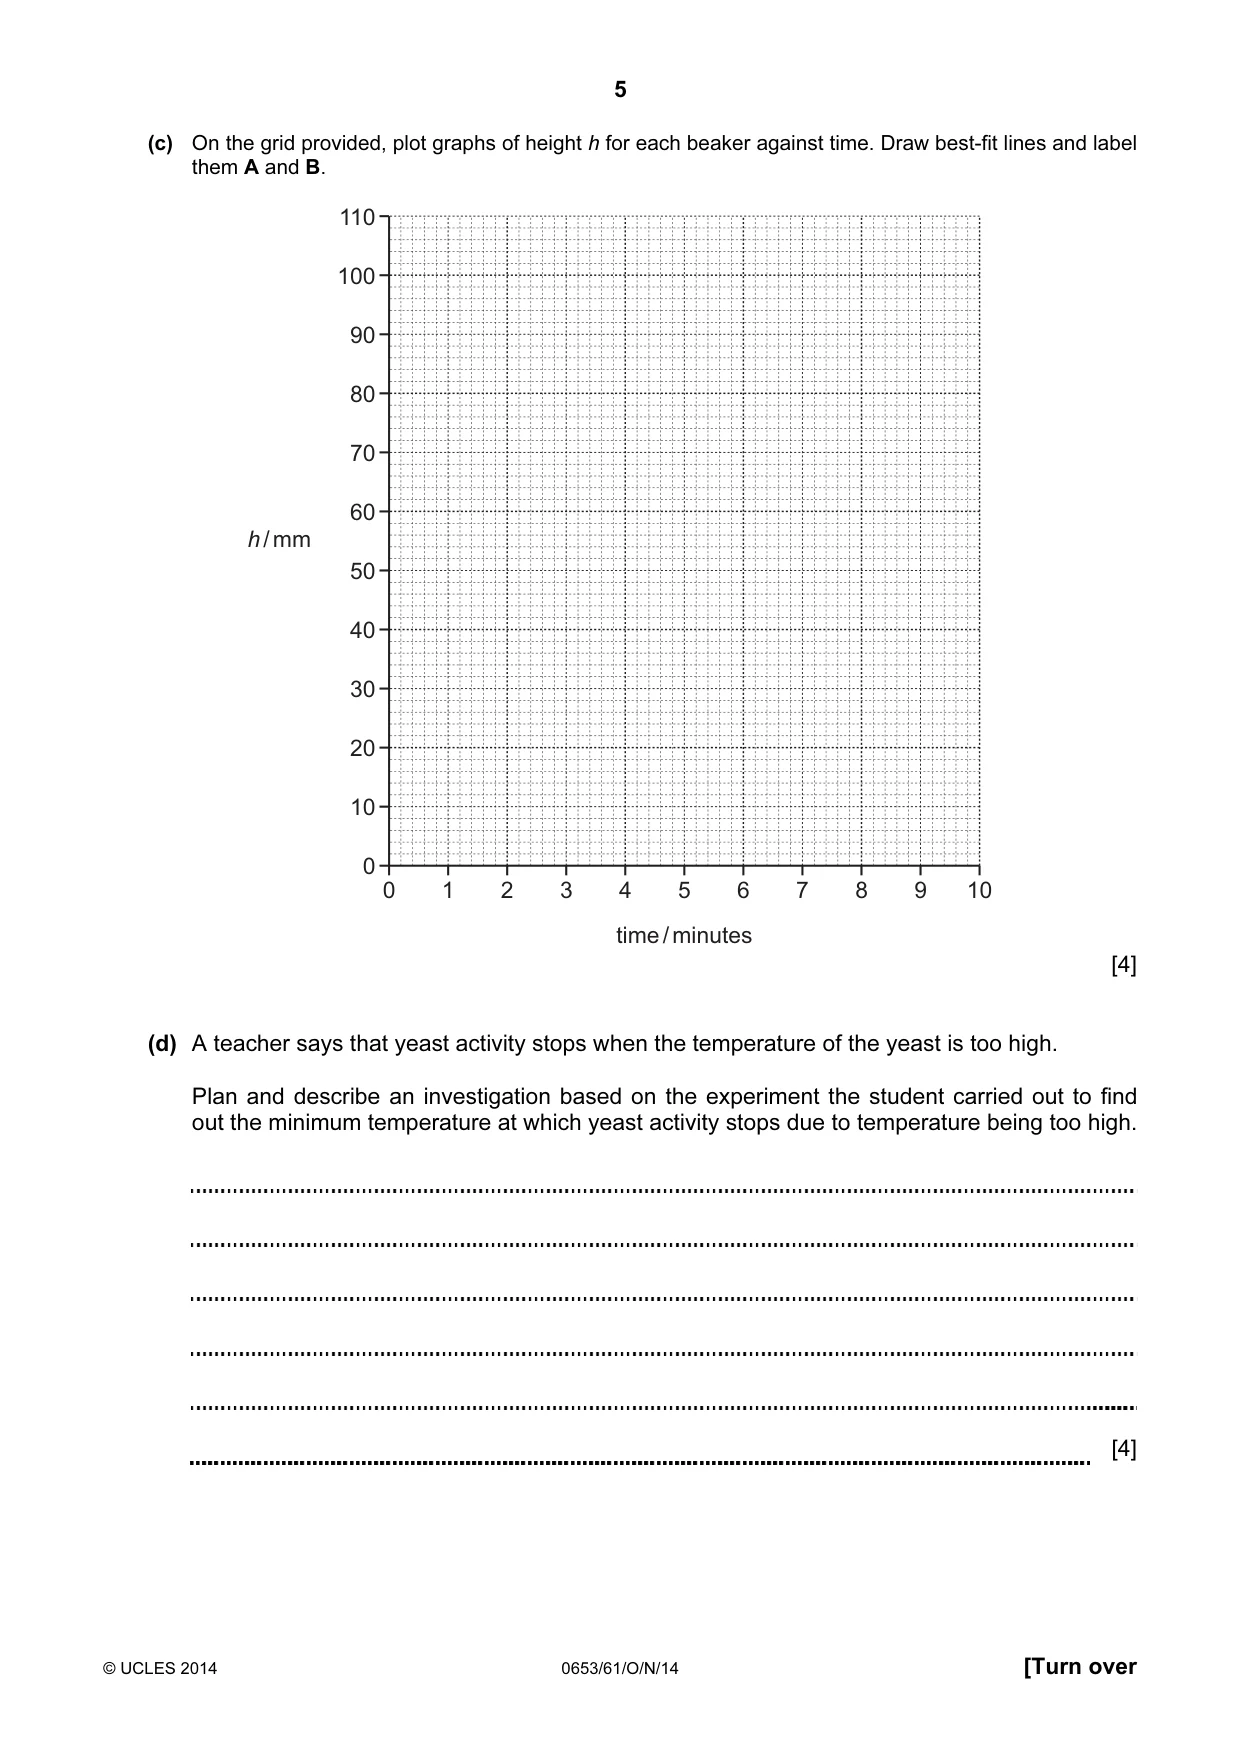
5 © UCLES 2014 0653/61/O/N/14 [Turn over (c) On the grid provided, plot graphs of height h for each beaker against time. Draw best-fit lines and label them A and B. 0 1 2 3 4 5 time / minutes 6 7 8 9 10 110 100 90 80 70 60 50 40 30 20 10 0 h / mm [4] (d) A teacher says that yeast activity stops when the temperature of the yeast is too high. Plan and describe an investigation based on the experiment the student carried out to find out the minimum temperature at which yeast activity stops due to temperature being too high. [4]
Question paper, page 6
6 © UCLES 2014 0653/61/O/N/14 BLANK PAGE
Question paper, page 7
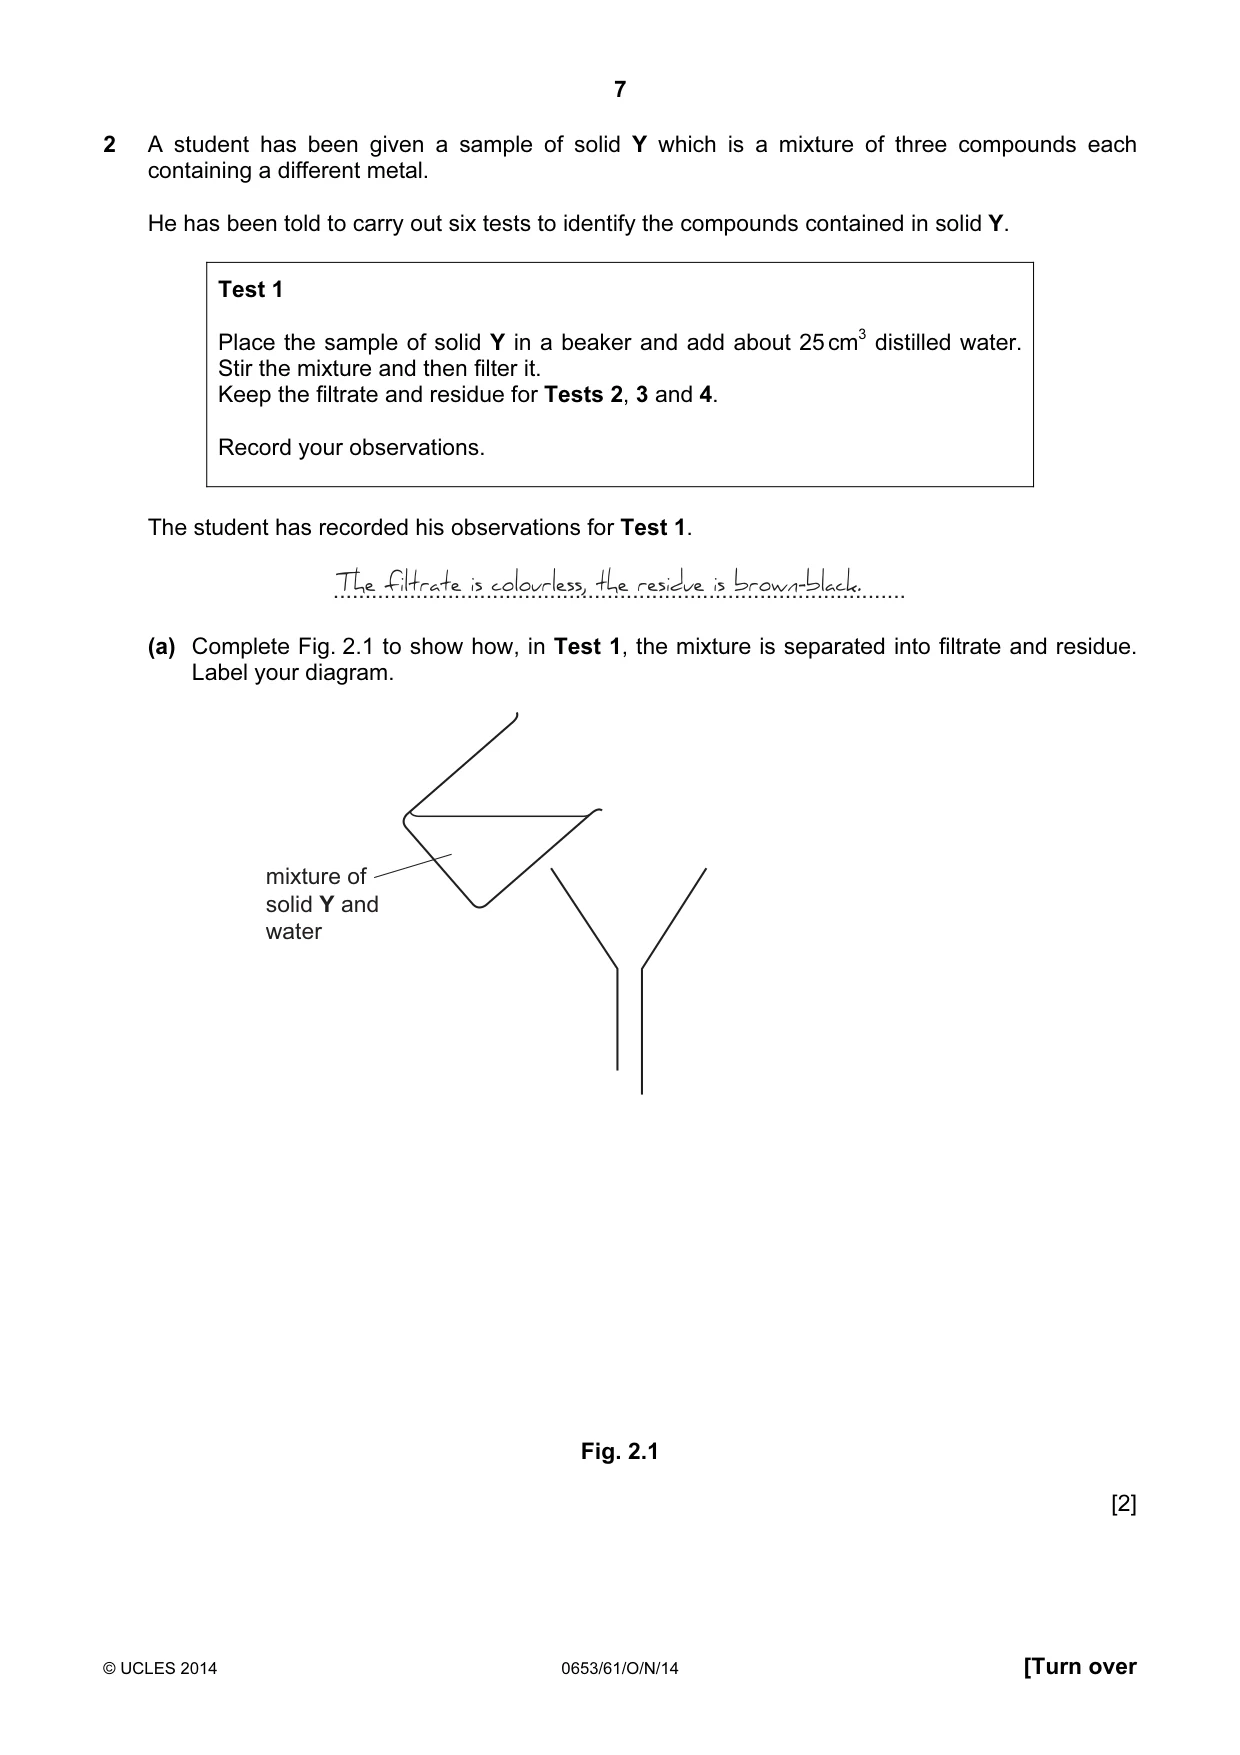
7 © UCLES 2014 0653/61/O/N/14 [Turn over 2 A student has been given a sample of solid Y which is a mixture of three compounds each containing a different metal. He has been told to carry out six tests to identify the compounds contained in solid Y. Test 1 Place the sample of solid Y in a beaker and add about 25 cm3 distilled water. Stir the mixture and then filter it. Keep the filtrate and residue for Tests 2, 3 and 4. Record your observations. The student has recorded his observations for Test 1. … The filtrate is colourless, the residue is brown-black. (a) Complete Fig. 2.1 to show how, in Test 1, the mixture is separated into filtrate and residue. Label your diagram. mixture of solid Y and water Fig. 2.1 [2]
Question paper, page 8
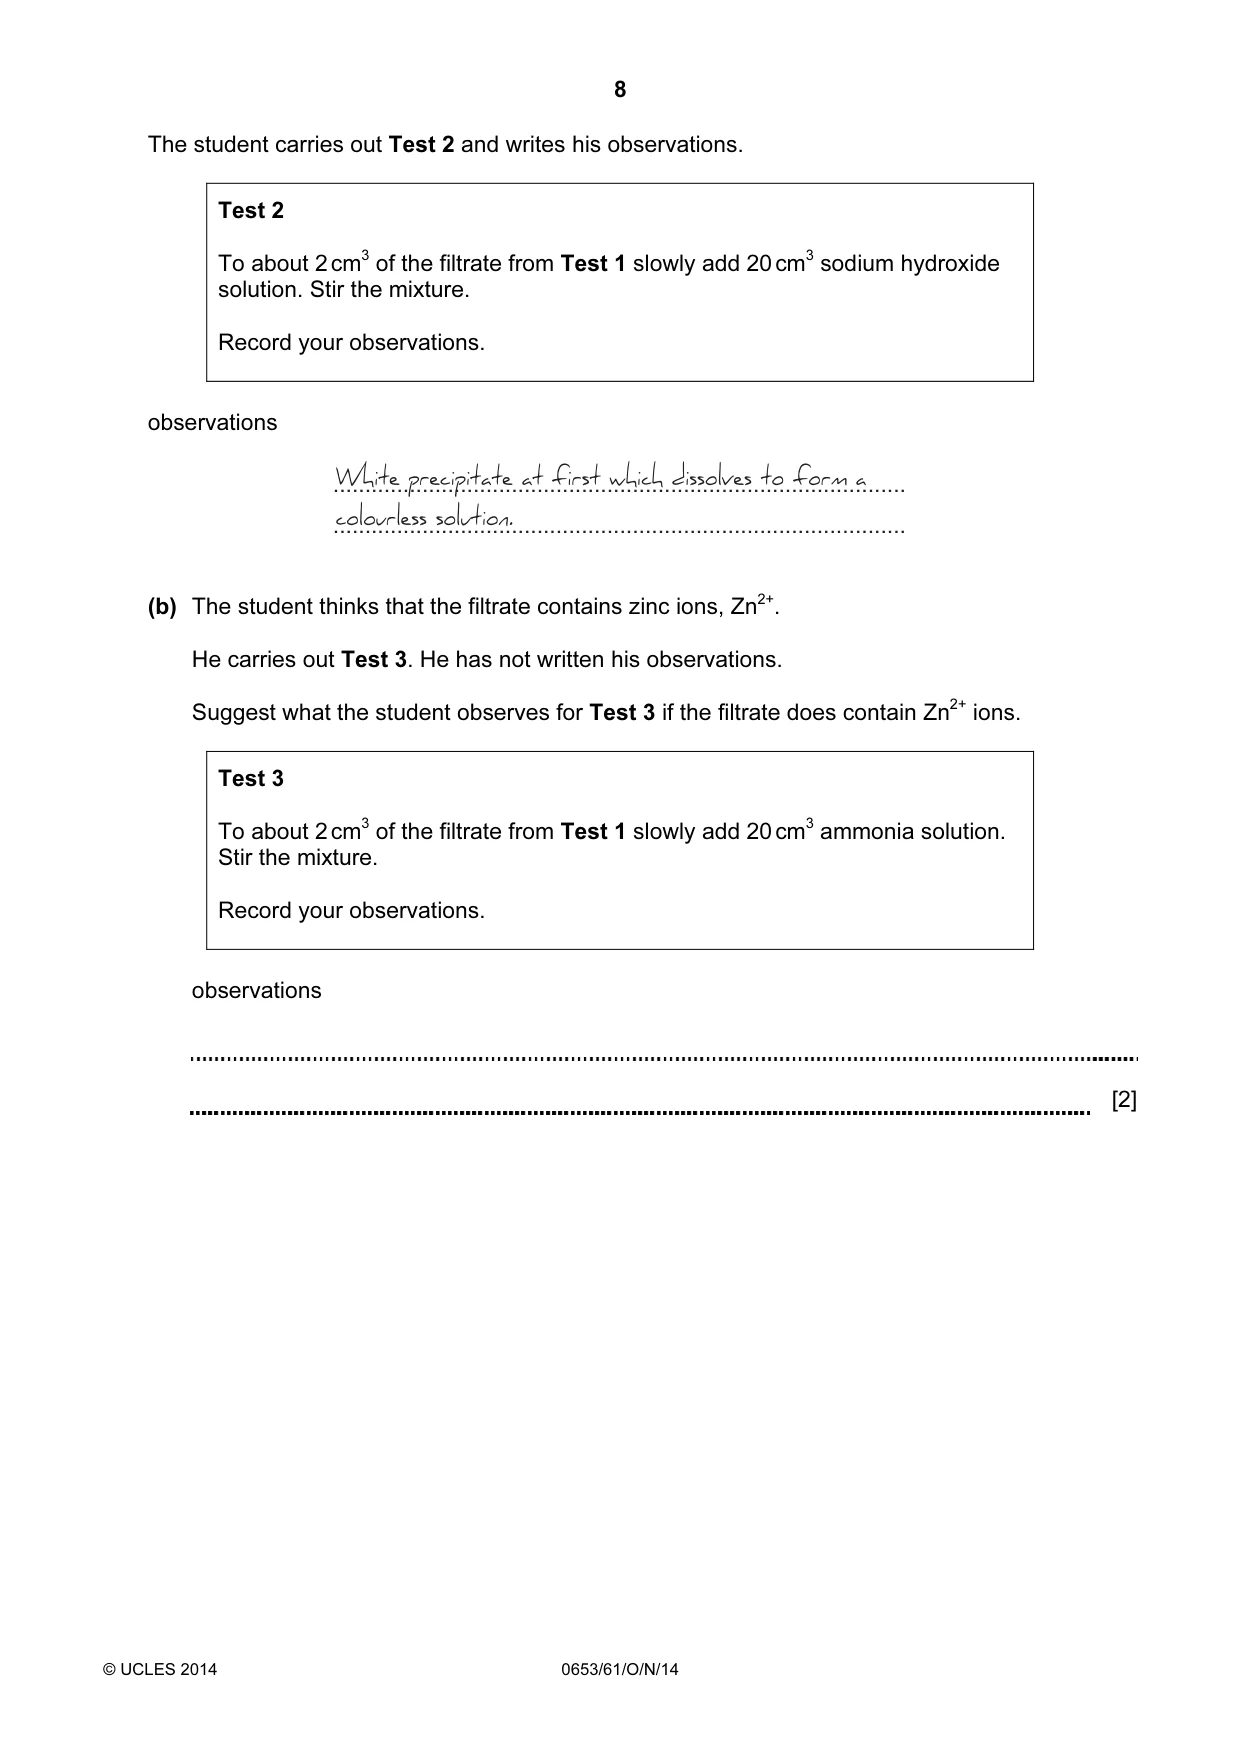
8 © UCLES 2014 0653/61/O/N/14 The student carries out Test 2 and writes his observations. Test 2 To about 2 cm3 of the filtrate from Test 1 slowly add 20 cm3 sodium hydroxide solution. Stir the mixture. Record your observations. observations … … White precipitate at first which dissolves to form a colourless solution. (b) The student thinks that the filtrate contains zinc ions, Zn2+. He carries out Test 3. He has not written his observations. Suggest what the student observes for Test 3 if the filtrate does contain Zn2+ ions. Test 3 To about 2 cm3 of the filtrate from Test 1 slowly add 20 cm3 ammonia solution. Stir the mixture. Record your observations. observations [2]
Question paper, page 9
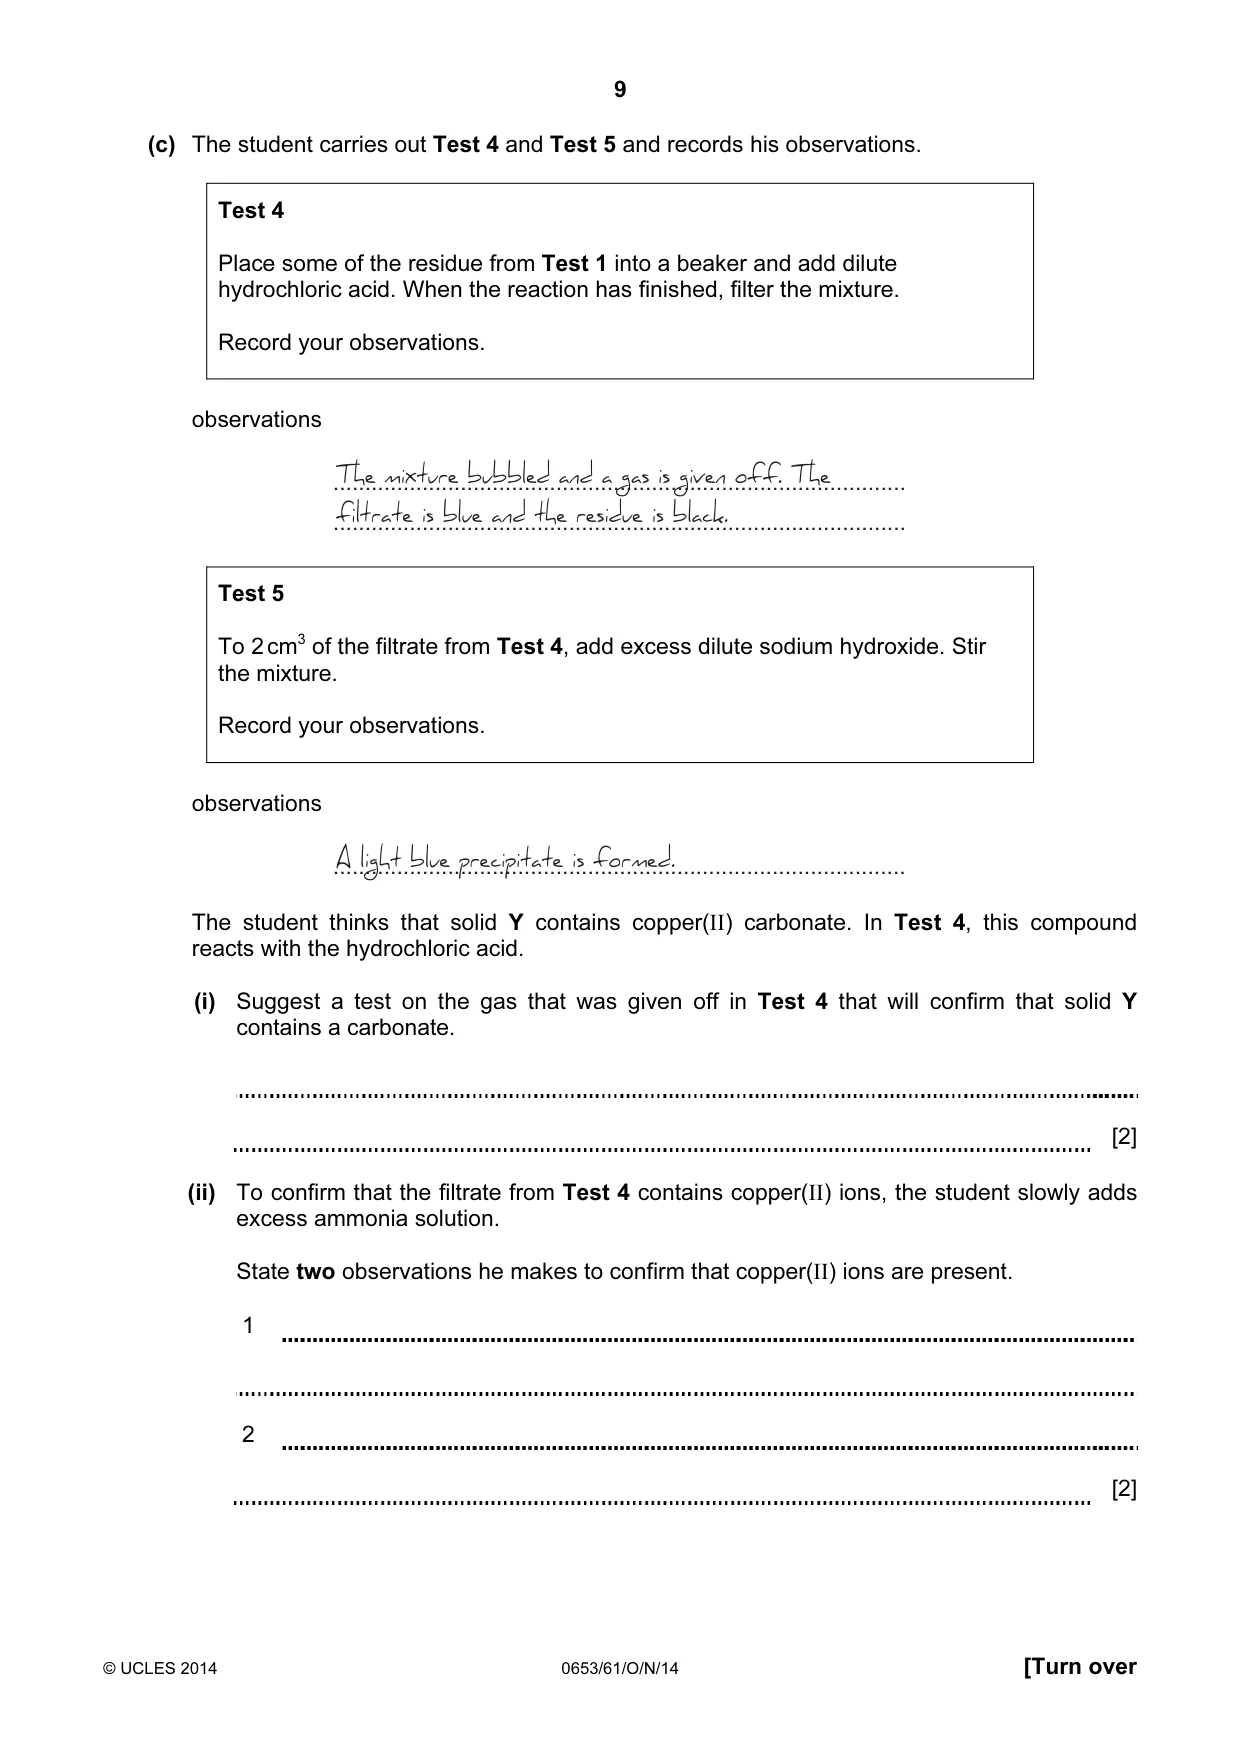
9 © UCLES 2014 0653/61/O/N/14 [Turn over (c) The student carries out Test 4 and Test 5 and records his observations. Test 4 Place some of the residue from Test 1 into a beaker and add dilute hydrochloric acid. When the reaction has finished, filter the mixture. Record your observations. observations … … The mixture bubbled and a gas is given off. The filtrate is blue and the residue is black. Test 5 To 2 cm3 of the filtrate from Test 4, add excess dilute sodium hydroxide. Stir the mixture. Record your observations. observations … A light blue precipitate is formed. The student thinks that solid Y contains copper(II) carbonate. In Test 4, this compound reacts with the hydrochloric acid. (i) Suggest a test on the gas that was given off in Test 4 that will confirm that solid Y contains a carbonate. [2] (ii) To confirm that the filtrate from Test 4 contains copper(II) ions, the student slowly adds excess ammonia solution. State two observations he makes to confirm that copper(II) ions are present. 1 2 [2]
Question paper, page 10
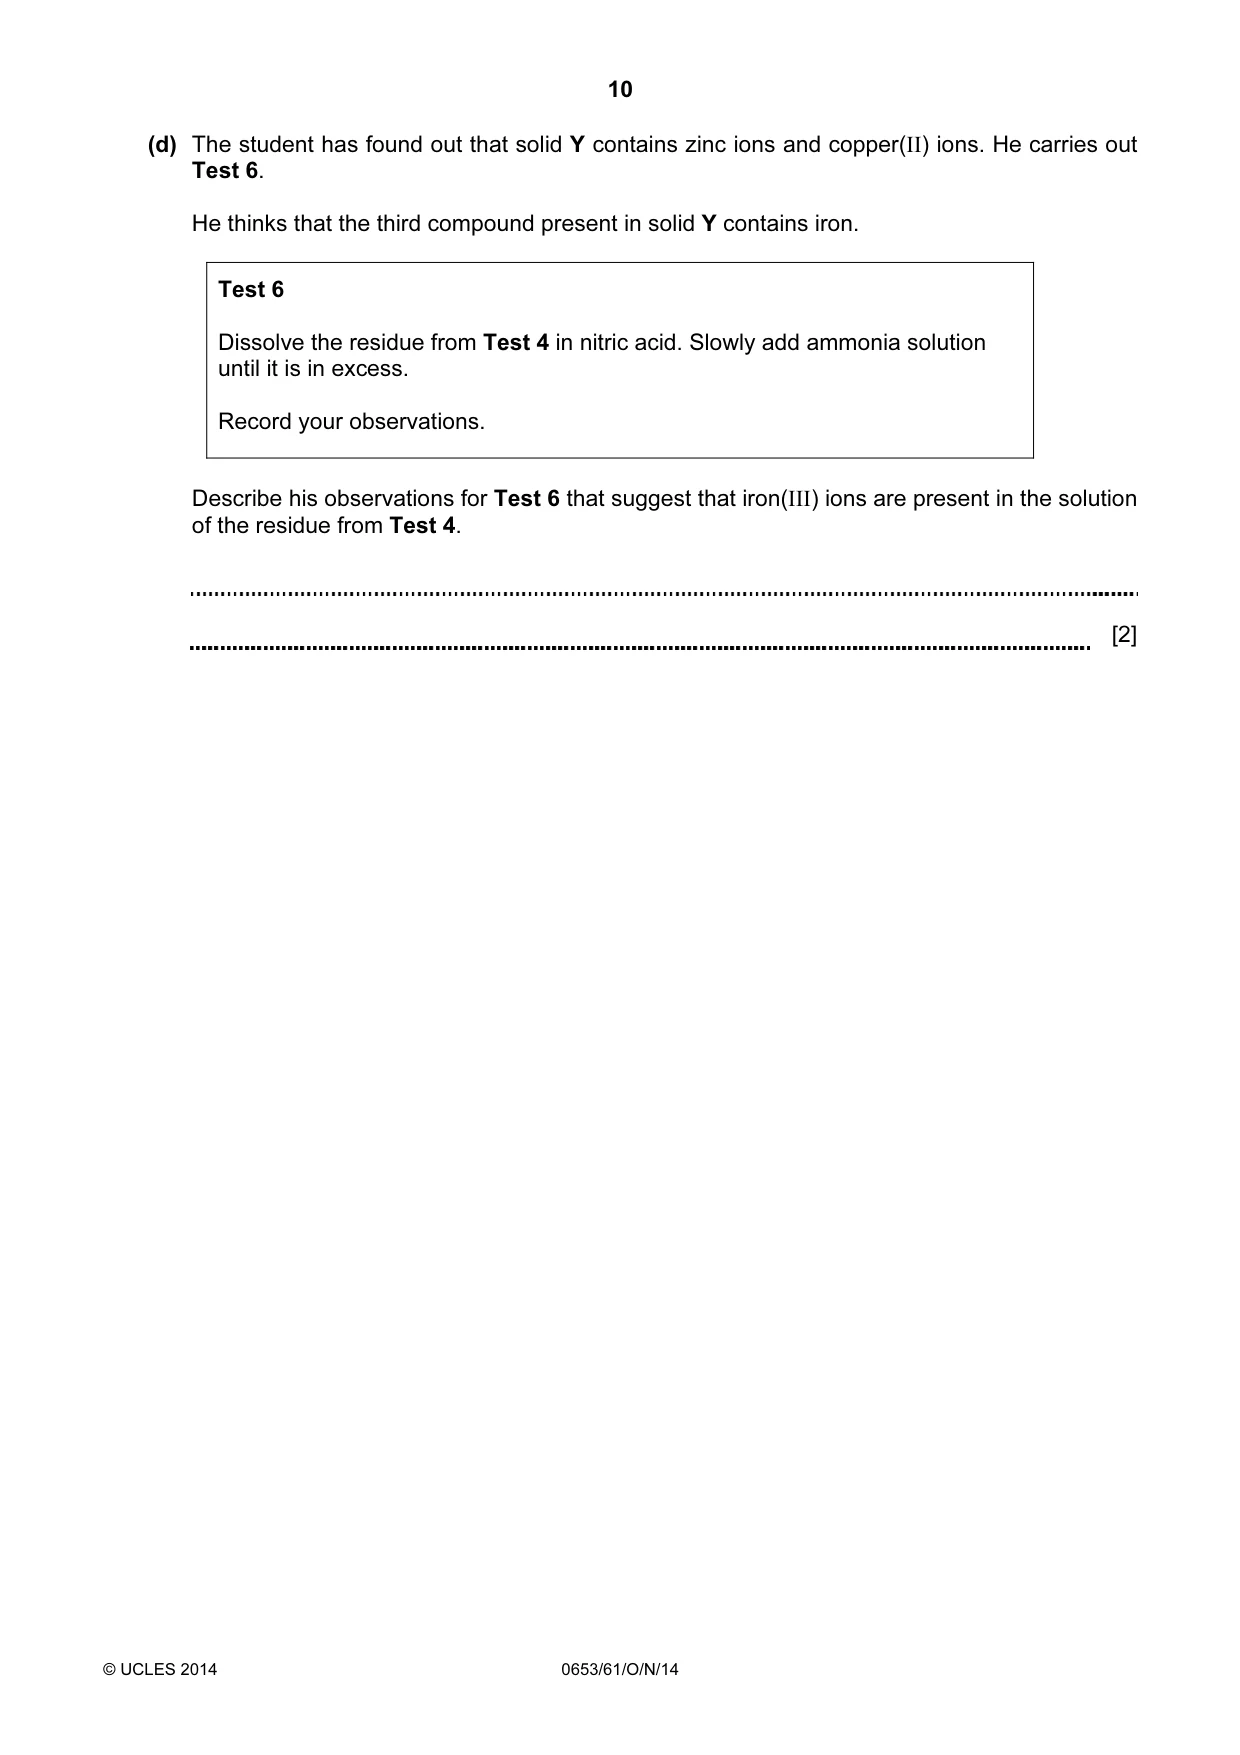
10 © UCLES 2014 0653/61/O/N/14 (d) The student has found out that solid Y contains zinc ions and copper(II) ions. He carries out Test 6. He thinks that the third compound present in solid Y contains iron. Test 6 Dissolve the residue from Test 4 in nitric acid. Slowly add ammonia solution until it is in excess. Record your observations. Describe his observations for Test 6 that suggest that iron(III) ions are present in the solution of the residue from Test 4. [2]
Question paper, page 11
11 © UCLES 2014 0653/61/O/N/14 [Turn over Please turn over for Question 3.
Question paper, page 12
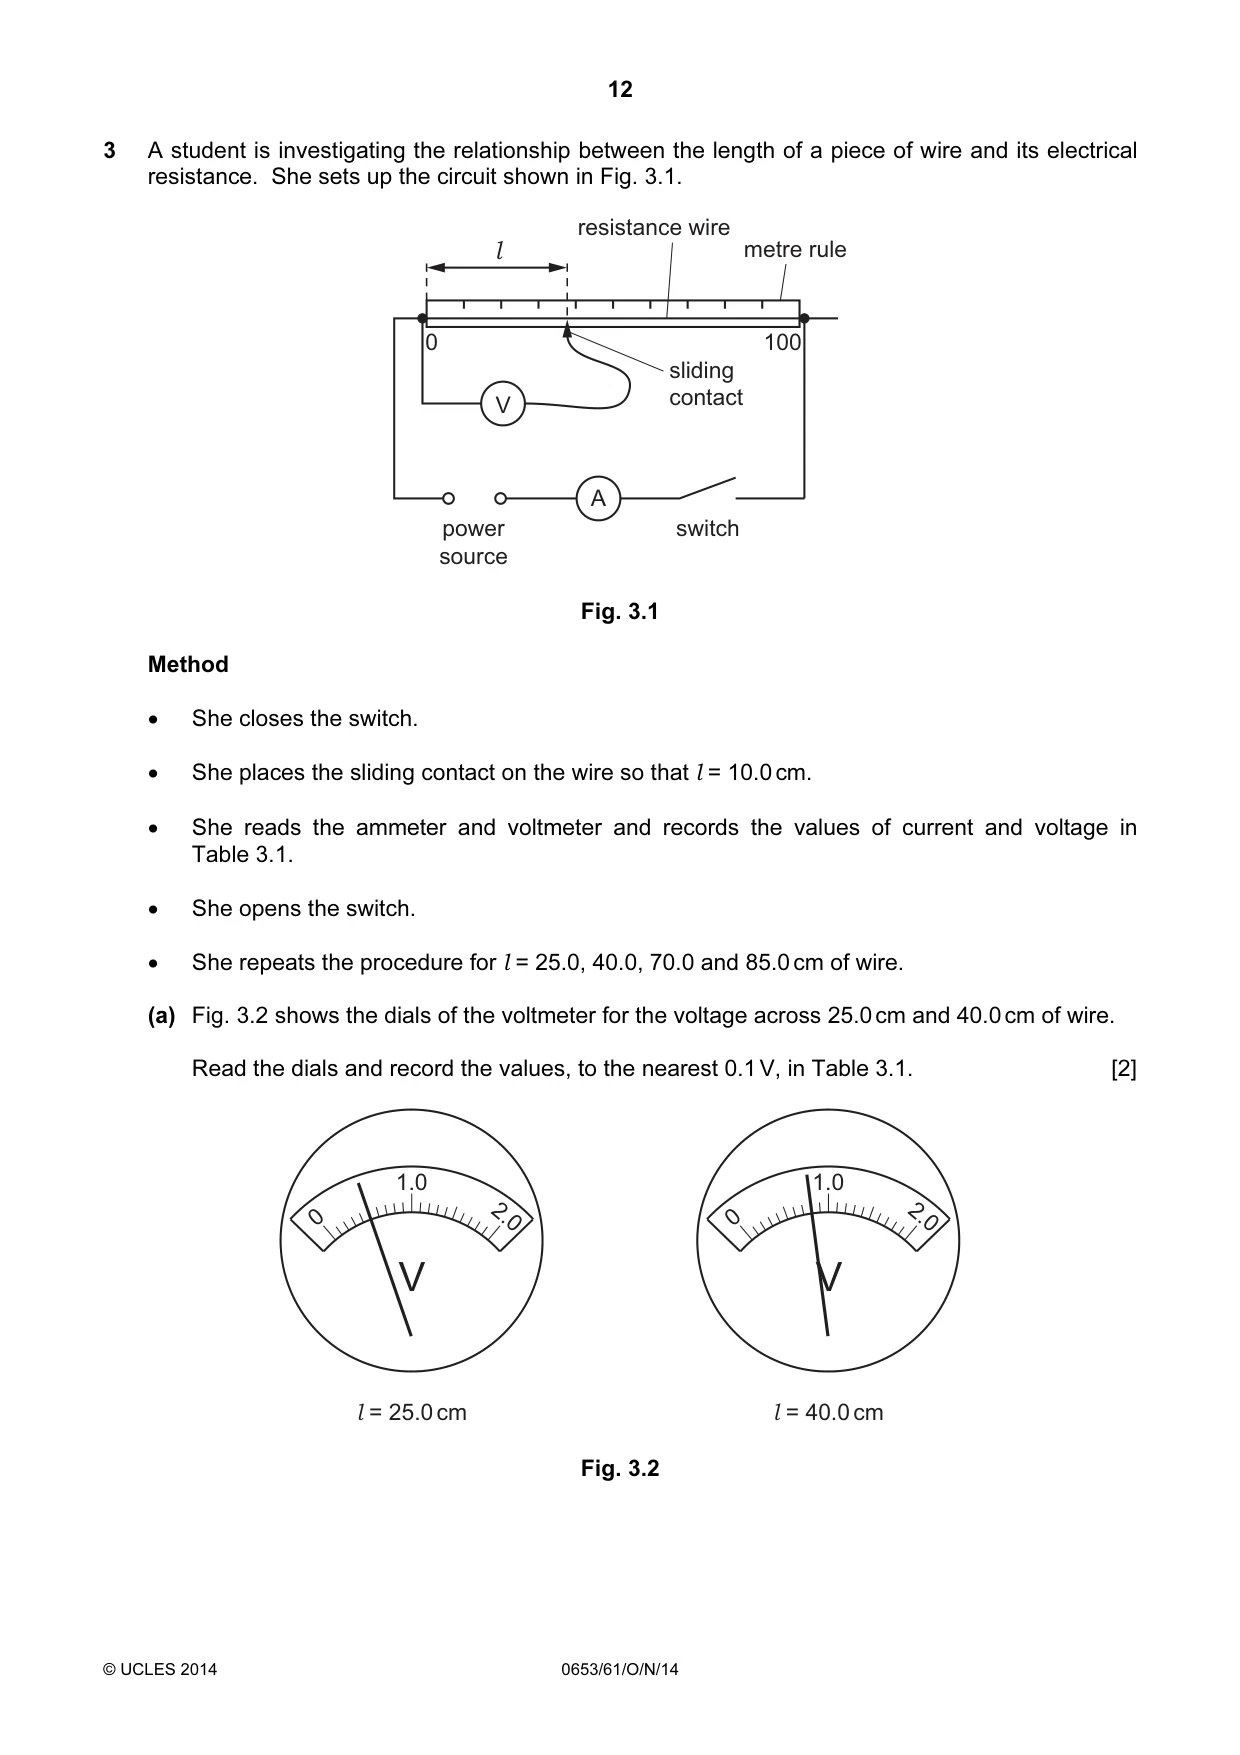
12 © UCLES 2014 0653/61/O/N/14 3 A student is investigating the relationship between the length of a piece of wire and its electrical resistance. She sets up the circuit shown in Fig. 3.1. A V l power source switch sliding contact resistance wire metre rule 0 100 Fig. 3.1 Method • She closes the switch. • She places the sliding contact on the wire so that l = 10.0 cm. • She reads the ammeter and voltmeter and records the values of current and voltage in Table 3.1. • She opens the switch. • She repeats the procedure for l = 25.0, 40.0, 70.0 and 85.0 cm of wire. (a) Fig. 3.2 shows the dials of the voltmeter for the voltage across 25.0 cm and 40.0 cm of wire. Read the dials and record the values, to the nearest 0.1 V, in Table 3.1. [2] V 1.0 l = 25.0 cm 2.0 0 V 1.0 l = 40.0 cm 2.0 0 Fig. 3.2
Question paper, page 13
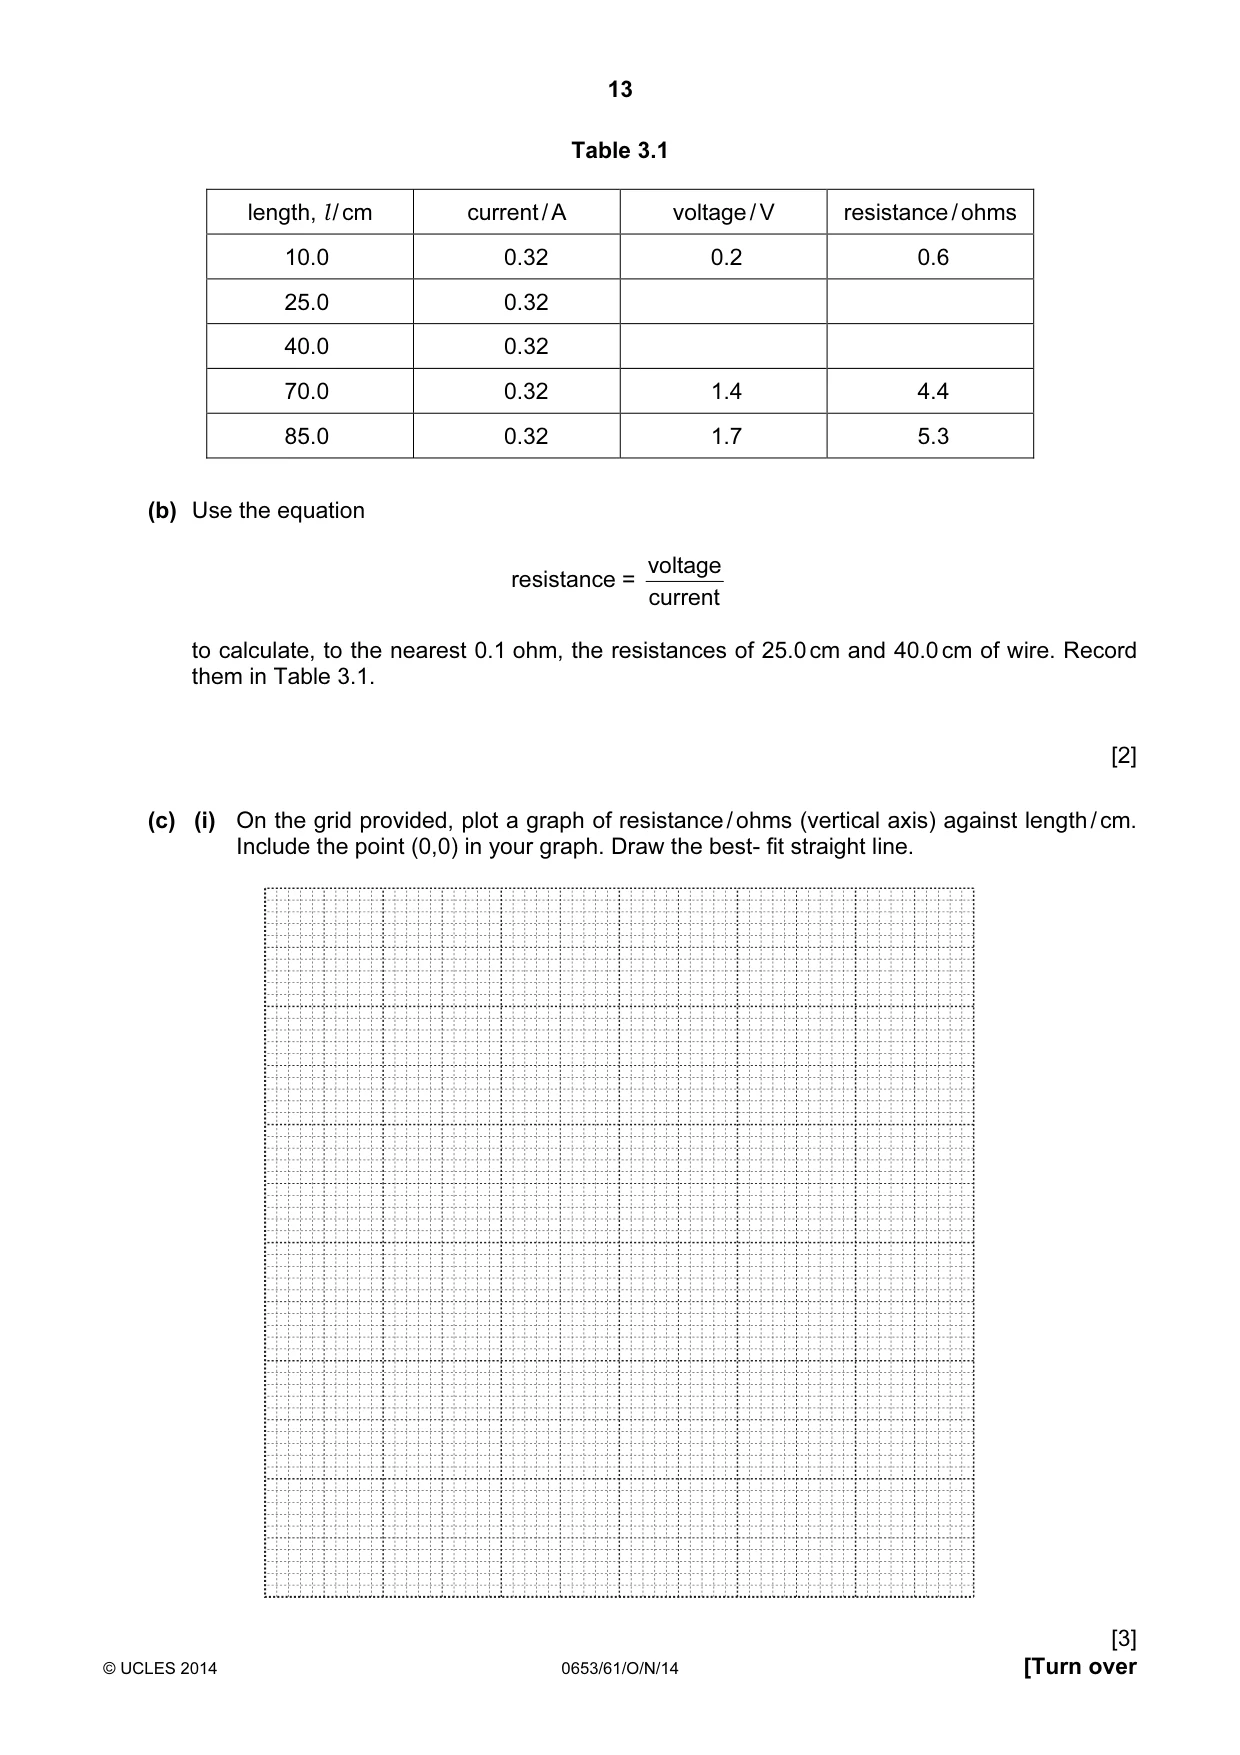
13 © UCLES 2014 0653/61/O/N/14 [Turn over Table 3.1 length, l / cm current / A voltage / V resistance / ohms 10.0 0.32 0.2 0.6 25.0 0.32 40.0 0.32 70.0 0.32 1.4 4.4 85.0 0.32 1.7 5.3 (b) Use the equation resistance = current voltage to calculate, to the nearest 0.1 ohm, the resistances of 25.0 cm and 40.0 cm of wire. Record them in Table 3.1. [2] (c) (i) On the grid provided, plot a graph of resistance / ohms (vertical axis) against length / cm. Include the point (0,0) in your graph. Draw the best- fit straight line. [3]
Question paper, page 14
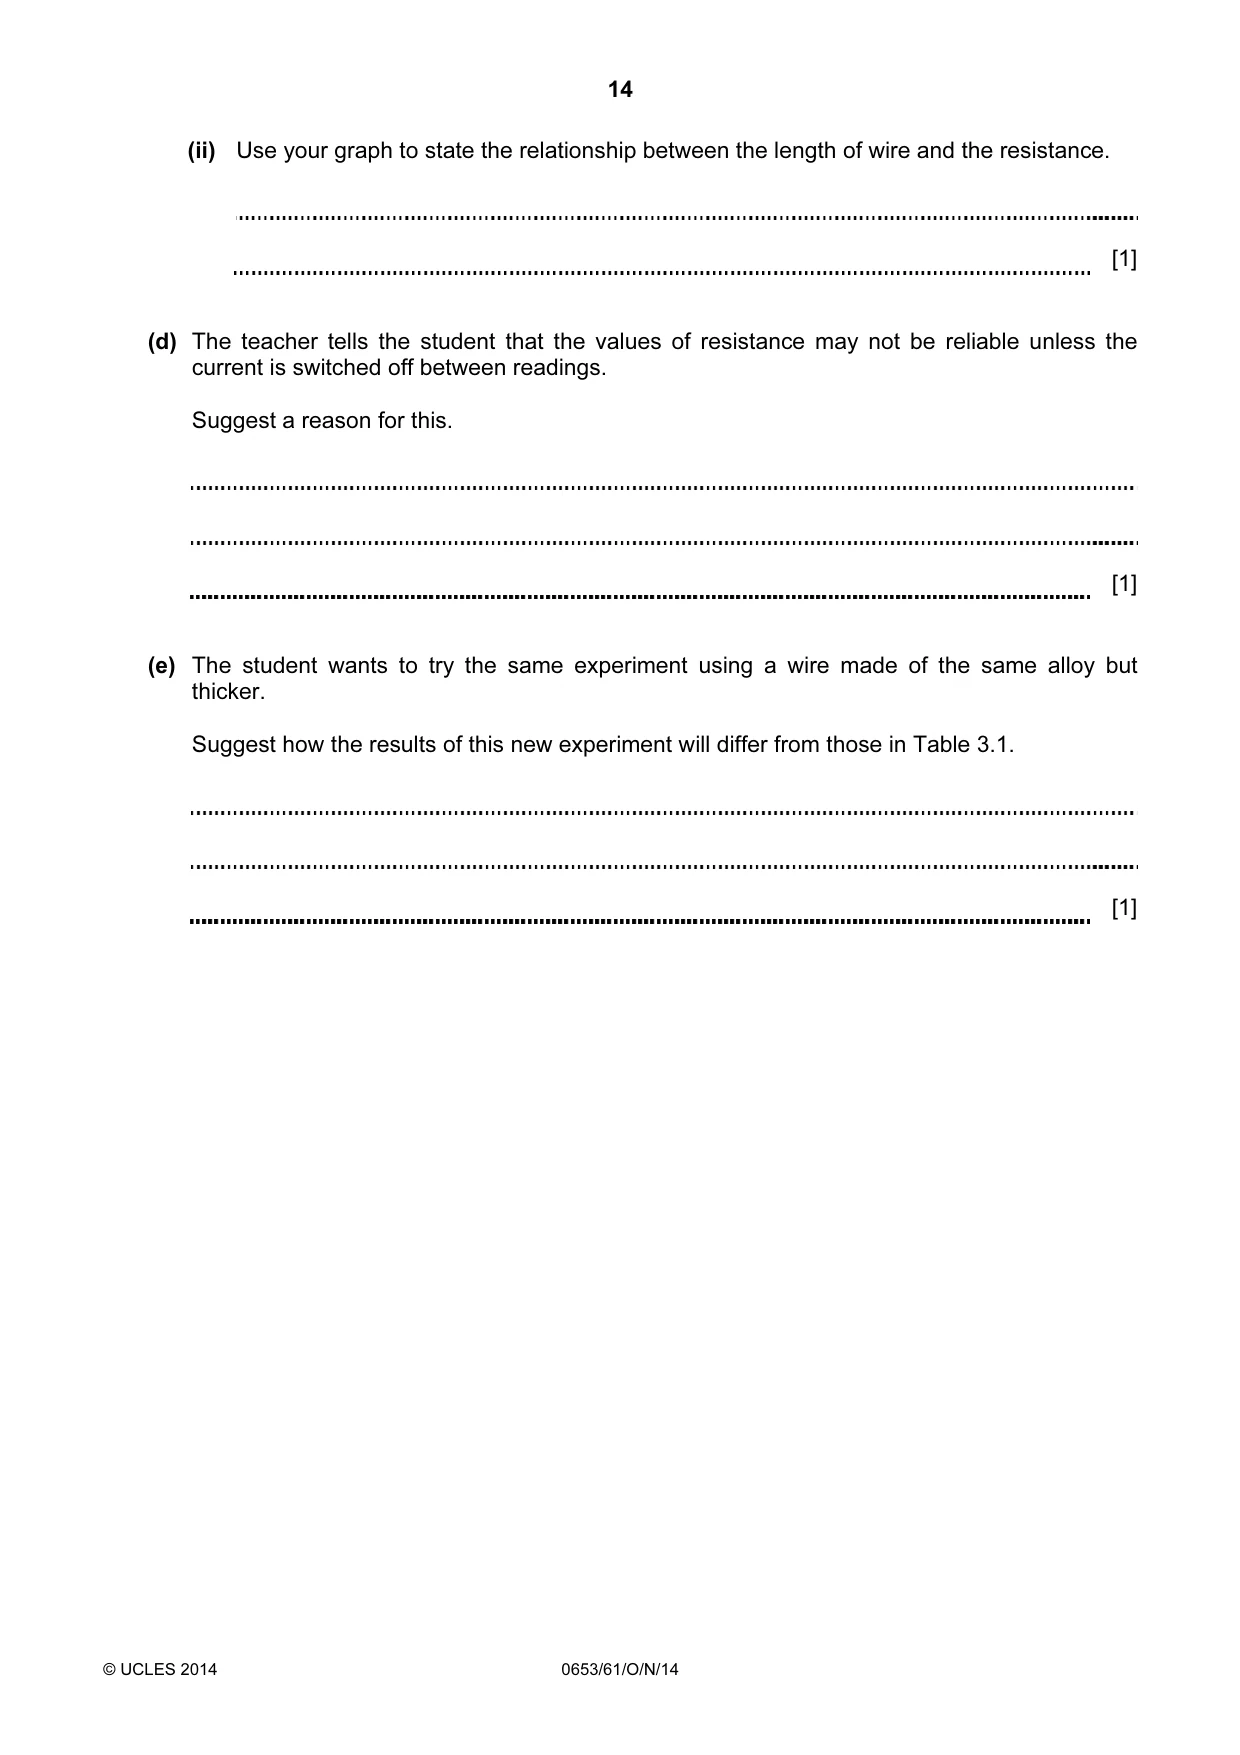
14 © UCLES 2014 0653/61/O/N/14 (ii) Use your graph to state the relationship between the length of wire and the resistance. [1] (d) The teacher tells the student that the values of resistance may not be reliable unless the current is switched off between readings. Suggest a reason for this. [1] (e) The student wants to try the same experiment using a wire made of the same alloy but thicker. Suggest how the results of this new experiment will differ from those in Table 3.1. [1]
Question paper, page 15
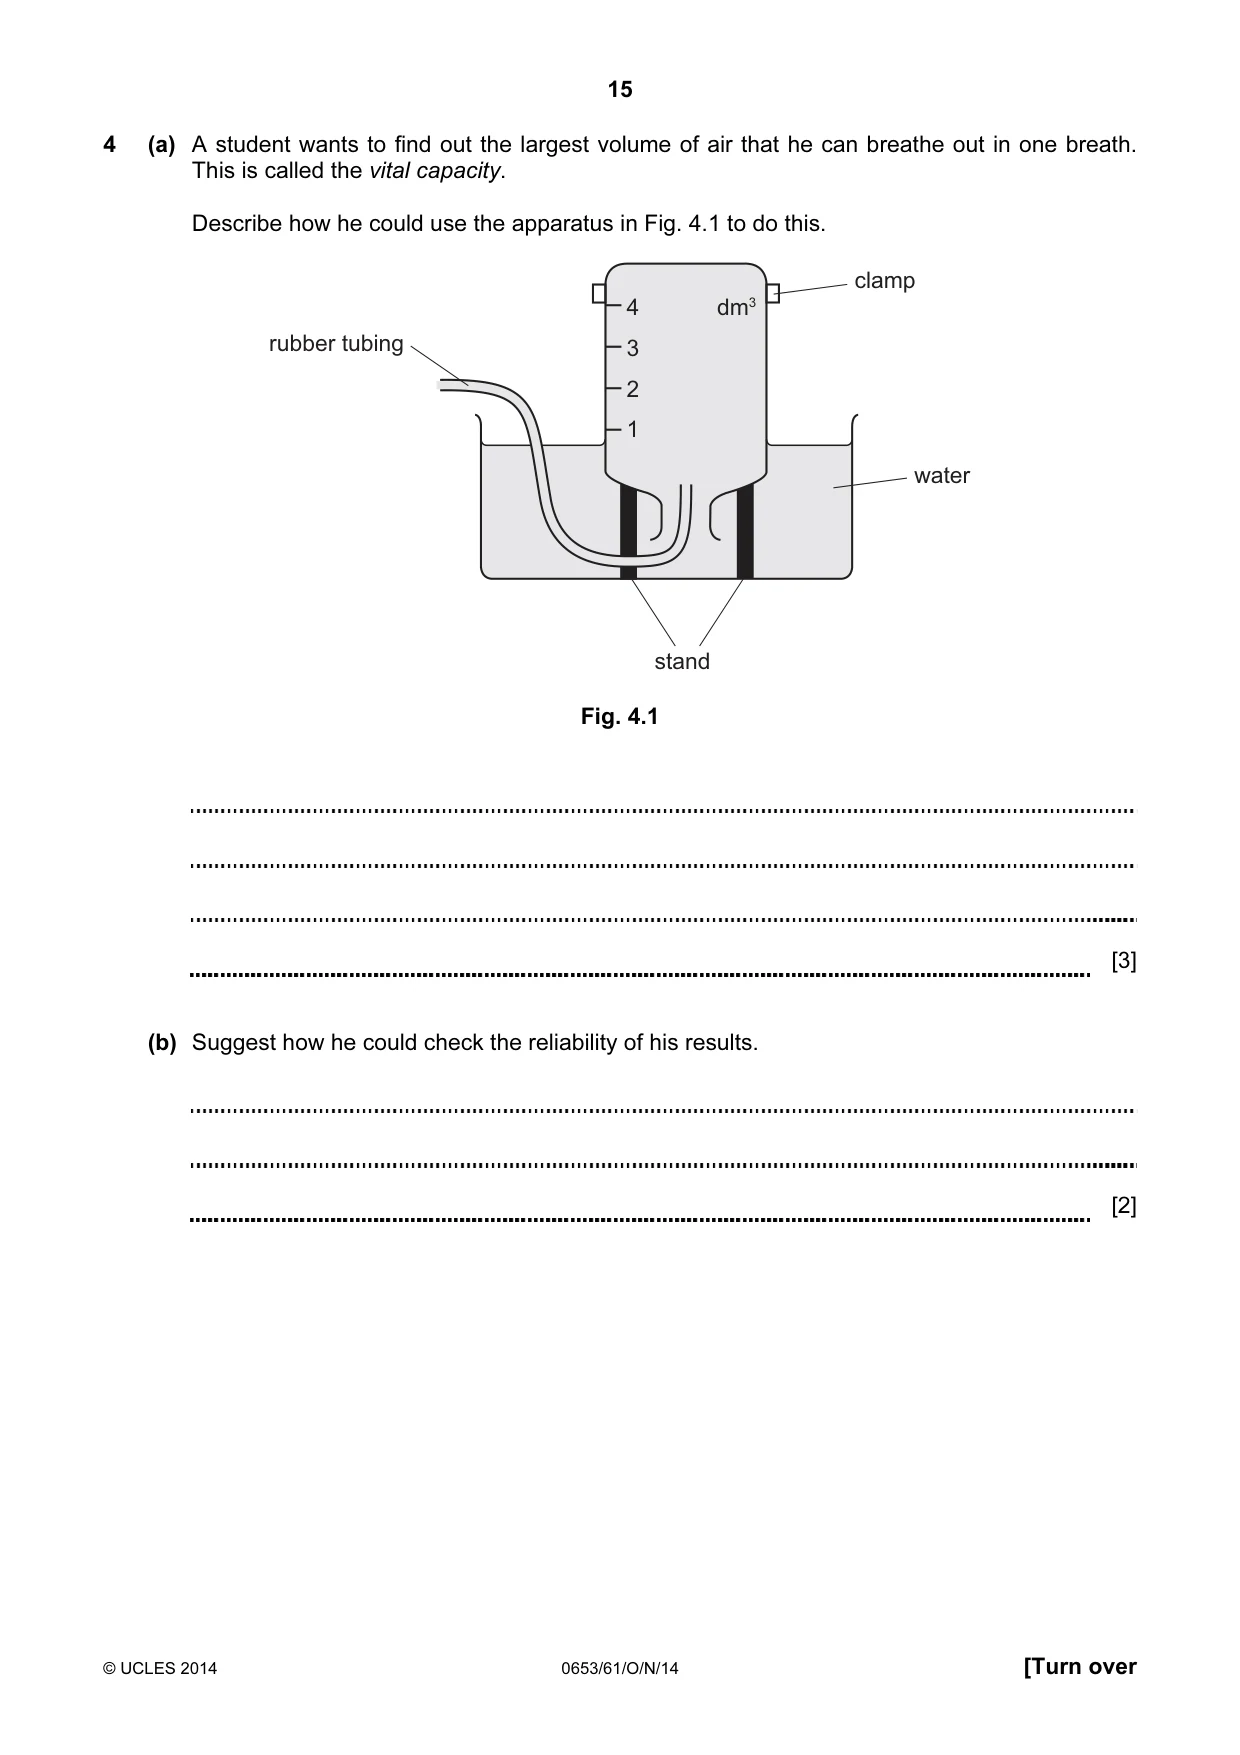
15 © UCLES 2014 0653/61/O/N/14 [Turn over 4 (a) A student wants to find out the largest volume of air that he can breathe out in one breath. This is called the vital capacity. Describe how he could use the apparatus in Fig. 4.1 to do this. 4 3 2 1 stand rubber tubing water clamp dm3 Fig. 4.1 [3] (b) Suggest how he could check the reliability of his results. [2]
Question paper, page 16
16 © UCLES 2014 0653/61/O/N/14 (c) (i) The teacher suggests that there is a relationship between a person’s height and vital capacity. Plan an experiment to test this hypothesis. [2] (ii) Describe how you would present your results to show any relationship. You may wish to use this space to draw a suitable table. [1] (d) Another student has two gas jars. One jar contains exhaled air and the other jar contains inhaled air. She places a lighted candle inside each jar. Suggest and explain the difference in results from the two samples of air. [2]
Question paper, page 17
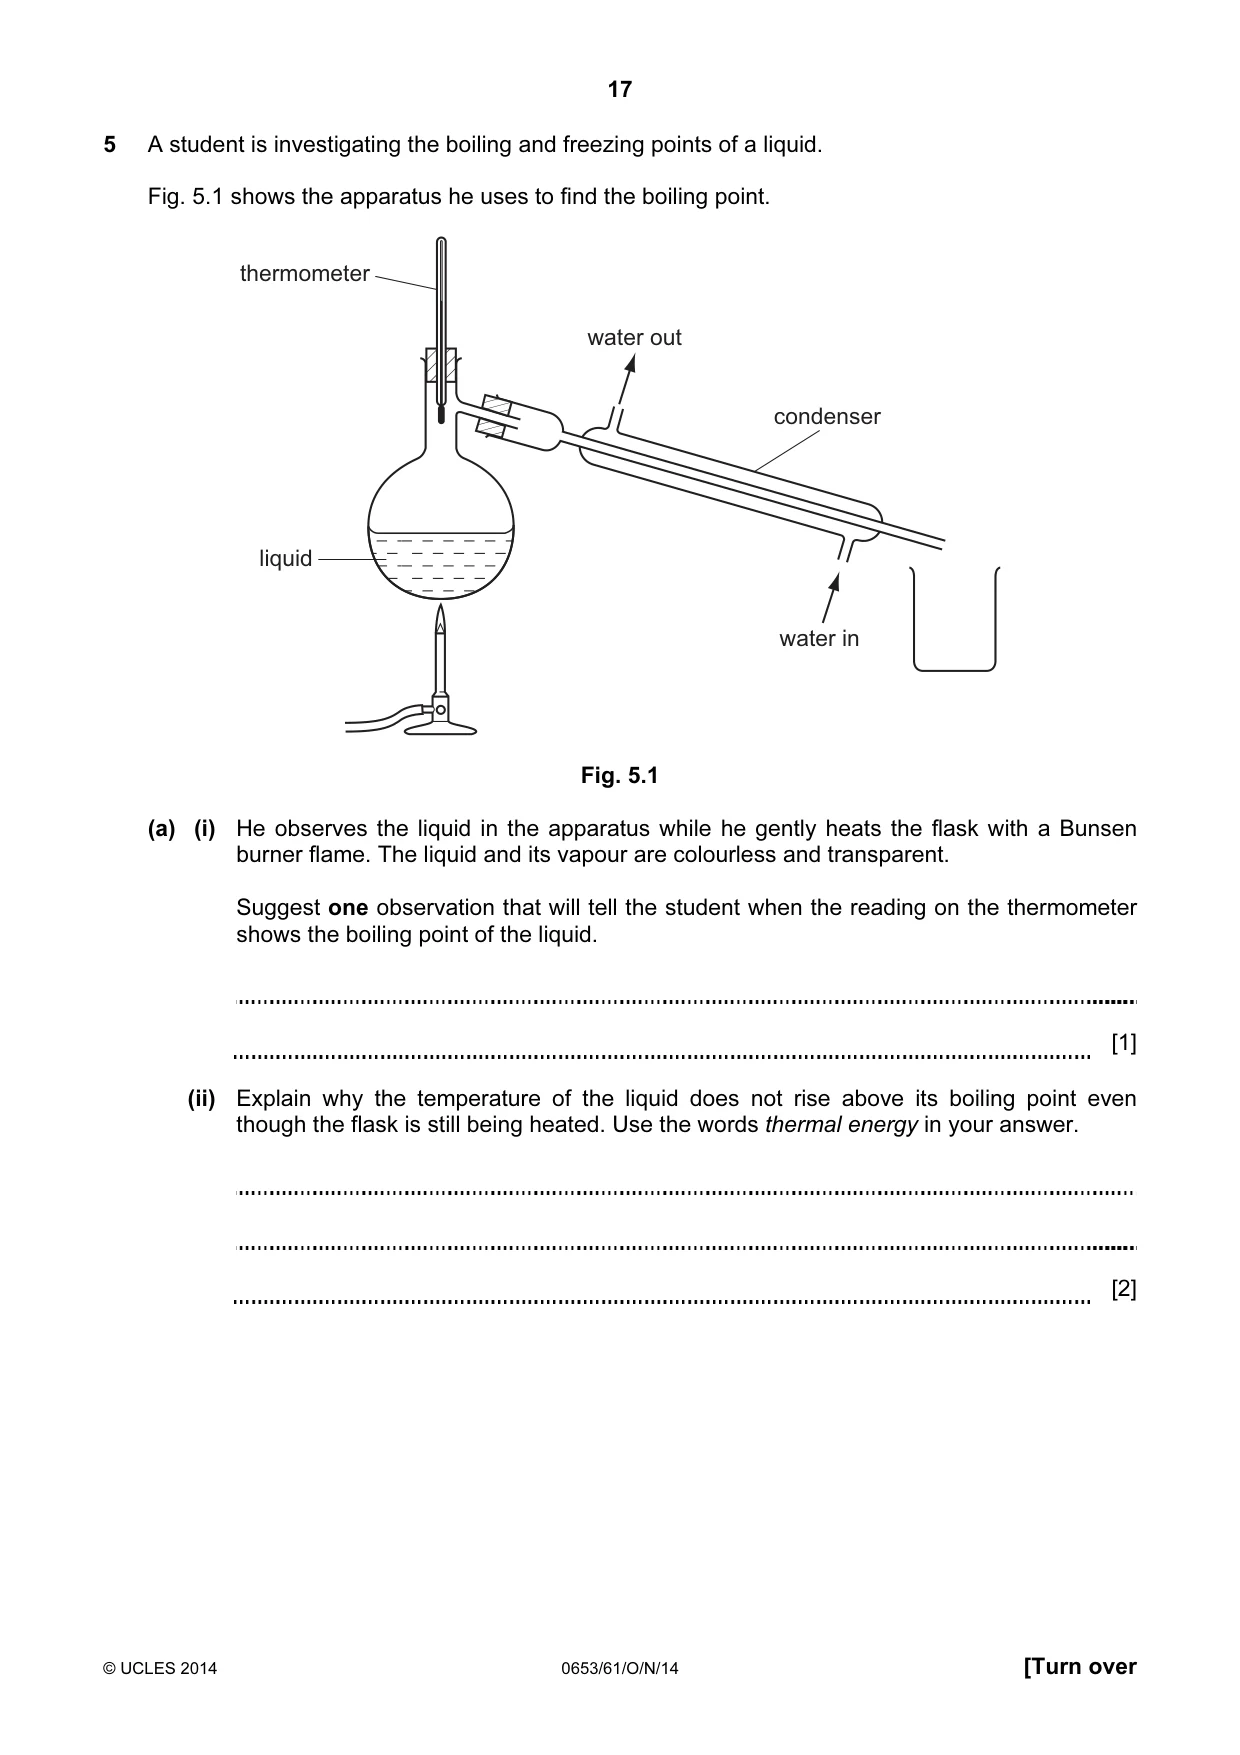
17 © UCLES 2014 0653/61/O/N/14 [Turn over 5 A student is investigating the boiling and freezing points of a liquid. Fig. 5.1 shows the apparatus he uses to find the boiling point. water out water in thermometer liquid condenser Fig. 5.1 (a) (i) He observes the liquid in the apparatus while he gently heats the flask with a Bunsen burner flame. The liquid and its vapour are colourless and transparent. Suggest one observation that will tell the student when the reading on the thermometer shows the boiling point of the liquid. [1] (ii) Explain why the temperature of the liquid does not rise above its boiling point even though the flask is still being heated. Use the words thermal energy in your answer. [2]
Question paper, page 18
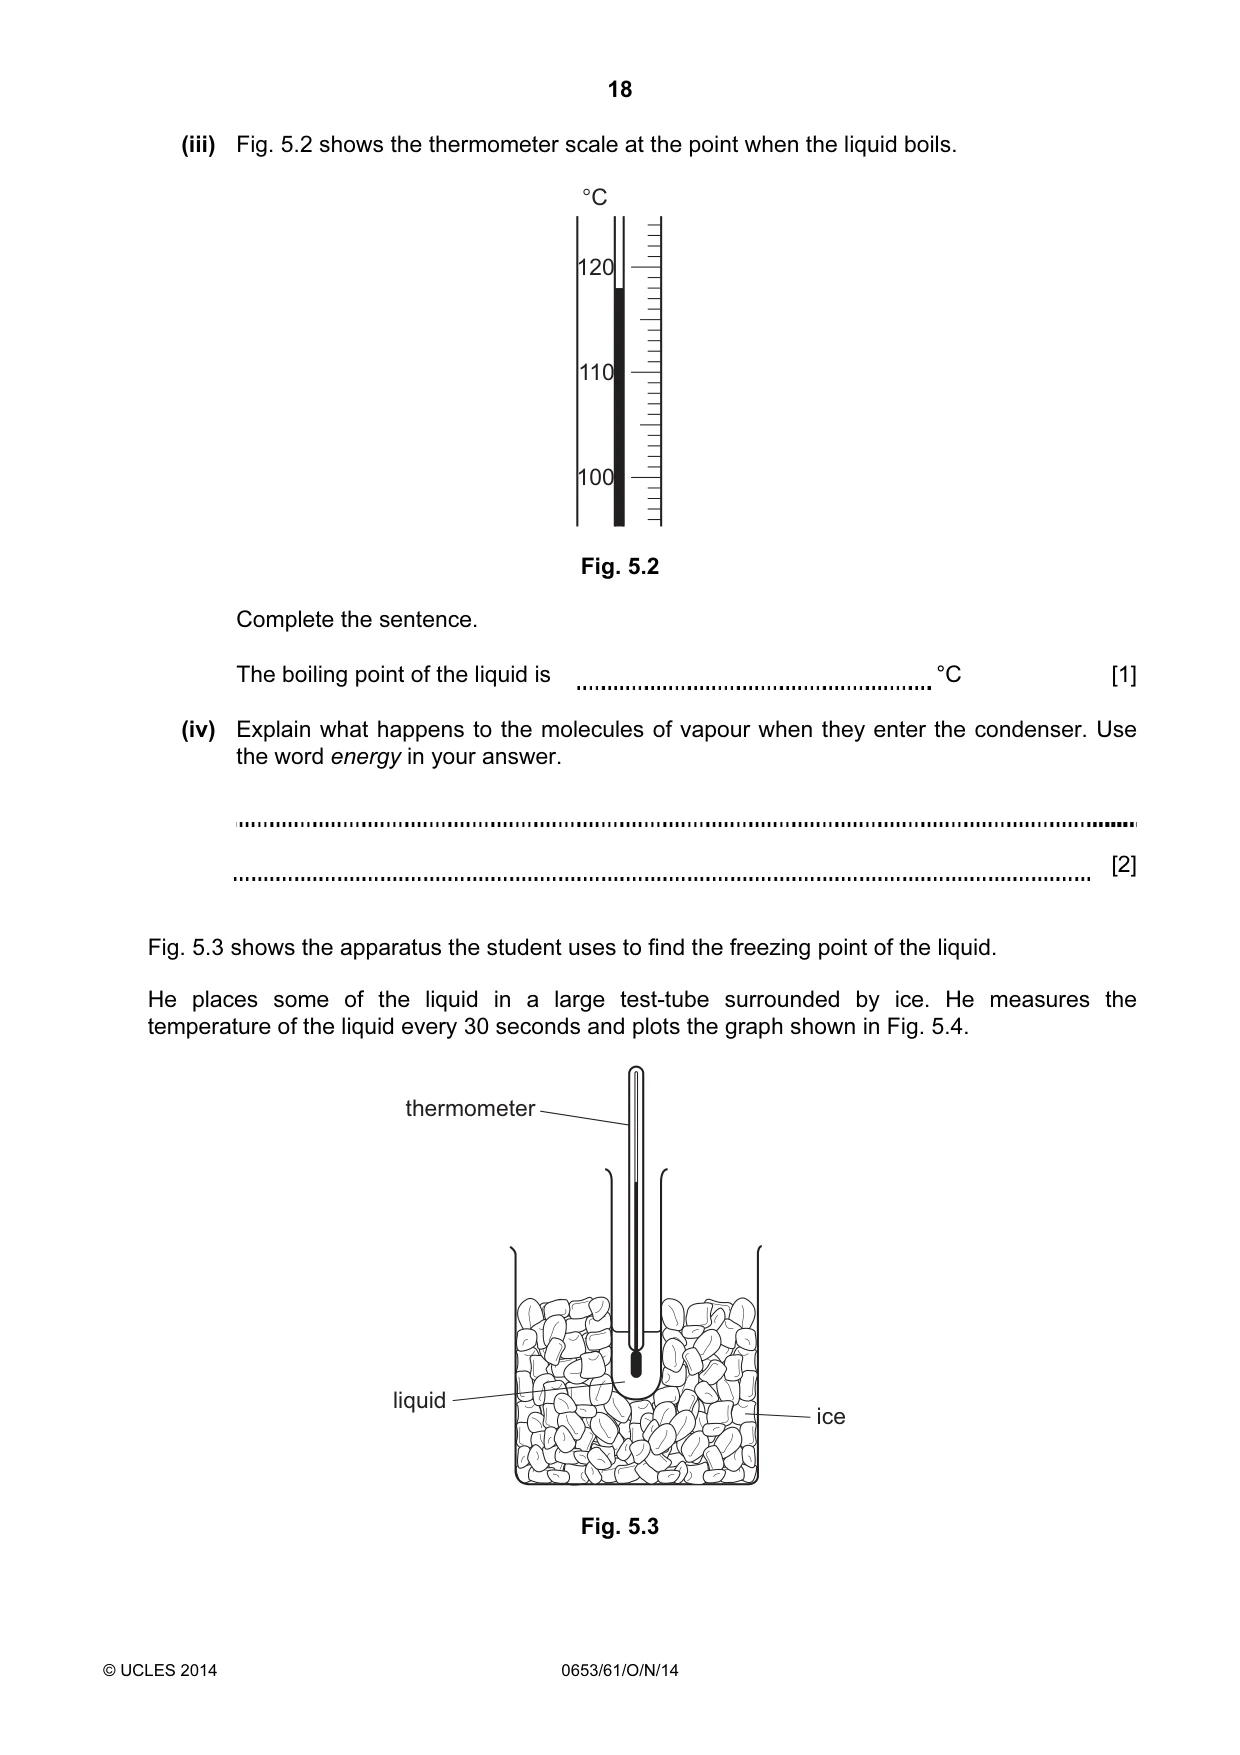
18 © UCLES 2014 0653/61/O/N/14 (iii) Fig. 5.2 shows the thermometer scale at the point when the liquid boils. 120 110 100 °C Fig. 5.2 Complete the sentence. The boiling point of the liquid is °C [1] (iv) Explain what happens to the molecules of vapour when they enter the condenser. Use the word energy in your answer. [2] Fig. 5.3 shows the apparatus the student uses to find the freezing point of the liquid. He places some of the liquid in a large test-tube surrounded by ice. He measures the temperature of the liquid every 30 seconds and plots the graph shown in Fig. 5.4. thermometer liquid ice Fig. 5.3
Question paper, page 19
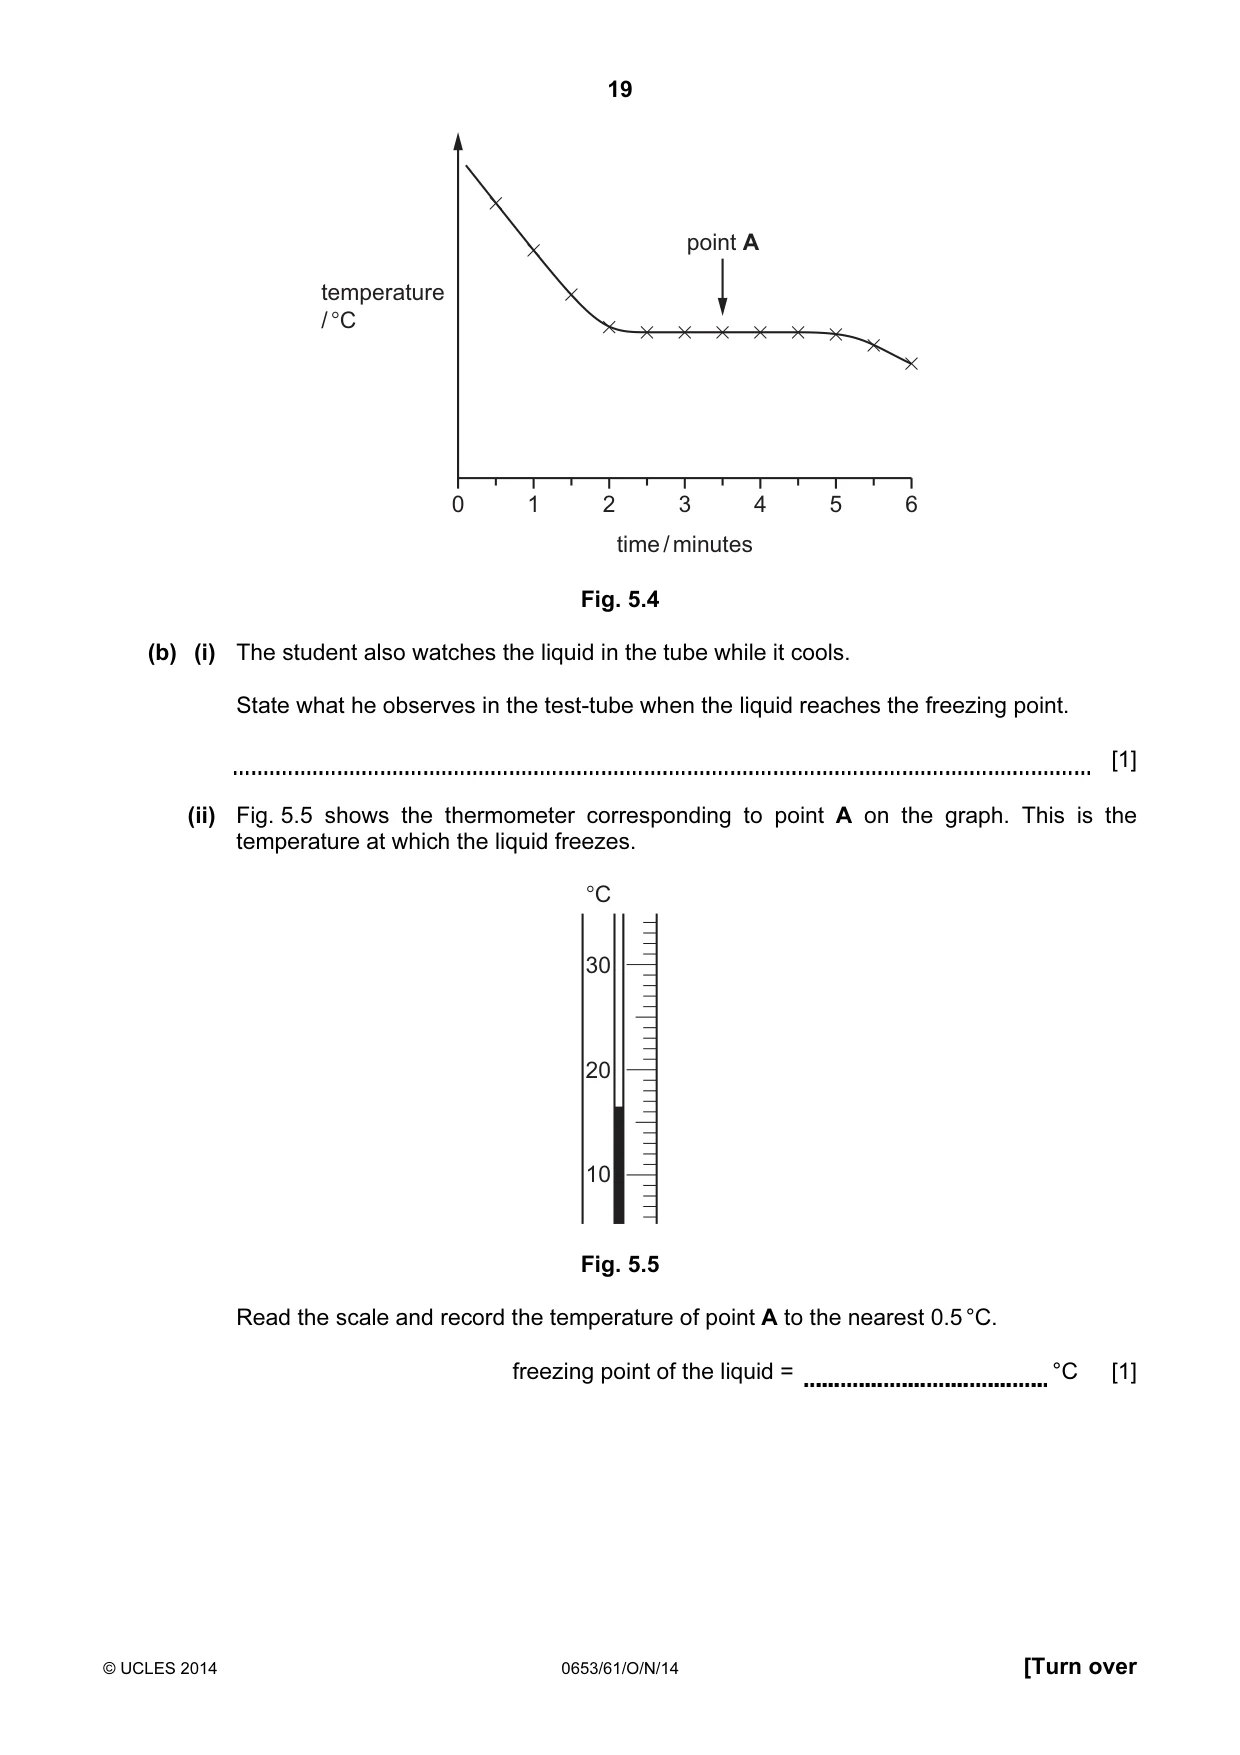
19 © UCLES 2014 0653/61/O/N/14 [Turn over 0 1 2 3 time / minutes 4 5 6 temperature / °C point A Fig. 5.4 (b) (i) The student also watches the liquid in the tube while it cools. State what he observes in the test-tube when the liquid reaches the freezing point. [1] (ii) Fig. 5.5 shows the thermometer corresponding to point A on the graph. This is the temperature at which the liquid freezes. 30 20 10 °C Fig. 5.5 Read the scale and record the temperature of point A to the nearest 0.5 °C. freezing point of the liquid = °C [1]
Question paper, page 20
20 © UCLES 2014 0653/61/O/N/14 (iii) Explain why the temperature stays constant at the temperature of point A on the graph for several minutes even though the contents of the test-tube have not yet cooled to 0 °C, the temperature of the ice. Your answer must include a reference to the thermal energy of the molecules of the liquid. [2]
Question paper, page 21
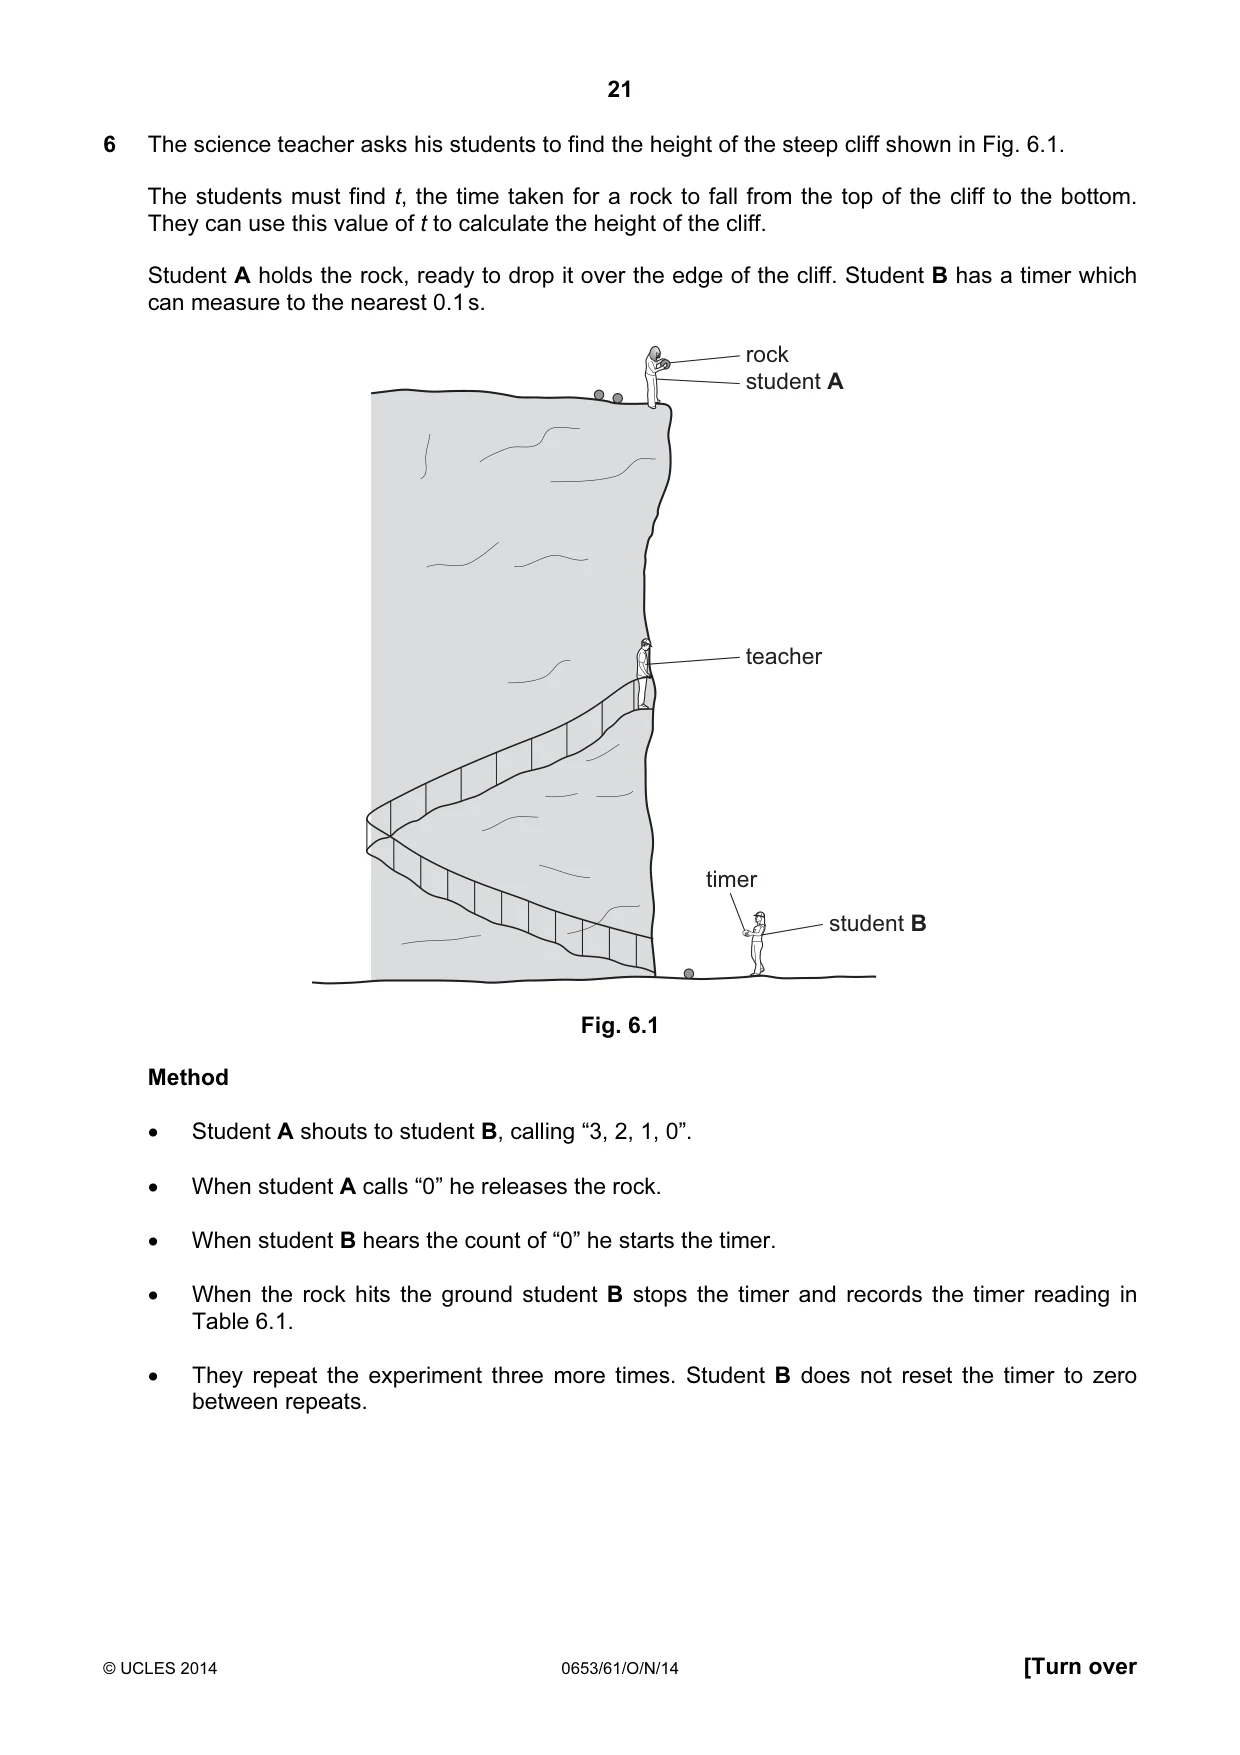
21 © UCLES 2014 0653/61/O/N/14 [Turn over 6 The science teacher asks his students to find the height of the steep cliff shown in Fig. 6.1. The students must find t, the time taken for a rock to fall from the top of the cliff to the bottom. They can use this value of t to calculate the height of the cliff. Student A holds the rock, ready to drop it over the edge of the cliff. Student B has a timer which can measure to the nearest 0.1 s. rock student A student B timer teacher Fig. 6.1 Method • Student A shouts to student B, calling “3, 2, 1, 0”. • When student A calls “0” he releases the rock. • When student B hears the count of “0” he starts the timer. • When the rock hits the ground student B stops the timer and records the timer reading in Table 6.1. • They repeat the experiment three more times. Student B does not reset the timer to zero between repeats.
Question paper, page 22
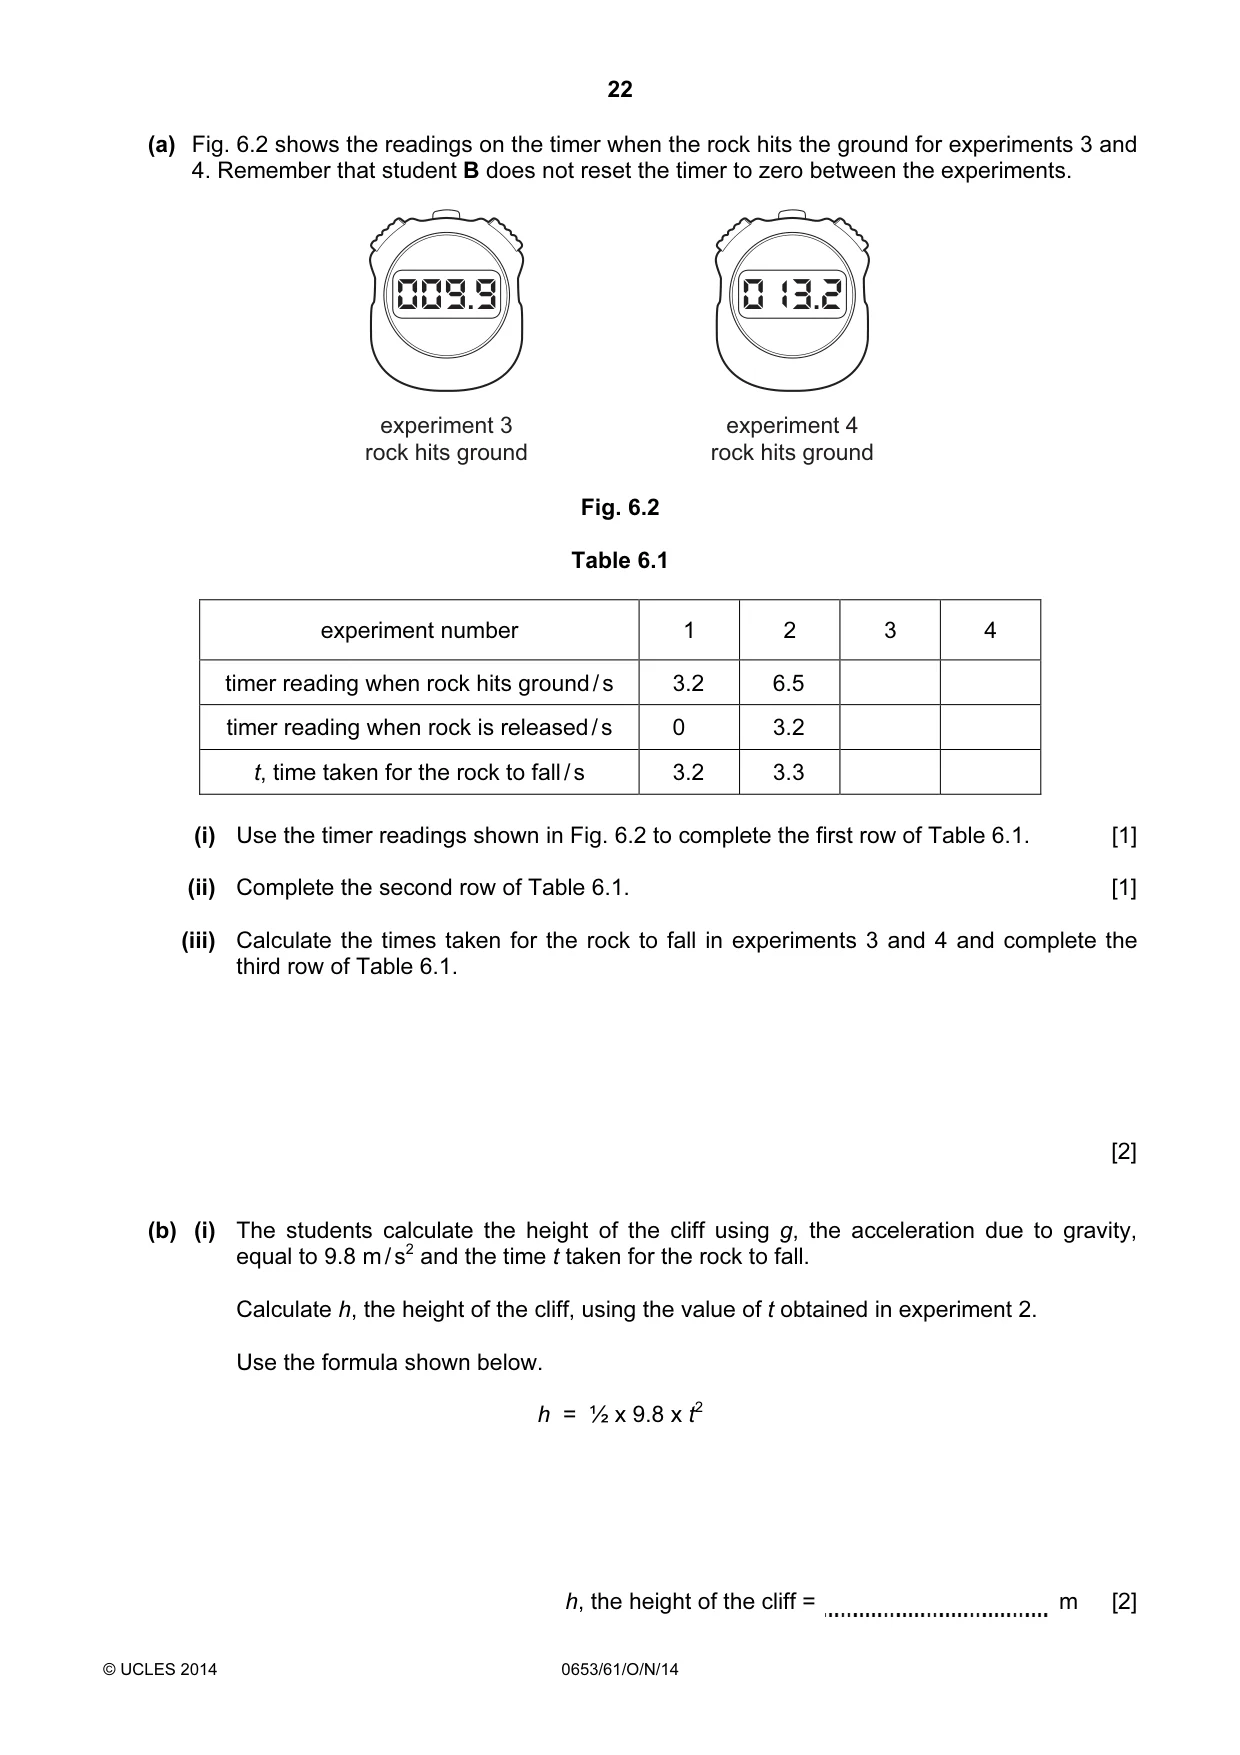
22 © UCLES 2014 0653/61/O/N/14 (a) Fig. 6.2 shows the readings on the timer when the rock hits the ground for experiments 3 and 4. Remember that student B does not reset the timer to zero between the experiments. experiment 3 rock hits ground experiment 4 rock hits ground Fig. 6.2 Table 6.1 experiment number 1 2 3 4 timer reading when rock hits ground / s 3.2 6.5 timer reading when rock is released / s 0 3.2 t, time taken for the rock to fall / s 3.2 3.3 (i) Use the timer readings shown in Fig. 6.2 to complete the first row of Table 6.1. [1] (ii) Complete the second row of Table 6.1. [1] (iii) Calculate the times taken for the rock to fall in experiments 3 and 4 and complete the third row of Table 6.1. [2] (b) (i) The students calculate the height of the cliff using g, the acceleration due to gravity, equal to 9.8 m / s2 and the time t taken for the rock to fall. Calculate h, the height of the cliff, using the value of t obtained in experiment 2. Use the formula shown below. h = ½ x 9.8 x t2 h, the height of the cliff = m [2]
Question paper, page 23
23 © UCLES 2014 0653/61/O/N/14 (ii) Explain why it might be better, when calculating h, to use an average of the four values of t instead of one of the values. [2] (c) The method used by the students gives a value of h that is less than the actual height of the cliff. The teacher tells them to do the experiment again, using a different method. This time, the teacher shouts to the students from a ledge at equal distances from both students (See Fig. 6.1). The teacher counts down to zero, calling “3, 2, 1, 0.” Student A releases the rock and student B starts the timer when they hear the teacher call “0”. Student B stops the timer when the rock hits the ground, as before. Explain why this method will give a more accurate value for t, the time for the rock to fall. [2]
Question paper, page 24
24 Permission to reproduce items where third-party owned material protected by copyright is included has been sought and cleared where possible. Every reasonable effort has been made by the publisher (UCLES) to trace copyright holders, but if any items requiring clearance have unwittingly been included, the publisher will be pleased to make amends at the earliest possible opportunity. Cambridge International Examinations is part of the Cambridge Assessment Group. Cambridge Assessment is the brand name of University of Cambridge Local Examinations Syndicate (UCLES), which is itself a department of the University of Cambridge. UCLES 2014 0653/61/O/N/14 BLANK PAGE
Mark scheme, page 1
® IGCSE is the registered trademark of Cambridge International Examinations. CAMBRIDGE INTERNATIONAL EXAMINATIONS Cambridge International General Certificate of Secondary Education MARK SCHEME for the October/November 2014 series 0653 COMBINED SCIENCE 0653/61 Paper 6 (Alternative to Practical), maximum raw mark 60 This mark scheme is published as an aid to teachers and candidates, to indicate the requirements of the examination. It shows the basis on which Examiners were instructed to award marks. It does not indicate the details of the discussions that took place at an Examiners’ meeting before marking began, which would have considered the acceptability of alternative answers. Mark schemes should be read in conjunction with the question paper and the Principal Examiner Report for Teachers. Cambridge will not enter into discussions about these mark schemes. Cambridge is publishing the mark schemes for the October/November 2014 series for most Cambridge IGCSE®, Cambridge International A and AS Level components and some Cambridge O Level components.
Mark scheme, page 2
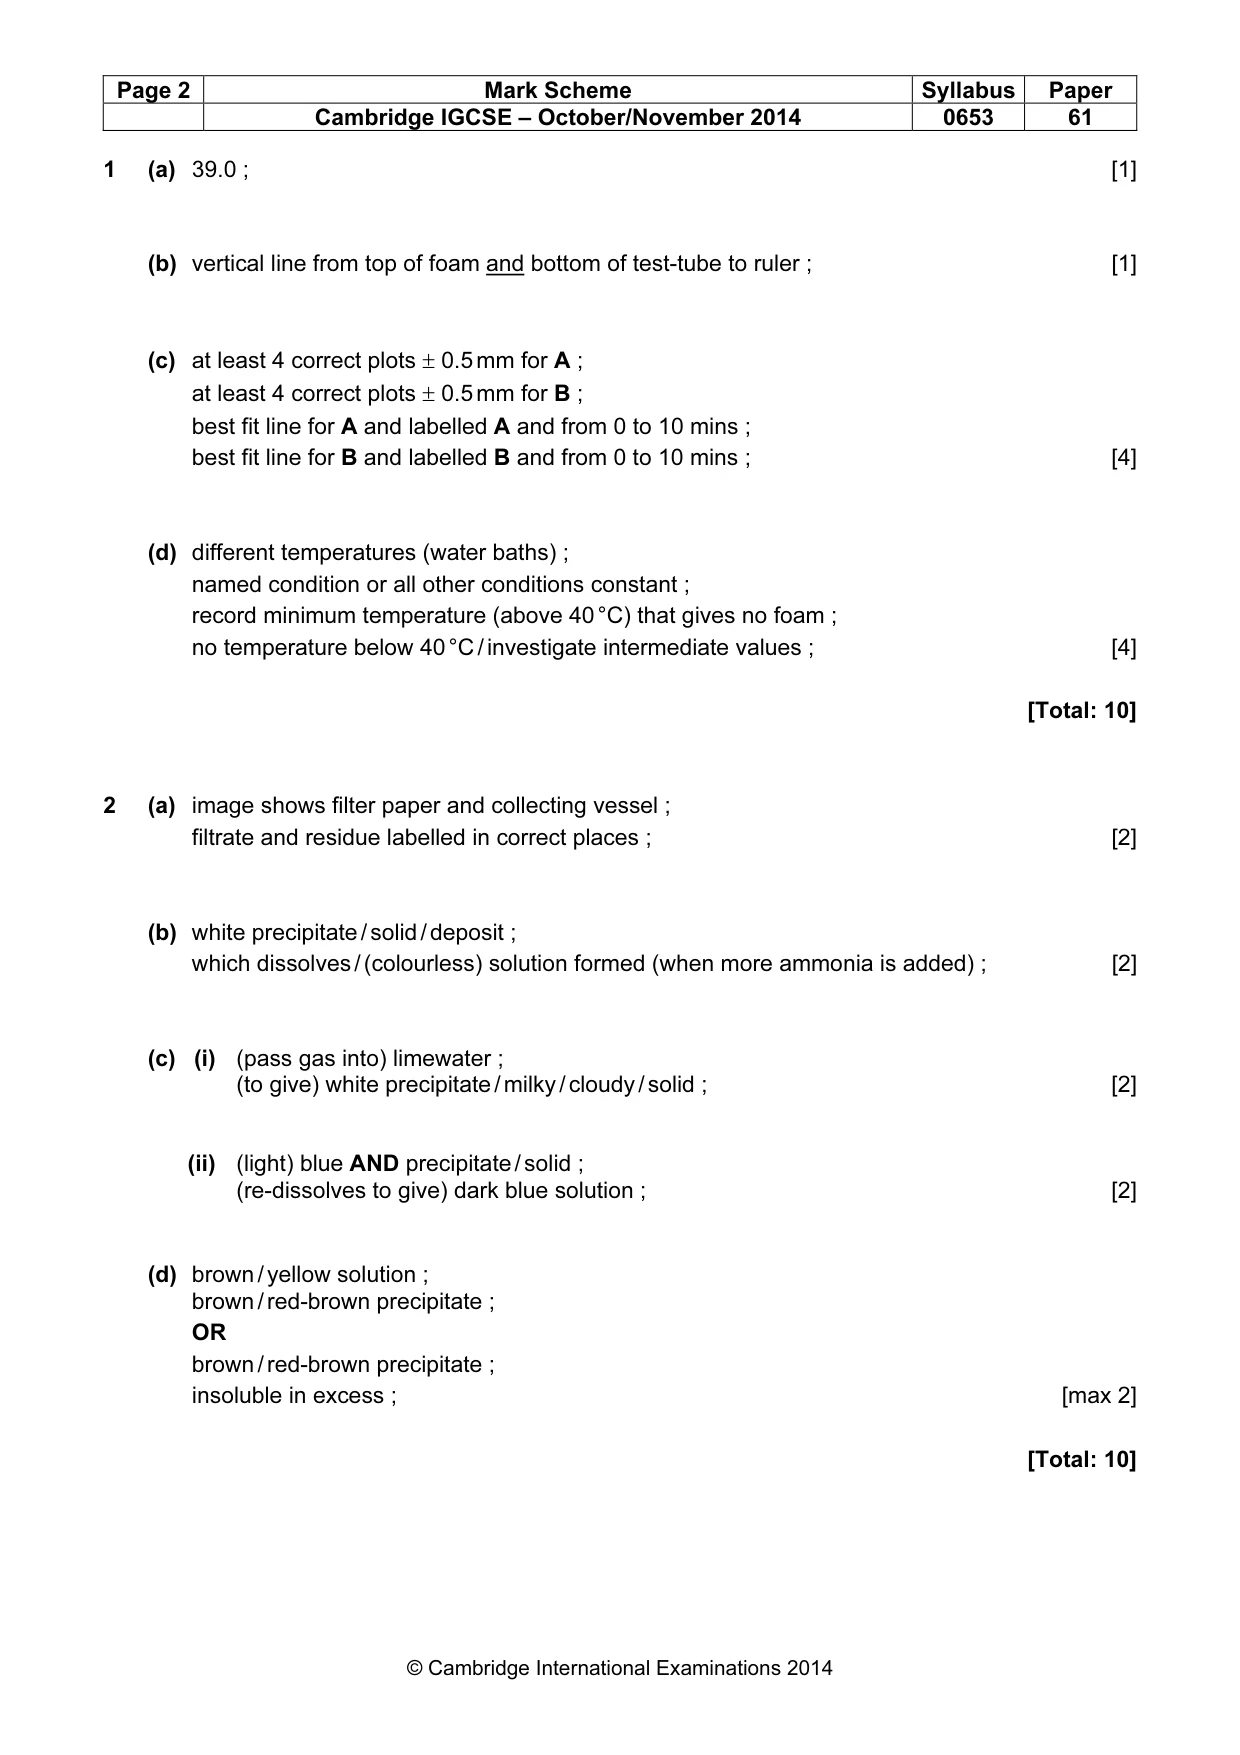
Page 2 Mark Scheme Syllabus Paper Cambridge IGCSE – October/November 2014 0653 61 © Cambridge International Examinations 2014 1 (a) 39.0 ; [1] (b) vertical line from top of foam and bottom of test-tube to ruler ; [1] (c) at least 4 correct plots ± 0.5 mm for A ; at least 4 correct plots ± 0.5 mm for B ; best fit line for A and labelled A and from 0 to 10 mins ; best fit line for B and labelled B and from 0 to 10 mins ; [4] (d) different temperatures (water baths) ; named condition or all other conditions constant ; record minimum temperature (above 40 °C) that gives no foam ; no temperature below 40 °C / investigate intermediate values ; [4] [Total: 10] 2 (a) image shows filter paper and collecting vessel ; filtrate and residue labelled in correct places ; [2] (b) white precipitate / solid / deposit ; which dissolves / (colourless) solution formed (when more ammonia is added) ; [2] (c) (i) (pass gas into) limewater ; (to give) white precipitate / milky / cloudy / solid ; [2] (ii) (light) blue AND precipitate / solid ; (re-dissolves to give) dark blue solution ; [2] (d) brown / yellow solution ; brown / red-brown precipitate ; OR brown / red-brown precipitate ; insoluble in excess ; [max 2] [Total: 10]
Mark scheme, page 3
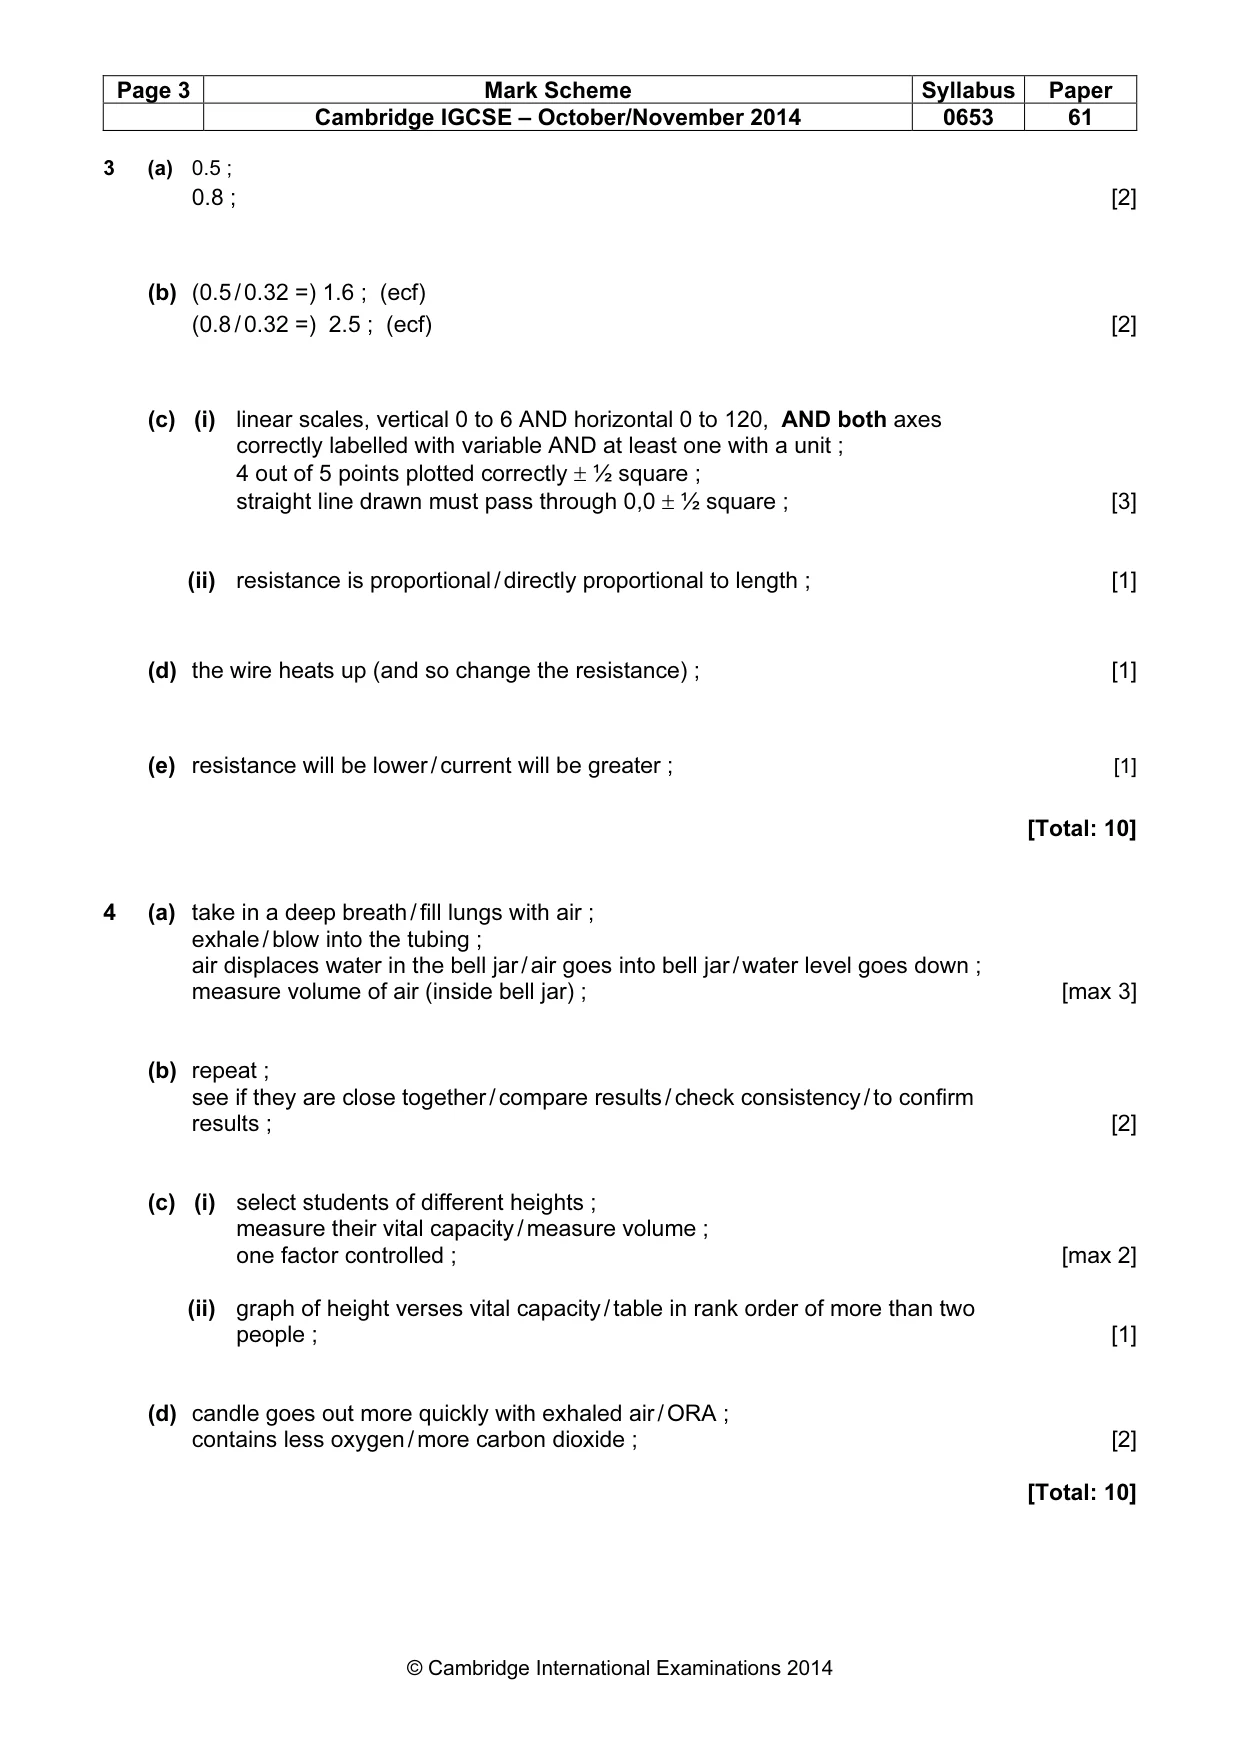
Page 3 Mark Scheme Syllabus Paper Cambridge IGCSE – October/November 2014 0653 61 © Cambridge International Examinations 2014 3 (a) 0.5 ; 0.8 ; [2] (b) (0.5 / 0.32 =) 1.6 ; (ecf) (0.8 / 0.32 =) 2.5 ; (ecf) [2] (c) (i) linear scales, vertical 0 to 6 AND horizontal 0 to 120, AND both axes correctly labelled with variable AND at least one with a unit ; 4 out of 5 points plotted correctly ± ½ square ; straight line drawn must pass through 0,0 ± ½ square ; [3] (ii) resistance is proportional / directly proportional to length ; [1] (d) the wire heats up (and so change the resistance) ; [1] (e) resistance will be lower / current will be greater ; [1] [Total: 10] 4 (a) take in a deep breath / fill lungs with air ; exhale / blow into the tubing ; air displaces water in the bell jar / air goes into bell jar / water level goes down ; measure volume of air (inside bell jar) ; [max 3] (b) repeat ; see if they are close together / compare results / check consistency / to confirm results ; [2] (c) (i) select students of different heights ; measure their vital capacity / measure volume ; one factor controlled ; [max 2] (ii) graph of height verses vital capacity / table in rank order of more than two people ; [1] (d) candle goes out more quickly with exhaled air / ORA ; contains less oxygen / more carbon dioxide ; [2] [Total: 10]
Mark scheme, page 4
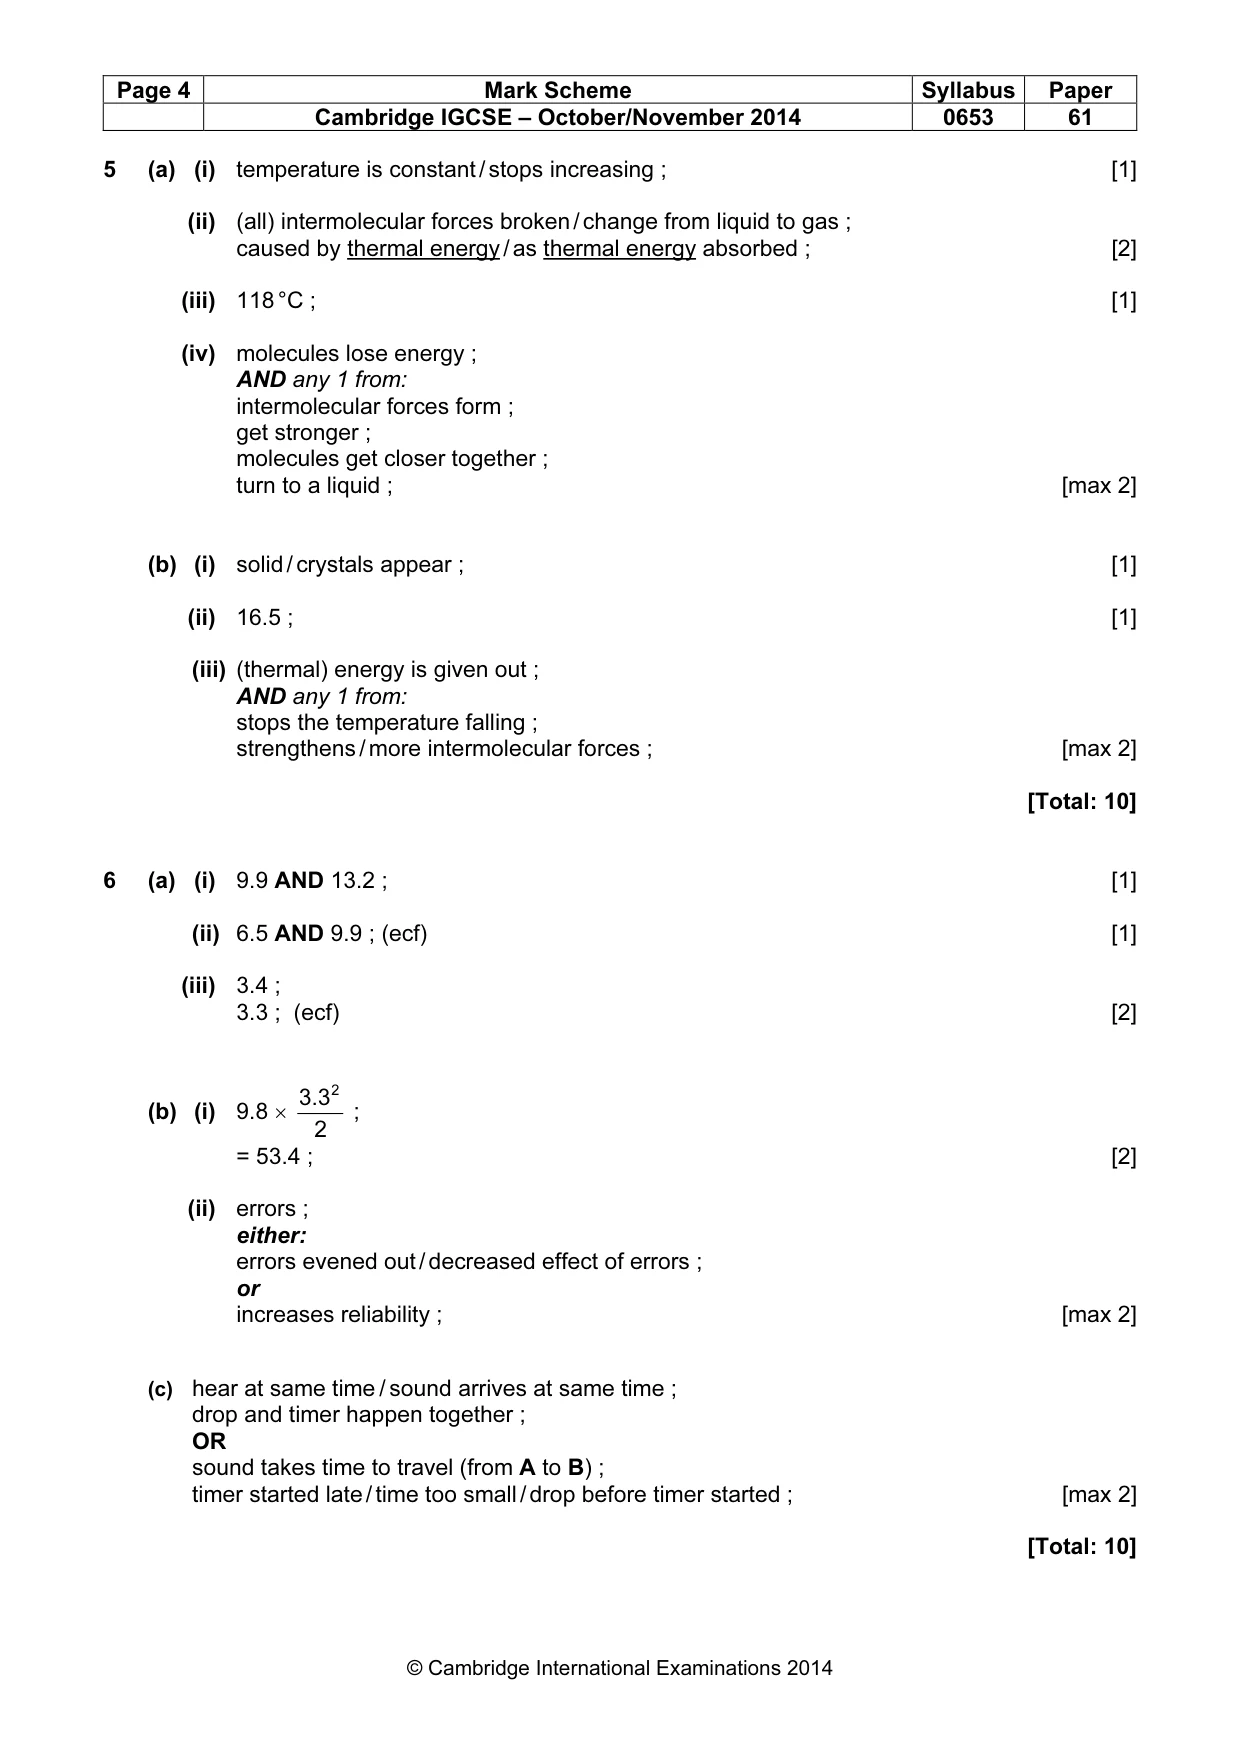
Page 4 Mark Scheme Syllabus Paper Cambridge IGCSE – October/November 2014 0653 61 © Cambridge International Examinations 2014 5 (a) (i) temperature is constant / stops increasing ; [1] (ii) (all) intermolecular forces broken / change from liquid to gas ; caused by thermal energy / as thermal energy absorbed ; [2] (iii) 118 °C ; [1] (iv) molecules lose energy ; AND any 1 from: intermolecular forces form ; get stronger ; molecules get closer together ; turn to a liquid ; [max 2] (b) (i) solid / crystals appear ; [1] (ii) 16.5 ; [1] (iii) (thermal) energy is given out ; AND any 1 from: stops the temperature falling ; strengthens / more intermolecular forces ; [max 2] [Total: 10] 6 (a) (i) 9.9 AND 13.2 ; [1] (ii) 6.5 AND 9.9 ; (ecf) [1] (iii) 3.4 ; 3.3 ; (ecf) [2] (b) (i) 9.8 × 2 3.32 ; = 53.4 ; [2] (ii) errors ; either: errors evened out / decreased effect of errors ; or increases reliability ; [max 2] (c) hear at same time / sound arrives at same time ; drop and timer happen together ; OR sound takes time to travel (from A to B) ; timer started late / time too small / drop before timer started ; [max 2] [Total: 10]
What you needed in this session
Cambridge’s own grade thresholds for 2014 Oct/Nov, Paper 6 · Variant 1. A higher threshold means an easier paper — the bar moves with how the cohort did.