Cambridge IGCSE Science - Combined 0653 — 2014 May/June Paper 6 · Variant 3
0653/63/M/J/14 · 60 marks · ≈68 min
The question paper and its mark scheme, free to read here and free to download. This is Cambridge’s own paper, exactly as it was sat.
Question paper20 pages



Mark scheme4 pages
Answers below. Sit the paper first if you are practising.
Paper as text
Question paper, page 1
This document consists of 20 printed pages. IB14 06_0653_63/FP © UCLES 2014 [Turn over *2994000068* Cambridge International Examinations Cambridge International General Certificate of Secondary Education COMBINED SCIENCE 0653/63 Paper 6 Alternative to Practical May/June 2014 1 hour Candidates answer on the Question paper. No Additional Materials are required. READ THESE INSTRUCTIONS FIRST Write your Centre number, candidate number and name on all the work you hand in. Write in dark blue or black pen. You may use an HB pencil for any diagrams or graphs. Do not use staples, paper clips, glue or correction fluid. DO NOT WRITE IN ANY BARCODES. Answer all questions. Electronic calculators may be used. You may lose marks if you do not show your working or if you do not use appropriate units. At the end of the examination, fasten all your work securely together. The number of marks is given in brackets [ ] at the end of each question or part question.
Question paper, page 2
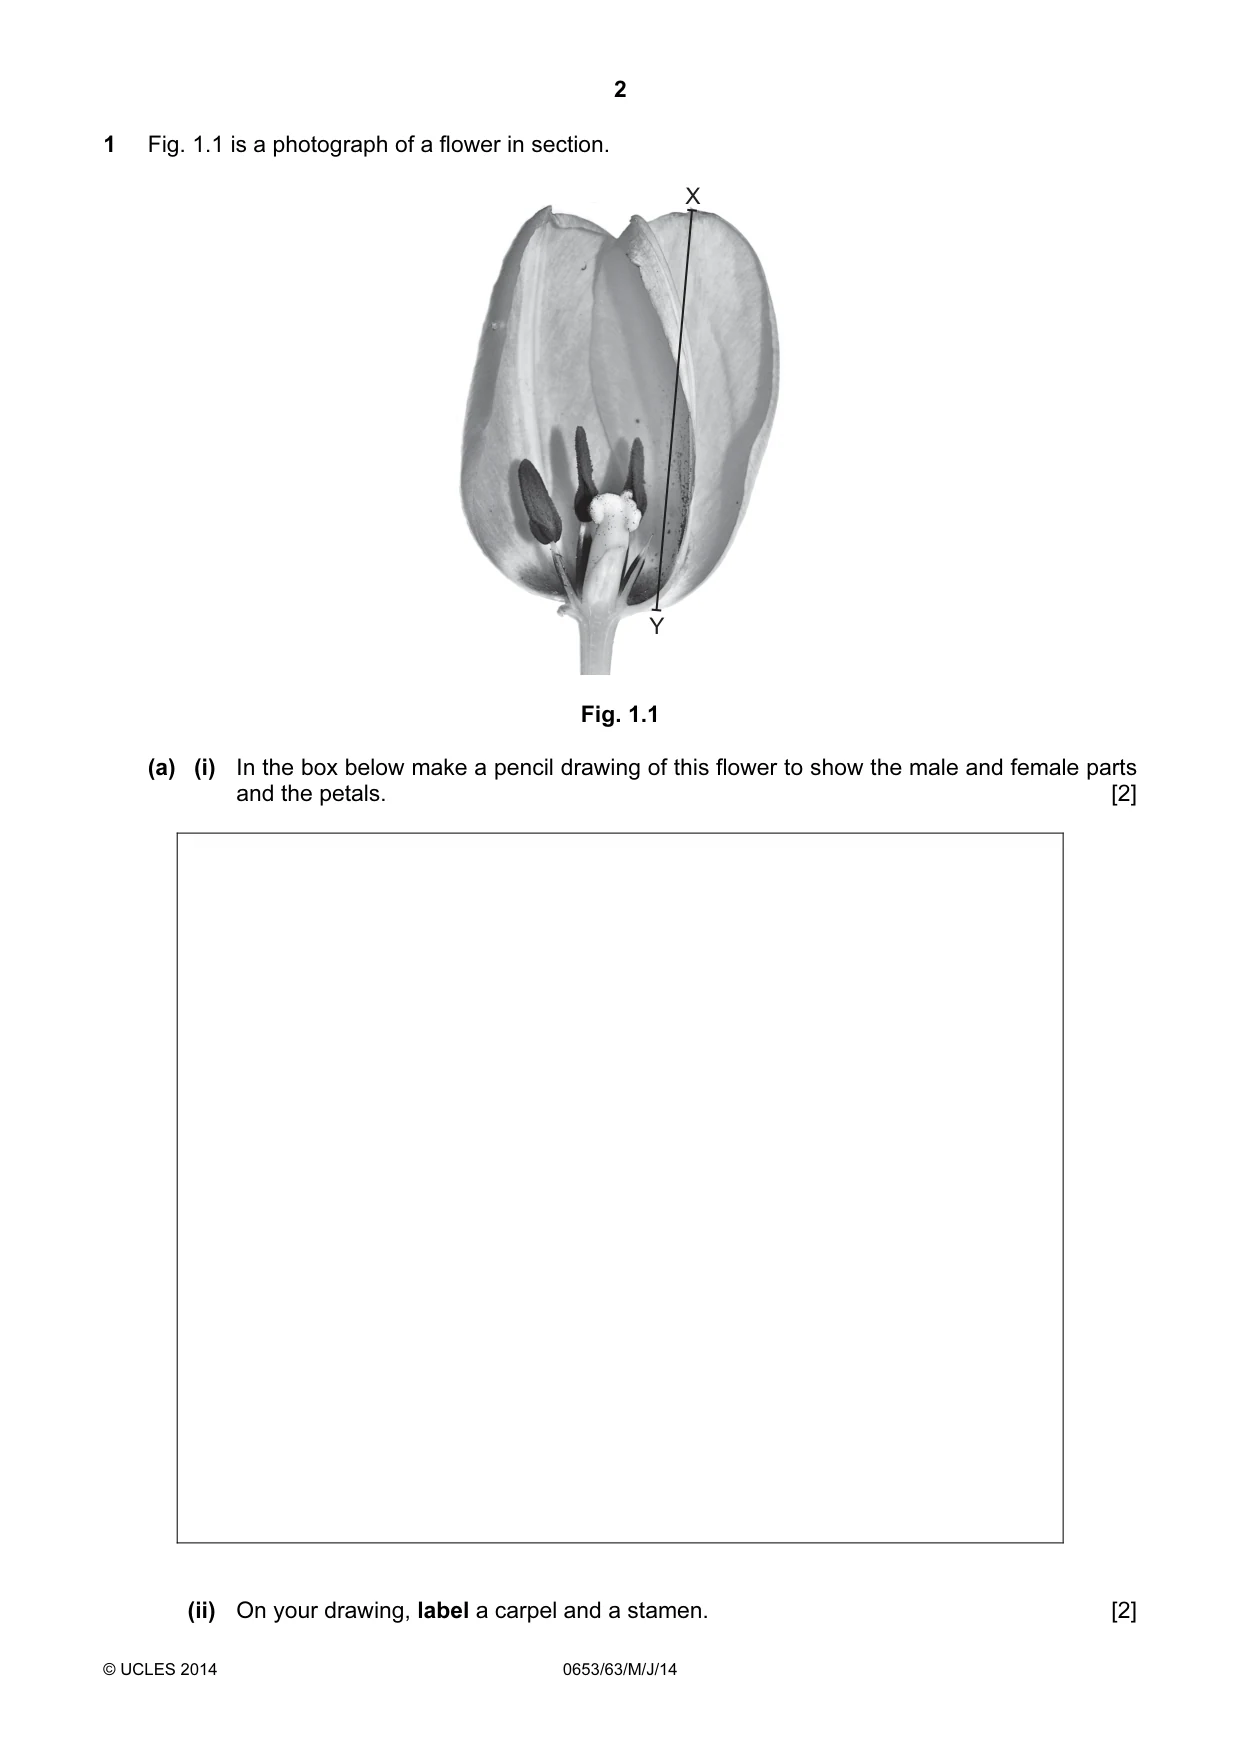
2 © UCLES 2014 0653/63/M/J/14 1 Fig. 1.1 is a photograph of a flower in section. X Y Fig. 1.1 (a) (i) In the box below make a pencil drawing of this flower to show the male and female parts and the petals. [2] (ii) On your drawing, label a carpel and a stamen. [2]
Question paper, page 3
3 © UCLES 2014 0653/63/M/J/14 [Turn over (b) (i) Measure the line X – Y on Fig. 1.1 in mm. length = mm [1] (ii) Measure the length of the same part on your drawing in mm. length = mm [1] (c) Use these two measurements to calculate the magnification of your drawing. Show your working in the space below. magnification = [1] (d) On your drawing, mark with a Z the structure that receives pollen during pollination. [1] (e) Describe the procedure you would use if you wanted to examine a sample of pollen from this flower. [2]
Question paper, page 4
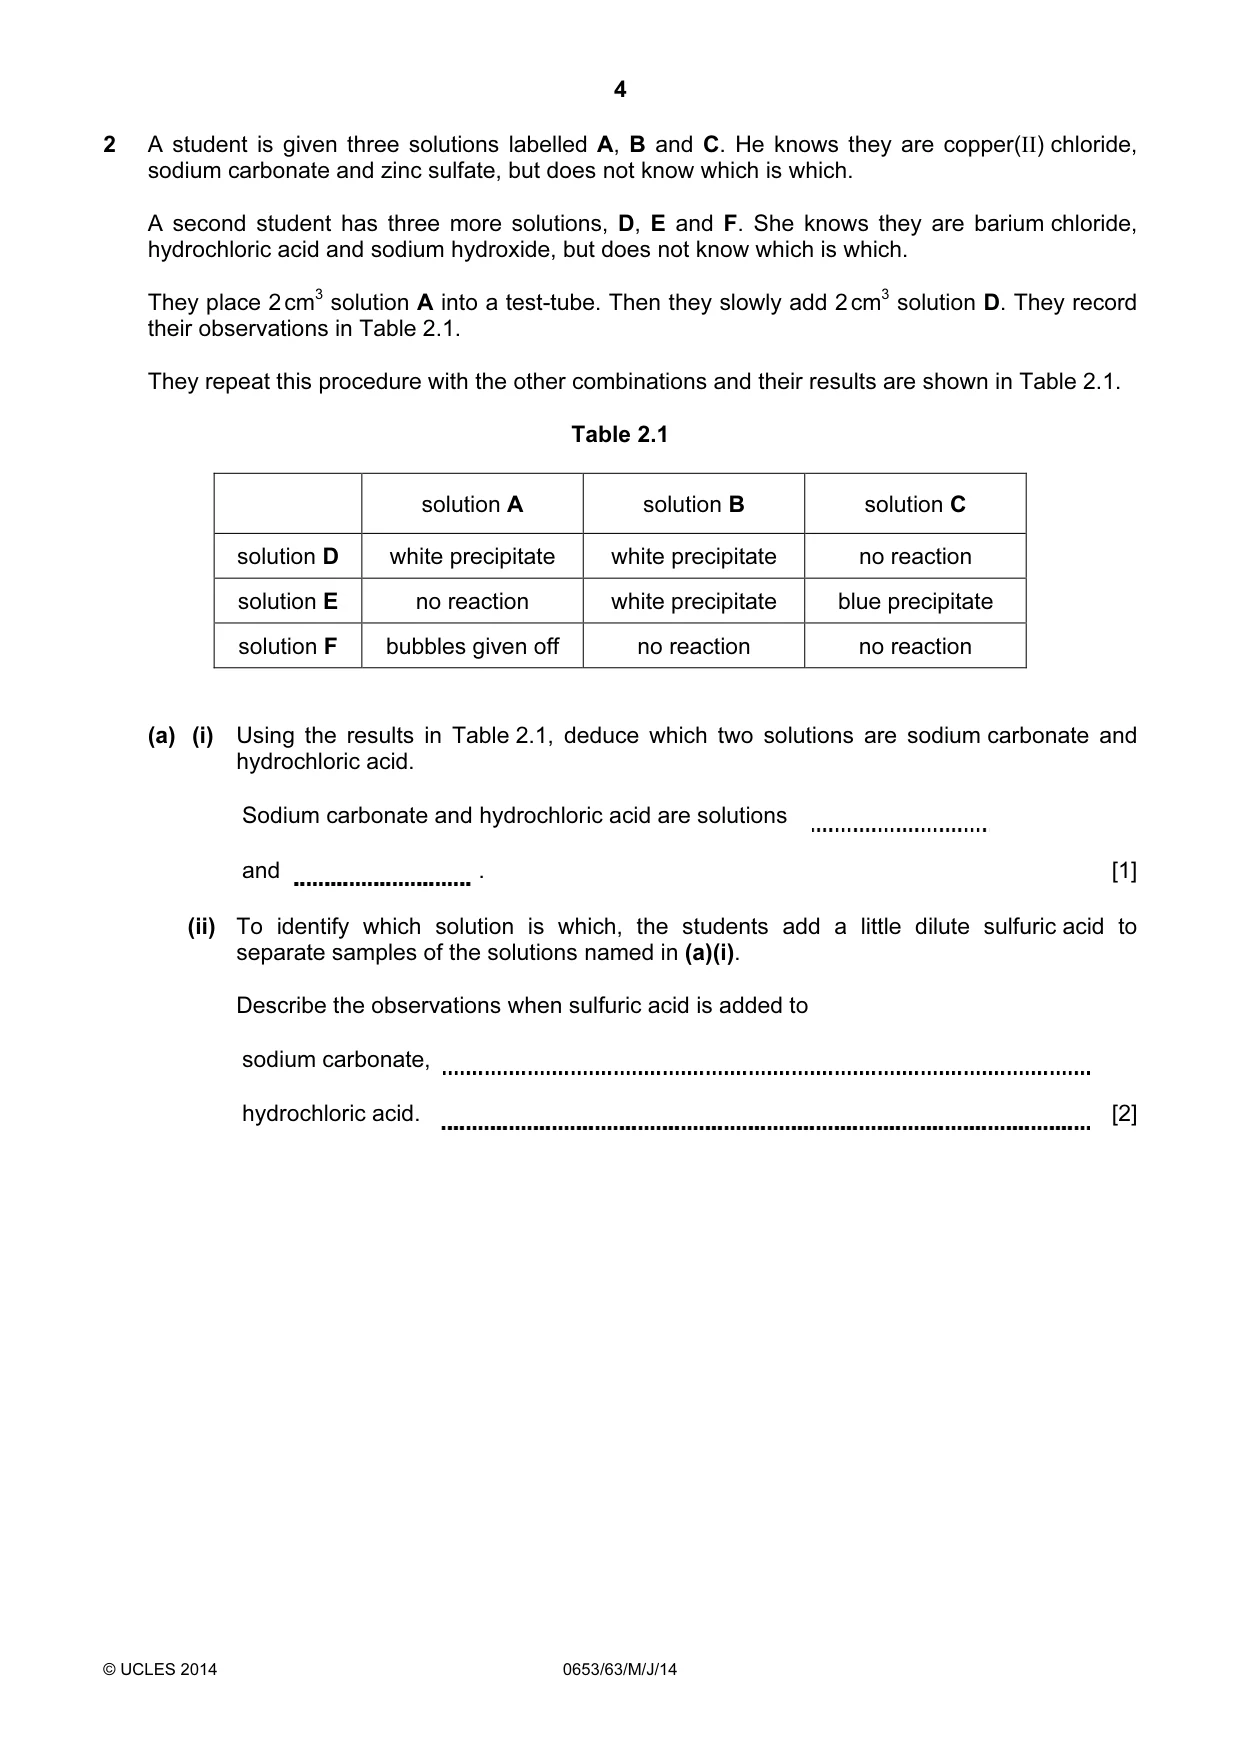
4 © UCLES 2014 0653/63/M/J/14 2 A student is given three solutions labelled A, B and C. He knows they are copper(II) chloride, sodium carbonate and zinc sulfate, but does not know which is which. A second student has three more solutions, D, E and F. She knows they are barium chloride, hydrochloric acid and sodium hydroxide, but does not know which is which. They place 2 cm3 solution A into a test-tube. Then they slowly add 2 cm3 solution D. They record their observations in Table 2.1. They repeat this procedure with the other combinations and their results are shown in Table 2.1. Table 2.1 solution A solution B solution C solution D white precipitate white precipitate no reaction solution E no reaction white precipitate blue precipitate solution F bubbles given off no reaction no reaction (a) (i) Using the results in Table 2.1, deduce which two solutions are sodium carbonate and hydrochloric acid. Sodium carbonate and hydrochloric acid are solutions and . [1] (ii) To identify which solution is which, the students add a little dilute sulfuric acid to separate samples of the solutions named in (a)(i). Describe the observations when sulfuric acid is added to sodium carbonate, hydrochloric acid. [2]
Question paper, page 5
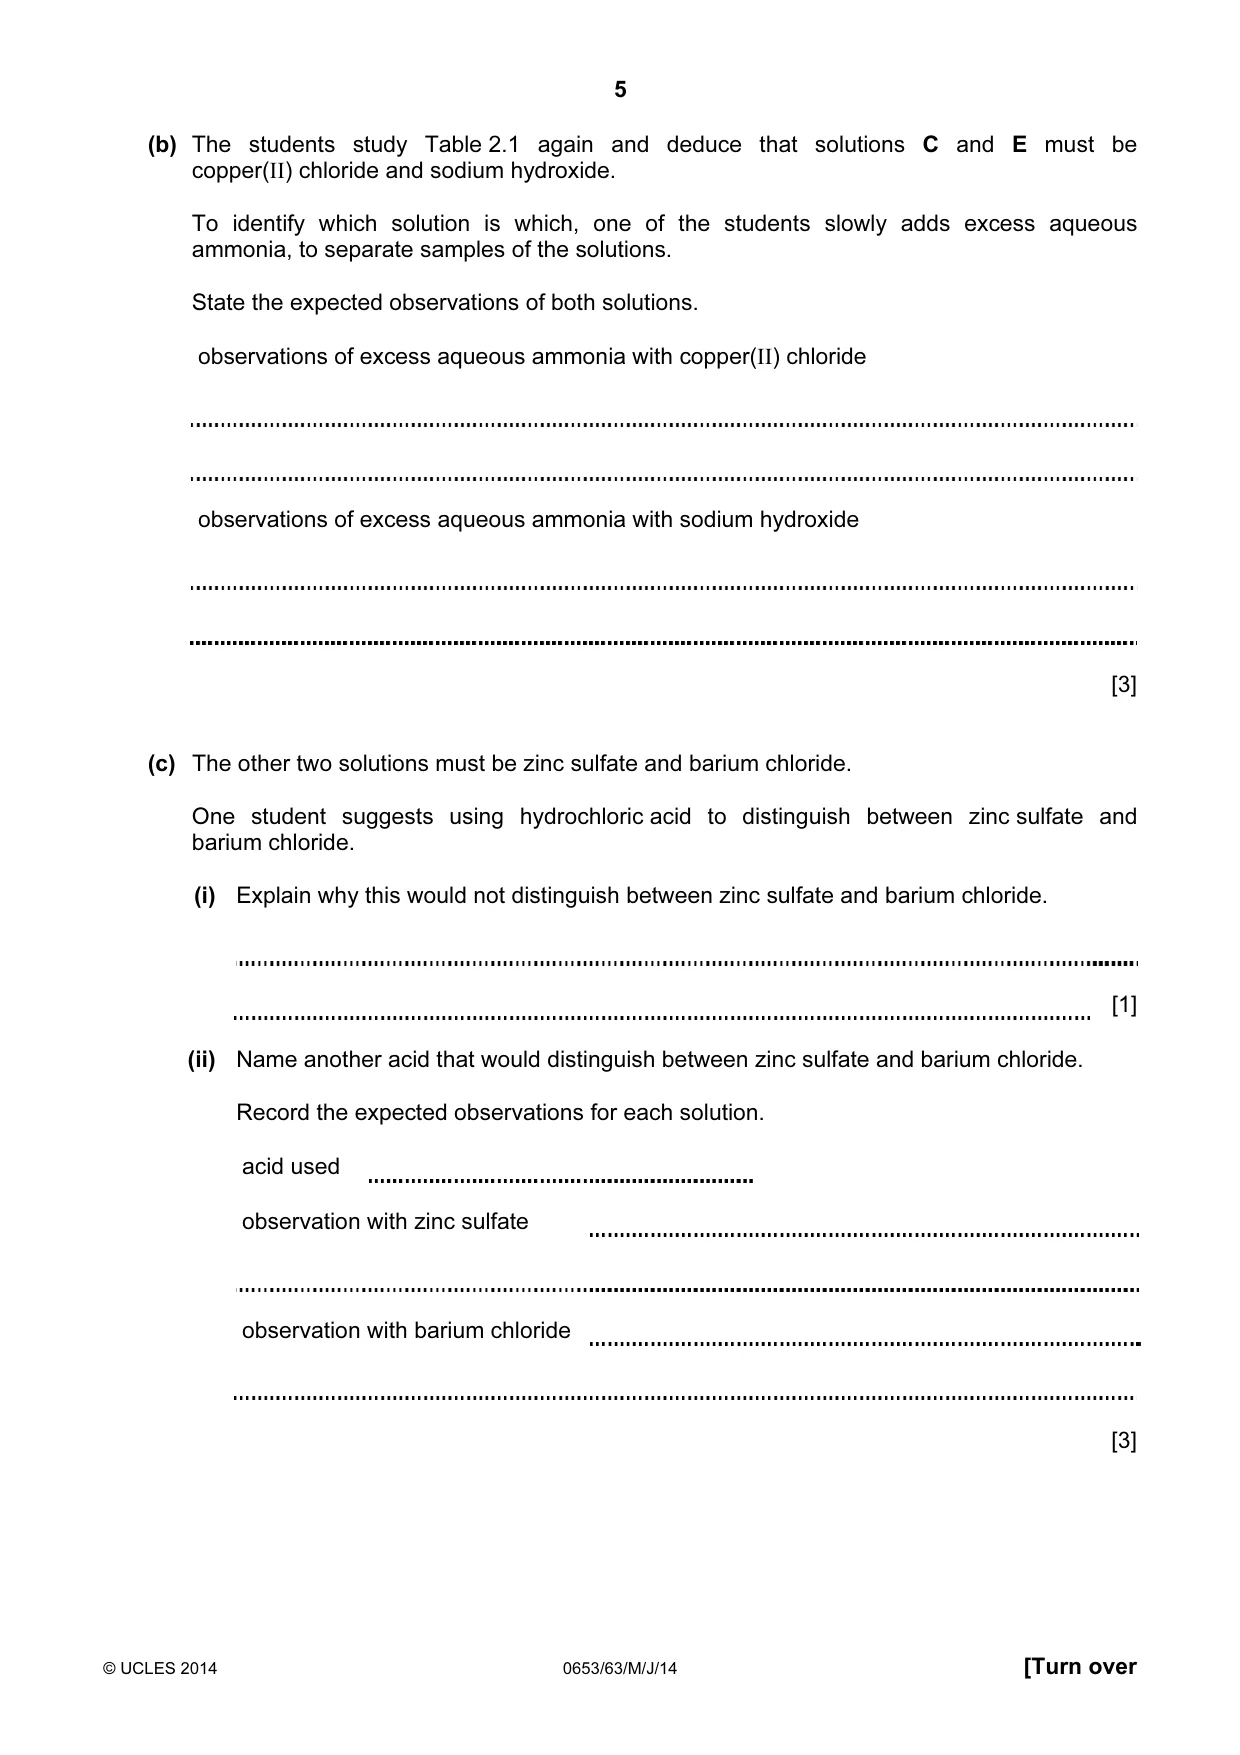
5 © UCLES 2014 0653/63/M/J/14 [Turn over (b) The students study Table 2.1 again and deduce that solutions C and E must be copper(II) chloride and sodium hydroxide. To identify which solution is which, one of the students slowly adds excess aqueous ammonia, to separate samples of the solutions. State the expected observations of both solutions. observations of excess aqueous ammonia with copper(II) chloride observations of excess aqueous ammonia with sodium hydroxide [3] (c) The other two solutions must be zinc sulfate and barium chloride. One student suggests using hydrochloric acid to distinguish between zinc sulfate and barium chloride. (i) Explain why this would not distinguish between zinc sulfate and barium chloride. [1] (ii) Name another acid that would distinguish between zinc sulfate and barium chloride. Record the expected observations for each solution. acid used observation with zinc sulfate observation with barium chloride [3]
Question paper, page 6
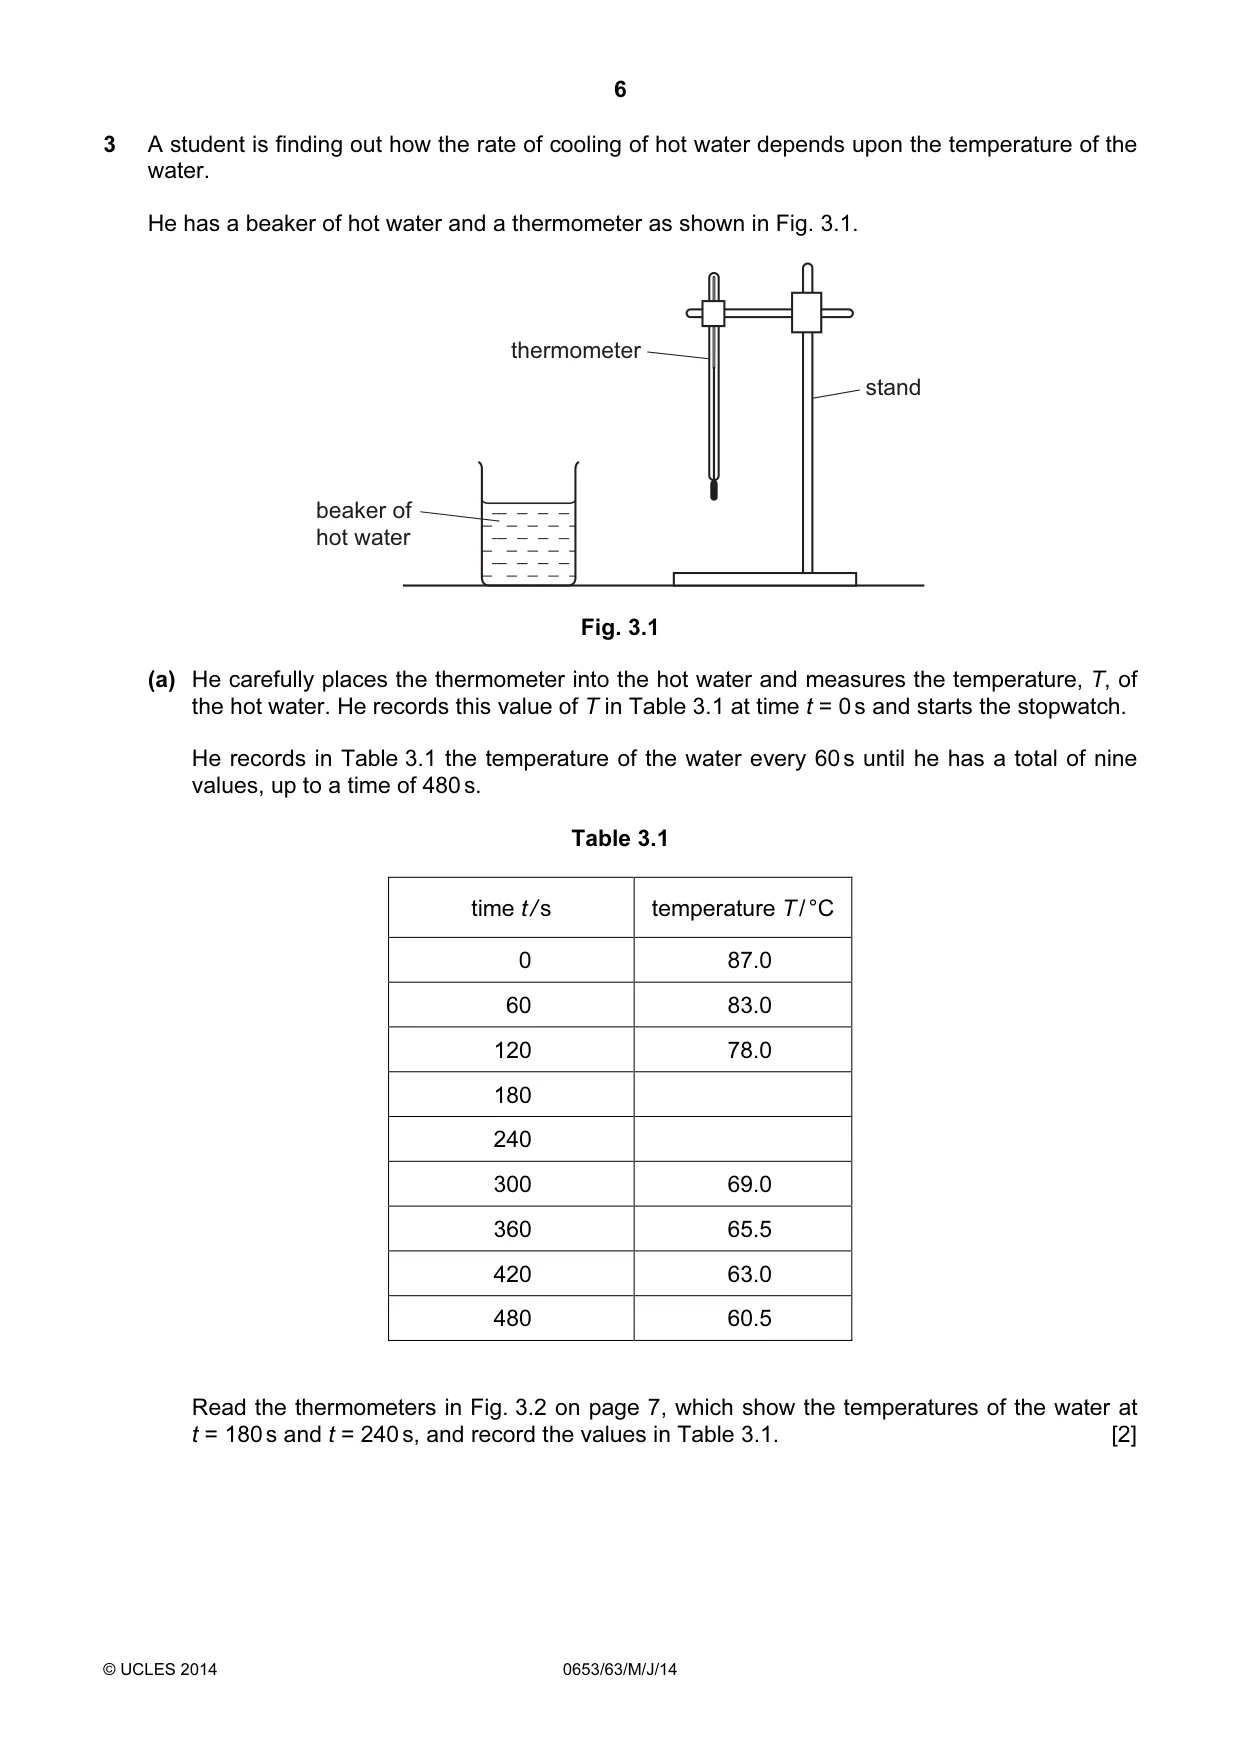
6 © UCLES 2014 0653/63/M/J/14 3 A student is finding out how the rate of cooling of hot water depends upon the temperature of the water. He has a beaker of hot water and a thermometer as shown in Fig. 3.1. beaker of hot water thermometer stand Fig. 3.1 (a) He carefully places the thermometer into the hot water and measures the temperature, T, of the hot water. He records this value of T in Table 3.1 at time t = 0 s and starts the stopwatch. He records in Table 3.1 the temperature of the water every 60 s until he has a total of nine values, up to a time of 480 s. Table 3.1 time t / s temperature T / °C 0 87.0 60 83.0 120 78.0 180 240 300 69.0 360 65.5 420 63.0 480 60.5 Read the thermometers in Fig. 3.2 on page 7, which show the temperatures of the water at t = 180 s and t = 240 s, and record the values in Table 3.1. [2]
Question paper, page 7
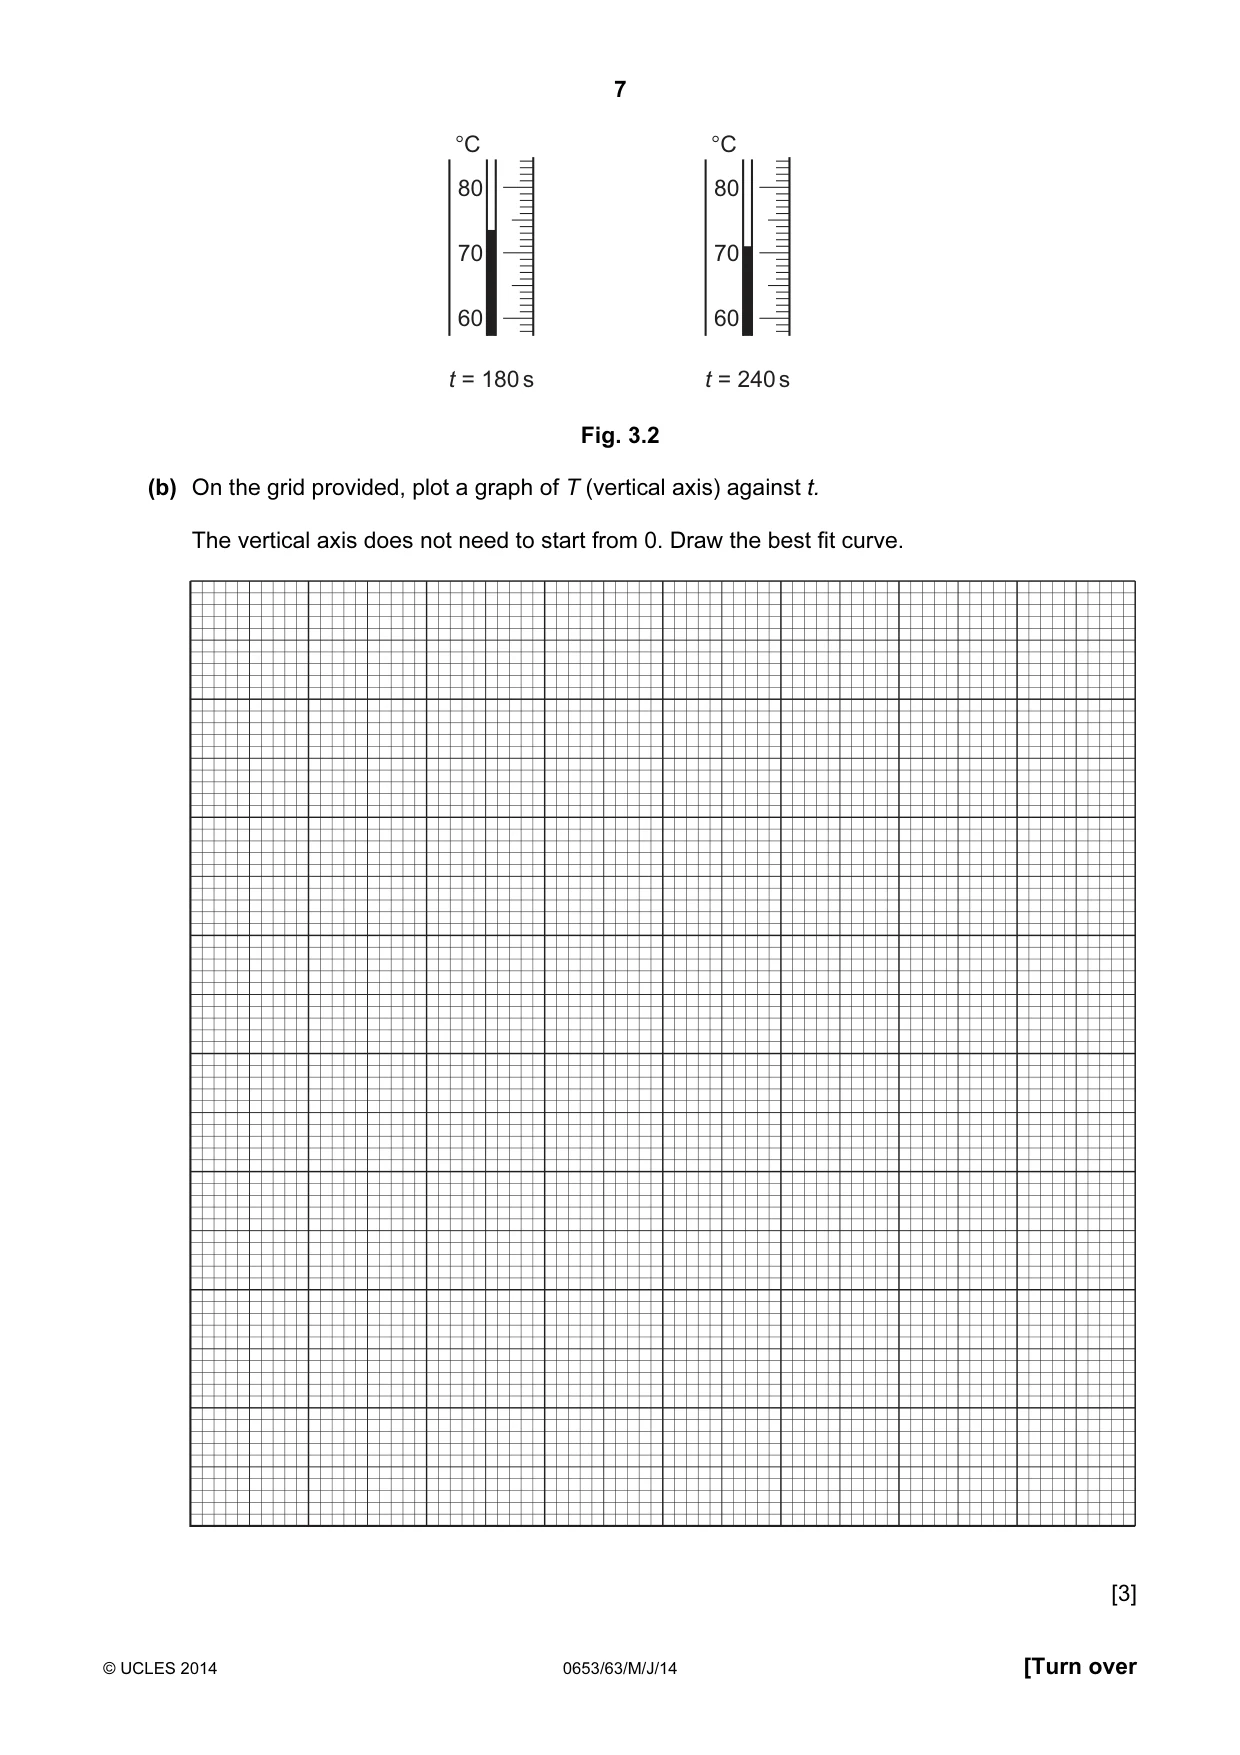
7 © UCLES 2014 0653/63/M/J/14 [Turn over 80 70 60 °C t = 180 s 80 70 60 °C t = 240 s Fig. 3.2 (b) On the grid provided, plot a graph of T (vertical axis) against t. The vertical axis does not need to start from 0. Draw the best fit curve. [3]
Question paper, page 8
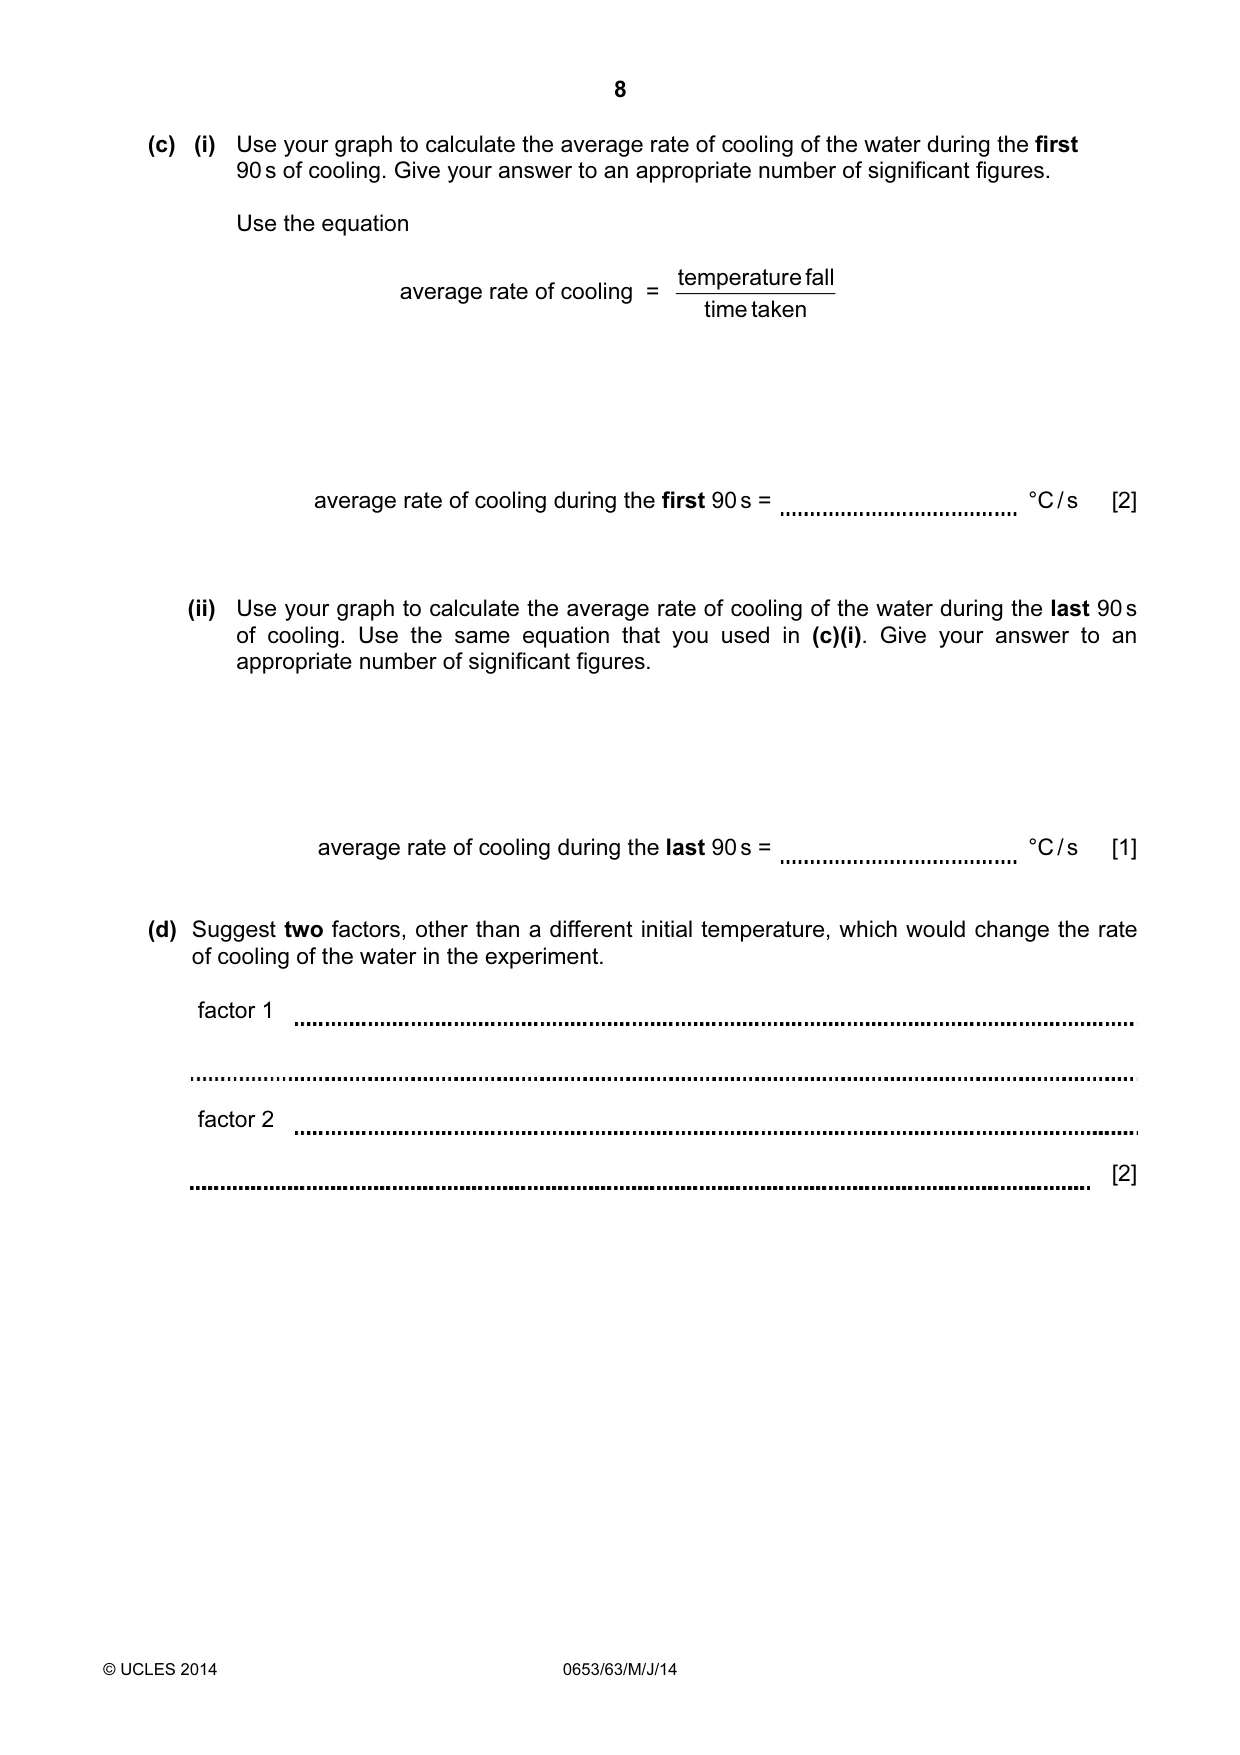
8 © UCLES 2014 0653/63/M/J/14 (c) (i) Use your graph to calculate the average rate of cooling of the water during the first 90 s of cooling. Give your answer to an appropriate number of significant figures. Use the equation average rate of cooling = taken time fall e temperatur average rate of cooling during the first 90 s = °C / s [2] (ii) Use your graph to calculate the average rate of cooling of the water during the last 90 s of cooling. Use the same equation that you used in (c)(i). Give your answer to an appropriate number of significant figures. average rate of cooling during the last 90 s = °C / s [1] (d) Suggest two factors, other than a different initial temperature, which would change the rate of cooling of the water in the experiment. factor 1 factor 2 [2]
Question paper, page 9
9 © UCLES 2014 0653/63/M/J/14 [Turn over Please turn over for Question 4.
Question paper, page 10
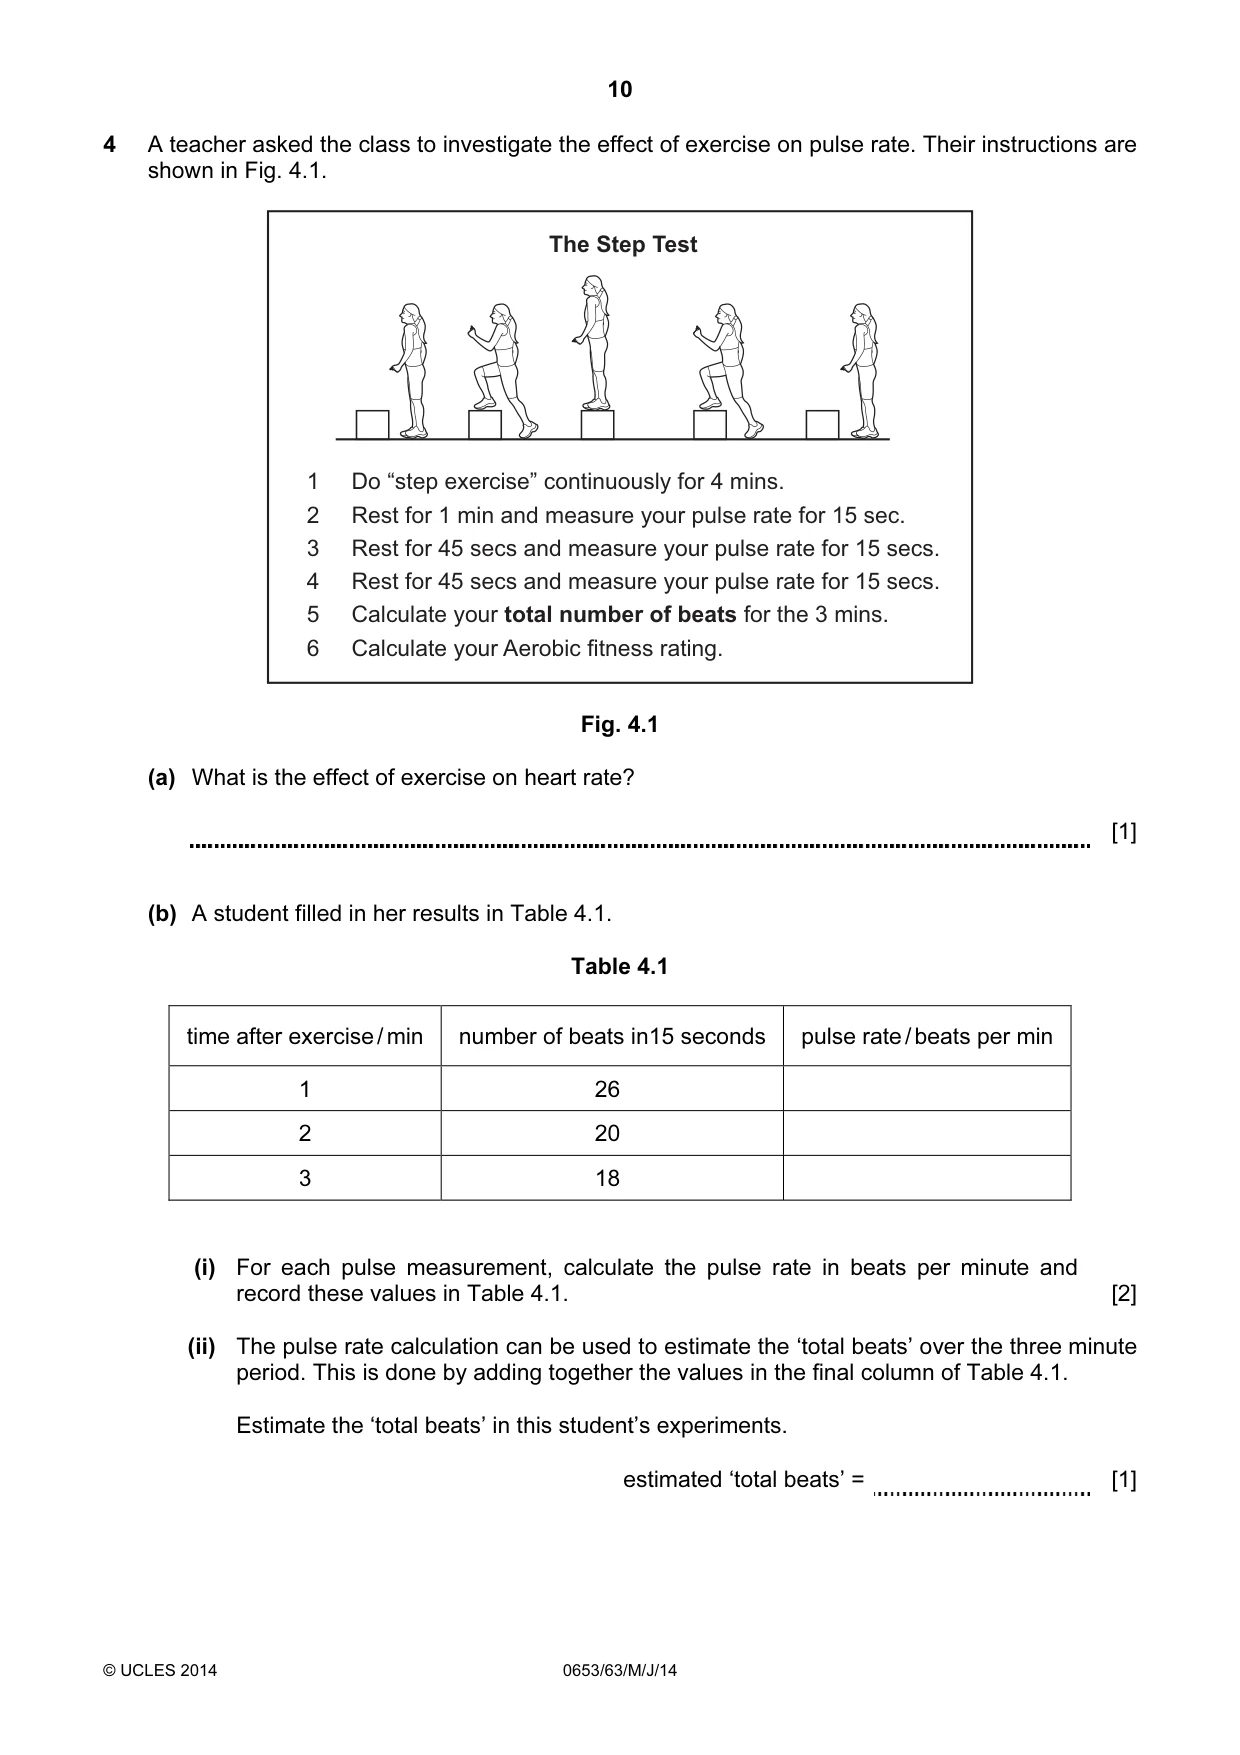
10 © UCLES 2014 0653/63/M/J/14 4 A teacher asked the class to investigate the effect of exercise on pulse rate. Their instructions are shown in Fig. 4.1. The Step Test 1 Do “step exercise” continuously for 4 mins. 2 Rest for 1 min and measure your pulse rate for 15 sec. 3 Rest for 45 secs and measure your pulse rate for 15 secs. 4 Rest for 45 secs and measure your pulse rate for 15 secs. 5 Calculate your total number of beats for the 3 mins. 6 Calculate your Aerobic fitness rating. Fig. 4.1 (a) What is the effect of exercise on heart rate? [1] (b) A student filled in her results in Table 4.1. Table 4.1 time after exercise / min number of beats in15 seconds pulse rate / beats per min 1 26 2 20 3 18 (i) For each pulse measurement, calculate the pulse rate in beats per minute and record these values in Table 4.1. [2] (ii) The pulse rate calculation can be used to estimate the ‘total beats’ over the three minute period. This is done by adding together the values in the final column of Table 4.1. Estimate the ‘total beats’ in this student’s experiments. estimated ‘total beats’ = [1]
Question paper, page 11
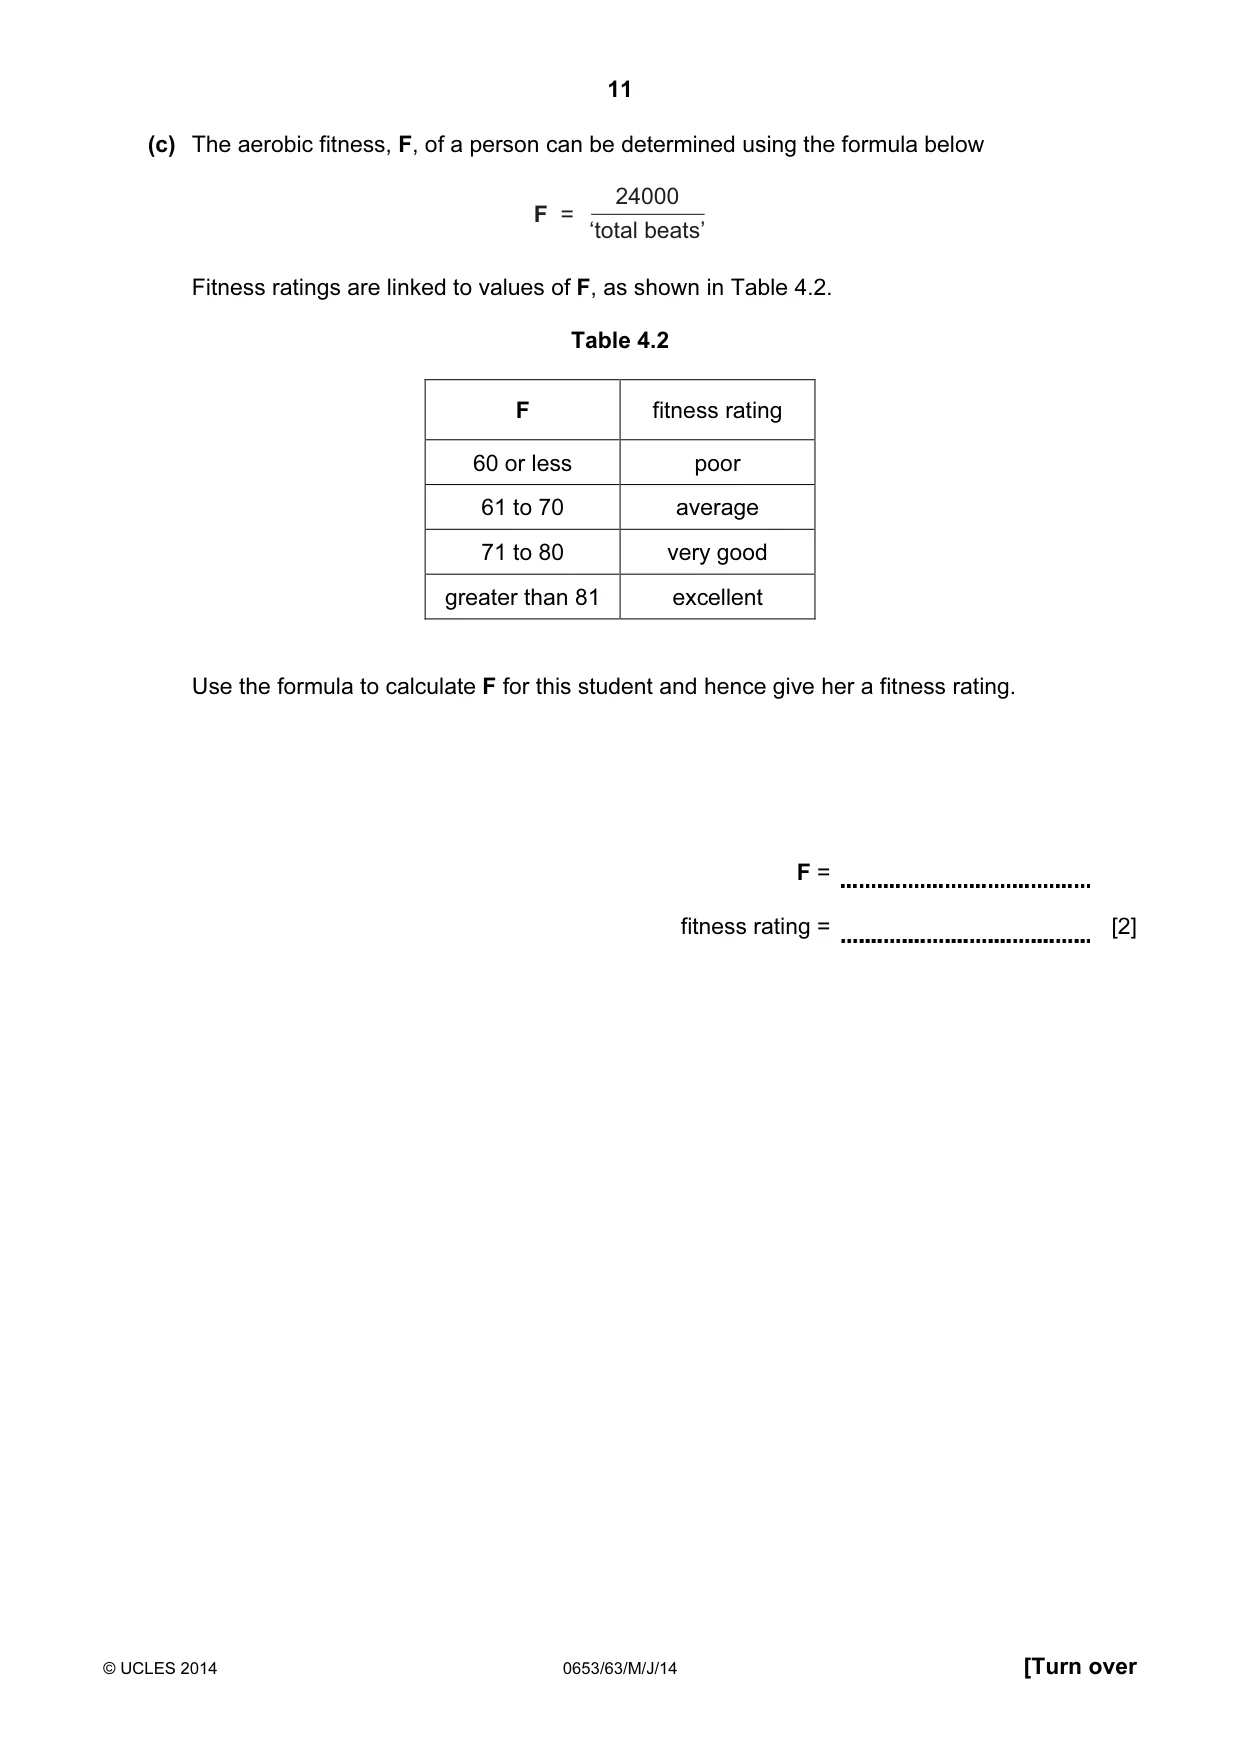
11 © UCLES 2014 0653/63/M/J/14 [Turn over (c) The aerobic fitness, F, of a person can be determined using the formula below 24000 ‘total beats’ F = Fitness ratings are linked to values of F, as shown in Table 4.2. Table 4.2 F fitness rating 60 or less poor 61 to 70 average 71 to 80 very good greater than 81 excellent Use the formula to calculate F for this student and hence give her a fitness rating. F = fitness rating = [2]
Question paper, page 12
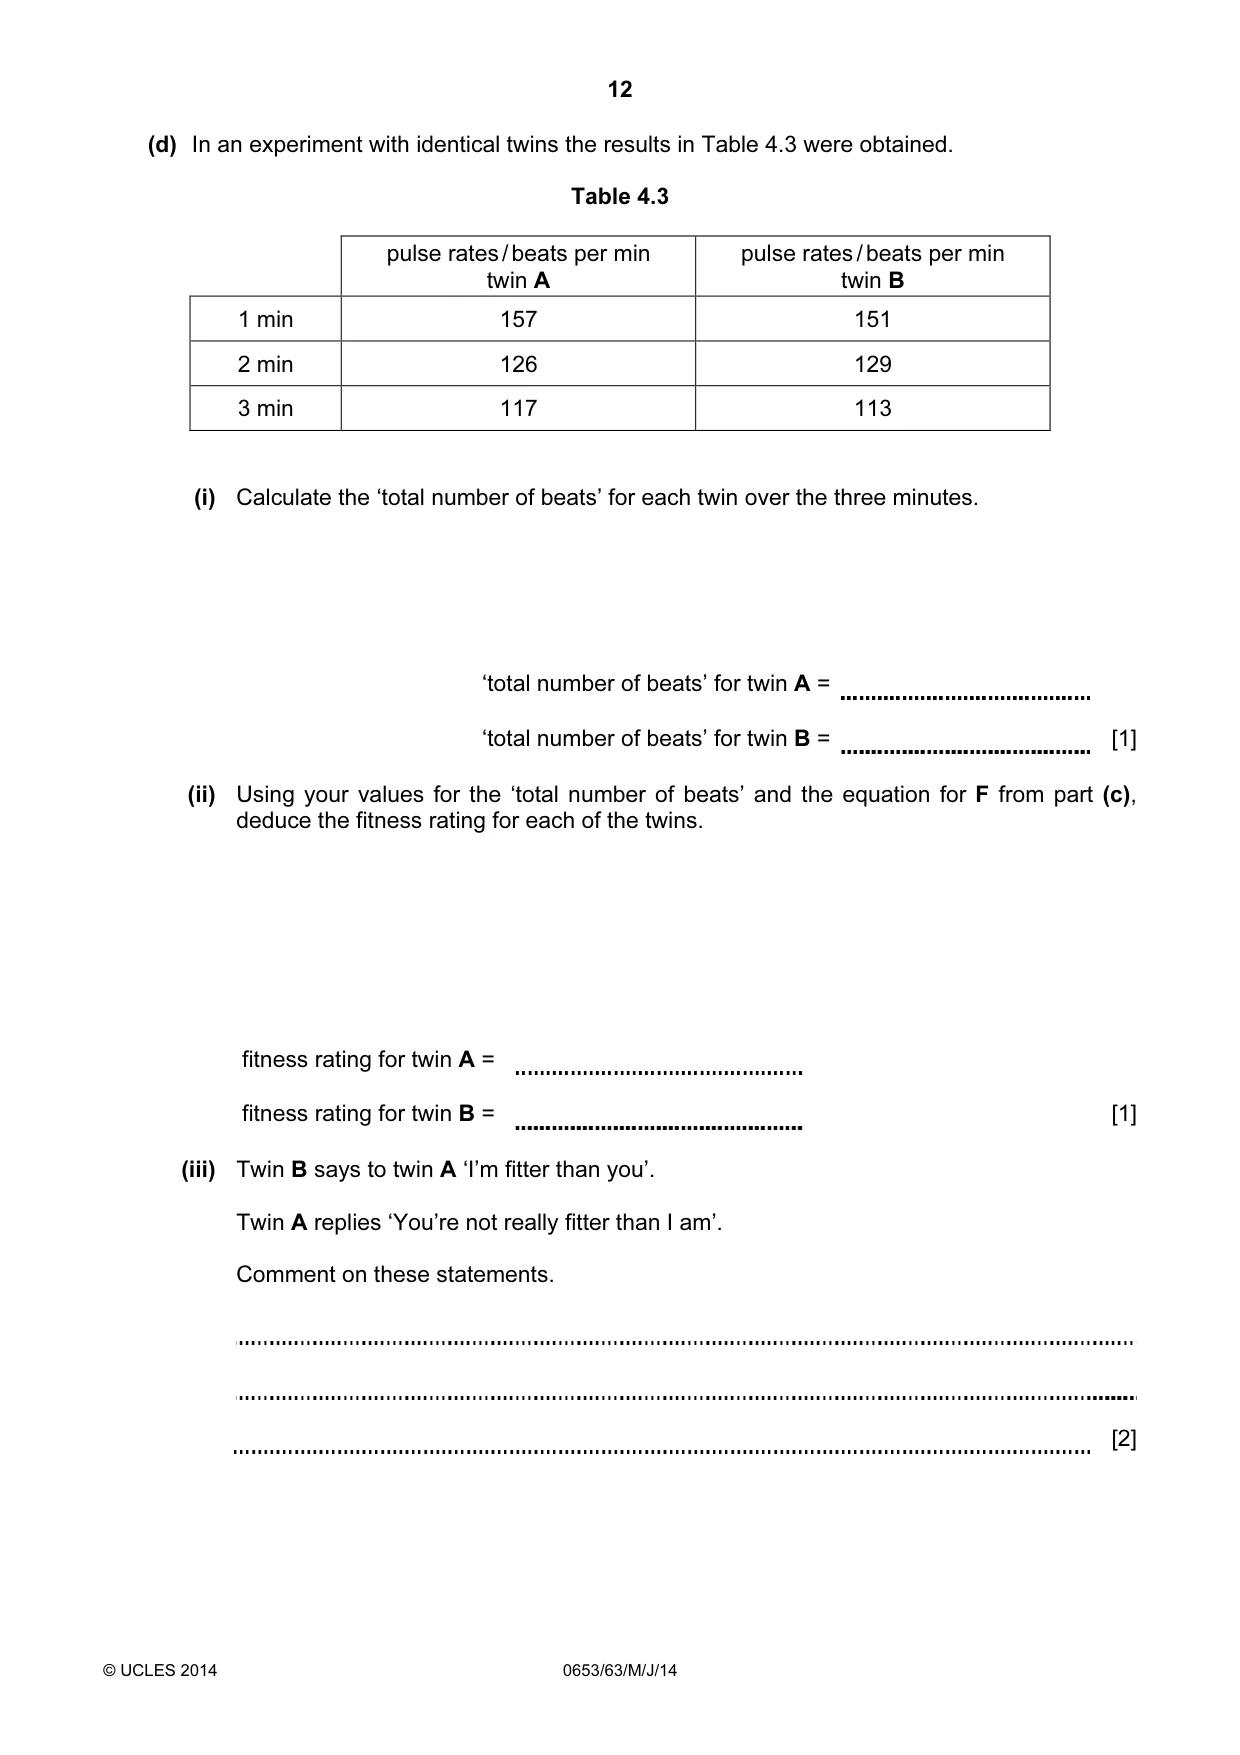
12 © UCLES 2014 0653/63/M/J/14 (d) In an experiment with identical twins the results in Table 4.3 were obtained. Table 4.3 pulse rates / beats per min twin A pulse rates / beats per min twin B 1 min 157 151 2 min 126 129 3 min 117 113 (i) Calculate the ‘total number of beats’ for each twin over the three minutes. ‘total number of beats’ for twin A = ‘total number of beats’ for twin B = [1] (ii) Using your values for the ‘total number of beats’ and the equation for F from part (c), deduce the fitness rating for each of the twins. fitness rating for twin A = fitness rating for twin B = [1] (iii) Twin B says to twin A ‘I’m fitter than you’. Twin A replies ‘You’re not really fitter than I am’. Comment on these statements. [2]
Question paper, page 13
13 © UCLES 2014 0653/63/M/J/14 [Turn over Please turn over for Question 5.
Question paper, page 14
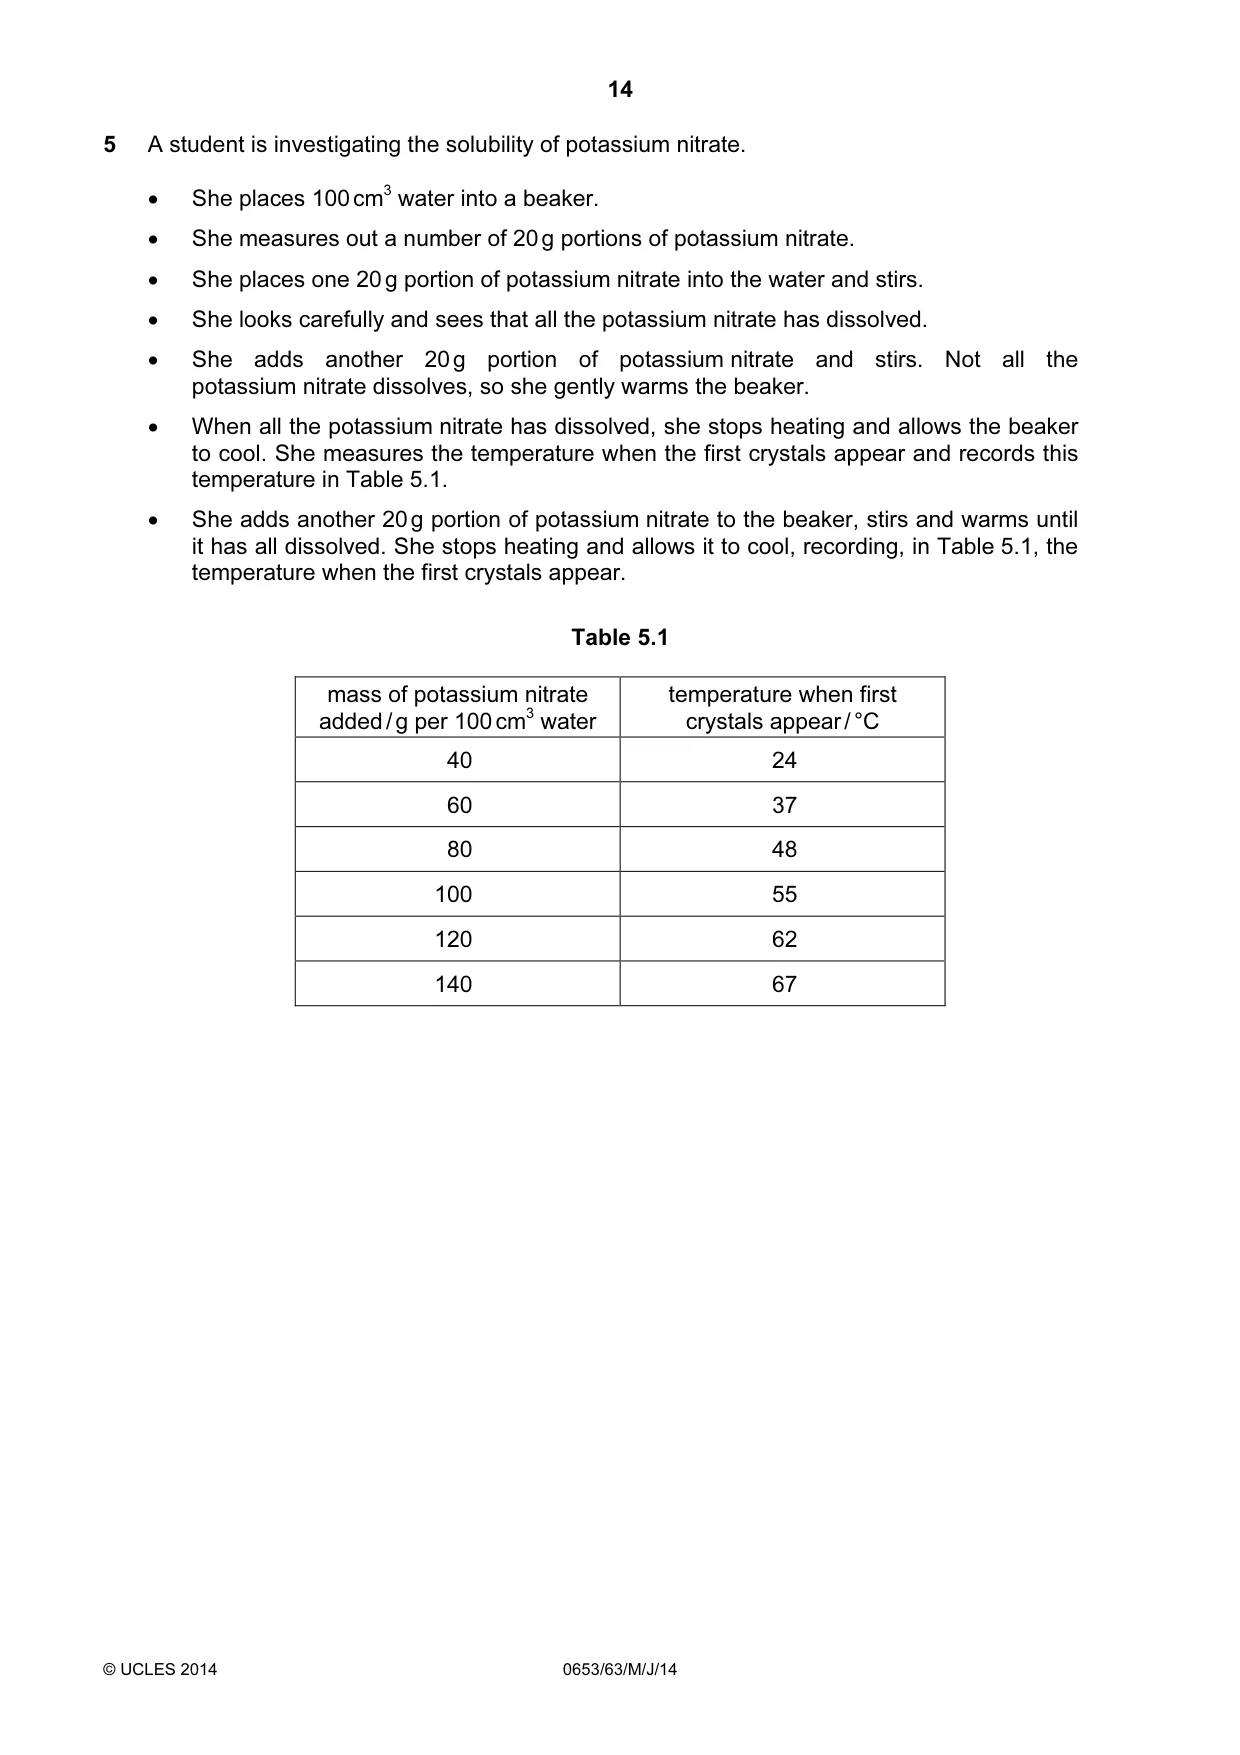
14 © UCLES 2014 0653/63/M/J/14 5 A student is investigating the solubility of potassium nitrate. • She places 100 cm3 water into a beaker. • She measures out a number of 20 g portions of potassium nitrate. • She places one 20 g portion of potassium nitrate into the water and stirs. • She looks carefully and sees that all the potassium nitrate has dissolved. • She adds another 20 g portion of potassium nitrate and stirs. Not all the potassium nitrate dissolves, so she gently warms the beaker. • When all the potassium nitrate has dissolved, she stops heating and allows the beaker to cool. She measures the temperature when the first crystals appear and records this temperature in Table 5.1. • She adds another 20 g portion of potassium nitrate to the beaker, stirs and warms until it has all dissolved. She stops heating and allows it to cool, recording, in Table 5.1, the temperature when the first crystals appear. Table 5.1 mass of potassium nitrate added / g per 100 cm3 water temperature when first crystals appear / °C 40 24 60 37 80 48 100 55 120 62 140 67
Question paper, page 15
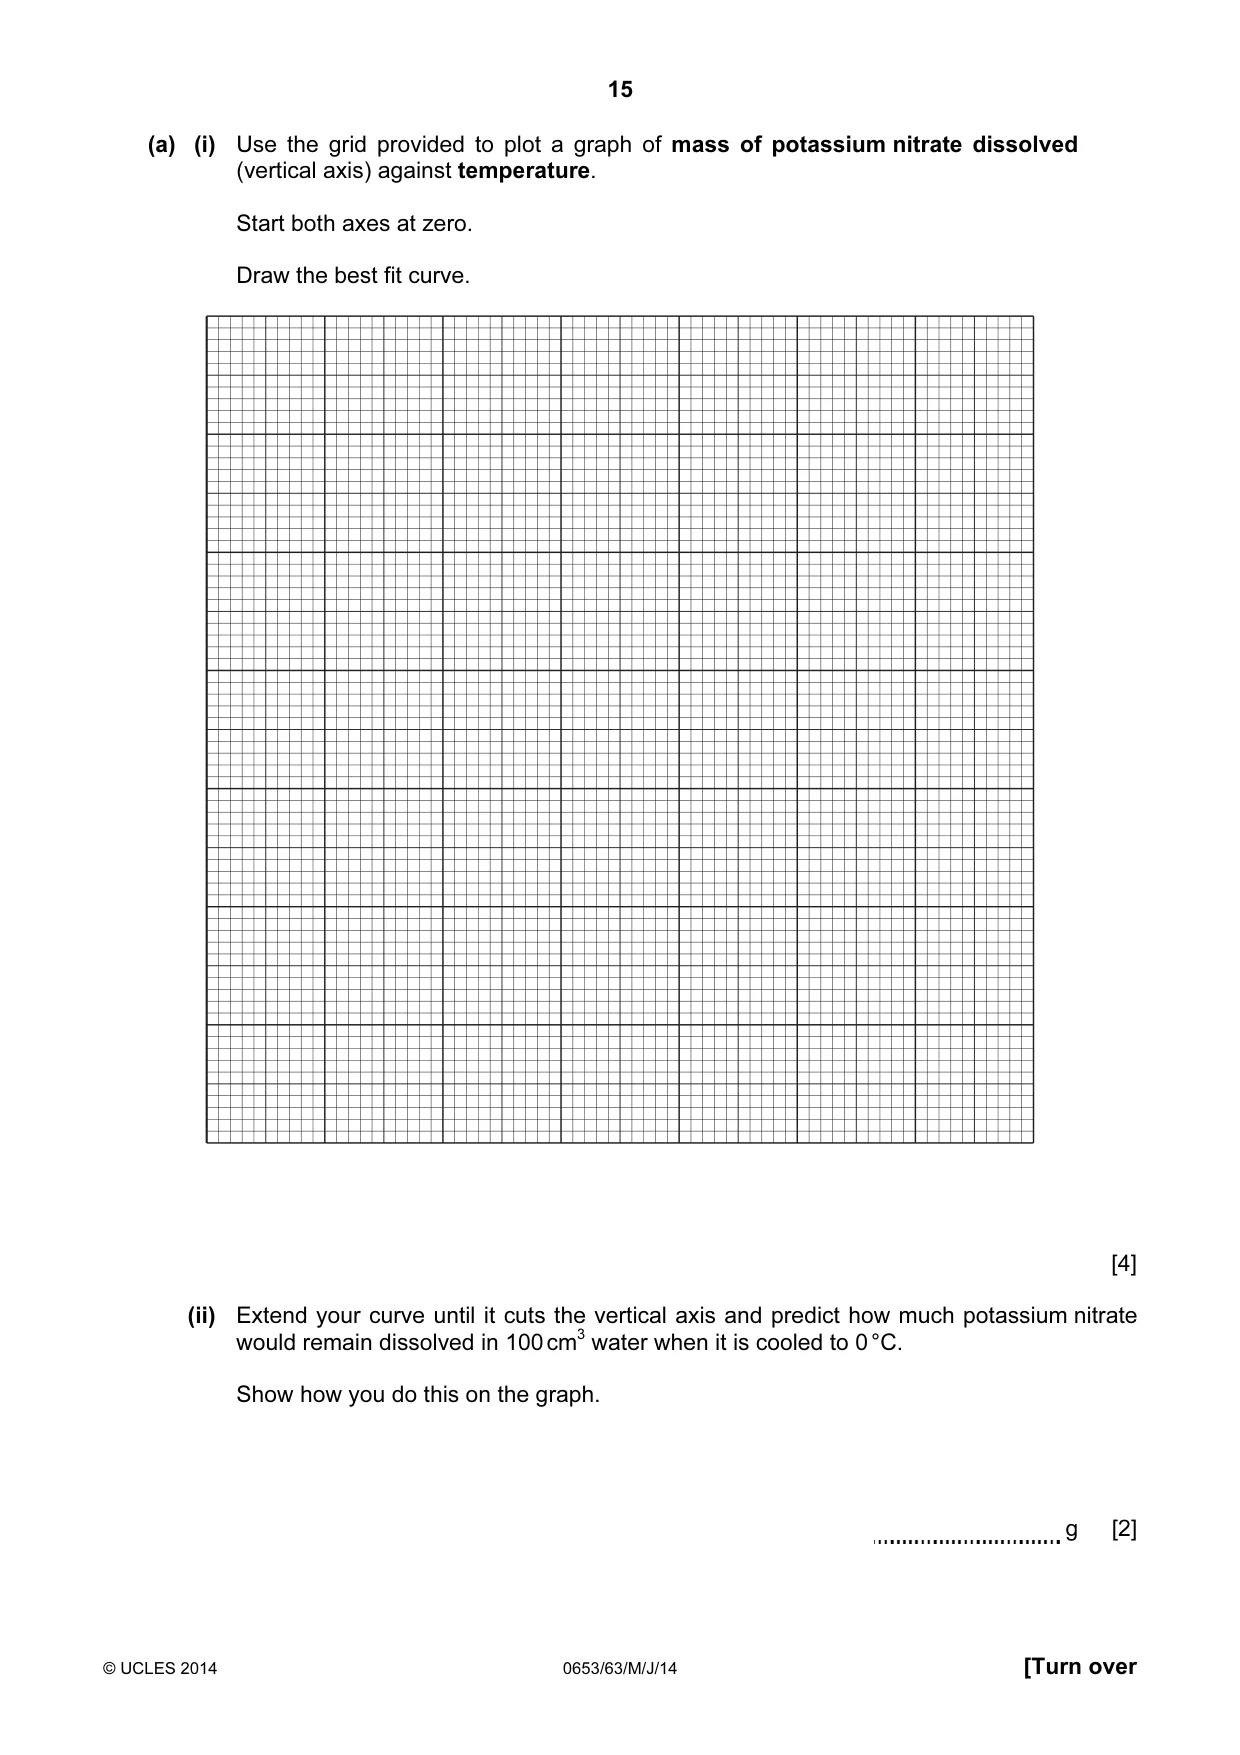
15 © UCLES 2014 0653/63/M/J/14 [Turn over (a) (i) Use the grid provided to plot a graph of mass of potassium nitrate dissolved (vertical axis) against temperature. Start both axes at zero. Draw the best fit curve. [4] (ii) Extend your curve until it cuts the vertical axis and predict how much potassium nitrate would remain dissolved in 100 cm3 water when it is cooled to 0 °C. Show how you do this on the graph. g [2]
Question paper, page 16
16 © UCLES 2014 0653/63/M/J/14 (iii) The solution of potassium nitrate at 0 °C is still a liquid. Suggest the effect that dissolving potassium nitrate has on the freezing point of water. [1] (iv) Use your graph to calculate the mass of potassium nitrate that will be precipitated if the saturated solution was cooled from 65 °C to 25 °C. Show your working on the graph. g [2] (b) In carrying out the experiment the student warmed the mixture to dissolve the potassium nitrate and recorded the temperature at which the first crystals appeared as it cooled down. Suggest a reason why the student does not record the temperature at which the potassium nitrate dissolves as she warms the beaker up. [1]
Question paper, page 17
17 © UCLES 2014 0653/63/M/J/14 [Turn over Please turn over for Question 6.
Question paper, page 18
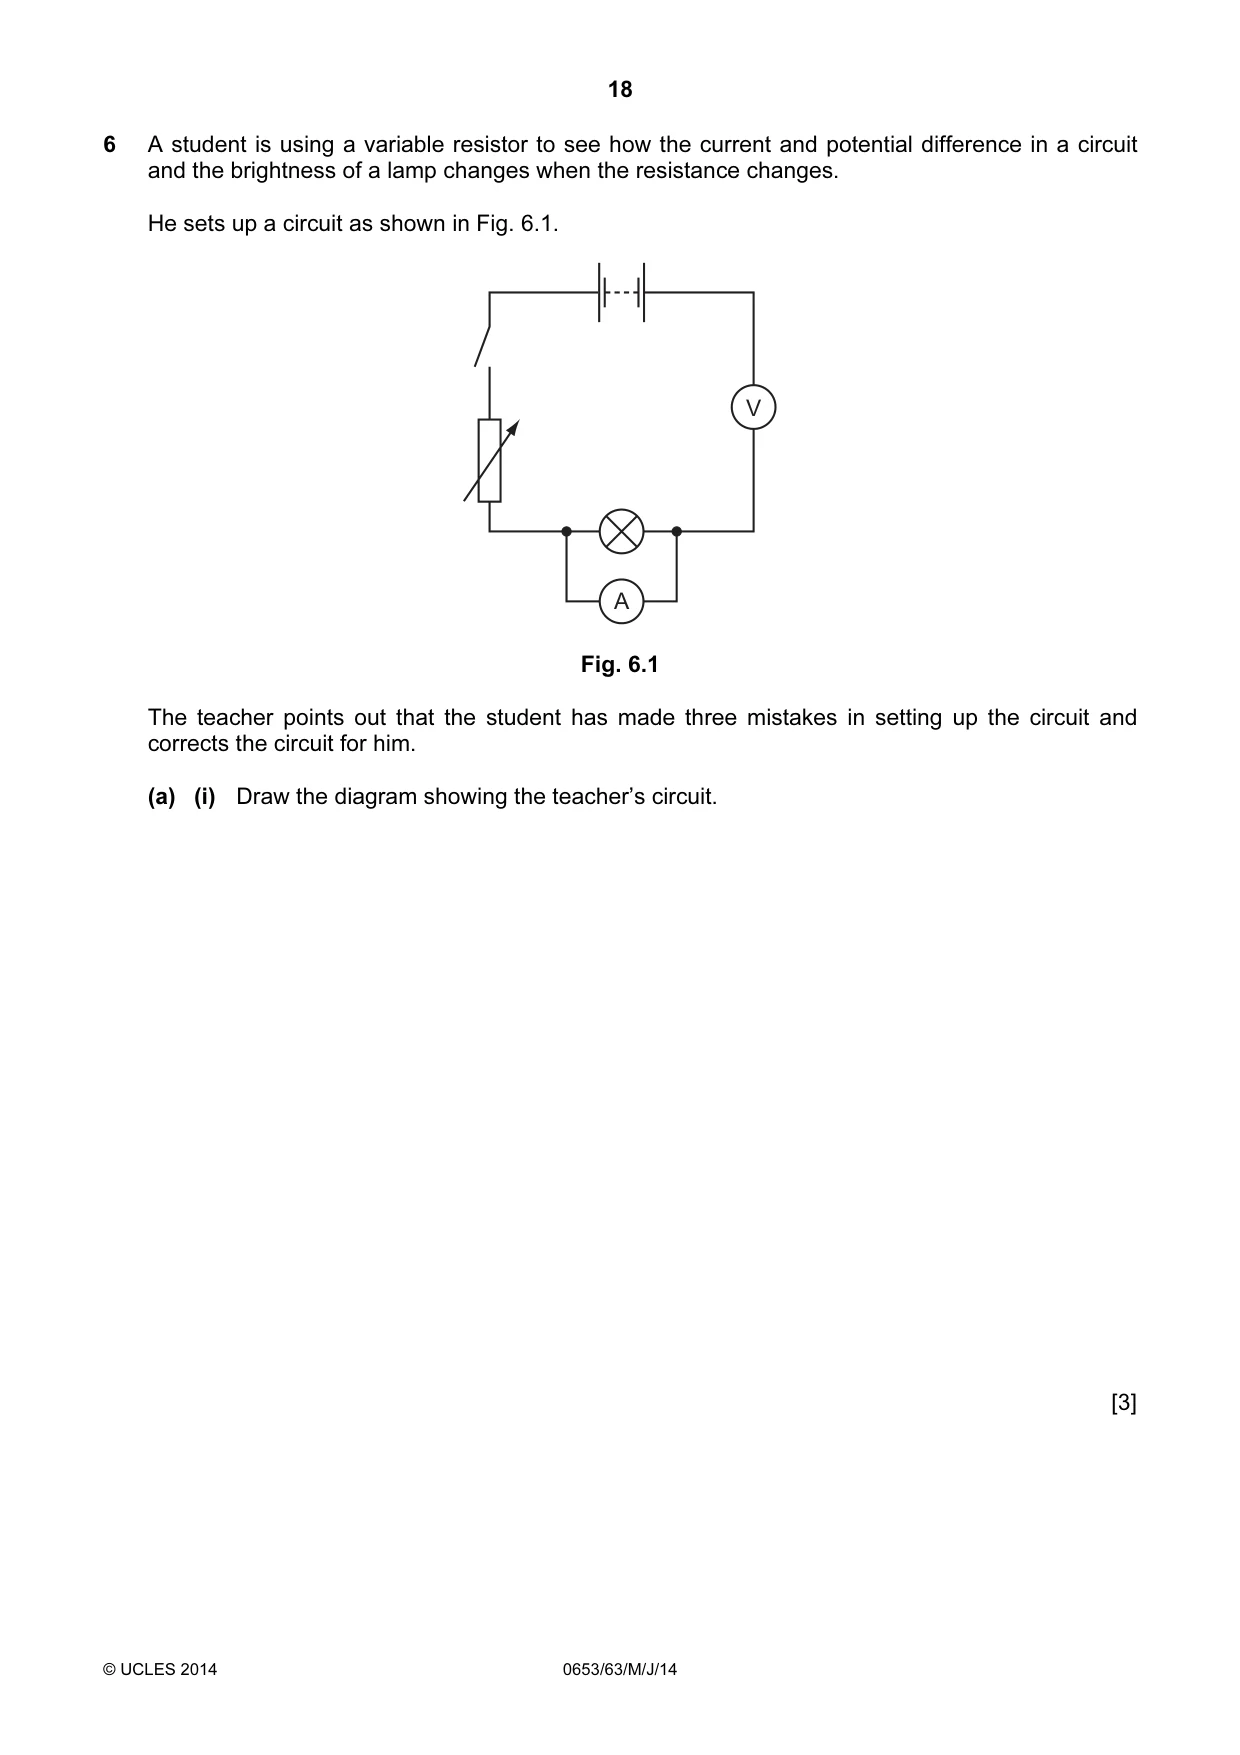
18 © UCLES 2014 0653/63/M/J/14 6 A student is using a variable resistor to see how the current and potential difference in a circuit and the brightness of a lamp changes when the resistance changes. He sets up a circuit as shown in Fig. 6.1. A V Fig. 6.1 The teacher points out that the student has made three mistakes in setting up the circuit and corrects the circuit for him. (a) (i) Draw the diagram showing the teacher’s circuit. [3]
Question paper, page 19
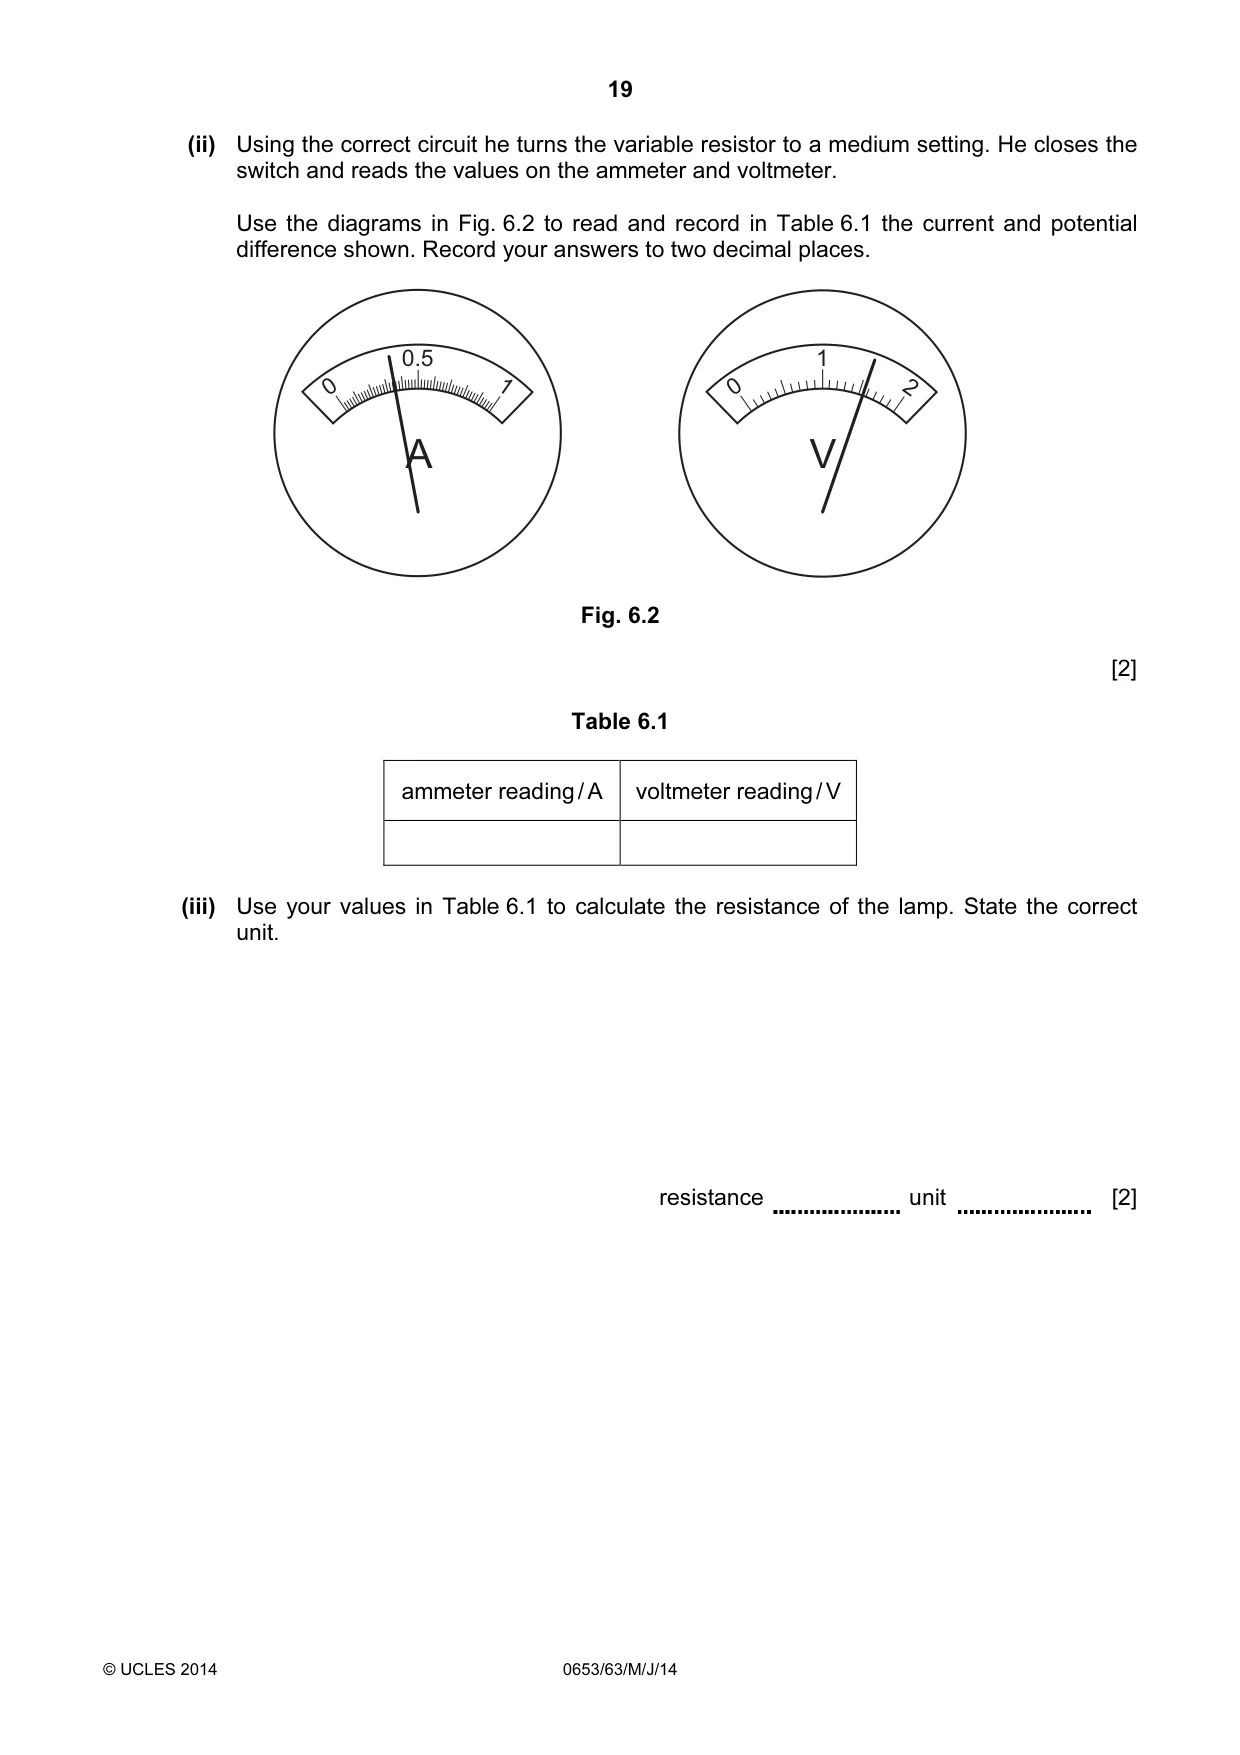
19 © UCLES 2014 0653/63/M/J/14 (ii) Using the correct circuit he turns the variable resistor to a medium setting. He closes the switch and reads the values on the ammeter and voltmeter. Use the diagrams in Fig. 6.2 to read and record in Table 6.1 the current and potential difference shown. Record your answers to two decimal places. A 0.5 1 0 2 0 V 1 Fig. 6.2 [2] Table 6.1 ammeter reading / A voltmeter reading / V (iii) Use your values in Table 6.1 to calculate the resistance of the lamp. State the correct unit. resistance unit [2]
Question paper, page 20
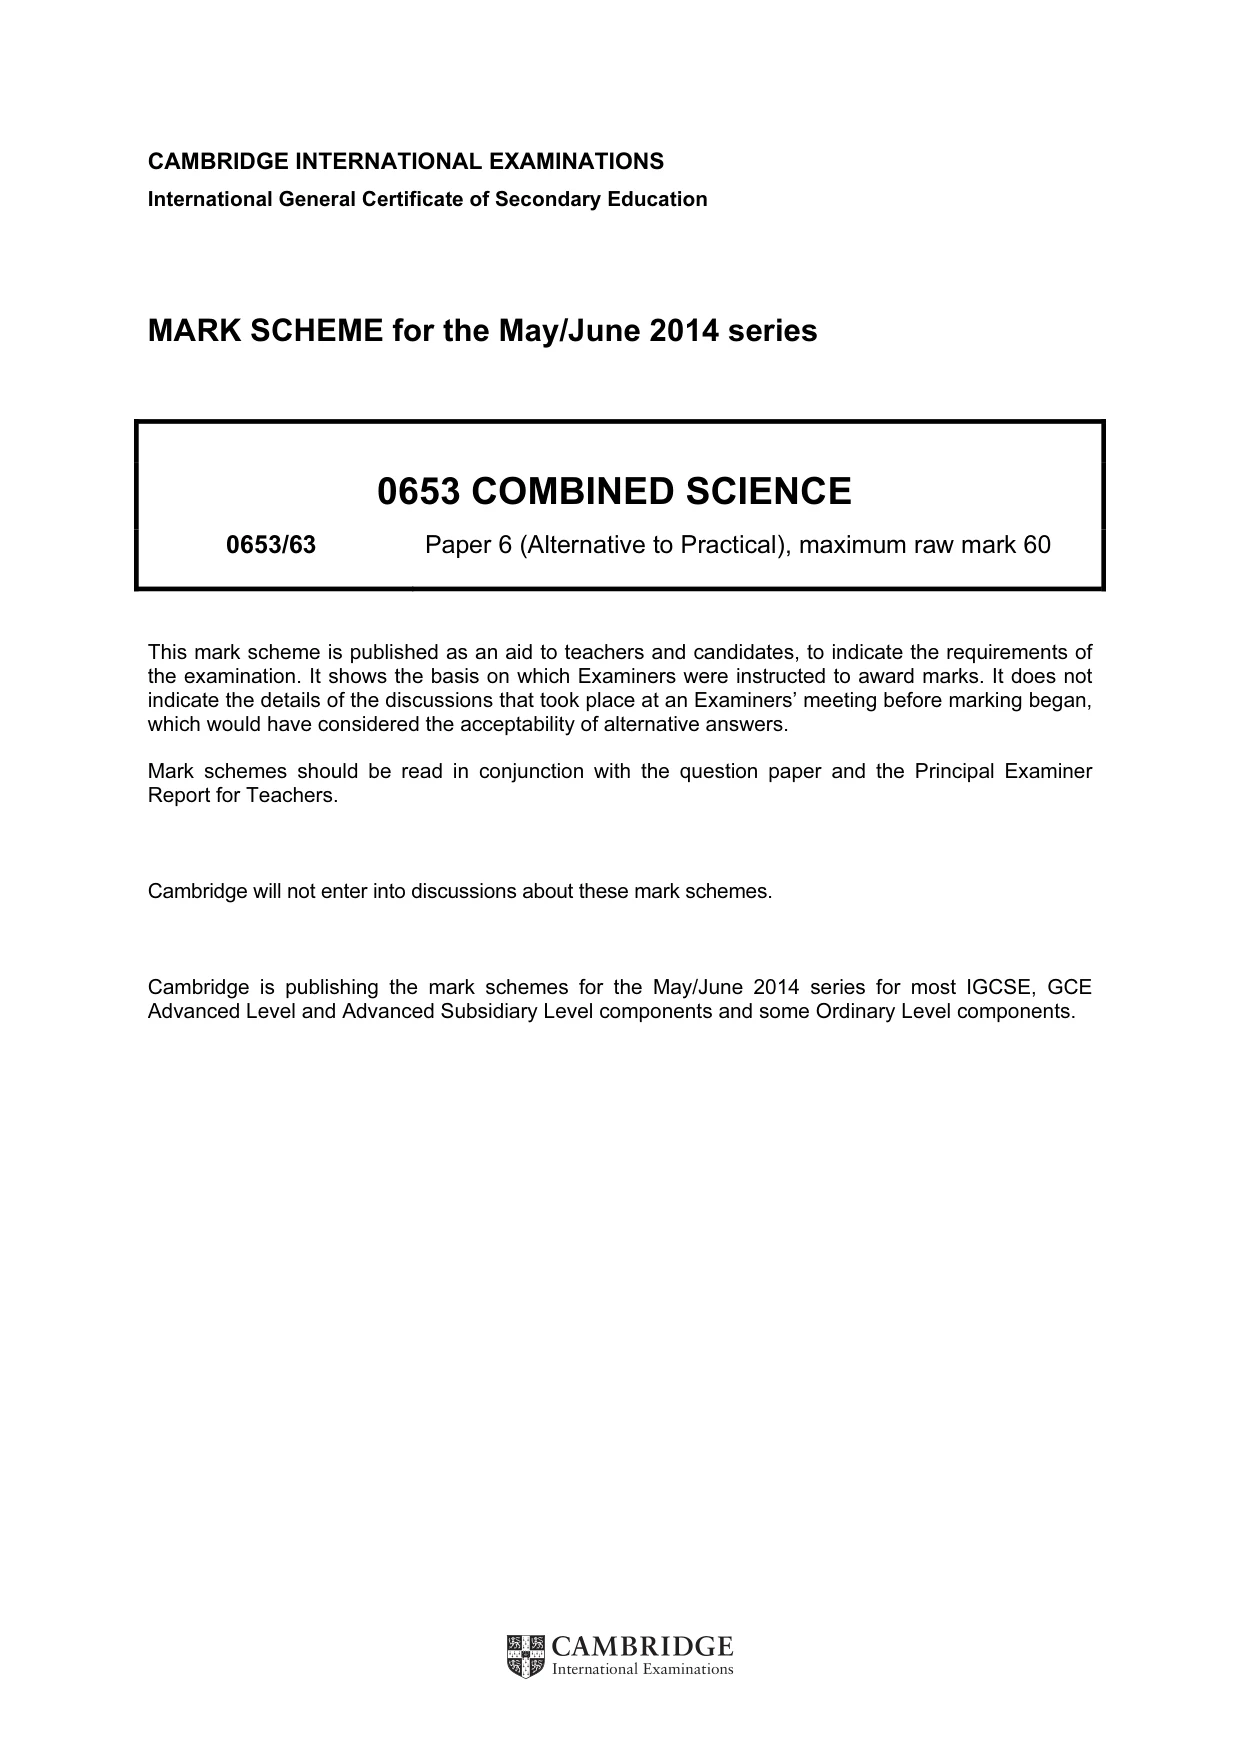
20 Permission to reproduce items where third-party owned material protected by copyright is included has been sought and cleared where possible. Every reasonable effort has been made by the publisher (UCLES) to trace copyright holders, but if any items requiring clearance have unwittingly been included, the publisher will be pleased to make amends at the earliest possible opportunity. Cambridge International Examinations is part of the Cambridge Assessment Group. Cambridge Assessment is the brand name of University of Cambridge Local Examinations Syndicate (UCLES), which is itself a department of the University of Cambridge. © UCLES 2014 0653/63/M/J/14 (b) (i) The student changes the setting on the variable resistor to the highest resistance. State what will happen to the ammeter reading and the brightness of the lamp. ammeter reading brightness of the lamp [1] (ii) The student slowly changes the setting on the variable resistor to the lowest resistance. He sees the lamp getting brighter and brighter and then suddenly going out. Suggest explanations for these observations. [2]
Mark scheme, page 1
CAMBRIDGE INTERNATIONAL EXAMINATIONS International General Certificate of Secondary Education MARK SCHEME for the May/June 2014 series 0653 COMBINED SCIENCE 0653/63 Paper 6 (Alternative to Practical), maximum raw mark 60 This mark scheme is published as an aid to teachers and candidates, to indicate the requirements of the examination. It shows the basis on which Examiners were instructed to award marks. It does not indicate the details of the discussions that took place at an Examiners’ meeting before marking began, which would have considered the acceptability of alternative answers. Mark schemes should be read in conjunction with the question paper and the Principal Examiner Report for Teachers. Cambridge will not enter into discussions about these mark schemes. Cambridge is publishing the mark schemes for the May/June 2014 series for most IGCSE, GCE Advanced Level and Advanced Subsidiary Level components and some Ordinary Level components.
Mark scheme, page 2
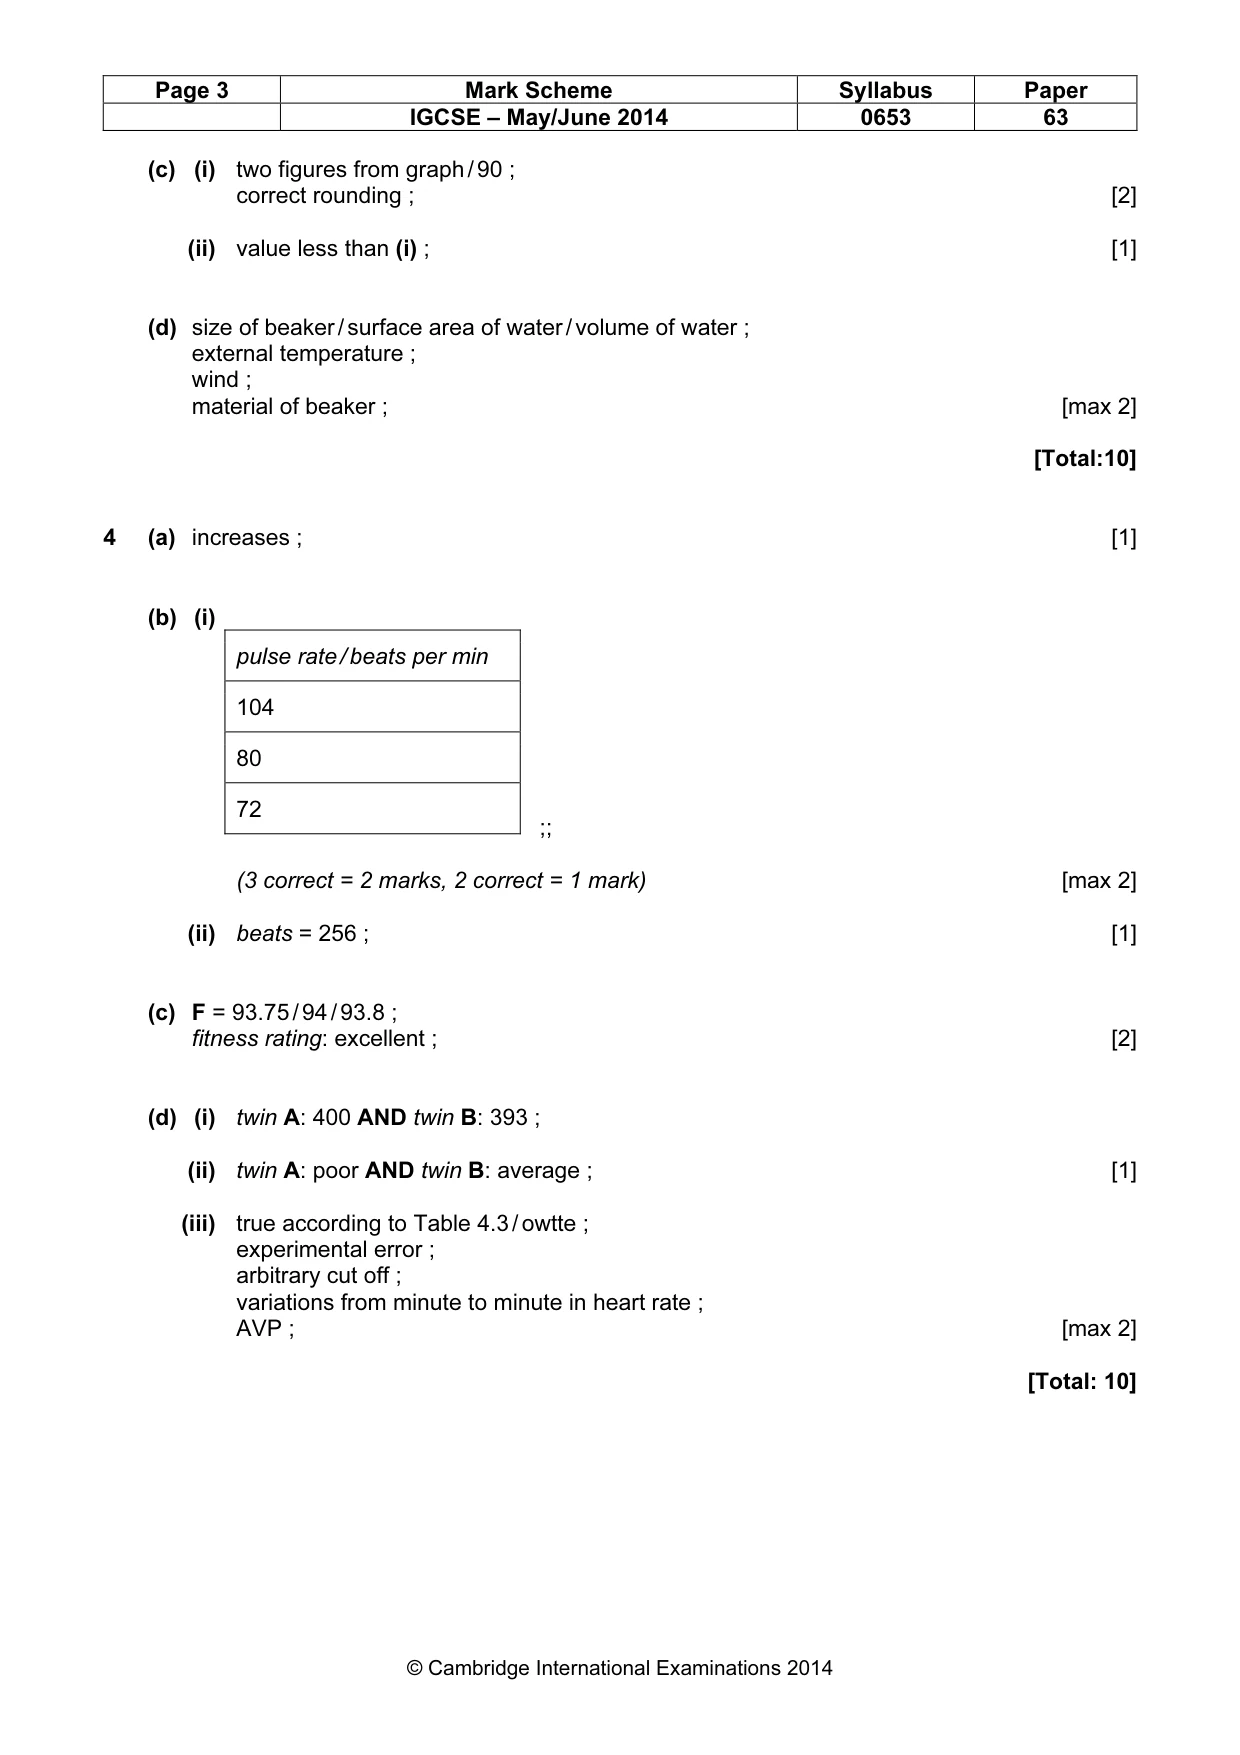
Page 2 Mark Scheme Syllabus Paper IGCSE – May/June 2014 0653 63 © Cambridge International Examinations 2014 1 (a) (i) good quality drawing ; carpel, stamen and at least two petals drawn ; [2] (ii) stamen correctly labelled ; carpel correctly labelled ; [2] (b) (i) correct measurement from photograph – 68 (mm) ; [1] (ii) correct measurement of drawing given ; [1] (c) magnification calculated by dividing the length of drawing by the length of the petal in photo (ensure both in the same units) ; [1] (d) stigma labelled Z ; [1] (e) select anther (allow top of stamen) ; squash / cut to open anther ; use a microscope to observe ; [max 2] [Total: 10] 2 (a) (i) A and F (both required, either order) ; [1] (ii) bubbles with sodium carbonate ; no reaction with hydrochloric acid ; [2] (b) copper(II) chloride: blue ppt ; becomes (dark) blue solution ; aqueous ammonia: no change / no reaction ; [3] (c) (i) no observable change / no ppt ; [1] (ii) sulfuric ; zinc sulfate: no change / no ppt ; barium chloride: white ppt ; [3] (zero marks is hydrochloric acid is used) [Total: 10] 3 (a) 73.5 ; 71.0 ; [2] (b) axes correct and labelled and use of grid ; points (allow 1 error) ; smooth curve ; [3]
Mark scheme, page 3
Page 3 Mark Scheme Syllabus Paper IGCSE – May/June 2014 0653 63 © Cambridge International Examinations 2014 (c) (i) two figures from graph / 90 ; correct rounding ; [2] (ii) value less than (i) ; [1] (d) size of beaker / surface area of water / volume of water ; external temperature ; wind ; material of beaker ; [max 2] [Total:10] 4 (a) increases ; [1] (b) (i) ;; (3 correct = 2 marks, 2 correct = 1 mark) [max 2] (ii) beats = 256 ; [1] (c) F = 93.75 / 94 / 93.8 ; fitness rating: excellent ; [2] (d) (i) twin A: 400 AND twin B: 393 ; (ii) twin A: poor AND twin B: average ; [1] (iii) true according to Table 4.3 / owtte ; experimental error ; arbitrary cut off ; variations from minute to minute in heart rate ; AVP ; [max 2] [Total: 10] pulse rate / beats per min 104 80 72
Mark scheme, page 4
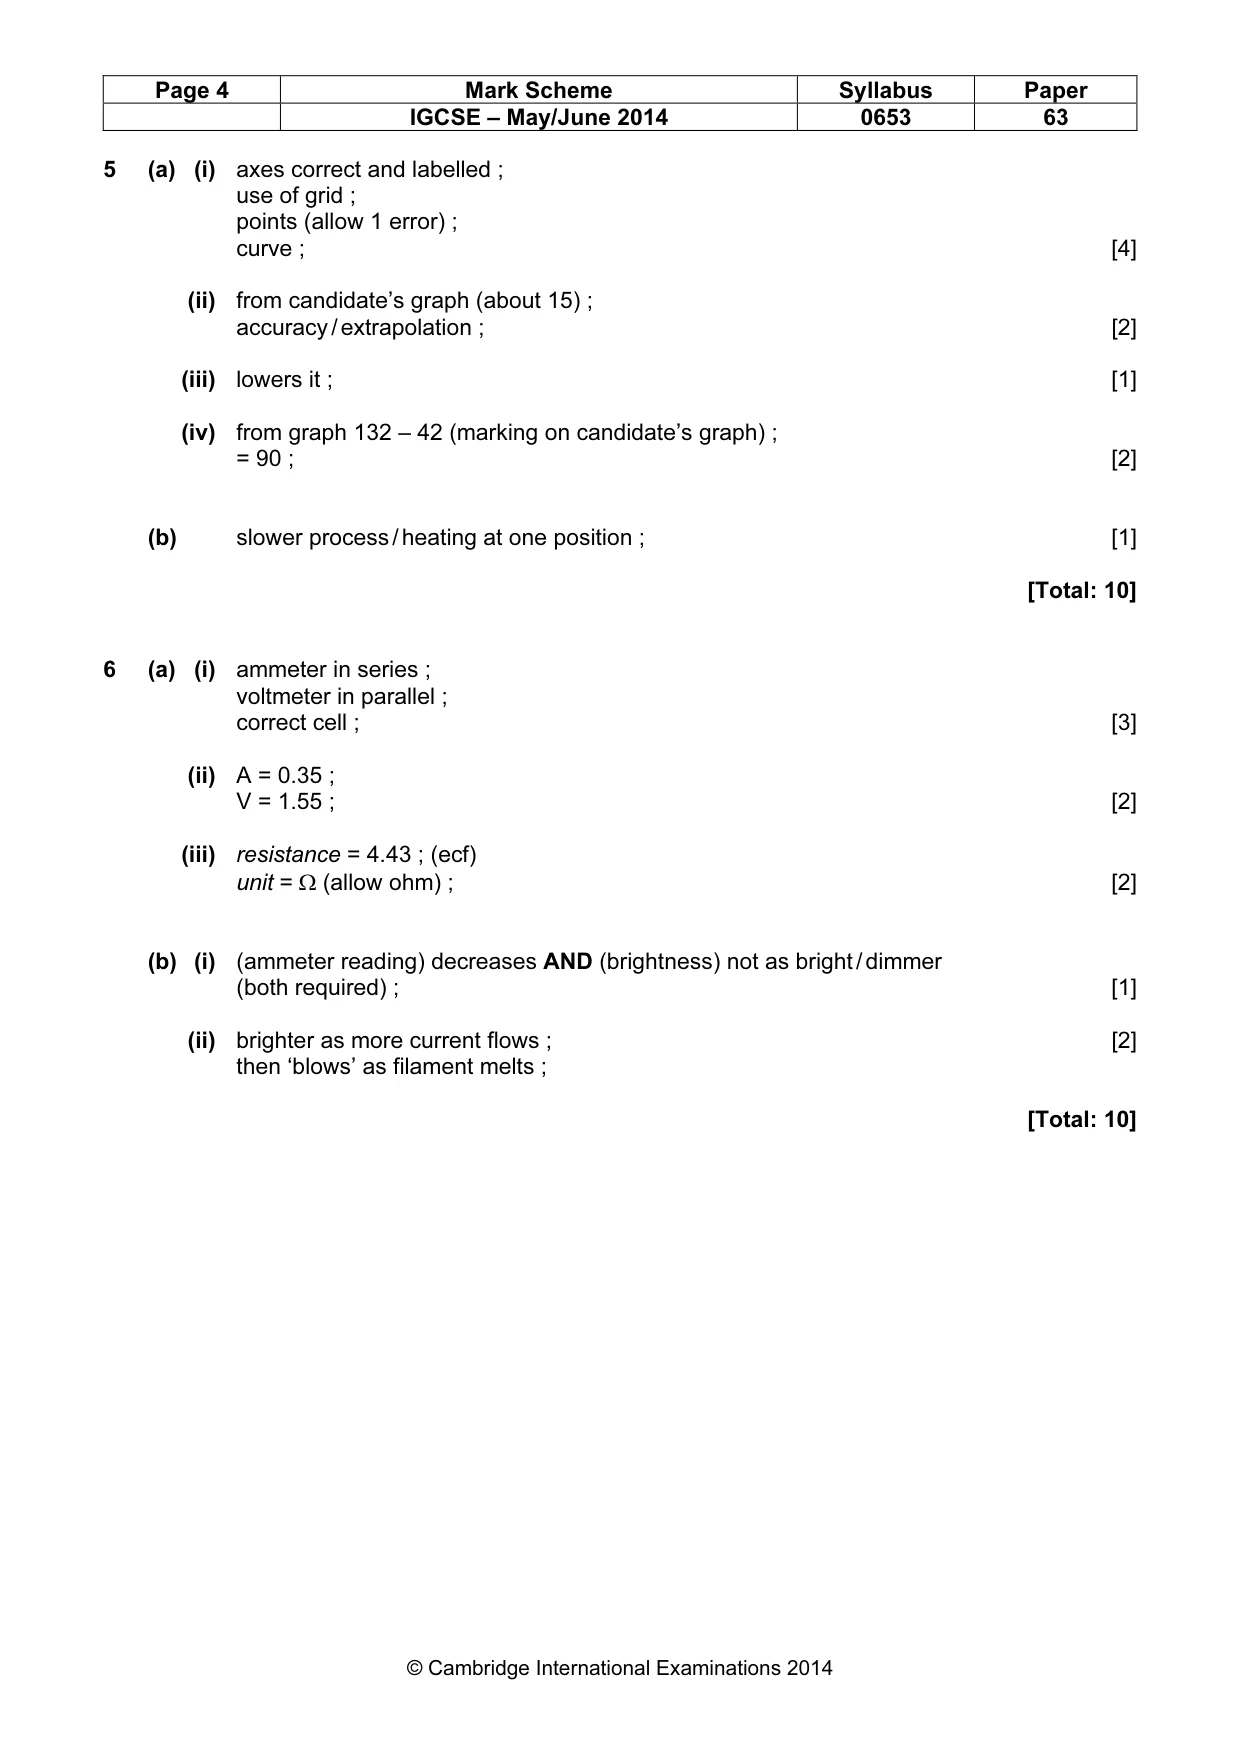
Page 4 Mark Scheme Syllabus Paper IGCSE – May/June 2014 0653 63 © Cambridge International Examinations 2014 5 (a) (i) axes correct and labelled ; use of grid ; points (allow 1 error) ; curve ; [4] (ii) from candidate’s graph (about 15) ; accuracy / extrapolation ; [2] (iii) lowers it ; [1] (iv) from graph 132 – 42 (marking on candidate’s graph) ; = 90 ; [2] (b) slower process / heating at one position ; [1] [Total: 10] 6 (a) (i) ammeter in series ; voltmeter in parallel ; correct cell ; [3] (ii) A = 0.35 ; V = 1.55 ; [2] (iii) resistance = 4.43 ; (ecf) unit = Ω (allow ohm) ; [2] (b) (i) (ammeter reading) decreases AND (brightness) not as bright / dimmer (both required) ; [1] (ii) brighter as more current flows ; [2] then ‘blows’ as filament melts ; [Total: 10]
What you needed in this session
Cambridge’s own grade thresholds for 2014 May/June, Paper 6 · Variant 3. A higher threshold means an easier paper — the bar moves with how the cohort did.