Questions as text
Q1 · A car is moving along a straight, level road, with a constant acceleration 0972/11 May/June 2018
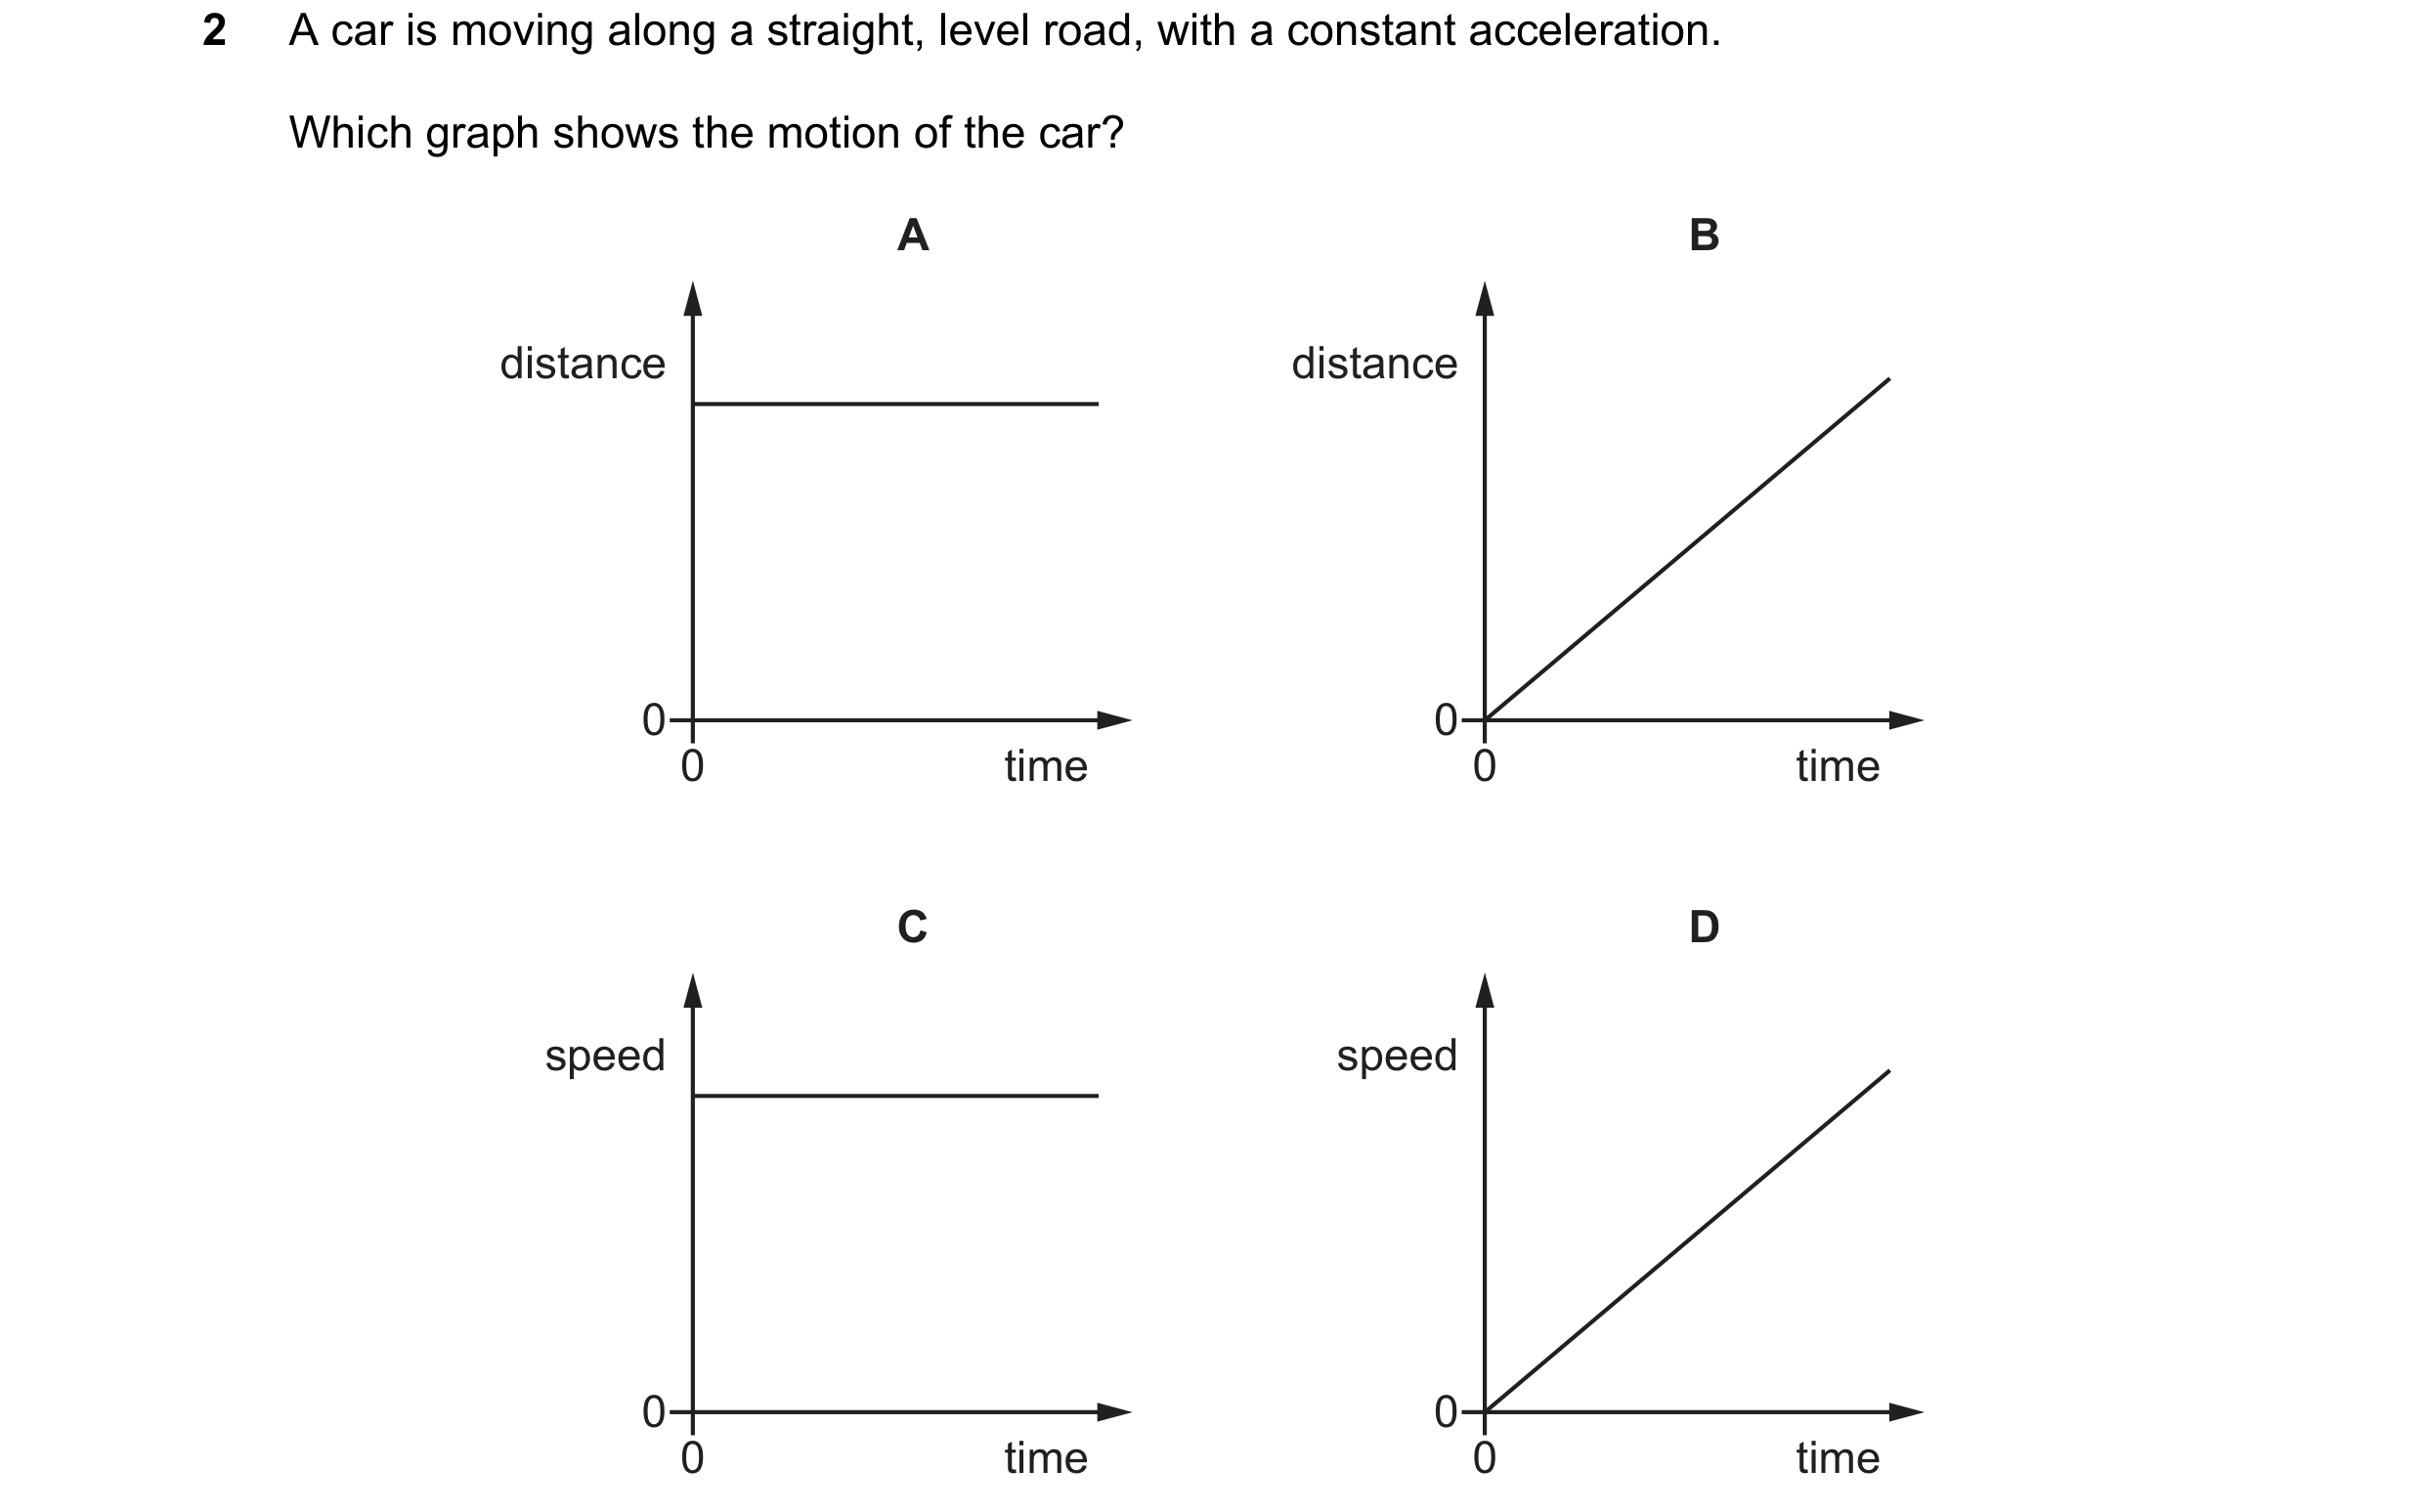
2 A car is moving along a straight, level road, with a constant acceleration. Which graph shows the motion of the car? A B distance distance 0 0 0 time 0 time C D speed speed 0 0 0 time 0 time
1 marks
Answer: D
This question in 0972/11 May/June 2018
Q2 · A car takes 15 minutes to travel along a road that is 20 km long 0972/11 May/June 2018
3 A car takes 15 minutes to travel along a road that is 20 km long. What is the average speed of the car? A 0.75 km / h B 5.0 km / h C 80 km / h D 300 km / h
1 marks
Answer: C
This question in 0972/11 May/June 2018
Q3 · A car is moving in a straight line on a level road 0972/11 May/June 2018
8 A car is moving in a straight line on a level road. Its engine provides a forward force on the car. A second force of equal size acts on the car due to resistive forces. Which statement describes what happens? A The car changes direction. B The car moves at a constant speed. C The car slows down. D The car speeds up.
1 marks
Answer: B
This question in 0972/11 May/June 2018
Q4 · A long-distance runner wishes to calculate her average speed for a race 0972/11 May/June 2019
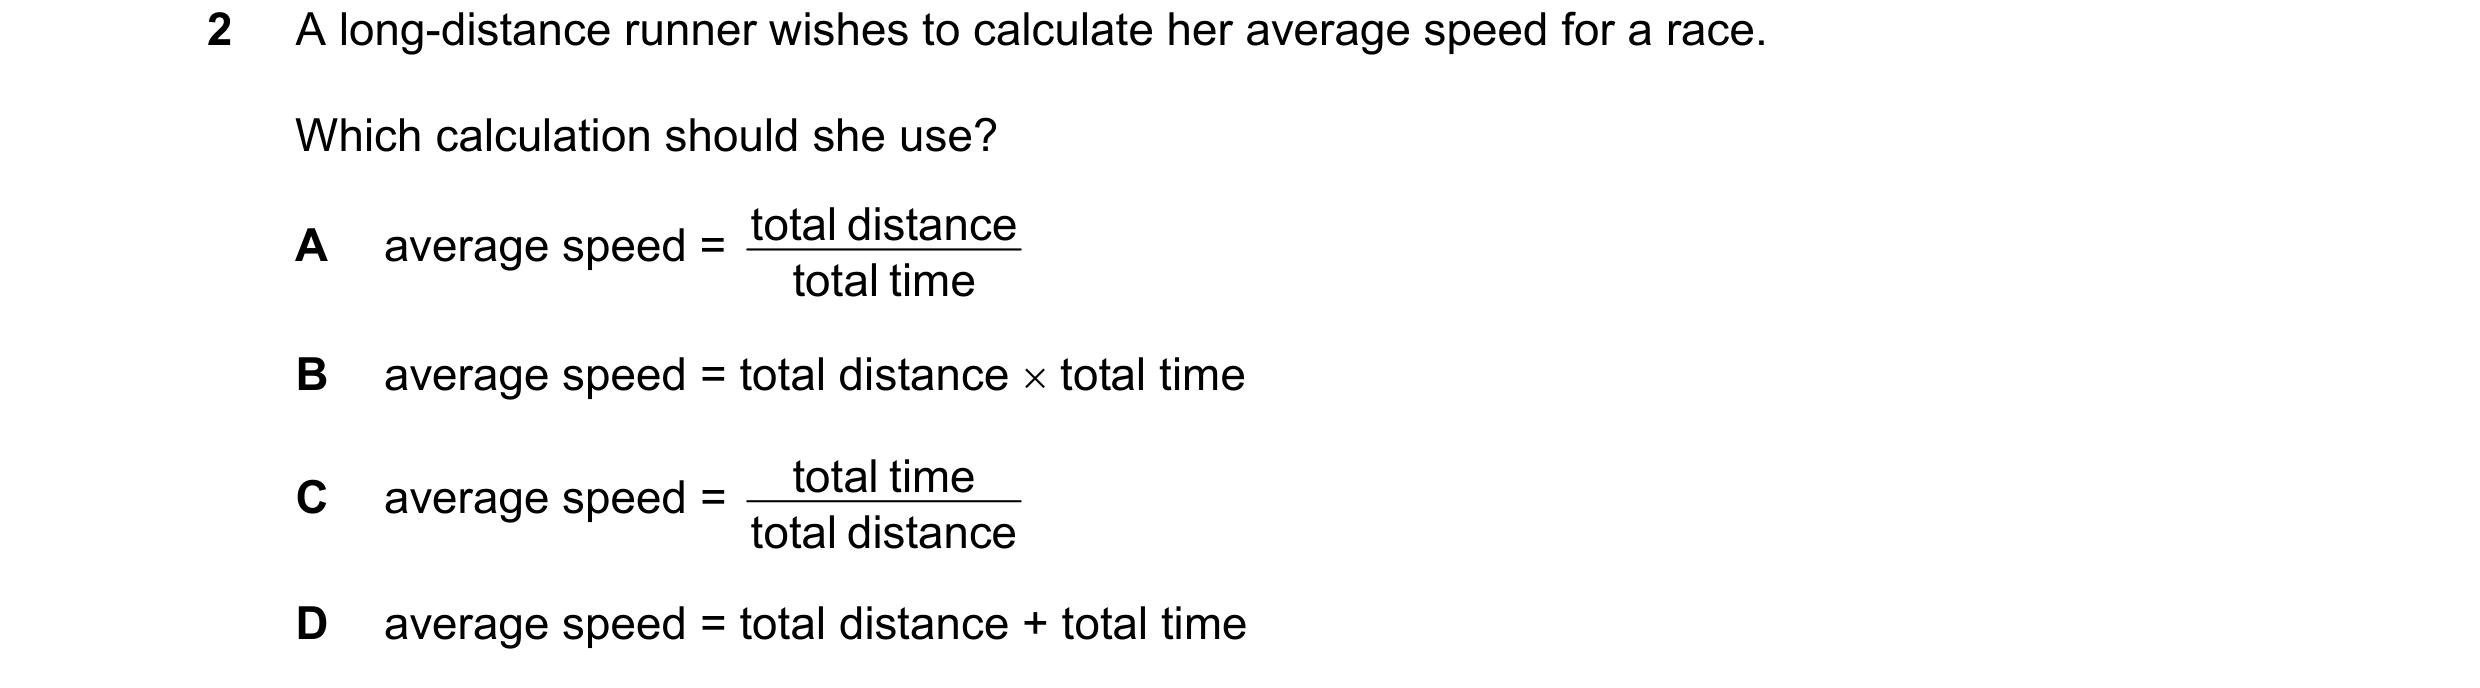
2 A long-distance runner wishes to calculate her average speed for a race. Which calculation should she use? total distance A average speed = total time B average speed = total distance × total time total time C average speed = total distance D average speed = total distance + total time
1 marks
Answer: A
This question in 0972/11 May/June 2019
Q5 · A heavy metal ball falls vertically downwards through air past four equally spaced levels… 0972/11 May/June 2019
3 A heavy metal ball falls vertically downwards through air past four equally spaced levels J, K, L and M. metal ball level J level K level L level M The times taken to fall from one level to the next are measured. Where is the speed of the ball greatest and which time is shortest? speed is time is greatest between shortest between A J and K J and K B J and K L and M C L and M J and K D L and M L and M
1 marks
Answer: D
This question in 0972/11 May/June 2019
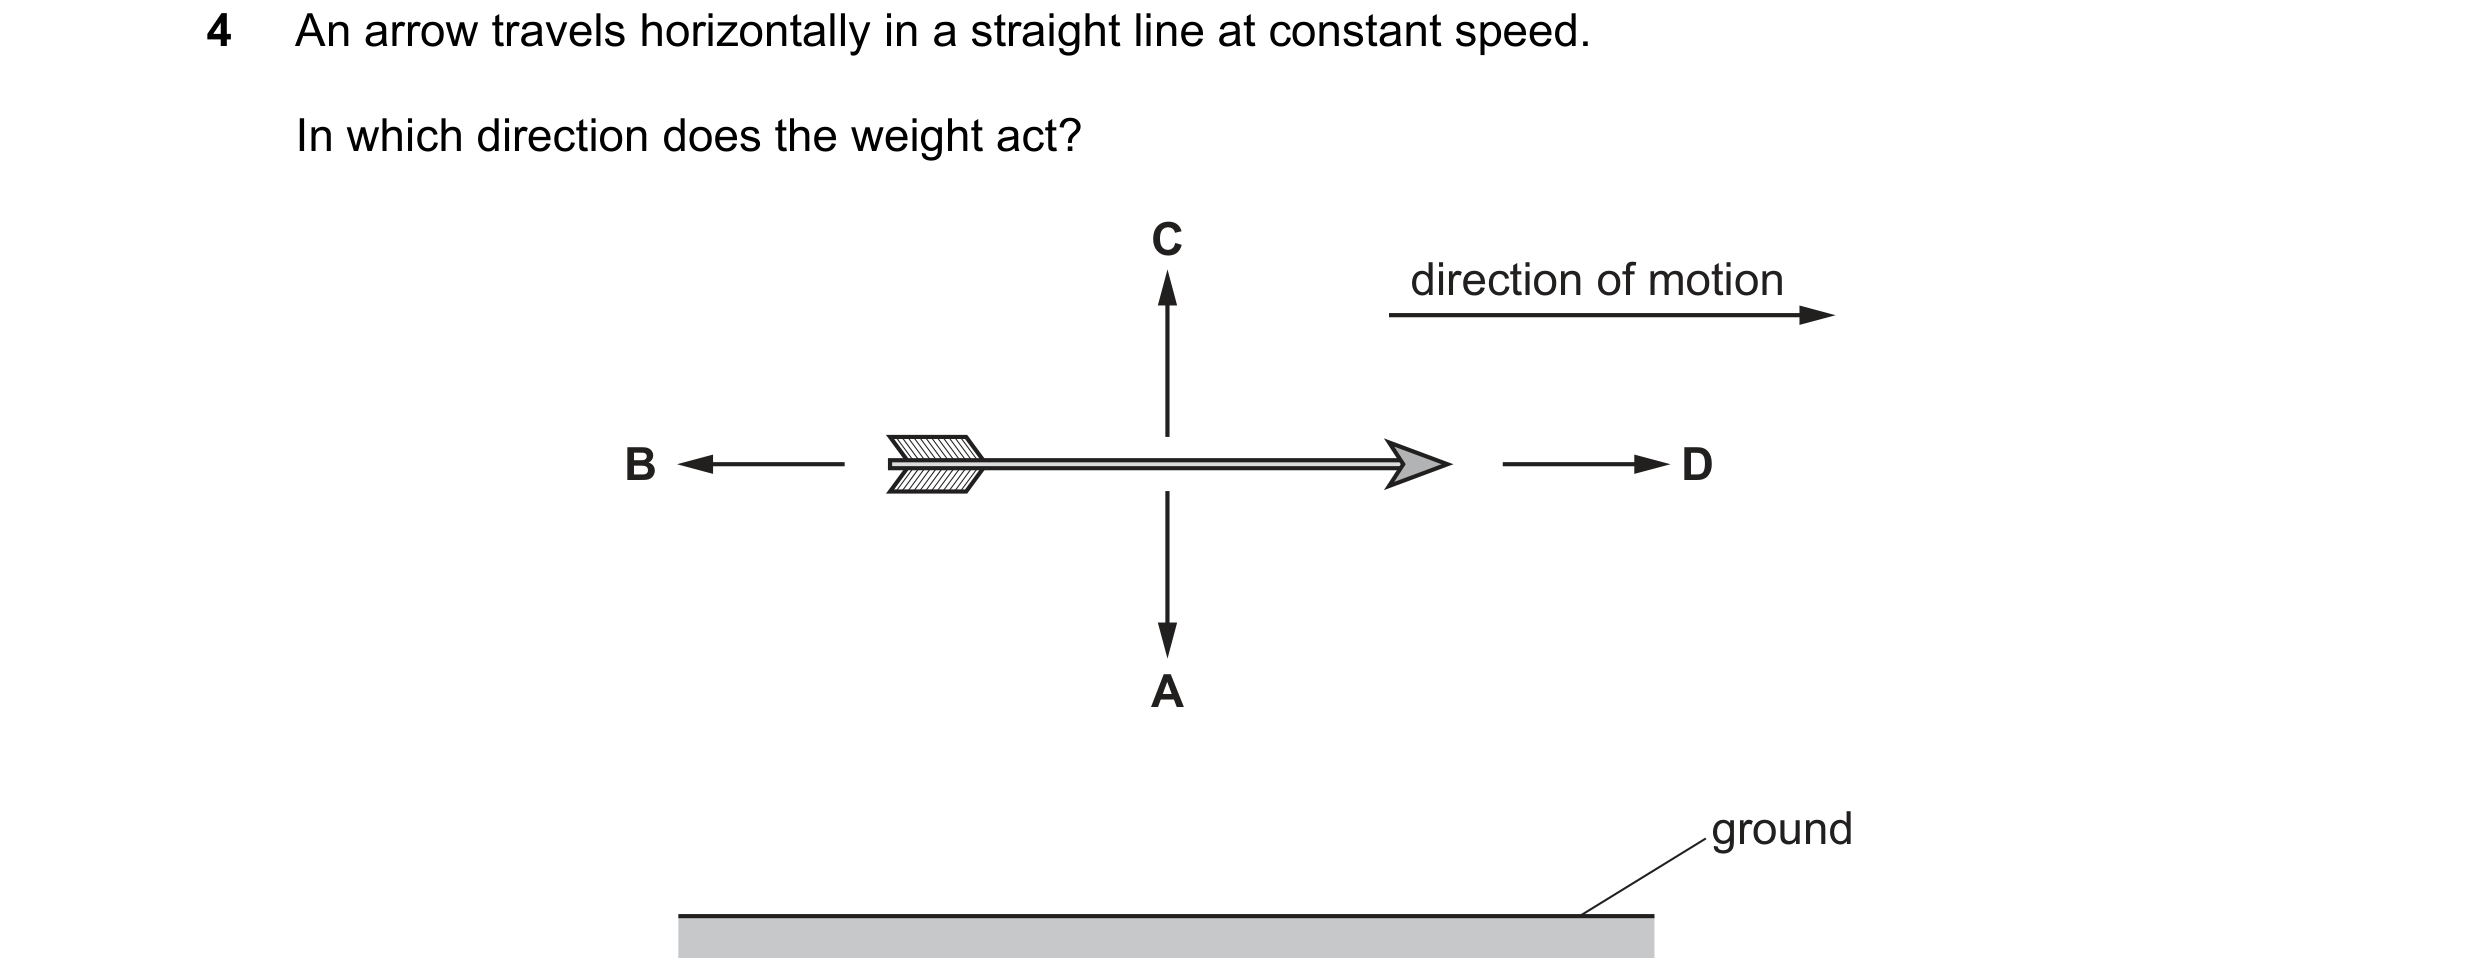
Q6 · An arrow travels horizontally in a straight line at constant speed 0972/11 May/June 2019
4 An arrow travels horizontally in a straight line at constant speed. In which direction does the weight act? C direction of motion B D A ground
1 marks
Answer: A
This question in 0972/11 May/June 2019
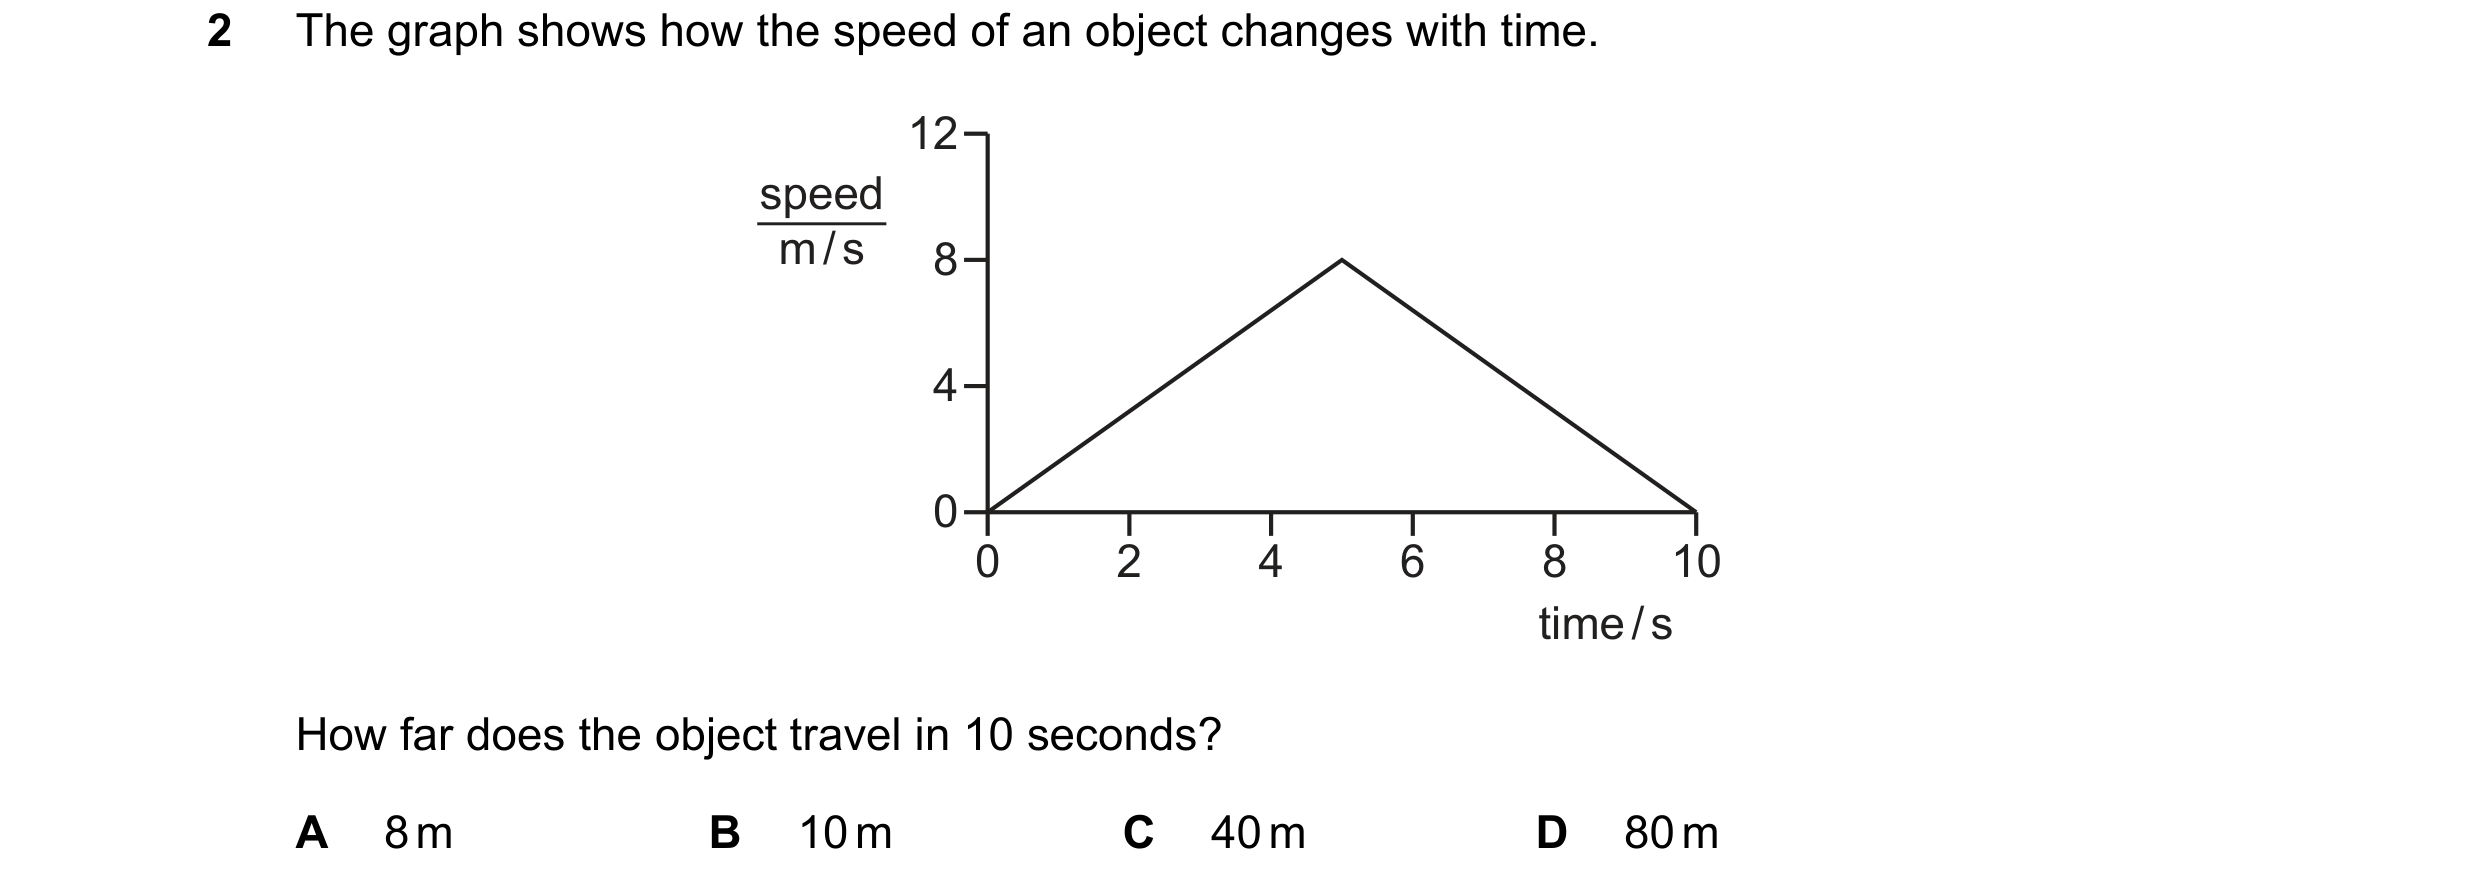
Q7 · The graph shows how the speed of an object changes with time 0972/11 Oct/Nov 2019
2 The graph shows how the speed of an object changes with time. 12 speed m / s 8 4 0 0 2 4 6 8 10 time / s How far does the object travel in 10 seconds? A 8 m B 10 m C 40 m D 80 m
1 marks
Answer: C
This question in 0972/11 Oct/Nov 2019
Q8 · A car travels at an average speed of 60 km / h for 15 minutes 0972/11 Oct/Nov 2019
3 A car travels at an average speed of 60 km / h for 15 minutes. How far does the car travel in 15 minutes? A 4.0 km B 15 km C 240 km D 900 km
1 marks
Answer: B
This question in 0972/11 Oct/Nov 2019
Q9 · A man hears a starting pistol fire 1.5 seconds after he sees a puff of smoke from the… 0972/11 Oct/Nov 2019
26 A man hears a starting pistol fire 1.5 seconds after he sees a puff of smoke from the pistol. The sound and the smoke are made at the same time. The starting pistol is 450 metres away from the man. What is the speed of sound calculated from this observation? A 150 m / s B 300 m / s C 330 m / s D 625 m / s
1 marks
Answer: B
This question in 0972/11 Oct/Nov 2019
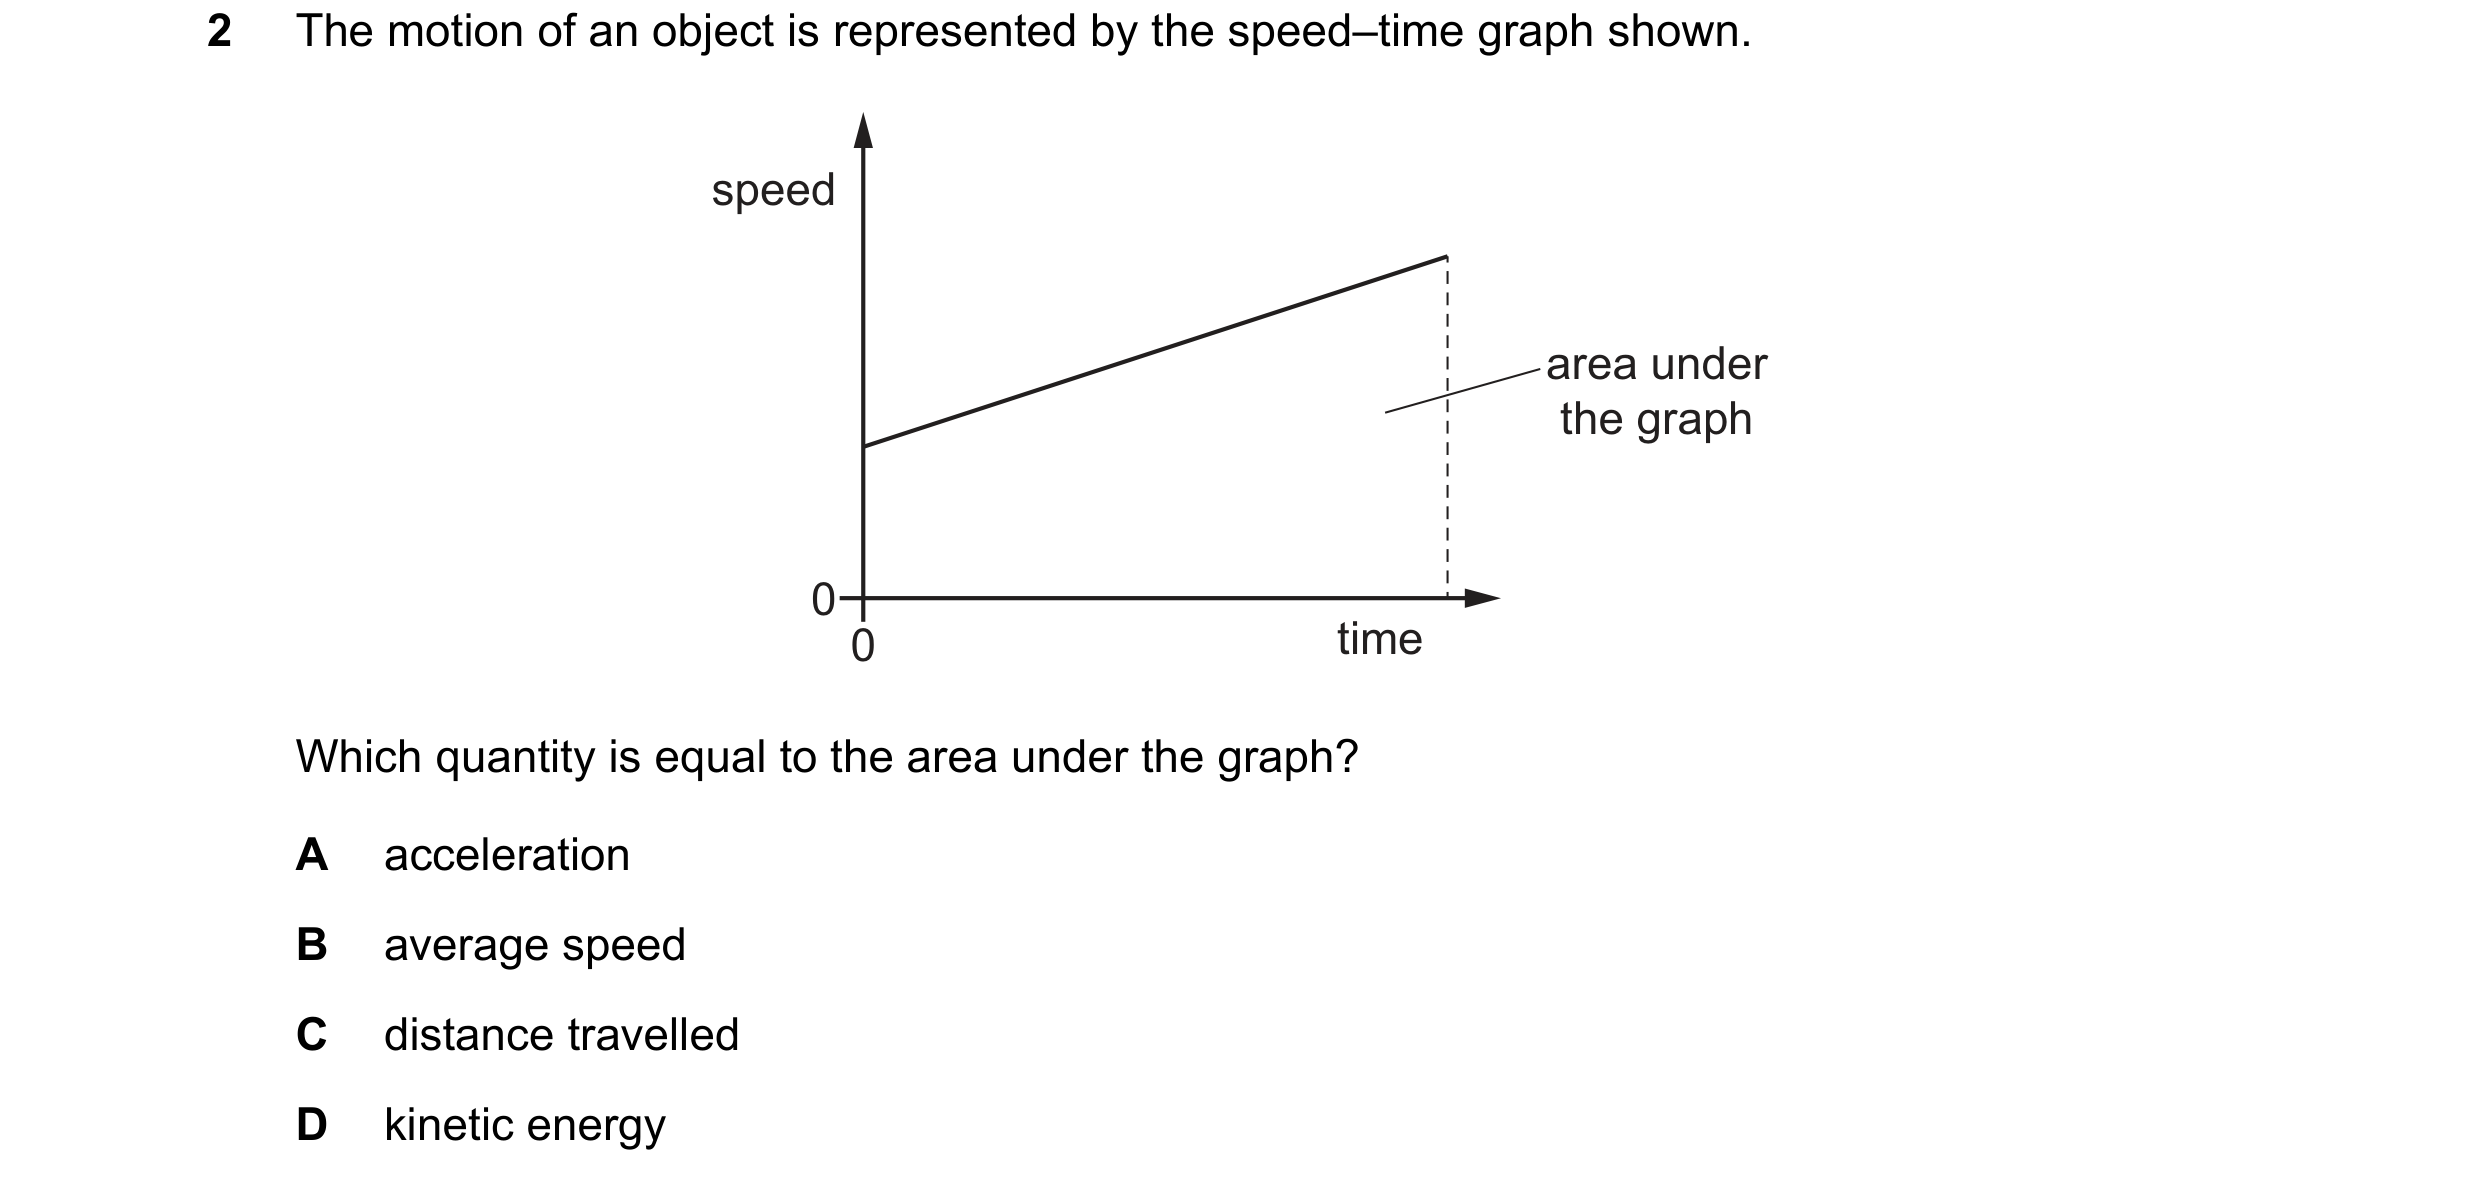
Q10 · The motion of an object is represented by the speed–time graph shown 0972/11 May/June 2020
2 The motion of an object is represented by the speed–time graph shown. speed area under the graph 0 0 time Which quantity is equal to the area under the graph? A acceleration B average speed C distance travelled D kinetic energy
1 marks
Answer: C
This question in 0972/11 May/June 2020
Q11 · Which statement about acceleration is correct? 0972/11 May/June 2020
3 Which statement about acceleration is correct? A It is related to the changing speed of an object. B It is the distance an object travels in one second. C It is the force acting on an object divided by the distance it travels in one second. D It is the force acting on an object when it is near to the Earth.
1 marks
Answer: A
This question in 0972/11 May/June 2020
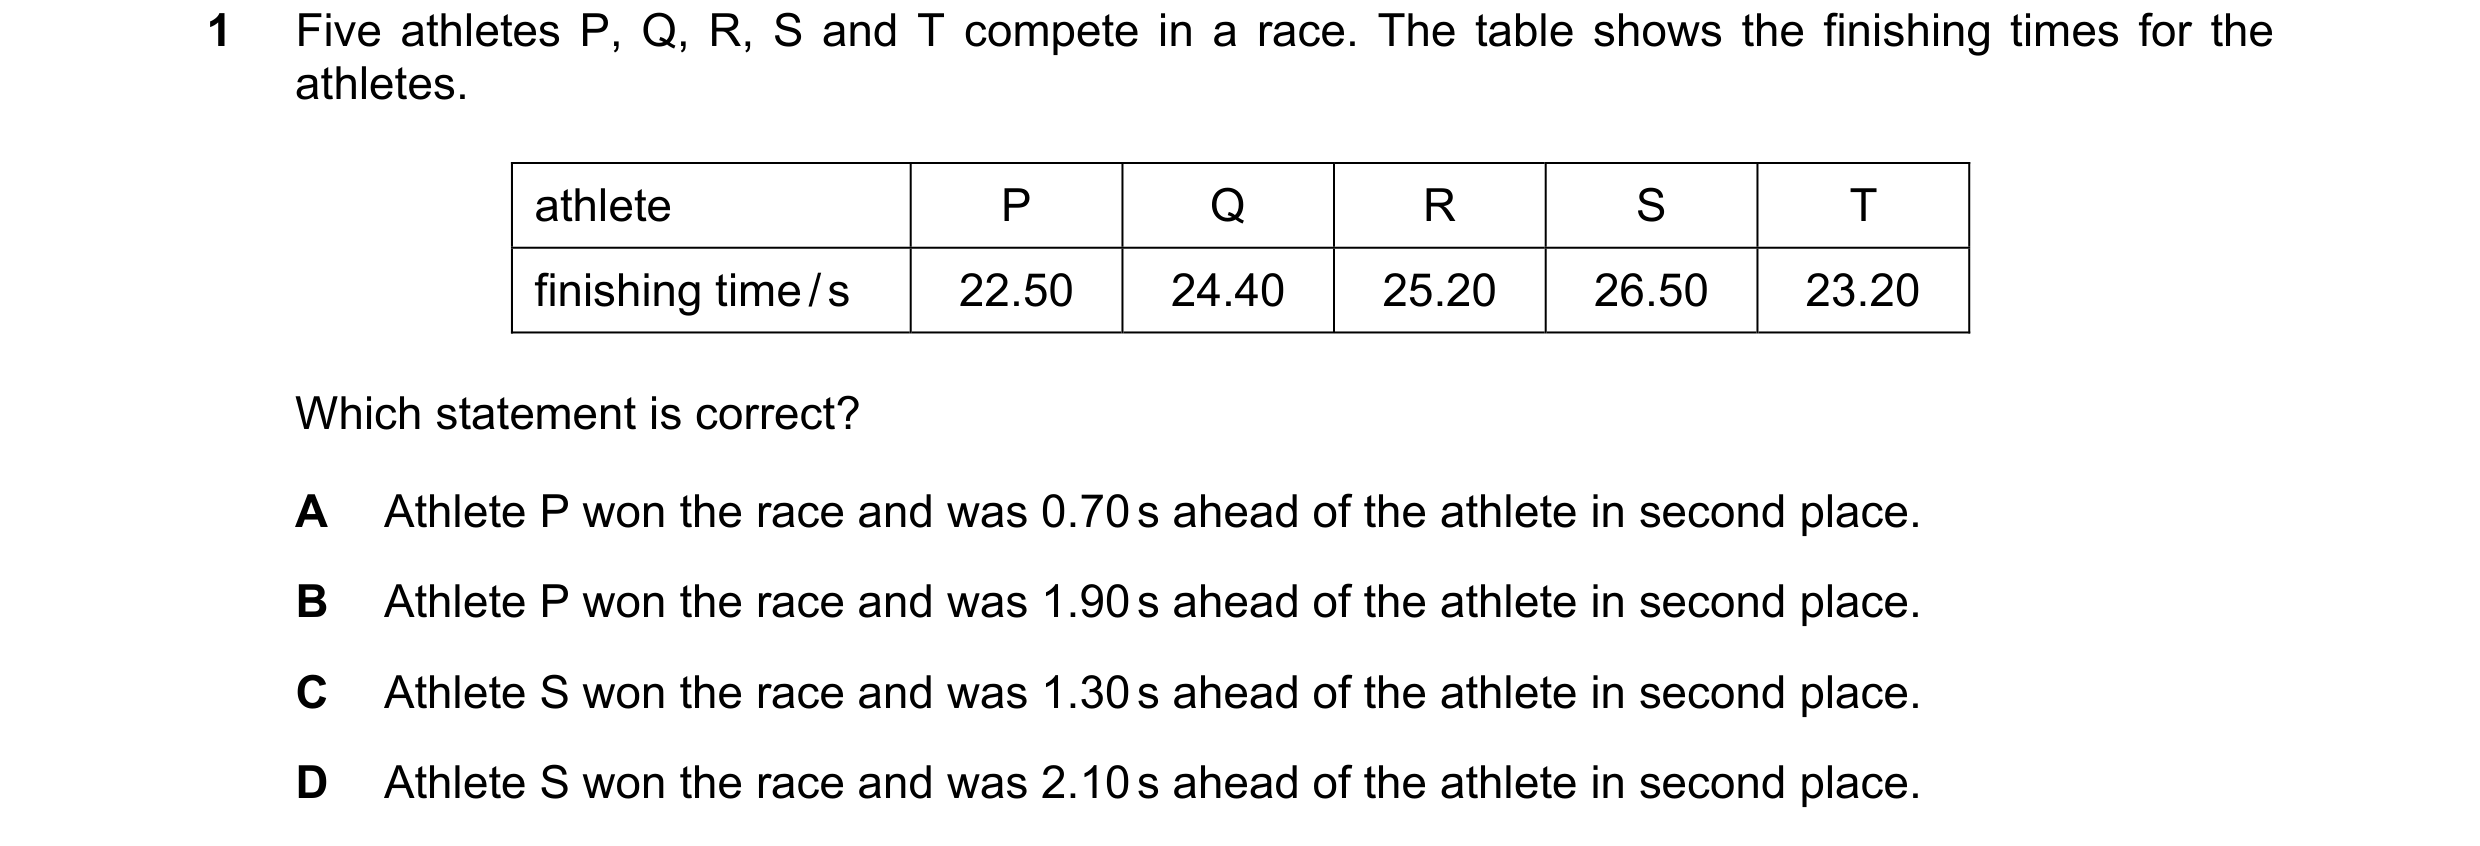
Q12 · Five athletes P, Q, R, S and T compete in a race 0972/12 May/June 2020
1 Five athletes P, Q, R, S and T compete in a race. The table shows the finishing times for the athletes. athlete P Q R S T finishing time / s 22.50 24.40 25.20 26.50 23.20 Which statement is correct? A Athlete P won the race and was 0.70 s ahead of the athlete in second place. B Athlete P won the race and was 1.90 s ahead of the athlete in second place. C Athlete S won the race and was 1.30 s ahead of the athlete in second place. D Athlete S won the race and was 2.10 s ahead of the athlete in second place.
1 marks
Answer: A
This question in 0972/12 May/June 2020
Q13 · The graph shows how the speed of an object varies with time 0972/12 May/June 2020
2 The graph shows how the speed of an object varies with time. At which labelled time is the acceleration greatest? speed 0 0 A B C D time
1 marks
Answer: A
This question in 0972/12 May/June 2020
Q14 · Which statement about acceleration is correct? 0972/12 May/June 2020
3 Which statement about acceleration is correct? A It is related to the changing speed of an object. B It is the distance an object travels in one second. C It is the force acting on an object divided by the distance it travels in one second. D It is the force acting on an object when it is near to the Earth.
1 marks
Answer: A
This question in 0972/12 May/June 2020
Q15 · A dolphin sends out a sound wave 0972/12 May/June 2020
26 A dolphin sends out a sound wave. An echo returns 0.010 s later from a fish which is 7.5 m from the dolphin. What is the speed of the sound wave in water? A 0.075 m / s B 0.15 m / s C 750 m / s D 1500 m / s
1 marks
Answer: D
This question in 0972/12 May/June 2020
Q16 · The speed–time graph represents a journey 0972/11 Oct/Nov 2020
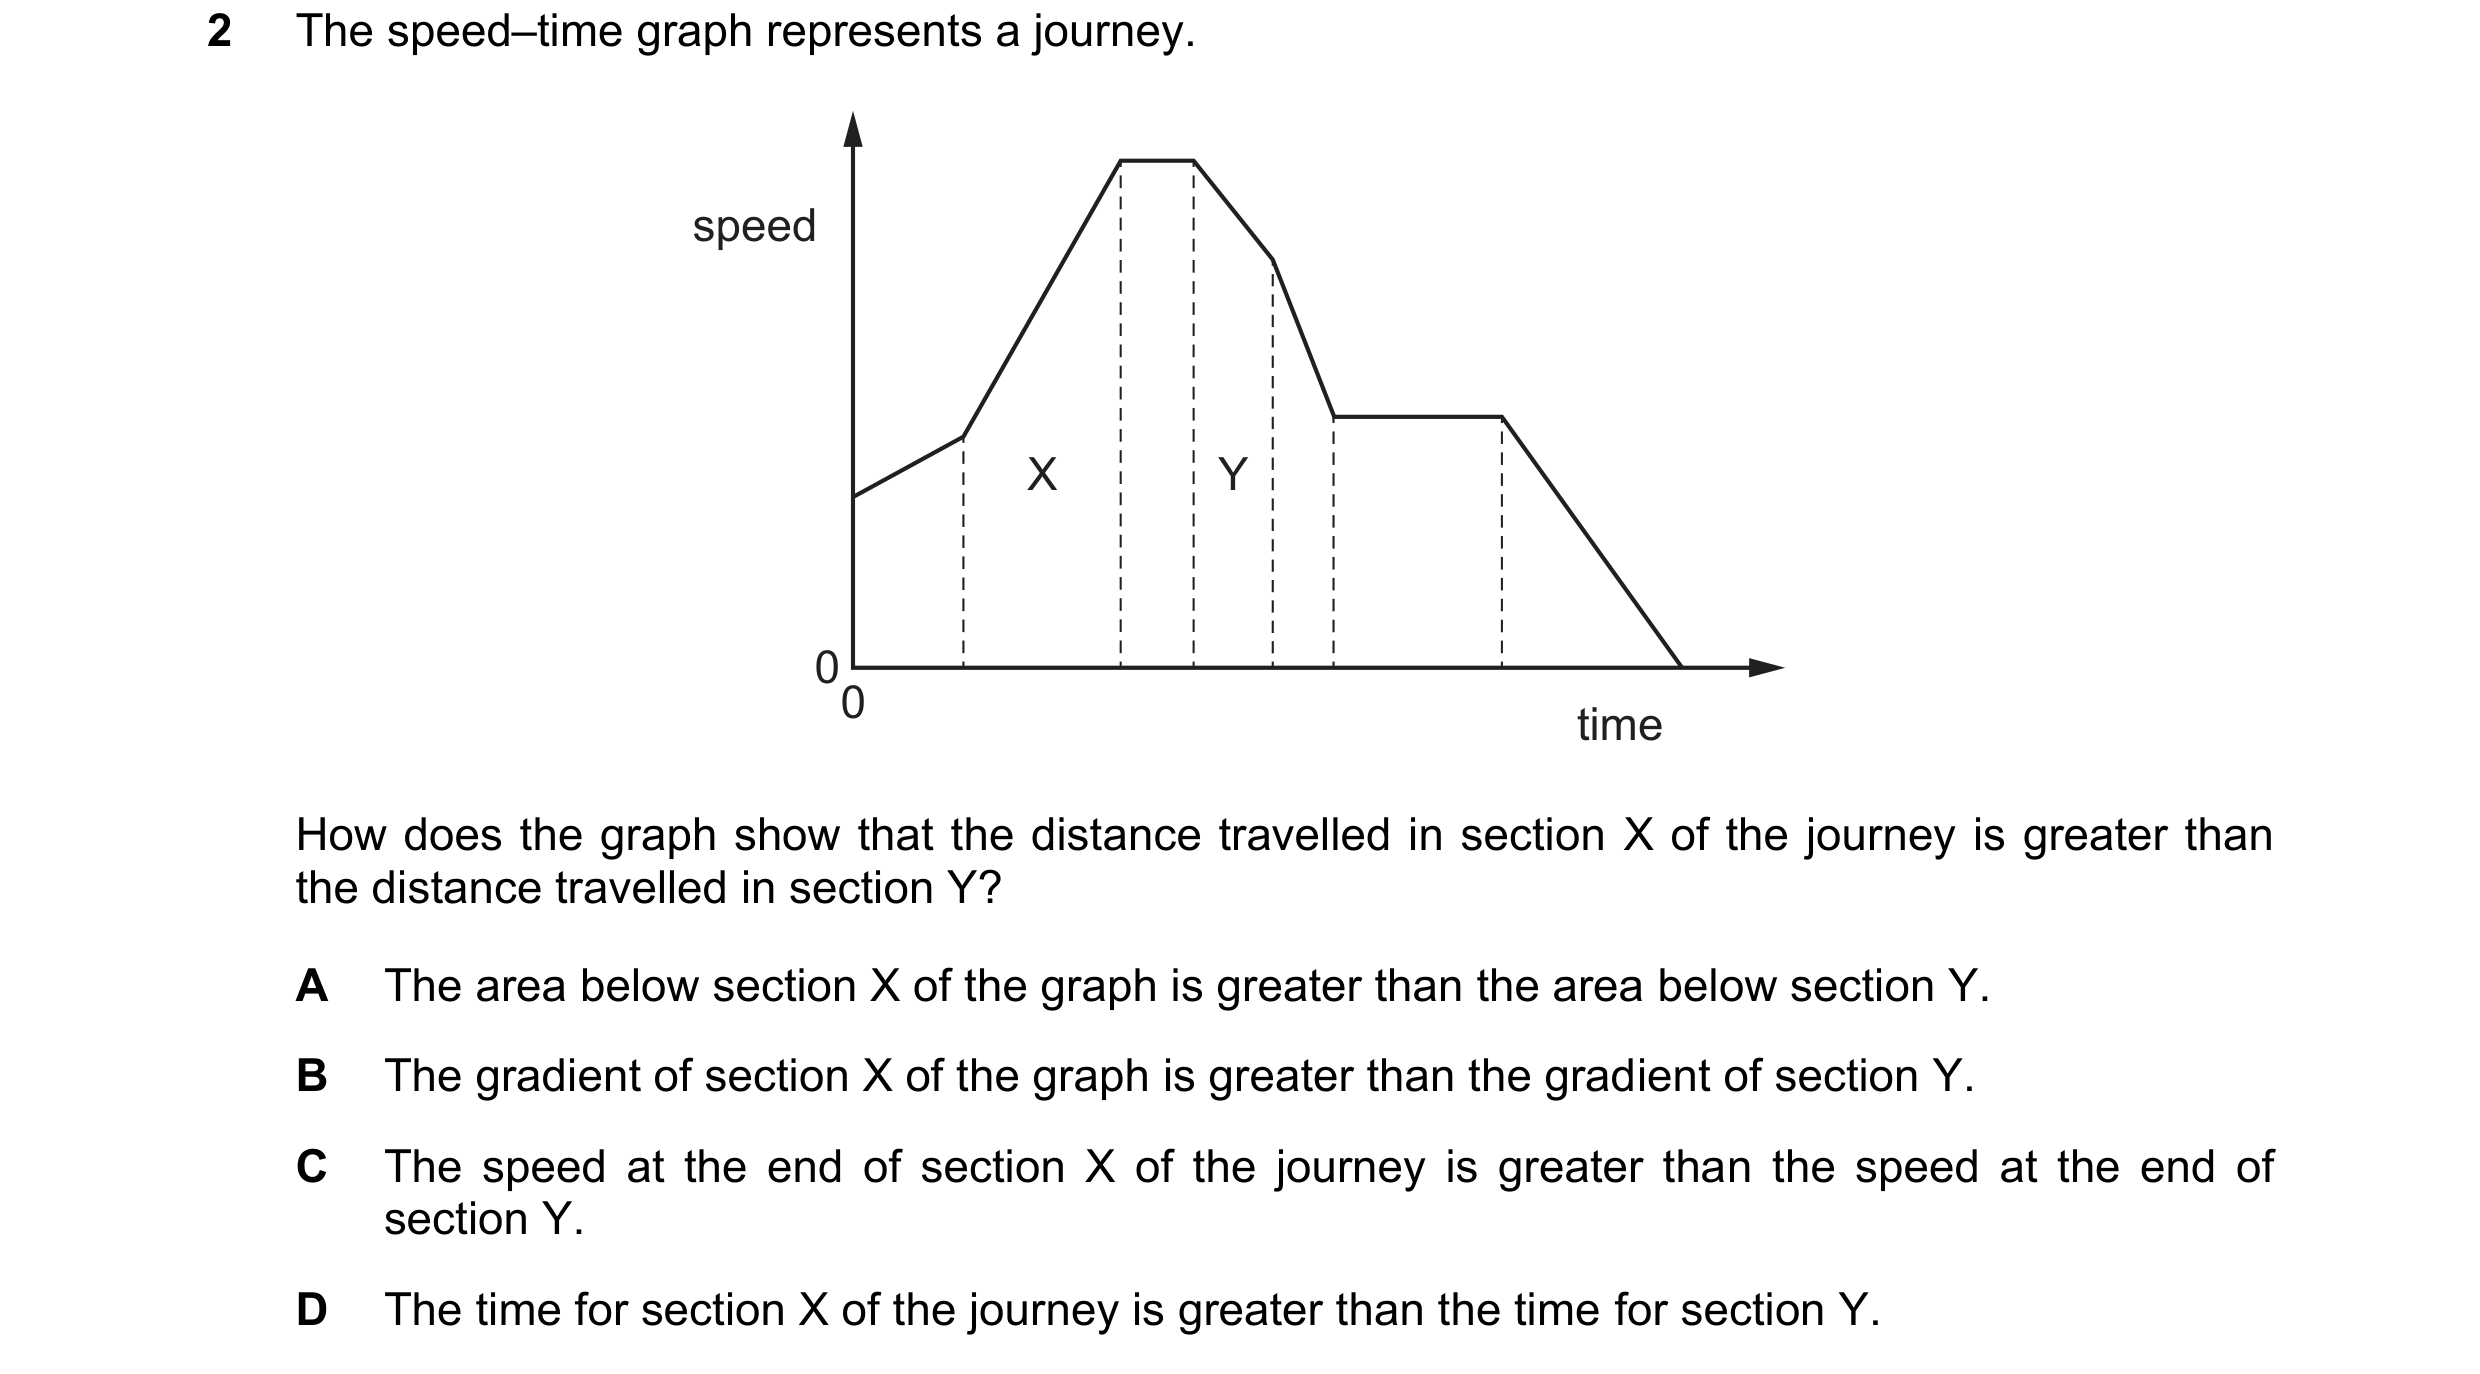
2 The speed–time graph represents a journey. speed X Y 00 time How does the graph show that the distance travelled in section X of the journey is greater than the distance travelled in section Y? A The area below section X of the graph is greater than the area below section Y. B The gradient of section X of the graph is greater than the gradient of section Y. C The speed at the end of section X of the journey is greater than the speed at the end of section Y. D The time for section X of the journey is greater than the time for section Y.
1 marks
Answer: A
This question in 0972/11 Oct/Nov 2020
Q17 · A boy throws a ball vertically upwards with a speed v 0972/11 Oct/Nov 2020
3 A boy throws a ball vertically upwards with a speed v. highest point X Which row describes the speed and the acceleration of the ball at point X on the way upwards? speed acceleration A decreasing upwards B decreasing downwards C increasing upwards D increasing downwards
1 marks
Answer: B
This question in 0972/11 Oct/Nov 2020
Q18 · The diagrams show distance–time graphs for four objects 0972/11 Oct/Nov 2021
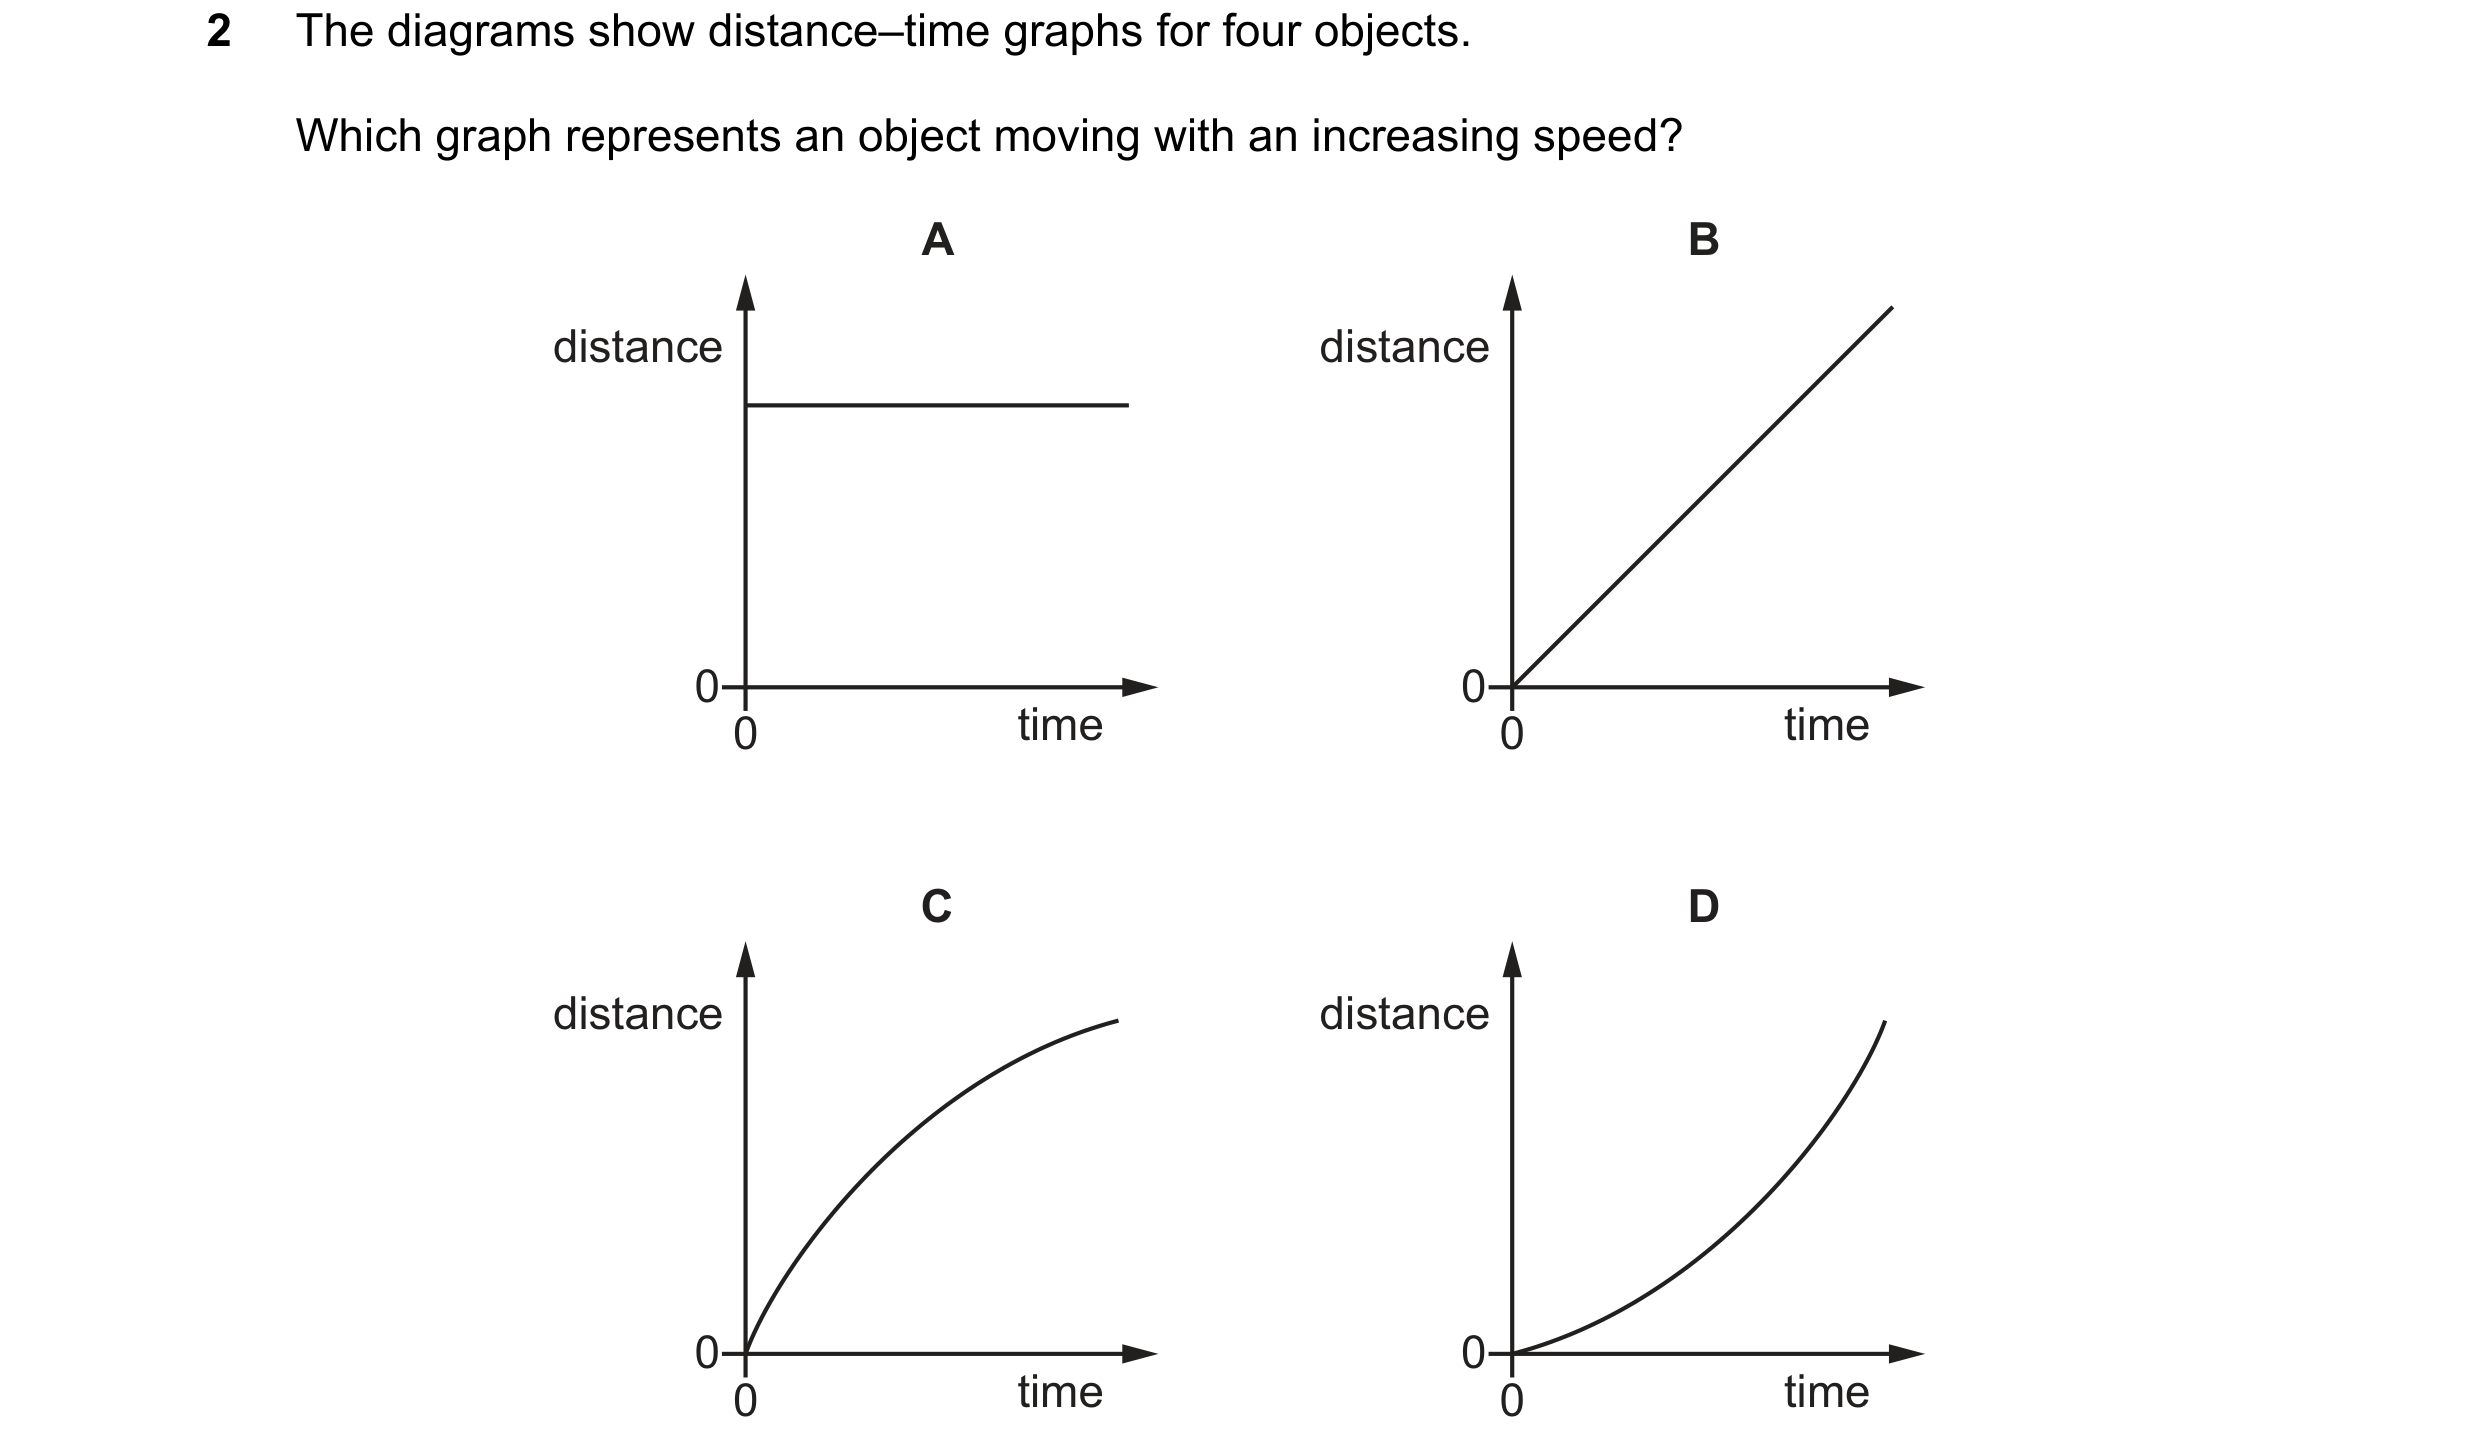
2 The diagrams show distance–time graphs for four objects. Which graph represents an object moving with an increasing speed? A B distance distance 0 0 0 time 0 time C D distance distance 0 0 0 time 0 time
1 marks
Answer: D
This question in 0972/11 Oct/Nov 2021
Q19 · The speed–time graph for a train is shown 0972/11 May/June 2022
2 The speed–time graph for a train is shown. R 20 speed km / h 15 Q S 10 5 P 0 0 10 20 30 40 50 60 70 80 90 100 time / s Which regions of the graph show the train moving? A P, Q, R and S B Q, R and S only C Q and S only D R only
1 marks
Answer: B
This question in 0972/11 May/June 2022
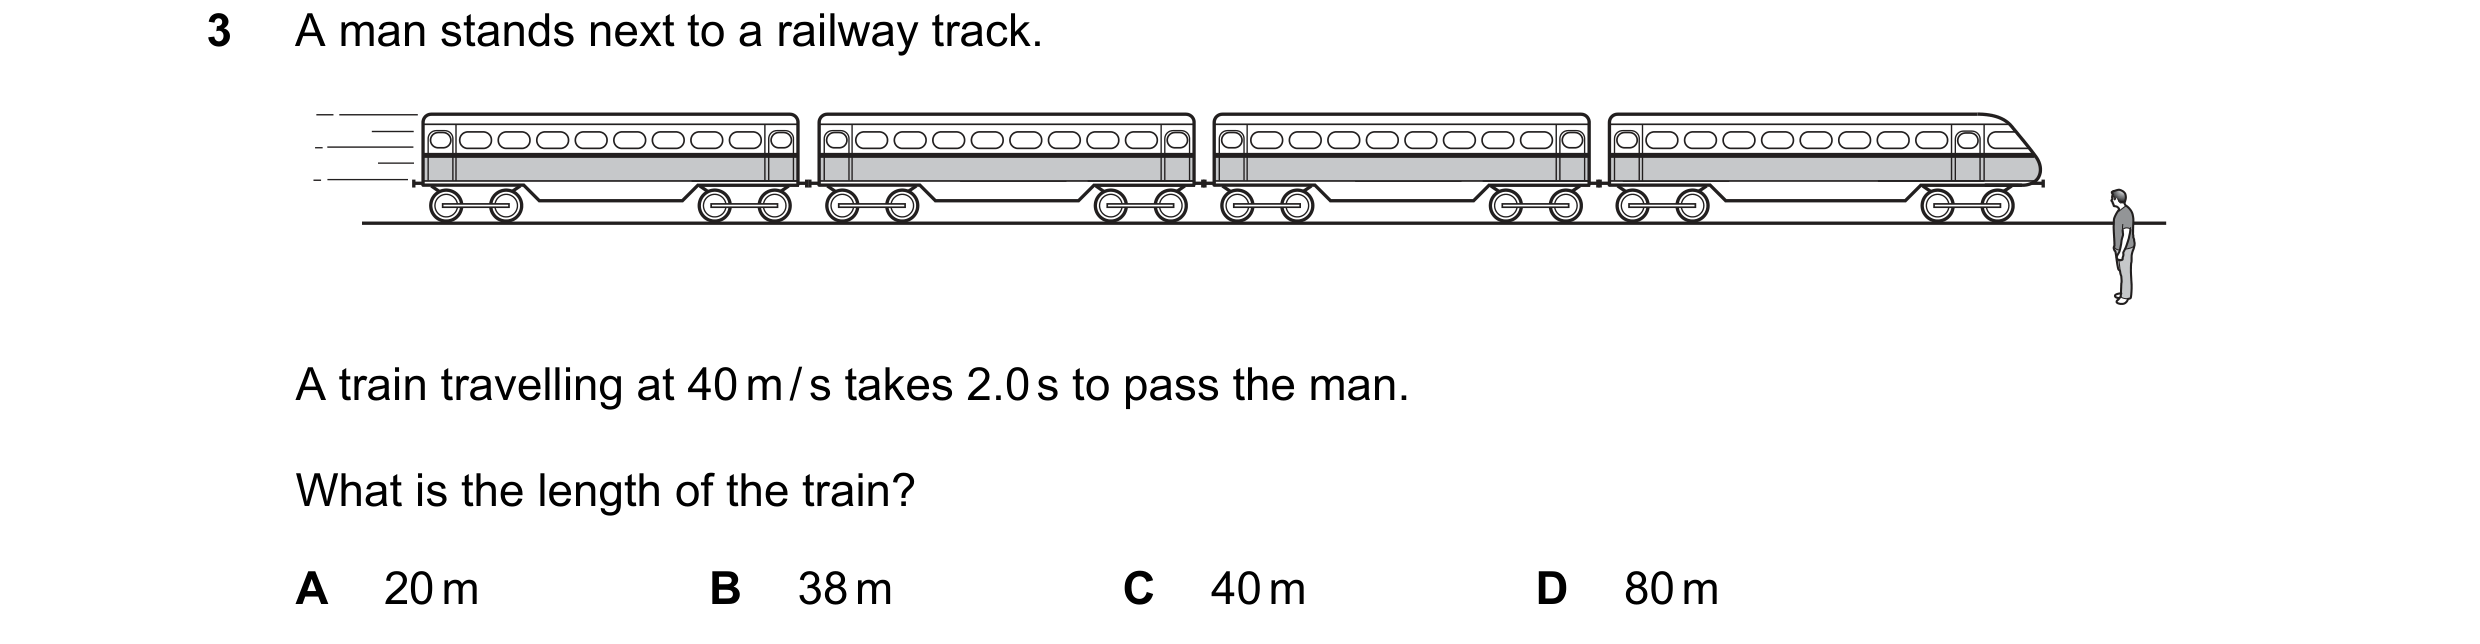
Q20 · A man stands next to a railway track 0972/11 May/June 2022
3 A man stands next to a railway track. A train travelling at 40 m / s takes 2.0 s to pass the man. What is the length of the train? A 20 m B 38 m C 40 m D 80 m
1 marks
Answer: D
This question in 0972/11 May/June 2022
Q21 · What is used to determine the distance travelled by an object in motion? 0972/12 May/June 2022
2 What is used to determine the distance travelled by an object in motion? A the area under a distance–time graph B the area under a speed–time graph C the gradient of a distance–time graph D the gradient of a speed–time graph
1 marks
Answer: B
This question in 0972/12 May/June 2022
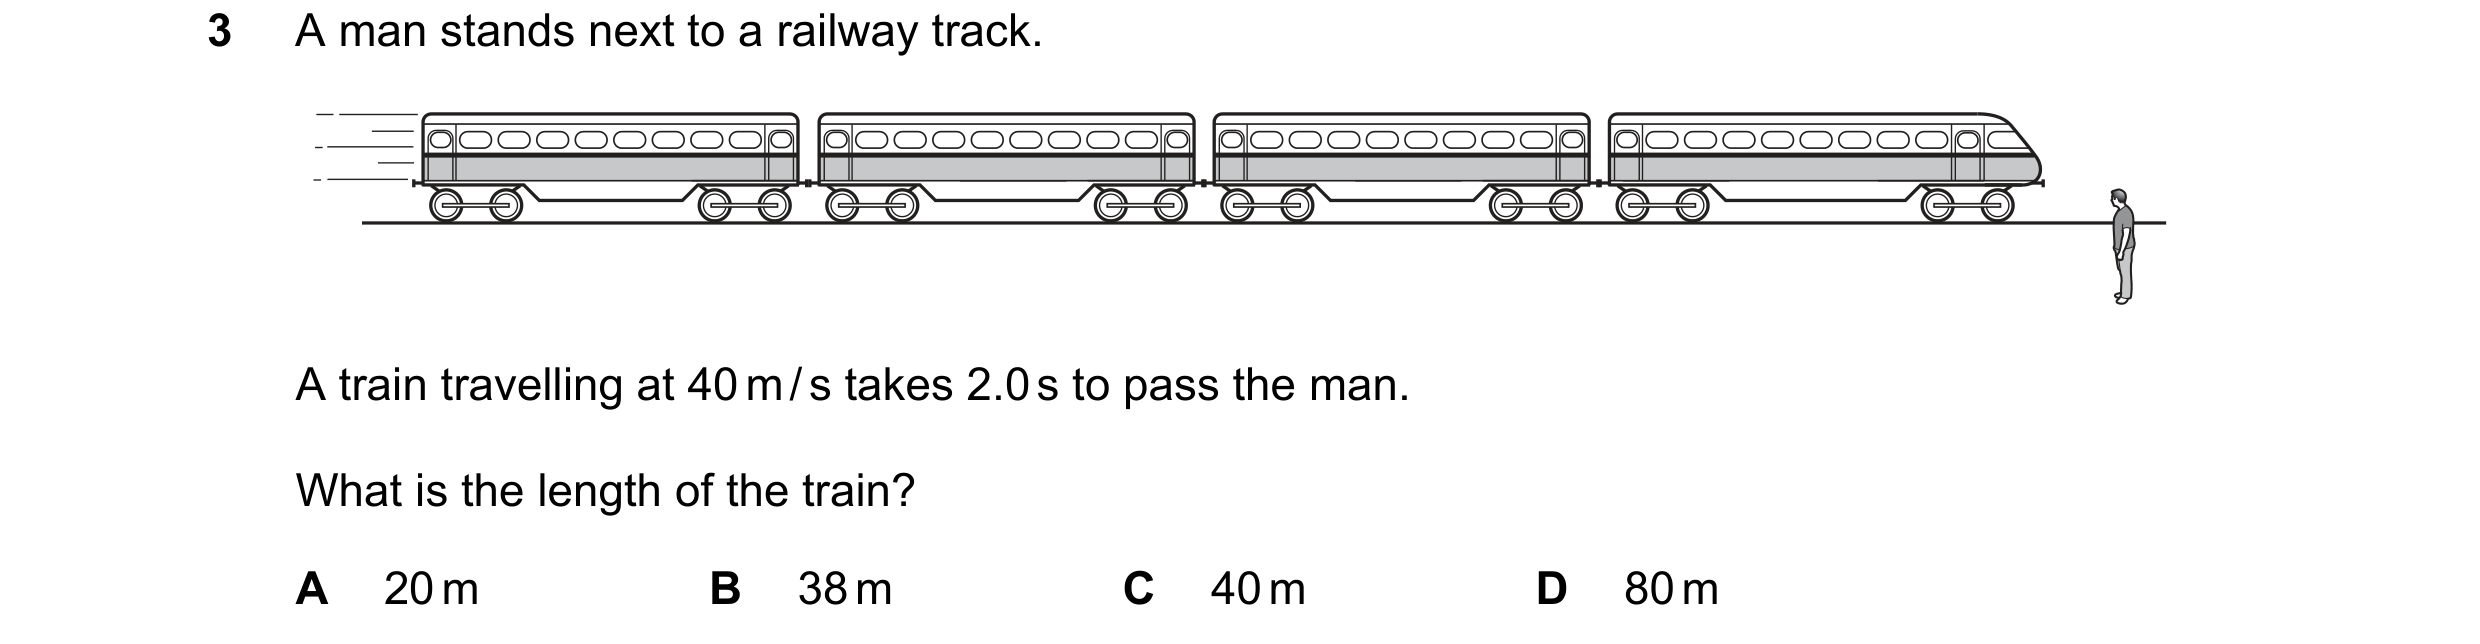
Q22 · A man stands next to a railway track 0972/12 May/June 2022
3 A man stands next to a railway track. A train travelling at 40 m / s takes 2.0 s to pass the man. What is the length of the train? A 20 m B 38 m C 40 m D 80 m
1 marks
Answer: D
This question in 0972/12 May/June 2022
Q23 · A spaceship approaches and passes a planet 0972/12 May/June 2022
6 A spaceship approaches and passes a planet. spaceship planet What can the force of gravity between the spaceship and planet achieve? A It can change the direction of the spaceship, or slow it down, but not speed it up. B It can change the direction of the spaceship, or speed it up, but not slow it down. C It can slow down the spaceship, or speed it up, but not change its direction. D It can change the direction of the spaceship, slow it down, or speed it up.
1 marks
Answer: D
This question in 0972/12 May/June 2022
Q24 · The graph represents the motion of a vehicle 0972/11 May/June 2023
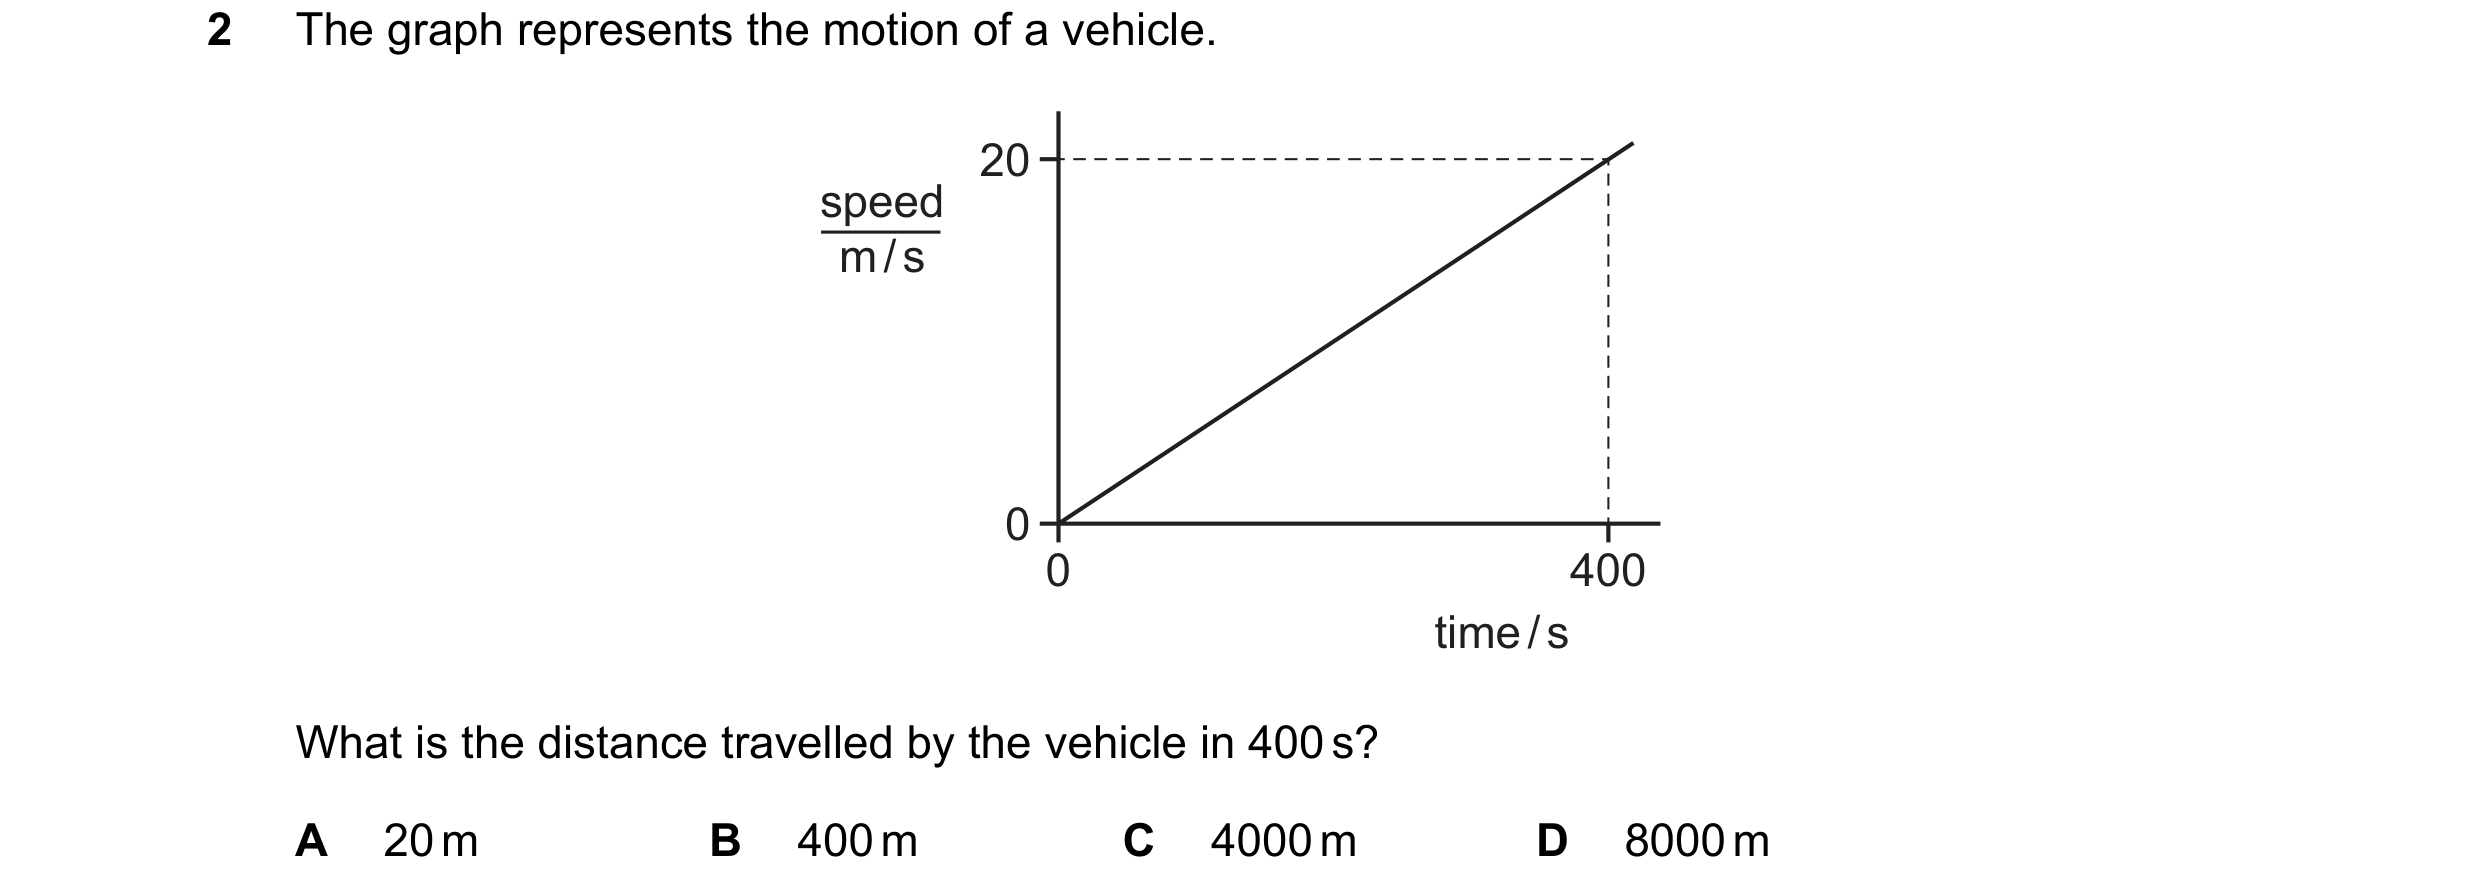
2 The graph represents the motion of a vehicle. 20 speed m / s 0 0 400 time / s What is the distance travelled by the vehicle in 400 s? A 20 m B 400 m C 4000 m D 8000 m
1 marks
Answer: C
This question in 0972/11 May/June 2023
Q25 · The diagram shows a distance–time graph for an object moving in a straight line 0972/11 May/June 2023
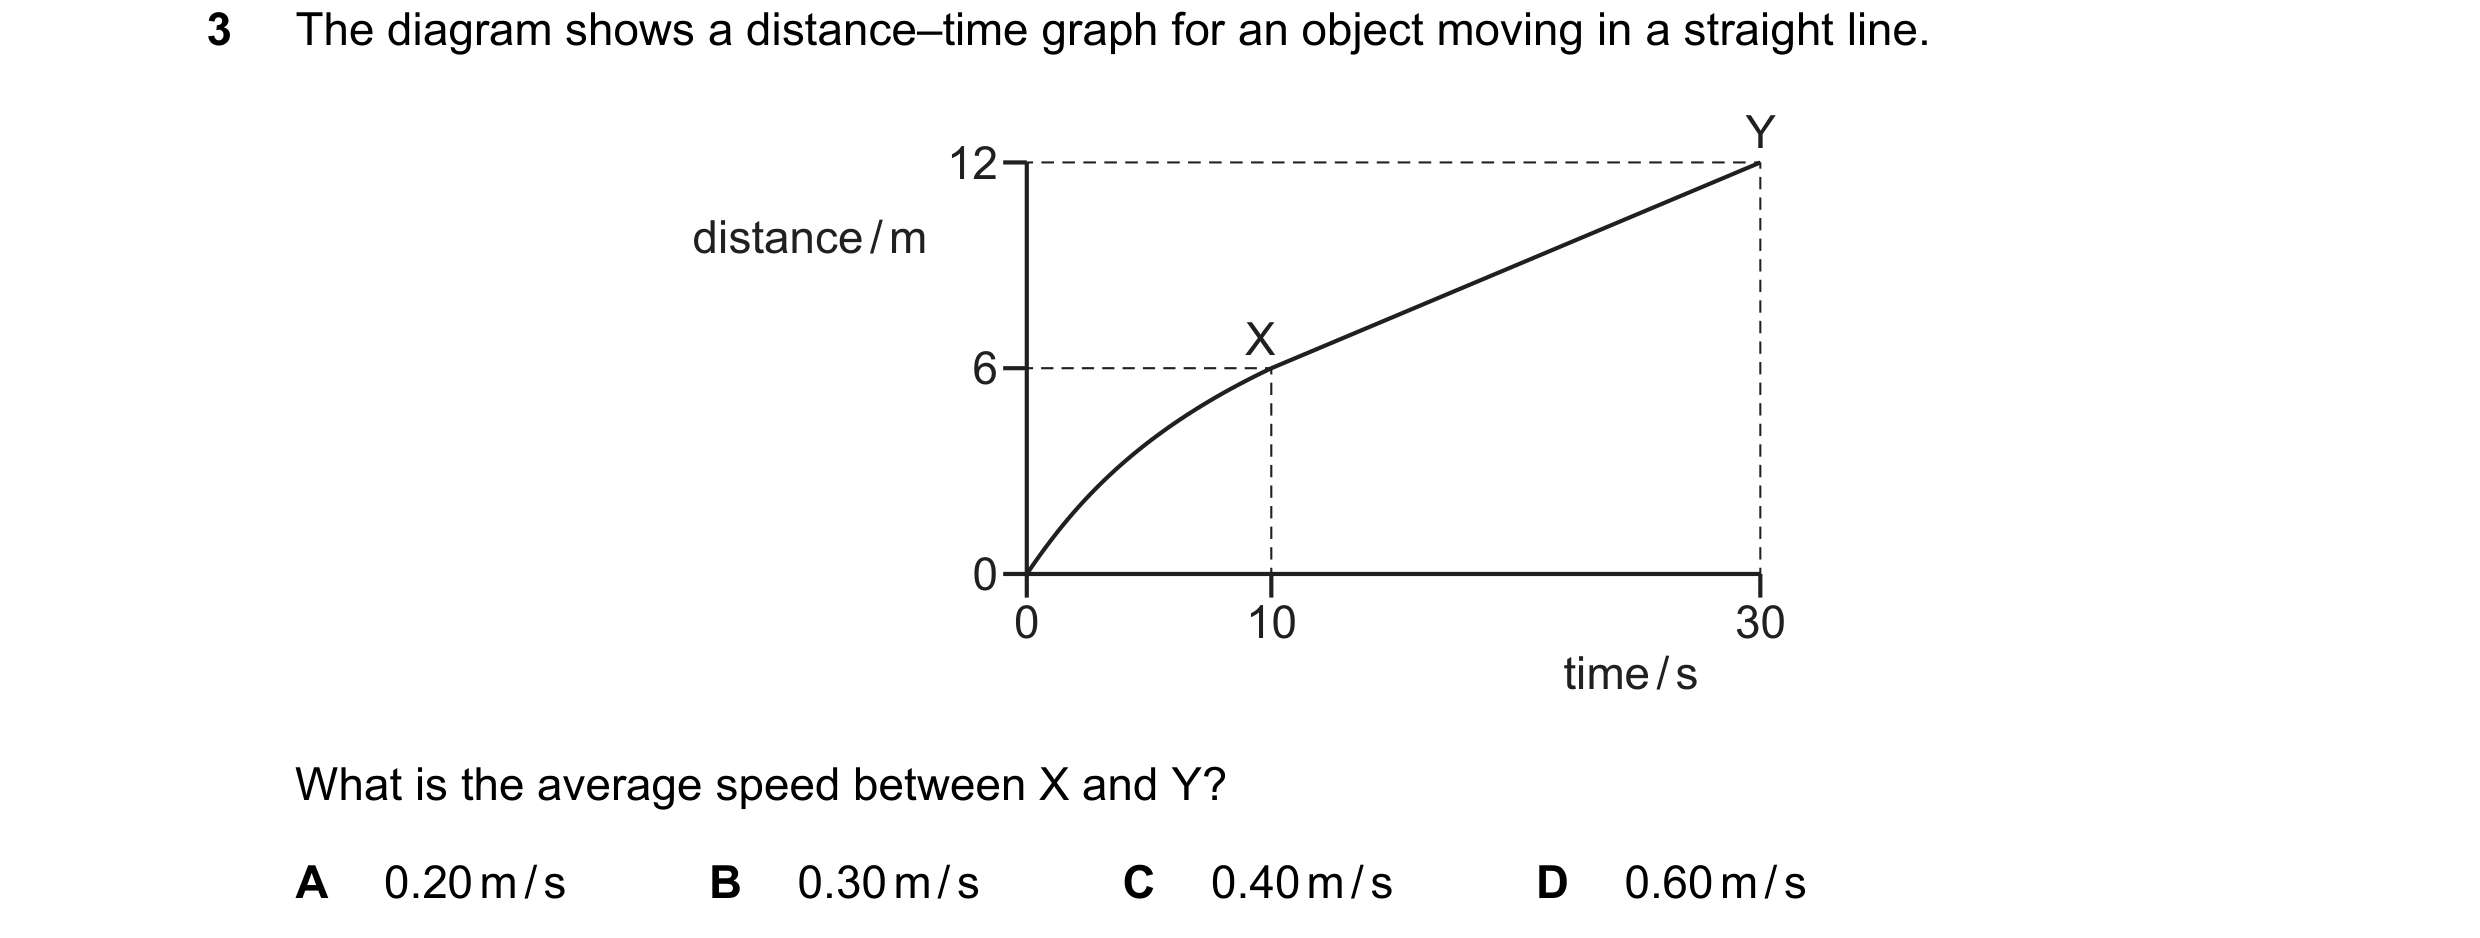
3 The diagram shows a distance–time graph for an object moving in a straight line. Y 12 distance / m X 6 0 0 10 30 time / s What is the average speed between X and Y? A 0.20 m / s B 0.30 m / s C 0.40 m / s D 0.60 m / s
1 marks
Answer: B
This question in 0972/11 May/June 2023
Q26 · Four objects are moving 0972/11 May/June 2023
7 Four objects are moving. Which object has a zero resultant force acting on it? A the object moving at a decreasing speed B the object moving at an increasing speed C the object moving at a constant speed in a circle D the object moving at a constant speed in a straight line
1 marks
Answer: D
This question in 0972/11 May/June 2023
Q27 · Student X fires a starting pistol which produces smoke and sound 0972/11 May/June 2023
22 Student X fires a starting pistol which produces smoke and sound. Student Y is standing 100 m away and sees the smoke the instant it is produced. The speed of sound in air is 340 m / s. What is the time delay between student Y seeing the smoke and hearing the sound? A 0.29 s B 0.59 s C 1.7 s D 3.4 s
1 marks
Answer: A
This question in 0972/11 May/June 2023
Q28 · The speed–time graph represents a short journey 0972/12 May/June 2023
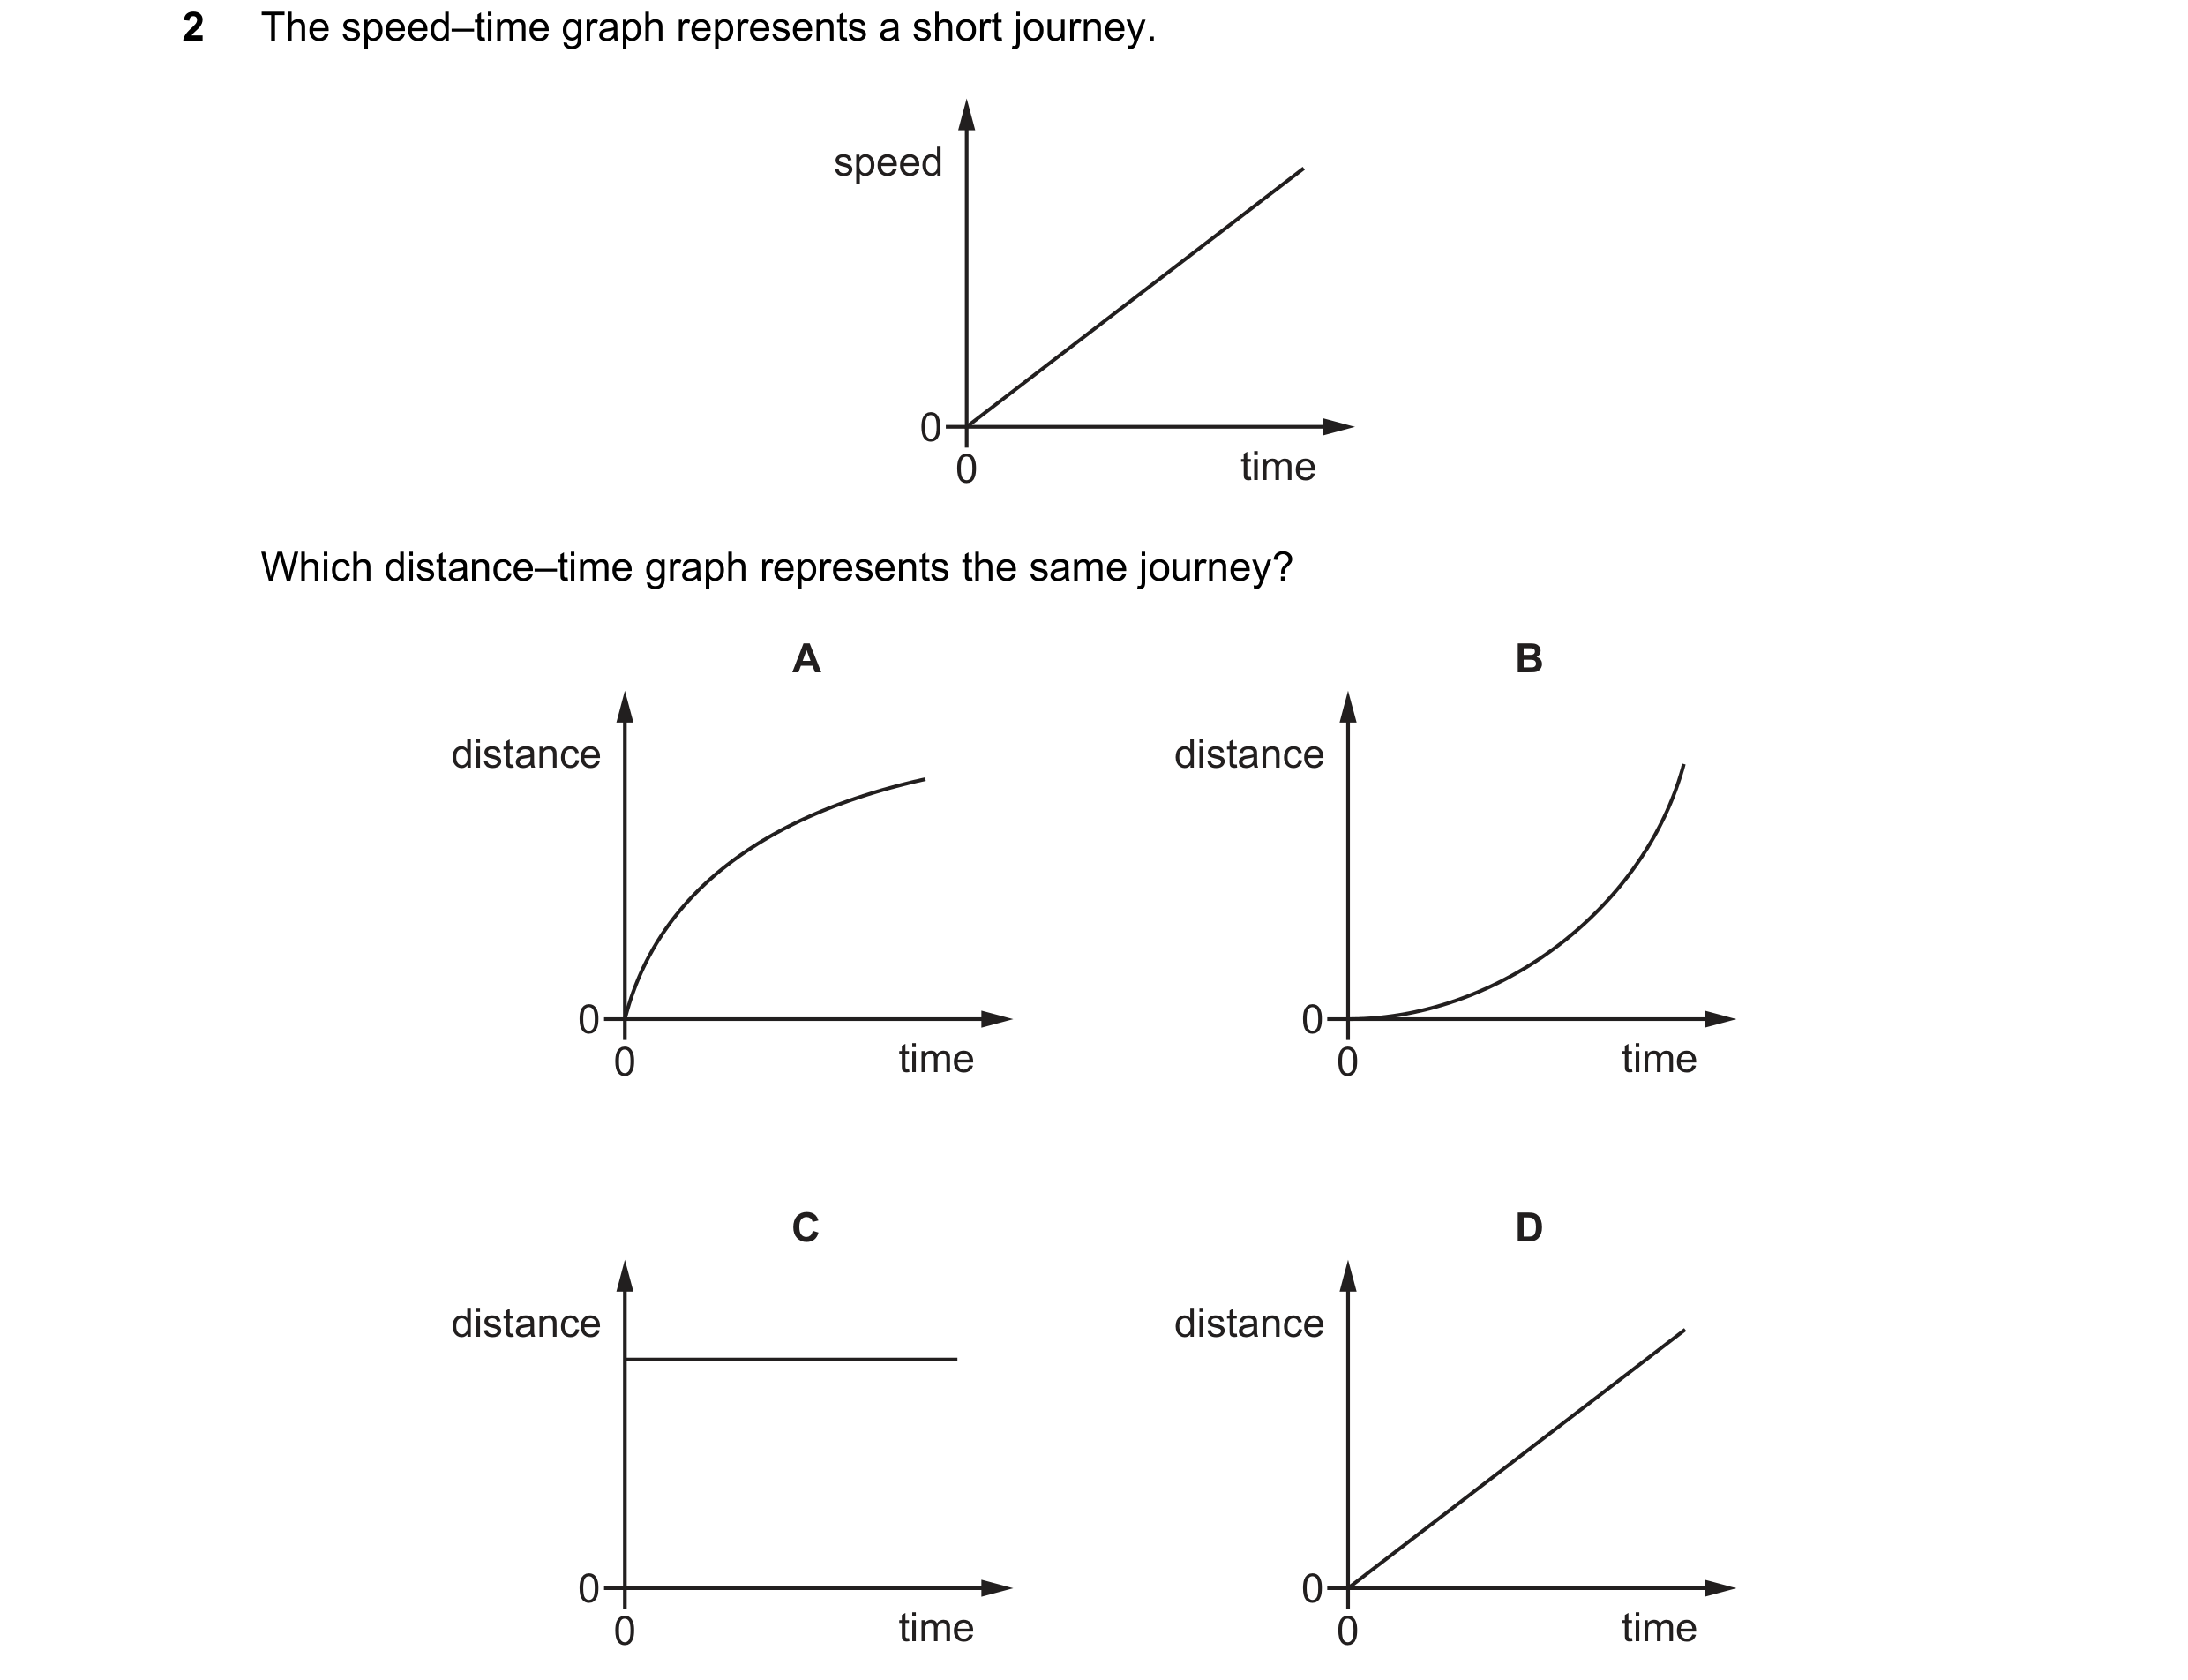
2 The speed–time graph represents a short journey. speed 0 0 time Which distance–time graph represents the same journey? A B distance distance 0 0 0 time 0 time C D distance distance 0 0 0 time 0 time
1 marks
Answer: B
This question in 0972/12 May/June 2023
Q29 · The graph represents the motion of a car 0972/12 May/June 2023
3 The graph represents the motion of a car. 10 speed m / s 8 6 4 2 0 0 1 2 3 4 5 time / s How far has the car moved between 0 and 5 s? A 2 m B 10 m C 25 m D 50 m
1 marks
Answer: C
This question in 0972/12 May/June 2023
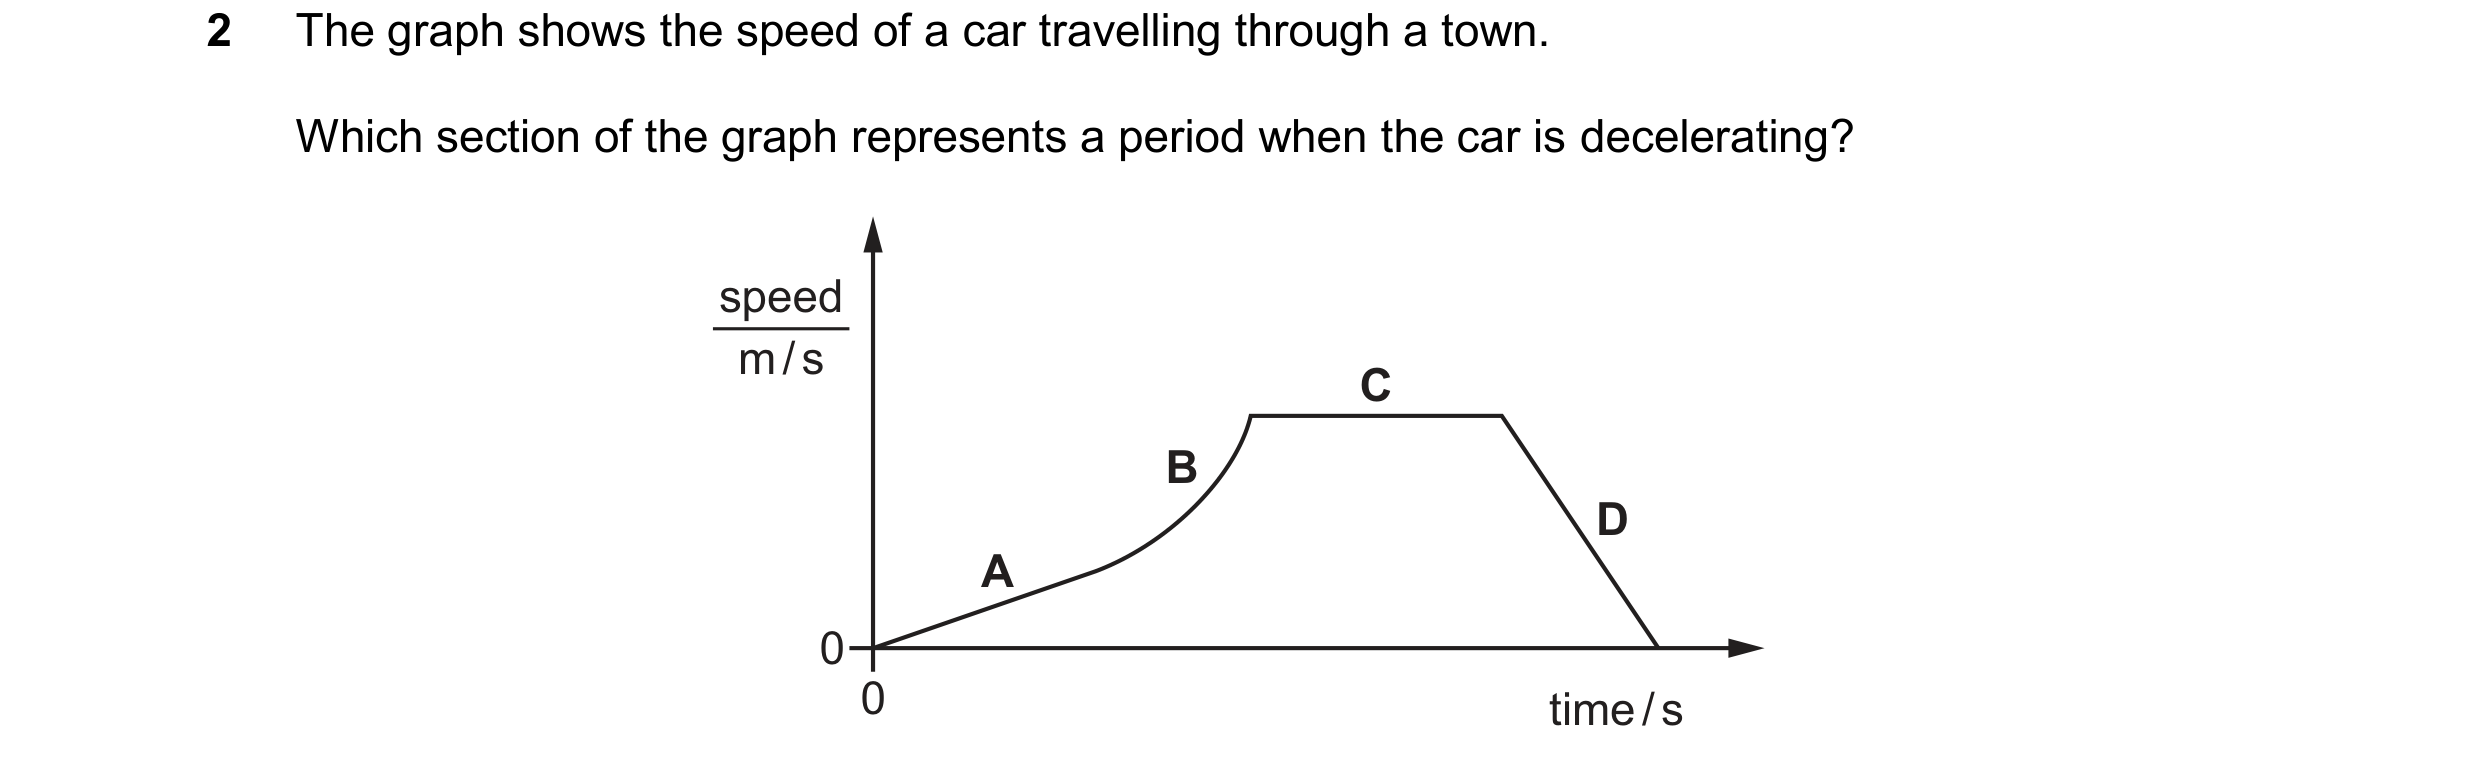
Q30 · The graph shows the speed of a car travelling through a town 0972/11 Oct/Nov 2023
2 The graph shows the speed of a car travelling through a town. Which section of the graph represents a period when the car is decelerating? speed m / s C B D A 0 0 time / s
1 marks
Answer: D
This question in 0972/11 Oct/Nov 2023
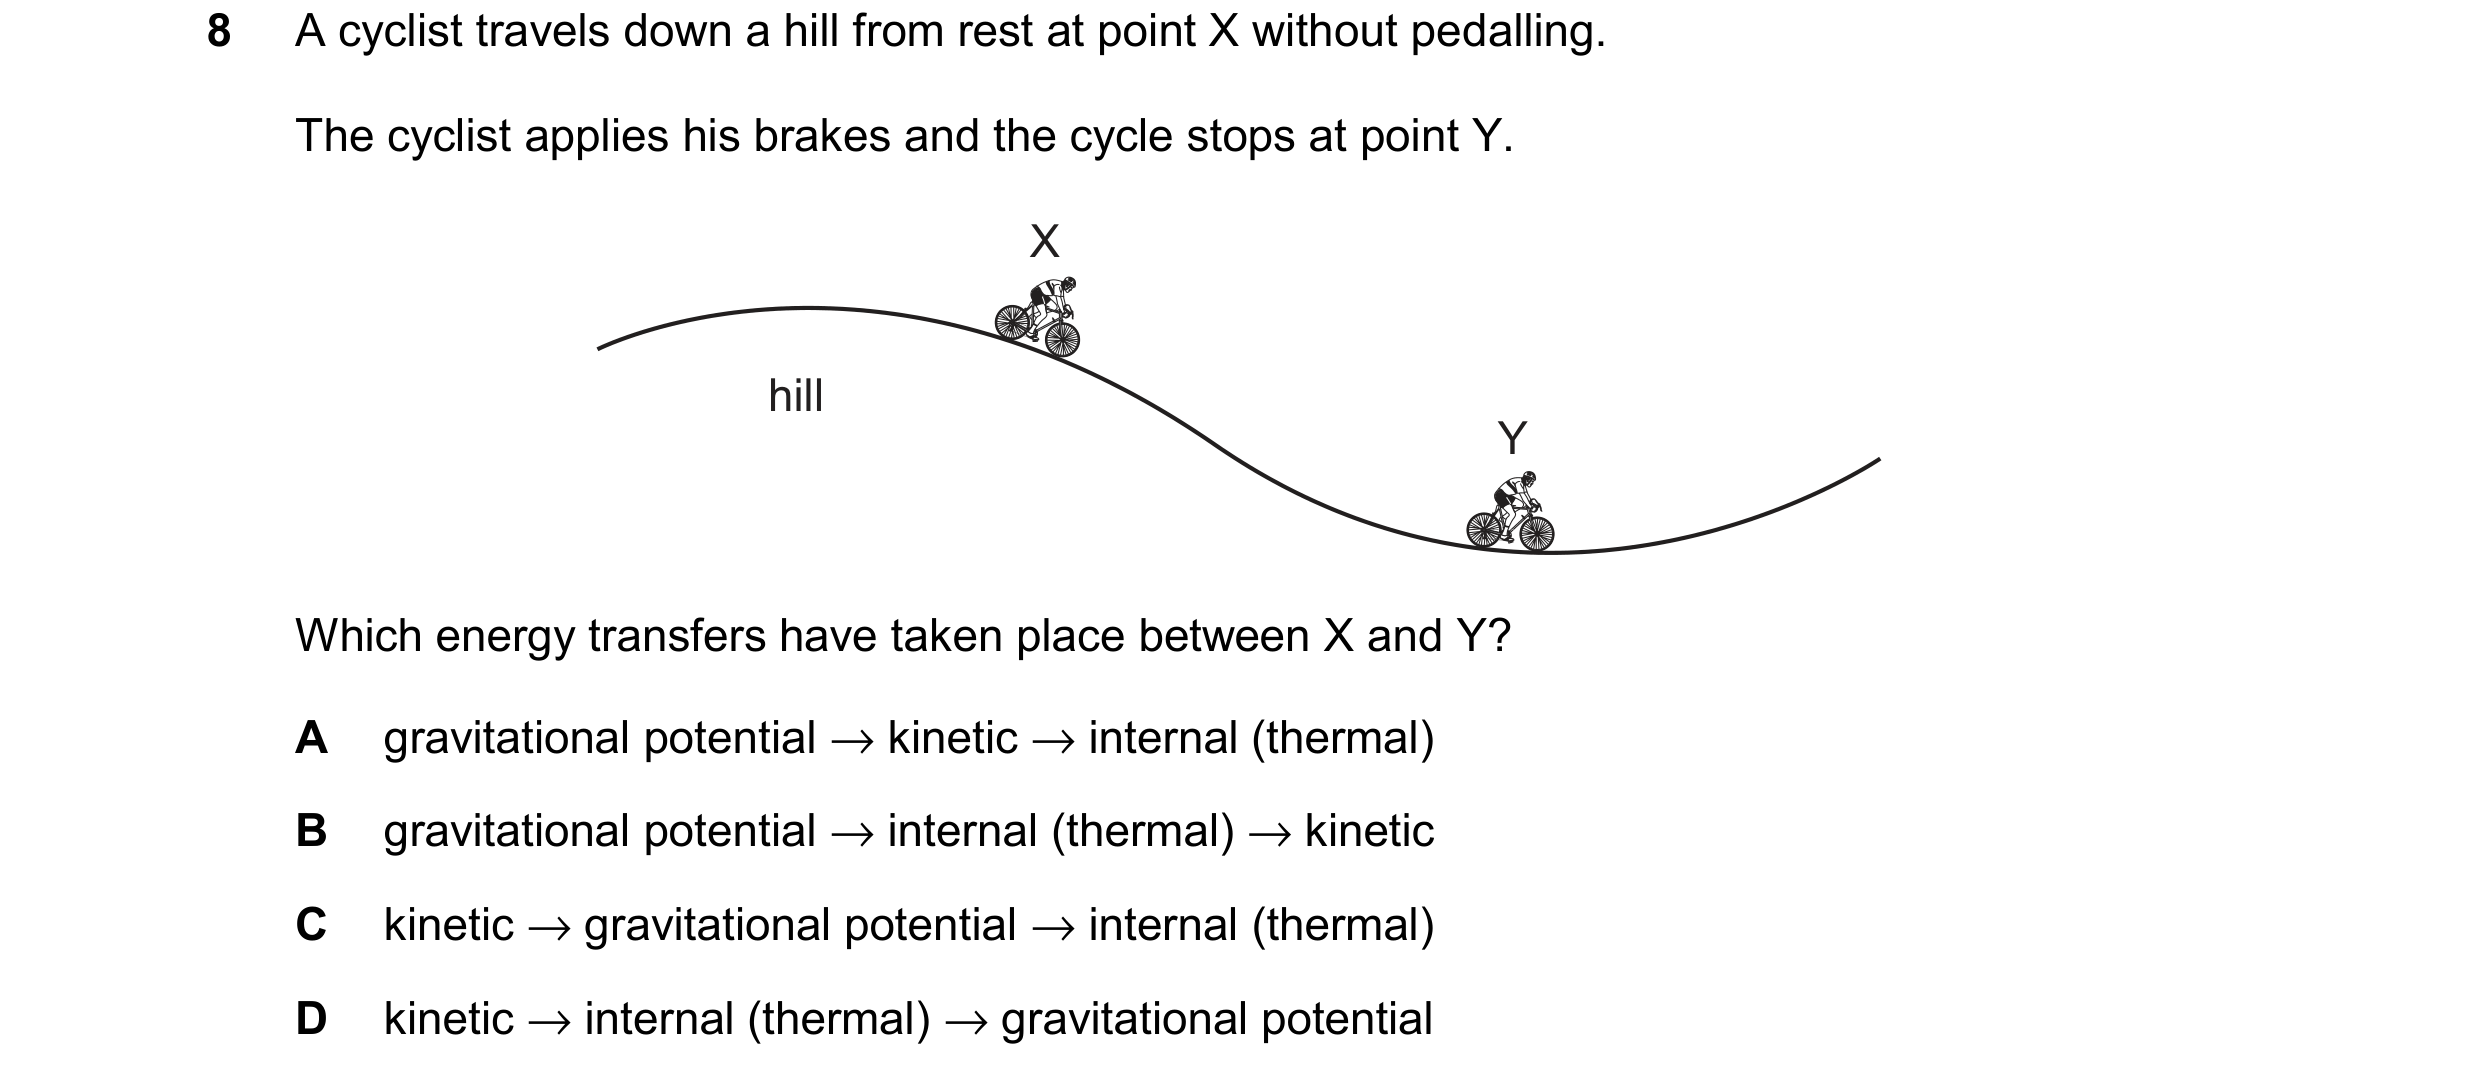
Q31 · A cyclist travels down a hill from rest at point X without pedalling 0972/11 Oct/Nov 2023
8 A cyclist travels down a hill from rest at point X without pedalling. The cyclist applies his brakes and the cycle stops at point Y. X hill Y Which energy transfers have taken place between X and Y? A gravitational potential → kinetic → internal (thermal) B gravitational potential → internal (thermal) → kinetic C kinetic → gravitational potential → internal (thermal) D kinetic → internal (thermal) → gravitational potential
1 marks
Answer: A
This question in 0972/11 Oct/Nov 2023
Q32 · The diagram shows two objects, X and Y, suspended from identical springs 0972/11 May/June 2024
2 The diagram shows two objects, X and Y, suspended from identical springs. The extension of each spring is different. object X object Y Which row compares the mass and the weight of the two objects? mass weight A both objects have the same mass both objects have the same weight B both objects have the same mass the weight of X is less than the weight of Y C the mass of X is less than the mass of Y both objects have the same weight D the mass of X is less than the mass of Y the weight of X is less than the weight of Y
1 marks
Answer: D
This question in 0972/11 May/June 2024
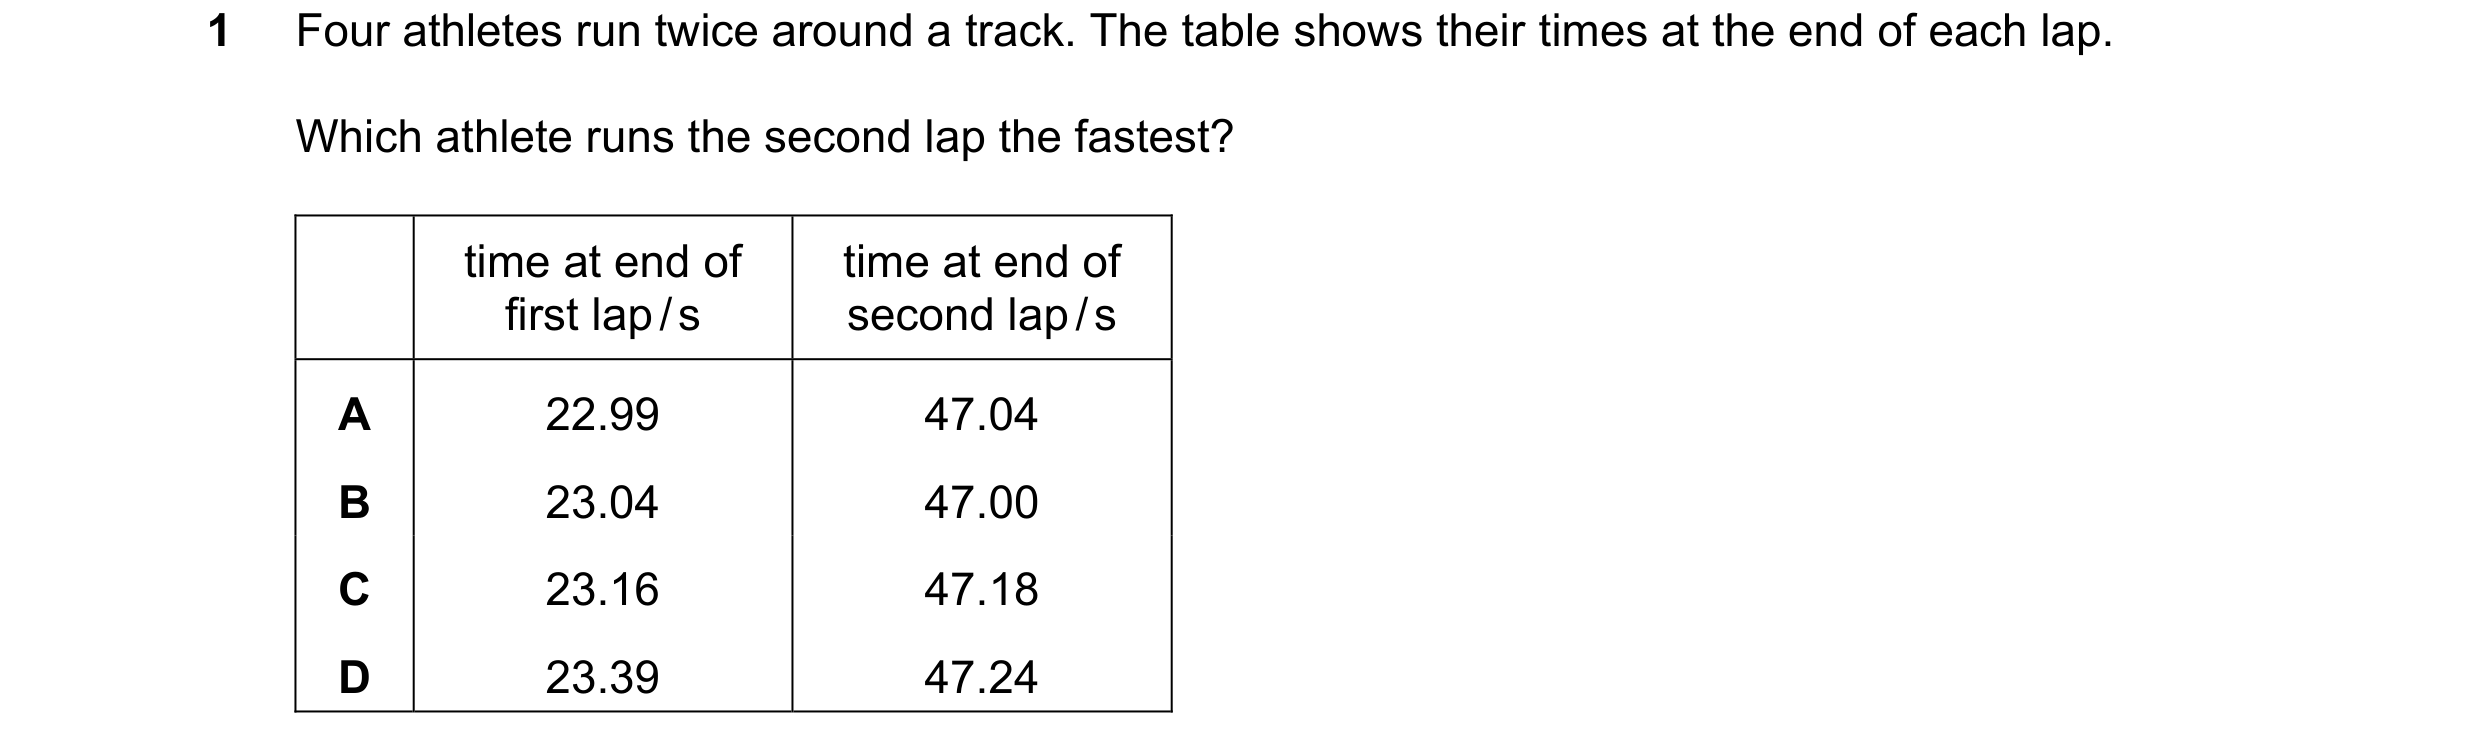
Q33 · Four athletes run twice around a track 0972/12 May/June 2024
1 Four athletes run twice around a track. The table shows their times at the end of each lap. Which athlete runs the second lap the fastest? time at end of time at end of first lap / s second lap / s A 22.99 47.04 B 23.04 47.00 C 23.16 47.18 D 23.39 47.24
1 marks
Answer: D
This question in 0972/12 May/June 2024
Q34 · A racing car is fitted with an on-board computer 0972/12 May/June 2024
2 A racing car is fitted with an on-board computer. Every time the car passes the starting line, the computer records the distance travelled in the following two seconds. Which set of data shows that the car is increasing in speed during the two seconds? A B distance distance time / s time / s travelled / m travelled / m 0 0 0 0 1 100 1 90 2 200 2 180 C D distance distance time / s time / s travelled / m travelled / m 0 0 0 0 1 80 1 100 2 190 2 180
1 marks
Answer: C
This question in 0972/12 May/June 2024
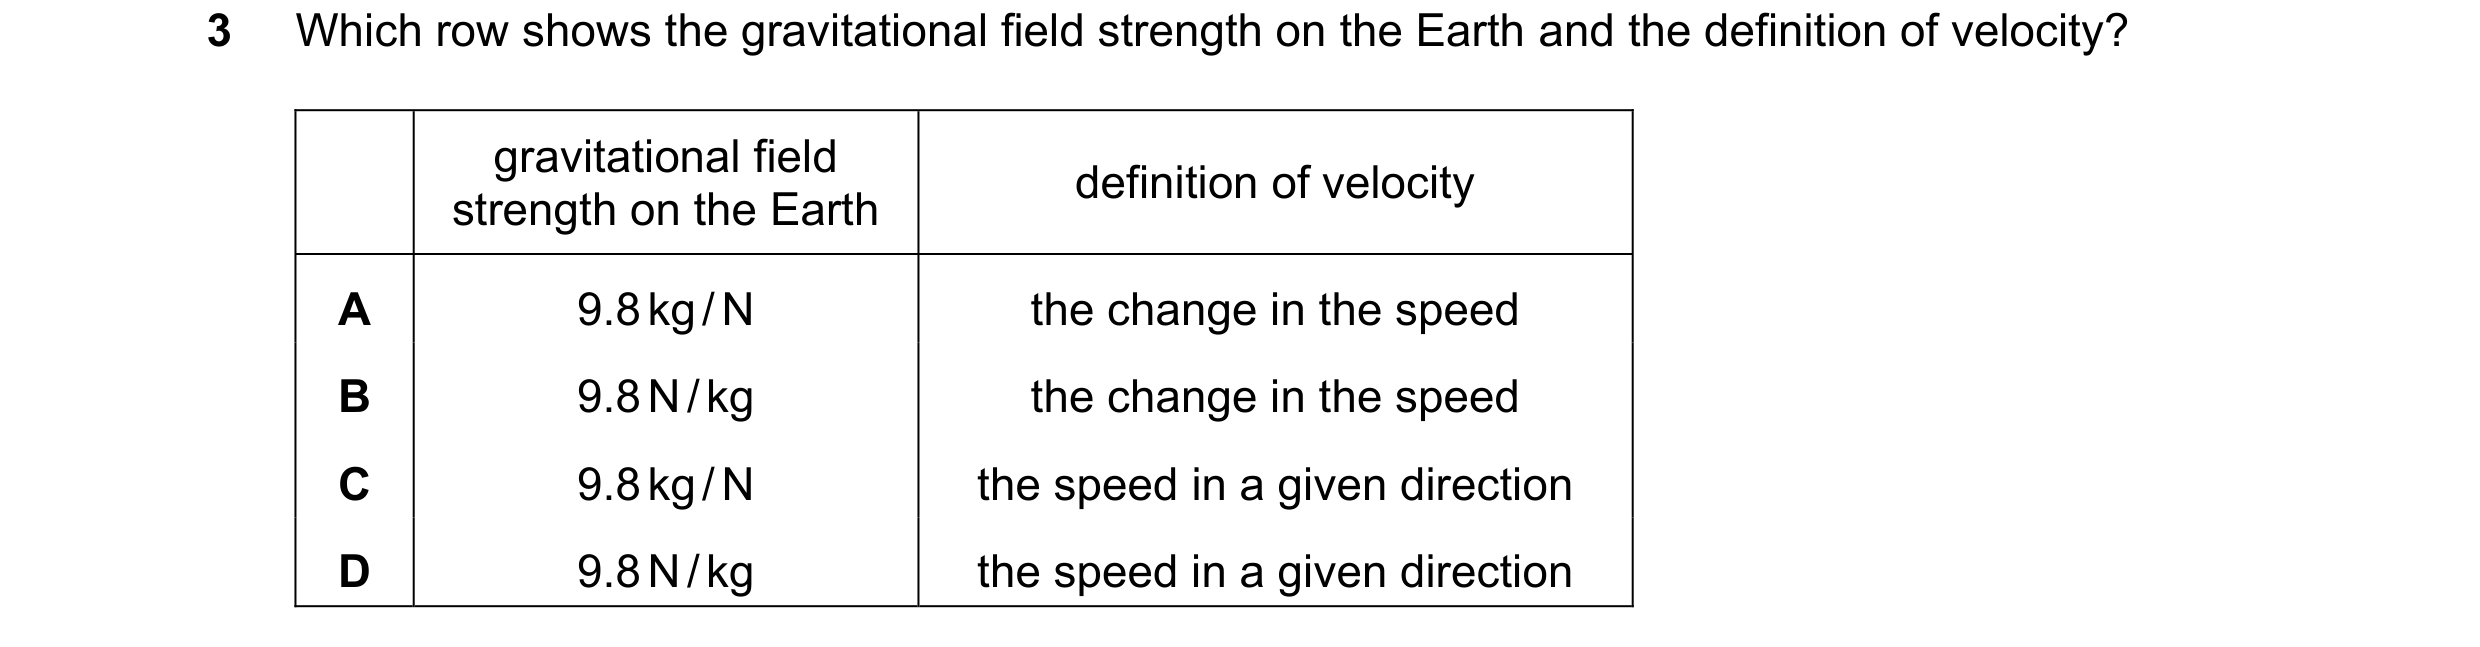
Q35 · Which row shows the gravitational field strength on the Earth and the definition of… 0972/12 May/June 2024
3 Which row shows the gravitational field strength on the Earth and the definition of velocity? gravitational field definition of velocity strength on the Earth A 9.8 kg / N the change in the speed B 9.8 N / kg the change in the speed C 9.8 kg / N the speed in a given direction D 9.8 N / kg the speed in a given direction
1 marks
Answer: D
This question in 0972/12 May/June 2024
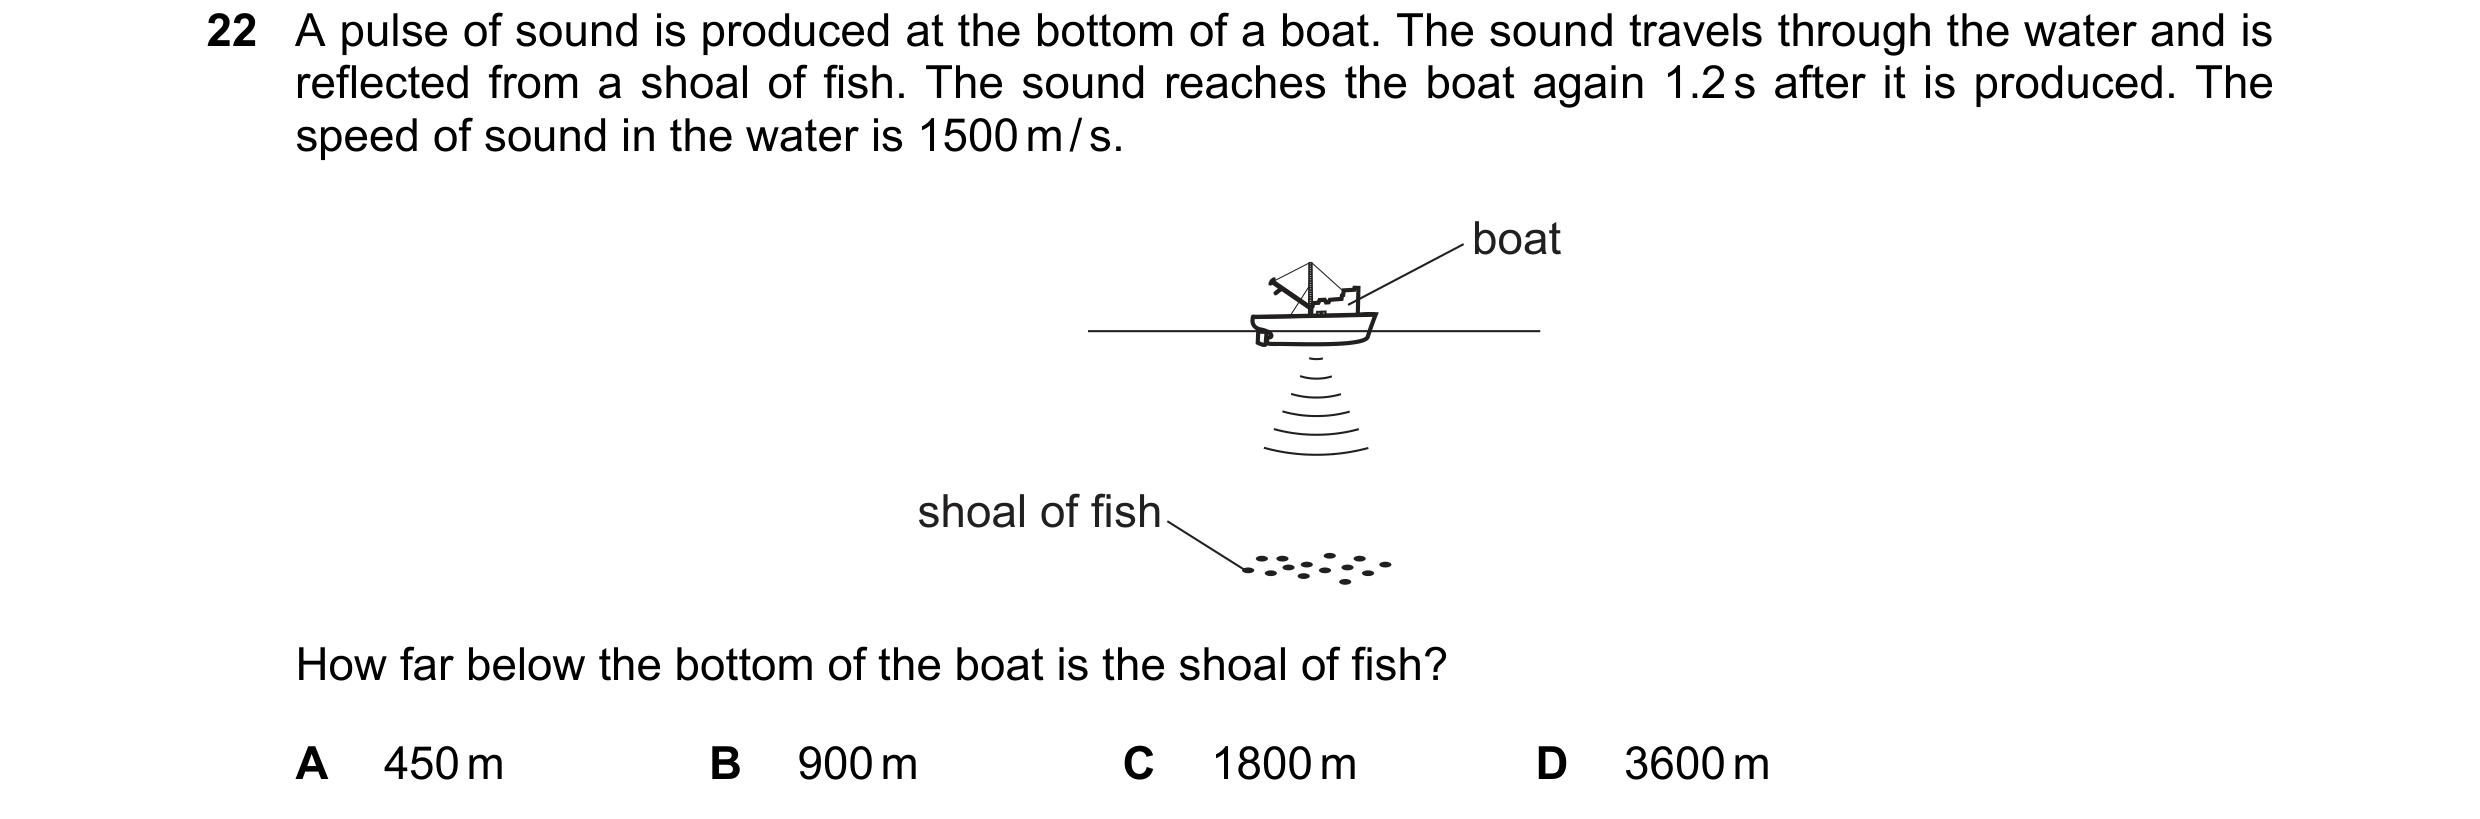
Q36 · A pulse of sound is produced at the bottom of a boat 0972/12 May/June 2024
22 A pulse of sound is produced at the bottom of a boat. The sound travels through the water and is reflected from a shoal of fish. The sound reaches the boat again 1.2 s after it is produced. The speed of sound in the water is 1500 m / s. boat shoal of fish How far below the bottom of the boat is the shoal of fish? A 450 m B 900 m C 1800 m D 3600 m
1 marks
Answer: B
This question in 0972/12 May/June 2024
Q37 · The diagram shows the speed–time graph of an object 0972/11 Oct/Nov 2024
2 The diagram shows the speed–time graph of an object. In which section does the object have the largest acceleration? D speed C B A 0 0 time
1 marks
Answer: B
This question in 0972/11 Oct/Nov 2024
Q38 · An object begins to fall close to the Earth’s surface 0972/11 Oct/Nov 2024
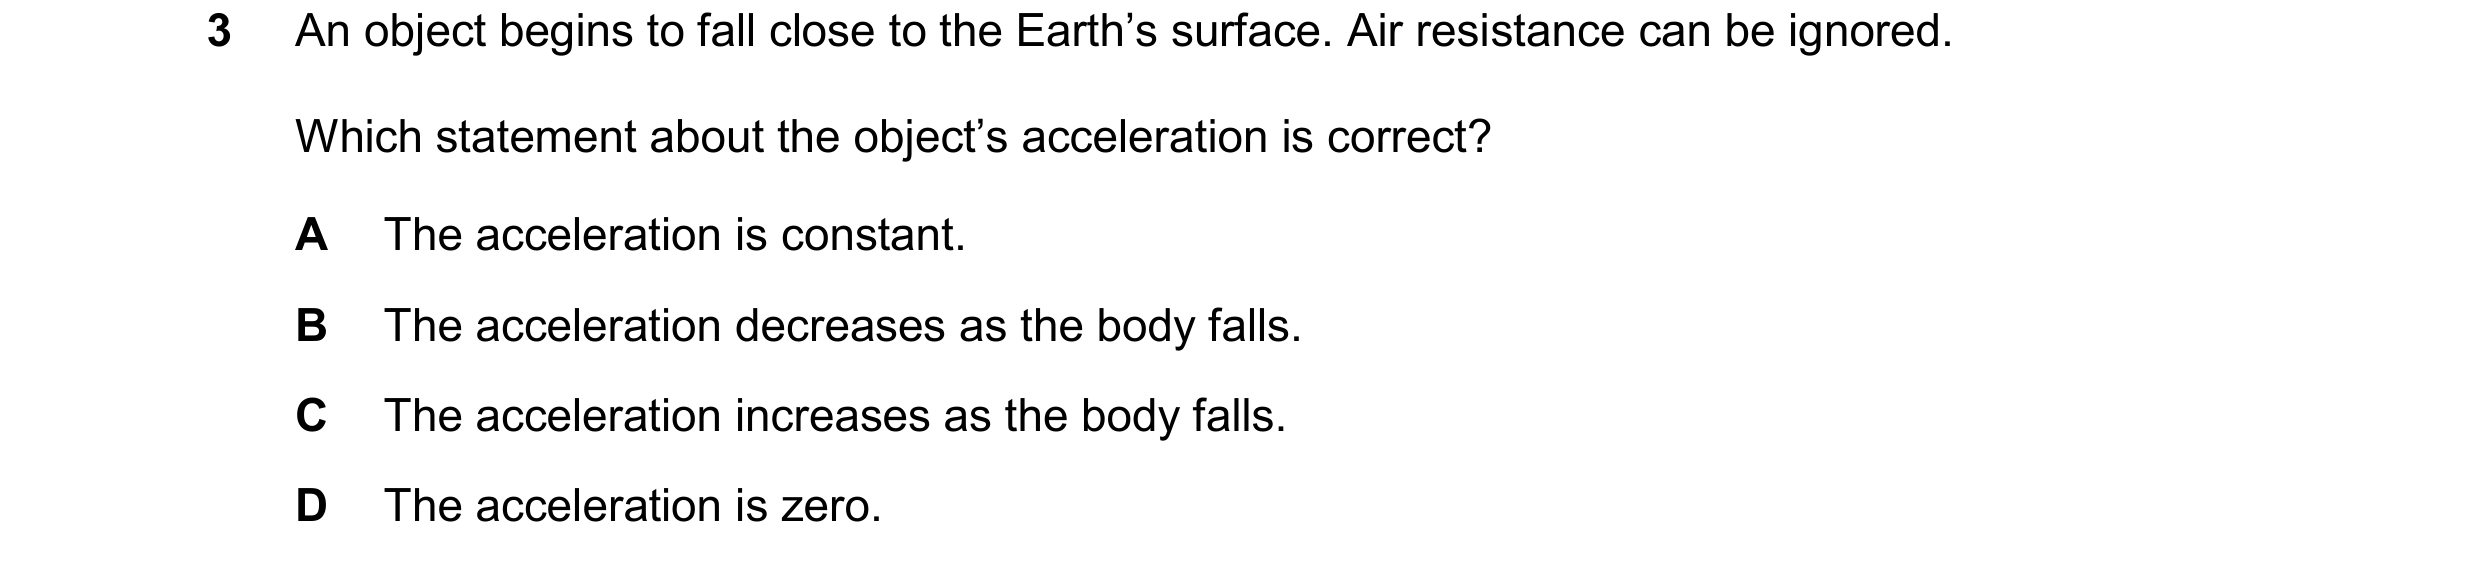
3 An object begins to fall close to the Earth’s surface. Air resistance can be ignored. Which statement about the object’s acceleration is correct? A The acceleration is constant. B The acceleration decreases as the body falls. C The acceleration increases as the body falls. D The acceleration is zero.
1 marks
Answer: A
This question in 0972/11 Oct/Nov 2024
Q39 · Which statement about the speed and velocity of an object is correct? 0972/11 May/June 2025
2 Which statement about the speed and velocity of an object is correct? A The speed and velocity of an object are always greater than zero. B The speed of an object is always greater than its velocity. C The velocity of an object is equal to its speed in a given direction. D Speed can be measured in m / s but velocity can only be measured in km / h.
1 marks
Answer: C
This question in 0972/11 May/June 2025
Q40 · The table shows a student’s times in three races 0972/11 May/June 2025
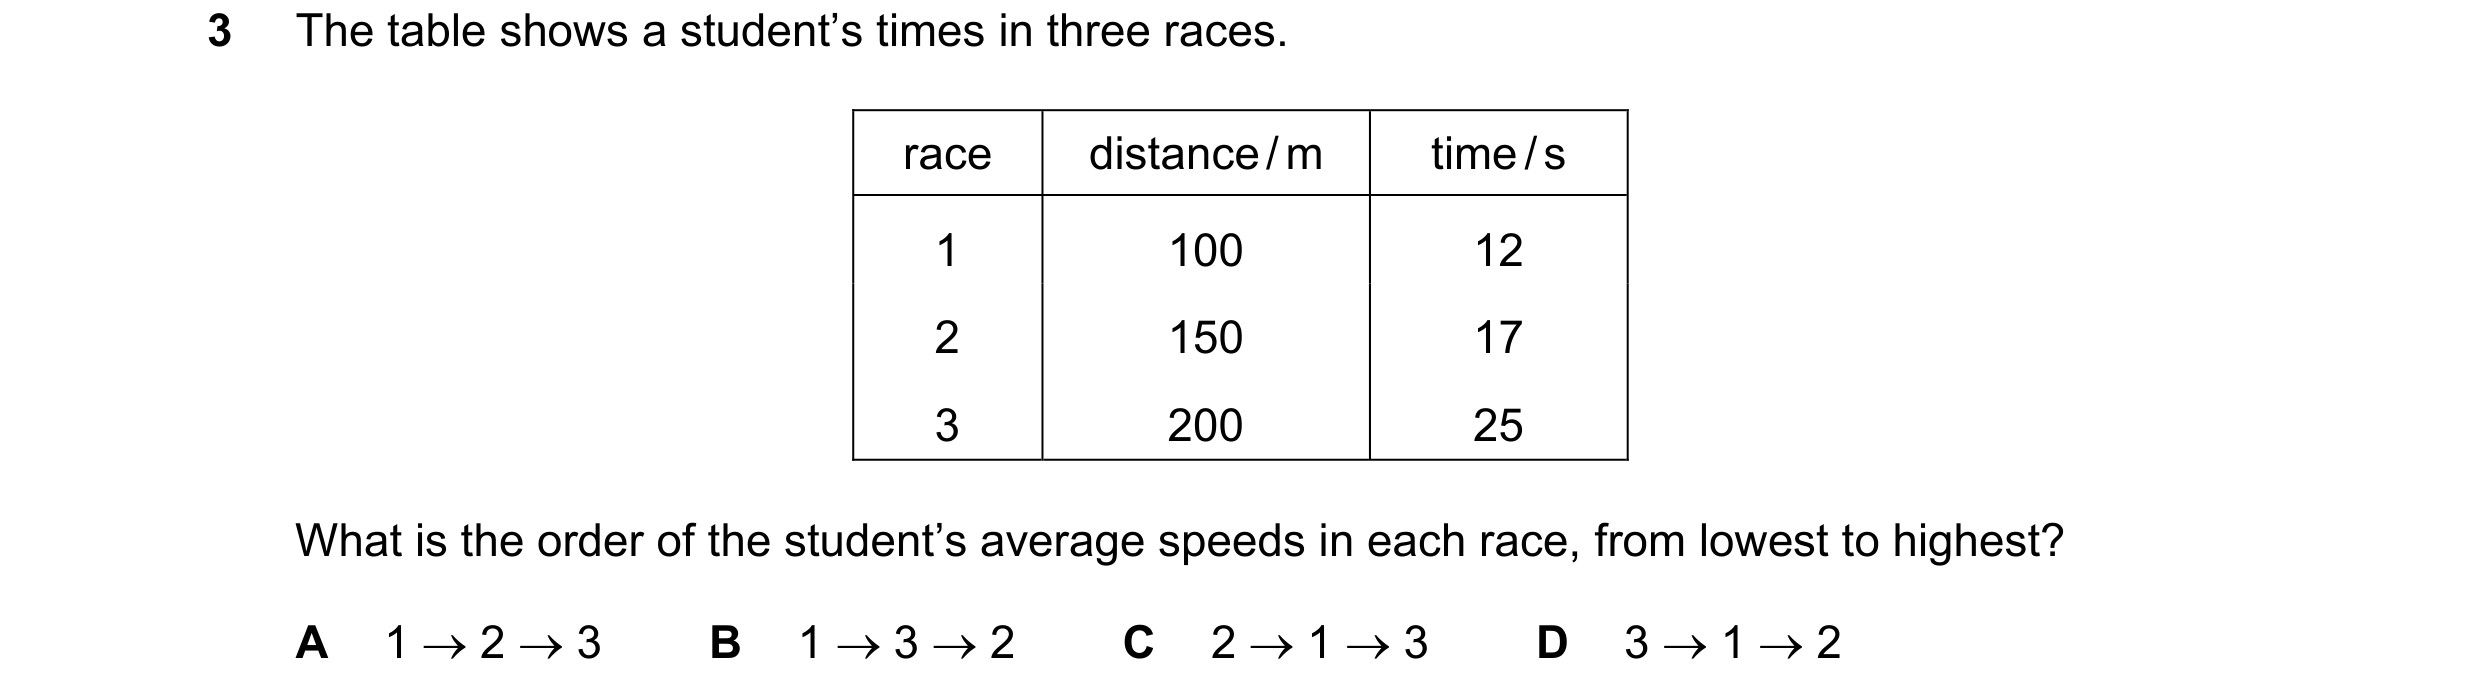
3 The table shows a student’s times in three races. race distance / m time / s 1 100 12 2 150 17 3 200 25 What is the order of the student’s average speeds in each race, from lowest to highest? A 1 2 3 B 1 3 2 C 2 1 3 D 3 1 2
1 marks
Answer: D
This question in 0972/11 May/June 2025
Q41 · A car is driven from rest on a long straight road 0972/11 May/June 2025
6 A car is driven from rest on a long straight road. The car engine exerts a constant driving force. The diagram shows the horizontal forces acting on the car. The resistive forces are proportional to the speed of the car. resistive driving force forces (from engine) Why does the car eventually reach a maximum speed? A The resistive forces decrease to make the acceleration of the car negative. B The resistive forces decrease to make the acceleration of the car zero. C The resistive forces increase to make the acceleration of the car negative. D The resistive forces increase to make the acceleration of the car zero.
1 marks
Answer: D
This question in 0972/11 May/June 2025
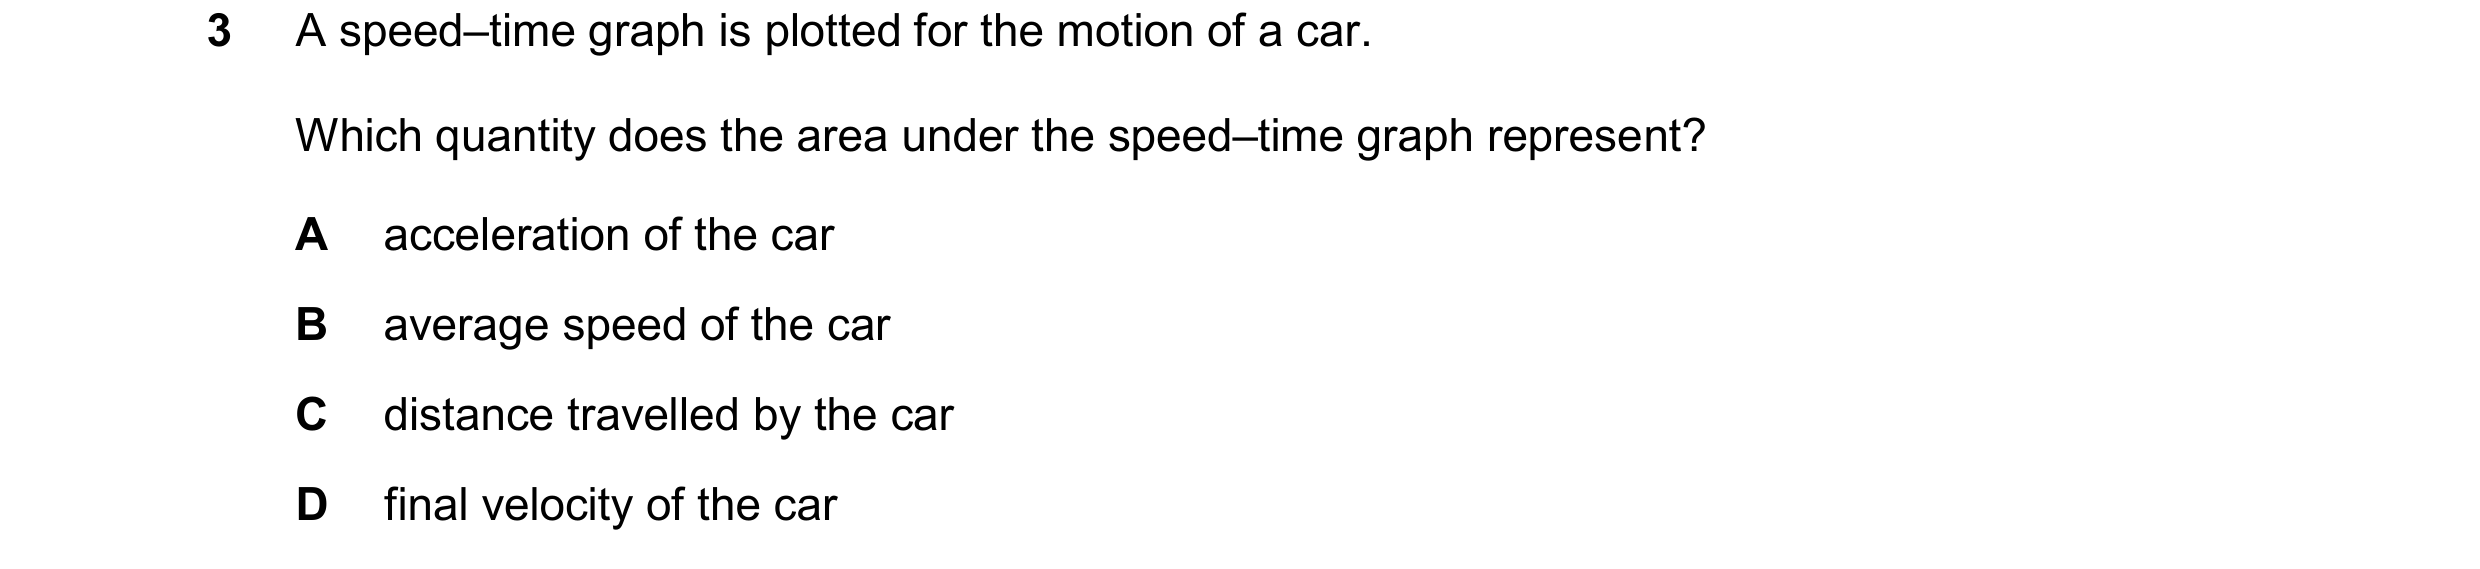
Q42 · A speed–time graph is plotted for the motion of a car 0972/12 May/June 2025
3 A speed–time graph is plotted for the motion of a car. Which quantity does the area under the speed–time graph represent? A acceleration of the car B average speed of the car C distance travelled by the car D final velocity of the car
1 marks
Answer: C
This question in 0972/12 May/June 2025
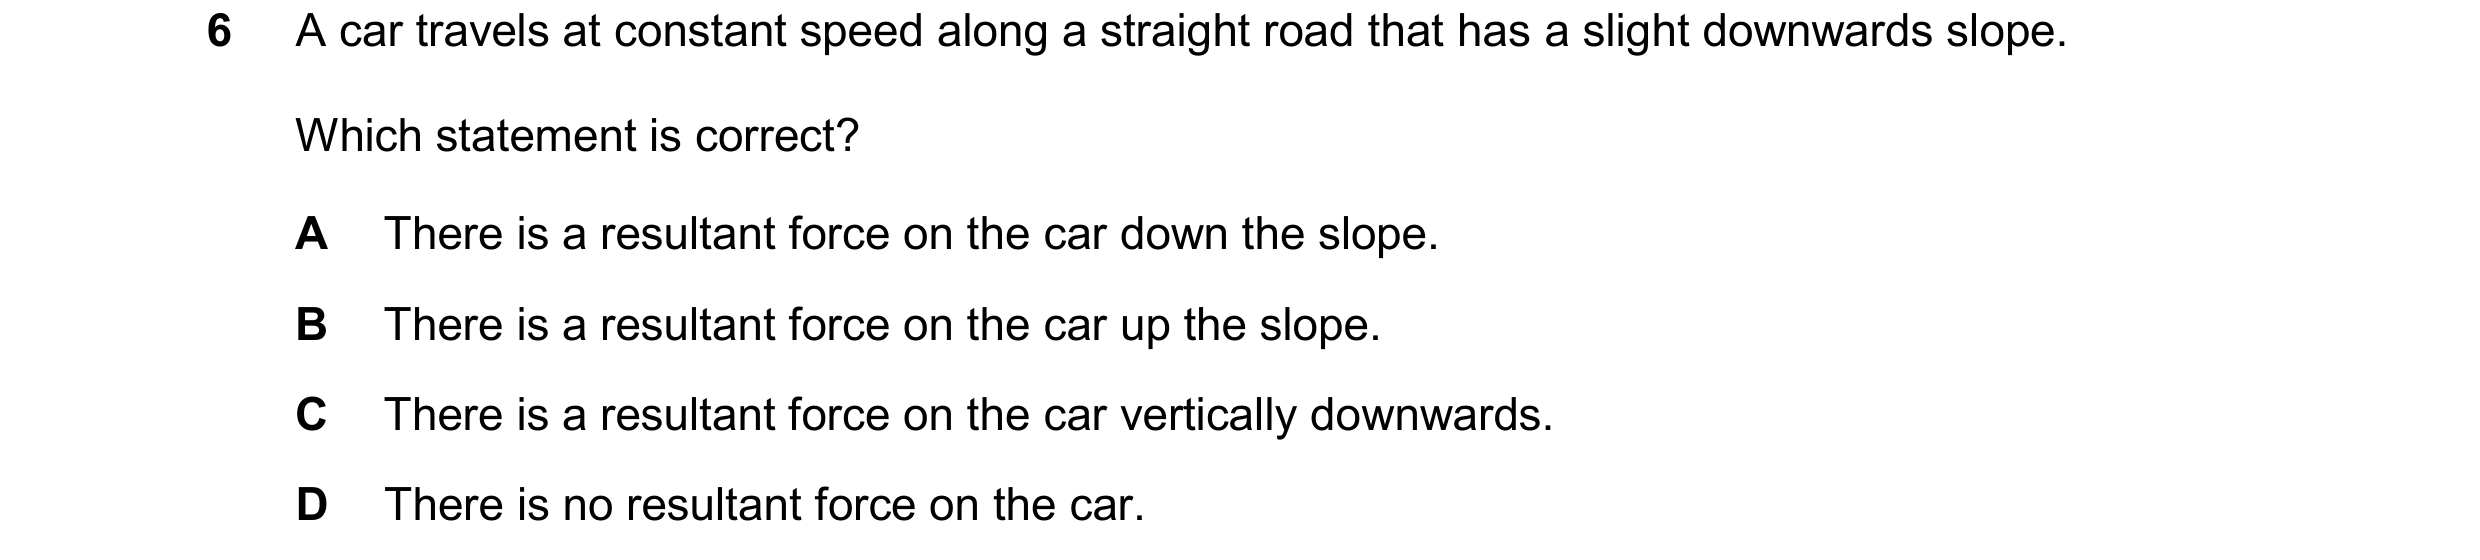
Q43 · A car travels at constant speed along a straight road that has a slight downwards slope 0972/12 May/June 2025
6 A car travels at constant speed along a straight road that has a slight downwards slope. Which statement is correct? A There is a resultant force on the car down the slope. B There is a resultant force on the car up the slope. C There is a resultant force on the car vertically downwards. D There is no resultant force on the car.
1 marks
Answer: D
This question in 0972/12 May/June 2025

 1 / 13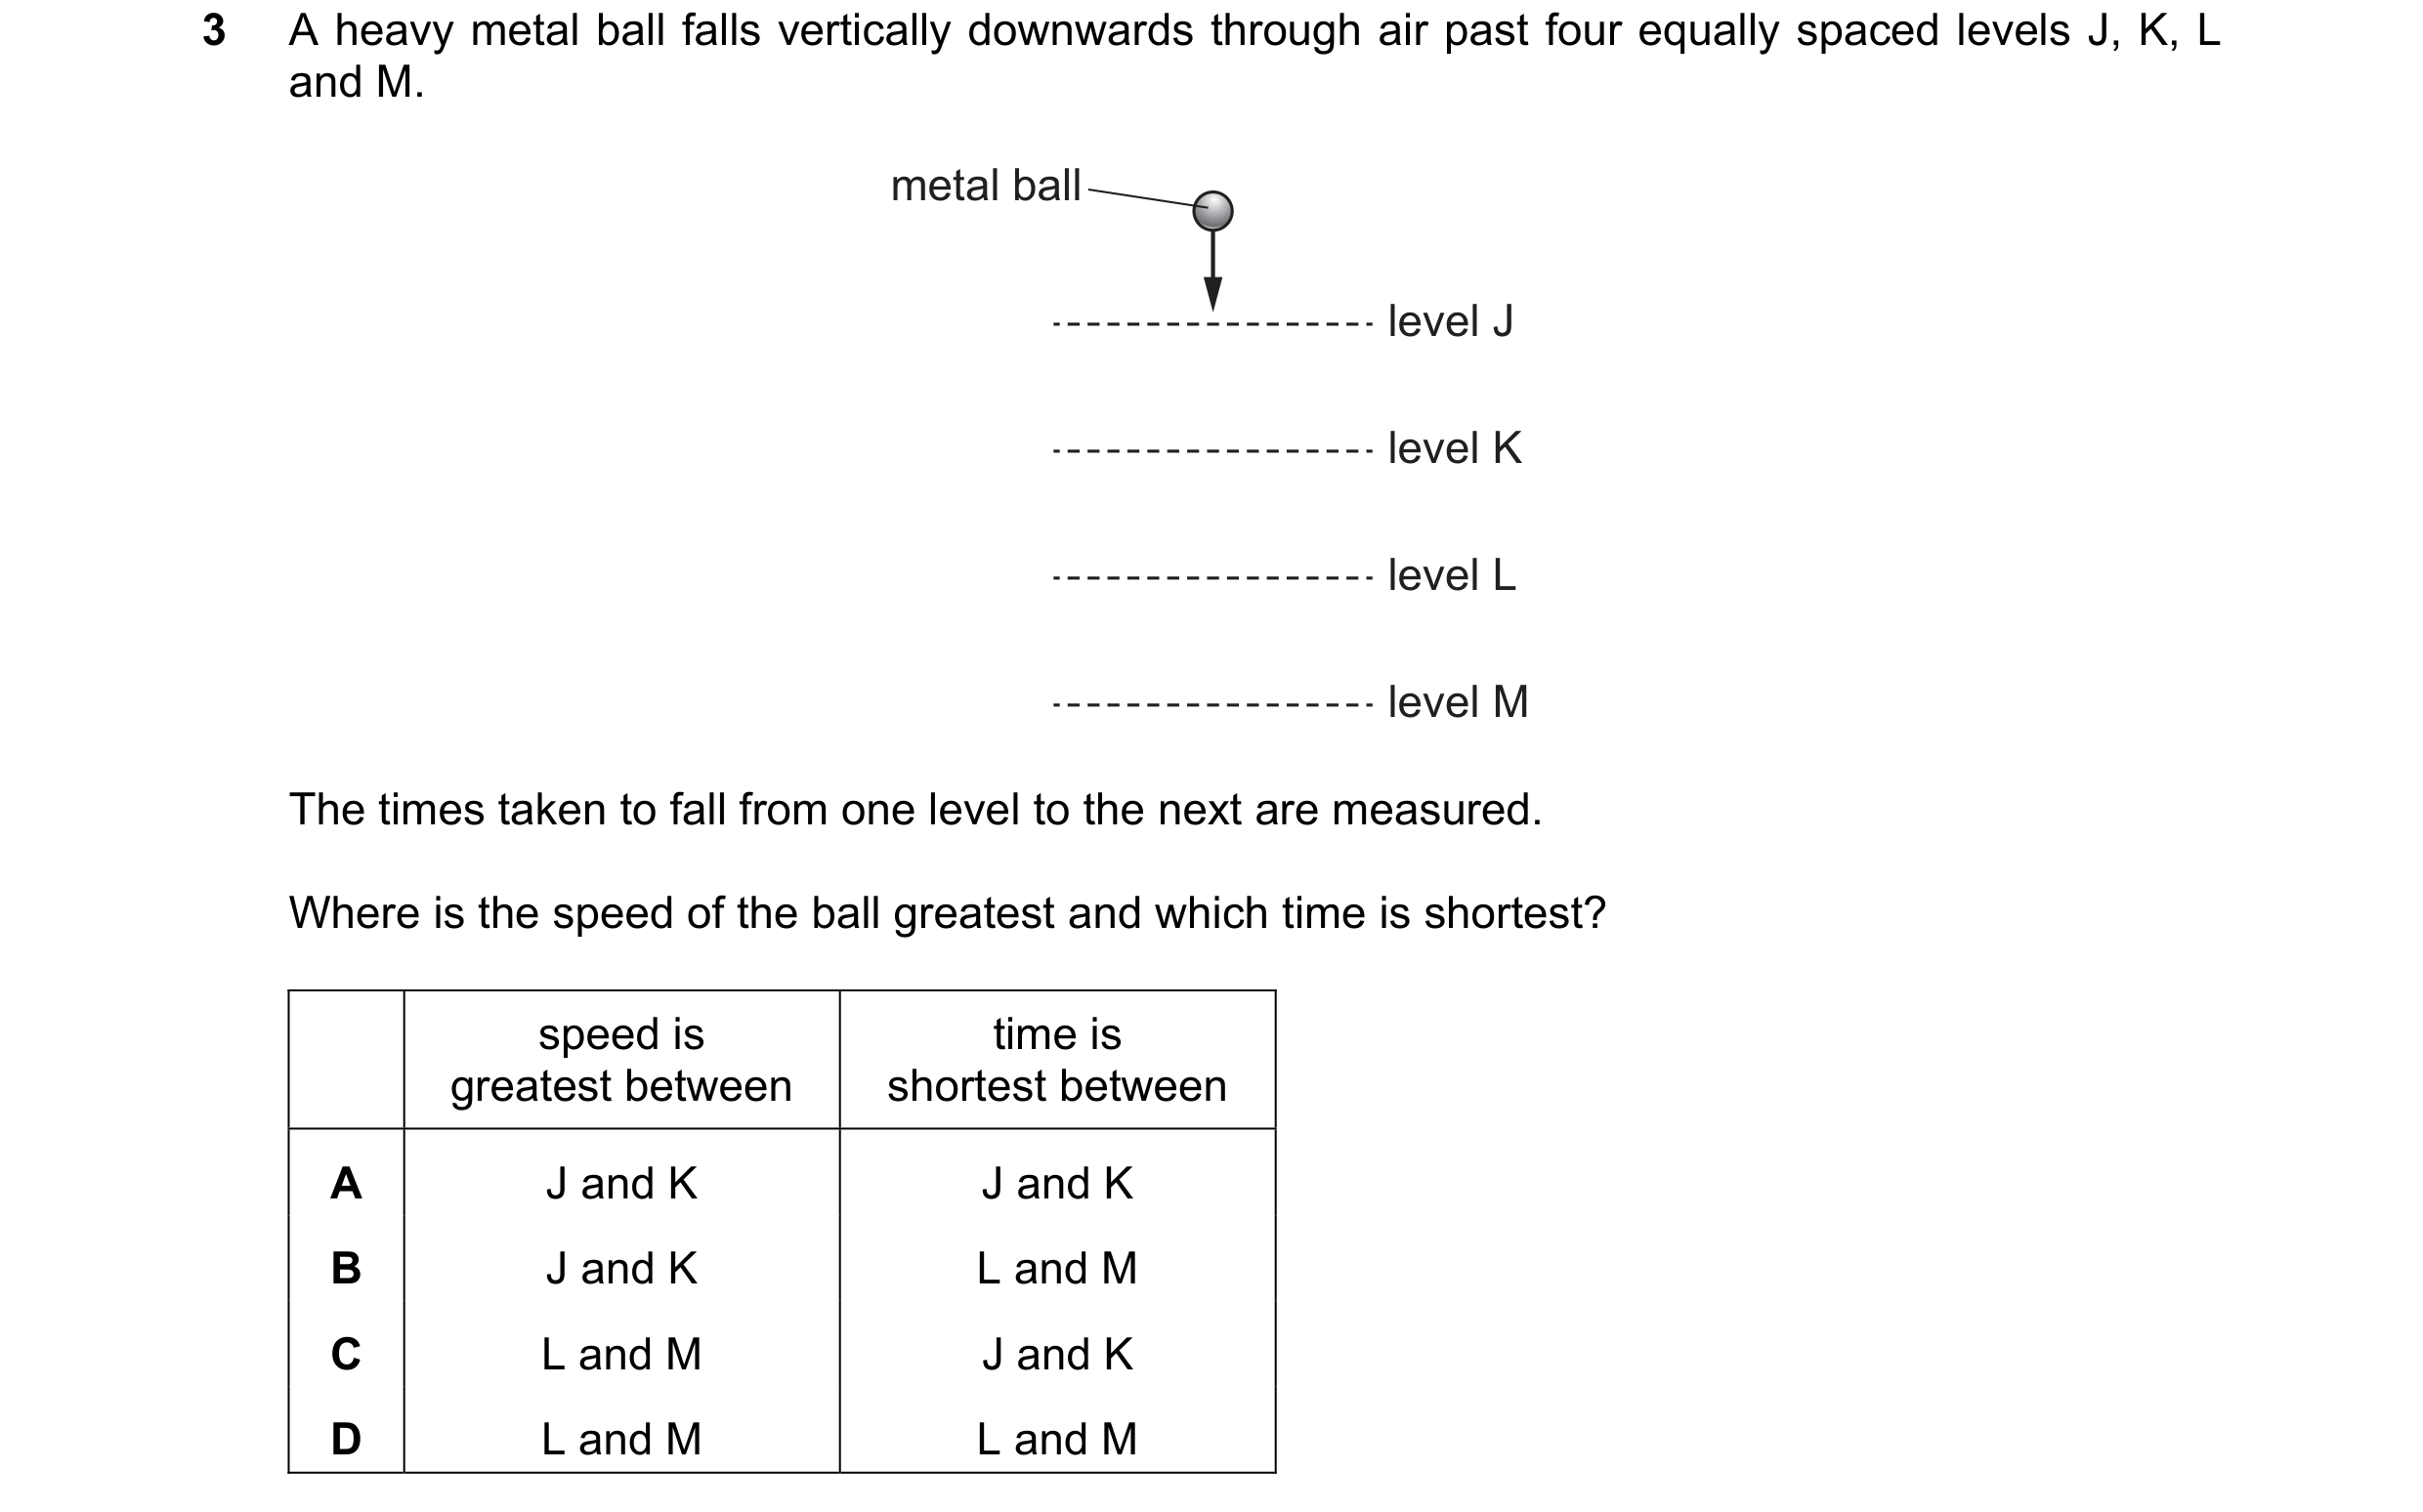
 2 / 13


 3 / 13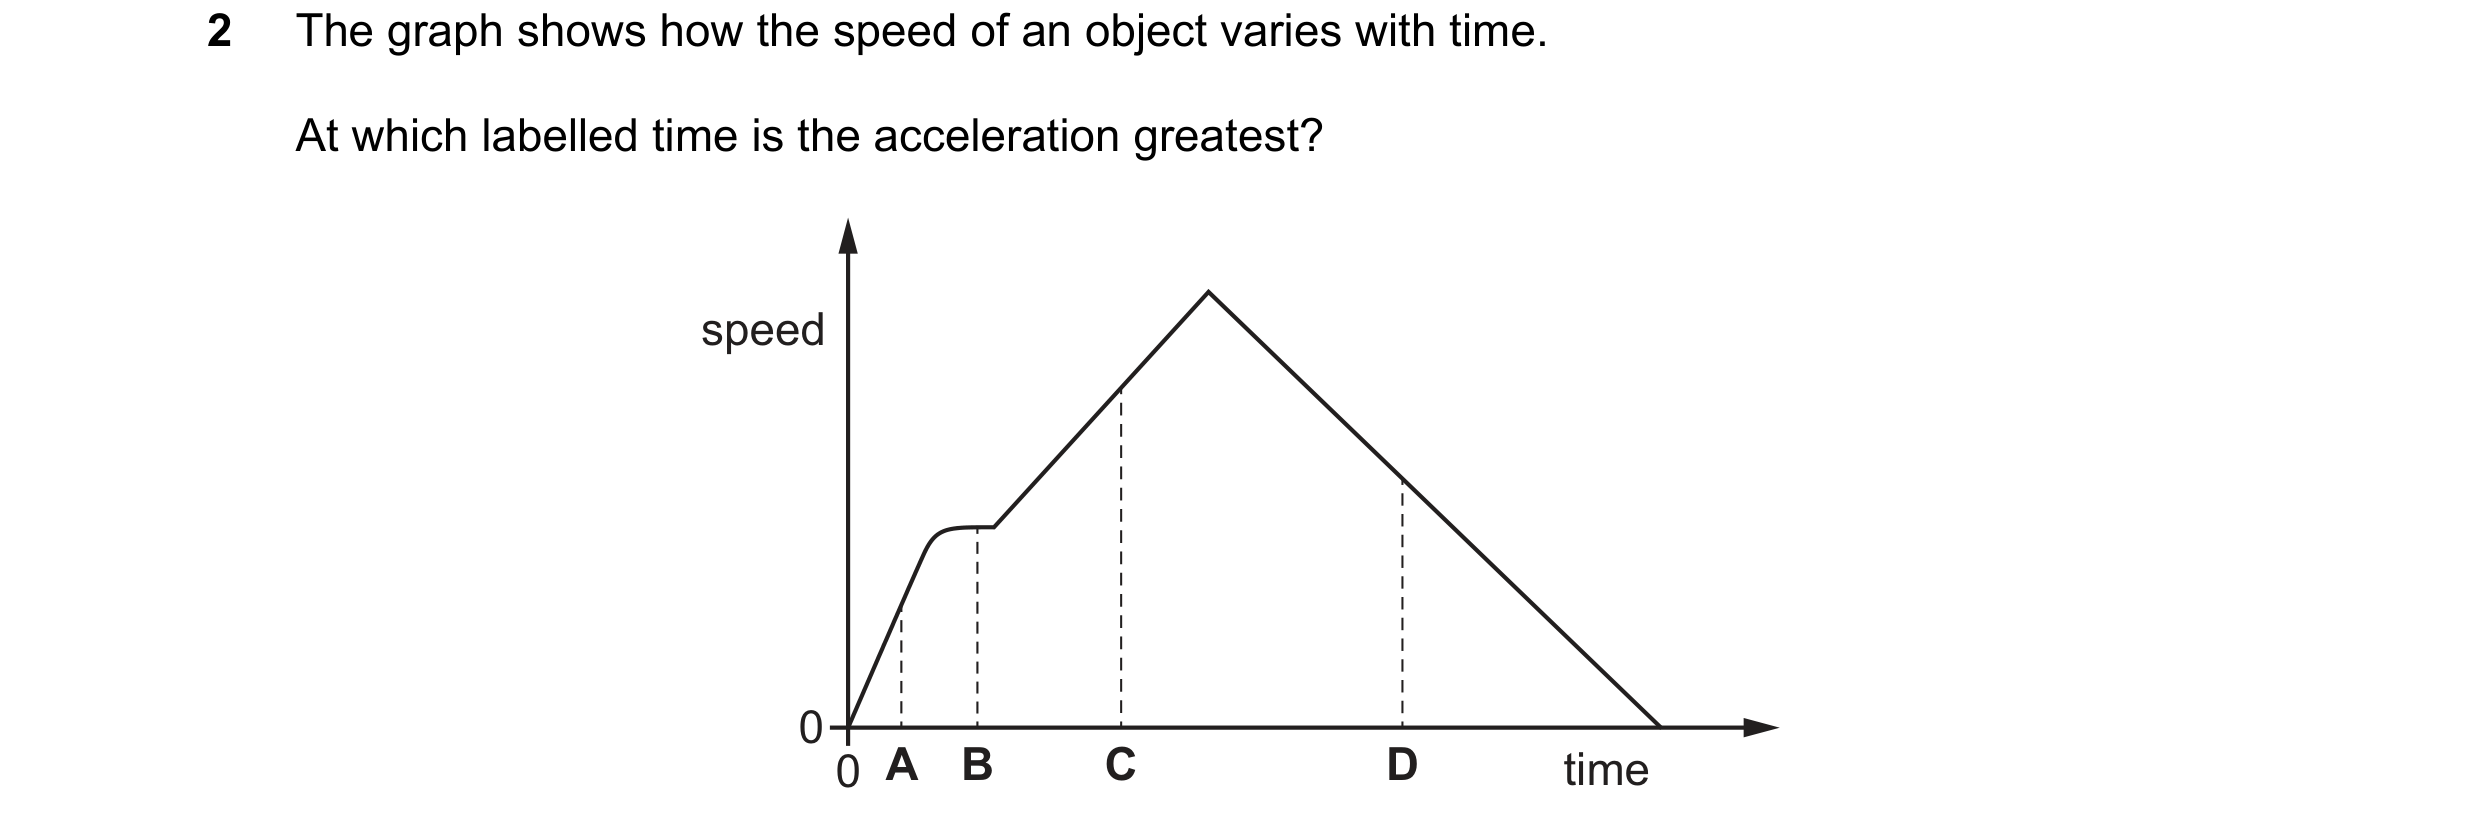


 4 / 13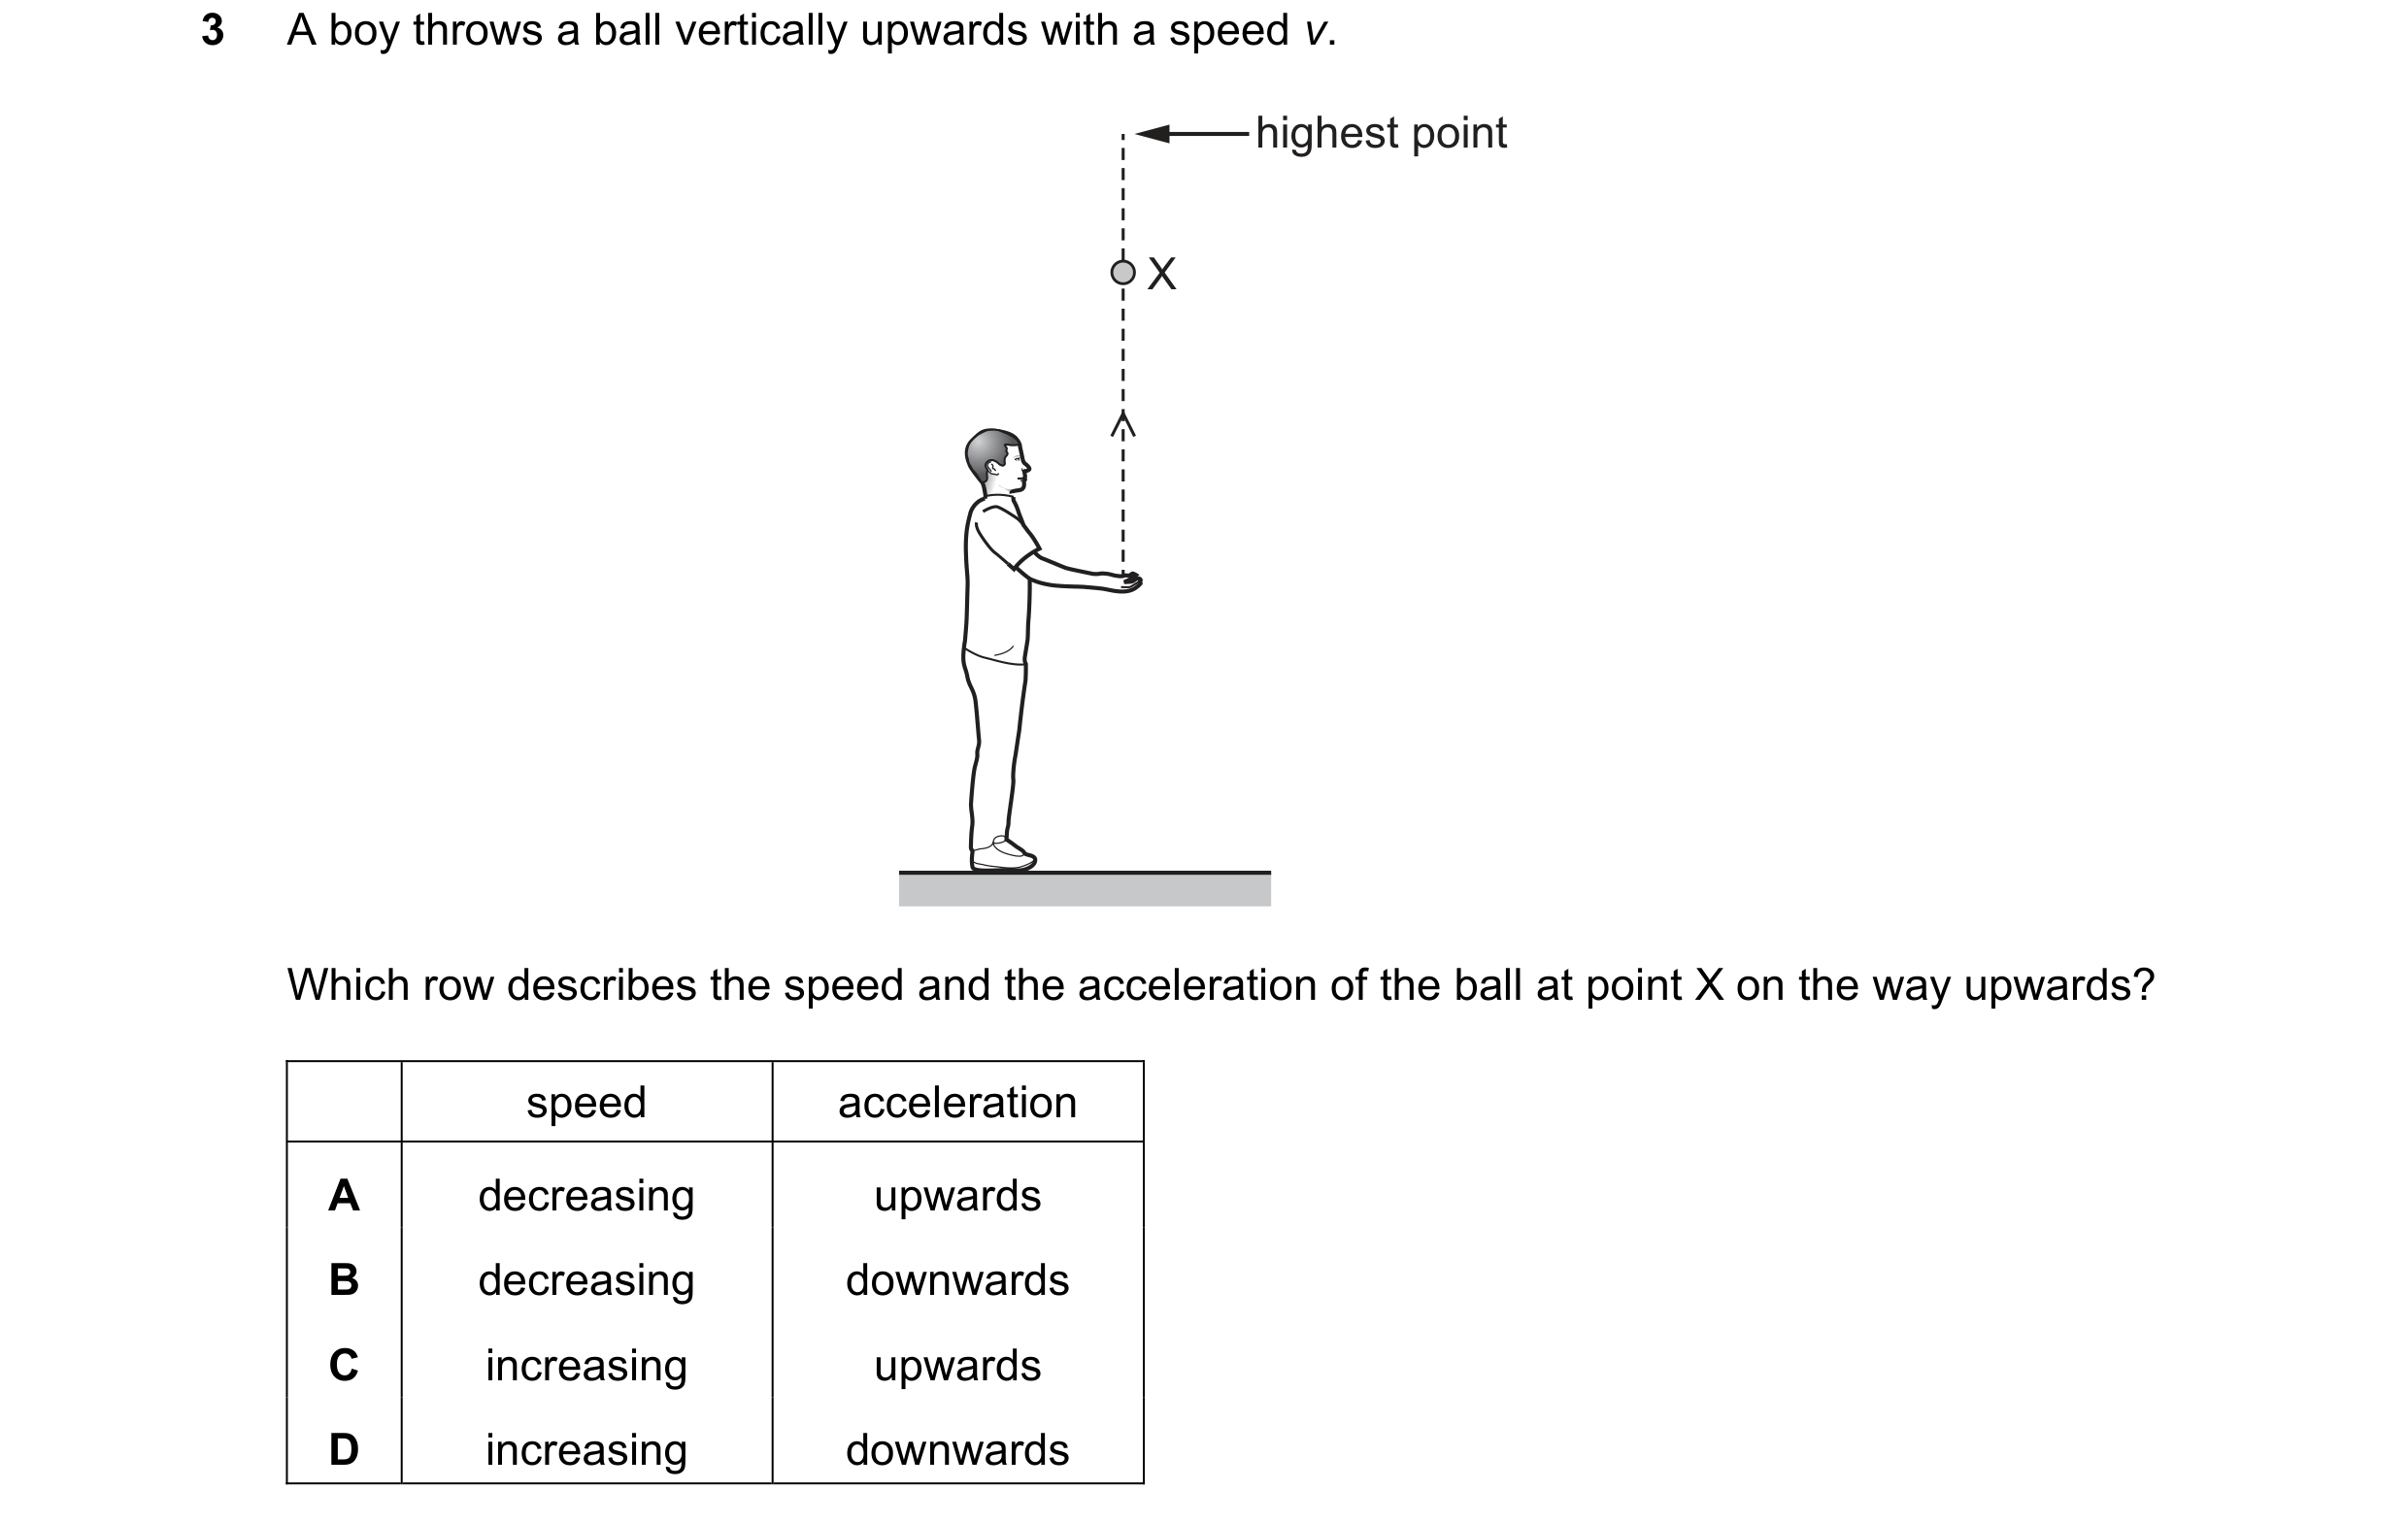
 5 / 13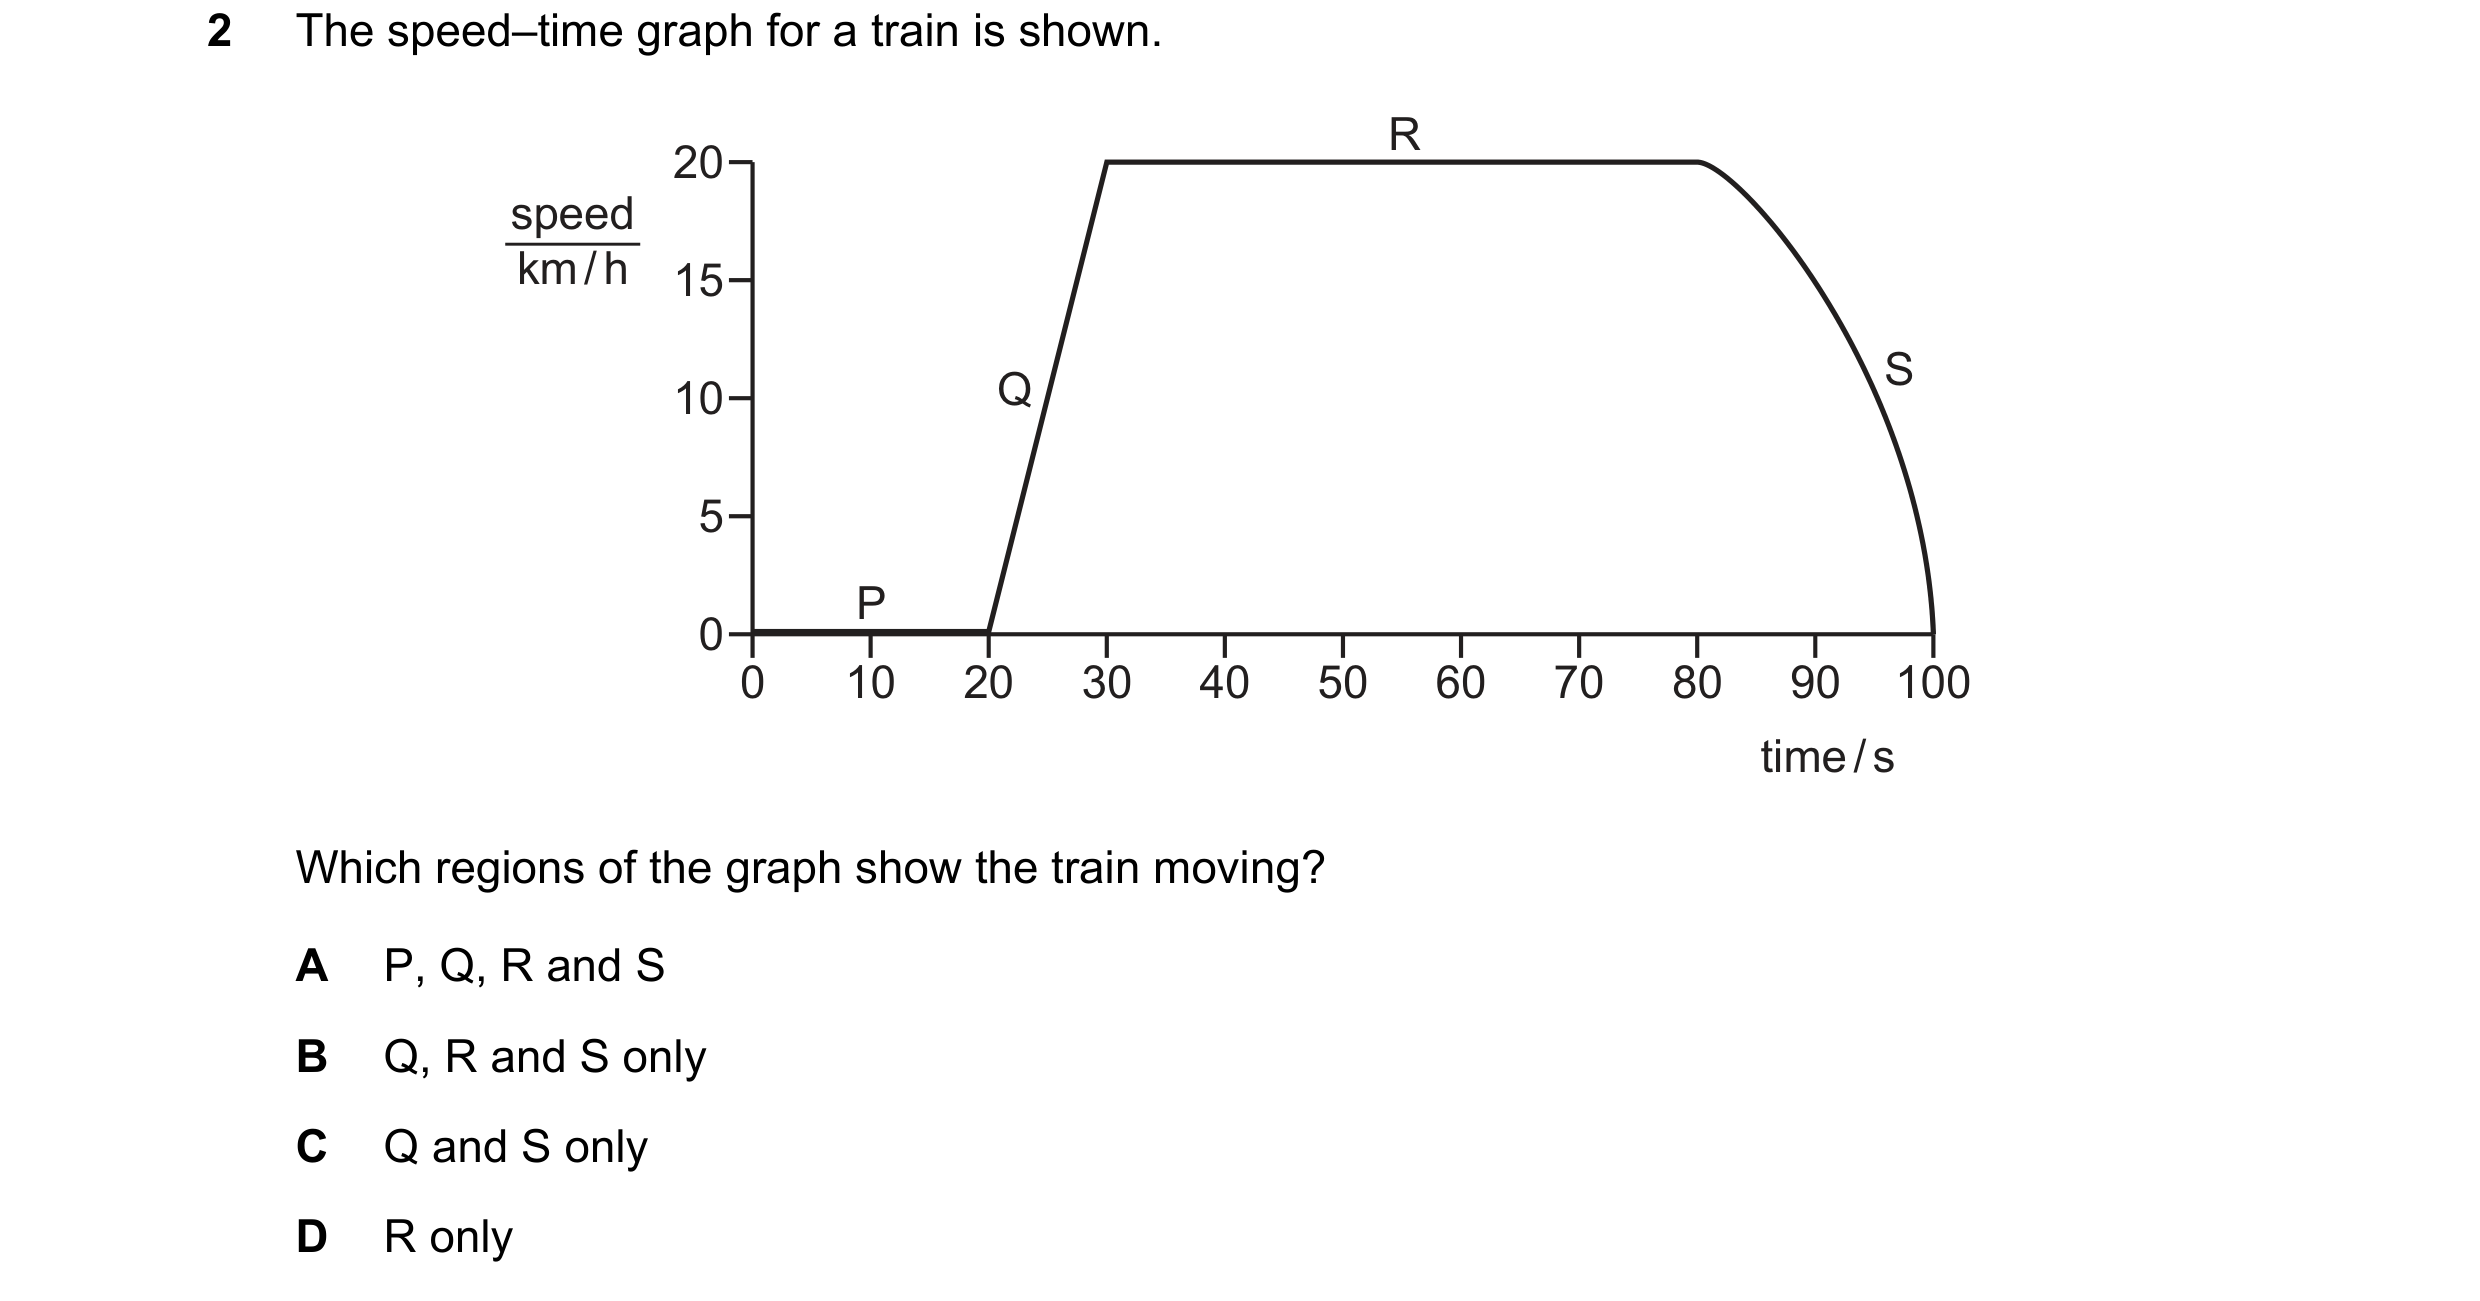

 6 / 13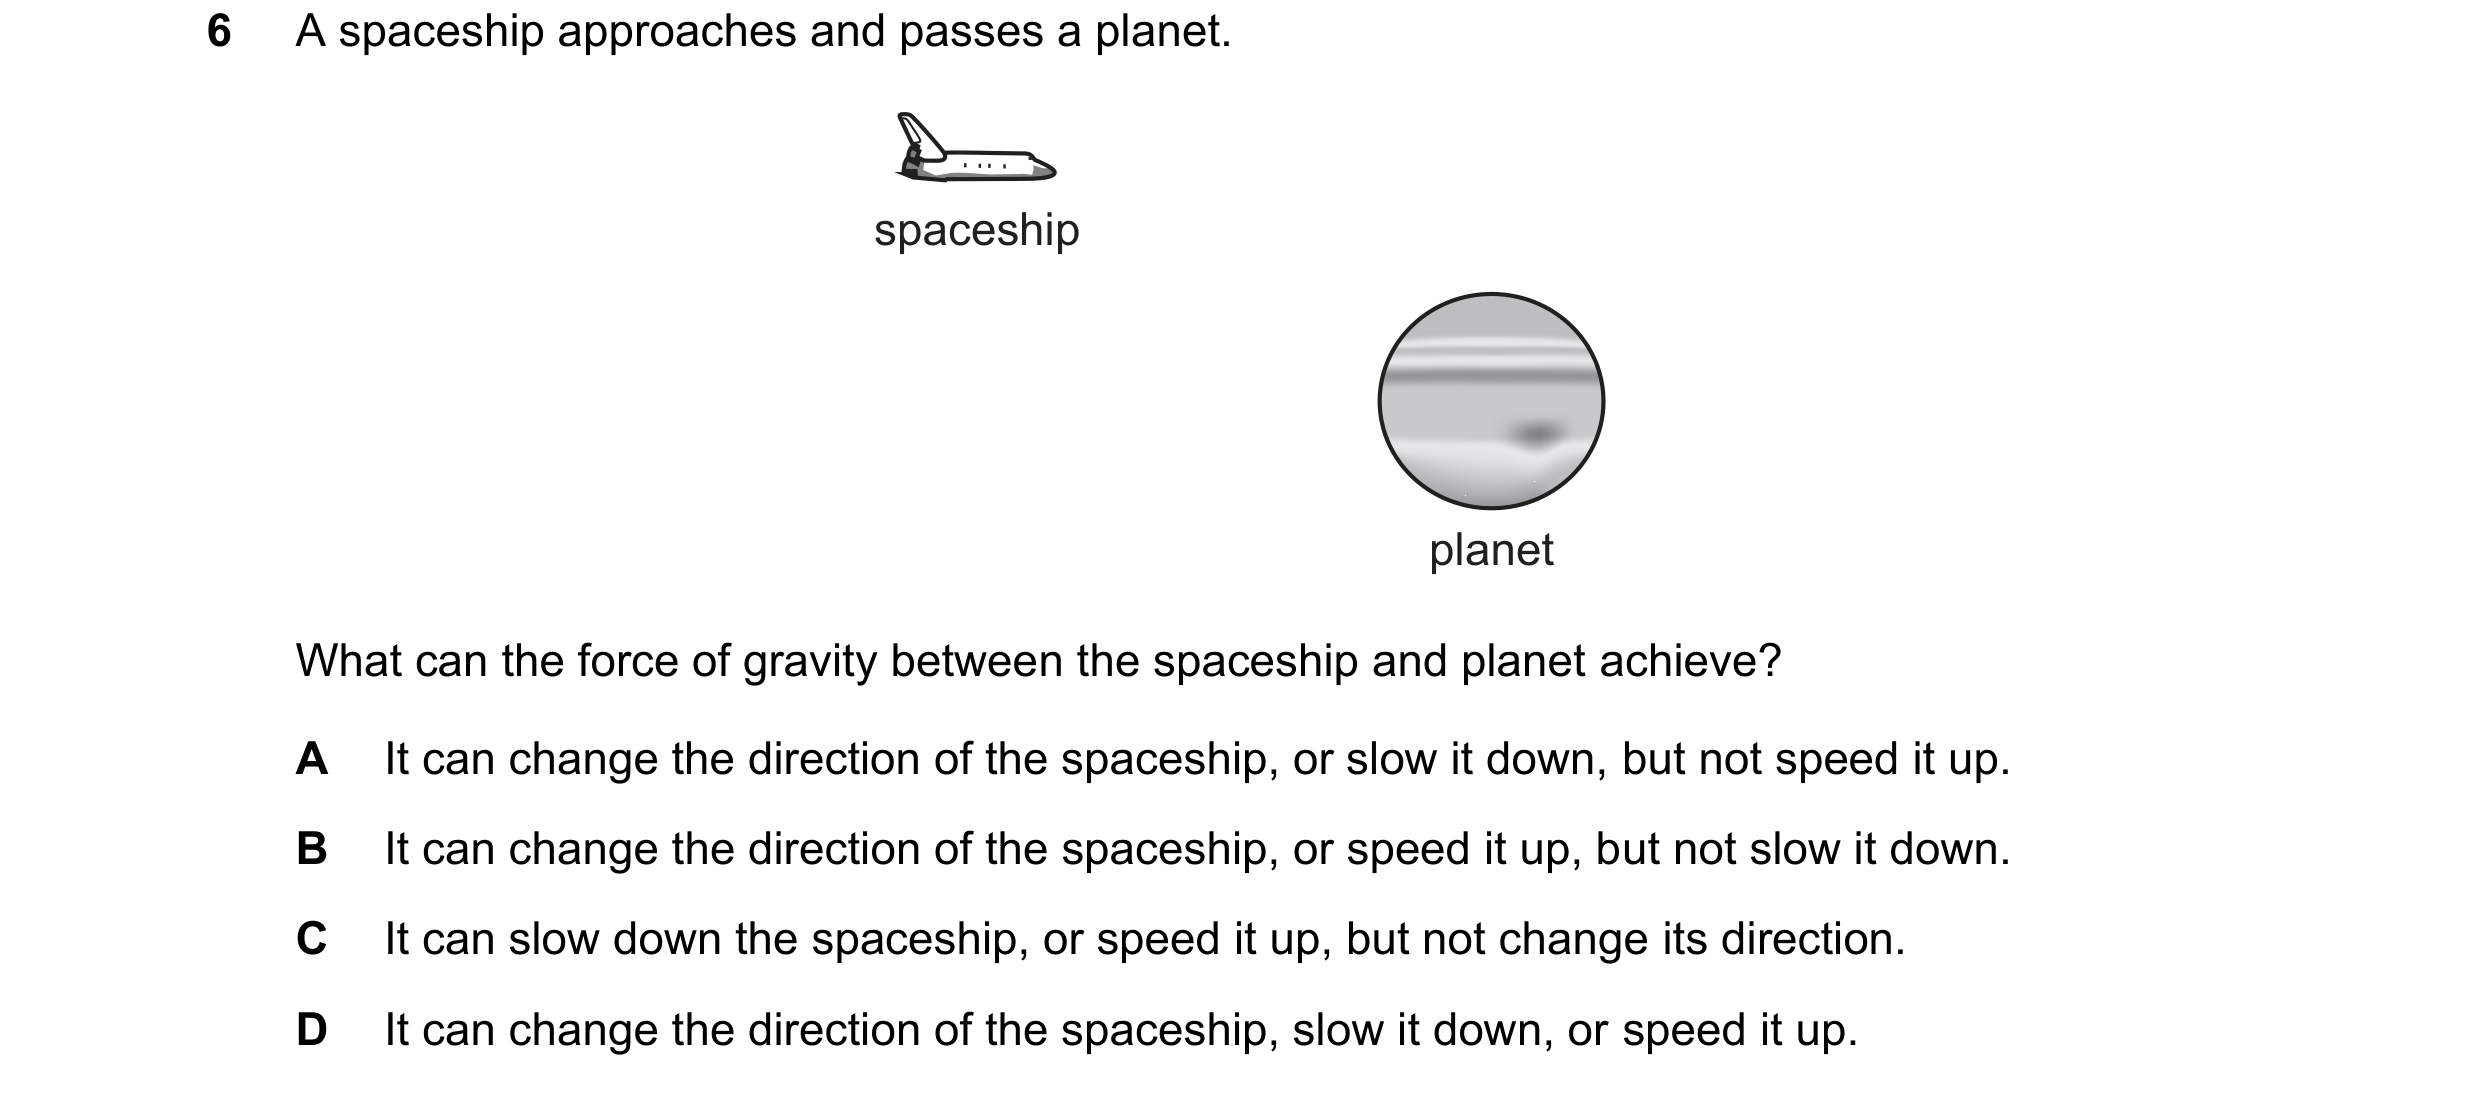
 7 / 13

 8 / 13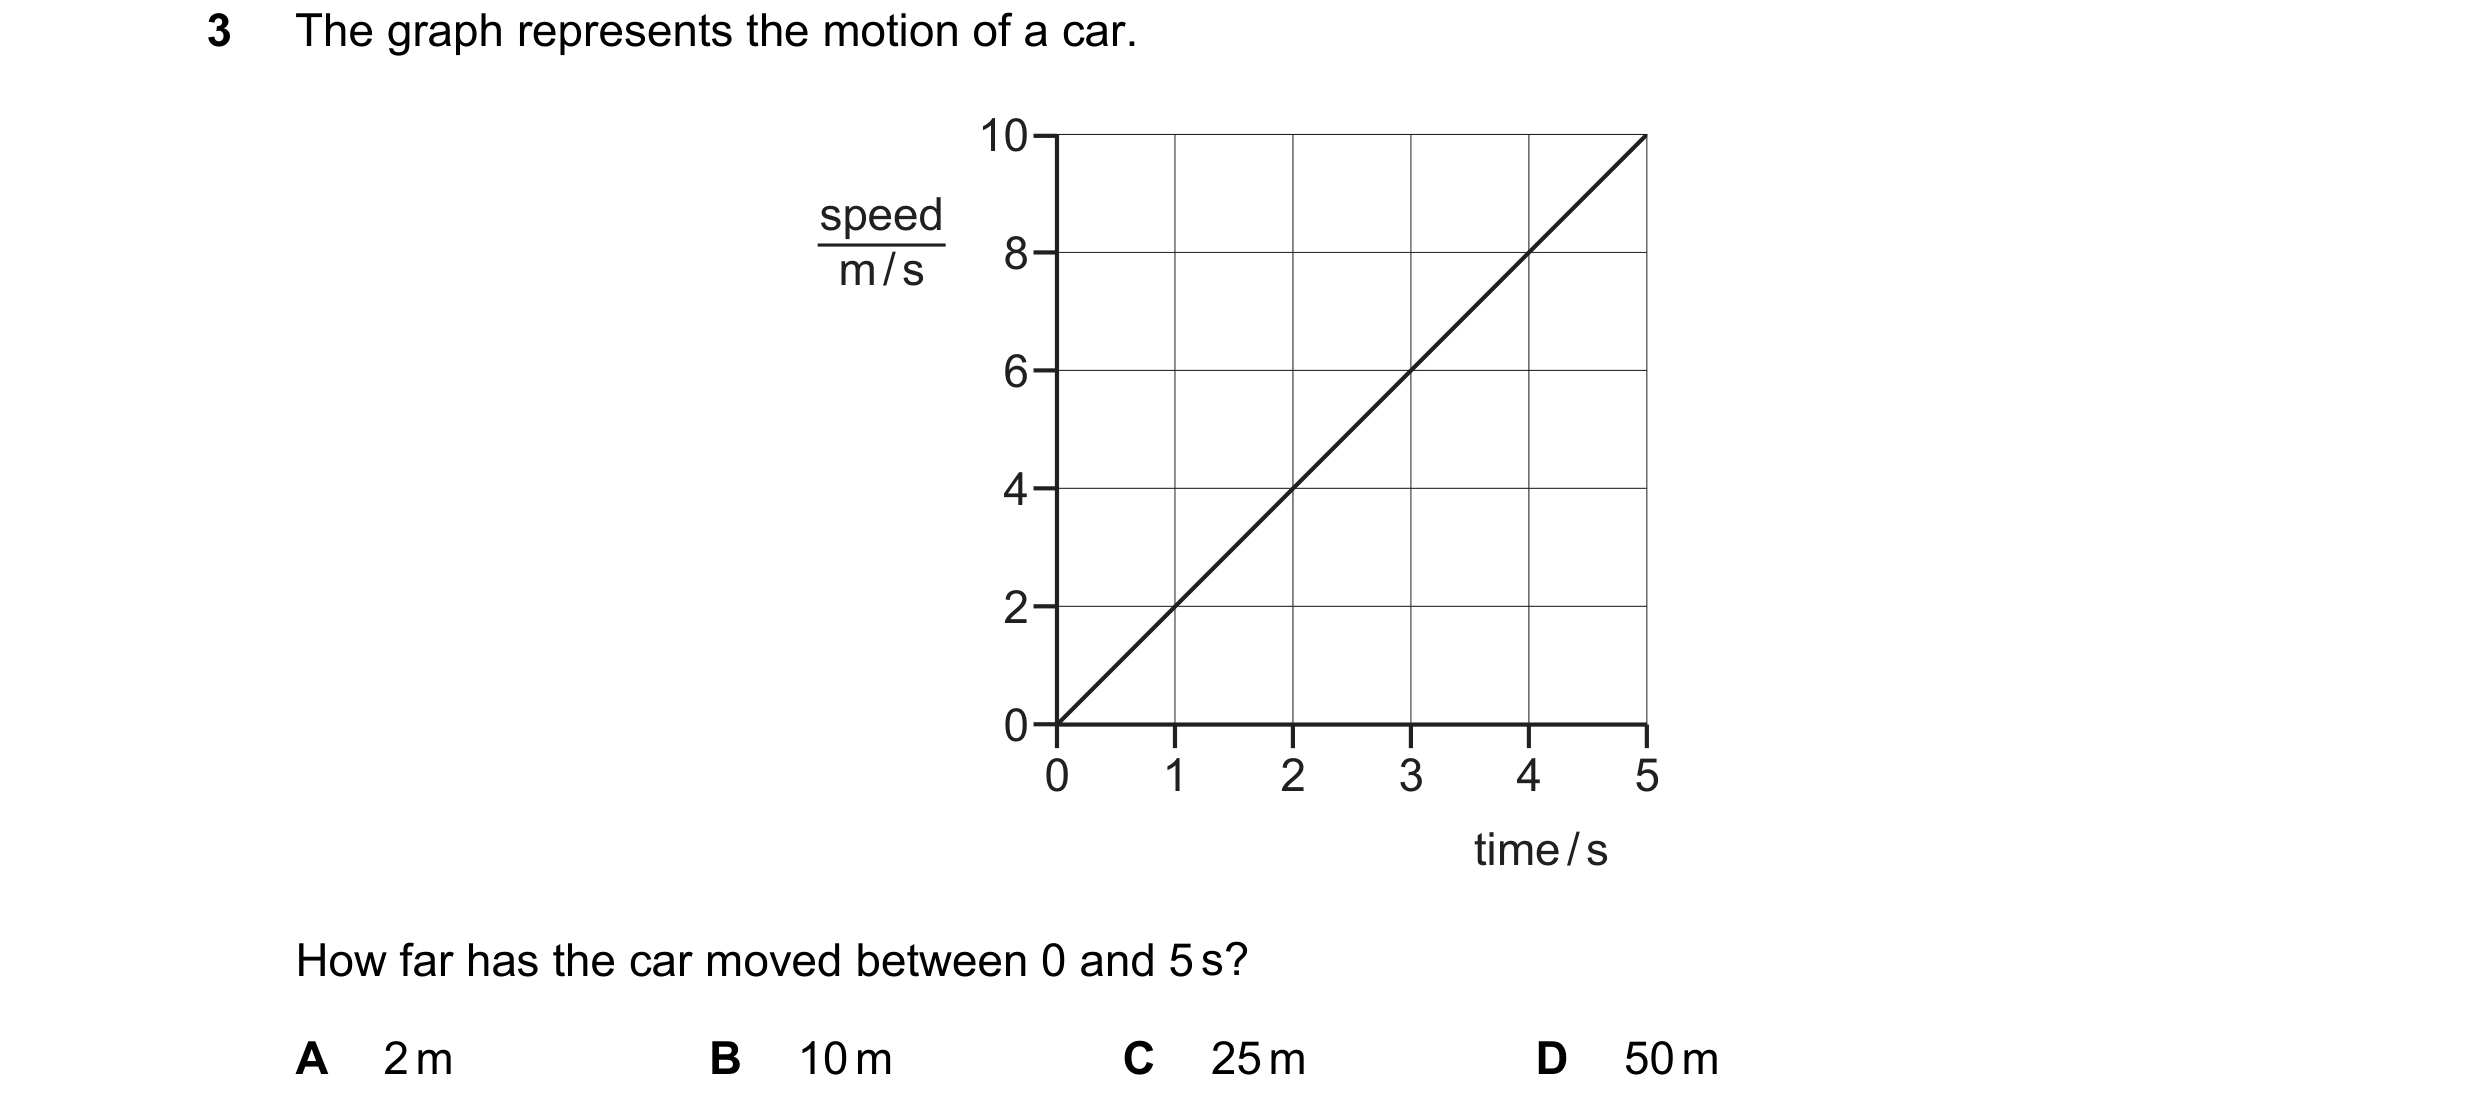
 9 / 13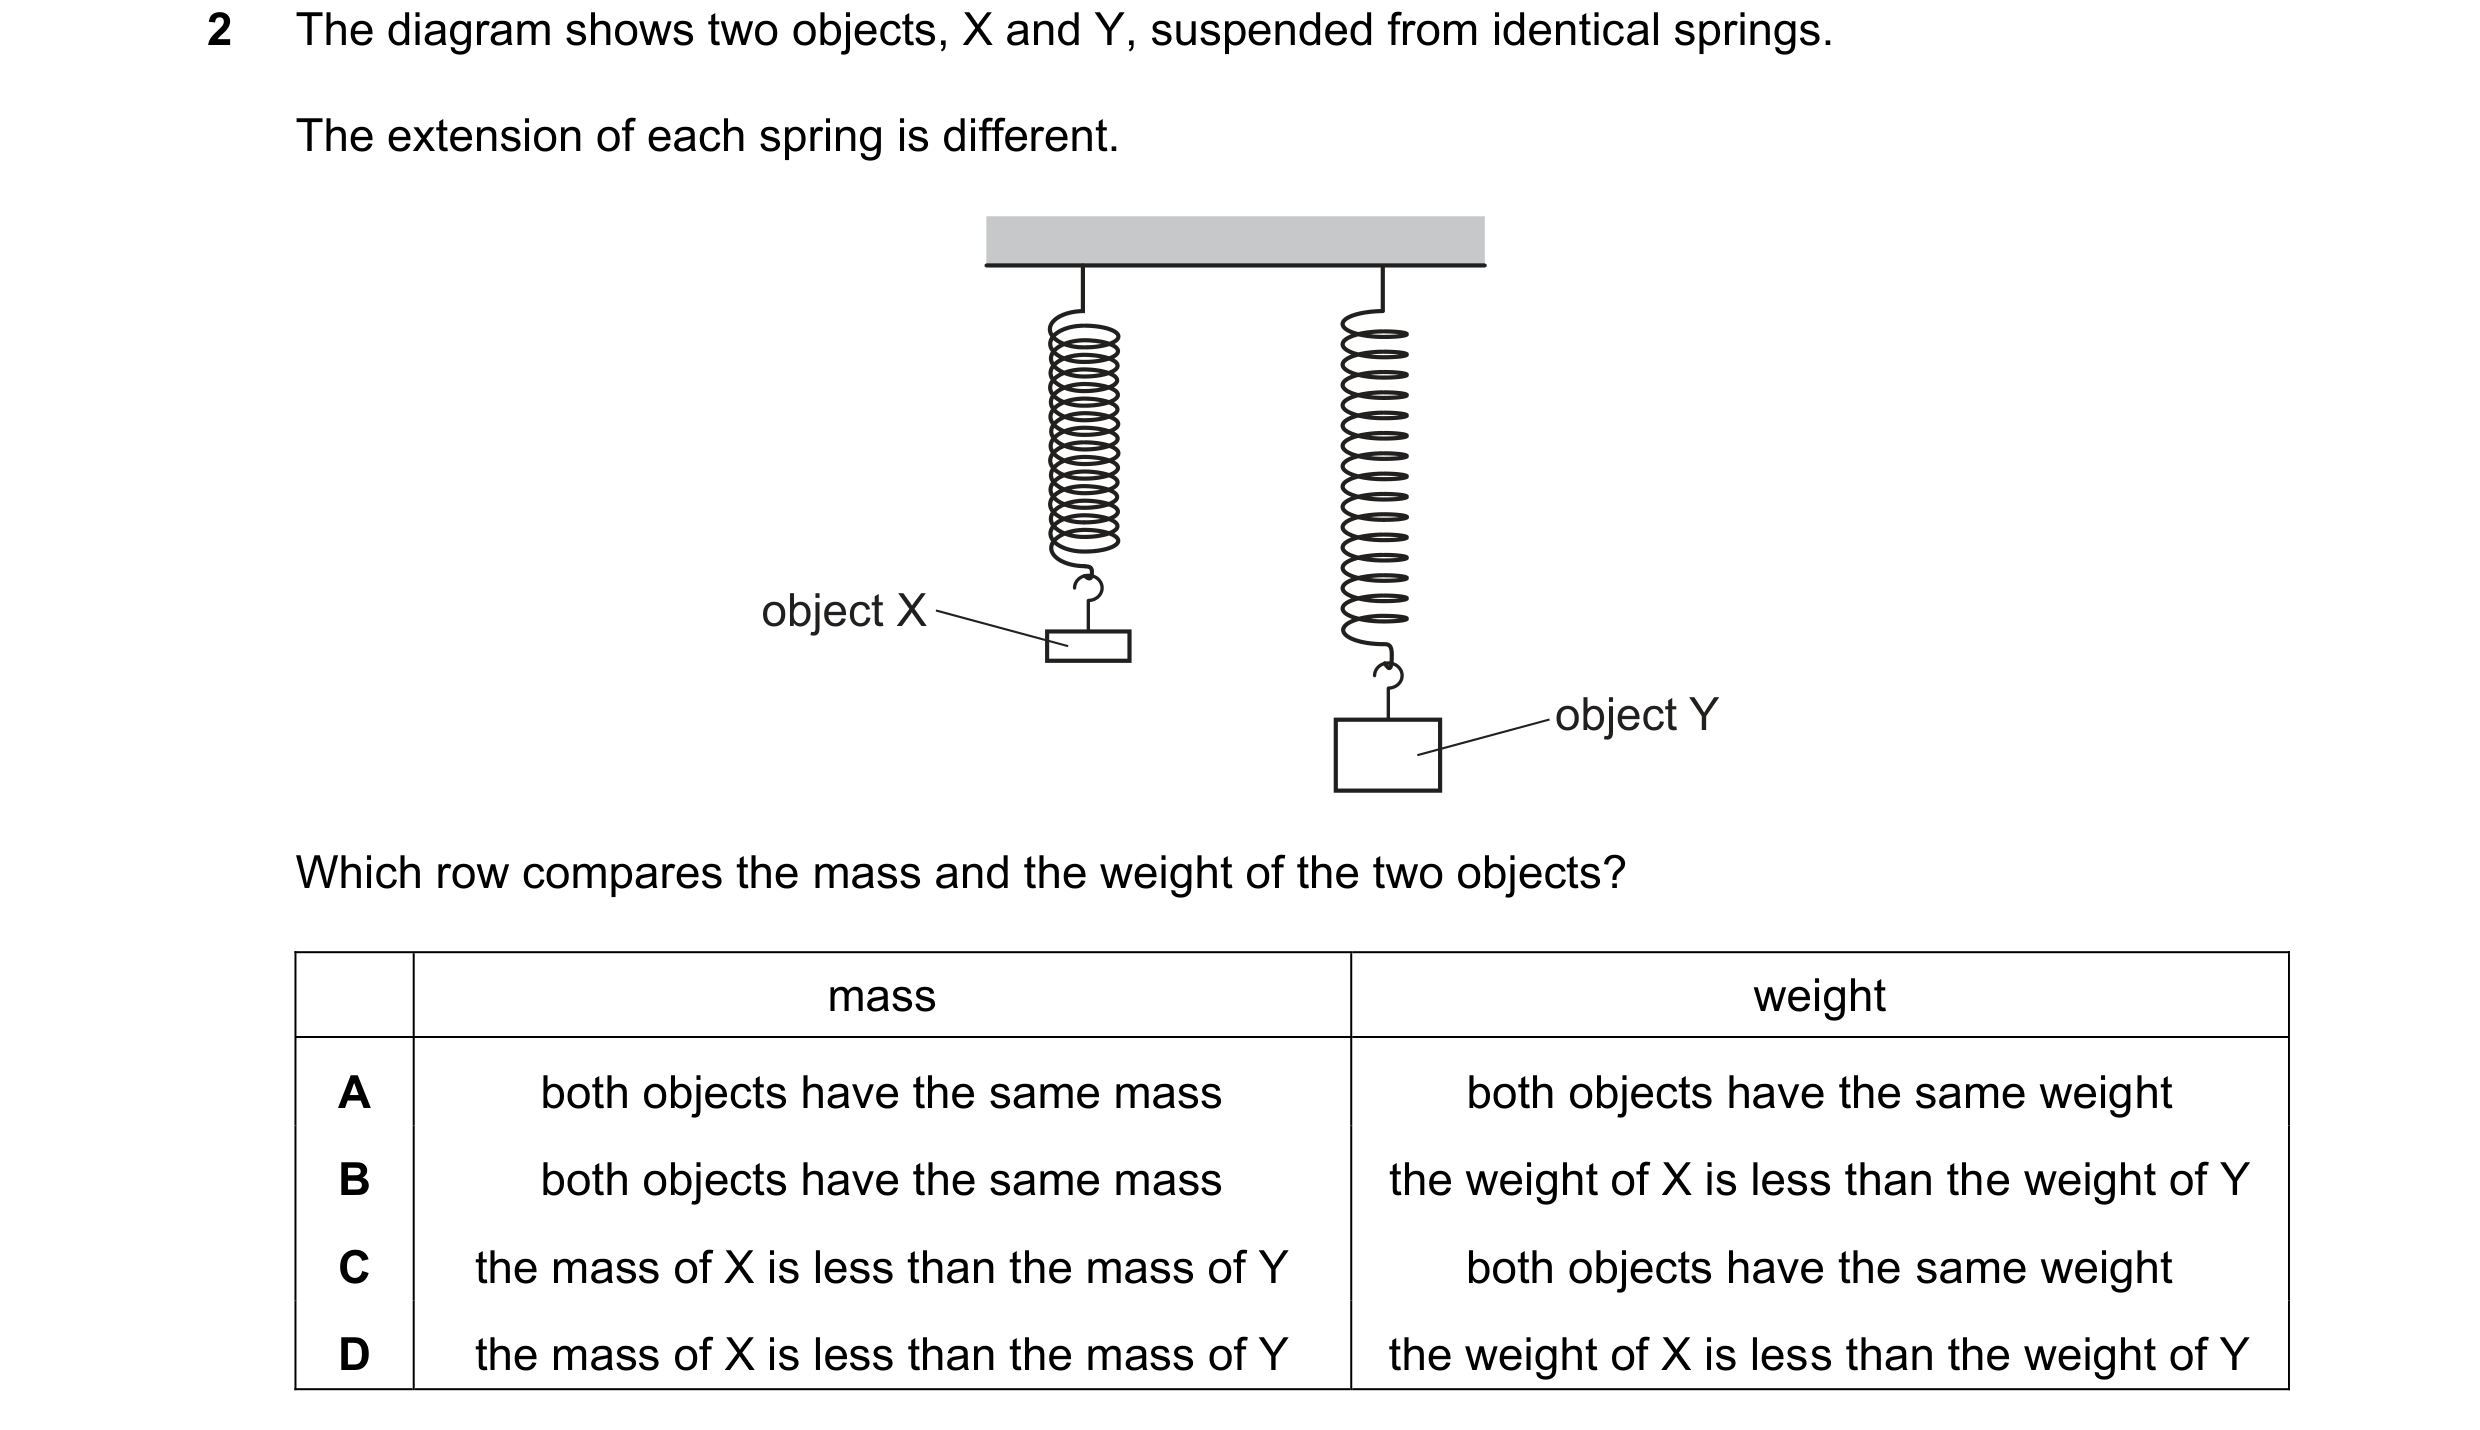
 10 / 13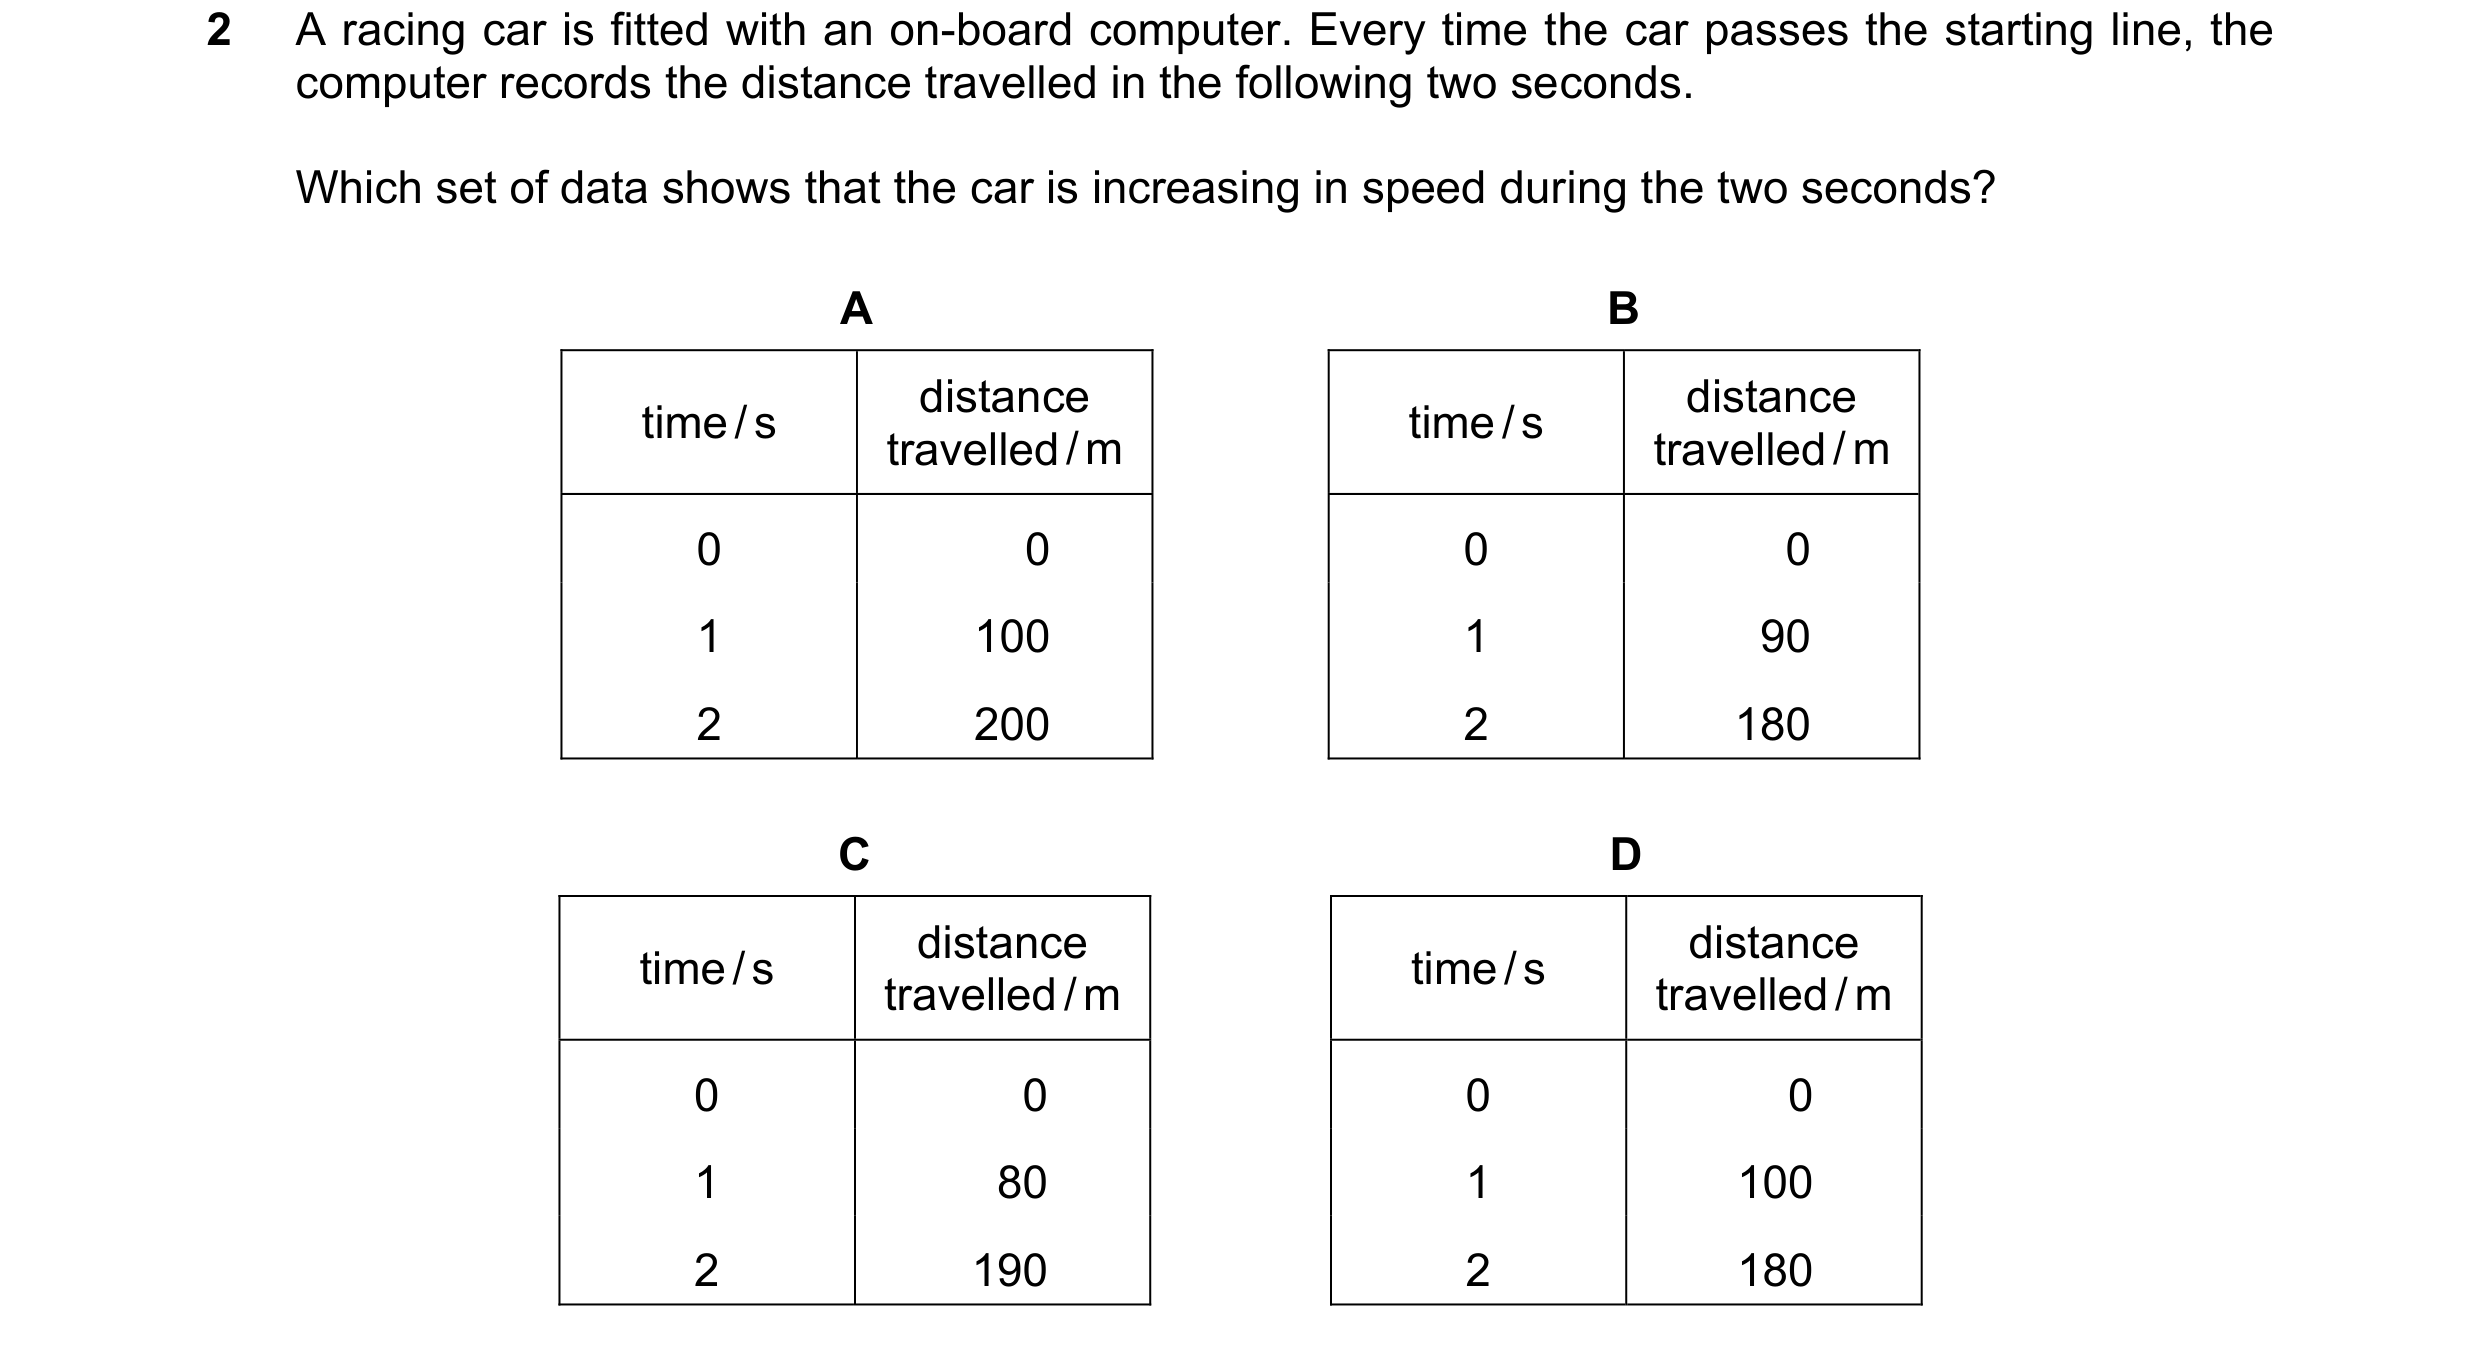
 11 / 13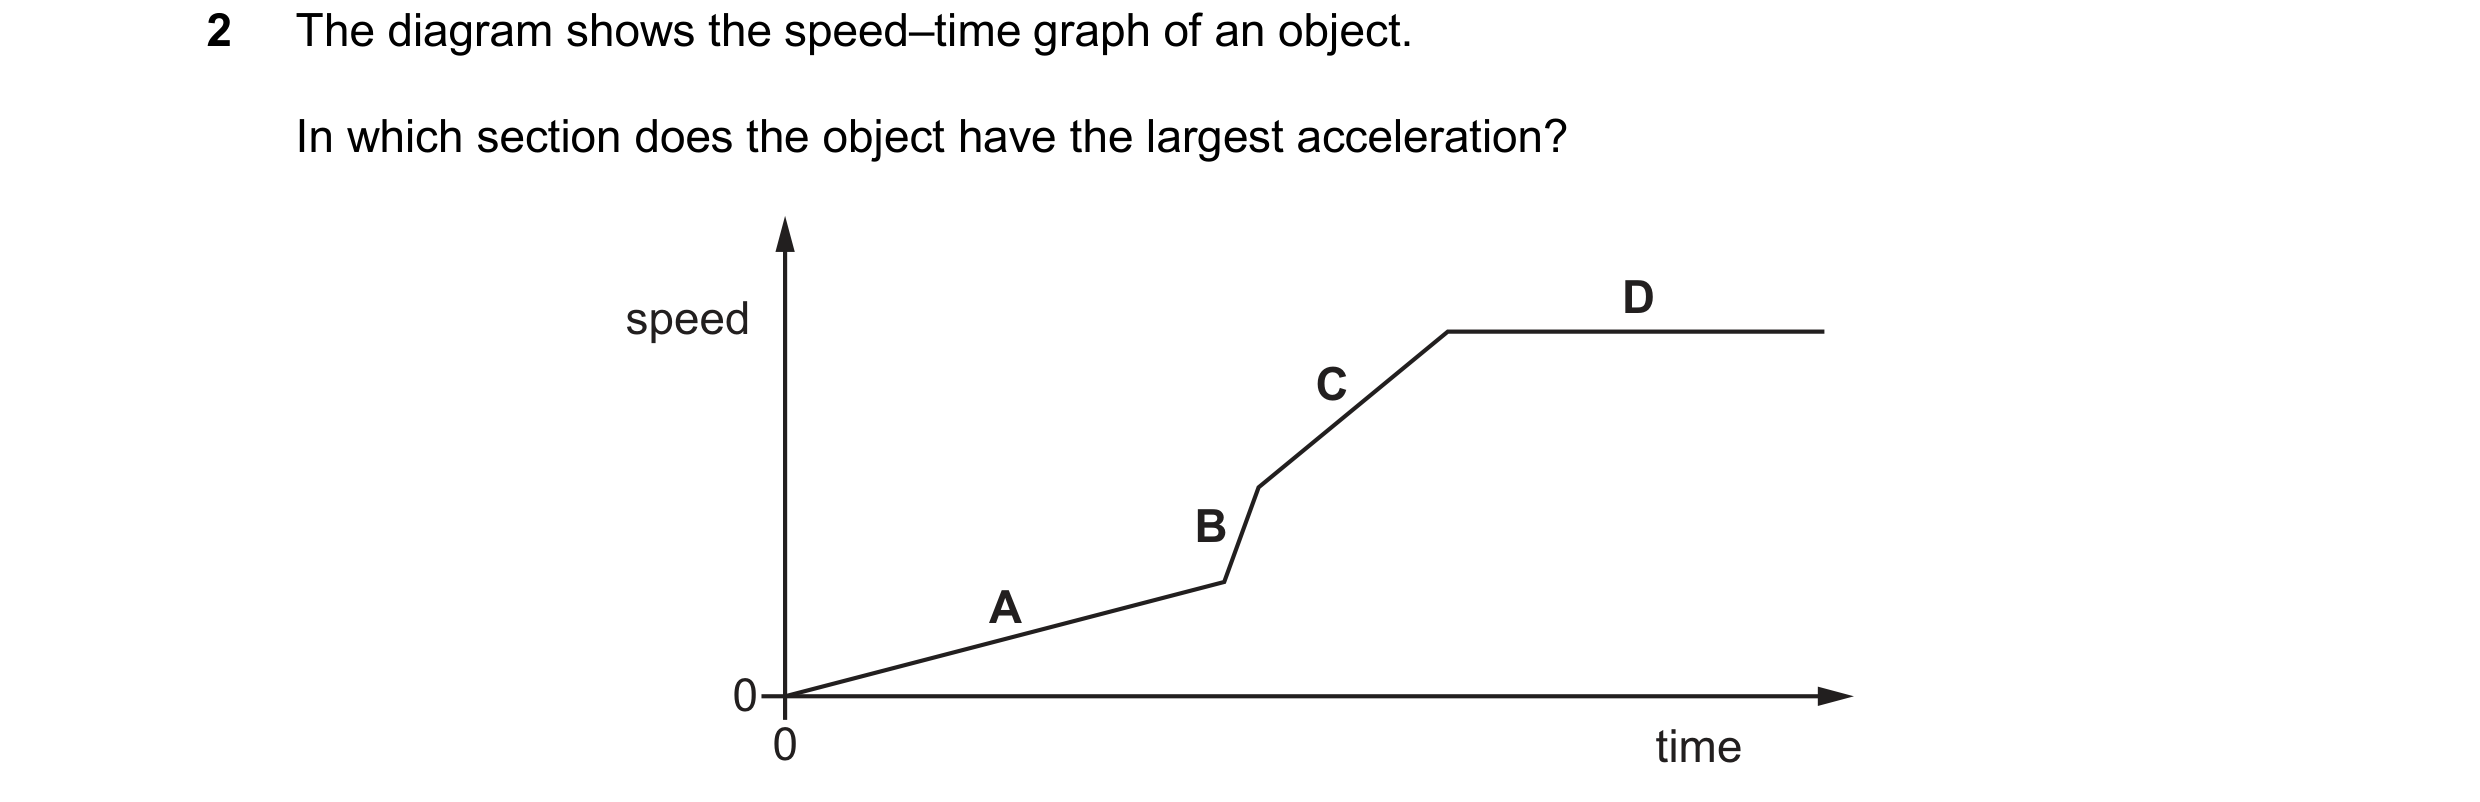

 12 / 13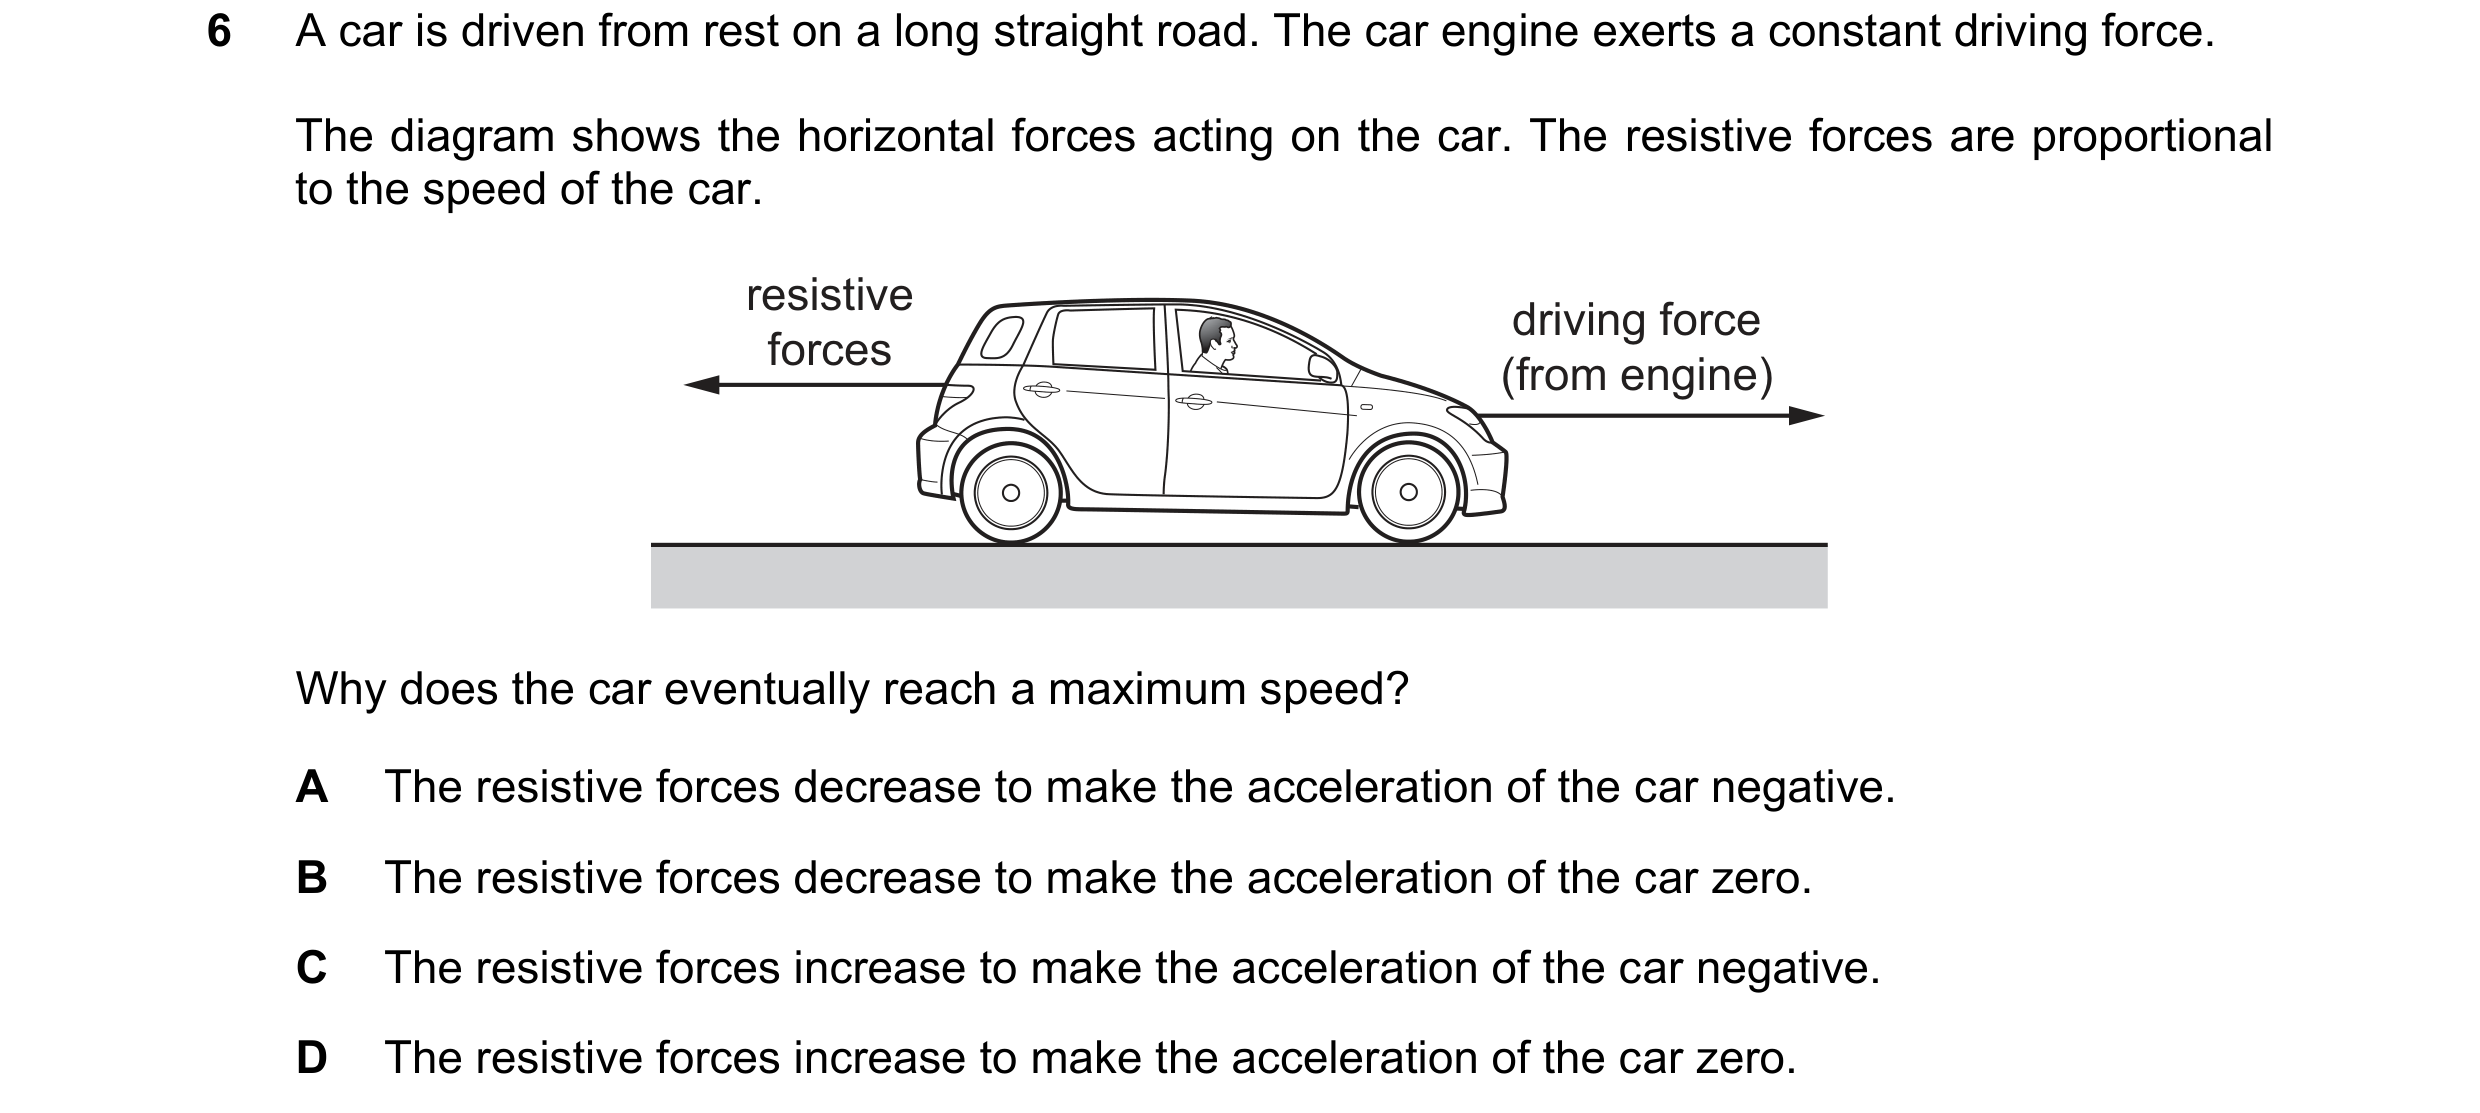
 13 / 13