Cambridge IGCSE Physics 0625 — 2016 May/June Paper 4 · Variant 3
0625/43/M/J/16 · 10 questions · 80 marks · ≈90 min
The question paper and its mark scheme, free to read here and free to download. This is Cambridge’s own paper, exactly as it was sat.
Question paper24 pages
Mark scheme9 pages
Answers below. Sit the paper first if you are practising.
Questions as text
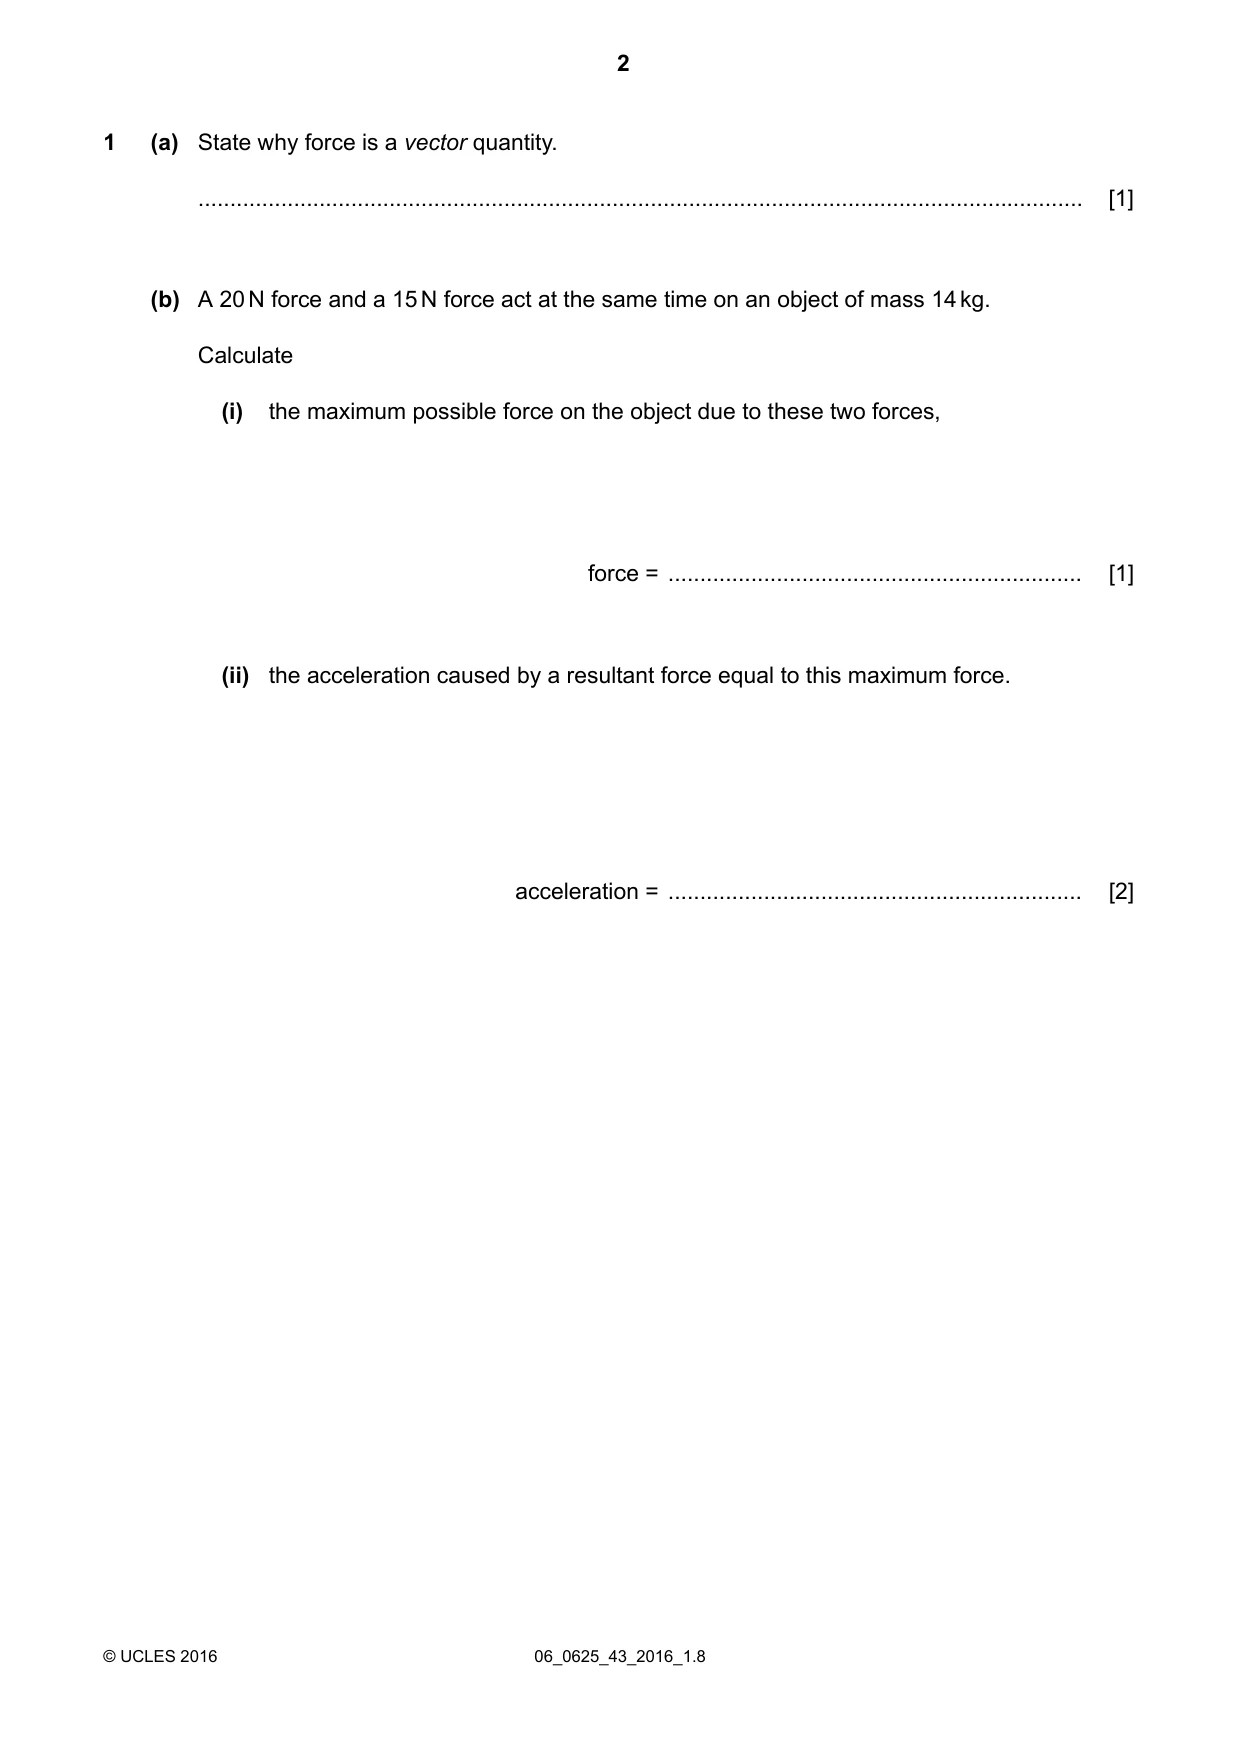
Q1 · State why force is a vector quantity
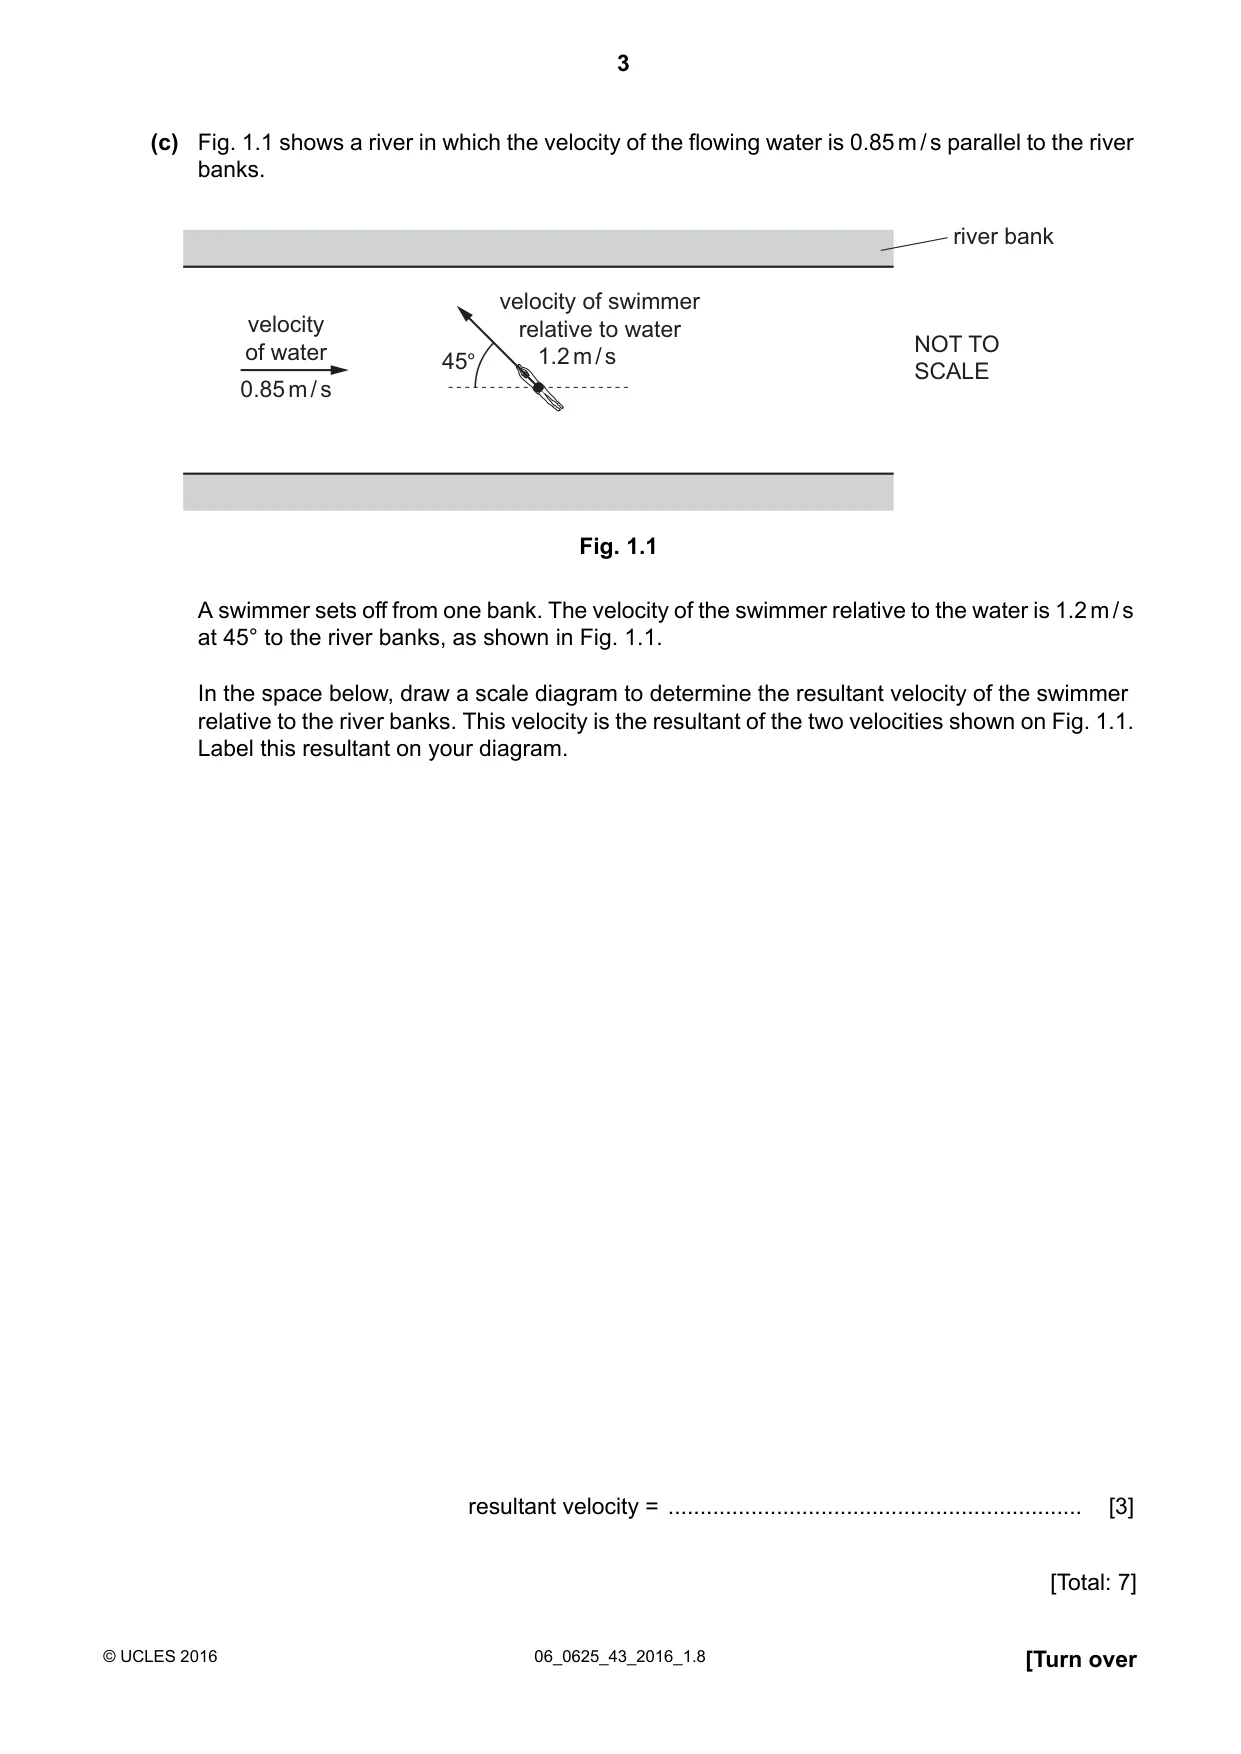
1 (a) State why force is a vector quantity. ........................................................................................................................................... [1] (b) A 20N force and a 15N force act at the same time on an object of mass 14kg. Calculate (i) the maximum possible force on the object due to these two forces, force = ................................................................. [1] (ii) the acceleration caused by a resultant force equal to this maximum force. acceleration = ................................................................. [2] (c) Fig. 1.1 shows a river in which the velocity of the flowing water is 0.85m/s parallel to the river banks. river bank velocity of swimmer velocity relative to water NOT TO of water 45° 1.2 m / s SCALE 0.85 m / s Fig. 1.1 A swimmer sets off from one bank. The velocity of the swimmer relative to the water is 1.2m/s at 45° to the river banks, as shown in Fig. 1.1. In the space below, draw a scale diagram to determine the resultant velocity of the swimmer relative to the river banks. This velocity is the resultant of the two velocities shown on Fig. 1.1. Label this resultant on your diagram. resultant velocity = ................................................................. [3] [Total: 7]
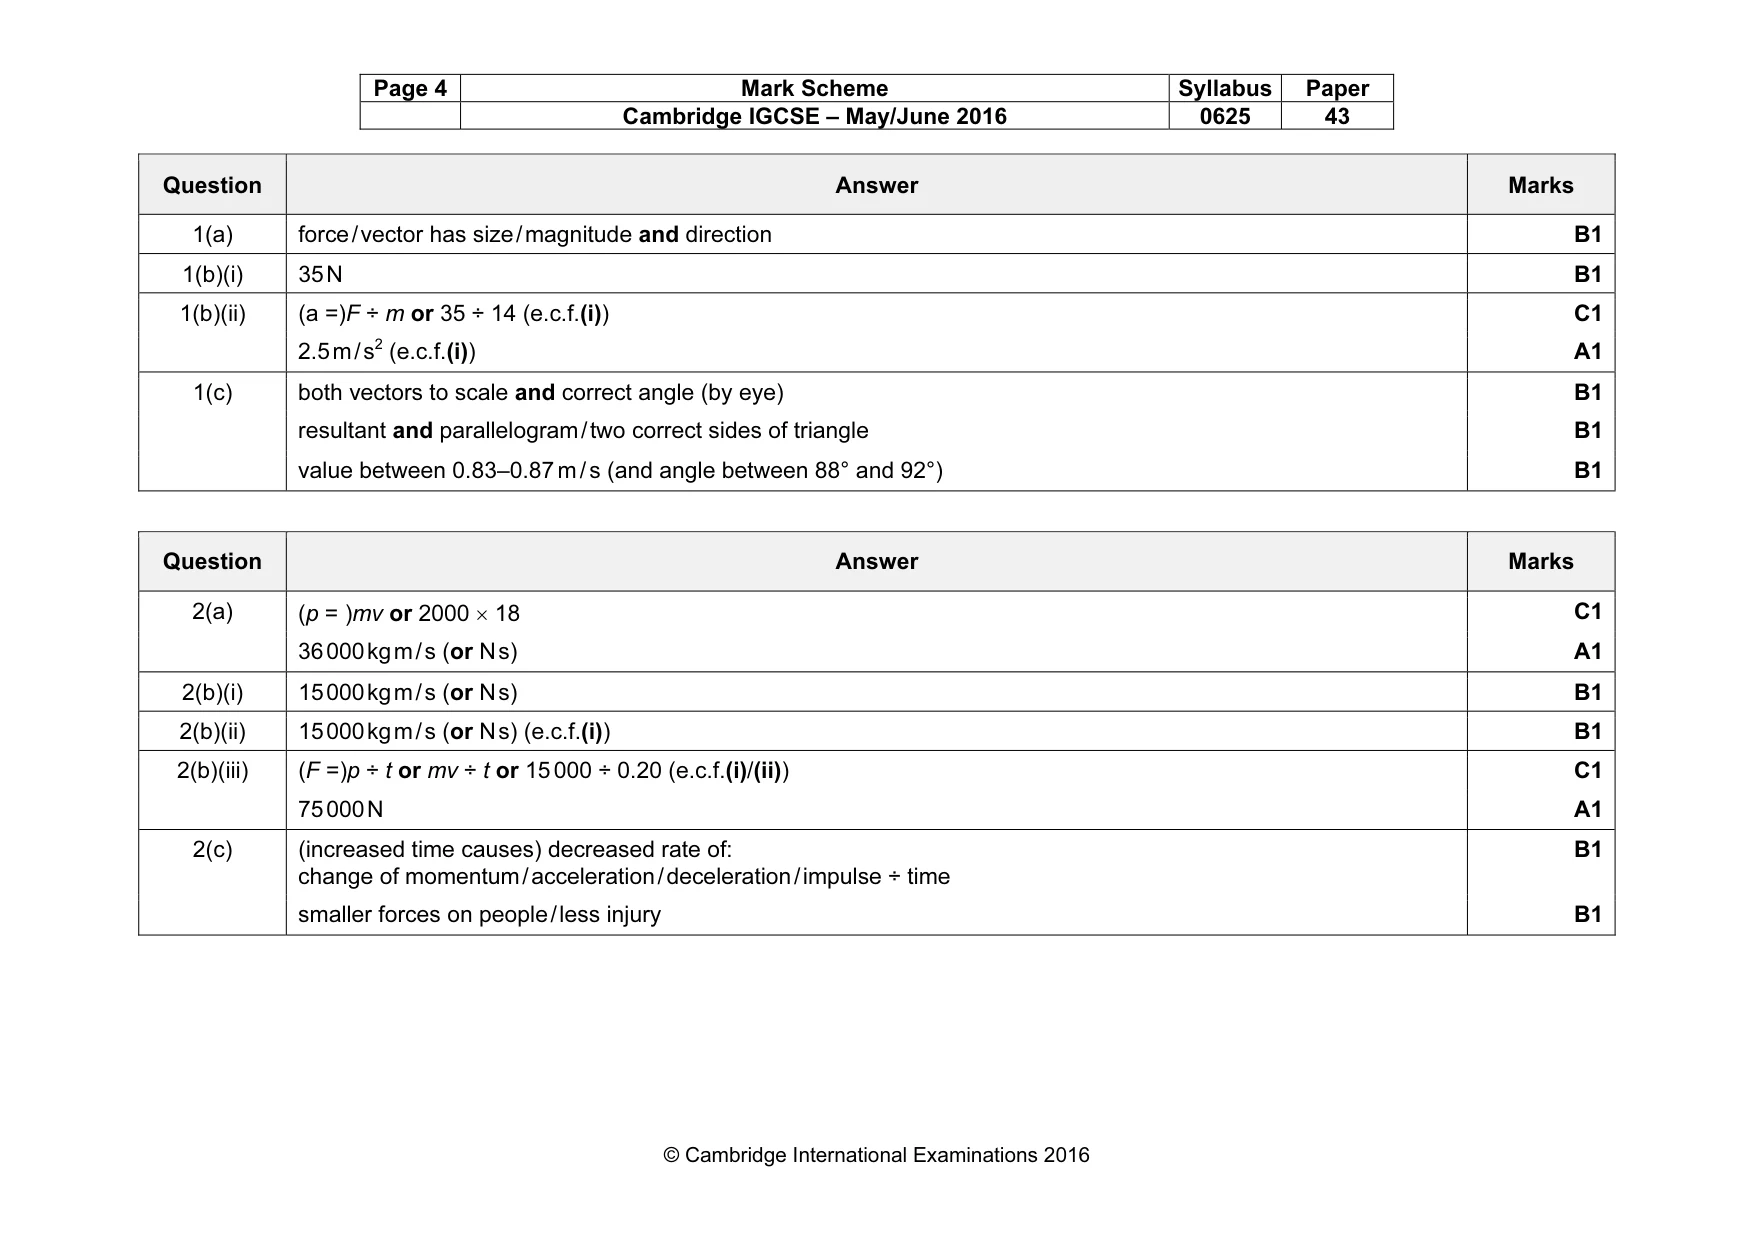
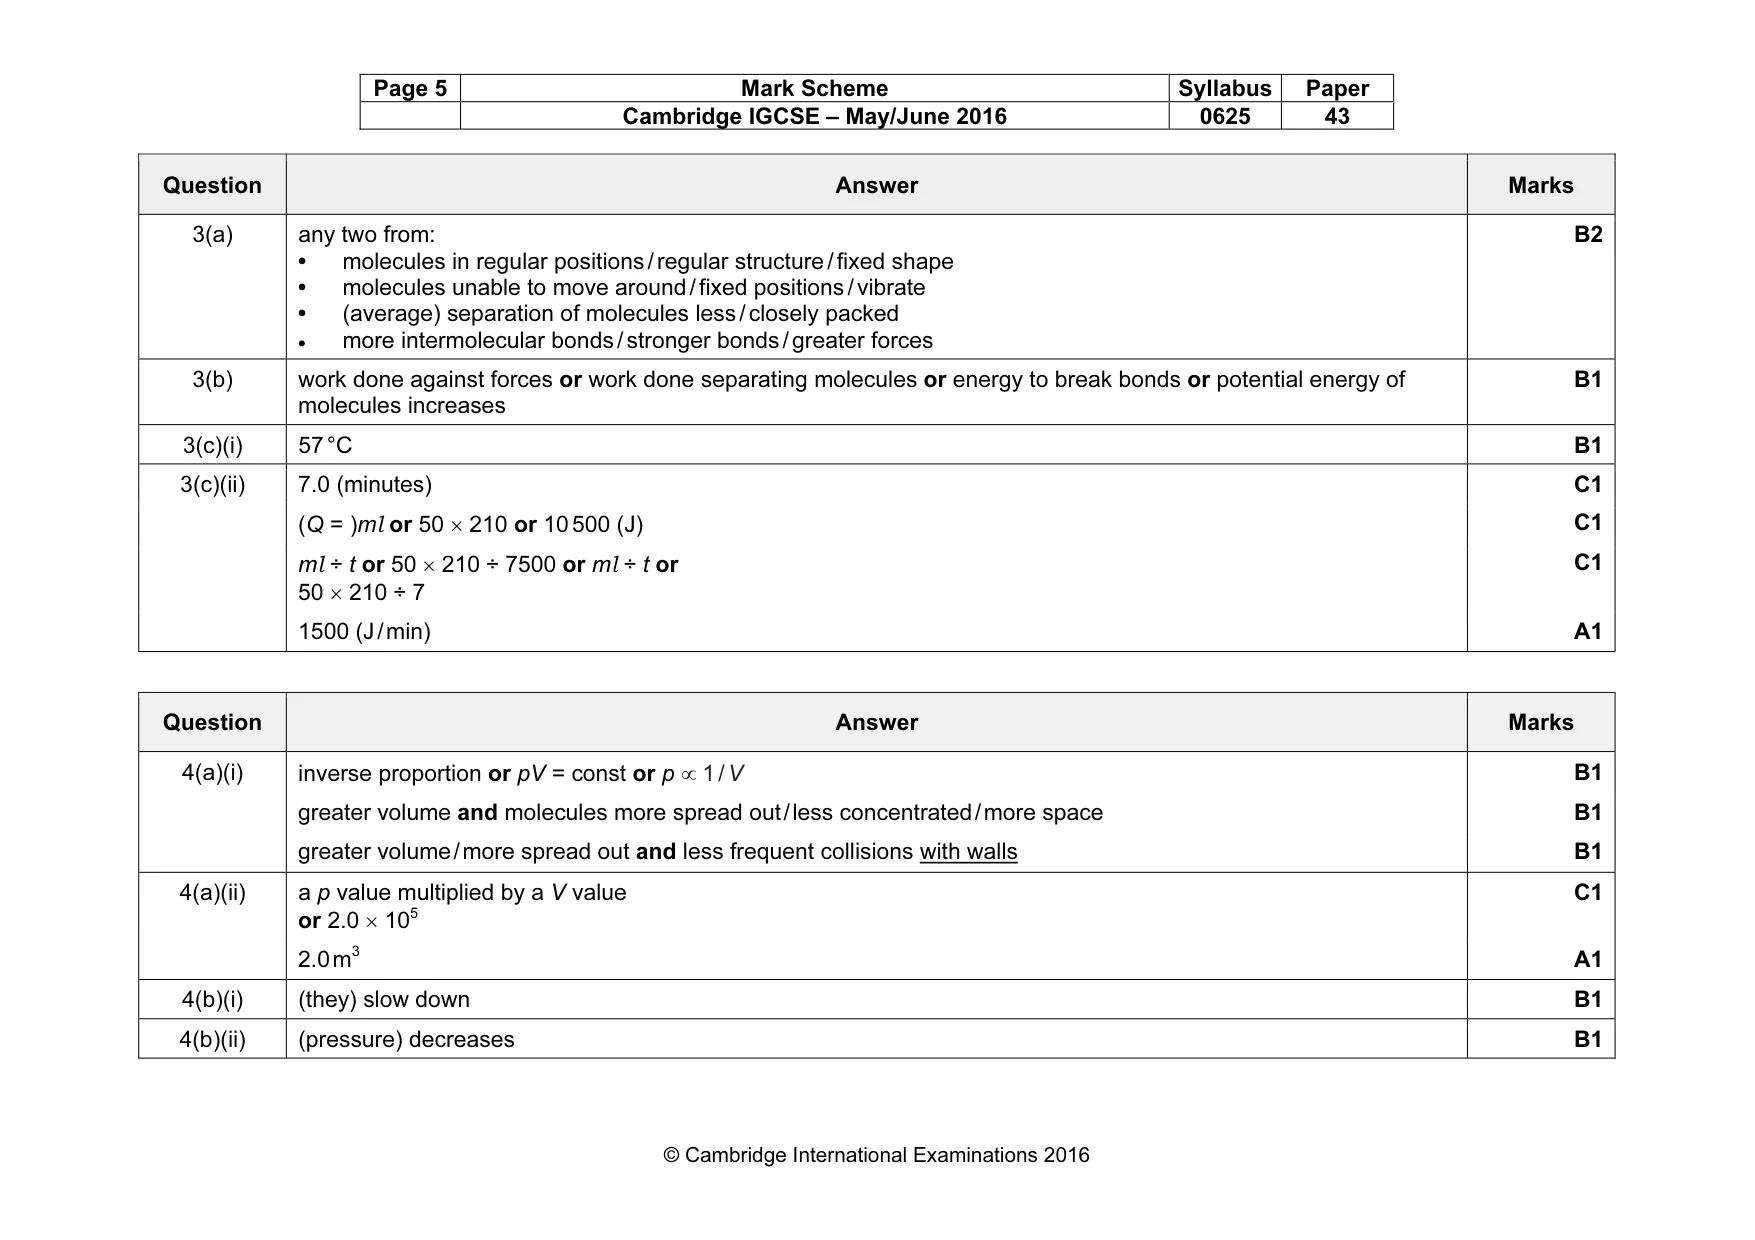
Mark scheme: 1(a) force / vector has size / magnitude and direction B1 1(b)(i) 35 N B1 1(b)(ii) (a =)F ÷ m or 35 ÷ 14 (e.c.f.(i)) C1 2.5 m / s2 (e.c.f.(i)) A1 1(c) both vectors to scale and correct angle (by eye) B1 resultant and parallelogram / two correct sides of triangle B1 value between 0.83–0.87 m / s (and angle between 88° and 92°) B1
Q2 · Two cars, A and B, before they collide
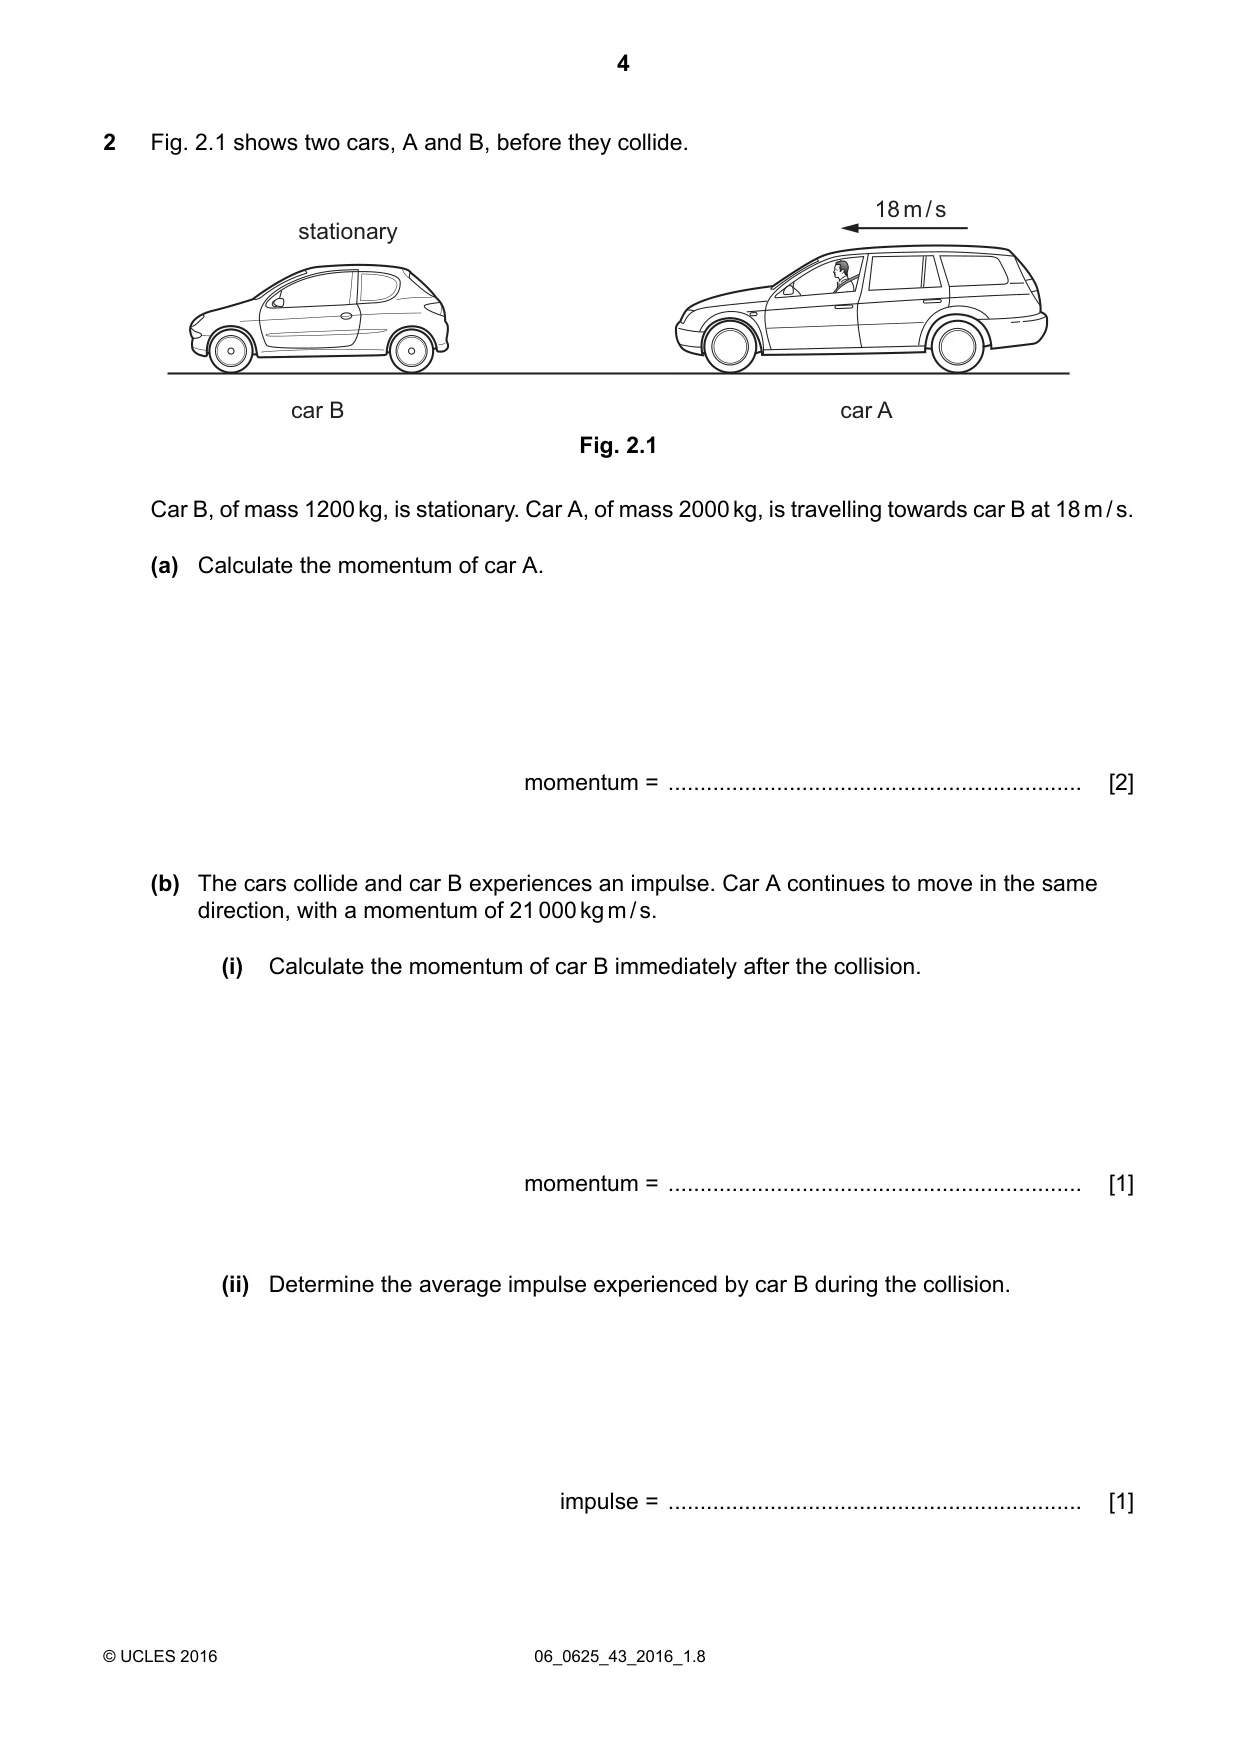
2 Fig. 2.1 shows two cars, A and B, before they collide. 18 m / s stationary car B car A Fig. 2.1 Car B, of mass 1200kg, is stationary. Car A, of mass 2000kg, is travelling towards car B at 18m/s. (a) Calculate the momentum of car A. momentum = ................................................................. [2] (b) The cars collide and car B experiences an impulse. Car A continues to move in the same direction, with a momentum of 21000kgm/s. (i) Calculate the momentum of car B immediately after the collision. momentum = ................................................................. [1] (ii) Determine the average impulse experienced by car B during the collision. impulse = ................................................................. [1] (iii) The cars are in contact for 0.20s. Calculate the average resultant force experienced by car B during the collision. force = ................................................................. [2] (c) A modern car is designed so that, during a collision, the front section of the car is crushed and the time of contact increases. Explain the benefit of increasing the time of contact for the people in the car. ........................................................................................................................................... ........................................................................................................................................... ........................................................................................................................................... ........................................................................................................................................... [2] [Total: 8]
Mark scheme: 2(a) C1 36 000 kg m / s (or N s) A1 2(b)(i) 15 000 kg m / s (or N s) B1 2(b)(ii) 15 000 kg m / s (or N s) (e.c.f.(i)) B1 2(b)(iii) (F =)p ÷ t or mv ÷ t or 15 000 ÷ 0.20 (e.c.f.(i)/(ii)) C1 75 000 N A1 2(c) (increased time causes) decreased rate of: change of momentum / acceleration / deceleration / impulse ÷ time B1 smaller forces on people / less injury B1
Q3 · A test-tube containing solid wax is heated by placing it in a beaker of very hot water…
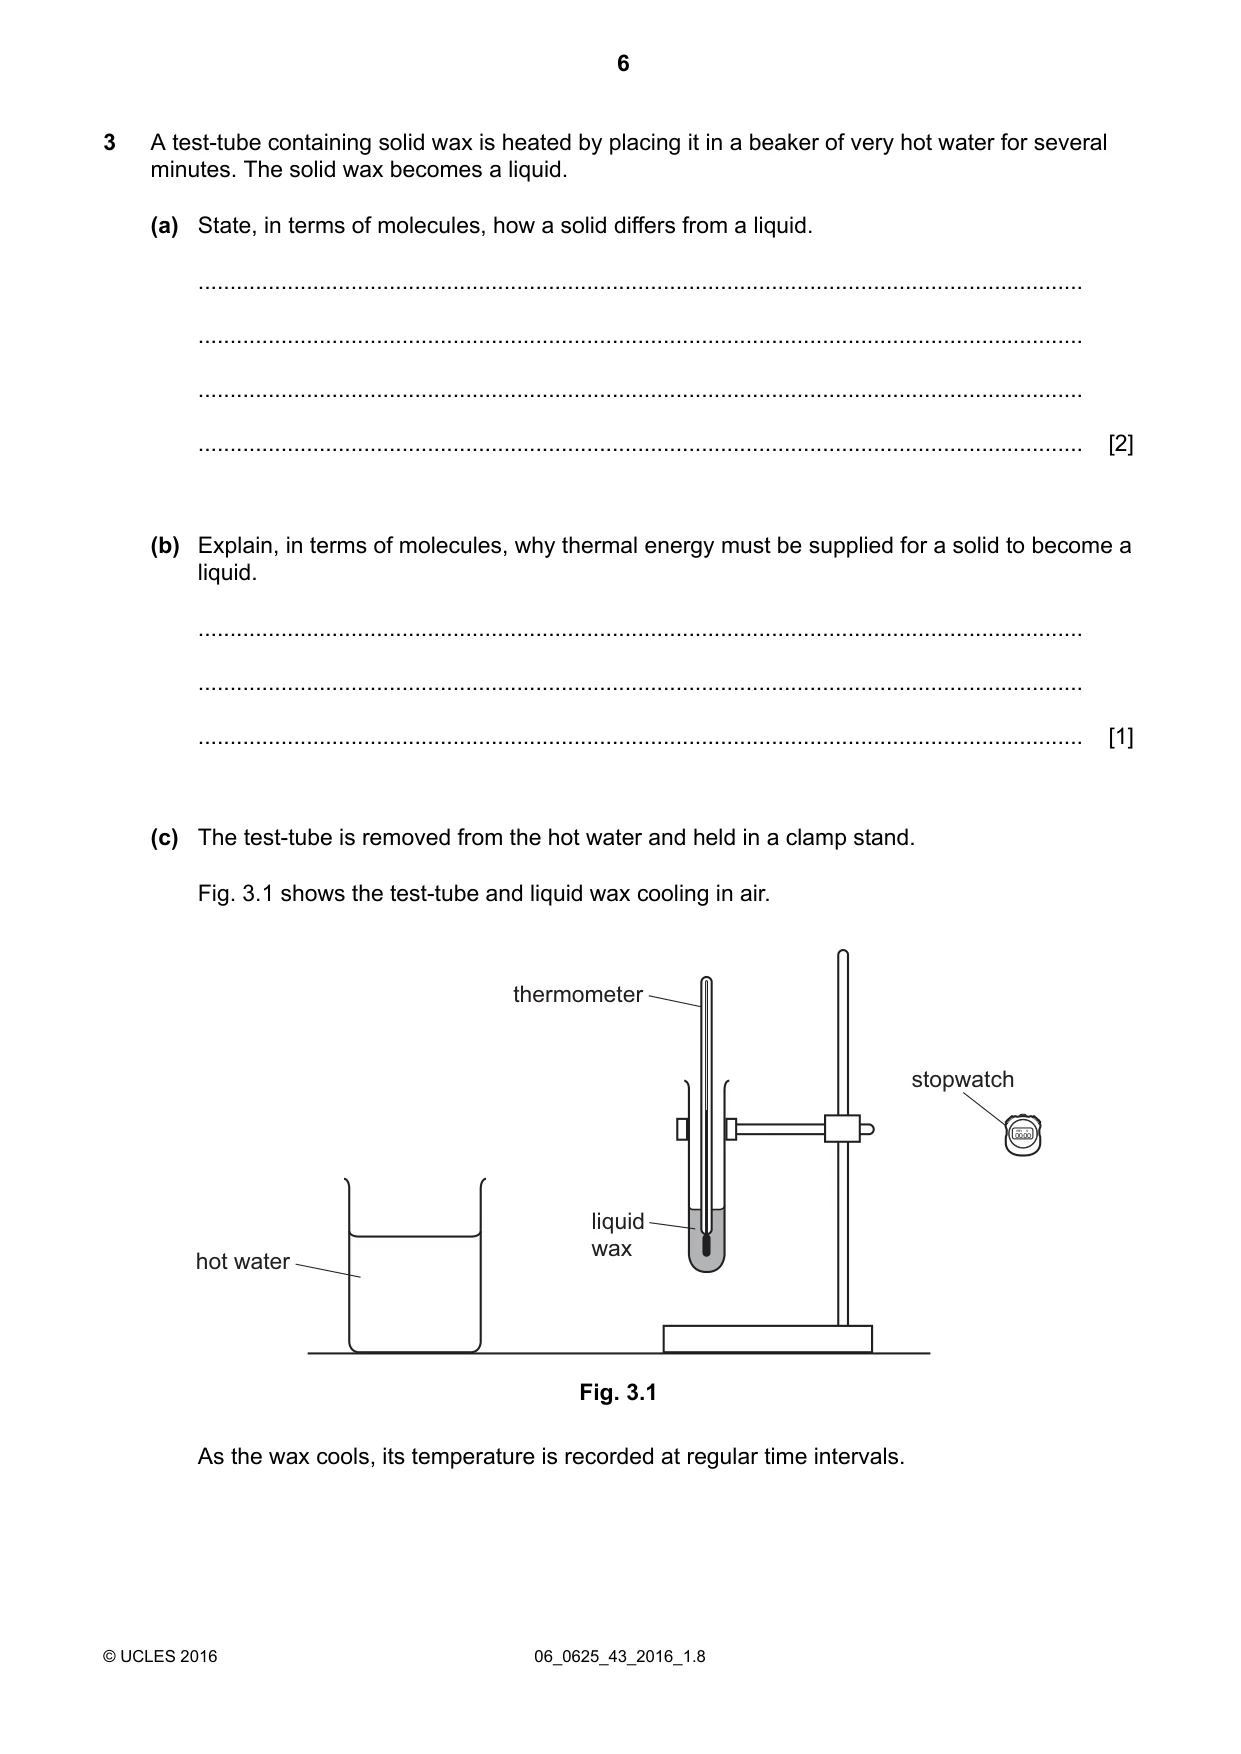
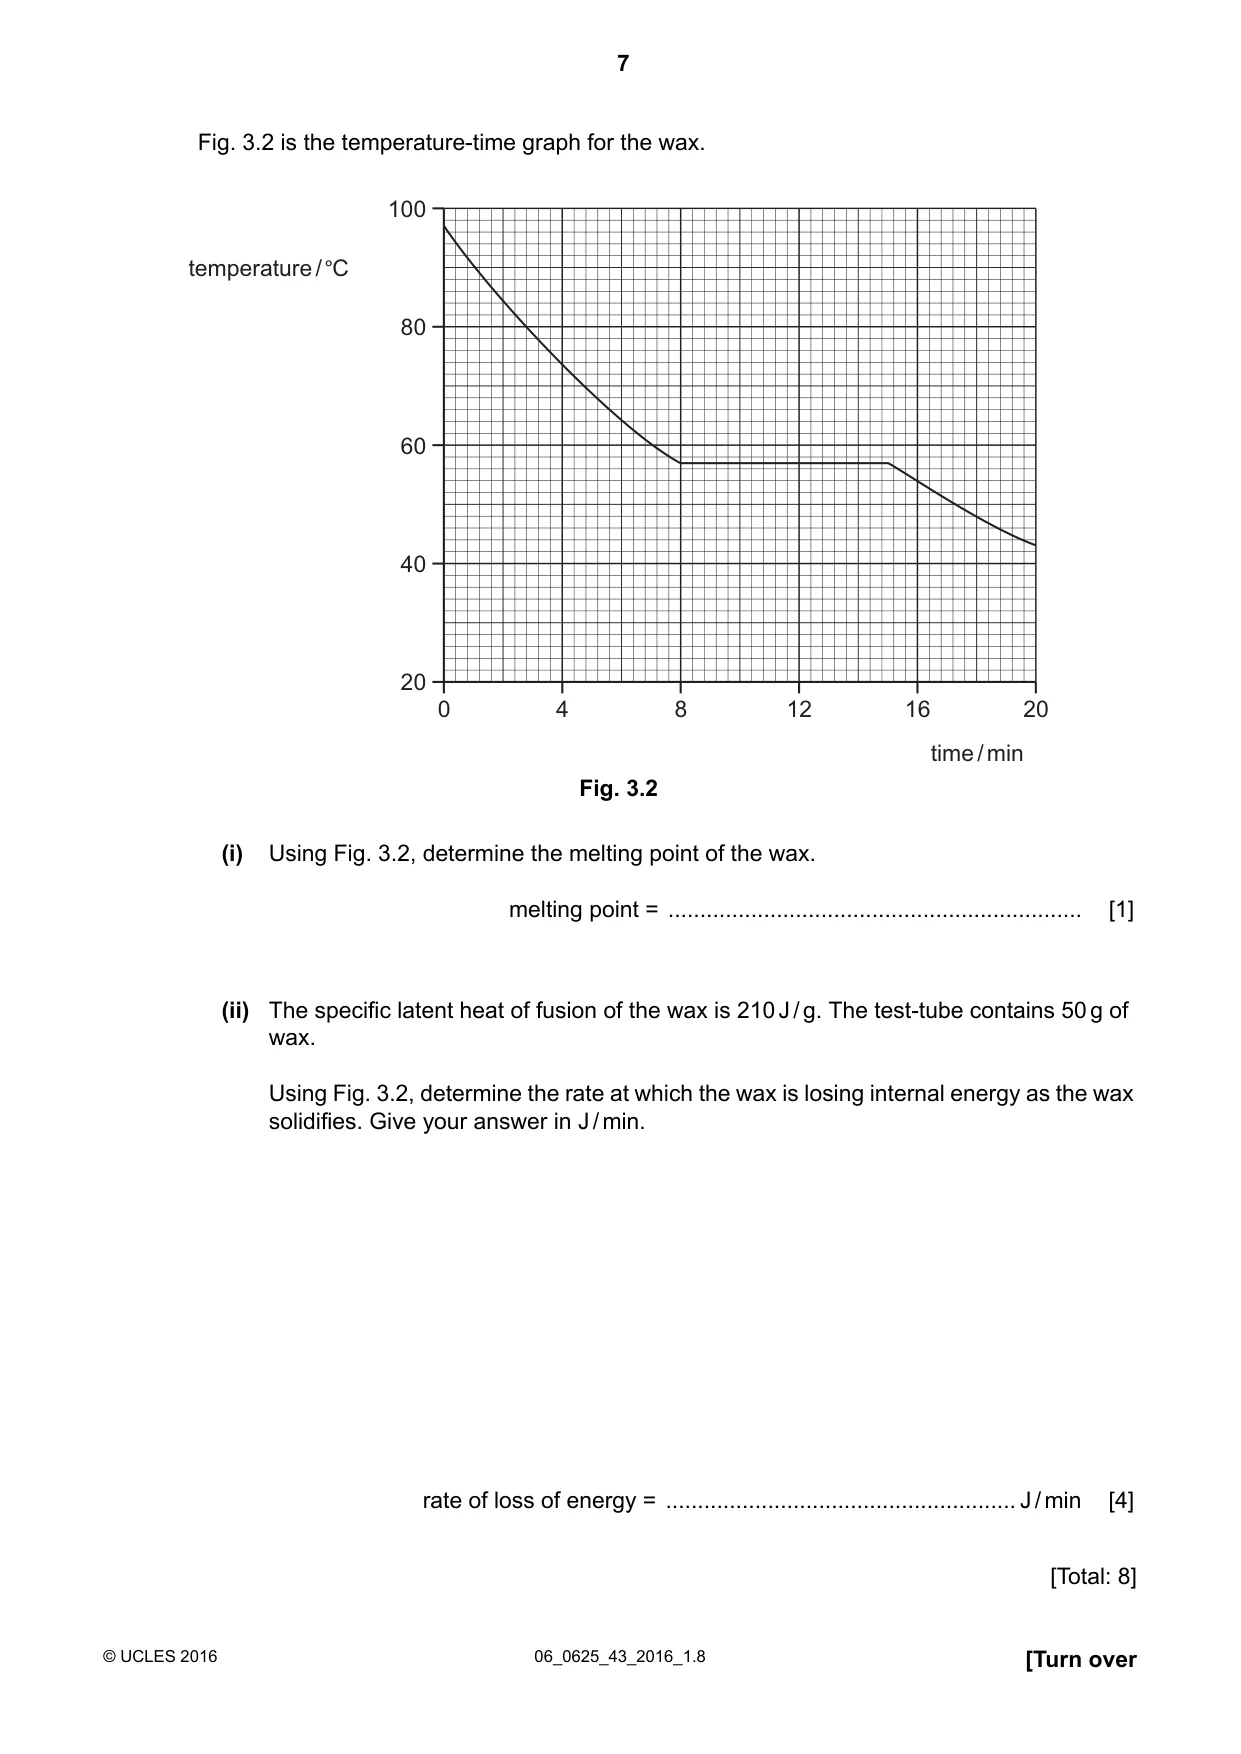
3 A test-tube containing solid wax is heated by placing it in a beaker of very hot water for several minutes. The solid wax becomes a liquid. (a) State, in terms of molecules, how a solid differs from a liquid. ........................................................................................................................................... ........................................................................................................................................... ........................................................................................................................................... ........................................................................................................................................... [2] (b) Explain, in terms of molecules, why thermal energy must be supplied for a solid to become a liquid. ........................................................................................................................................... ........................................................................................................................................... ........................................................................................................................................... [1] (c) The test-tube is removed from the hot water and held in a clamp stand. Fig. 3.1 shows the test-tube and liquid wax cooling in air. thermometer stopwatch liquid wax hot water Fig. 3.1 As the wax cools, its temperature is recorded at regular time intervals. Fig. 3.2 is the temperature-time graph for the wax. 100 temperature / °C 80 60 40 20 0 4 8 12 16 20 time / min Fig. 3.2 (i) Using Fig. 3.2, determine the melting point of the wax. melting point = ................................................................. [1] (ii) The specific latent heat of fusion of the wax is 210J/g. The test-tube contains 50g of wax. Using Fig. 3.2, determine the rate at which the wax is losing internal energy as the wax solidifies. Give your answer in J/min. rate of loss of energy = ....................................................... J/min [4] [Total: 8]
Mark scheme: 3(a) any two from: • molecules in regular positions / regular structure / fixed shape • molecules unable to move around / fixed positions / vibrate • (average) separation of molecules less / closely packed • more intermolecular bonds / stronger bonds / greater forces B2 3(b) work done against forces or work done separating molecules or energy to break bonds or potential energy of molecules increases B1 3(c)(i) 57 °C B1 3(c)(ii) 7.0 (minutes) C1 (Q = )ml or 50 × 210 or 10 500 (J) C1 ml ÷ t or 50 × 210 ÷ 7500 or ml ÷ t or 50 × 210 ÷ 7 C1 1500 (J / min) A1
Q4 · In an industrial process, a gas that is already at high pressure is trapped in a large…
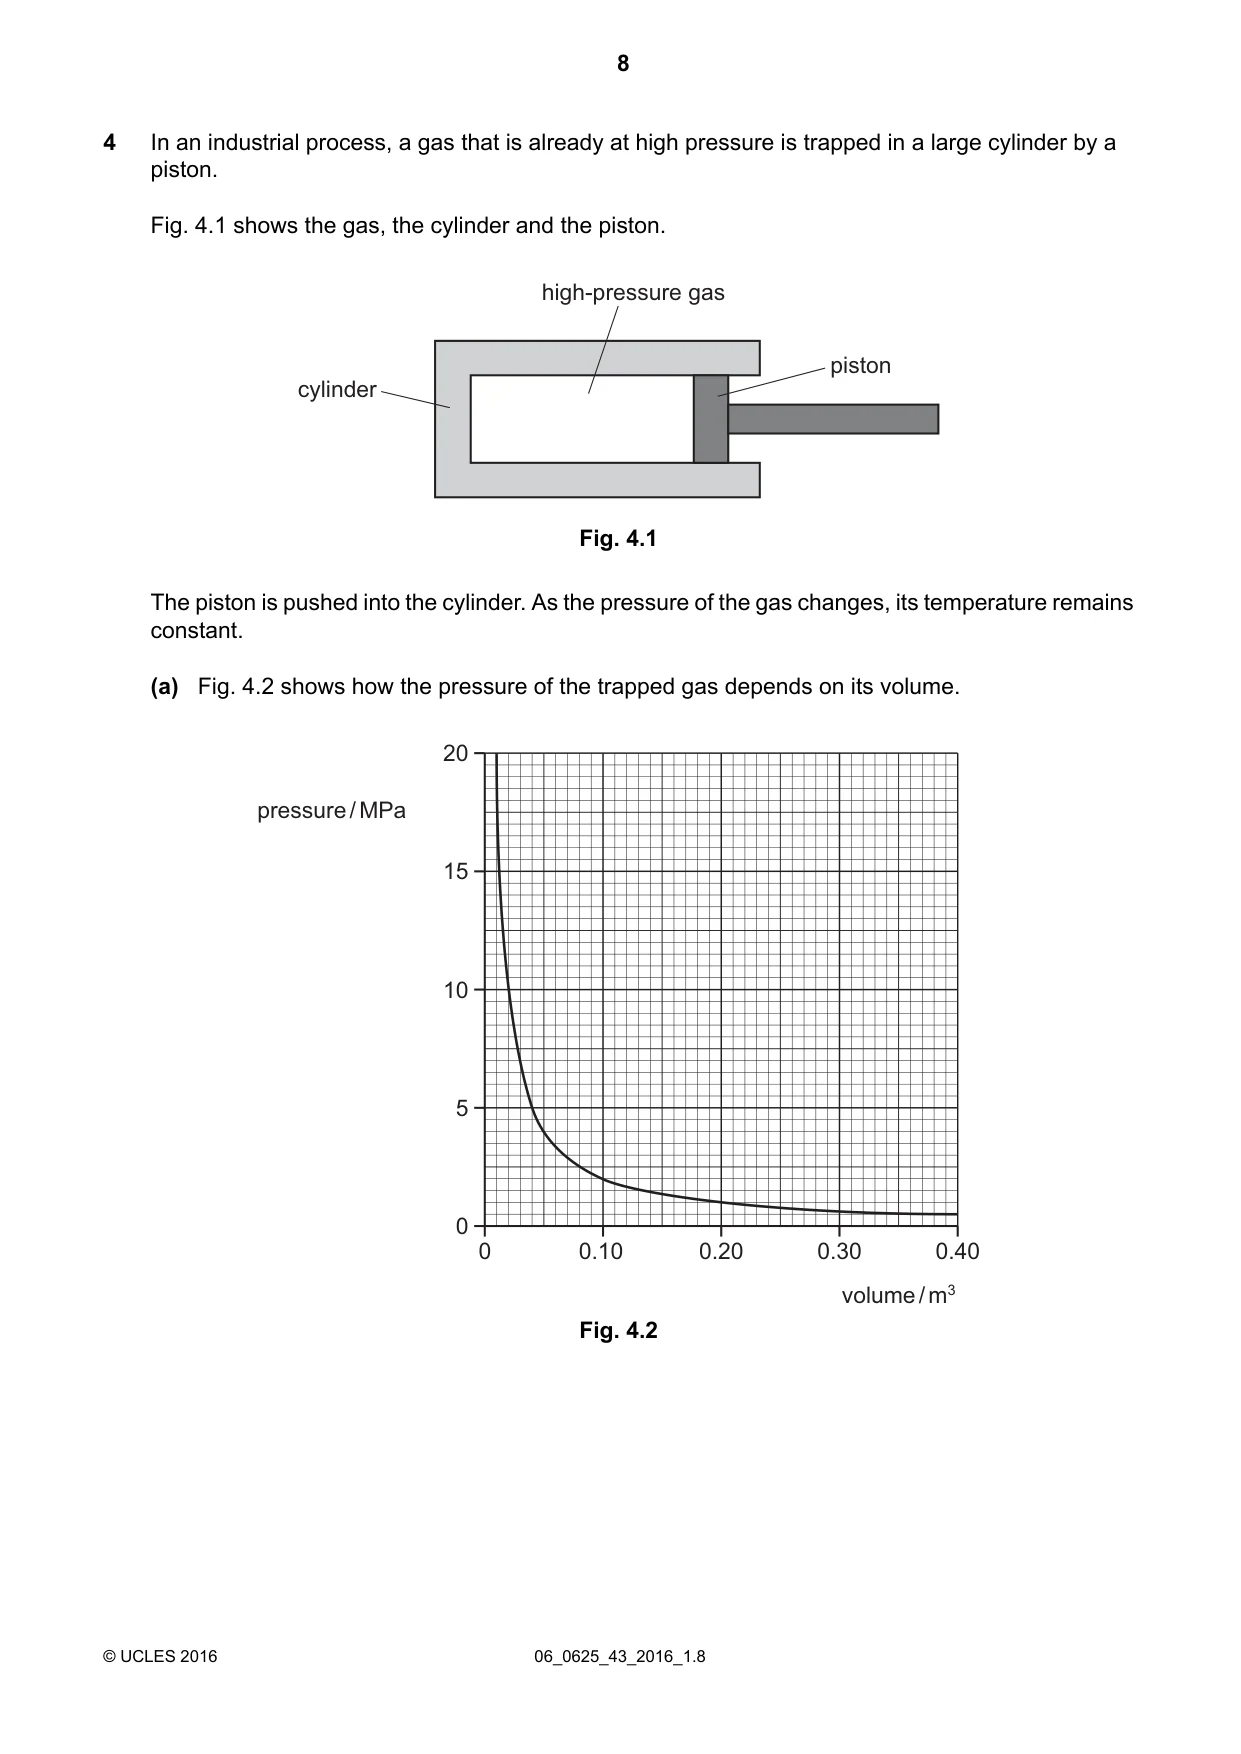
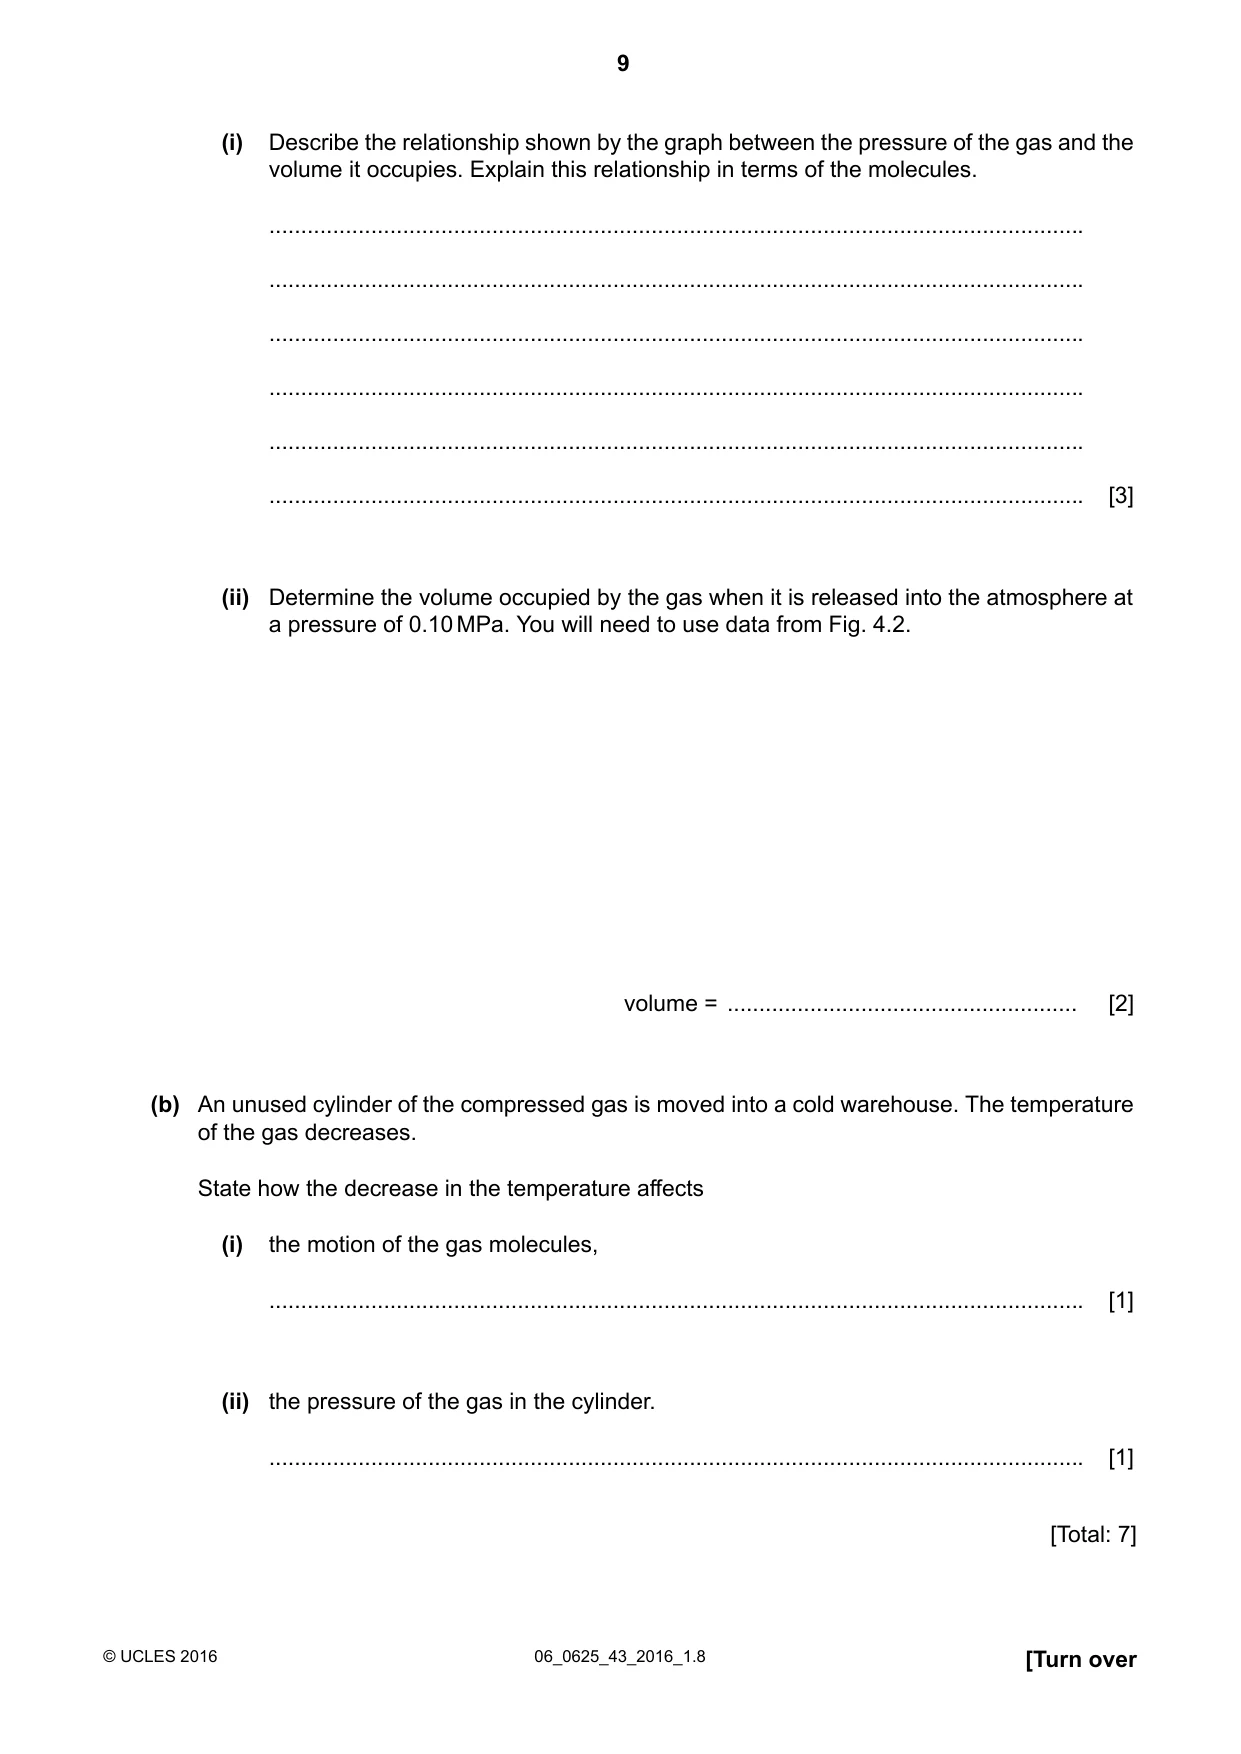
4 In an industrial process, a gas that is already at high pressure is trapped in a large cylinder by a piston. Fig. 4.1 shows the gas, the cylinder and the piston. high-pressure gas piston cylinder Fig. 4.1 The piston is pushed into the cylinder. As the pressure of the gas changes, its temperature remains constant. (a) Fig. 4.2 shows how the pressure of the trapped gas depends on its volume. 20 pressure / MPa 15 10 5 0 0 0.10 0.20 0.30 0.40 volume / m3 Fig. 4.2 (i) Describe the relationship shown by the graph between the pressure of the gas and the volume it occupies. Explain this relationship in terms of the molecules. ................................................................................................................................ ................................................................................................................................ ................................................................................................................................ ................................................................................................................................ ................................................................................................................................ ................................................................................................................................ [3] (ii) Determine the volume occupied by the gas when it is released into the atmosphere at a pressure of 0.10MPa. You will need to use data from Fig. 4.2. volume = ....................................................... [2] (b) An unused cylinder of the compressed gas is moved into a cold warehouse. The temperature of the gas decreases. State how the decrease in the temperature affects (i) the motion of the gas molecules, ................................................................................................................................ [1] (ii) the pressure of the gas in the cylinder. ................................................................................................................................ [1] [Total: 7]
Mark scheme: 4(a)(i) B1 greater volume and molecules more spread out / less concentrated / more space B1 greater volume / more spread out and less frequent collisions with walls B1 4(a)(ii) a p value multiplied by a V value or 2.0 × 10⁵ C1 2.0 m3 A1 4(b)(i) (they) slow down B1 4(b)(ii) (pressure) decreases B1
Q5 · Radio waves, ultrasound and visible light are all waves
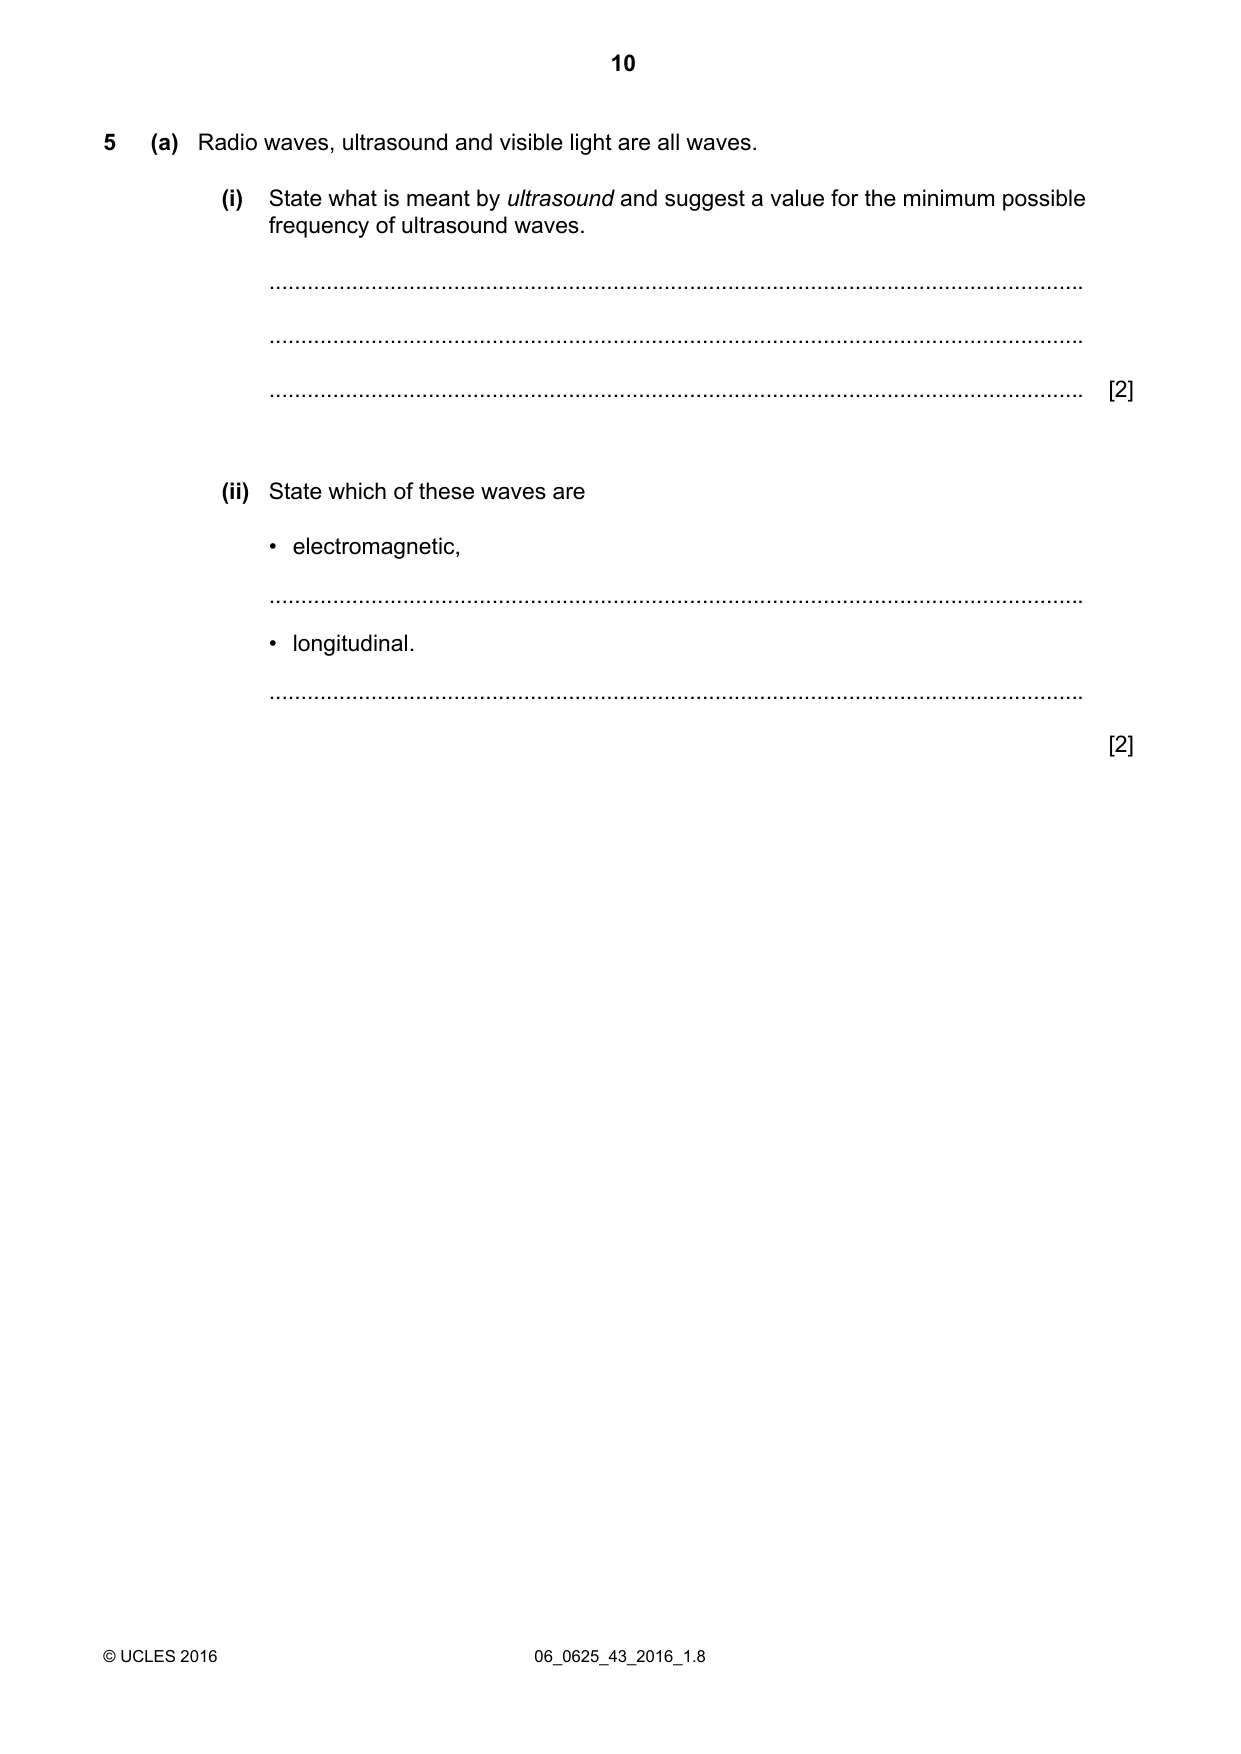
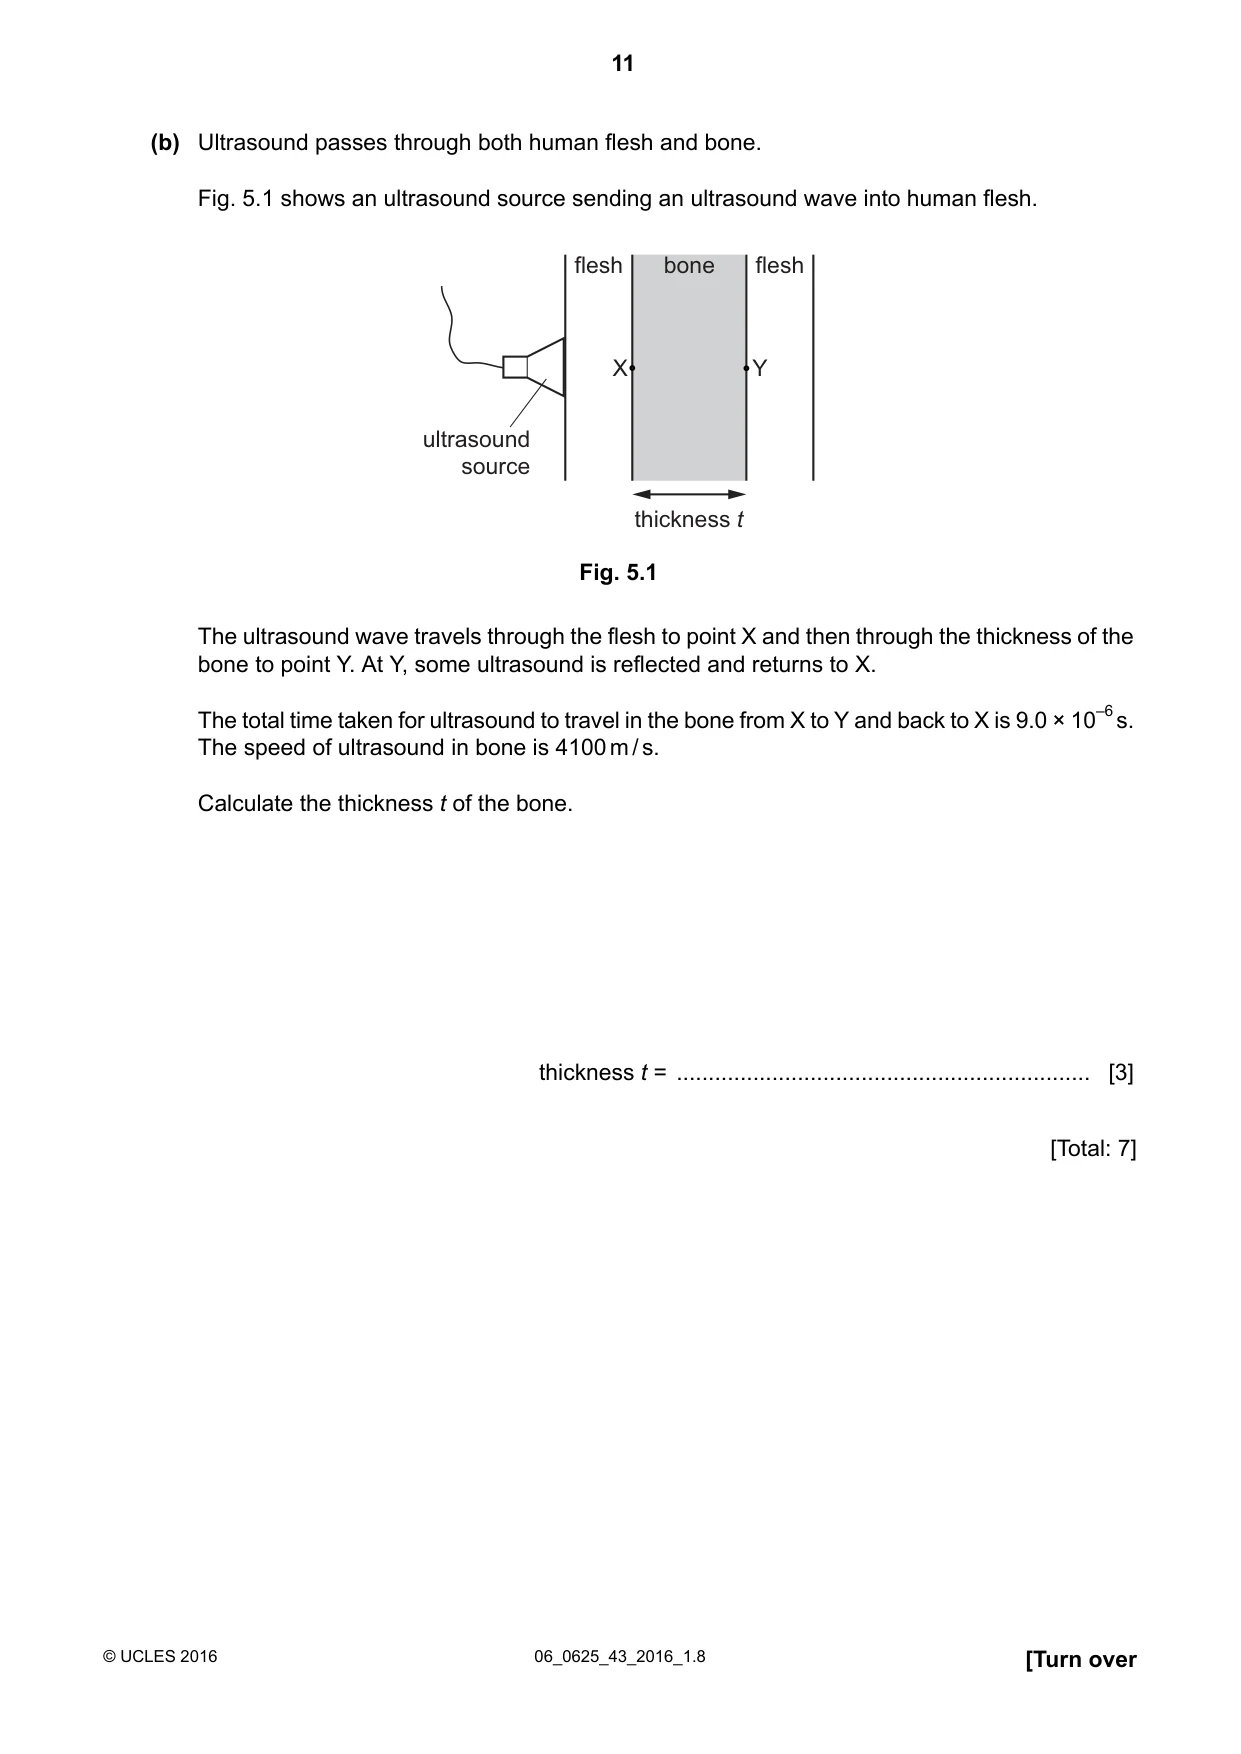
5 (a) Radio waves, ultrasound and visible light are all waves. (i) State what is meant by ultrasound and suggest a value for the minimum possible frequency of ultrasound waves. ................................................................................................................................ ................................................................................................................................ ................................................................................................................................ [2] (ii) State which of these waves are • electromagnetic, ................................................................................................................................ • longitudinal. ................................................................................................................................ [2] (b) Ultrasound passes through both human flesh and bone. Fig. 5.1 shows an ultrasound source sending an ultrasound wave into human flesh. flesh bone flesh X Y ultrasound source thickness t Fig. 5.1 The ultrasound wave travels through the flesh to point X and then through the thickness of the bone to point Y. At Y, some ultrasound is reflected and returns to X. The total time taken for ultrasound to travel in the bone from X to Y and back to X is 9.0 × 10⁻⁶s. The speed of ultrasound in bone is 4100m/s. Calculate the thickness t of the bone. thickness t = ................................................................. [3] [Total: 7]
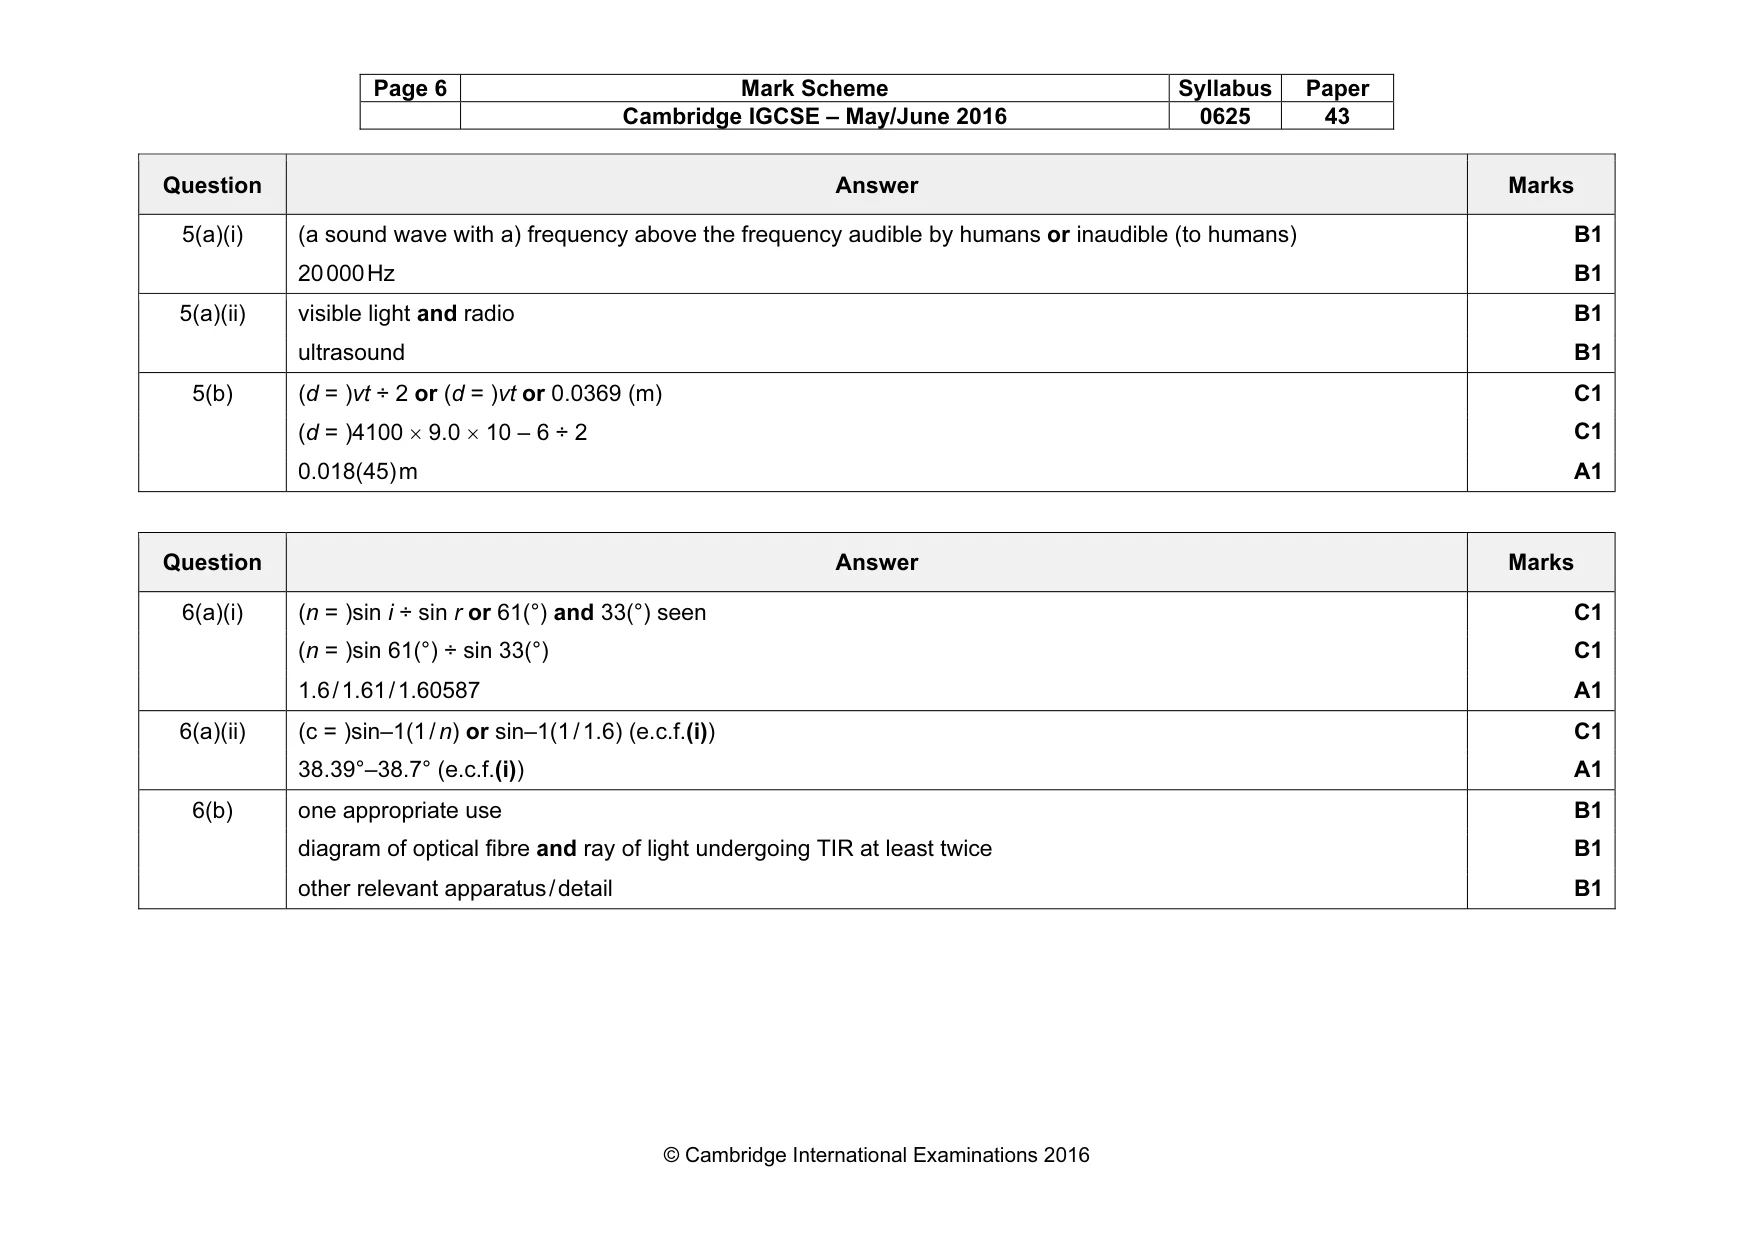
Mark scheme: 5(a)(i) (a sound wave with a) frequency above the frequency audible by humans or inaudible (to humans) B1 20 000 Hz B1 5(a)(ii) visible light and radio B1 ultrasound B1 5(b) (d = )vt ÷ 2 or (d = )vt or 0.0369 (m) C1 (d = )4100 × 9.0 × 10 – 6 ÷ 2 C1 0.018(45) m A1
Q6 · A block is made from a particular type of glass
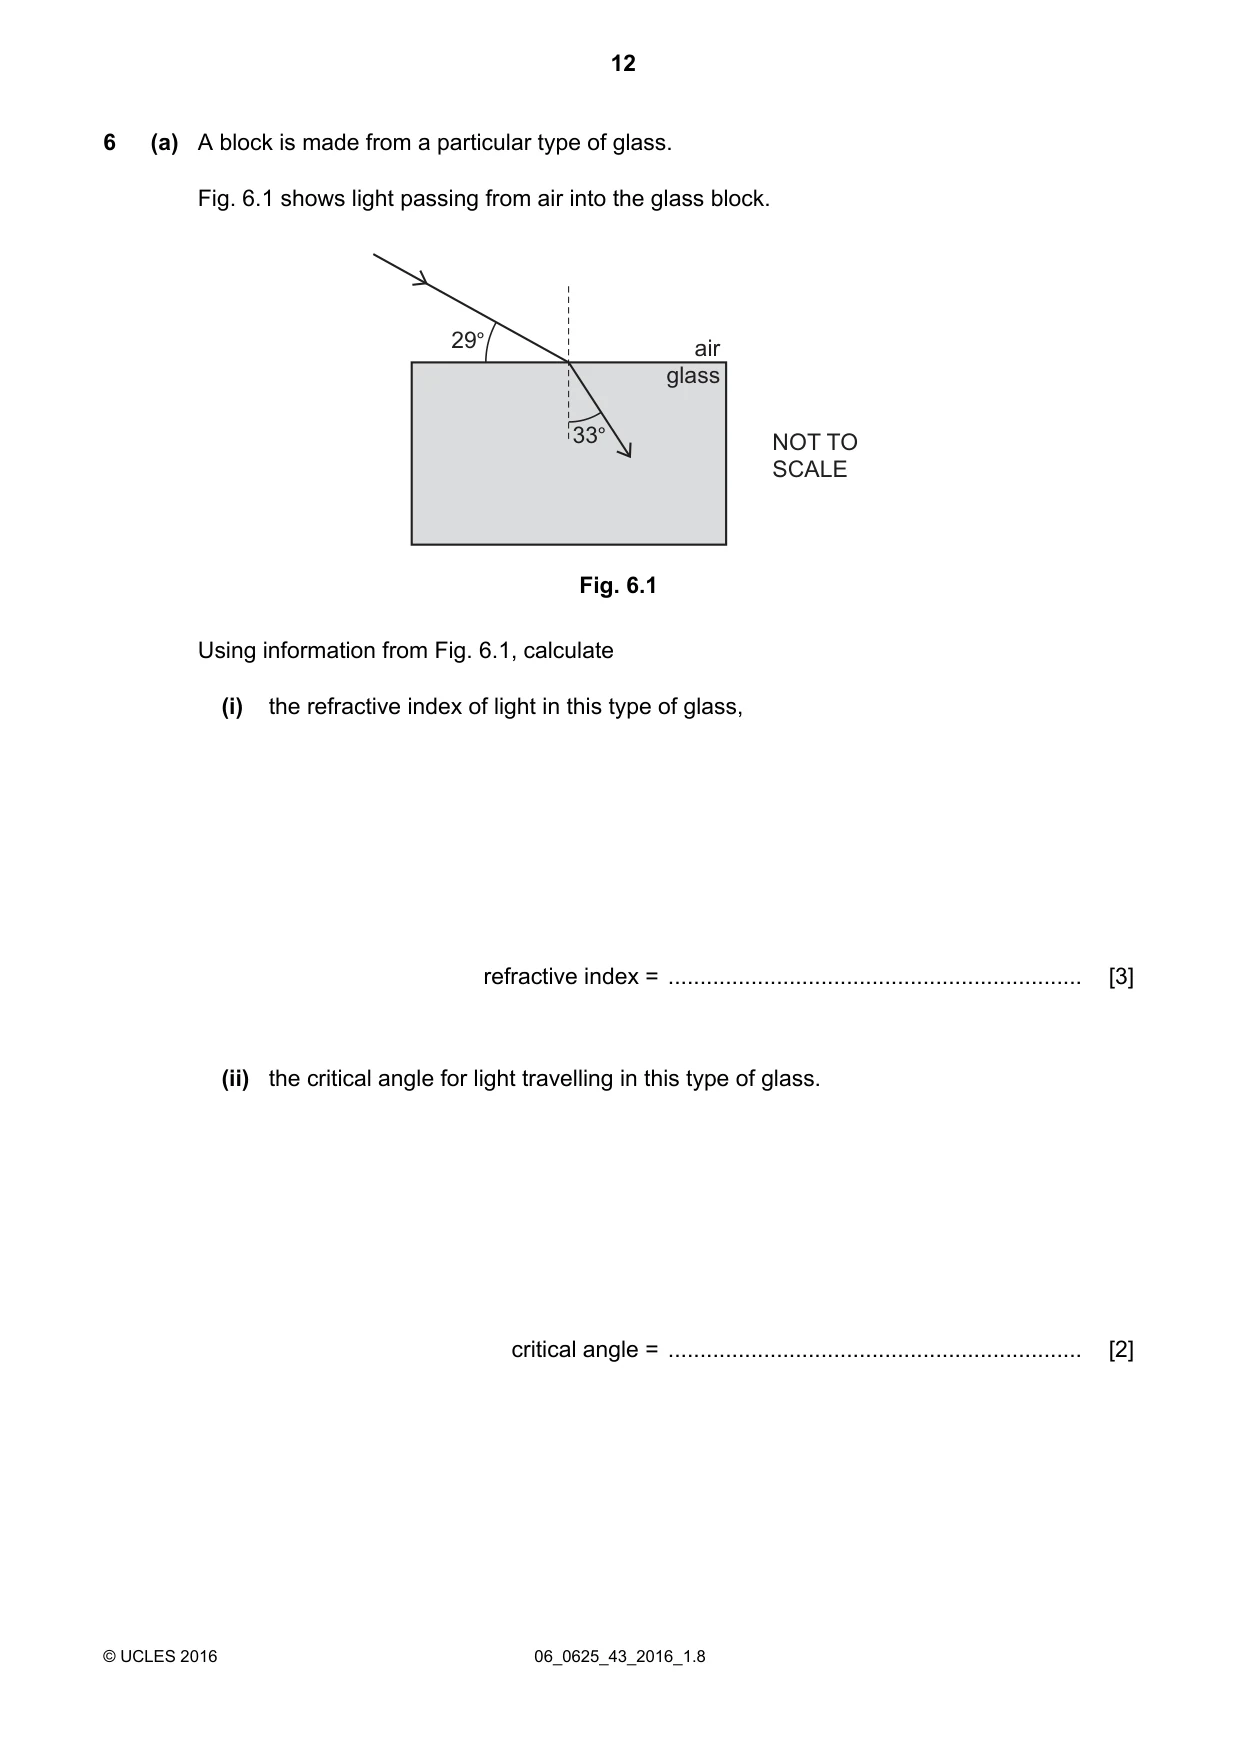
6 (a) A block is made from a particular type of glass. Fig. 6.1 shows light passing from air into the glass block. 29° air glass 33° NOT TO SCALE Fig. 6.1 Using information from Fig. 6.1, calculate (i) the refractive index of light in this type of glass, refractive index = ................................................................. [3] (ii) the critical angle for light travelling in this type of glass. critical angle = ................................................................. [2] (b) State one application of optical fibres. Draw a diagram that shows how an optical fibre is used in this application. ........................................................................................................................................... ........................................................................................................................................... ........................................................................................................................................... [3] [Total: 8]
Mark scheme: 6(a)(i) C1 (n = )sin 61(°) ÷ sin 33(°) C1 1.6 / 1.61 / 1.60587 A1 6(a)(ii) (c = )sin–1(1 / n) or sin–1(1 / 1.6) (e.c.f.(i)) C1 38.39°–38.7° (e.c.f.(i)) A1 6(b) one appropriate use B1 diagram of optical fibre and ray of light undergoing TIR at least twice B1 other relevant apparatus / detail B1
Q7 · A lightning conductor protects a tall building and the people in it against damage and…
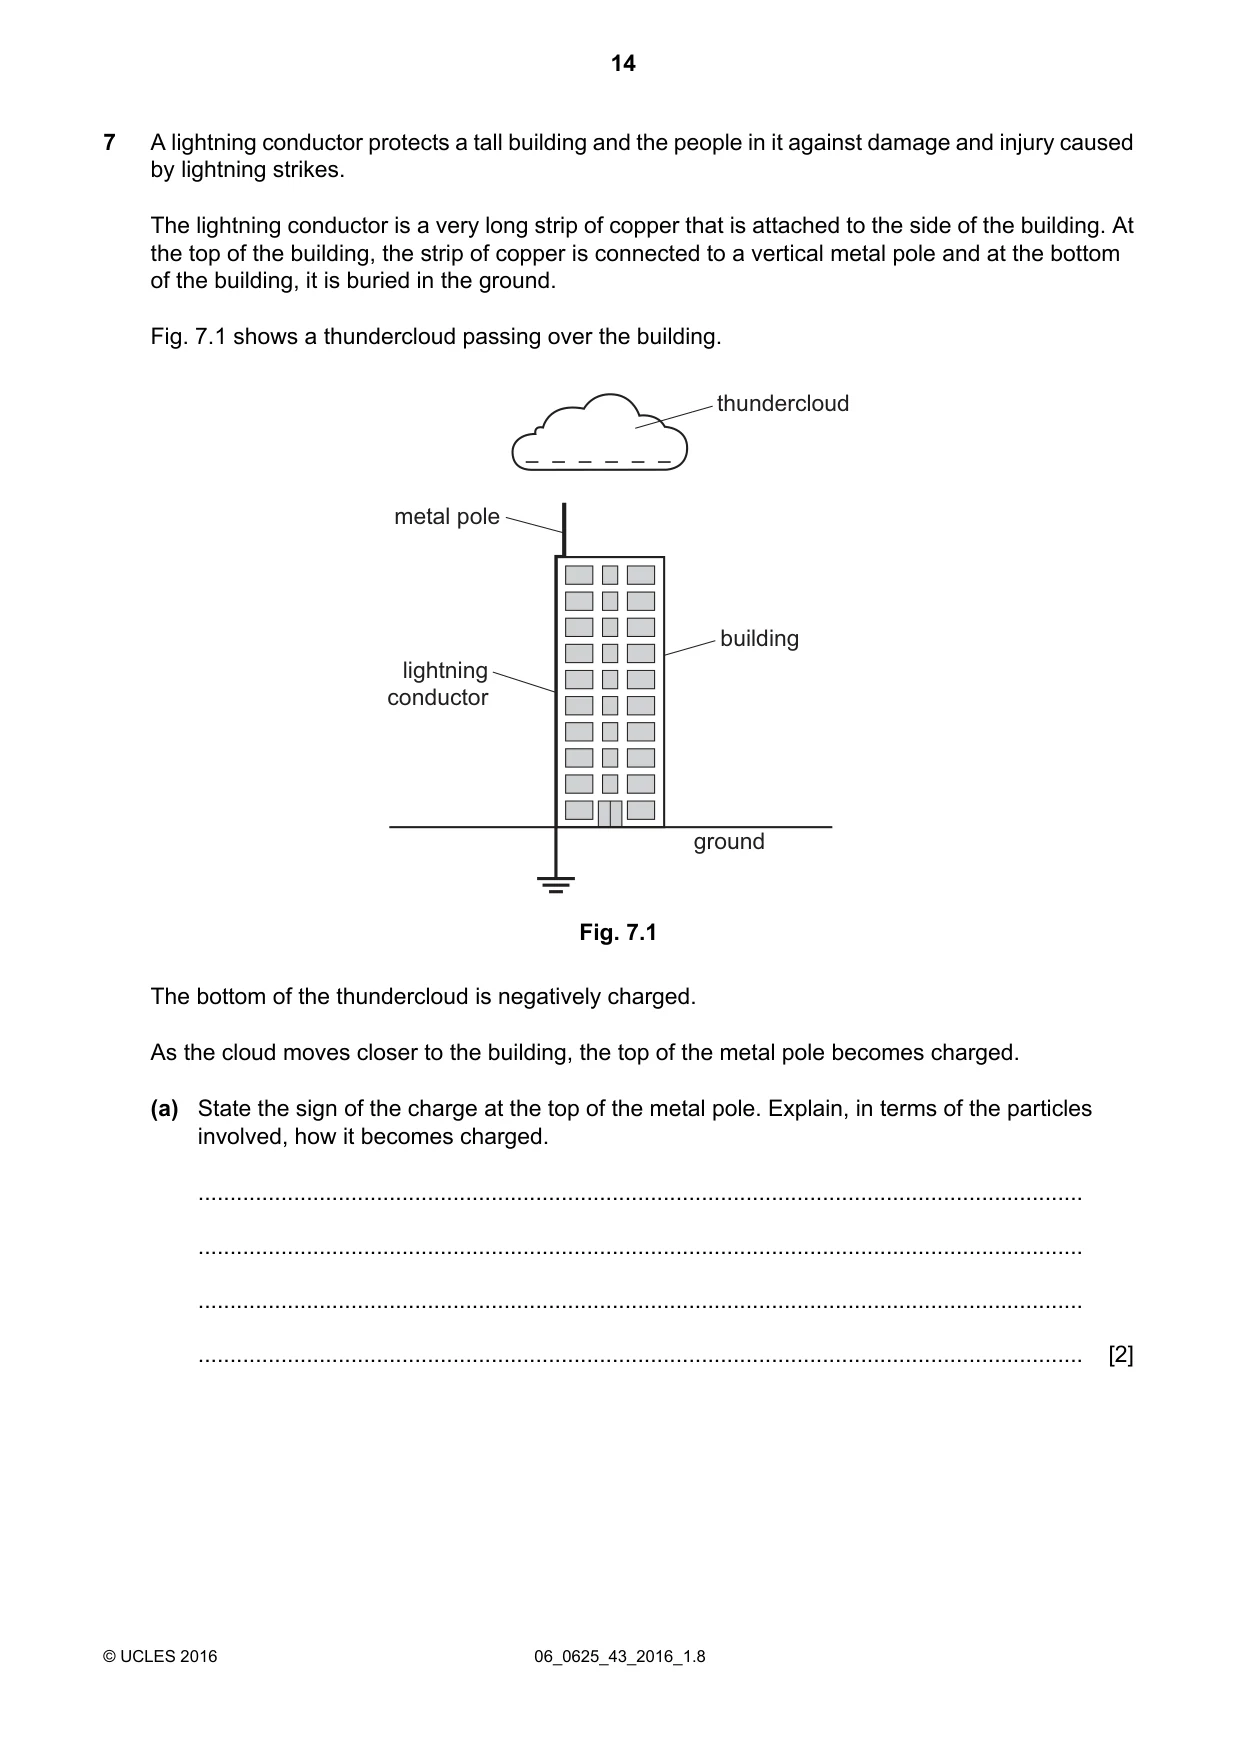
7 A lightning conductor protects a tall building and the people in it against damage and injury caused by lightning strikes. The lightning conductor is a very long strip of copper that is attached to the side of the building. At the top of the building, the strip of copper is connected to a vertical metal pole and at the bottom of the building, it is buried in the ground. Fig. 7.1 shows a thundercloud passing over the building. thundercloud – – – – – – metal pole building lightning conductor ground Fig. 7.1 The bottom of the thundercloud is negatively charged. As the cloud moves closer to the building, the top of the metal pole becomes charged. (a) State the sign of the charge at the top of the metal pole. Explain, in terms of the particles involved, how it becomes charged. ........................................................................................................................................... ........................................................................................................................................... ........................................................................................................................................... ........................................................................................................................................... [2] (b) As the cloud passes over the building, a lightning strike occurs and a charge of 0.84C flows through the lightning conductor. The charge flows for 3.5 × 10⁻⁵s. (i) Calculate the average current in the lightning conductor during this time. current = ................................................................. [2] (ii) It is suggested that the current in the lightning conductor could be measured by connecting a laboratory ammeter between the pole and the copper strip. State one reason why this cannot be successful. ................................................................................................................................ ................................................................................................................................ [1] (c) The copper strip has a large cross-sectional area. State how increasing the cross-sectional area of the copper strip affects its resistance. ........................................................................................................................................... ........................................................................................................................................... [1] [Total: 6]
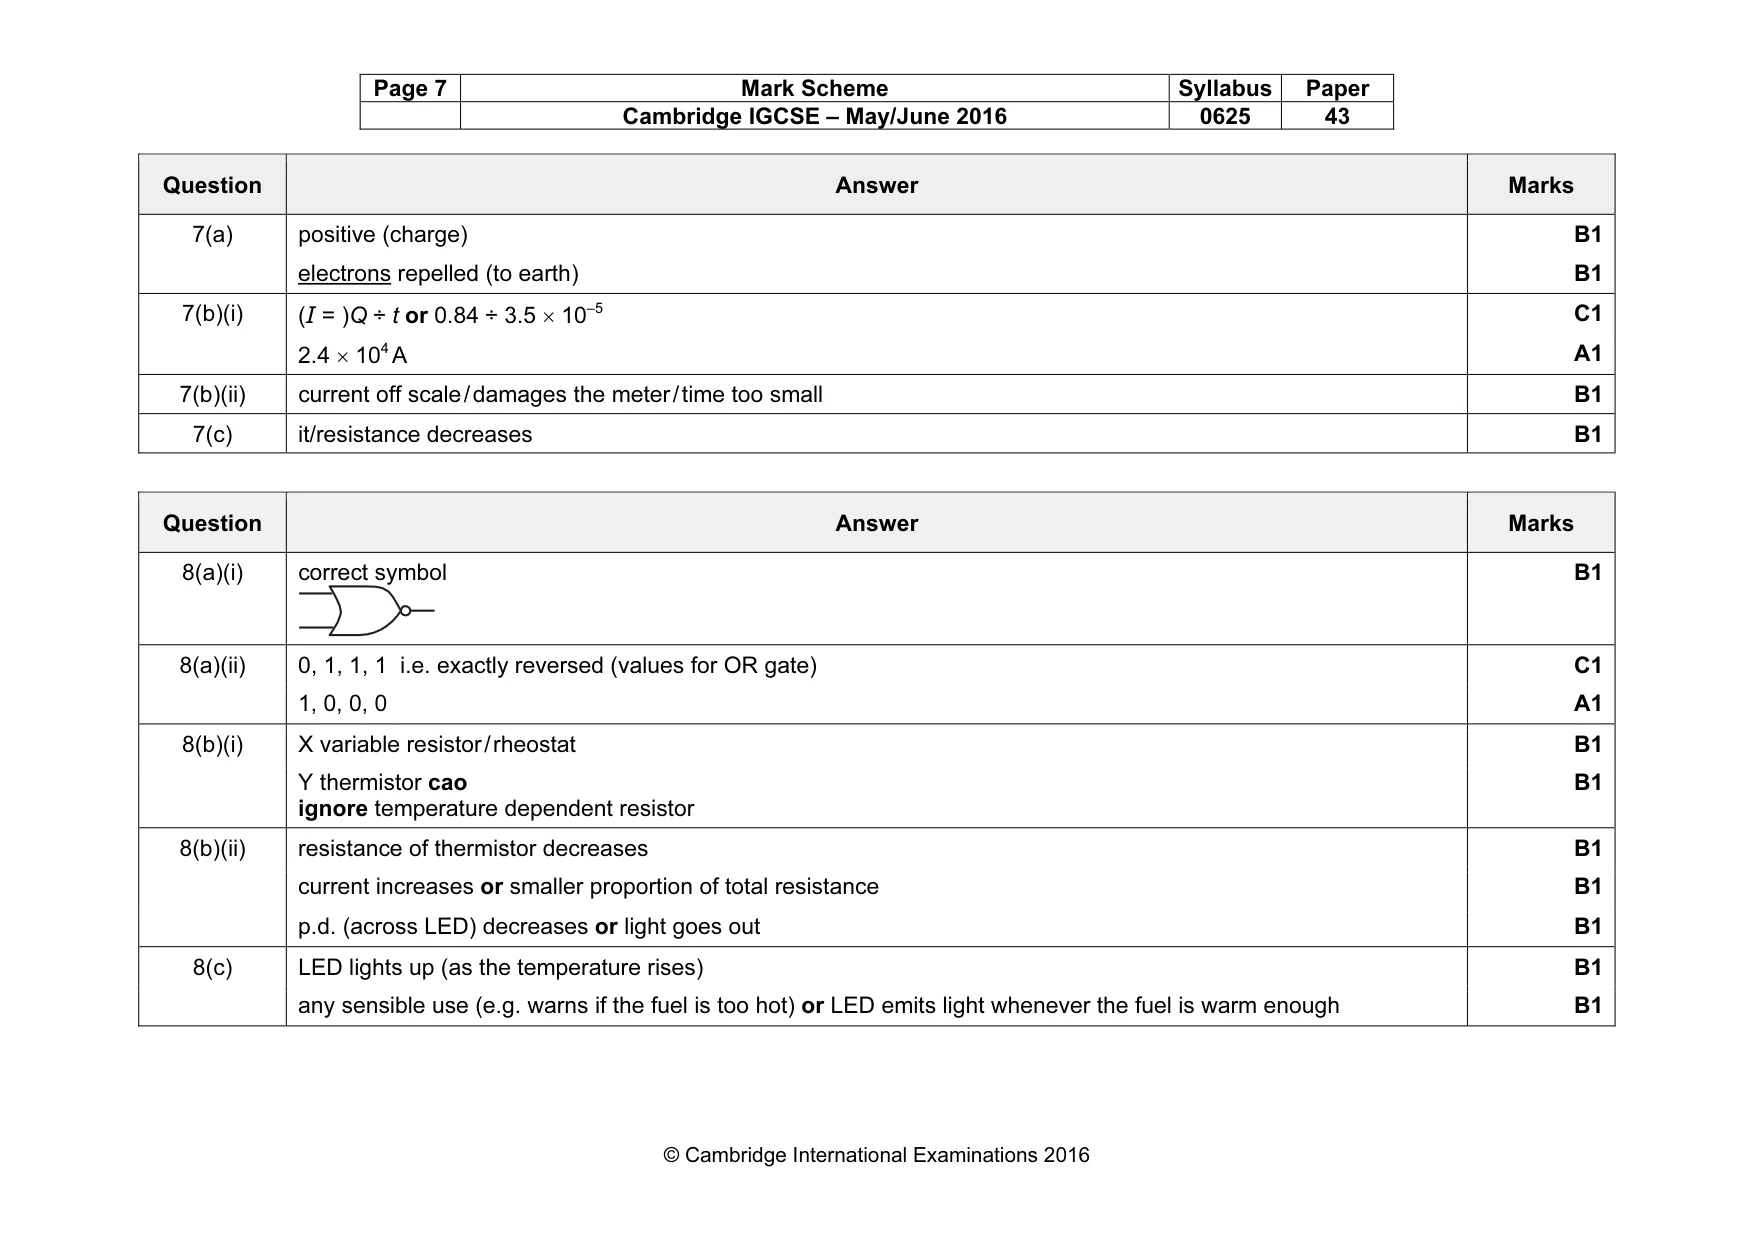
Mark scheme: 7(a) positive (charge) B1 electrons repelled (to earth) B1 7(b)(i) (I = )Q ÷ t or 0.84 ÷ 3.5 × 10⁻⁵ C1 2.4 × 10⁴ A A1 7(b)(ii) current off scale / damages the meter / time too small B1 7(c) it/resistance decreases B1
Q8 · In the space below, draw the symbol for a NOR gate
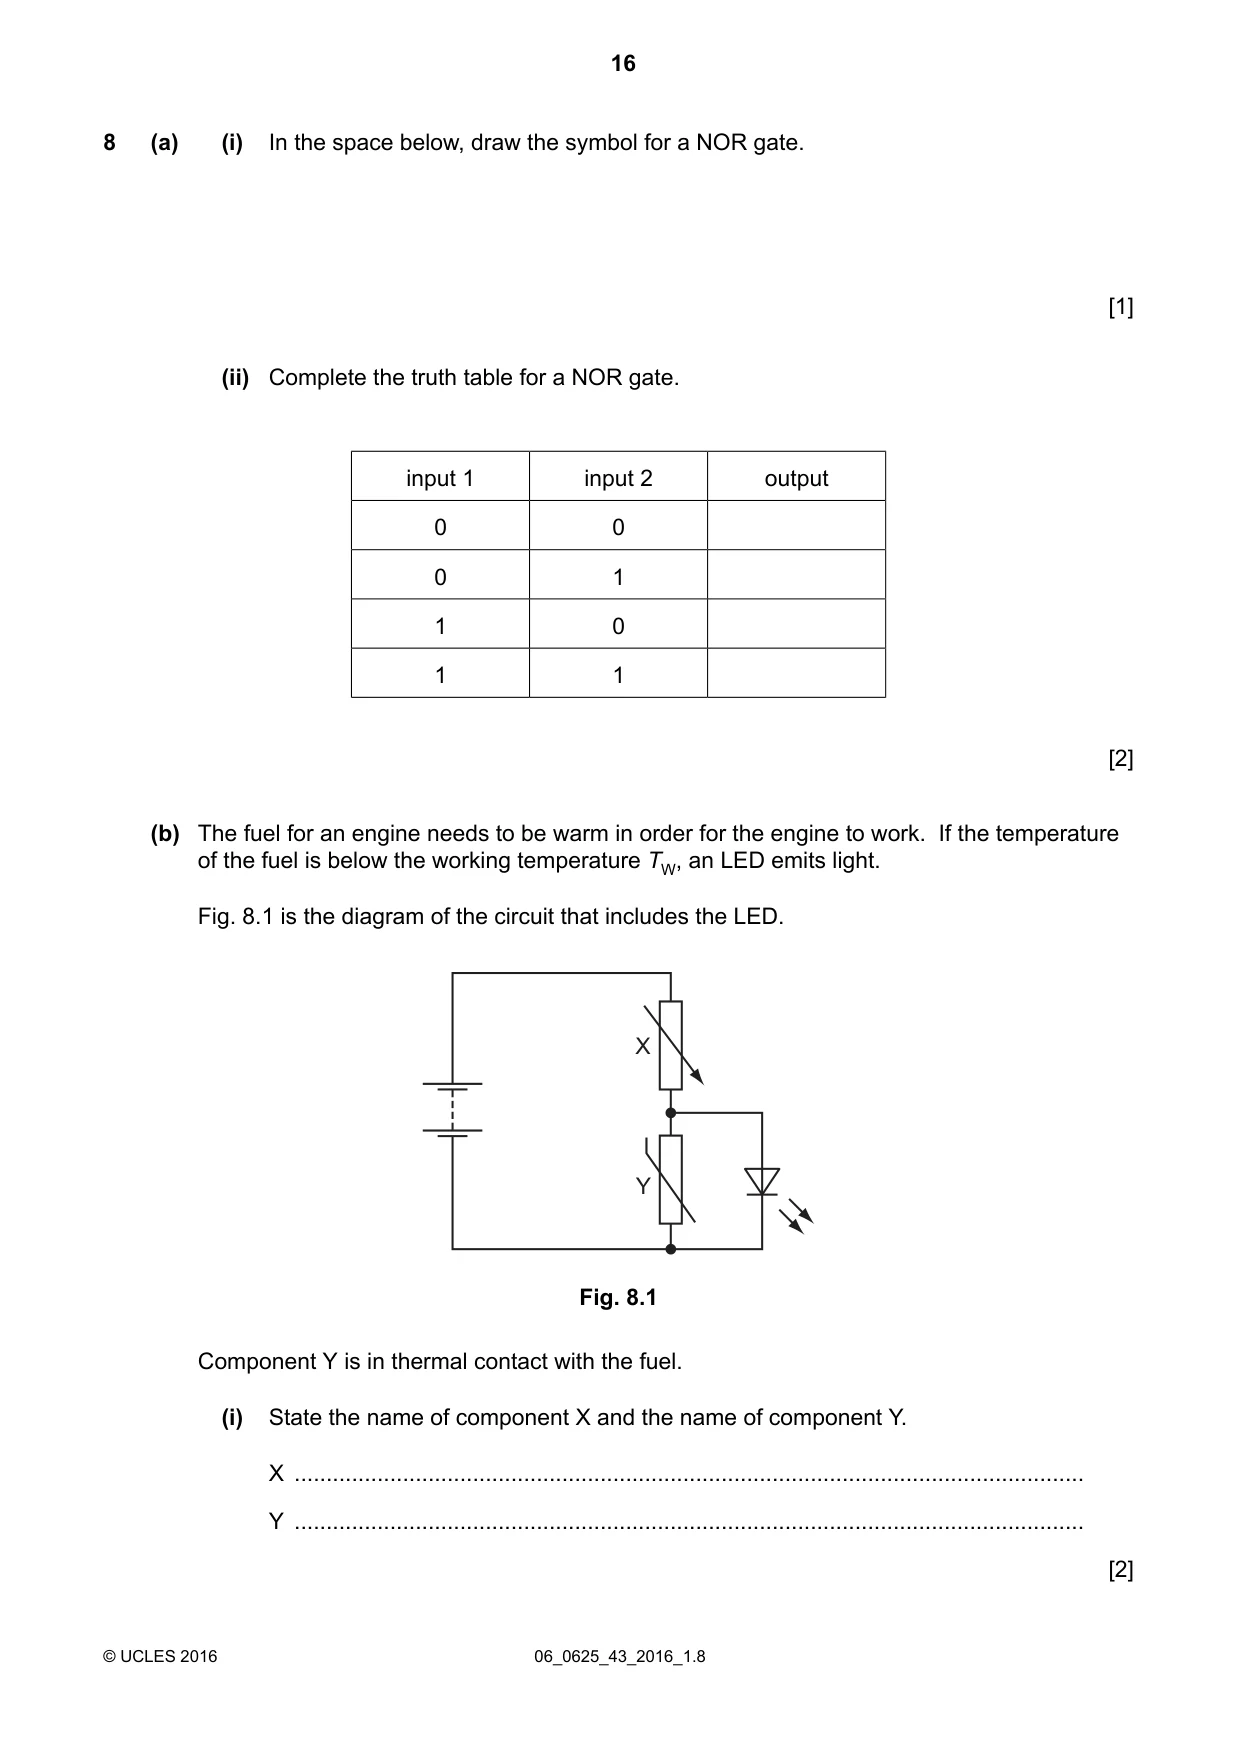
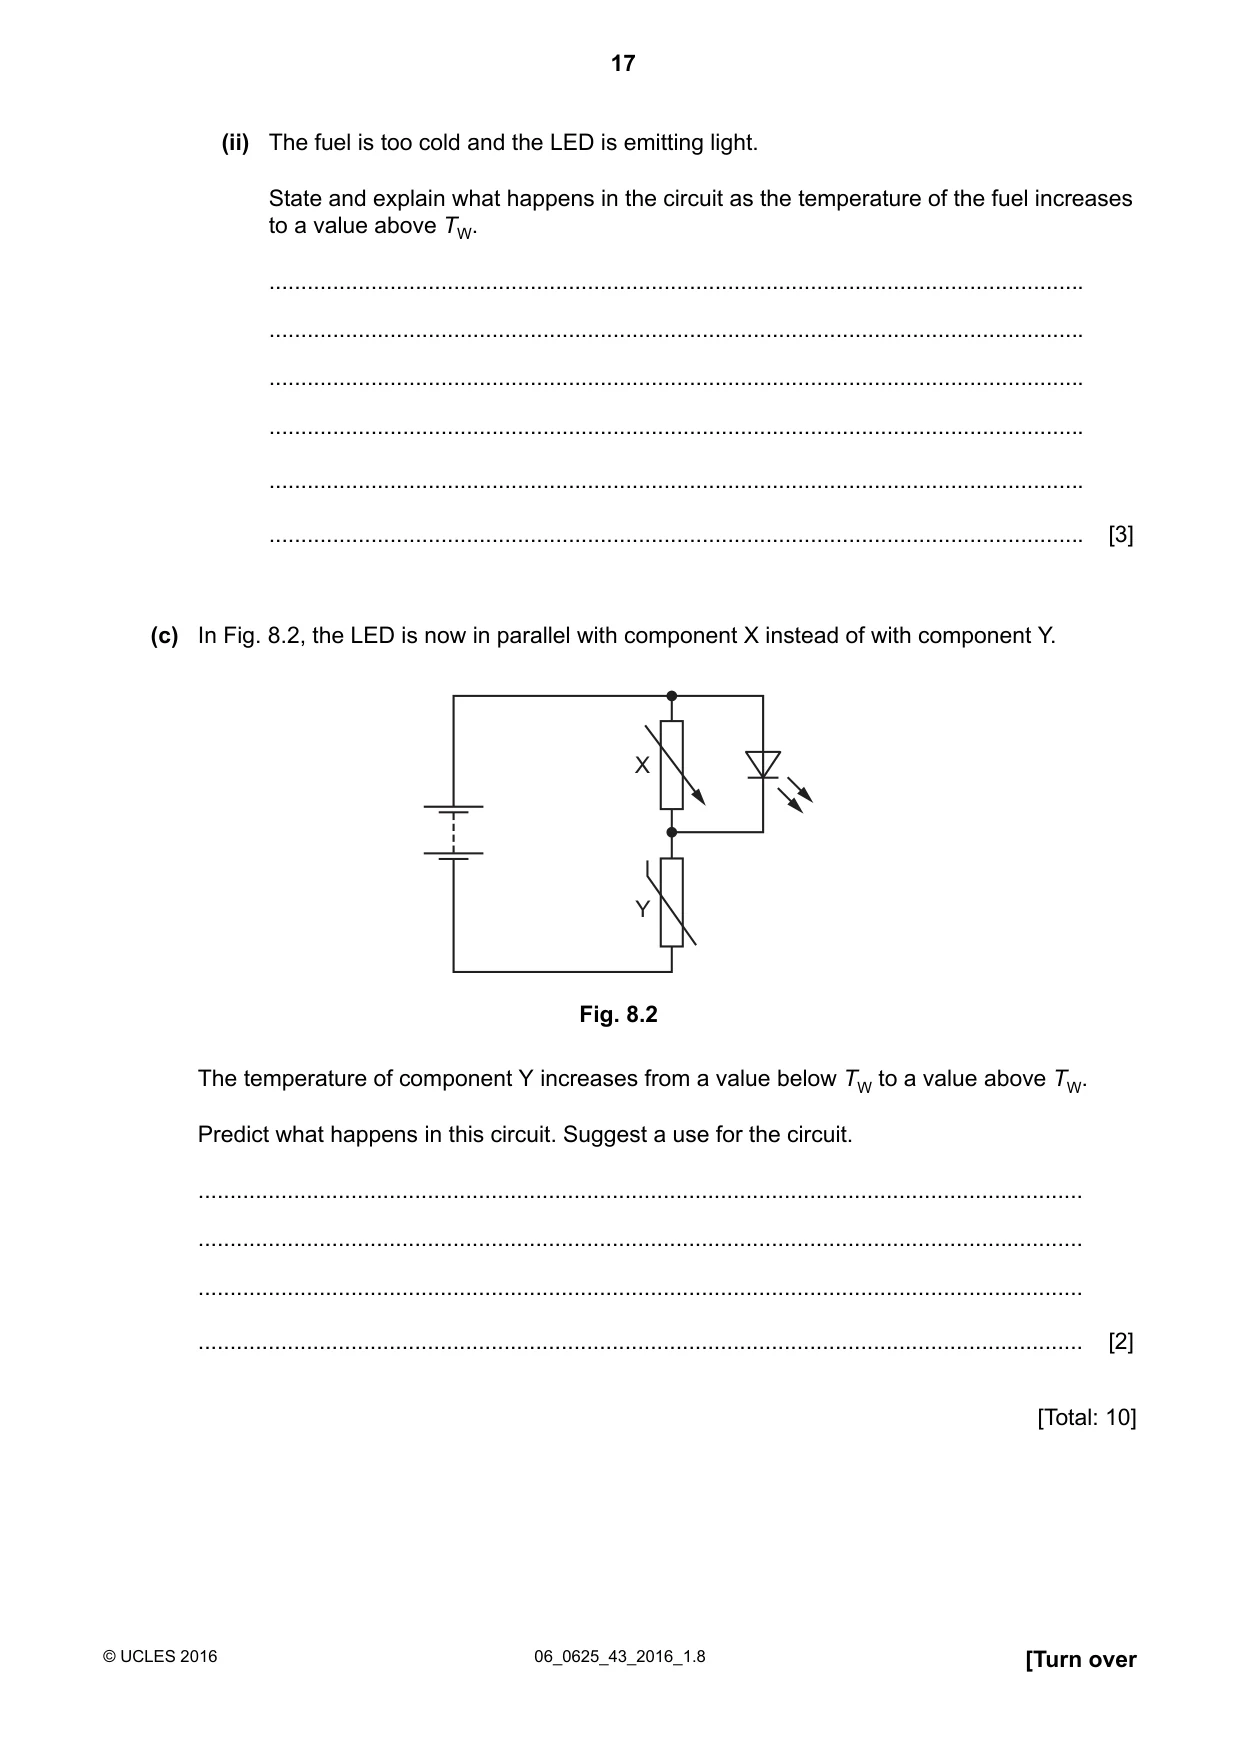
8 (a) (i) In the space below, draw the symbol for a NOR gate. [1] (ii) Complete the truth table for a NOR gate. input 1 input 2 output 0 0 0 1 1 0 1 1 [2] (b) The fuel for an engine needs to be warm in order for the engine to work. If the temperature of the fuel is below the working temperature TW, an LED emits light. Fig. 8.1 is the diagram of the circuit that includes the LED. X Y Fig. 8.1 Component Y is in thermal contact with the fuel. (i) State the name of component X and the name of component Y. X ............................................................................................................................ Y ............................................................................................................................ [2] (ii) The fuel is too cold and the LED is emitting light. State and explain what happens in the circuit as the temperature of the fuel increases to a value above TW. ................................................................................................................................ ................................................................................................................................ ................................................................................................................................ ................................................................................................................................ ................................................................................................................................ ................................................................................................................................ [3] (c) In Fig. 8.2, the LED is now in parallel with component X instead of with component Y. X Y Fig. 8.2 The temperature of component Y increases from a value below TW to a value above TW. Predict what happens in this circuit. Suggest a use for the circuit. ........................................................................................................................................... ........................................................................................................................................... ........................................................................................................................................... ........................................................................................................................................... [2] [Total: 10]
Mark scheme: 8(a)(i) correct symbol B1 8(a)(ii) 0, 1, 1, 1 i.e. exactly reversed (values for OR gate) C1 1, 0, 0, 0 A1 8(b)(i) X variable resistor / rheostat B1 Y thermistor cao ignore temperature dependent resistor B1 8(b)(ii) resistance of thermistor decreases B1 current increases or smaller proportion of total resistance B1 p.d. (across LED) decreases or light goes out B1 8(c) LED lights up (as the temperature rises) B1 any sensible use (e.g. warns if the fuel is too hot) or LED emits light whenever the fuel is warm enough B1
Q9 · The two ends of a metal rod are connected by copper wire to a very sensitive ammeter
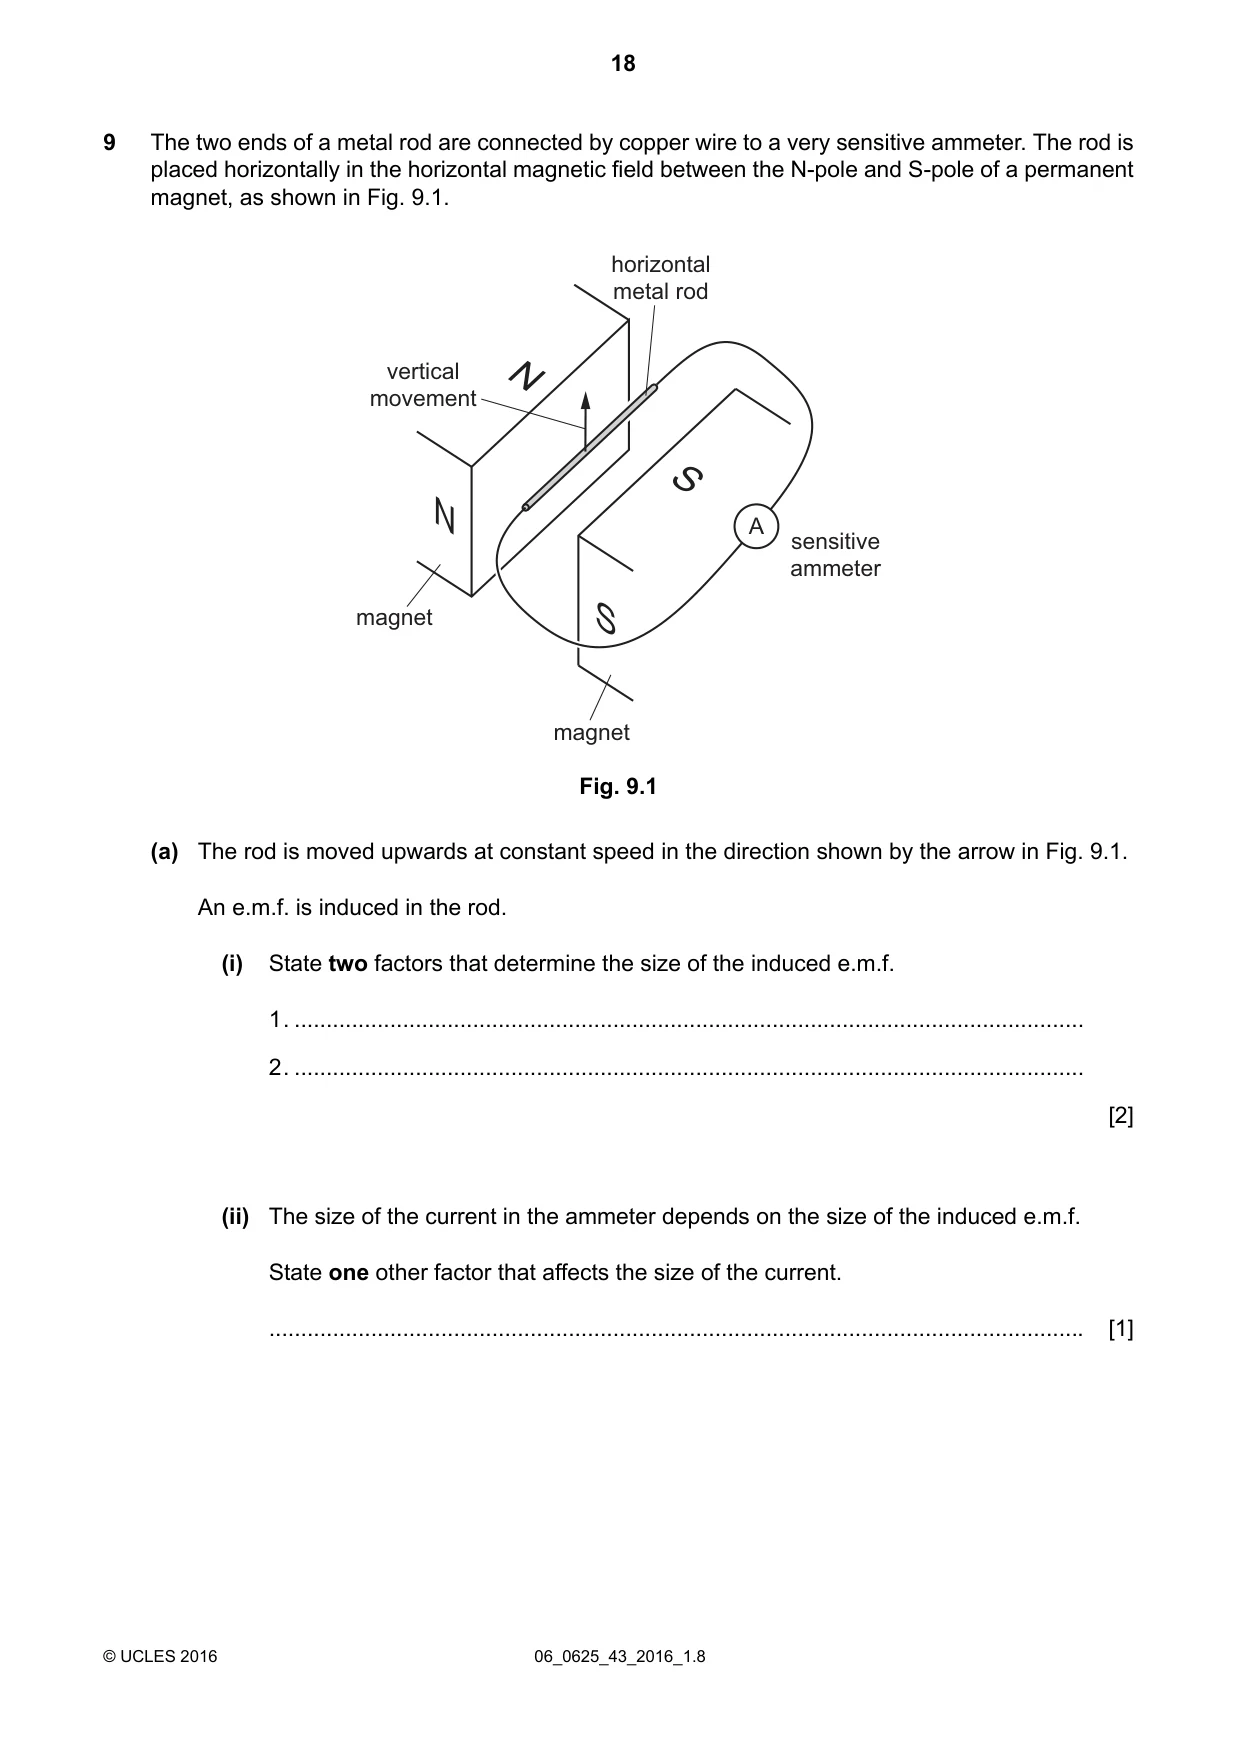
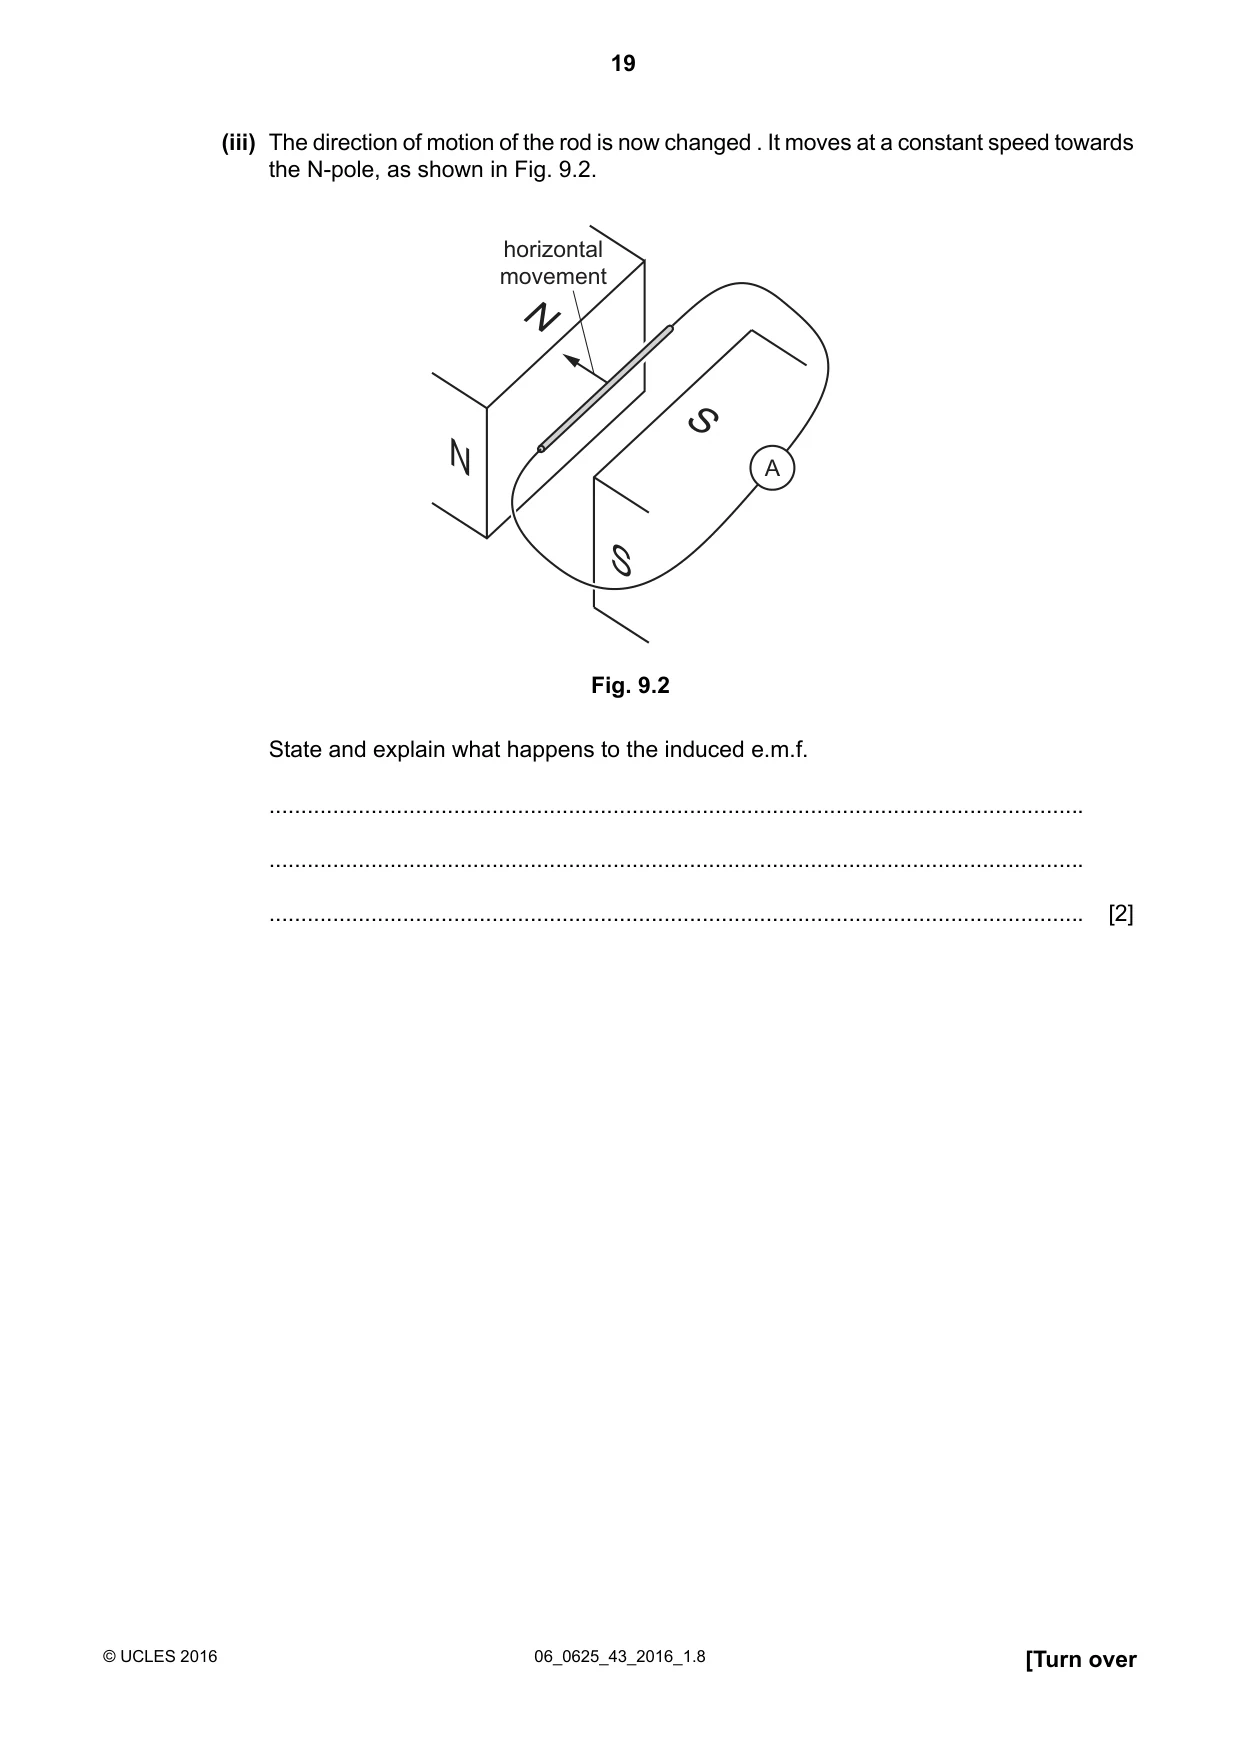
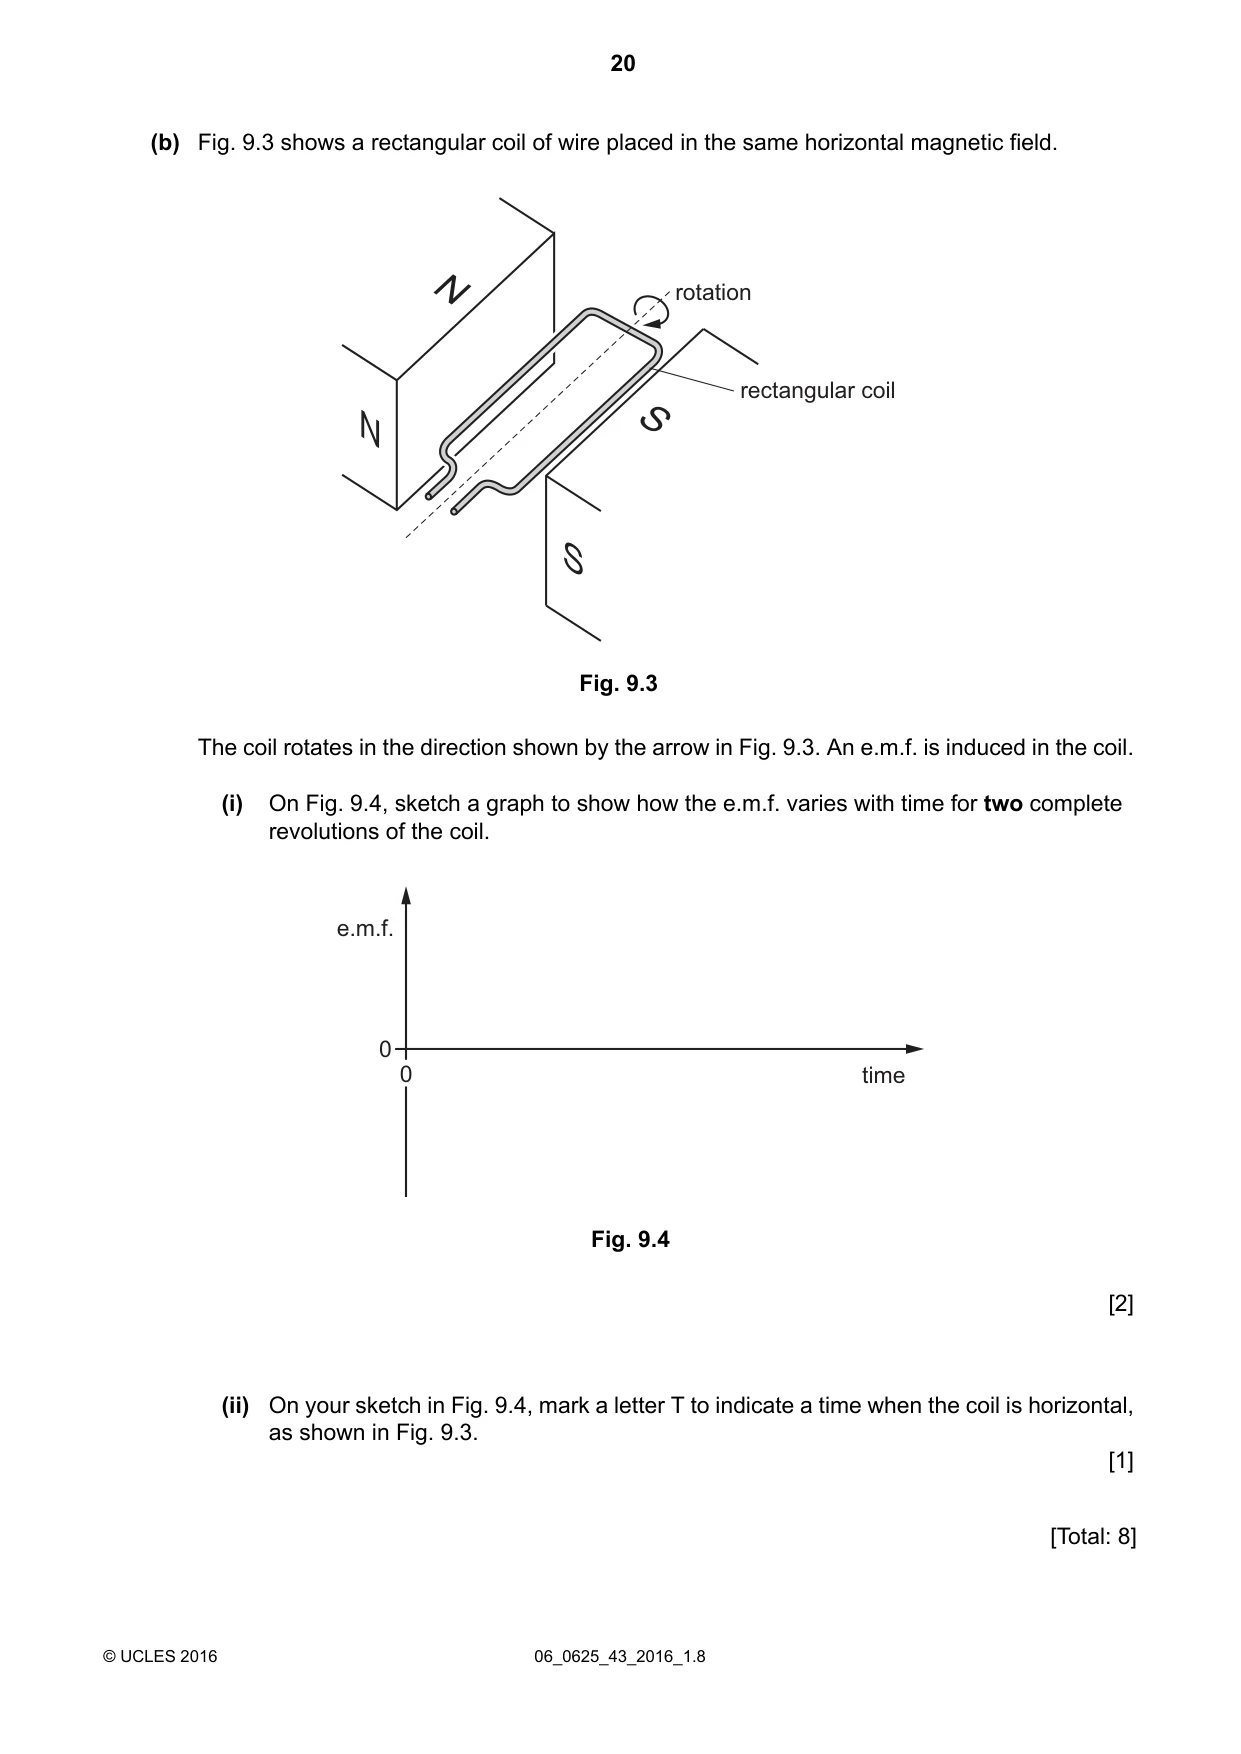
9 The two ends of a metal rod are connected by copper wire to a very sensitive ammeter. The rod is placed horizontally in the horizontal magnetic field between the N-pole and S-pole of a permanent magnet, as shown in Fig. 9.1. horizontal metal rod vertical N movement S N A sensitive ammeter magnet S magnet Fig. 9.1 (a) The rod is moved upwards at constant speed in the direction shown by the arrow in Fig. 9.1. An e.m.f. is induced in the rod. (i) State two factors that determine the size of the induced e.m.f. 1. ............................................................................................................................ 2. ............................................................................................................................ [2] (ii) The size of the current in the ammeter depends on the size of the induced e.m.f. State one other factor that affects the size of the current. ................................................................................................................................ [1] (iii) The direction of motion of the rod is now changed . It moves at a constant speed towards the N-pole, as shown in Fig. 9.2. horizontal movement N S N A S Fig. 9.2 State and explain what happens to the induced e.m.f. ................................................................................................................................ ................................................................................................................................ ................................................................................................................................ [2] (b) Fig. 9.3 shows a rectangular coil of wire placed in the same horizontal magnetic field. rotation N rectangular coil S N S Fig. 9.3 The coil rotates in the direction shown by the arrow in Fig. 9.3. An e.m.f. is induced in the coil. (i) On Fig. 9.4, sketch a graph to show how the e.m.f. varies with time for two complete revolutions of the coil. e.m.f. 0 0 time Fig. 9.4 [2] (ii) On your sketch in Fig. 9.4, mark a letter T to indicate a time when the coil is horizontal, as shown in Fig. 9.3. [1] [Total: 8]
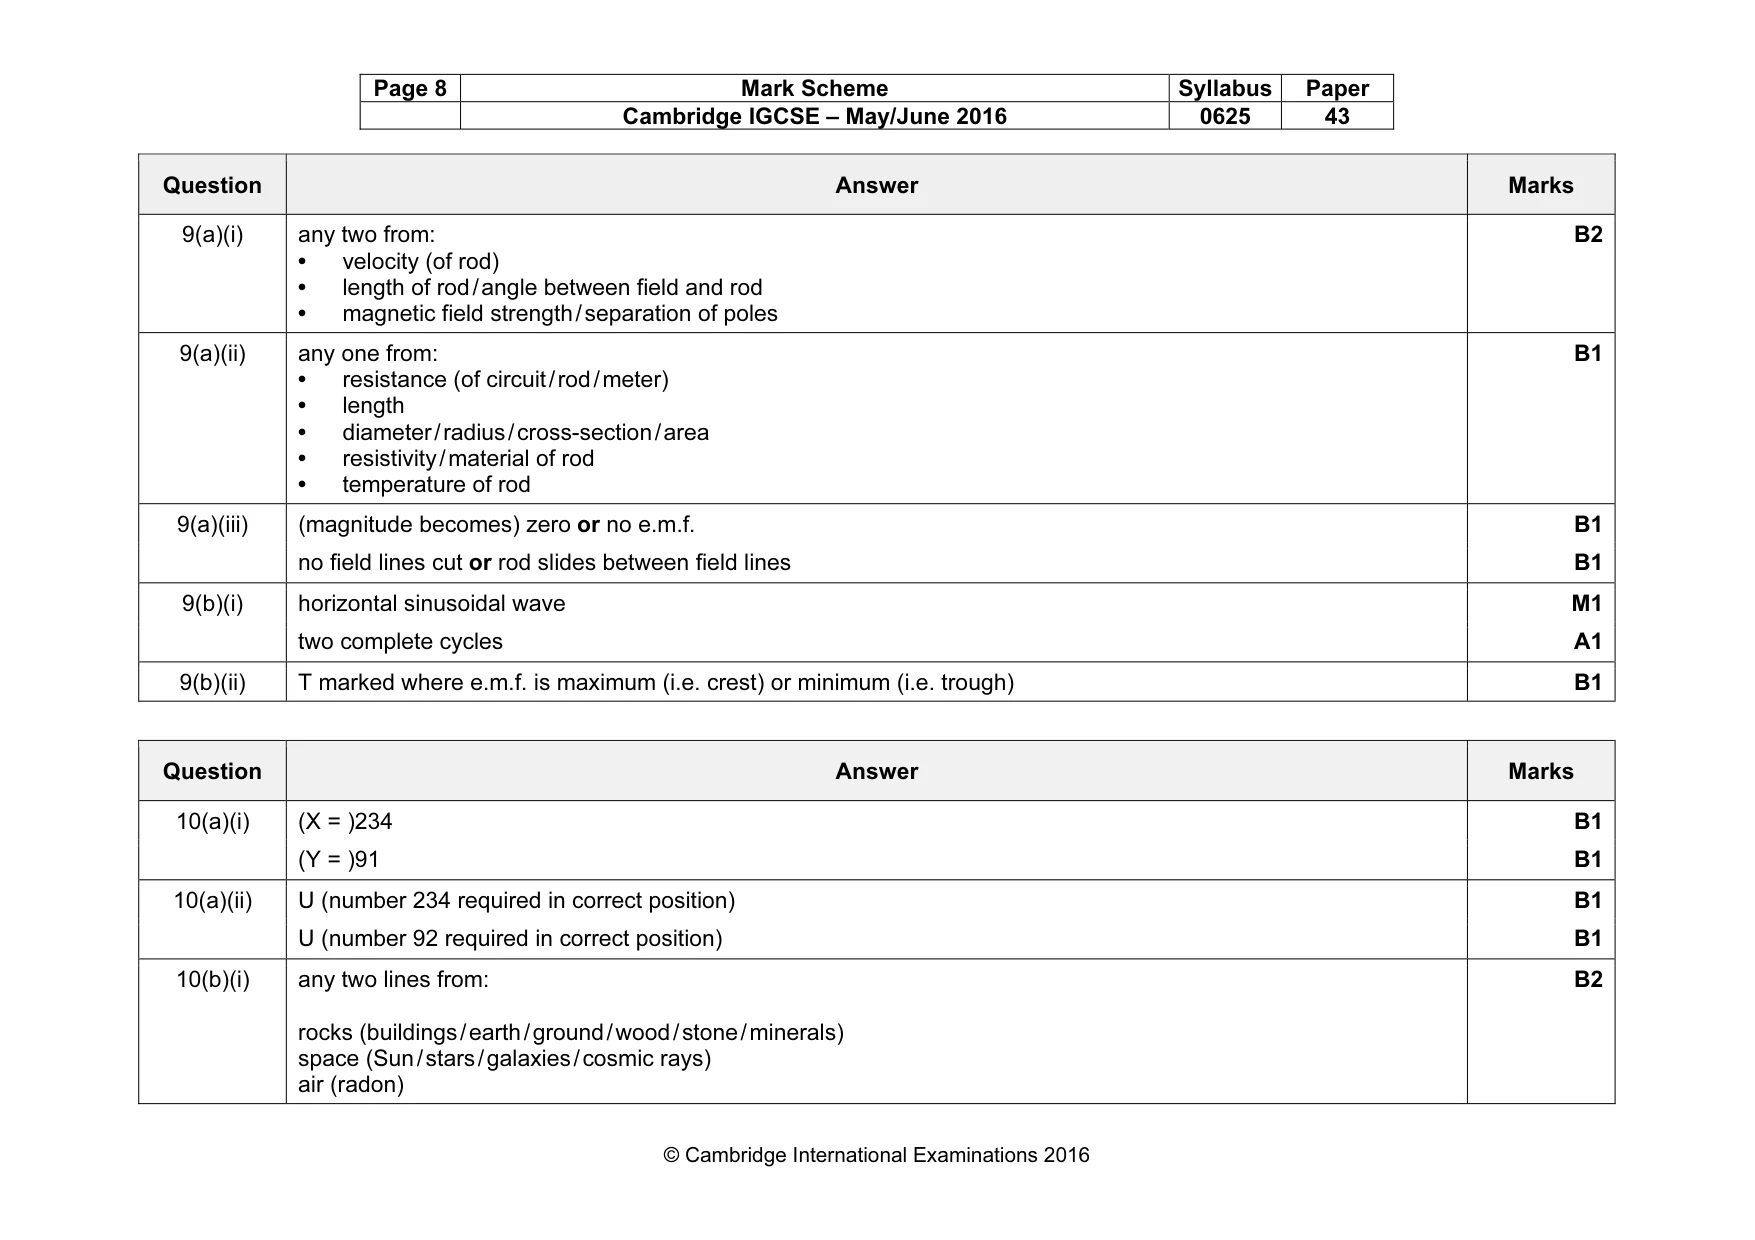
Mark scheme: 9(a)(i) any two from: • velocity (of rod) • length of rod / angle between field and rod • magnetic field strength / separation of poles B2 9(a)(ii) any one from: • resistance (of circuit / rod / meter) • length • diameter / radius / cross-section / area • resistivity / material of rod • temperature of rod B1 9(a)(iii) (magnitude becomes) zero or no e.m.f. B1 no field lines cut or rod slides between field lines B1 9(b)(i) horizontal sinusoidal wave M1 two complete cycles A1 9(b)(ii) T marked where e.m.f. is maximum (i.e. crest) or minimum (i.e. trough) B1
Q10 · A sample contains atoms of a particular isotope of protactinium
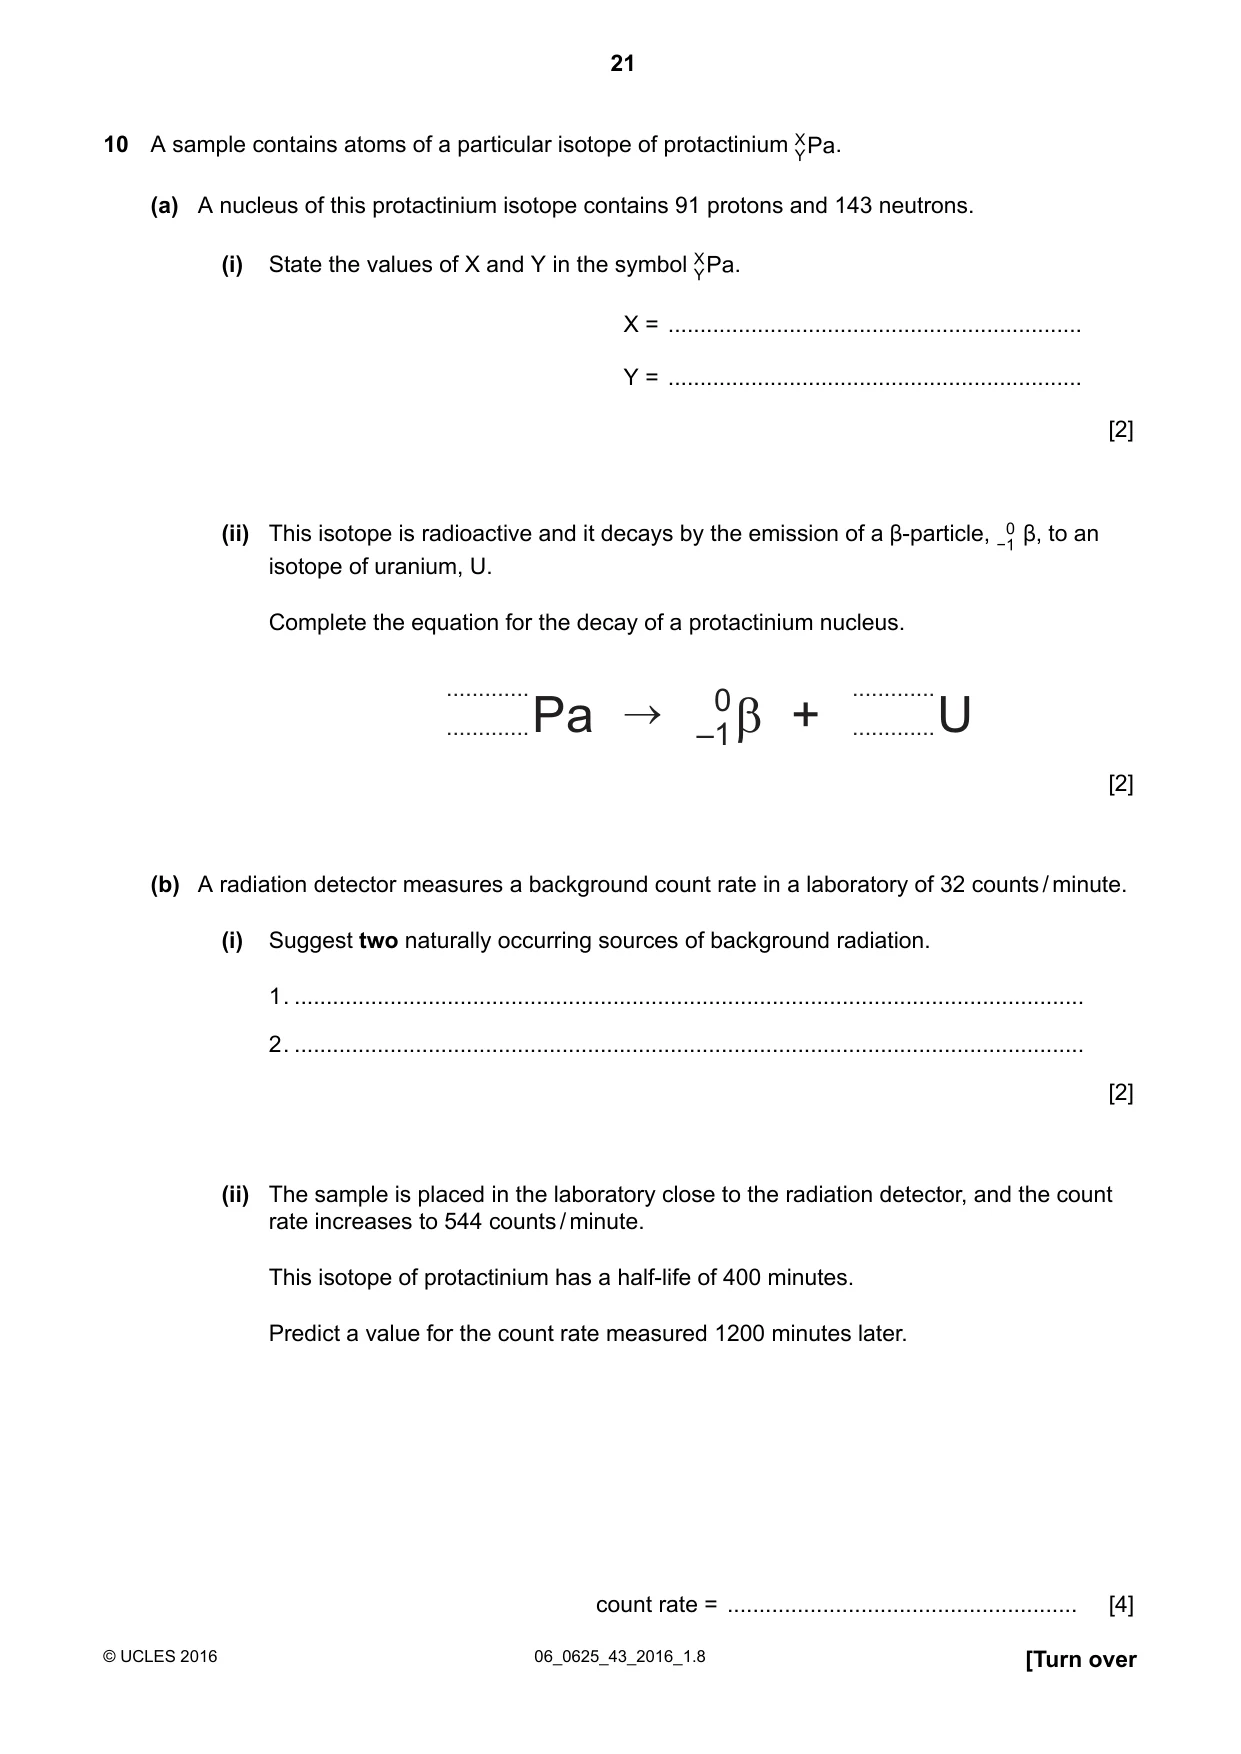
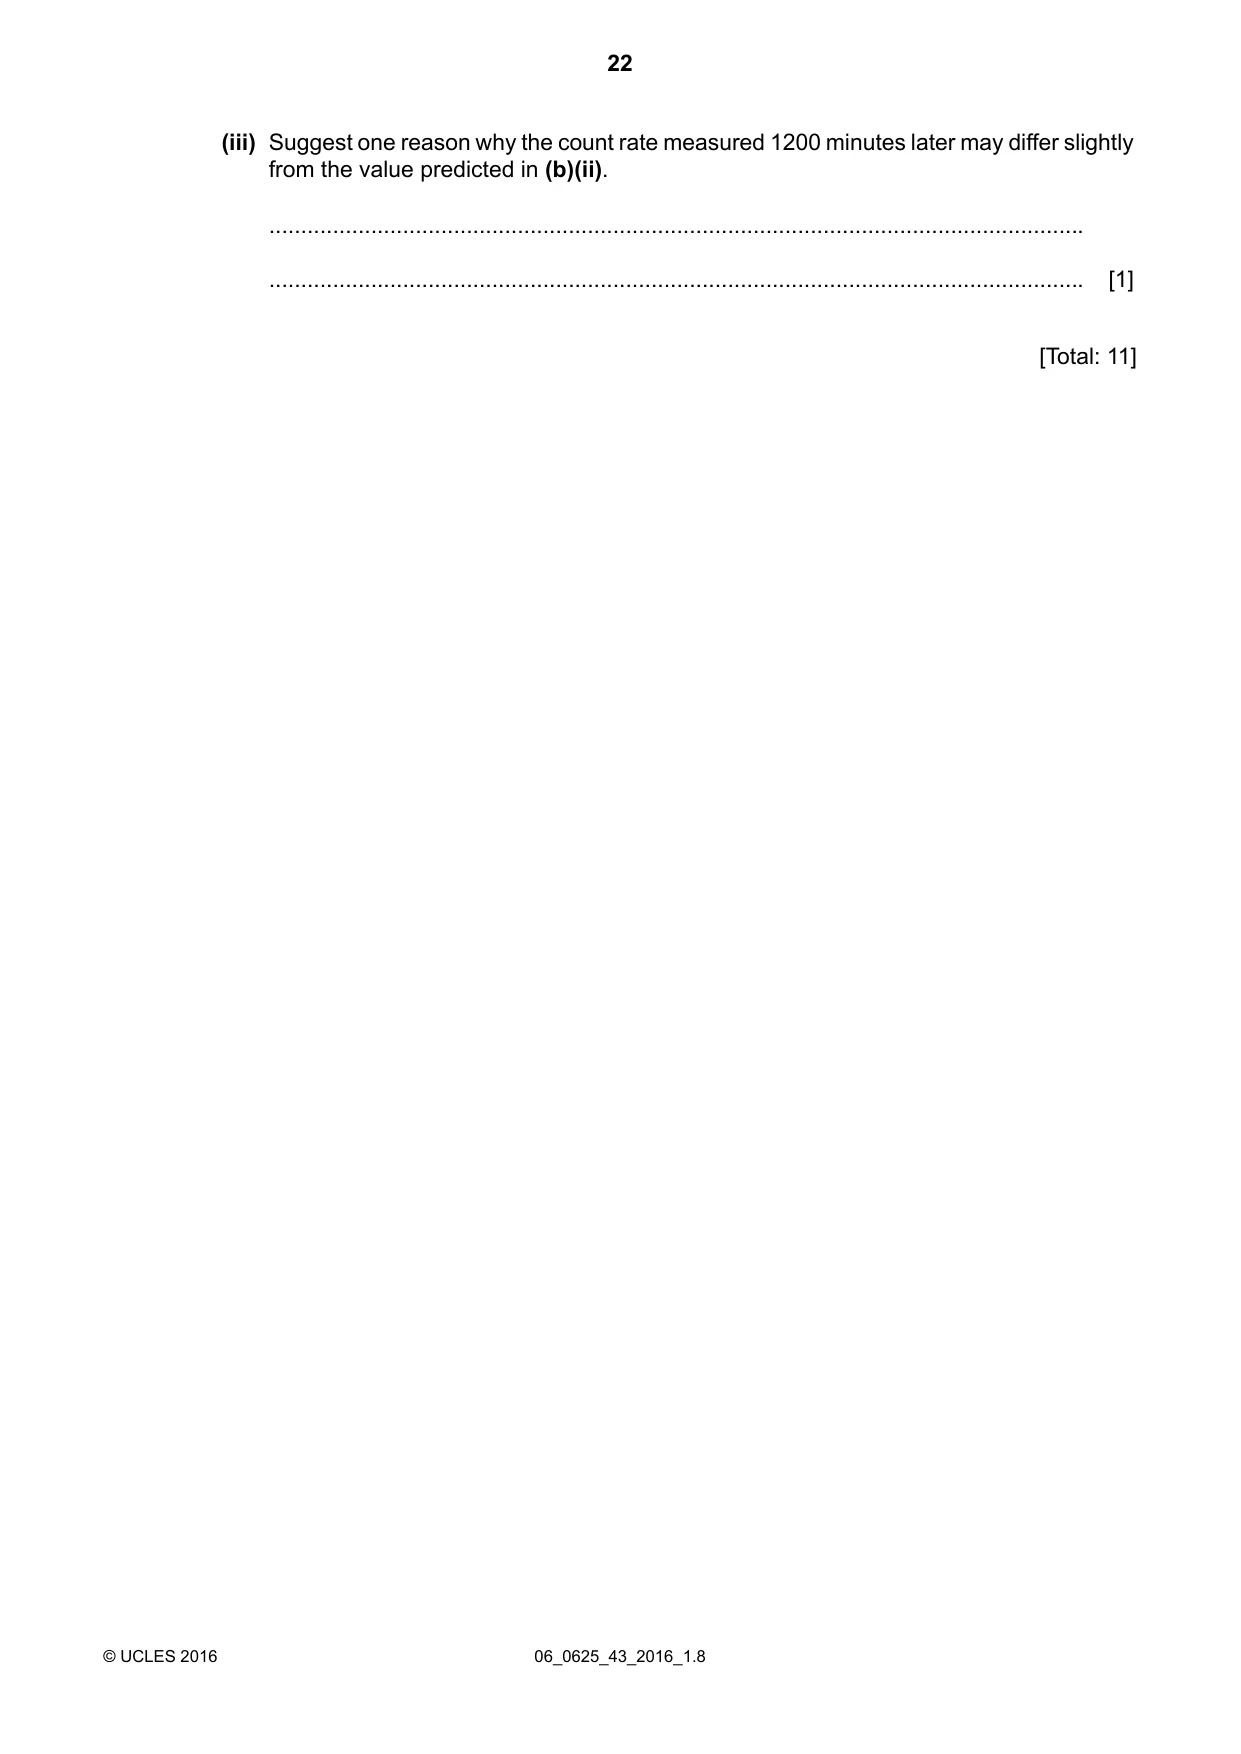
10 A sample contains atoms of a particular isotope of protactinium . (a) A nucleus of this protactinium isotope contains 91 protons and 143 neutrons. (i) State the values of X and Y in the symbol . X = ................................................................. Y = ................................................................. [2] (ii) This isotope is radioactive and it decays by the emission of a β-particle, β, to an isotope of uranium, U. Complete the equation for the decay of a protactinium nucleus. ............. ............. 0 ............. Pa β + ............. U –1 [2] (b) A radiation detector measures a background count rate in a laboratory of 32 counts/minute. (i) Suggest two naturally occurring sources of background radiation. 1. ............................................................................................................................ 2. ............................................................................................................................ [2] (ii) The sample is placed in the laboratory close to the radiation detector, and the count rate increases to 544 counts/minute. This isotope of protactinium has a half-life of 400 minutes. Predict a value for the count rate measured 1200 minutes later. count rate = ....................................................... [4] (iii) Suggest one reason why the count rate measured 1200 minutes later may differ slightly from the value predicted in (b)(ii). ................................................................................................................................ ................................................................................................................................ [1] [Total: 11]
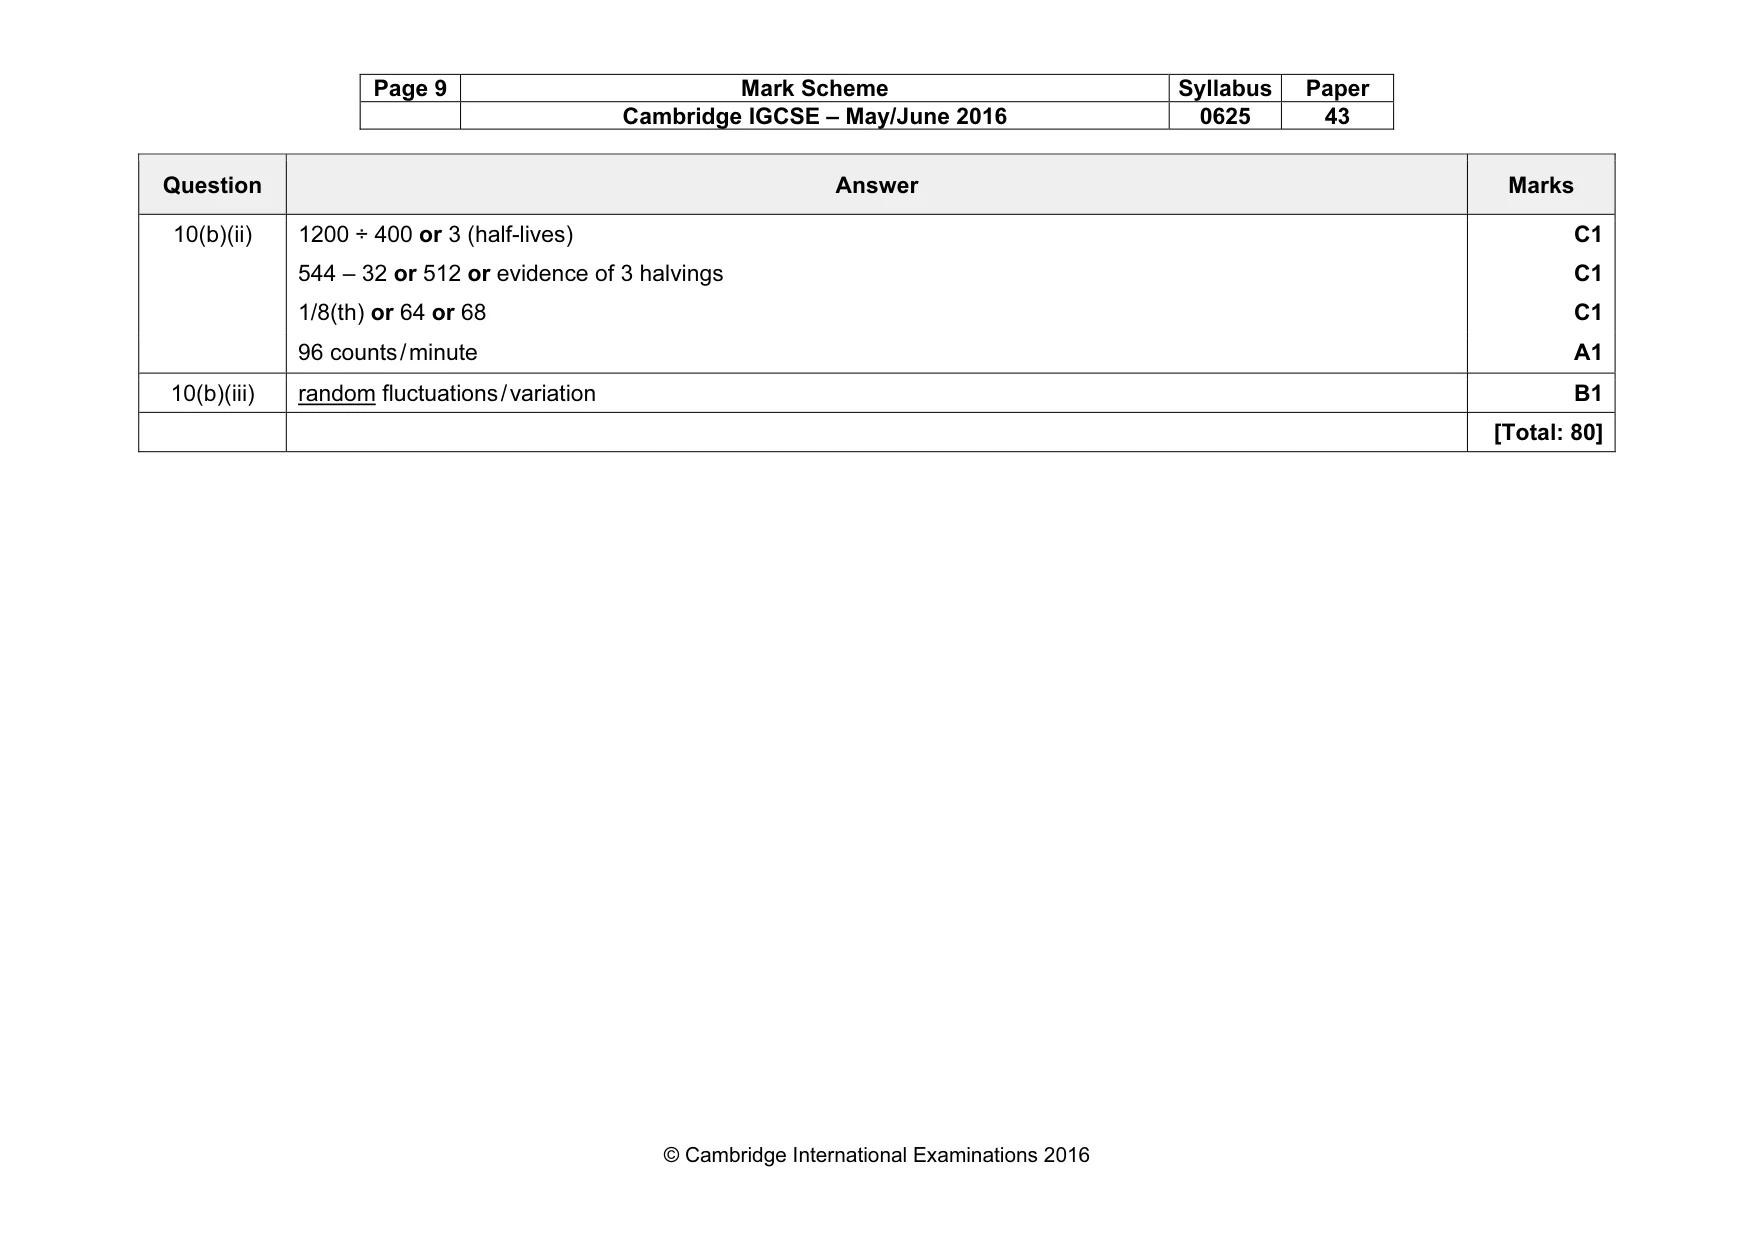
Mark scheme: 10(a)(i) (X = )234 B1 (Y = )91 B1 10(a)(ii) U (number 234 required in correct position) B1 U (number 92 required in correct position) B1 10(b)(i) any two lines from: rocks (buildings / earth / ground / wood / stone / minerals) space (Sun / stars / galaxies / cosmic rays) air (radon) B2 Question Answer Marks 10(b)(ii) 1200 ÷ 400 or 3 (half-lives) C1 544 – 32 or 512 or evidence of 3 halvings C1 1/8(th) or 64 or 68 C1 96 counts / minute A1 10(b)(iii) random fluctuations / variation B1 [Total: 80]
What was in this paper
The subtopics covered by these 10 questions, and how many questions each got. Open one in a new tab to see every Cambridge question on it.
What you needed in this session
Cambridge’s own grade thresholds for 2016 May/June, Paper 4 · Variant 3. A higher threshold means an easier paper — the bar moves with how the cohort did.