Cambridge IGCSE Physics 0625 — 2014 Oct/Nov Paper 3 · Variant 1
0625/31/O/N/14 · 11 questions · 80 marks · ≈90 min
The question paper and its mark scheme, free to read here and free to download. This is Cambridge’s own paper, exactly as it was sat.
Question paper20 pages

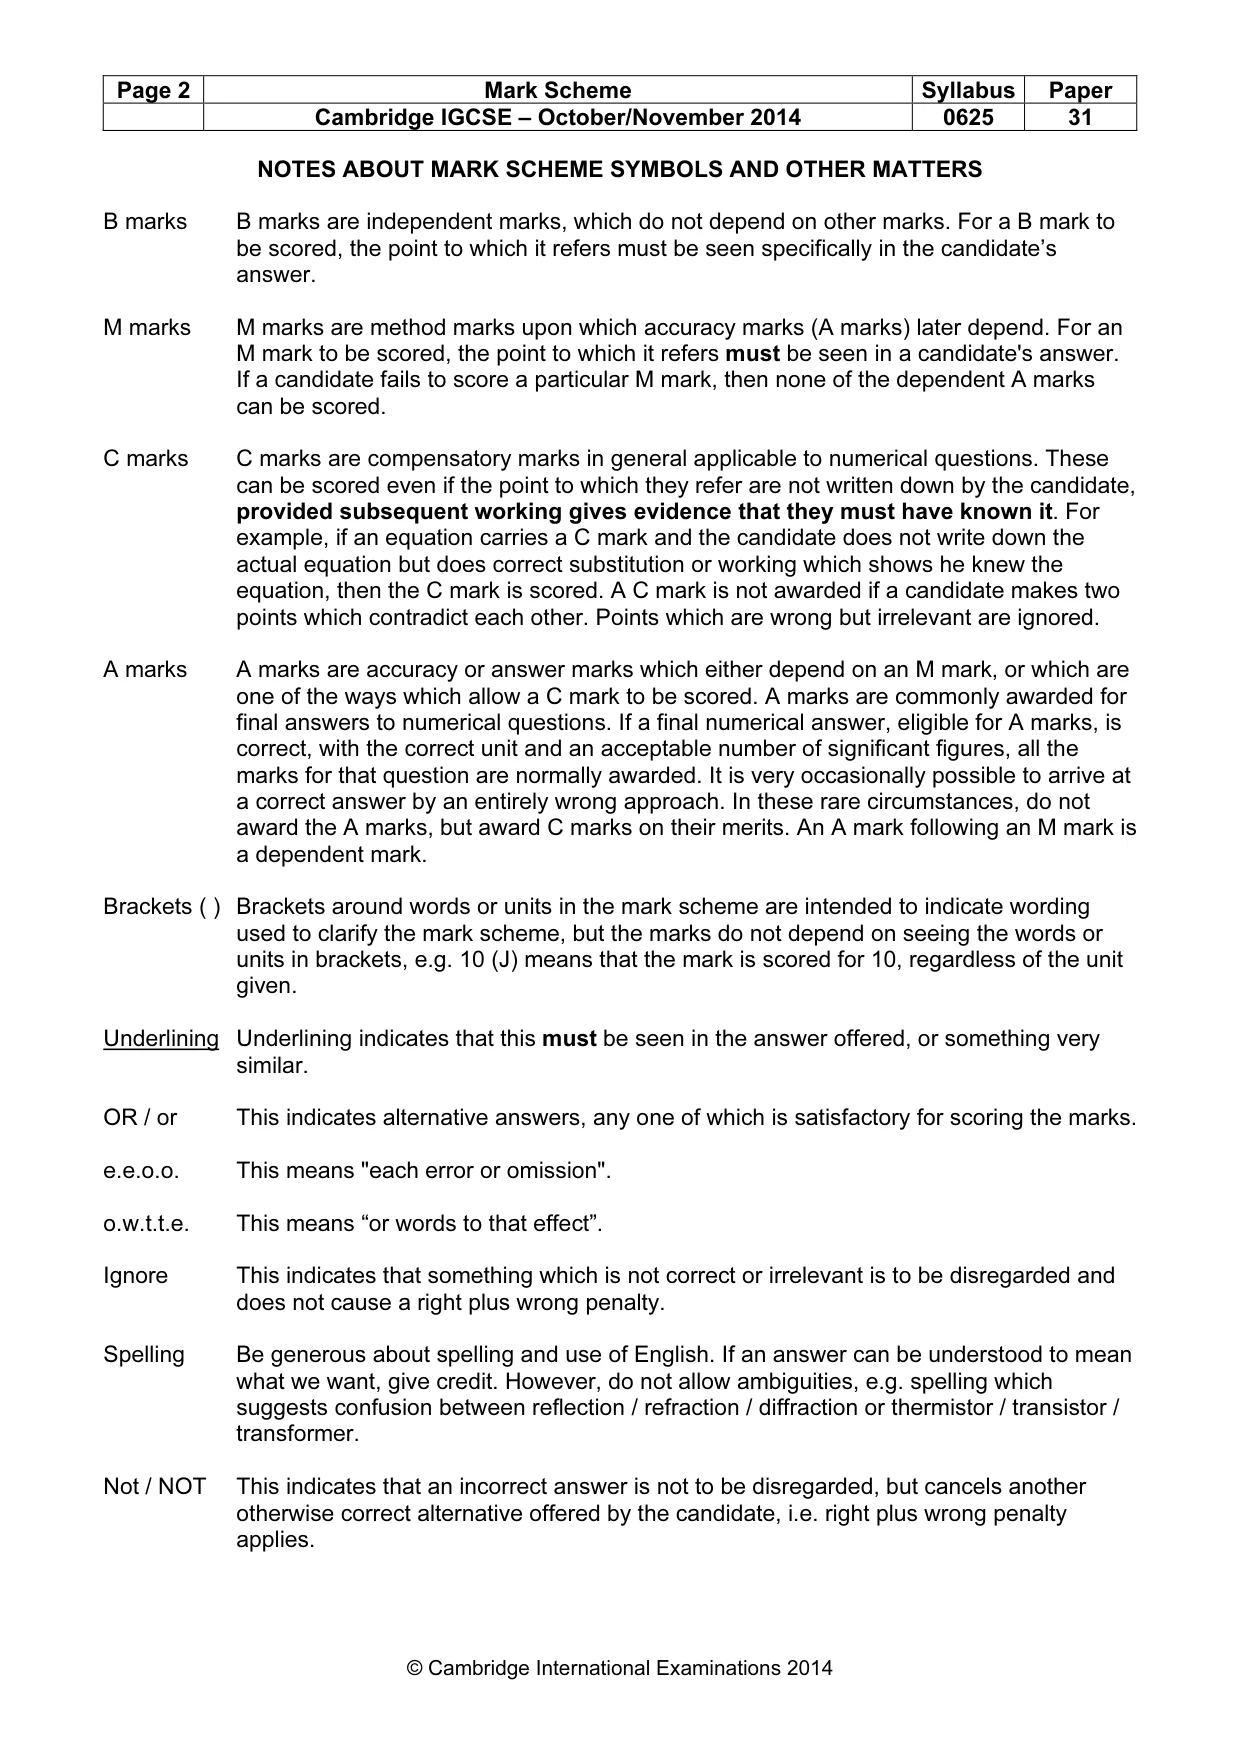
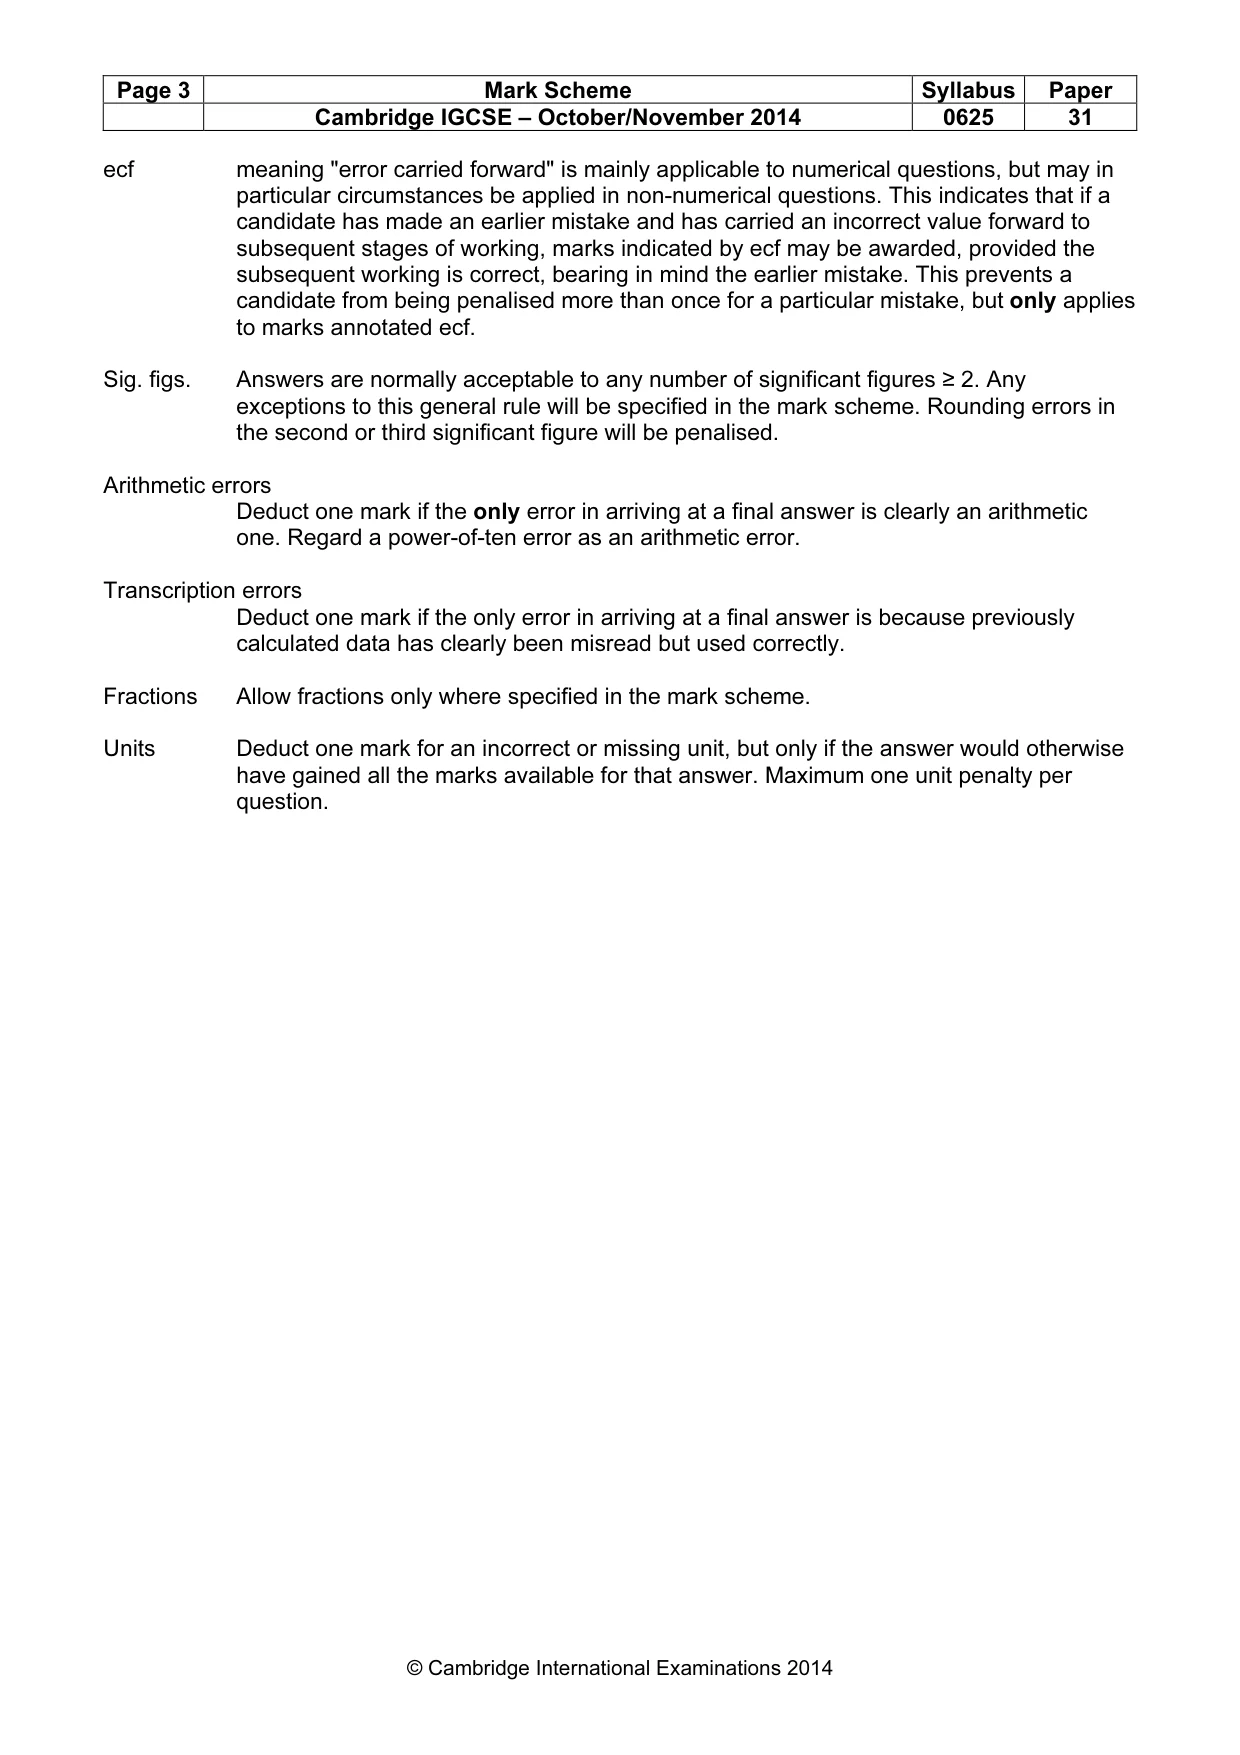
Mark scheme7 pages
Answers below. Sit the paper first if you are practising.
Questions as text
Q1 · The distance-time graphs for three different objects A, B and C
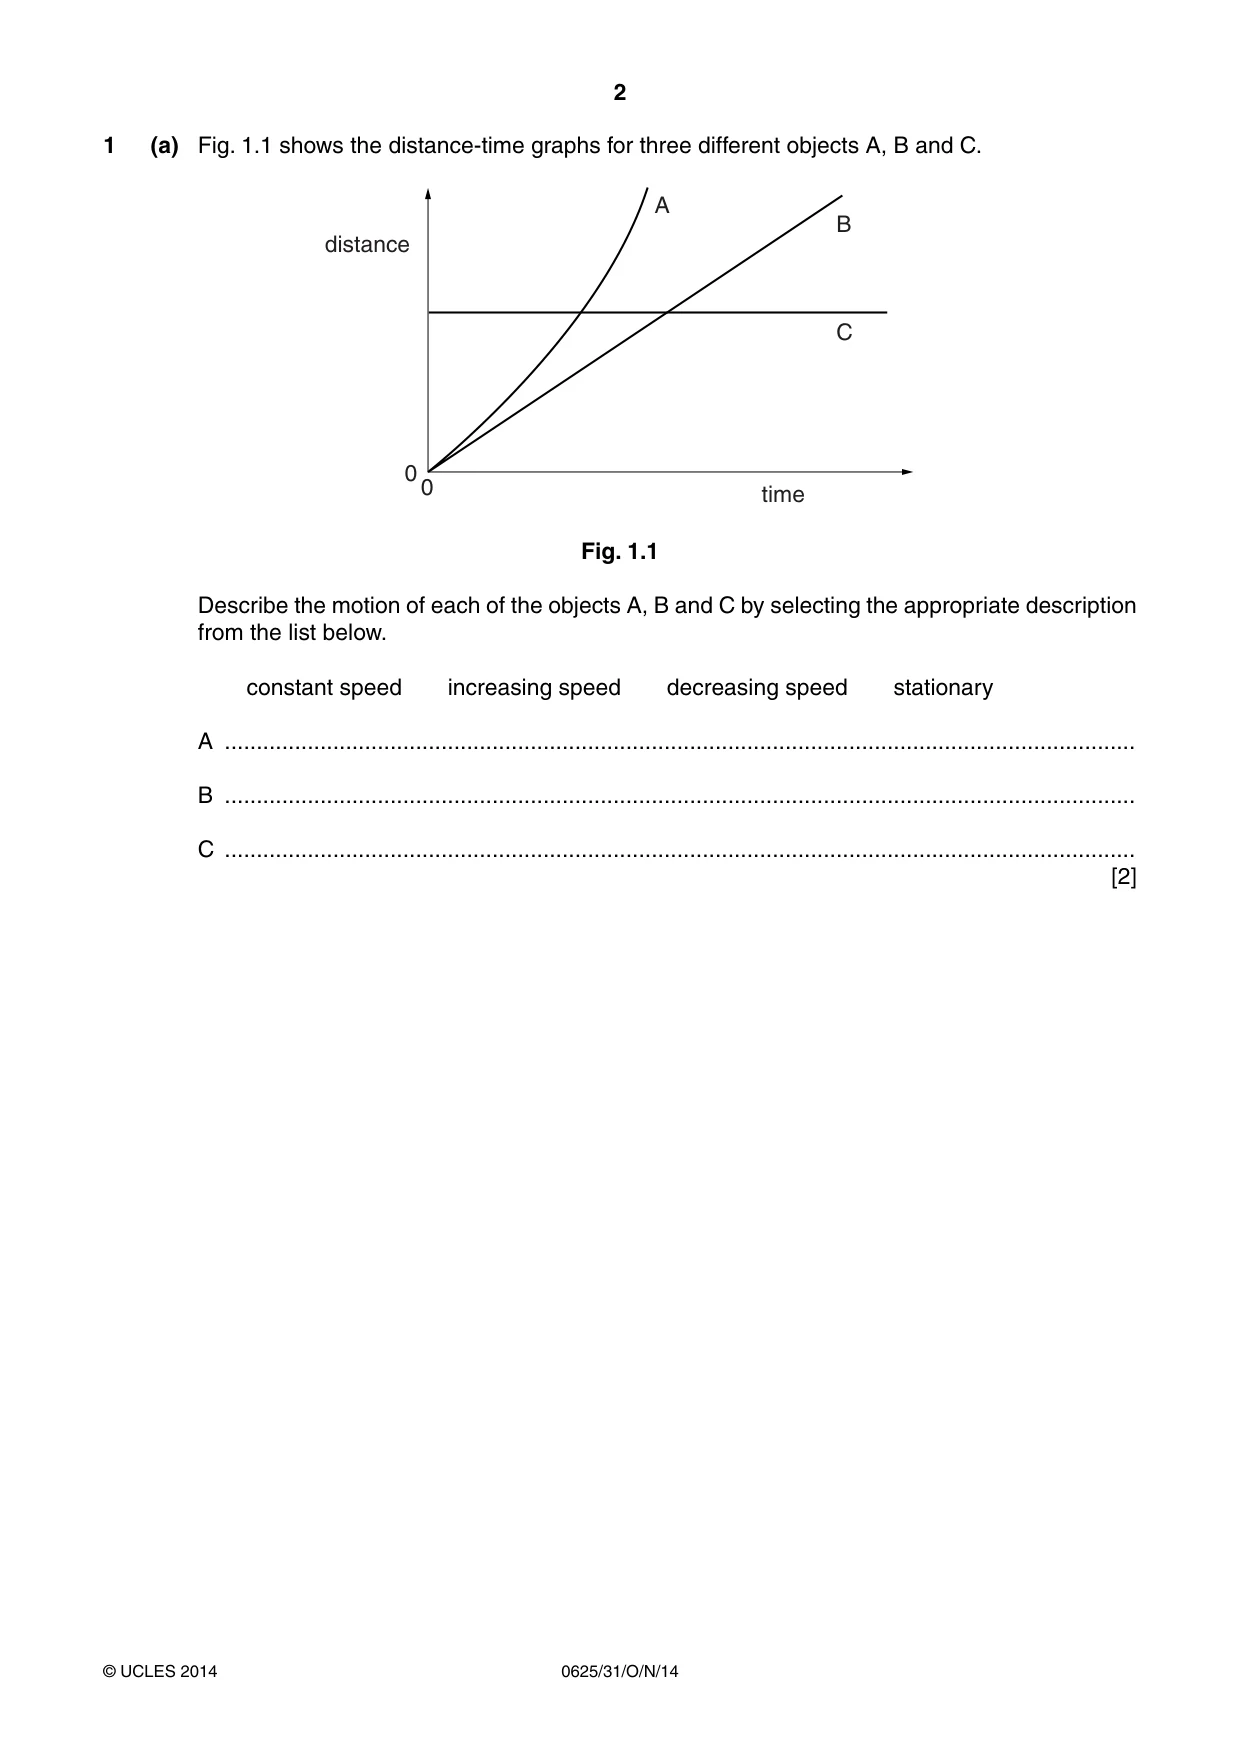
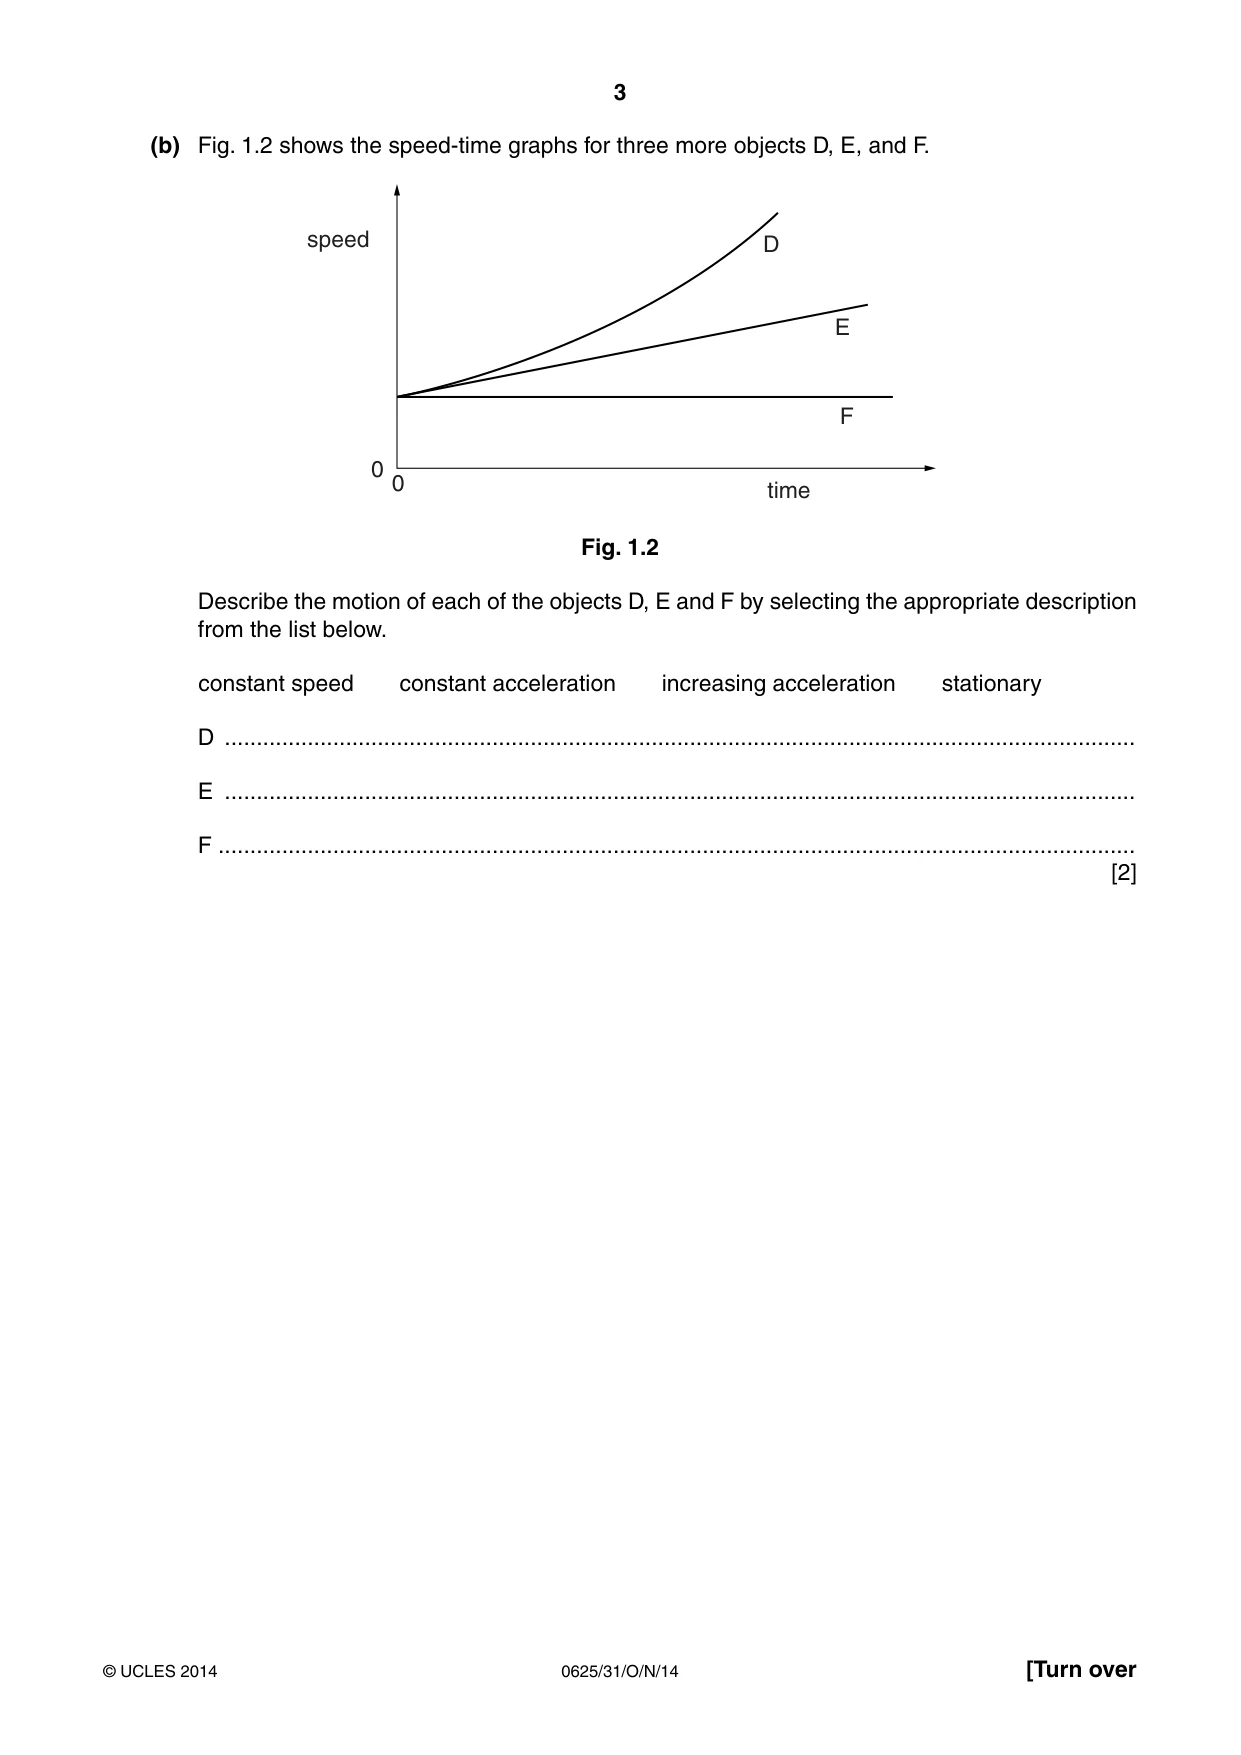
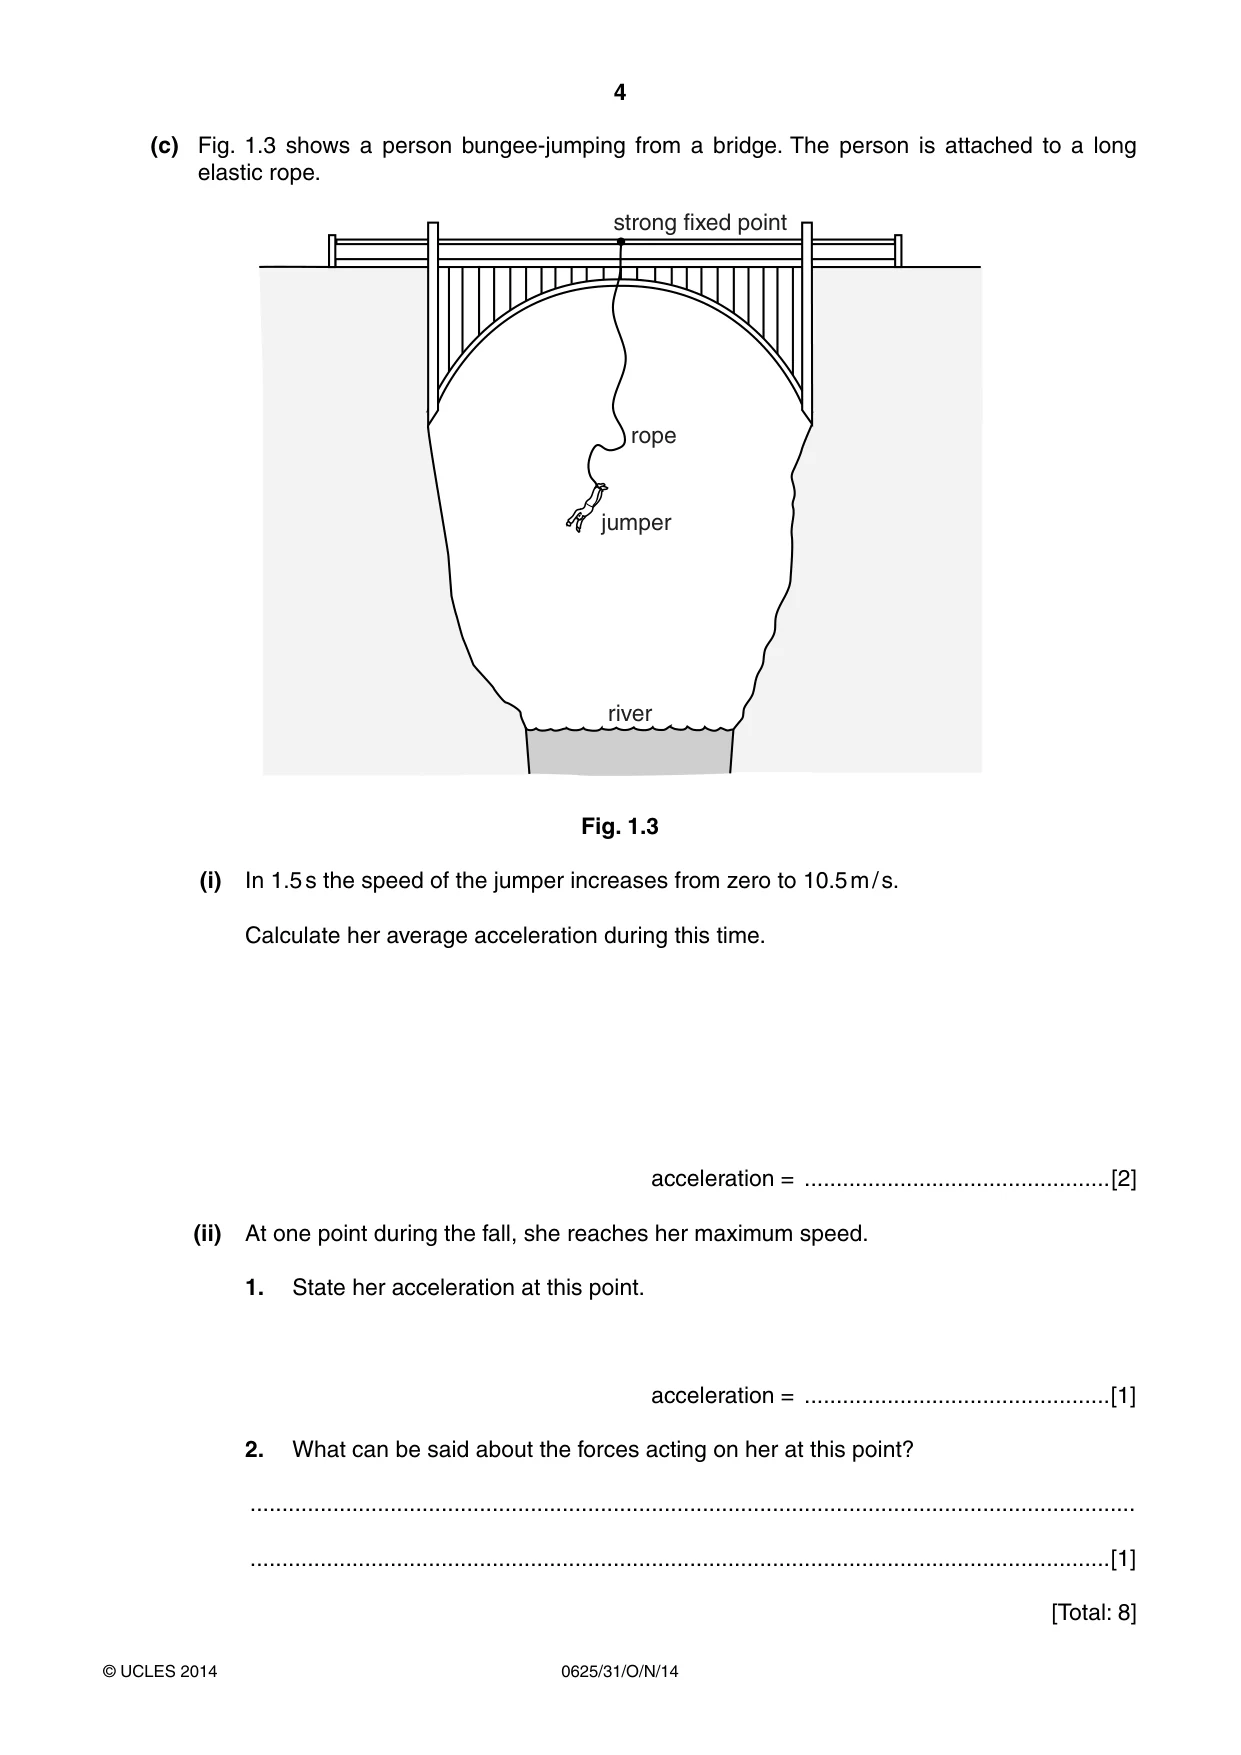
1 (a) Fig. 1.1 shows the distance-time graphs for three different objects A, B and C. A B distance C 00 time Fig. 1.1 Describe the motion of each of the objects A, B and C by selecting the appropriate description from the list below. constant speed increasing speed decreasing speed stationary A ............................................................................................................................................... B ............................................................................................................................................... C ............................................................................................................................................... [2] (b) Fig. 1.2 shows the speed-time graphs for three more objects D, E, and F. speed D E F 0 0 time Fig. 1.2 Describe the motion of each of the objects D, E and F by selecting the appropriate description from the list below. constant speed constant acceleration increasing acceleration stationary D ............................................................................................................................................... E ............................................................................................................................................... F ................................................................................................................................................ [2] (c) Fig. 1.3 shows a person bungee-jumping from a bridge. The person is attached to a long elastic rope. strong fixed point rope jumper river Fig. 1.3 (i) In 1.5 s the speed of the jumper increases from zero to 10.5 m / s. Calculate her average acceleration during this time. acceleration = ................................................[2] (ii) At one point during the fall, she reaches her maximum speed. 1. State her acceleration at this point. acceleration = ................................................[1] 2. What can be said about the forces acting on her at this point? ........................................................................................................................................... .......................................................................................................................................[1] [Total: 8] Turn over for Question 2
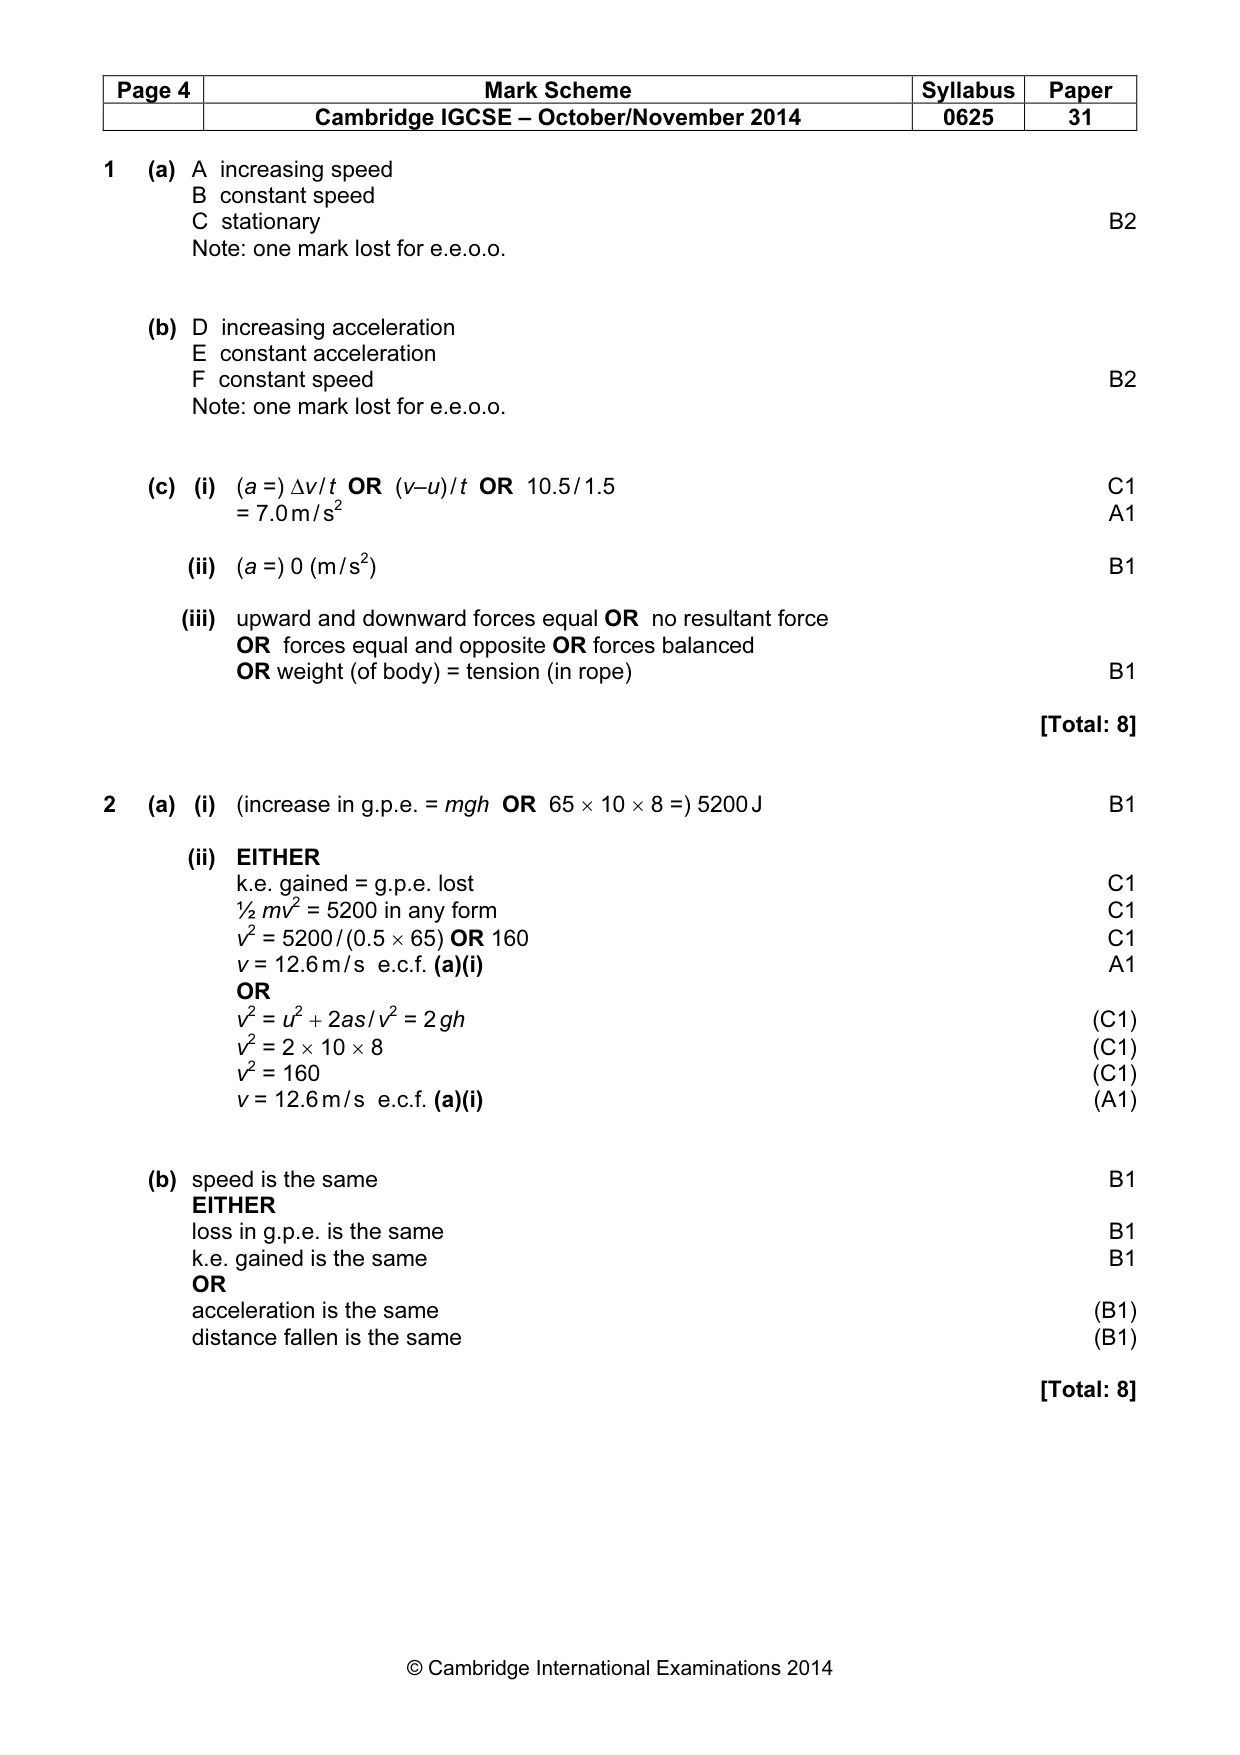
Mark scheme: 1 (a) A increasing speed B constant speed C stationary B2 Note: one mark lost for e.e.o.o. (b) D increasing acceleration E constant acceleration F constant speed B2 Note: one mark lost for e.e.o.o. (c) (i) (a =) ∆v / t OR (v–u) / t OR 10.5 / 1.5 C1 = 7.0 m / s2 A1 (ii) (a =) 0 (m / s2) B1 (iii) upward and downward forces equal OR no resultant force OR forces equal and opposite OR forces balanced OR weight (of body) = tension (in rope) B1 [Total: 8]
Q2 · A diver climbs some steps on to a fixed platform above the surface of the water in a…
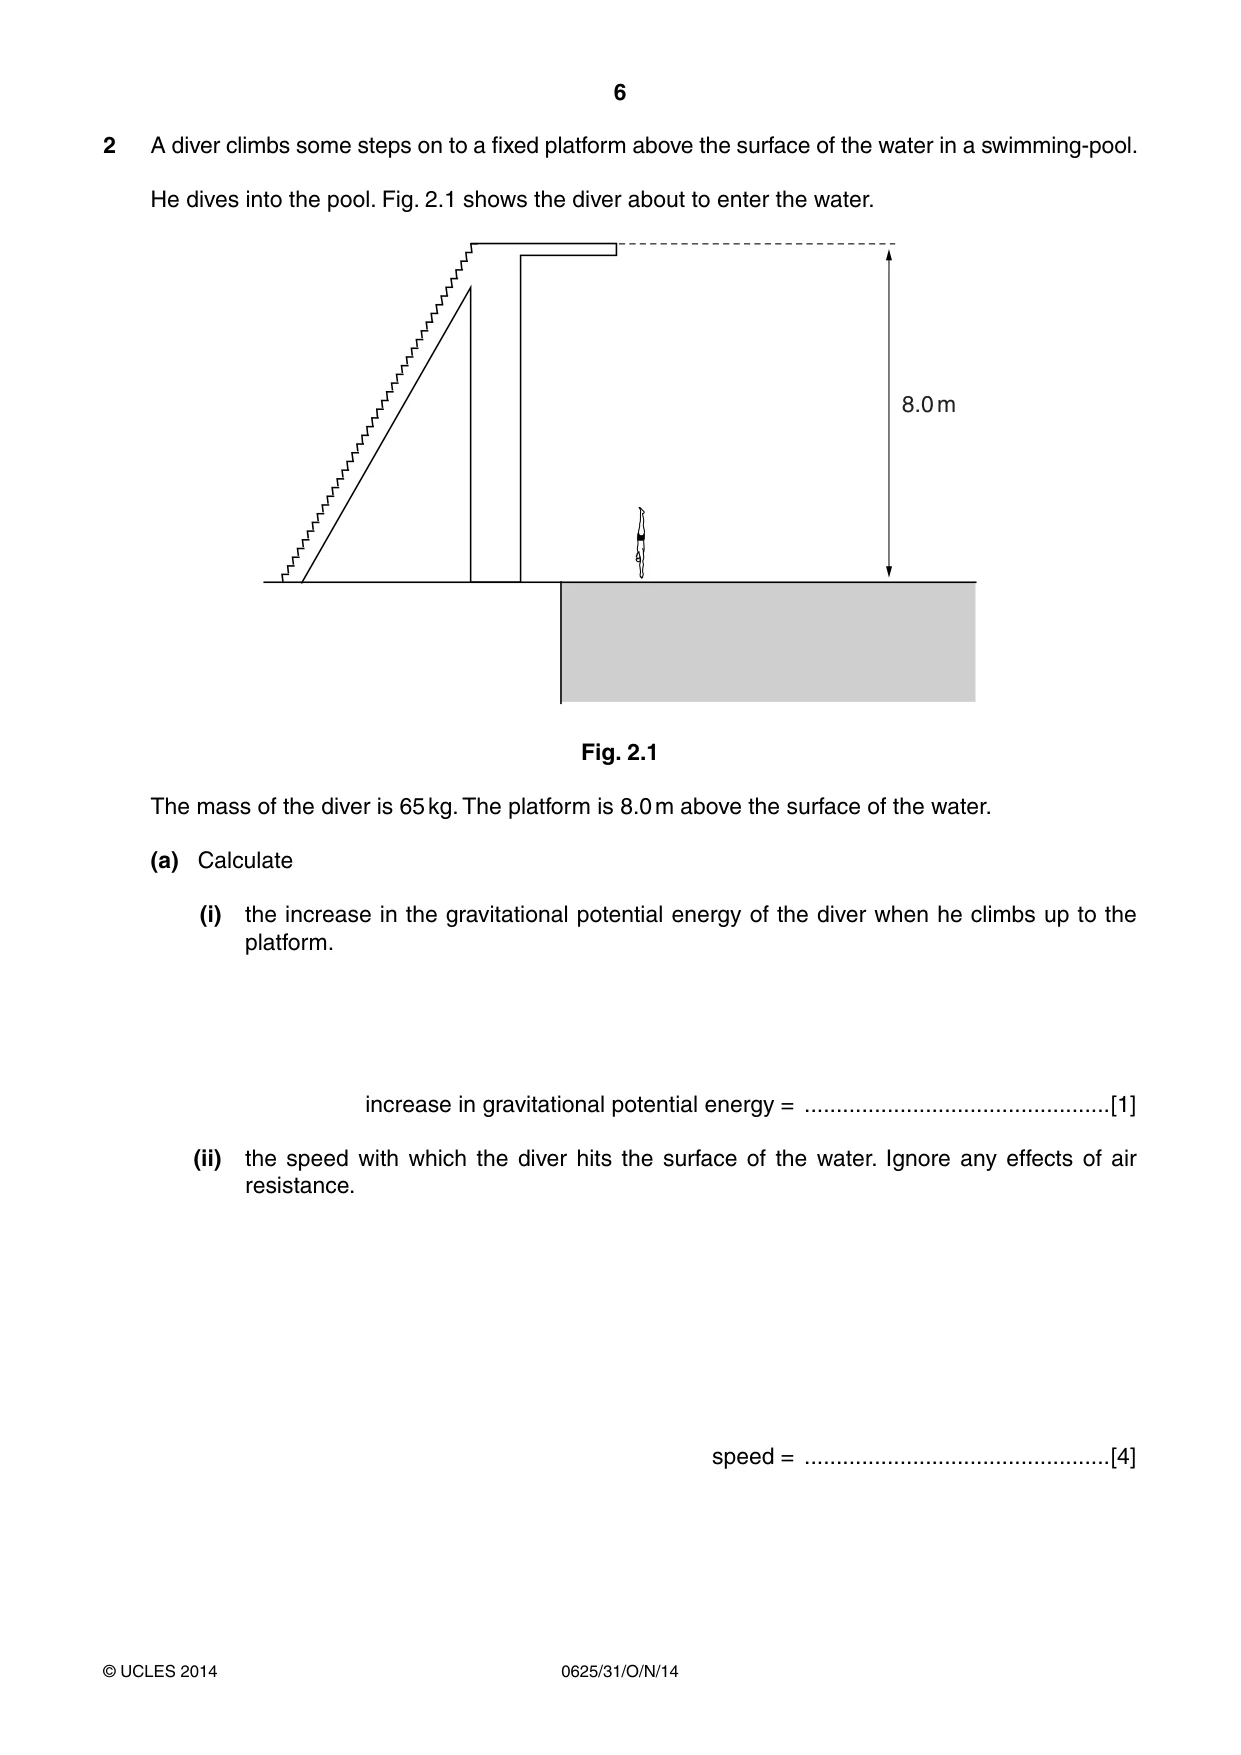
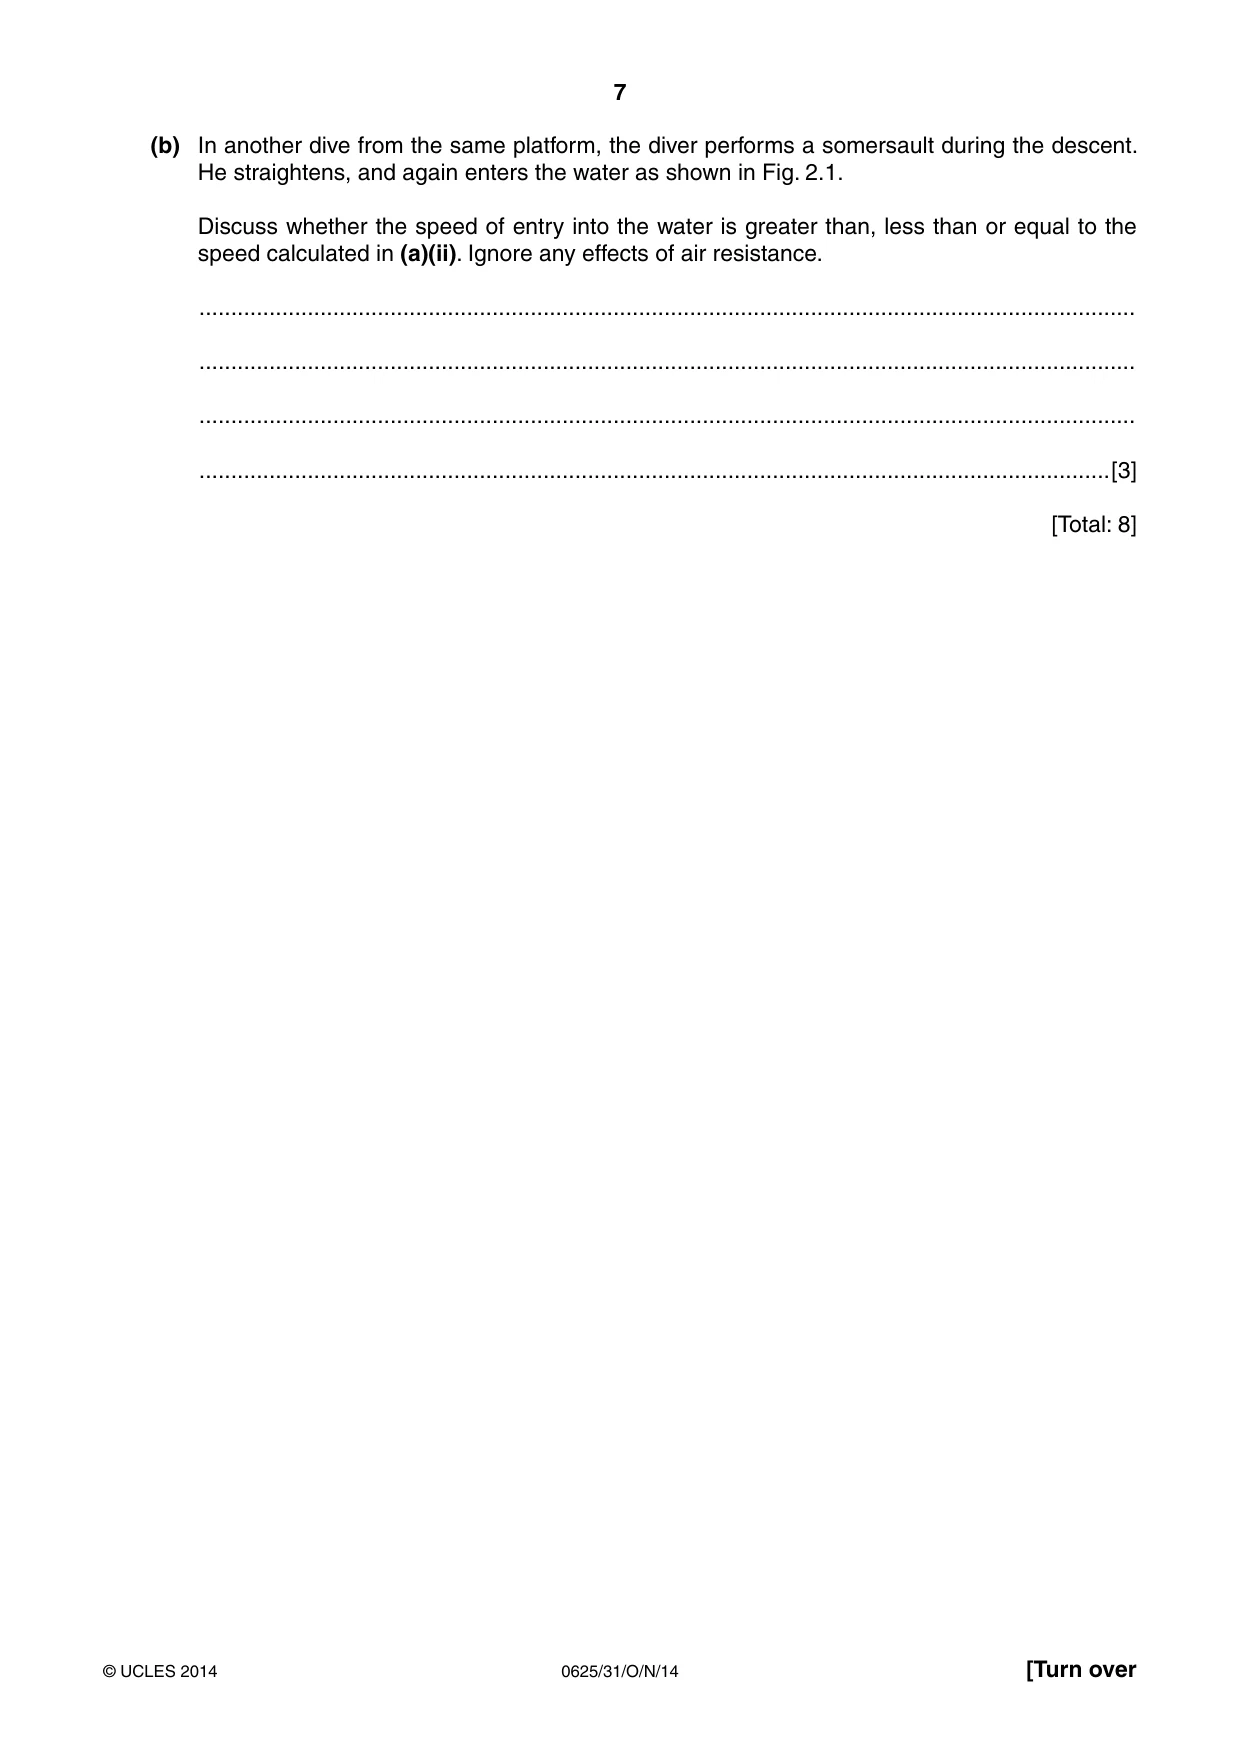
2 A diver climbs some steps on to a fixed platform above the surface of the water in a swimming-pool. He dives into the pool. Fig. 2.1 shows the diver about to enter the water. 8.0 m Fig. 2.1 The mass of the diver is 65 kg. The platform is 8.0 m above the surface of the water. (a) Calculate (i) the increase in the gravitational potential energy of the diver when he climbs up to the platform. increase in gravitational potential energy = ................................................[1] (ii) the speed with which the diver hits the surface of the water. Ignore any effects of air resistance. speed = ................................................[4] (b) In another dive from the same platform, the diver performs a somersault during the descent. He straightens, and again enters the water as shown in Fig. 2.1. Discuss whether the speed of entry into the water is greater than, less than or equal to the speed calculated in (a)(ii). Ignore any effects of air resistance. ................................................................................................................................................... ................................................................................................................................................... ................................................................................................................................................... ...............................................................................................................................................[3] [Total: 8]
Mark scheme: 2 (a) (i) (increase in g.p.e. = mgh OR 65 × 10 × 8 =) 5200 J B1 (ii) EITHER k.e. gained = g.p.e. lost C1 ½ mv2 = 5200 in any form C1 v2 = 5200 / (0.5 × 65) OR 160 C1 v = 12.6 m / s e.c.f. (a)(i) A1 OR v2 = u2 + 2as / v2 = 2 gh (C1) v2 = 2 × 10 × 8 (C1) v2 = 160 (C1) v = 12.6 m / s e.c.f. (a)(i) (A1) (b) speed is the same B1 EITHER loss in g.p.e. is the same B1 k.e. gained is the same B1 OR acceleration is the same (B1) distance fallen is the same (B1) [Total: 8]
Q3 · An oil can containing only air at atmospheric pressure
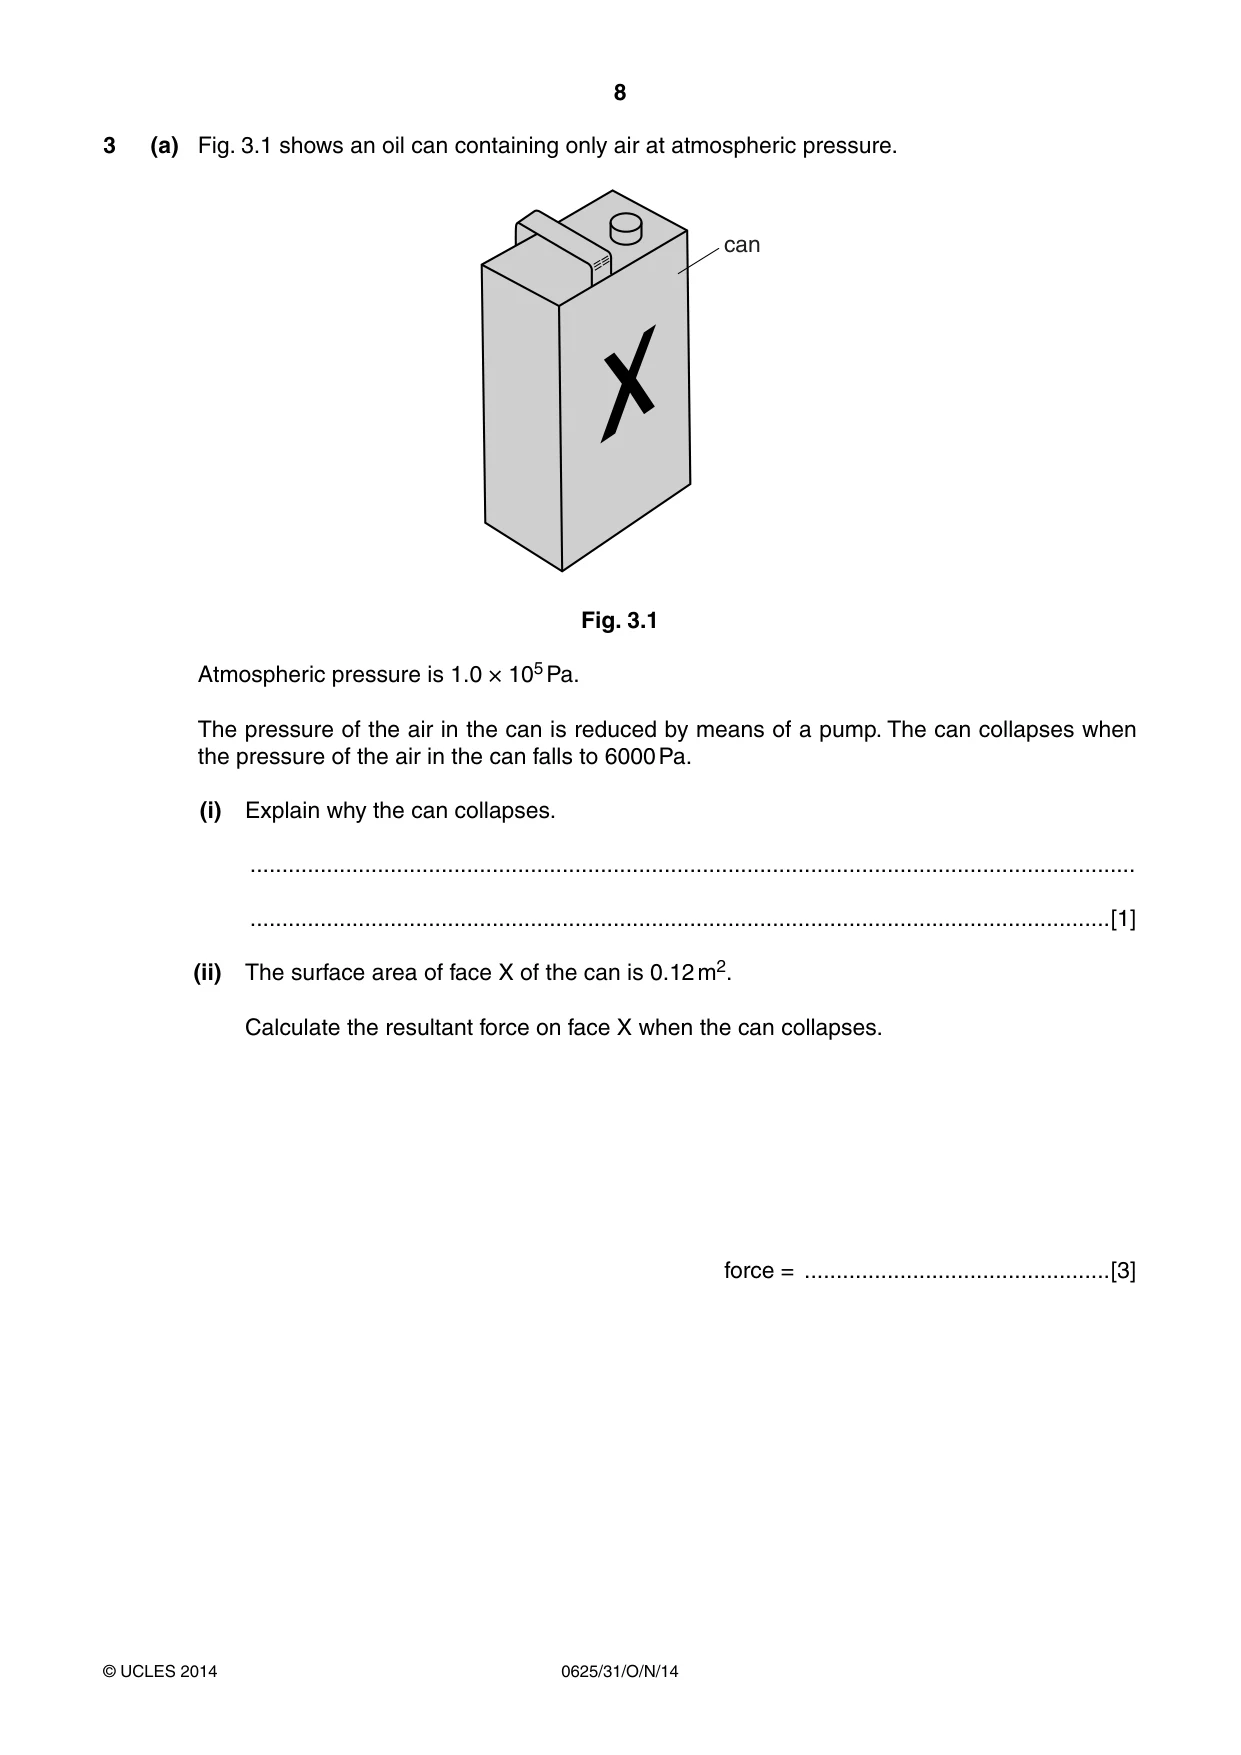
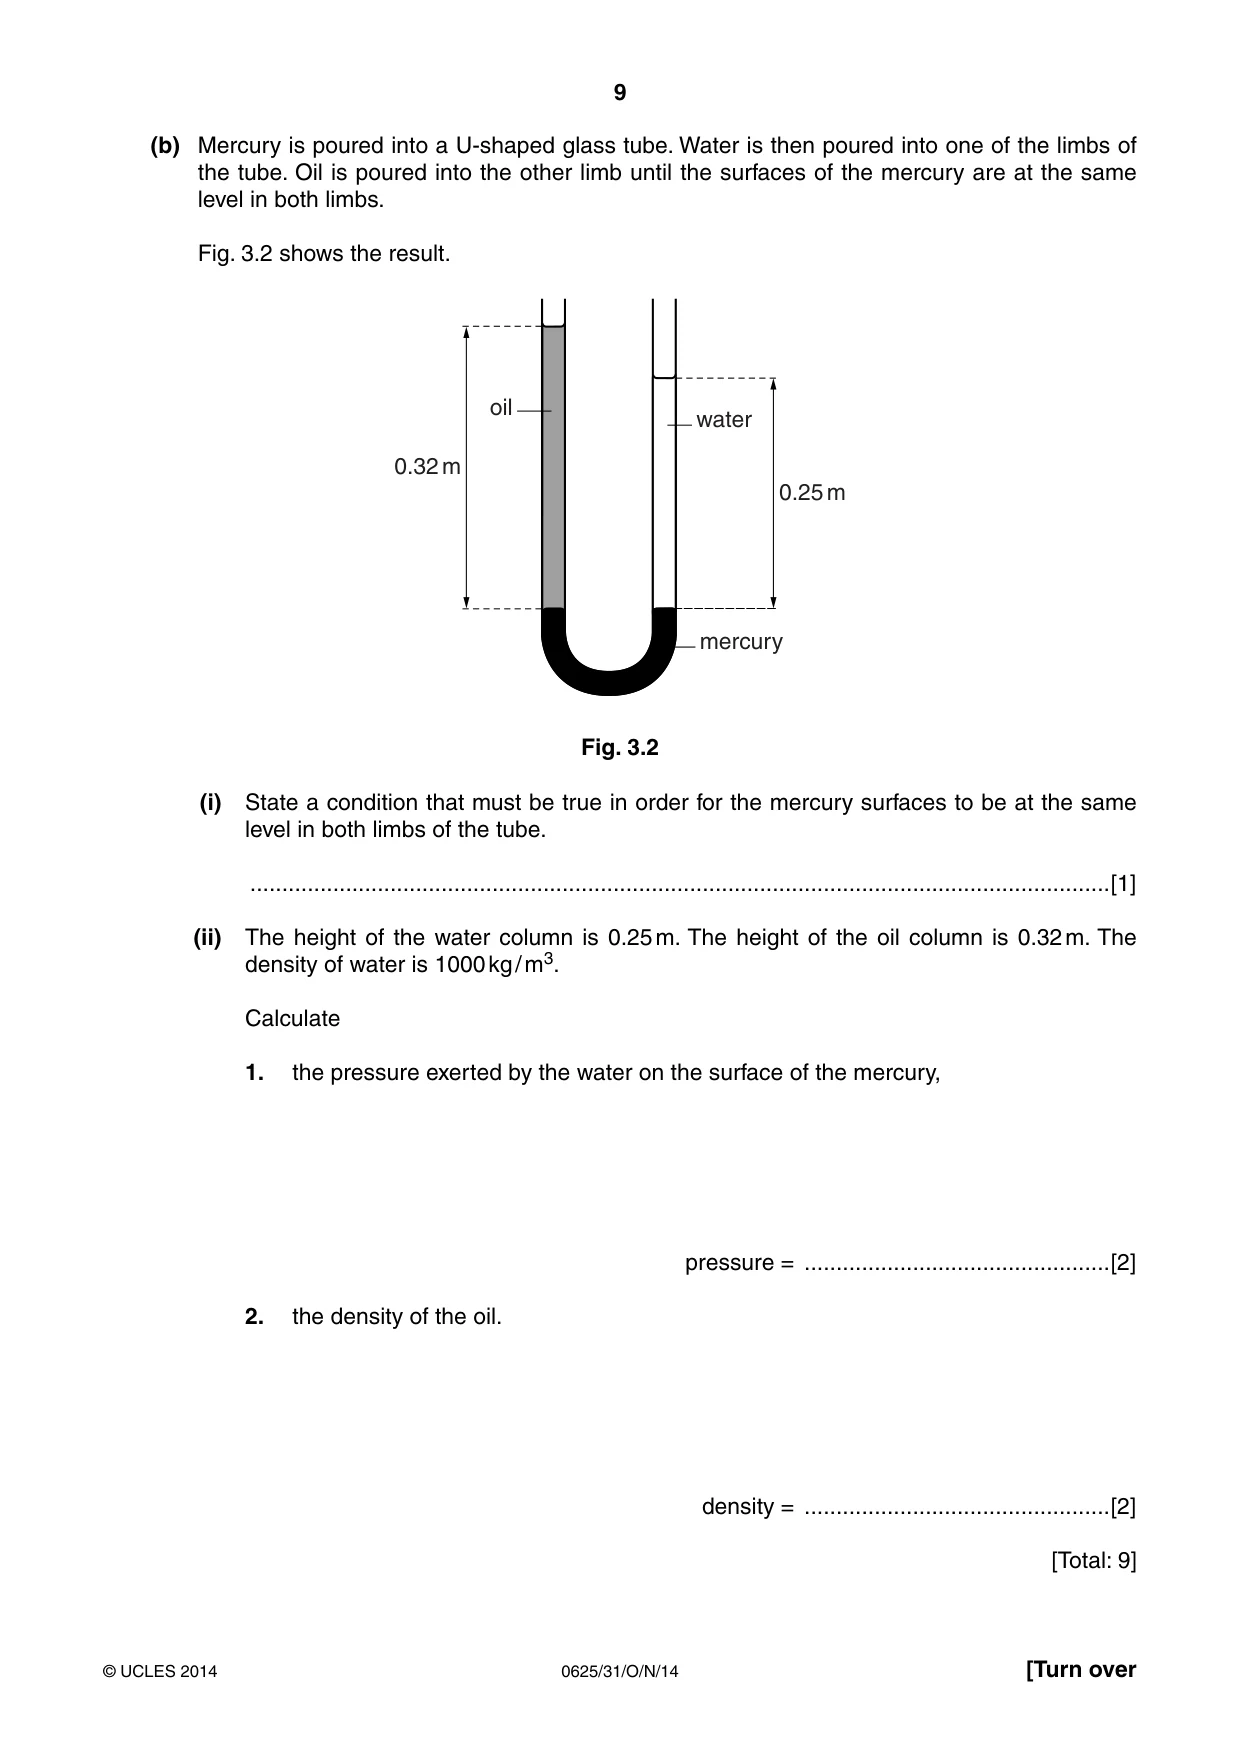
3 (a) Fig. 3.1 shows an oil can containing only air at atmospheric pressure. can Fig. 3.1 Atmospheric pressure is 1.0 × 10⁵ Pa. The pressure of the air in the can is reduced by means of a pump. The can collapses when the pressure of the air in the can falls to 6000 Pa. (i) Explain why the can collapses. ........................................................................................................................................... .......................................................................................................................................[1] (ii) The surface area of face X of the can is 0.12 m2. Calculate the resultant force on face X when the can collapses. force = ................................................[3] (b) Mercury is poured into a U-shaped glass tube. Water is then poured into one of the limbs of the tube. Oil is poured into the other limb until the surfaces of the mercury are at the same level in both limbs. Fig. 3.2 shows the result. oil water 0.32 m 0.25 m mercury Fig. 3.2 (i) State a condition that must be true in order for the mercury surfaces to be at the same level in both limbs of the tube. .......................................................................................................................................[1] (ii) The height of the water column is 0.25 m. The height of the oil column is 0.32 m. The density of water is 1000 kg / m3. Calculate 1. the pressure exerted by the water on the surface of the mercury, pressure = ................................................[2] 2. the density of the oil. density = ................................................[2] [Total: 9]
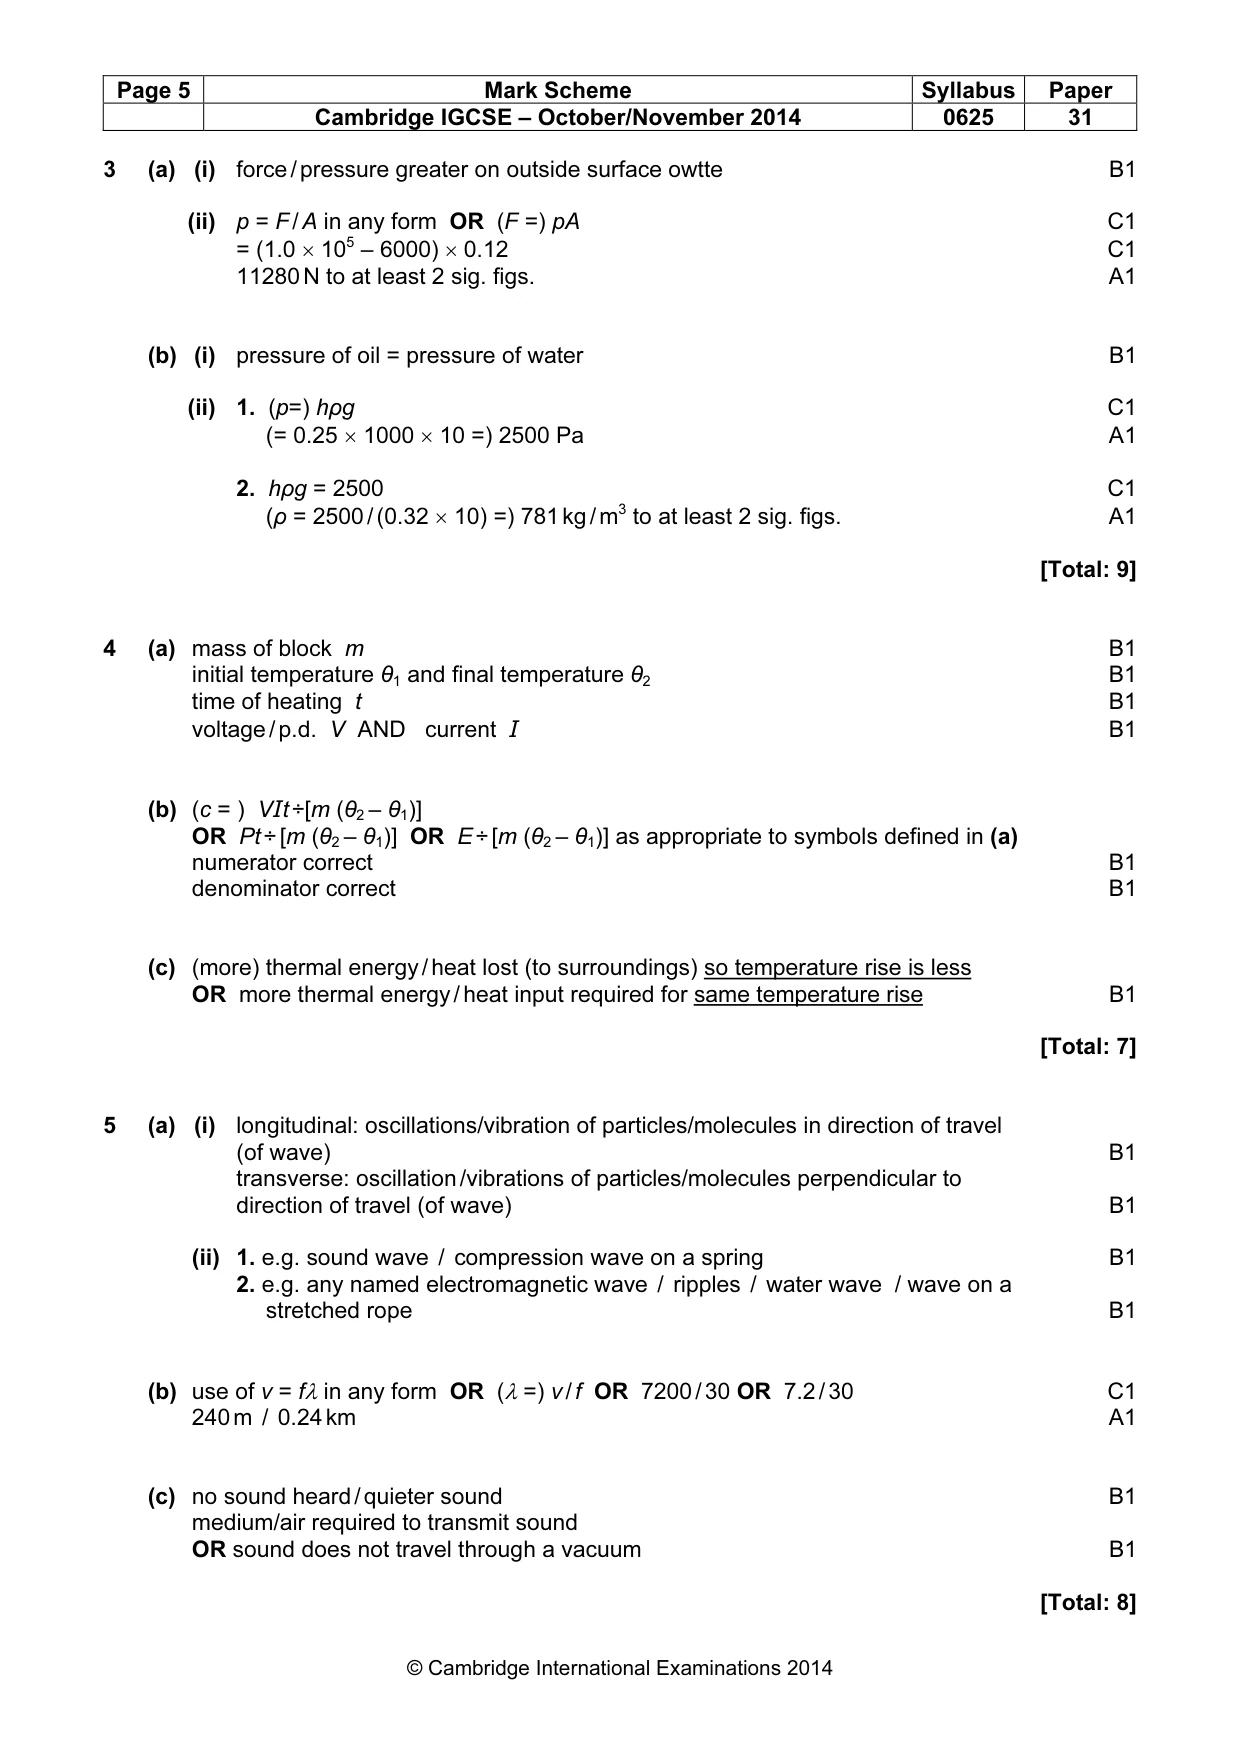
Mark scheme: 3 (a) (i) force / pressure greater on outside surface owtte B1 (ii) p = F / A in any form OR (F =) pA C1 = (1.0 × 10⁵ – 6000) × 0.12 C1 11280 N to at least 2 sig. figs. A1 (b) (i) pressure of oil = pressure of water B1 (ii) 1. (p=) hρg C1 (= 0.25 × 1000 × 10 =) 2500 Pa A1 2. hρg = 2500 C1 (ρ = 2500 / (0.32 × 10) =) 781 kg / m3 to at least 2 sig. figs. A1 [Total: 9]
Q4 · Some of the apparatus that a student uses to determine the specific heat capacity of…
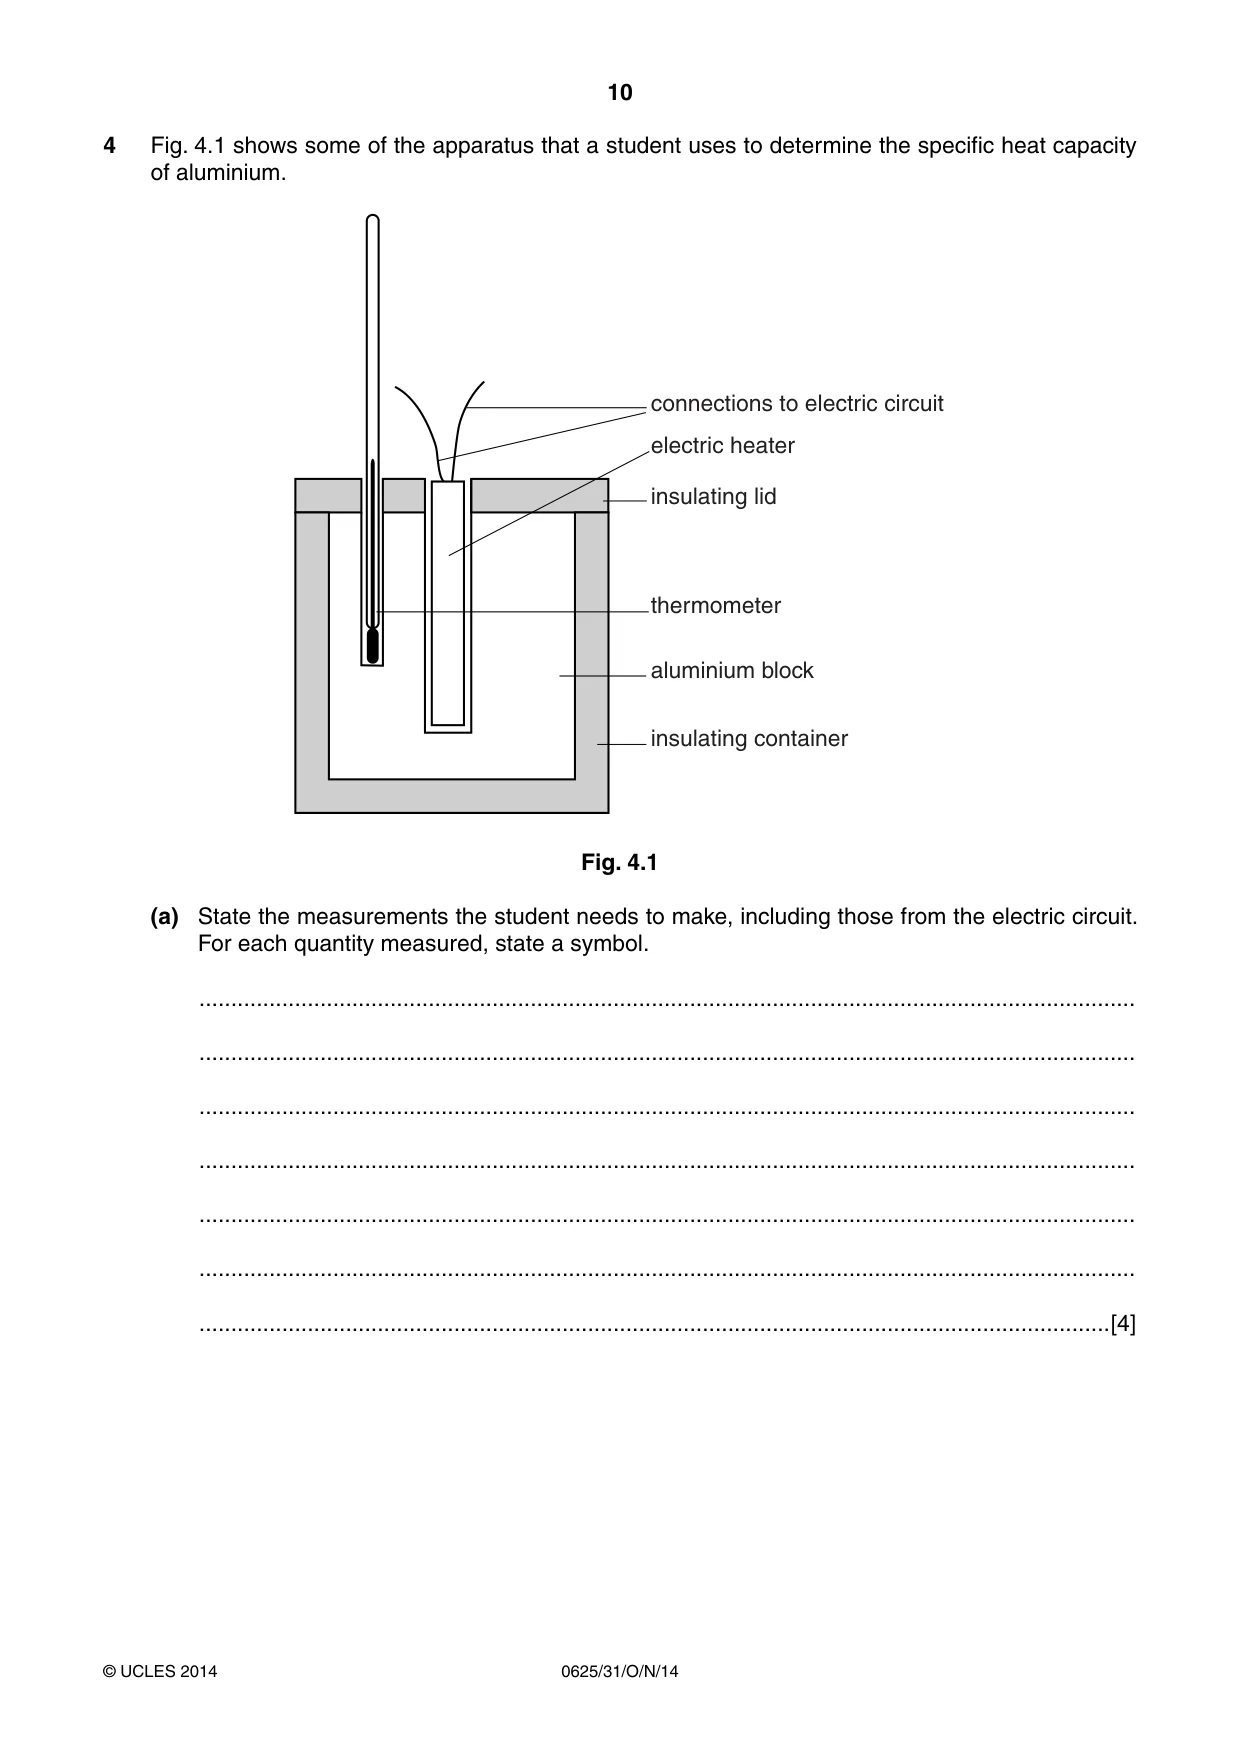
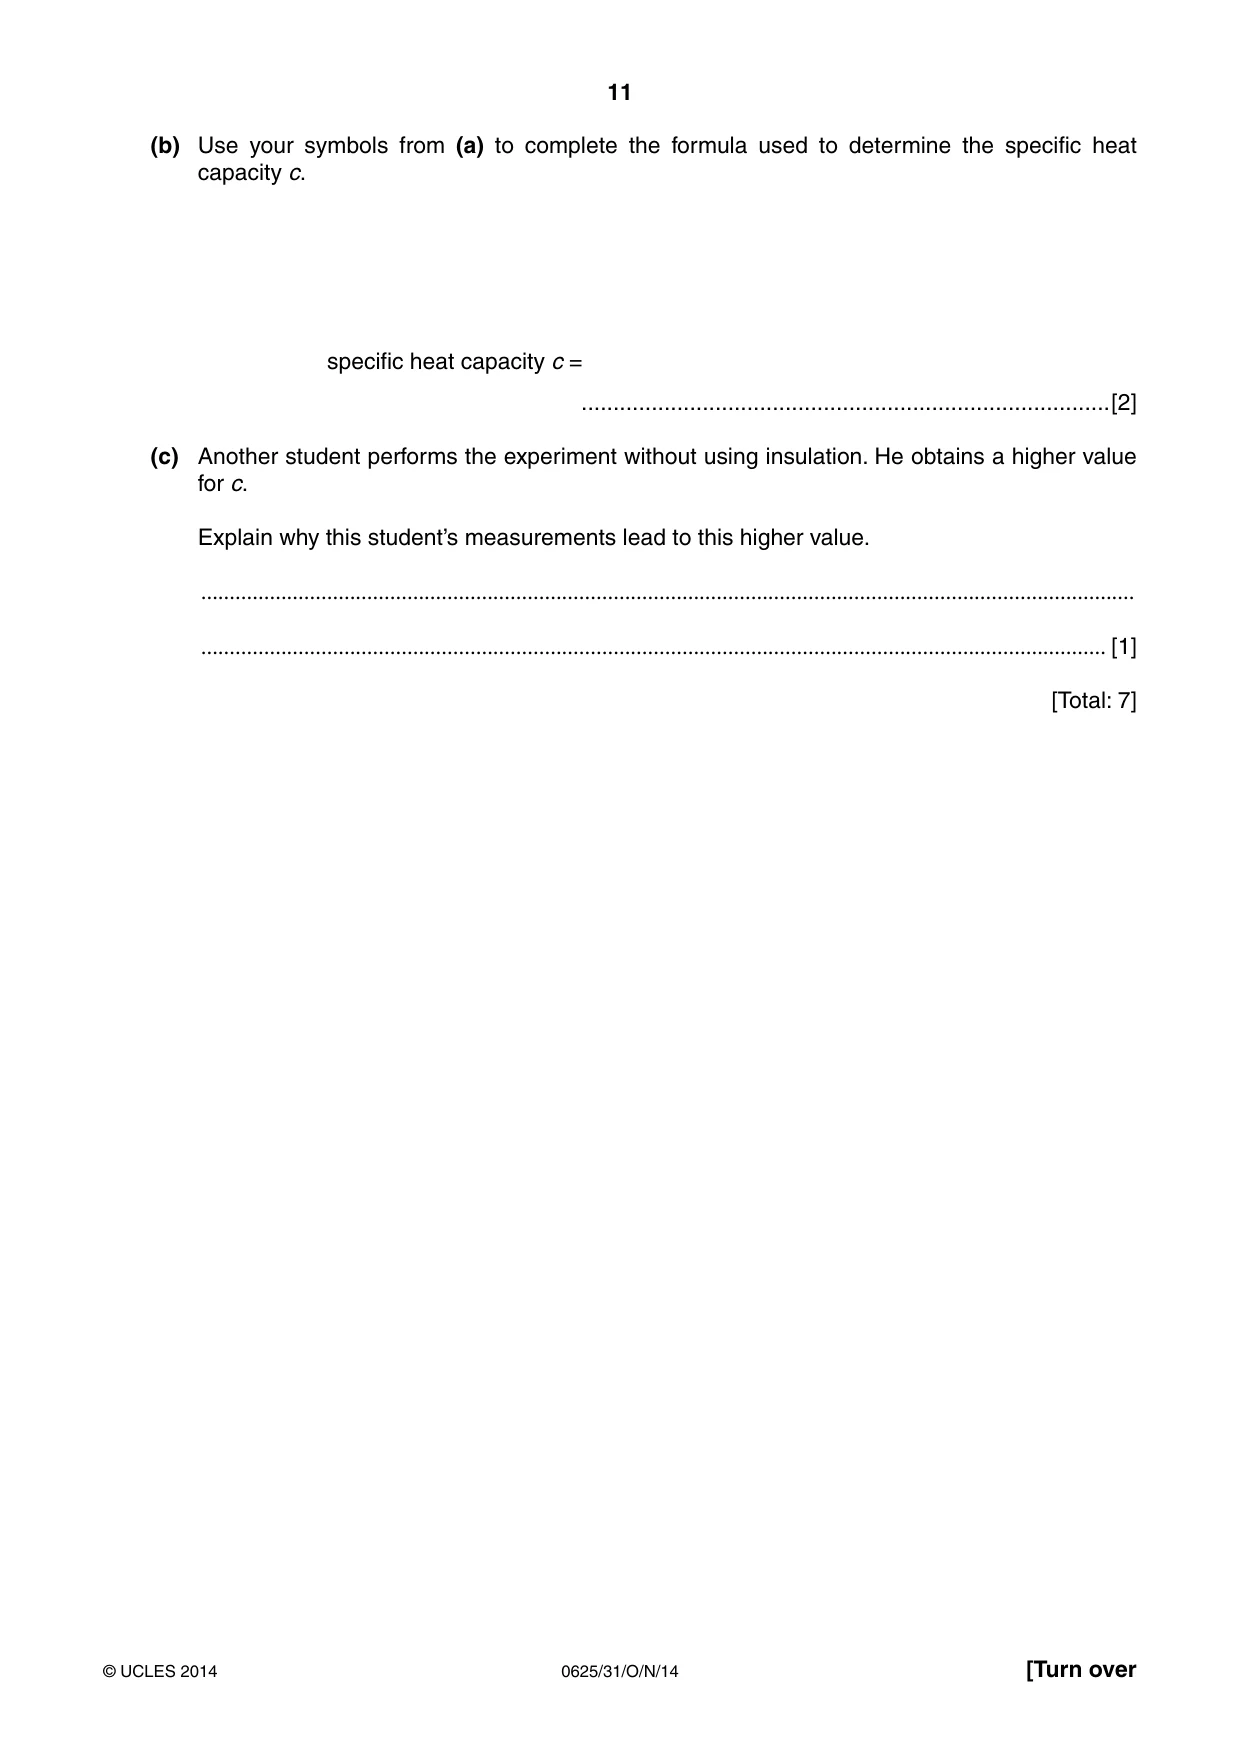
4 Fig. 4.1 shows some of the apparatus that a student uses to determine the specific heat capacity of aluminium. connections to electric circuit electric heater insulating lid thermometer aluminium block insulating container Fig. 4.1 (a) State the measurements the student needs to make, including those from the electric circuit. For each quantity measured, state a symbol. ................................................................................................................................................... ................................................................................................................................................... ................................................................................................................................................... ................................................................................................................................................... ................................................................................................................................................... ................................................................................................................................................... ...............................................................................................................................................[4] (b) Use your symbols from (a) to complete the formula used to determine the specific heat capacity c. specific heat capacity c = ...................................................................................[2] (c) Another student performs the experiment without using insulation. He obtains a higher value for c. Explain why this student’s measurements lead to this higher value. ................................................................................................................................................................... .............................................................................................................................................................. [1] [Total: 7]
Mark scheme: 4 (a) mass of block m B1 initial temperature θ1 and final temperature θ2 B1 time of heating t B1 voltage / p.d. V AND current I B1 (b) (c = ) VIt ÷[m (θ2 – θ1)] OR Pt ÷ [m (θ2 – θ1)] OR E ÷ [m (θ2 – θ1)] as appropriate to symbols defined in (a) numerator correct B1 denominator correct B1 (c) (more) thermal energy / heat lost (to surroundings) so temperature rise is less OR more thermal energy / heat input required for same temperature rise B1 [Total: 7]
Q5 · Two types of seismic waves are produced by earthquakes
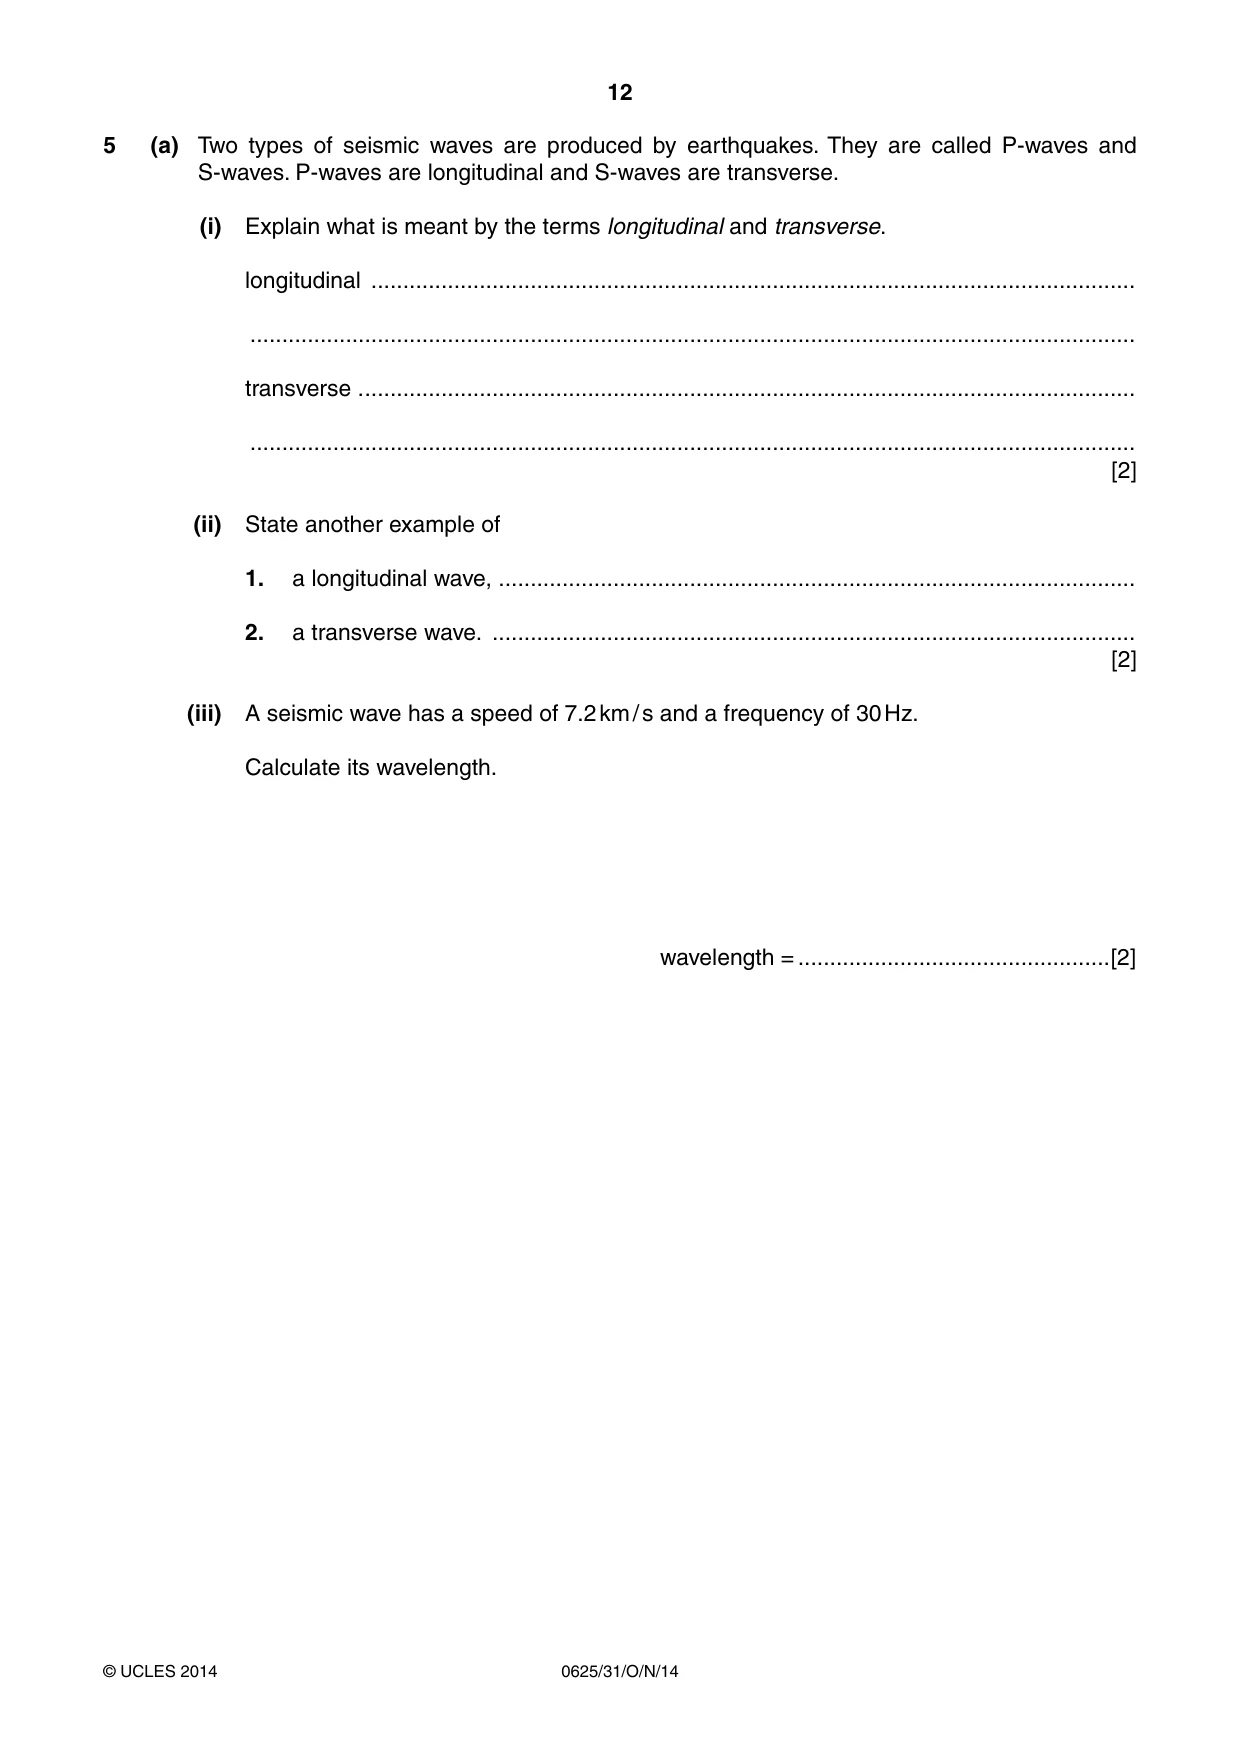
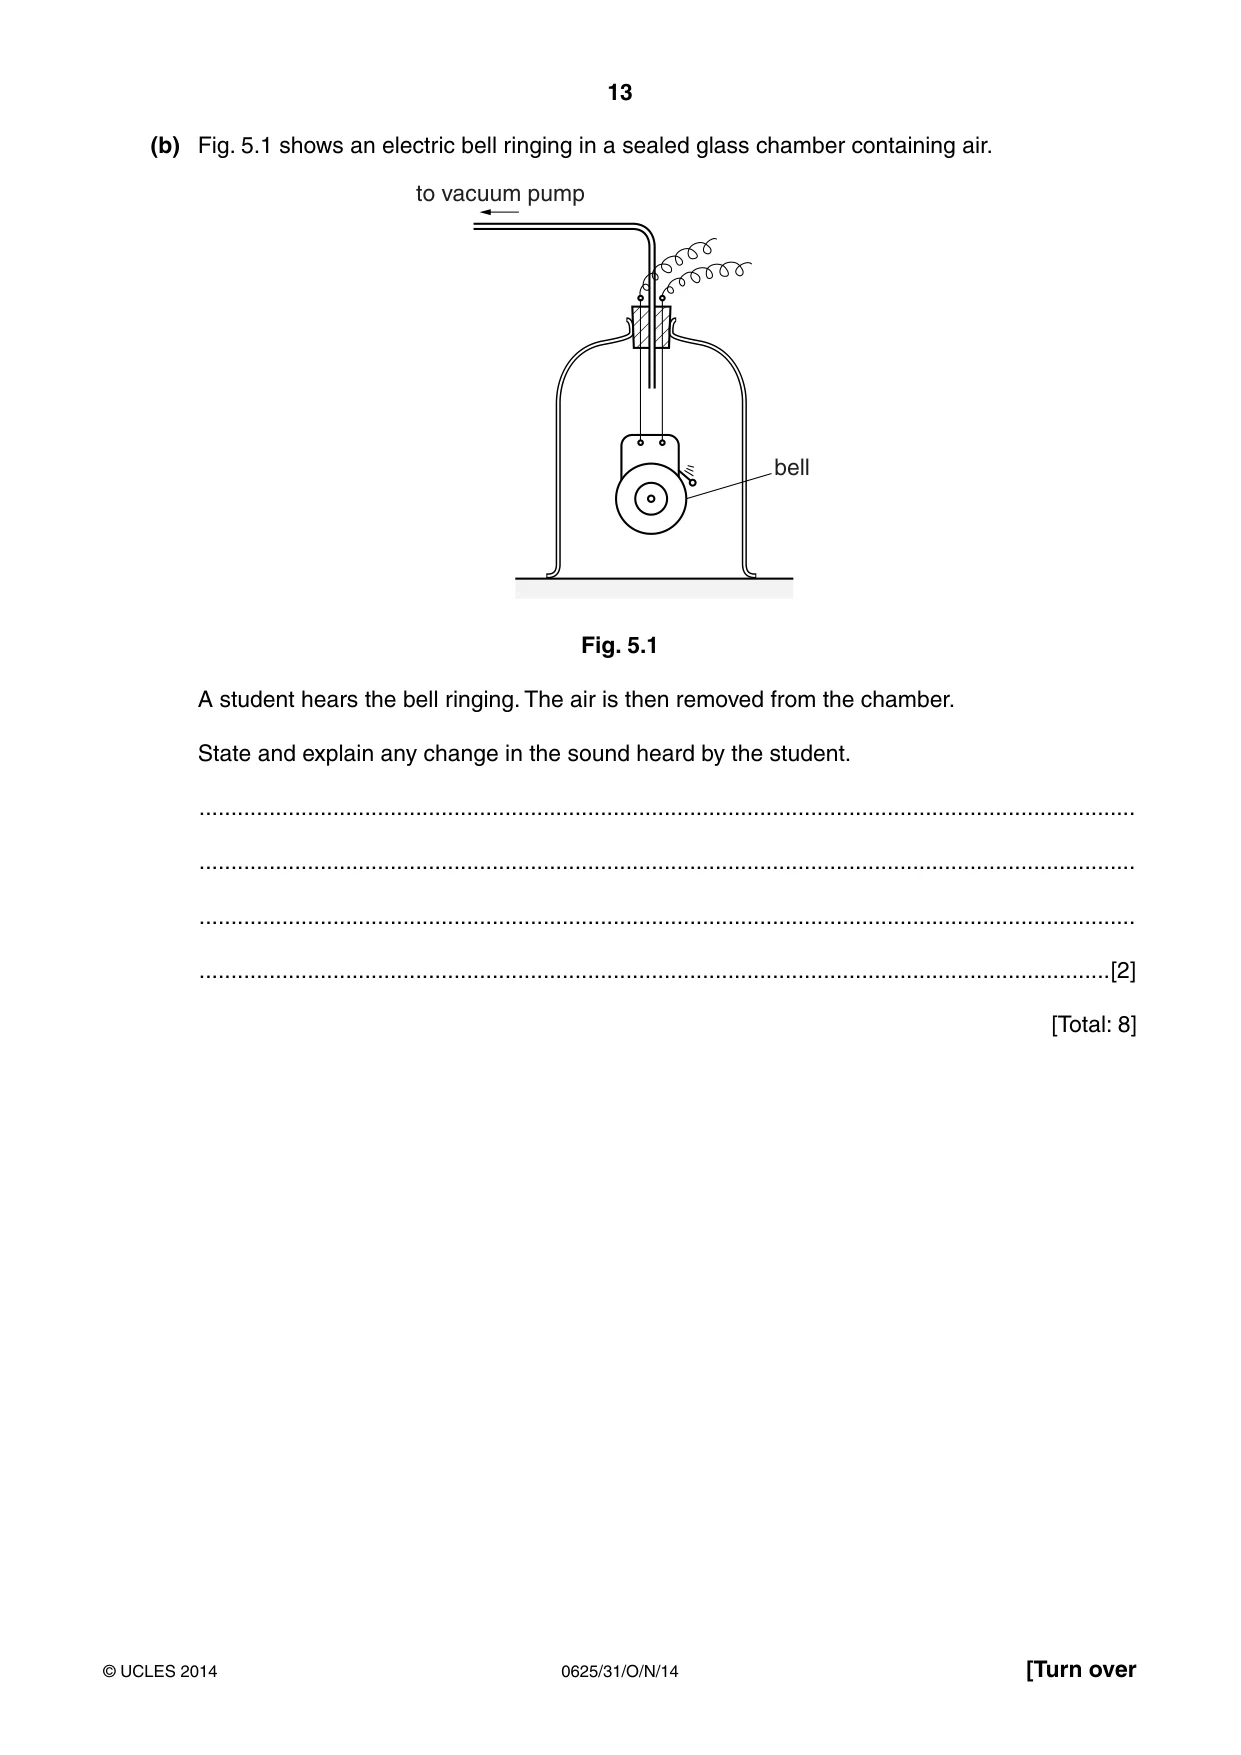
5 (a) Two types of seismic waves are produced by earthquakes. They are called P-waves and S-waves. P-waves are longitudinal and S-waves are transverse. (i) Explain what is meant by the terms longitudinal and transverse. longitudinal ........................................................................................................................ ........................................................................................................................................... transverse . ......................................................................................................................... ........................................................................................................................................... [2] (ii) State another example of 1. a longitudinal wave, .................................................................................................... 2. a transverse wave. ..................................................................................................... [2] (iii) A seismic wave has a speed of 7.2 km / s and a frequency of 30 Hz. Calculate its wavelength. wavelength = .................................................[2] (b) Fig. 5.1 shows an electric bell ringing in a sealed glass chamber containing air. to vacuum pump bell Fig. 5.1 A student hears the bell ringing. The air is then removed from the chamber. State and explain any change in the sound heard by the student. ................................................................................................................................................... ................................................................................................................................................... ................................................................................................................................................... ...............................................................................................................................................[2] [Total: 8]
Mark scheme: 5 (a) (i) longitudinal: oscillations/vibration of particles/molecules in direction of travel (of wave) B1 transverse: oscillation /vibrations of particles/molecules perpendicular to direction of travel (of wave) B1 (ii) 1. e.g. sound wave / compression wave on a spring B1 2. e.g. any named electromagnetic wave / ripples / water wave / wave on a stretched rope B1 (b) use of v = fλ in any form OR (λ =) v / f OR 7200 / 30 OR 7.2 / 30 C1 240 m / 0.24 km A1 (c) no sound heard / quieter sound B1 medium/air required to transmit sound OR sound does not travel through a vacuum B1 [Total: 8]
Q6 · An object O placed in front of a plane mirror M
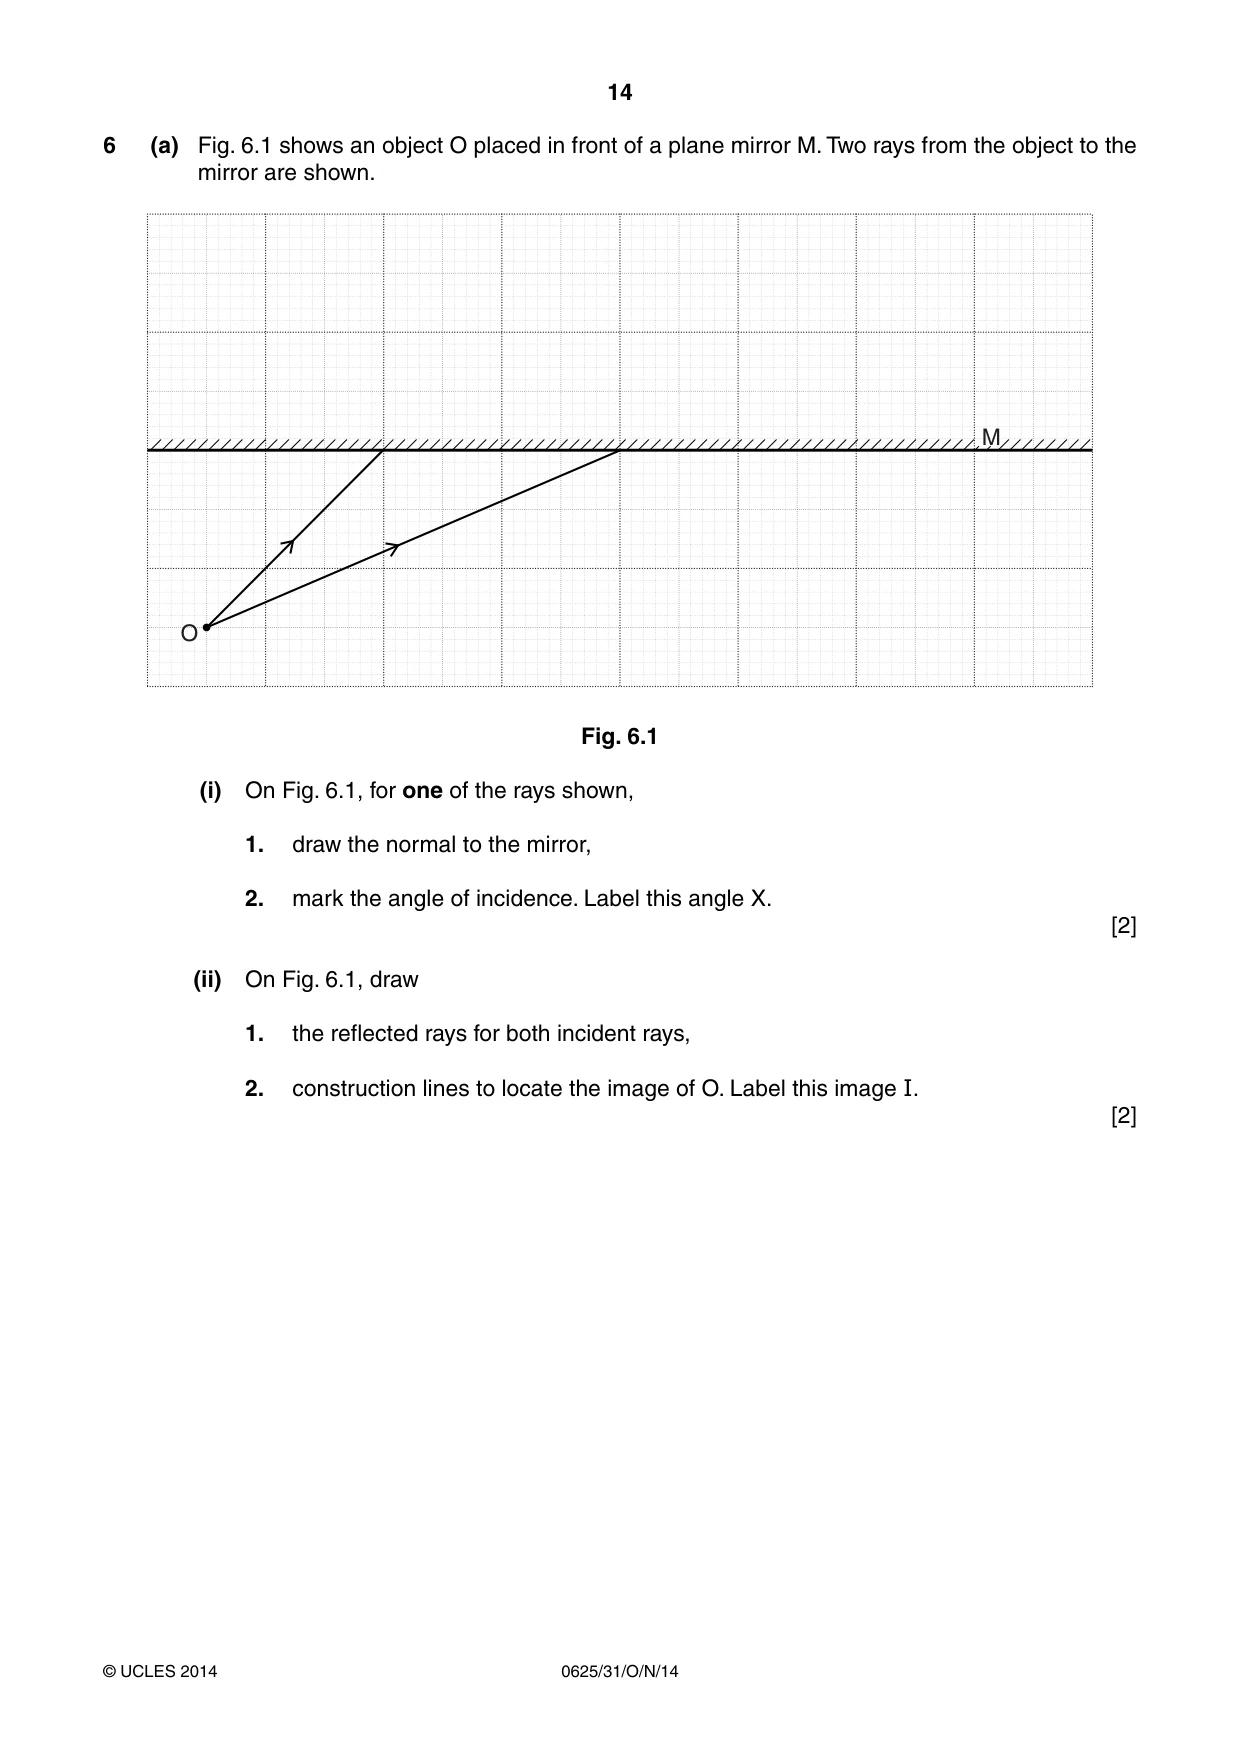
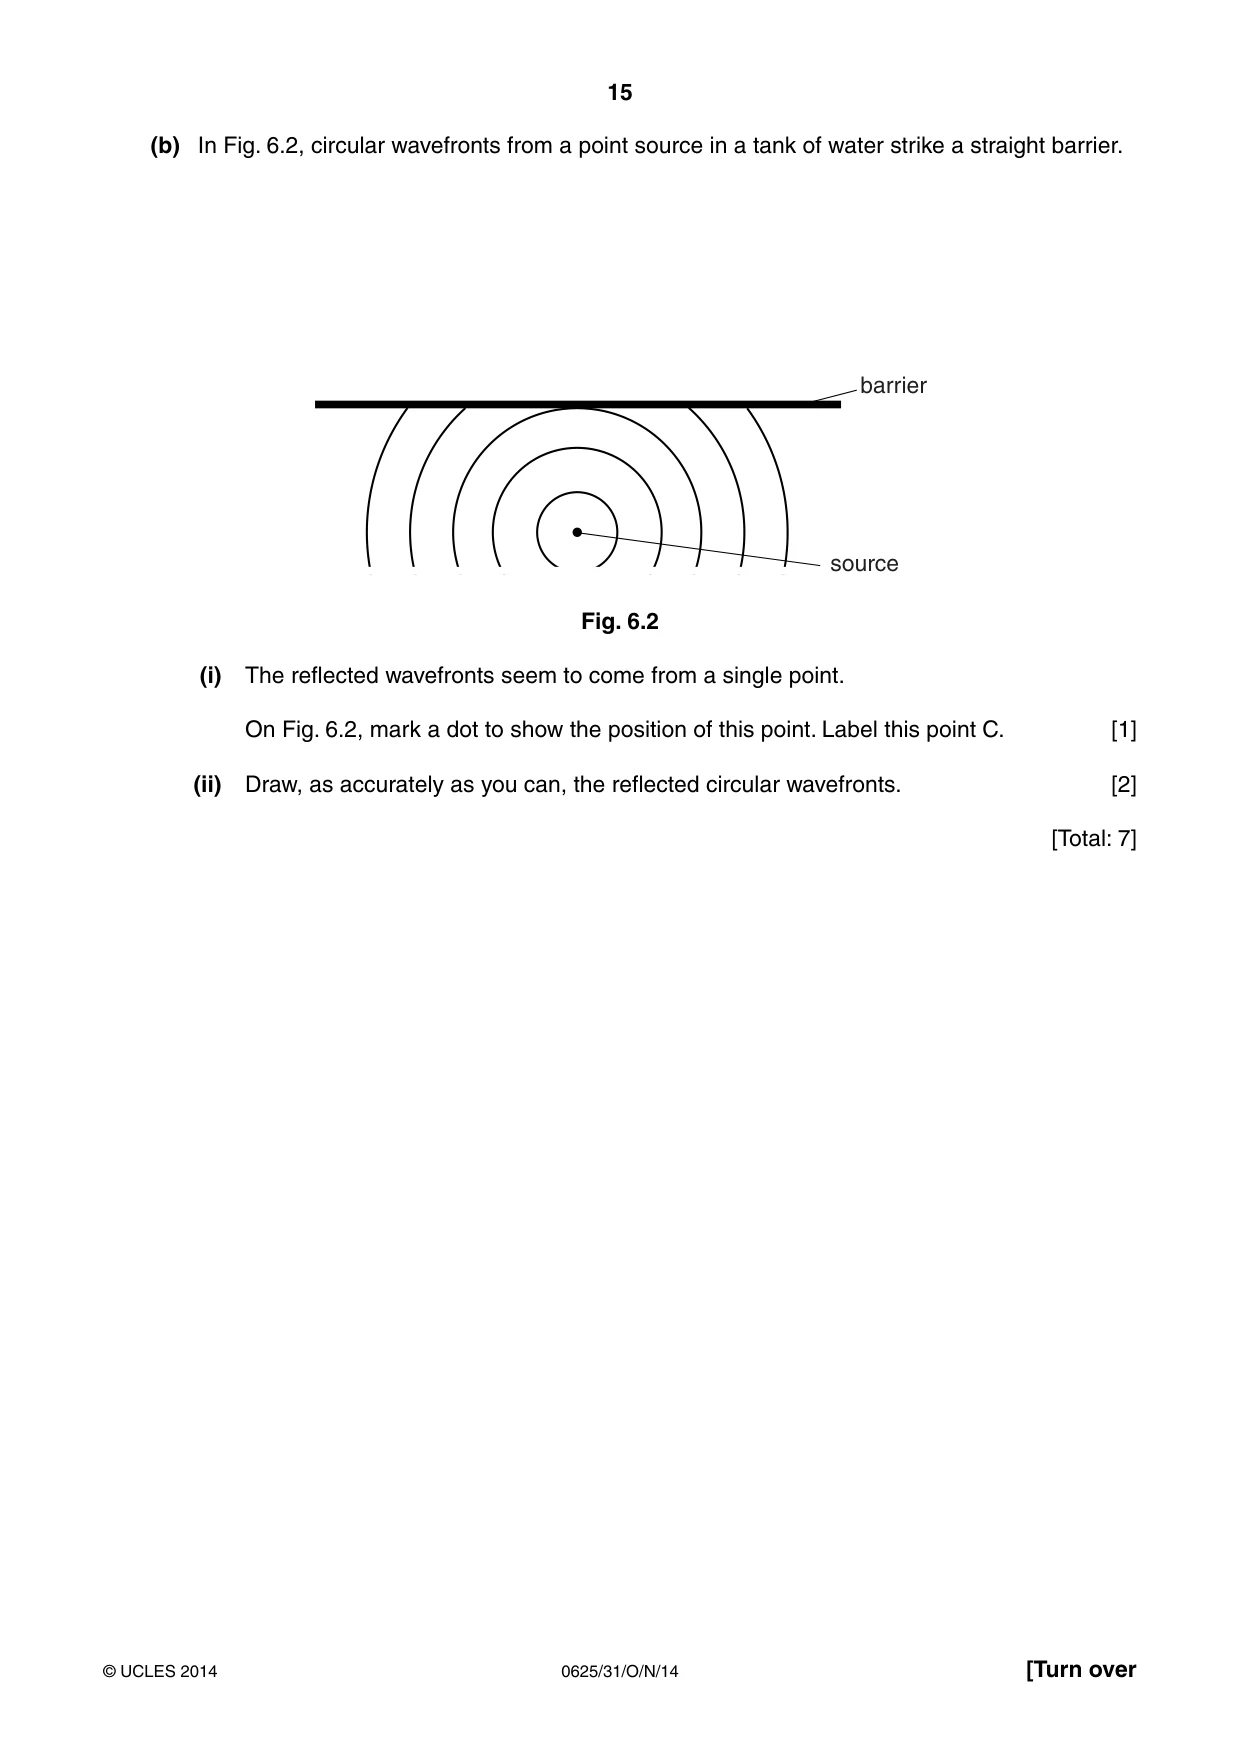
6 (a) Fig. 6.1 shows an object O placed in front of a plane mirror M. Two rays from the object to the mirror are shown. M O Fig. 6.1 (i) On Fig. 6.1, for one of the rays shown, 1. draw the normal to the mirror, 2. mark the angle of incidence. Label this angle X. [2] (ii) On Fig. 6.1, draw 1. the reflected rays for both incident rays, 2. construction lines to locate the image of O. Label this image I. [2] (b) In Fig. 6.2, circular wavefronts from a point source in a tank of water strike a straight barrier. barrier source Fig. 6.2 (i) The reflected wavefronts seem to come from a single point. On Fig. 6.2, mark a dot to show the position of this point. Label this point C. [1] (ii) Draw, as accurately as you can, the reflected circular wavefronts. [2] [Total: 7]
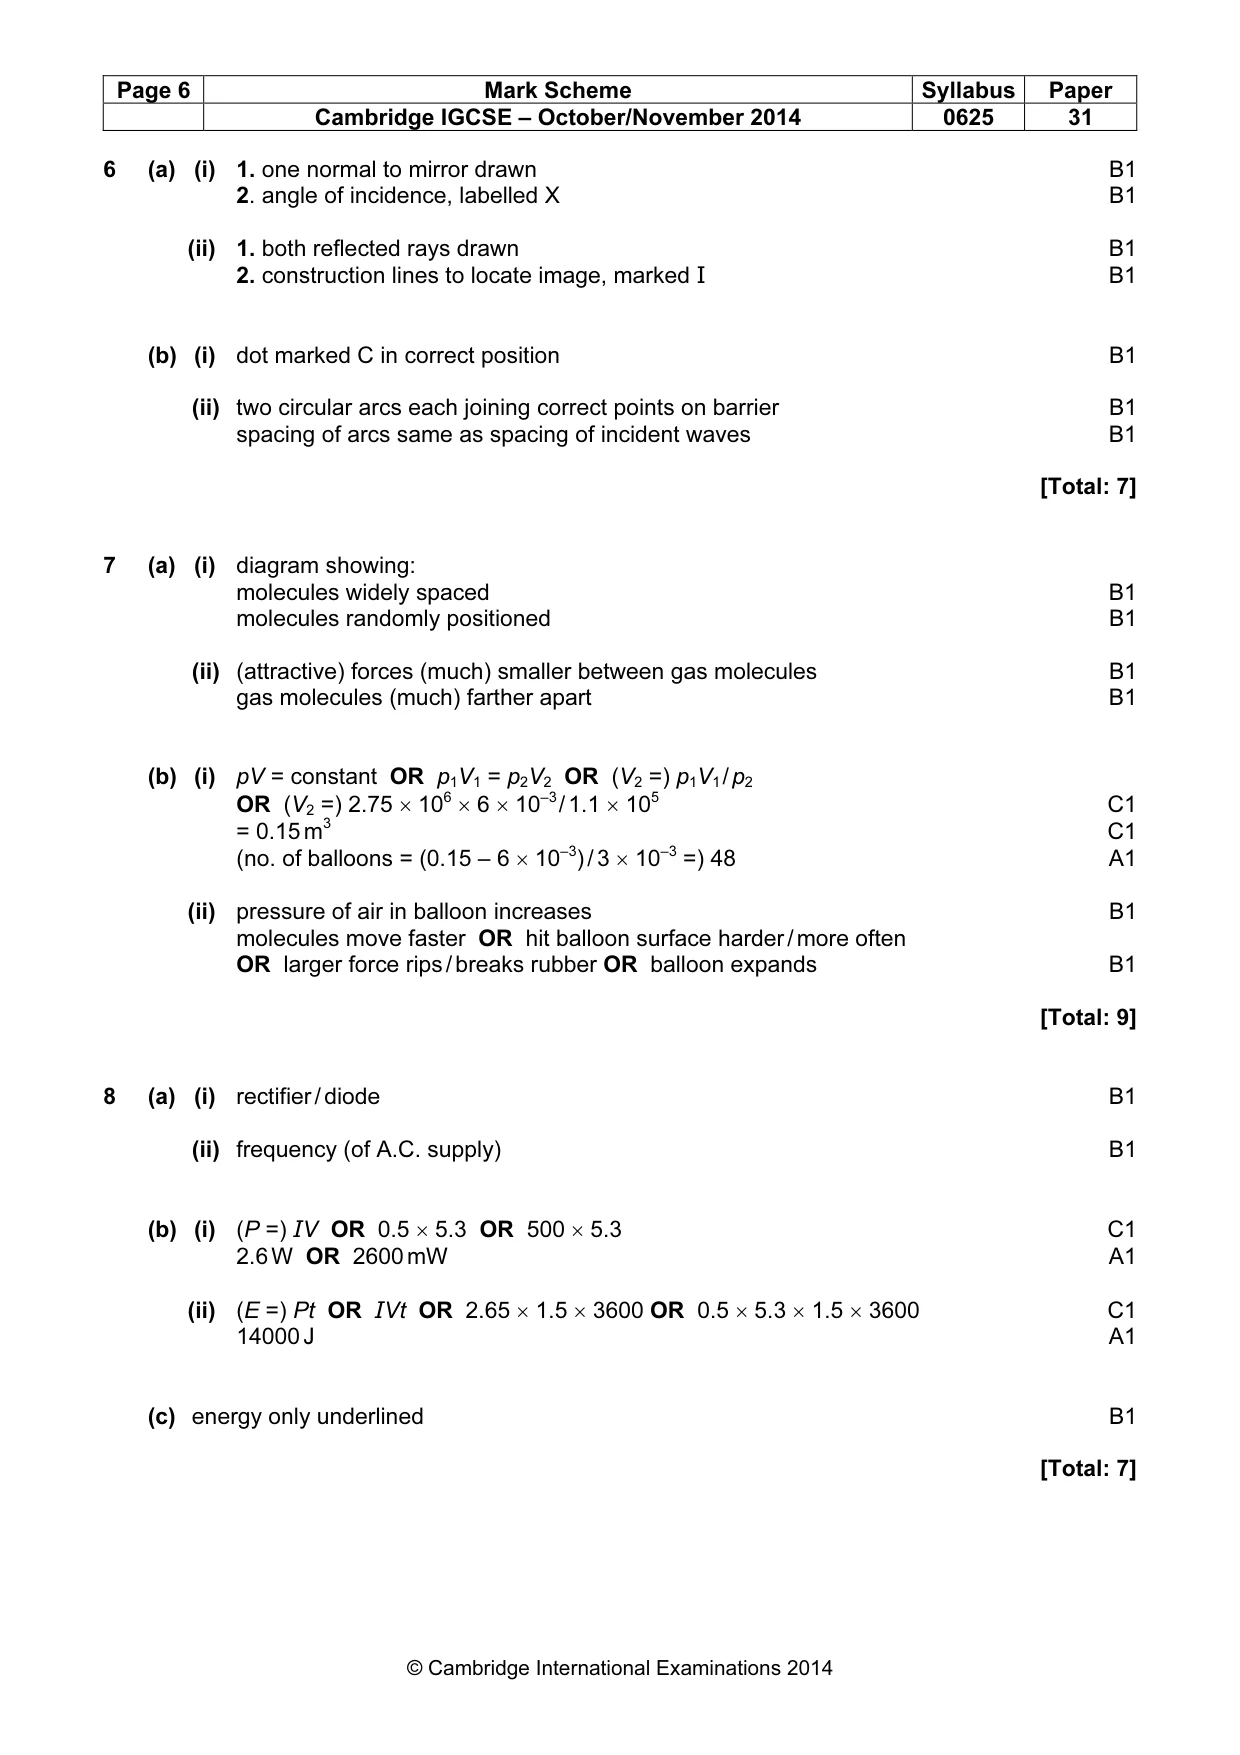
Mark scheme: 6 (a) (i) 1. one normal to mirror drawn B1 2. angle of incidence, labelled X B1 (ii) 1. both reflected rays drawn B1 2. construction lines to locate image, marked I B1 (b) (i) dot marked C in correct position B1 (ii) two circular arcs each joining correct points on barrier B1 spacing of arcs same as spacing of incident waves B1 [Total: 7]
Q7 · A small cylinder of compressed helium gas is used to inflate balloons for a celebration
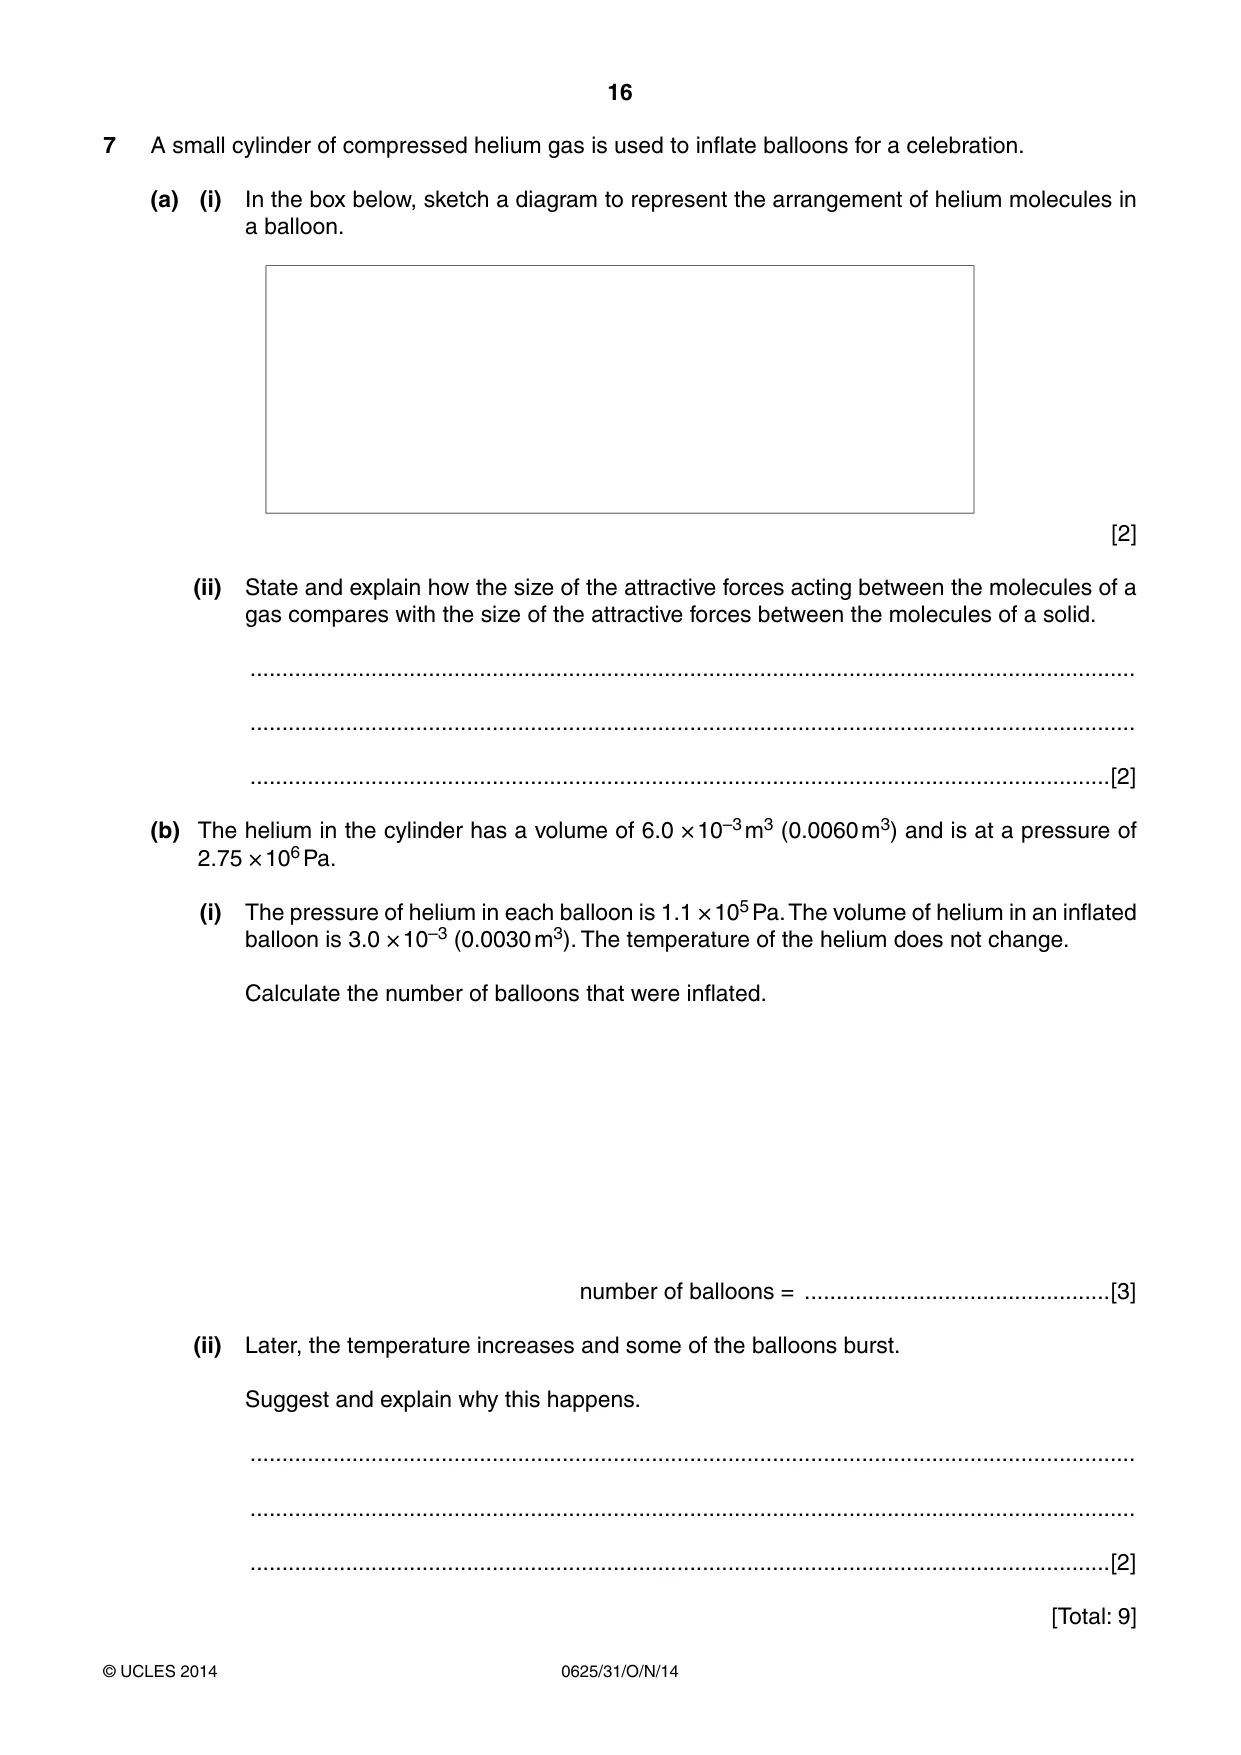
7 A small cylinder of compressed helium gas is used to inflate balloons for a celebration. (a) (i) In the box below, sketch a diagram to represent the arrangement of helium molecules in a balloon. [2] (ii) State and explain how the size of the attractive forces acting between the molecules of a gas compares with the size of the attractive forces between the molecules of a solid. ........................................................................................................................................... ........................................................................................................................................... .......................................................................................................................................[2] (b) The helium in the cylinder has a volume of 6.0 × 10⁻³ m3 (0.0060 m3) and is at a pressure of 2.75 × 10⁶ Pa. (i) The pressure of helium in each balloon is 1.1 × 10⁵ Pa. The volume of helium in an inflated balloon is 3.0 × 10⁻³ (0.0030 m3). The temperature of the helium does not change. Calculate the number of balloons that were inflated. number of balloons = ................................................[3] (ii) Later, the temperature increases and some of the balloons burst. Suggest and explain why this happens. ........................................................................................................................................... ........................................................................................................................................... .......................................................................................................................................[2] [Total: 9]
Mark scheme: 7 (a) (i) diagram showing: molecules widely spaced B1 molecules randomly positioned B1 (ii) (attractive) forces (much) smaller between gas molecules B1 gas molecules (much) farther apart B1 (b) (i) pV = constant OR p1V1 = p2V2 OR (V2 =) p1V1 / p2 OR (V2 =) 2.75 × 106 × 6 × 10–3 / 1.1 × 10⁵ C1 = 0.15 m3 C1 (no. of balloons = (0.15 – 6 × 10⁻³) / 3 × 10–3 =) 48 A1 (ii) pressure of air in balloon increases B1 molecules move faster OR hit balloon surface harder / more often OR larger force rips / breaks rubber OR balloon expands B1 [Total: 9]
Q8 · A charger for a cellphone (mobile phone) is marked: input: a.c
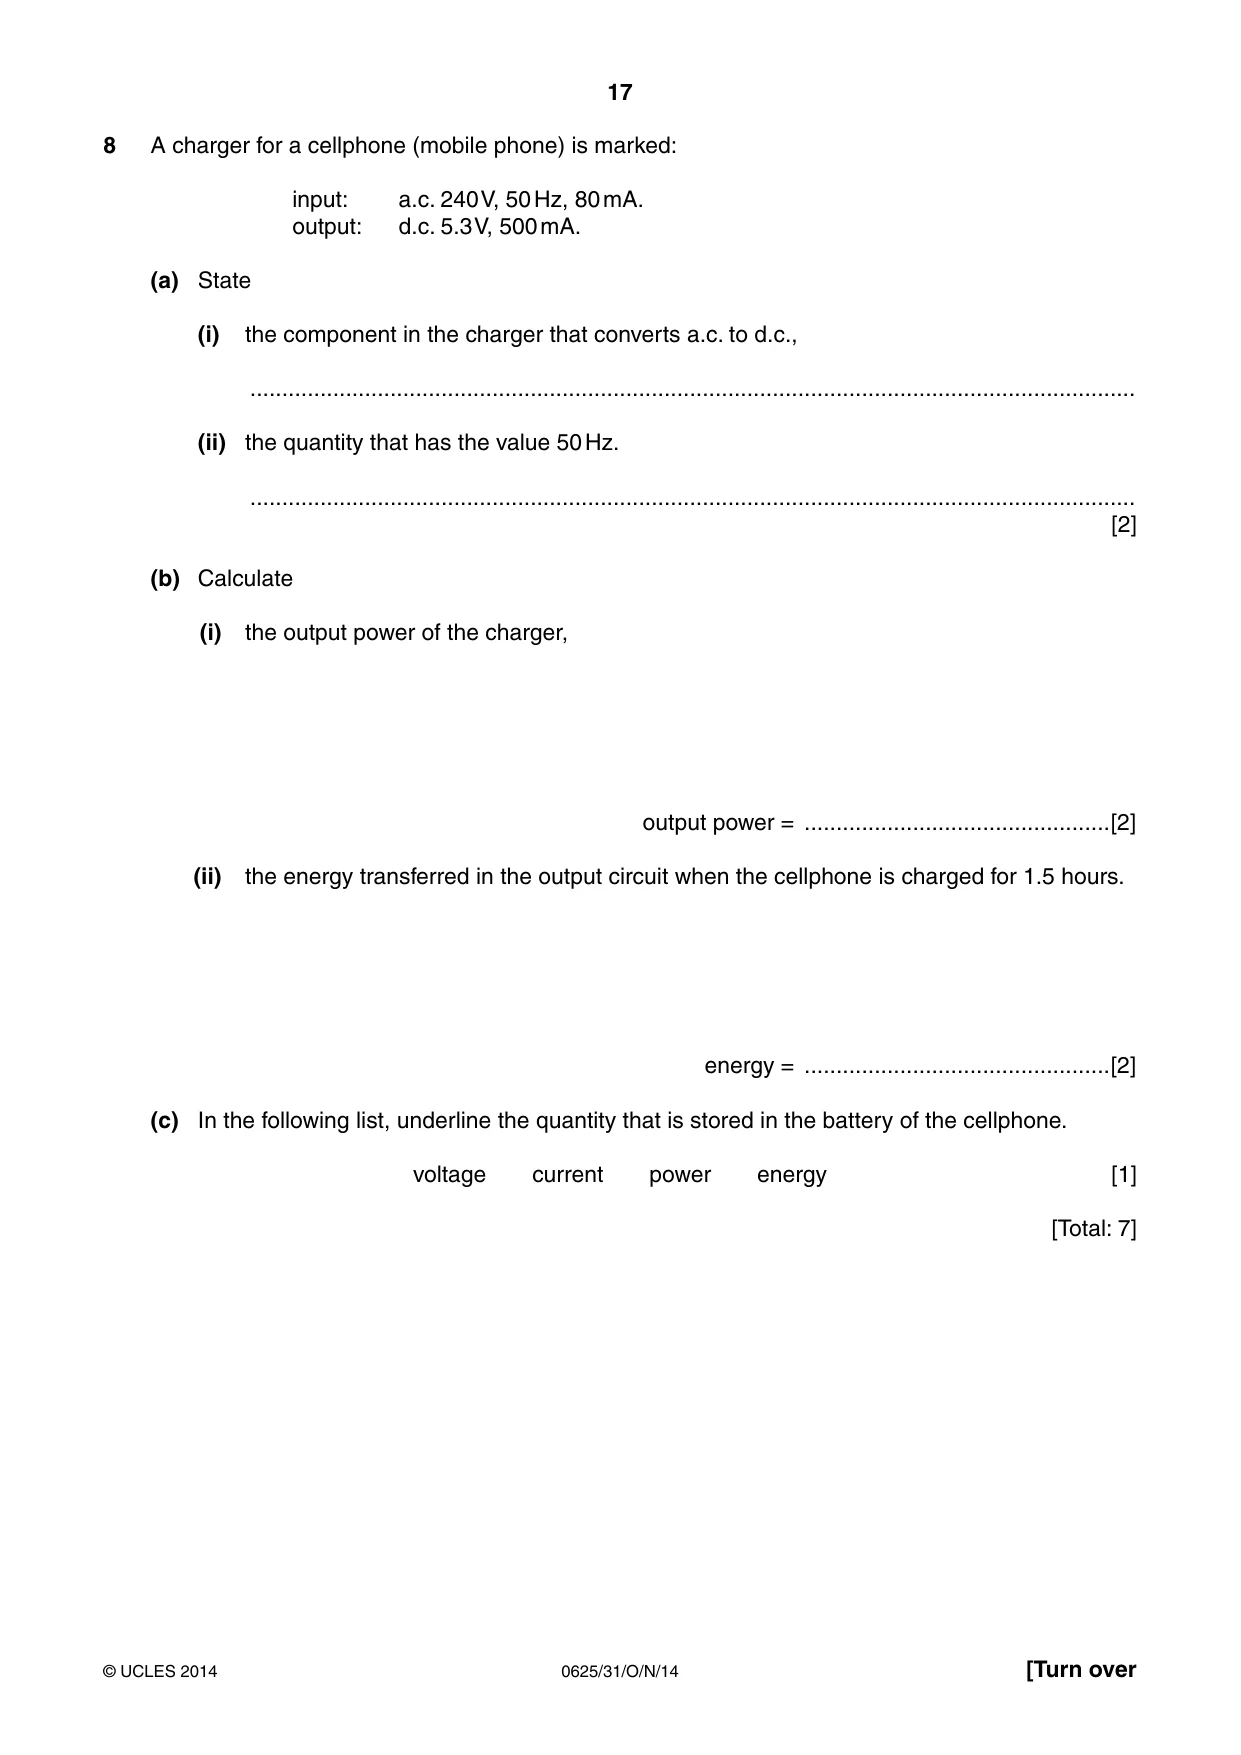
8 A charger for a cellphone (mobile phone) is marked: input: a.c. 240 V, 50 Hz, 80 mA. output: d.c. 5.3 V, 500 mA. (a) State (i) the component in the charger that converts a.c. to d.c., ........................................................................................................................................... (ii) the quantity that has the value 50 Hz. ........................................................................................................................................... [2] (b) Calculate (i) the output power of the charger, output power = ................................................[2] (ii) the energy transferred in the output circuit when the cellphone is charged for 1.5 hours. energy = ................................................[2] (c) In the following list, underline the quantity that is stored in the battery of the cellphone. voltage current power energy [1] [Total: 7]
Mark scheme: 8 (a) (i) rectifier / diode B1 (ii) frequency (of A.C. supply) B1 (b) (i) (P =) IV OR 0.5 × 5.3 OR 500 × 5.3 C1 2.6 W OR 2600 mW A1 (ii) (E =) Pt OR IVt OR 2.65 × 1.5 × 3600 OR 0.5 × 5.3 × 1.5 × 3600 C1 14000 J A1 (c) energy only underlined B1 [Total: 7]
Q9 · A technician sets up a radiation detector in a university laboratory, for use in some…
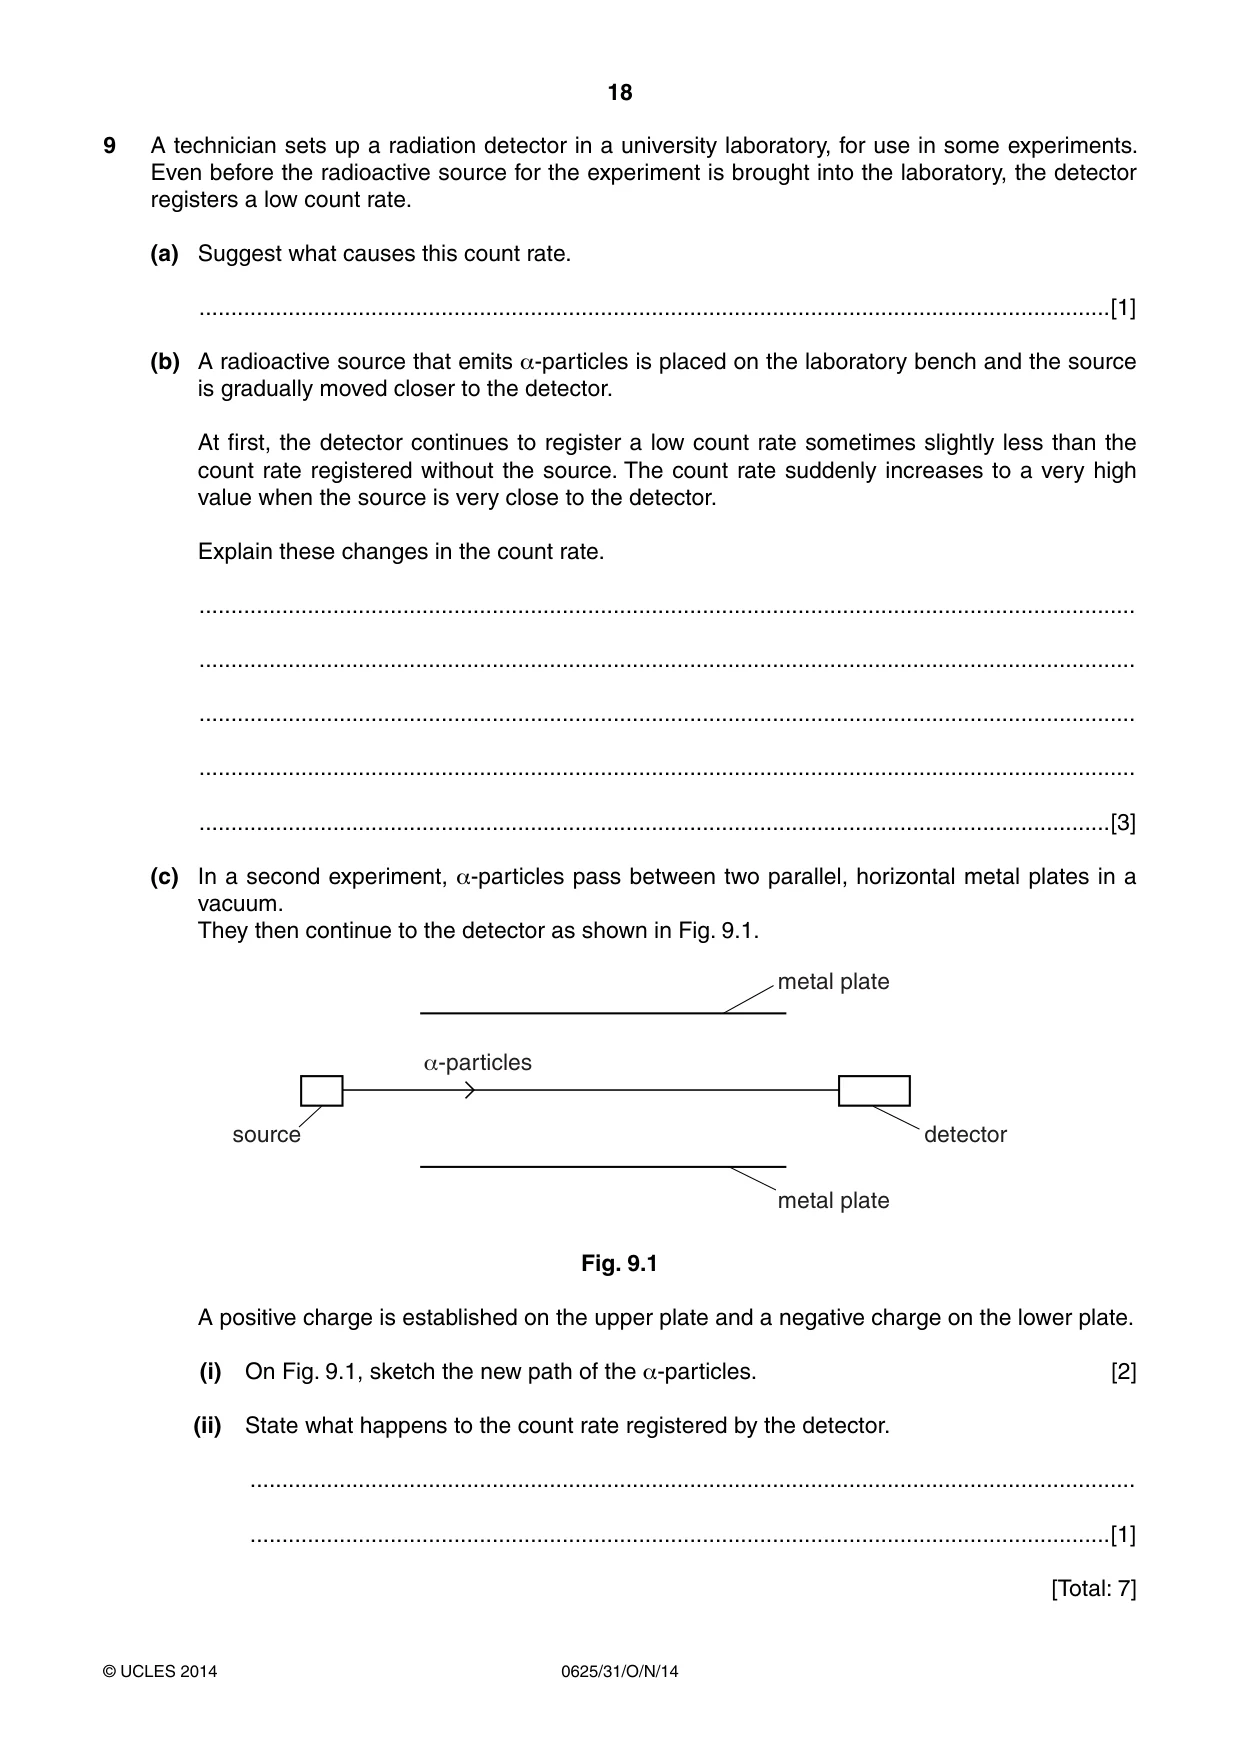
9 A technician sets up a radiation detector in a university laboratory, for use in some experiments. Even before the radioactive source for the experiment is brought into the laboratory, the detector registers a low count rate. (a) Suggest what causes this count rate. ...............................................................................................................................................[1] (b) A radioactive source that emits α-particles is placed on the laboratory bench and the source is gradually moved closer to the detector. At first, the detector continues to register a low count rate sometimes slightly less than the count rate registered without the source. The count rate suddenly increases to a very high value when the source is very close to the detector. Explain these changes in the count rate. ................................................................................................................................................... ................................................................................................................................................... ................................................................................................................................................... ................................................................................................................................................... ...............................................................................................................................................[3] (c) In a second experiment, α-particles pass between two parallel, horizontal metal plates in a vacuum. They then continue to the detector as shown in Fig. 9.1. metal plate _-particles source detector metal plate Fig. 9.1 A positive charge is established on the upper plate and a negative charge on the lower plate. (i) On Fig. 9.1, sketch the new path of the α-particles. [2] (ii) State what happens to the count rate registered by the detector. ........................................................................................................................................... .......................................................................................................................................[1] [Total: 7]
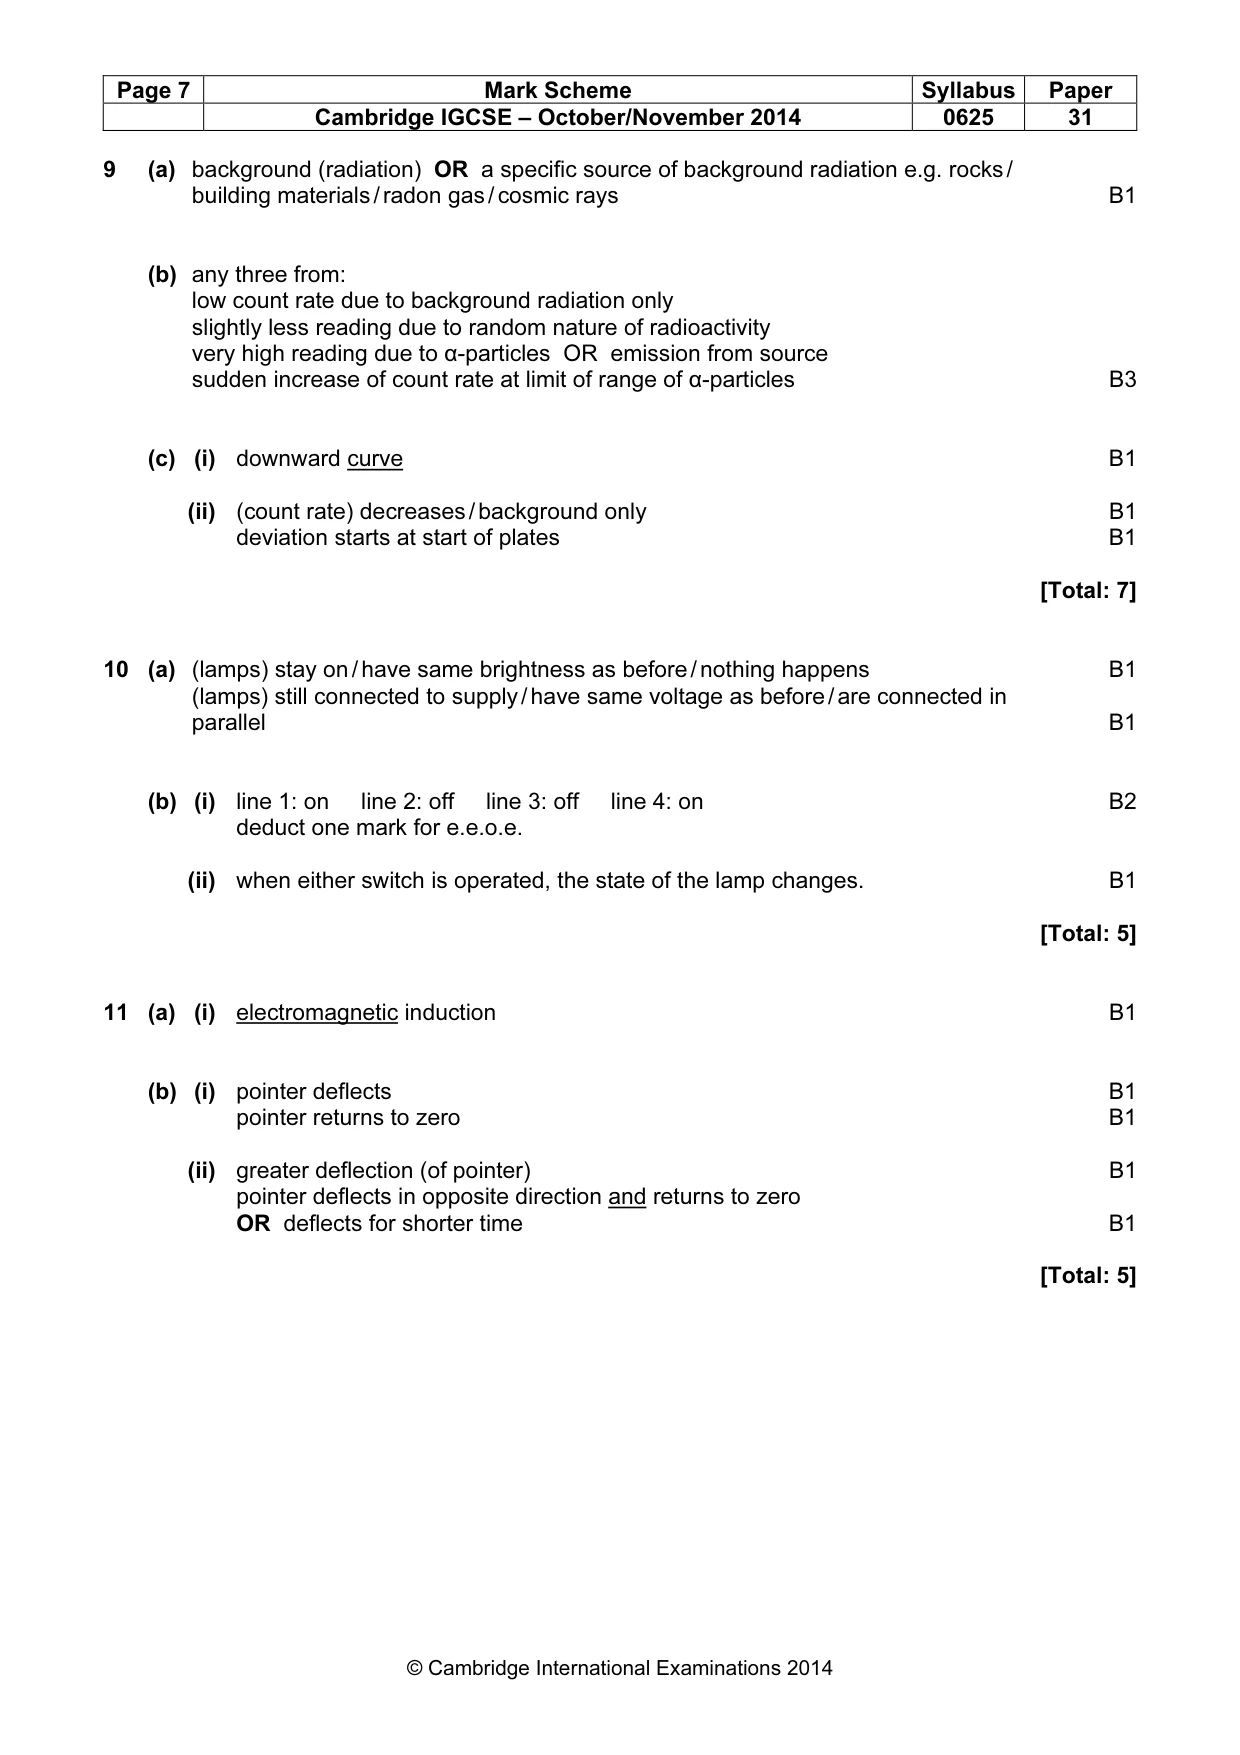
Mark scheme: 9 (a) background (radiation) OR a specific source of background radiation e.g. rocks / building materials / radon gas / cosmic rays B1 (b) any three from: low count rate due to background radiation only slightly less reading due to random nature of radioactivity very high reading due to α-particles OR emission from source sudden increase of count rate at limit of range of α-particles B3 (c) (i) downward curve B1 (ii) (count rate) decreases / background only B1 deviation starts at start of plates B1 [Total: 7]
Q10 · In a room in a house there are four electric lamps in parallel with each other…
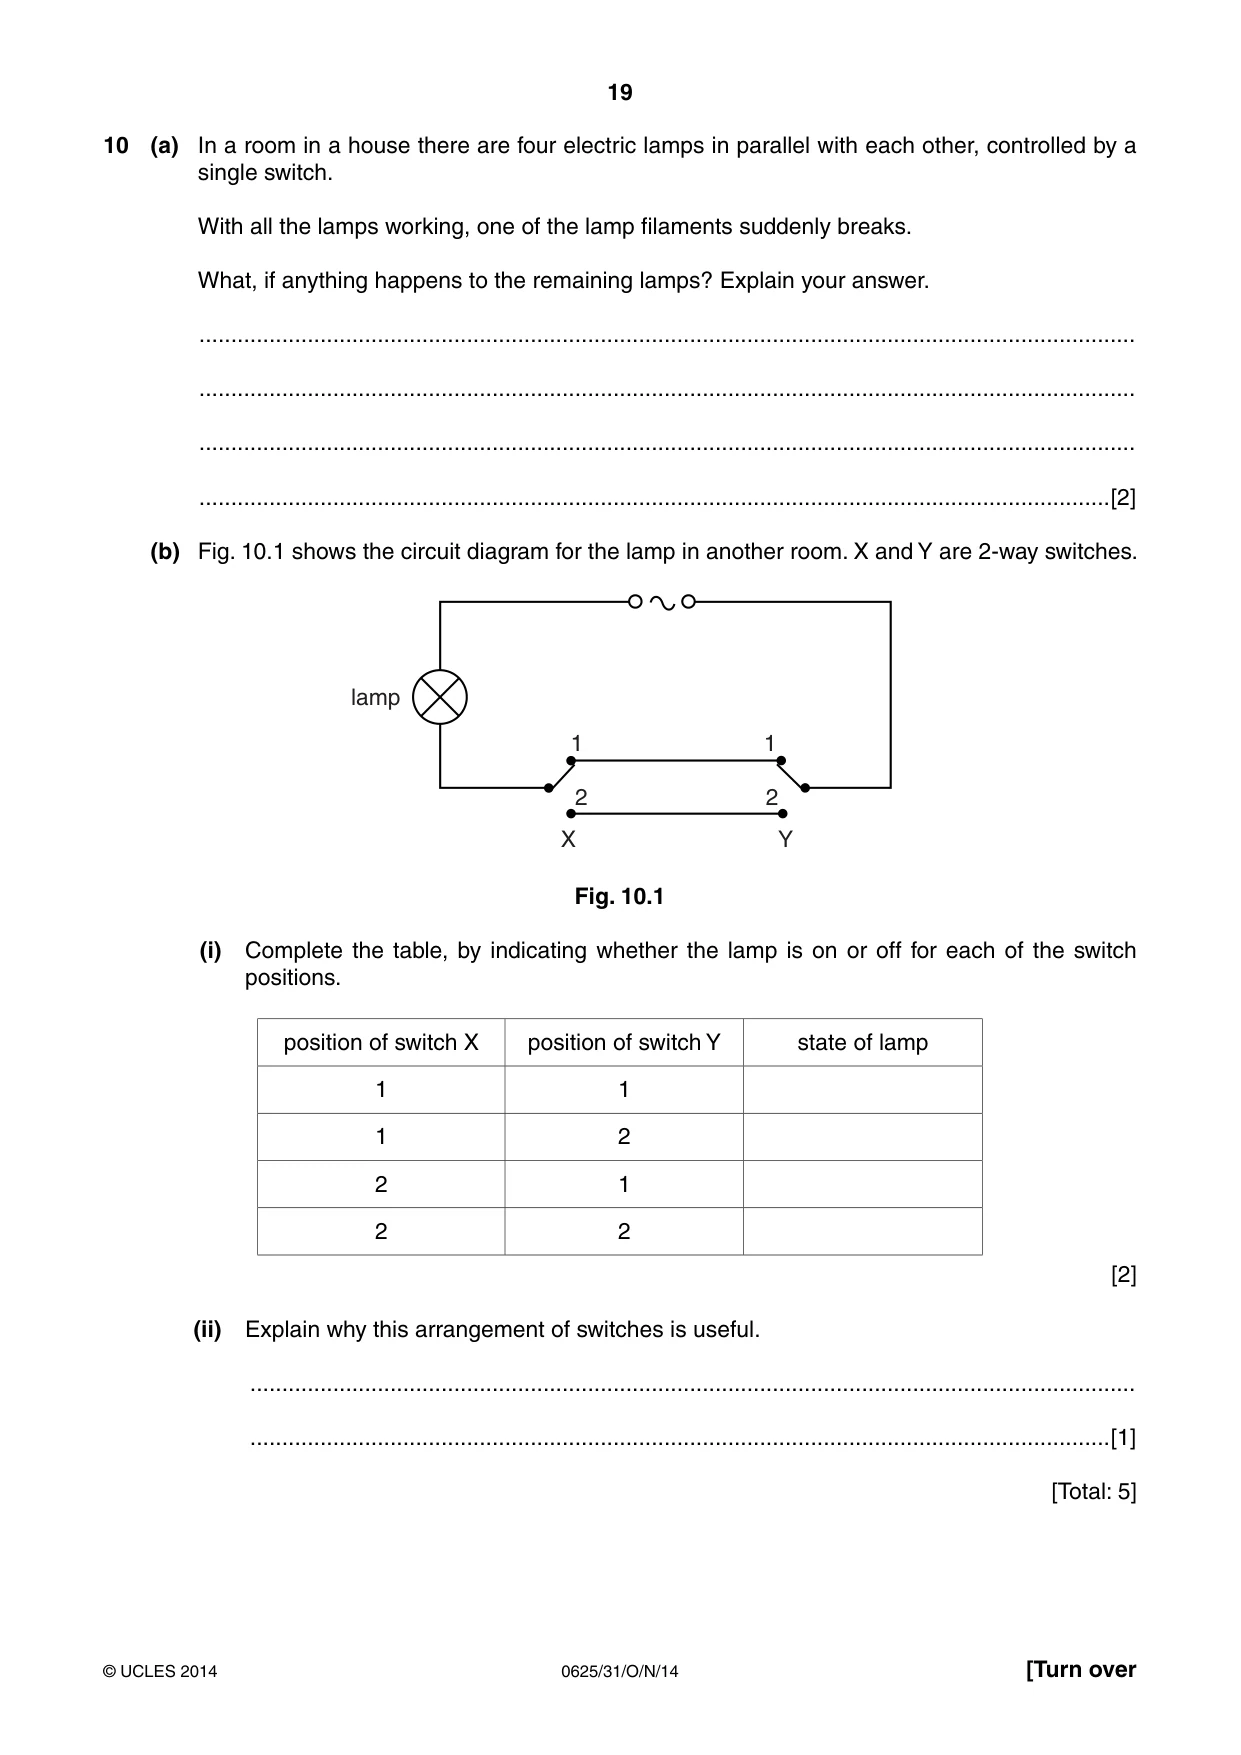
10 (a) In a room in a house there are four electric lamps in parallel with each other, controlled by a single switch. With all the lamps working, one of the lamp filaments suddenly breaks. What, if anything happens to the remaining lamps? Explain your answer. ................................................................................................................................................... ................................................................................................................................................... ................................................................................................................................................... ...............................................................................................................................................[2] (b) Fig. 10.1 shows the circuit diagram for the lamp in another room. X and Y are 2-way switches. lamp 1 1 2 2 X Y Fig. 10.1 (i) Complete the table, by indicating whether the lamp is on or off for each of the switch positions. position of switch X position of switch Y state of lamp 1 1 1 2 2 1 2 2 [2] (ii) Explain why this arrangement of switches is useful. ........................................................................................................................................... .......................................................................................................................................[1] [Total: 5]
Mark scheme: 10 (a) (lamps) stay on / have same brightness as before / nothing happens B1 (lamps) still connected to supply / have same voltage as before / are connected in parallel B1 (b) (i) line 1: on line 2: off line 3: off line 4: on B2 deduct one mark for e.e.o.e. (ii) when either switch is operated, the state of the lamp changes. B1 [Total: 5]
Q11 · Name the process that causes a potential difference across a solenoid due to the movement…
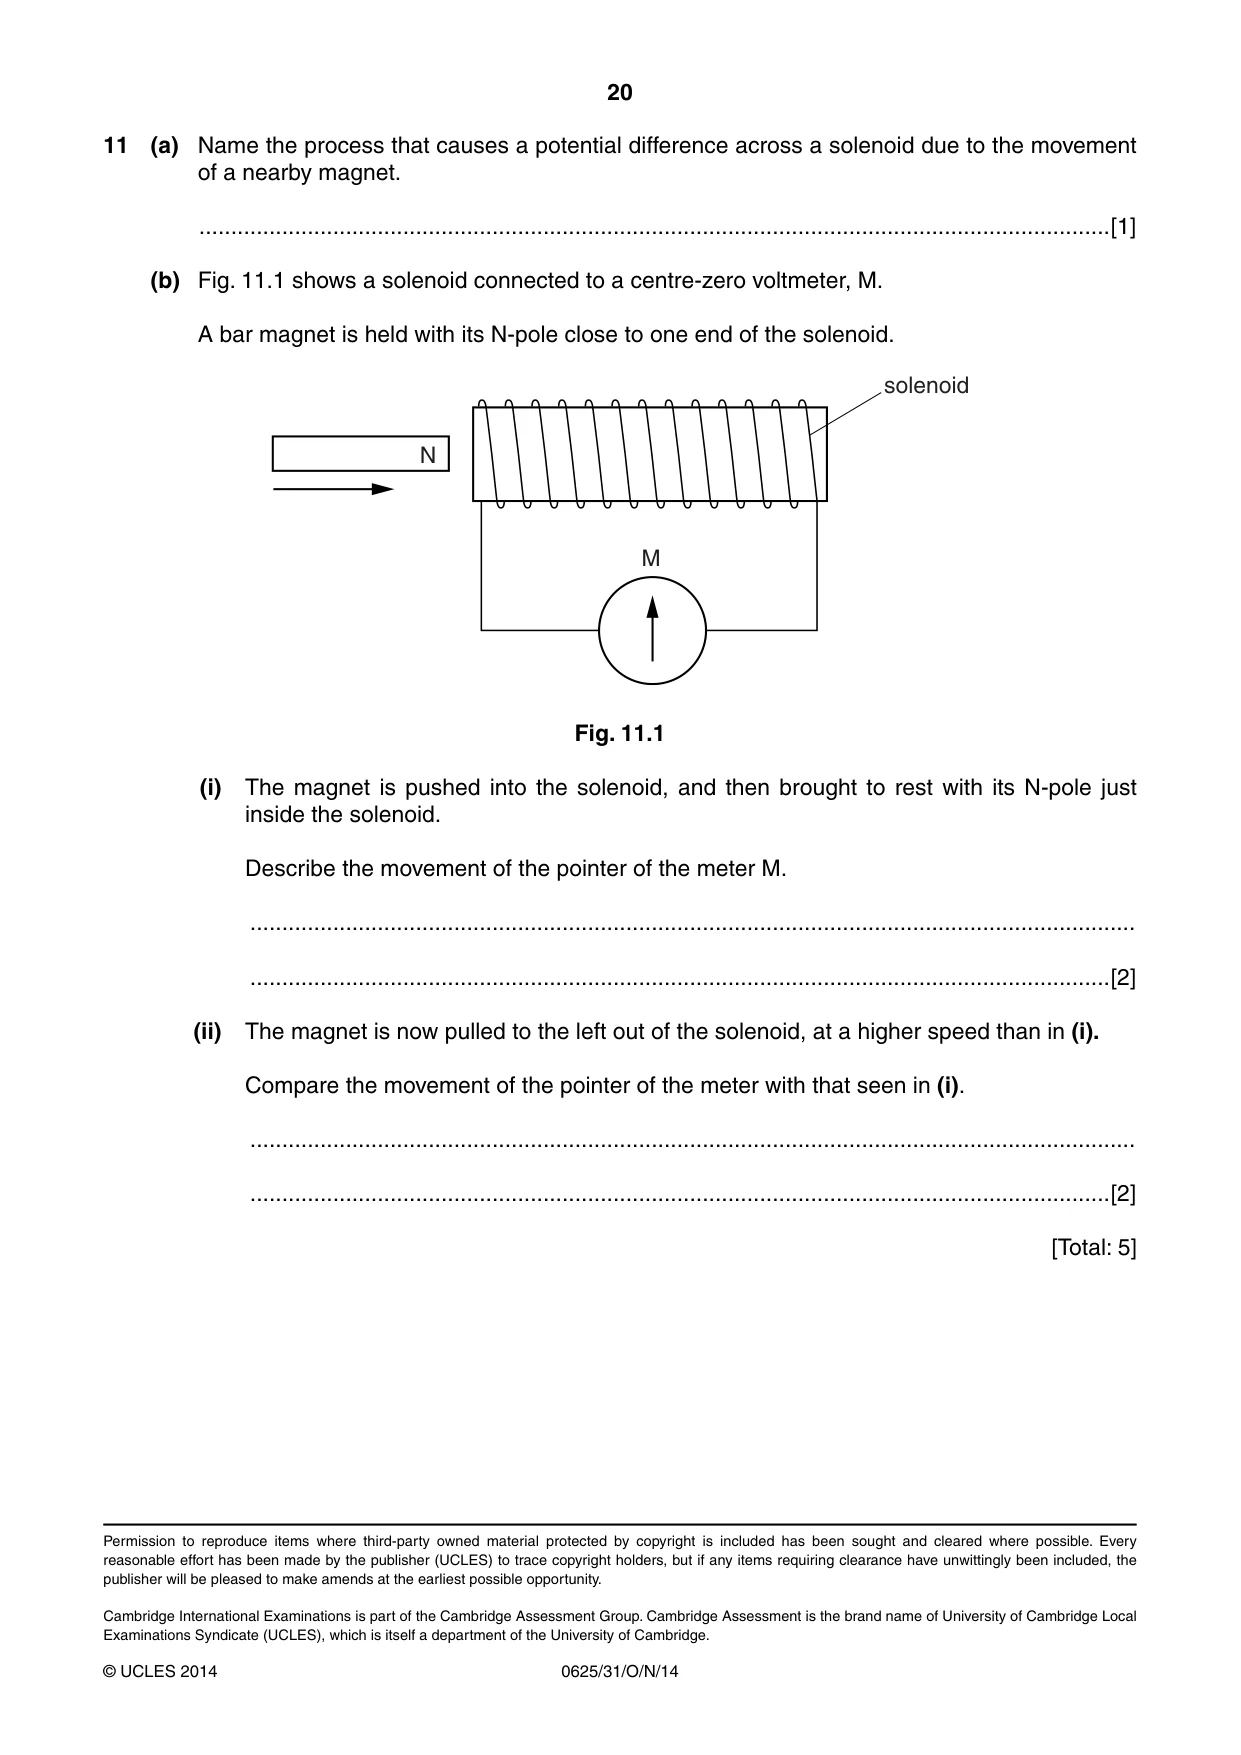
11 (a) Name the process that causes a potential difference across a solenoid due to the movement of a nearby magnet. ...............................................................................................................................................[1] (b) Fig. 11.1 shows a solenoid connected to a centre-zero voltmeter, M. A bar magnet is held with its N-pole close to one end of the solenoid. solenoid N M Fig. 11.1 (i) The magnet is pushed into the solenoid, and then brought to rest with its N-pole just inside the solenoid. Describe the movement of the pointer of the meter M. ........................................................................................................................................... .......................................................................................................................................[2] (ii) The magnet is now pulled to the left out of the solenoid, at a higher speed than in (i). Compare the movement of the pointer of the meter with that seen in (i). ........................................................................................................................................... .......................................................................................................................................[2] [Total: 5]
Mark scheme: 11 (a) (i) electromagnetic induction B1 (b) (i) pointer deflects B1 pointer returns to zero B1 (ii) greater deflection (of pointer) B1 pointer deflects in opposite direction and returns to zero OR deflects for shorter time B1 [Total: 5]
What was in this paper
The subtopics covered by these 11 questions, and how many questions each got. Open one in a new tab to see every Cambridge question on it.
What you needed in this session
Cambridge’s own grade thresholds for 2014 Oct/Nov, Paper 3 · Variant 1. A higher threshold means an easier paper — the bar moves with how the cohort did.