Questions as text
Q1 · Two friends, Hatab and Yasin, went on a cycle ride 0580/31 Oct/Nov 2004
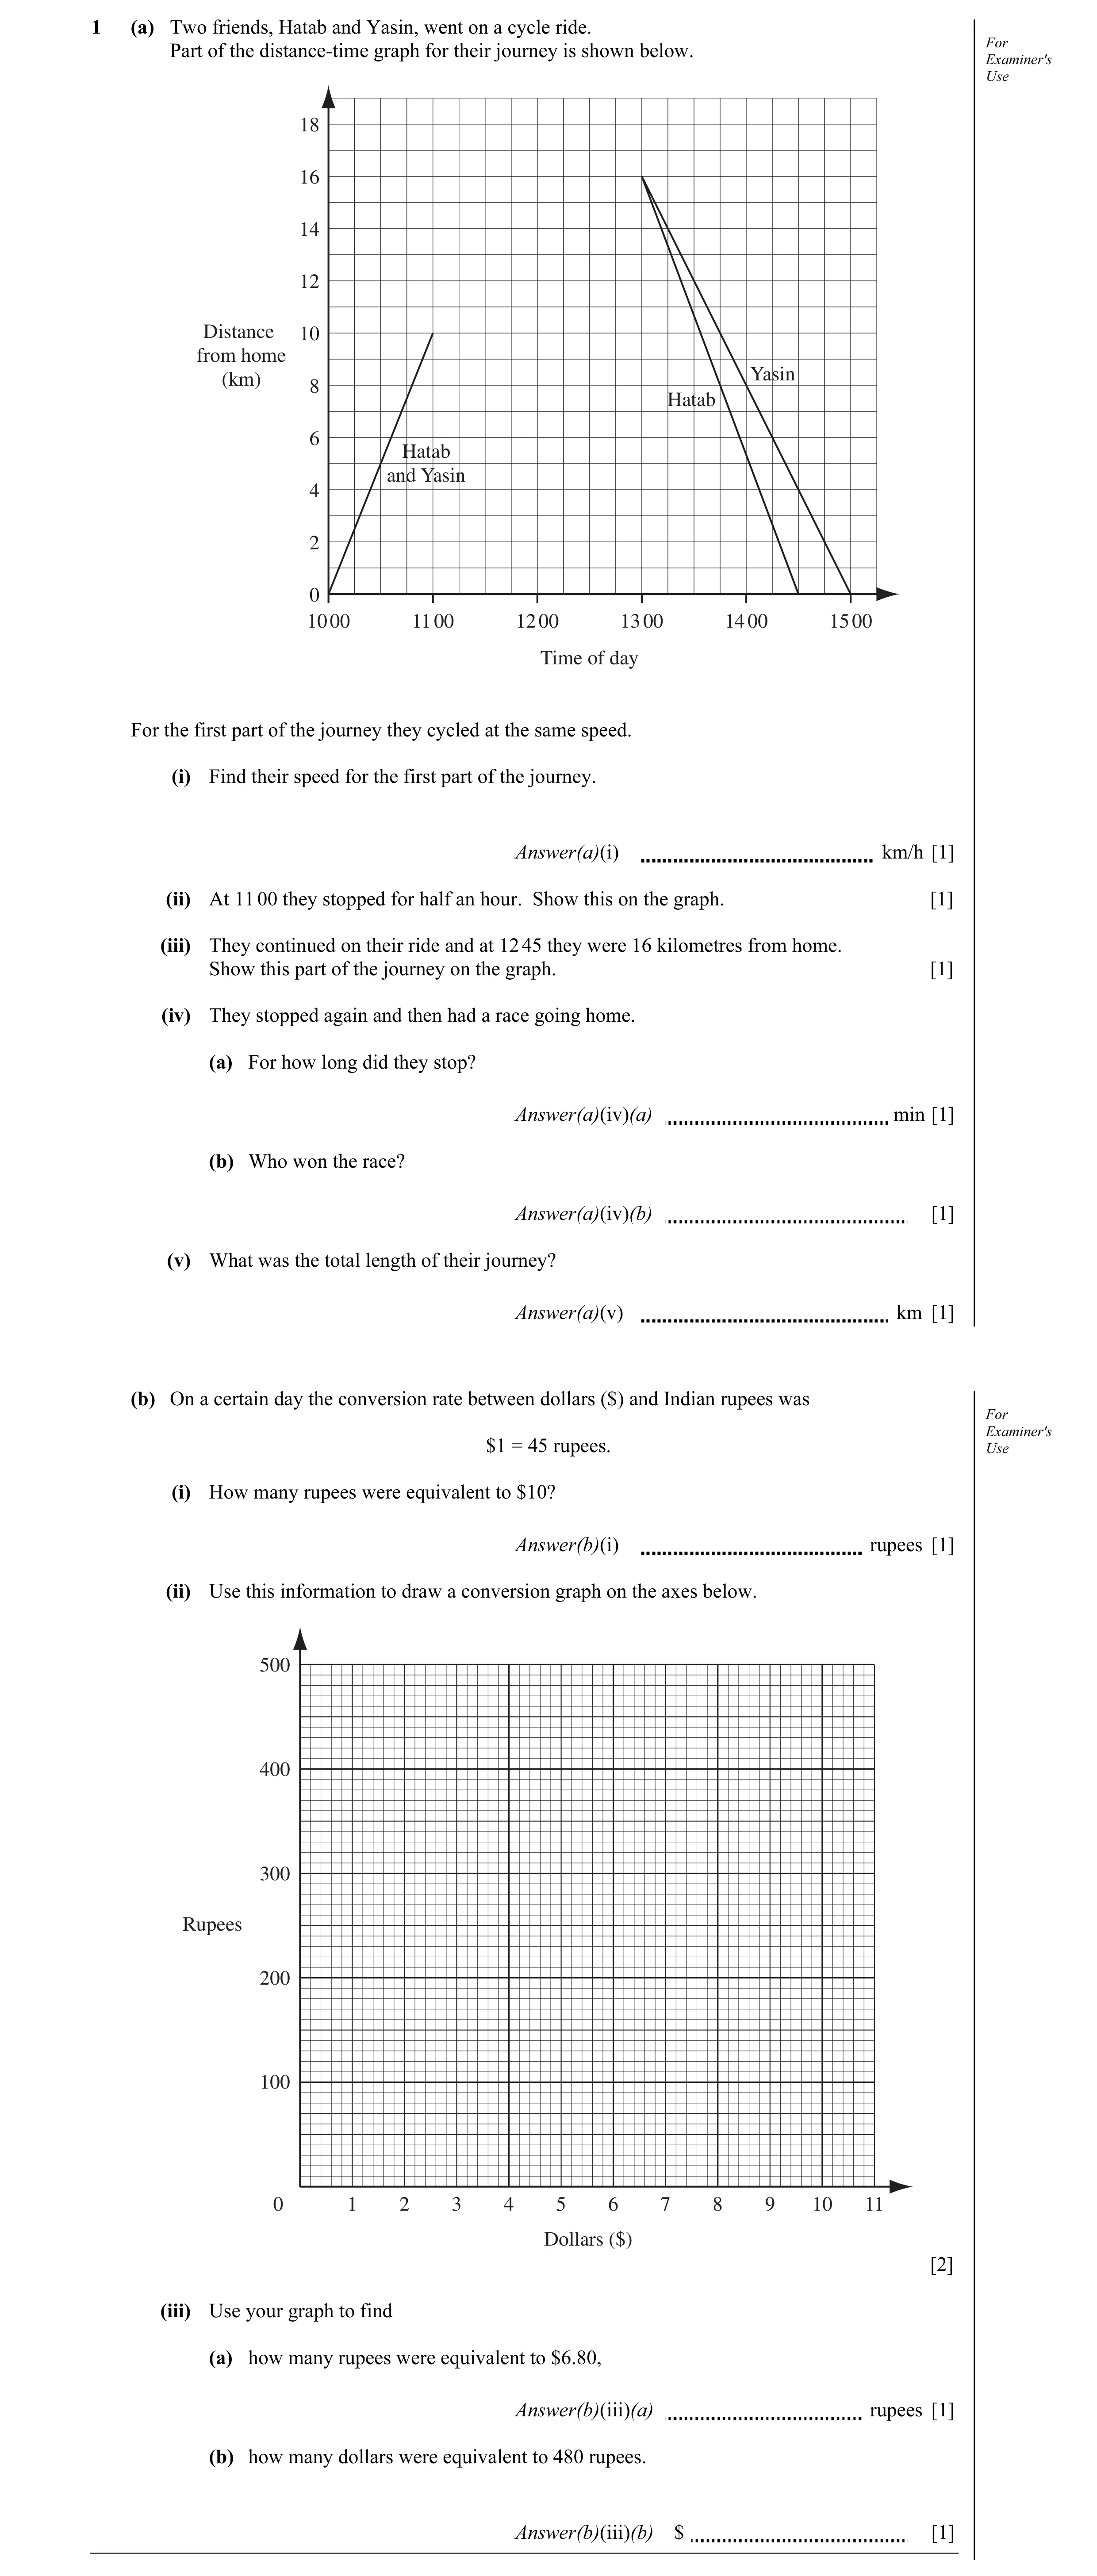
1 (a) Two friends, Hatab and Yasin, went on a cycle ride. For Part of the distance-time graph for their journey is shown below. Examiner's Use 18 16 14 12 Distance 10 from home Yasin (km) 8 Hatab 6 Hatab and Yasin 4 2 0 10 00 11 00 12 00 13 00 14 00 15 00 Time of day For the first part of the journey they cycled at the same speed. (i) Find their speed for the first part of the journey. Answer(a)(i) km/h [1] (ii) At 11 00 they stopped for half an hour. Show this on the graph. [1] (iii) They continued on their ride and at 12 45 they were 16 kilometres from home. Show this part of the journey on the graph. [1] (iv) They stopped again and then had a race going home. (a) For how long did they stop? Answer(a)(iv)(a) min [1] (b) Who won the race? Answer(a)(iv)(b) [1] (v) What was the total length of their journey? Answer(a)(v) km [1] (b) On a certain day the conversion rate between dollars ($) and Indian rupees was For Examiner's $1 = 45 rupees. Use (i) How many rupees were equivalent to $10? Answer(b)(i) rupees [1] (ii) Use this information to draw a conversion graph on the axes below. 500 400 300 Rupees 200 100 0 1 2 3 4 5 6 7 8 9 10 11 Dollars ($) [2] (iii) Use your graph to find (a) how many rupees were equivalent to $6.80, Answer(b)(iii)(a) rupees [1] (b) how many dollars were equivalent to 480 rupees. Answer(b)(iii)(b) $ [1]
11 marks
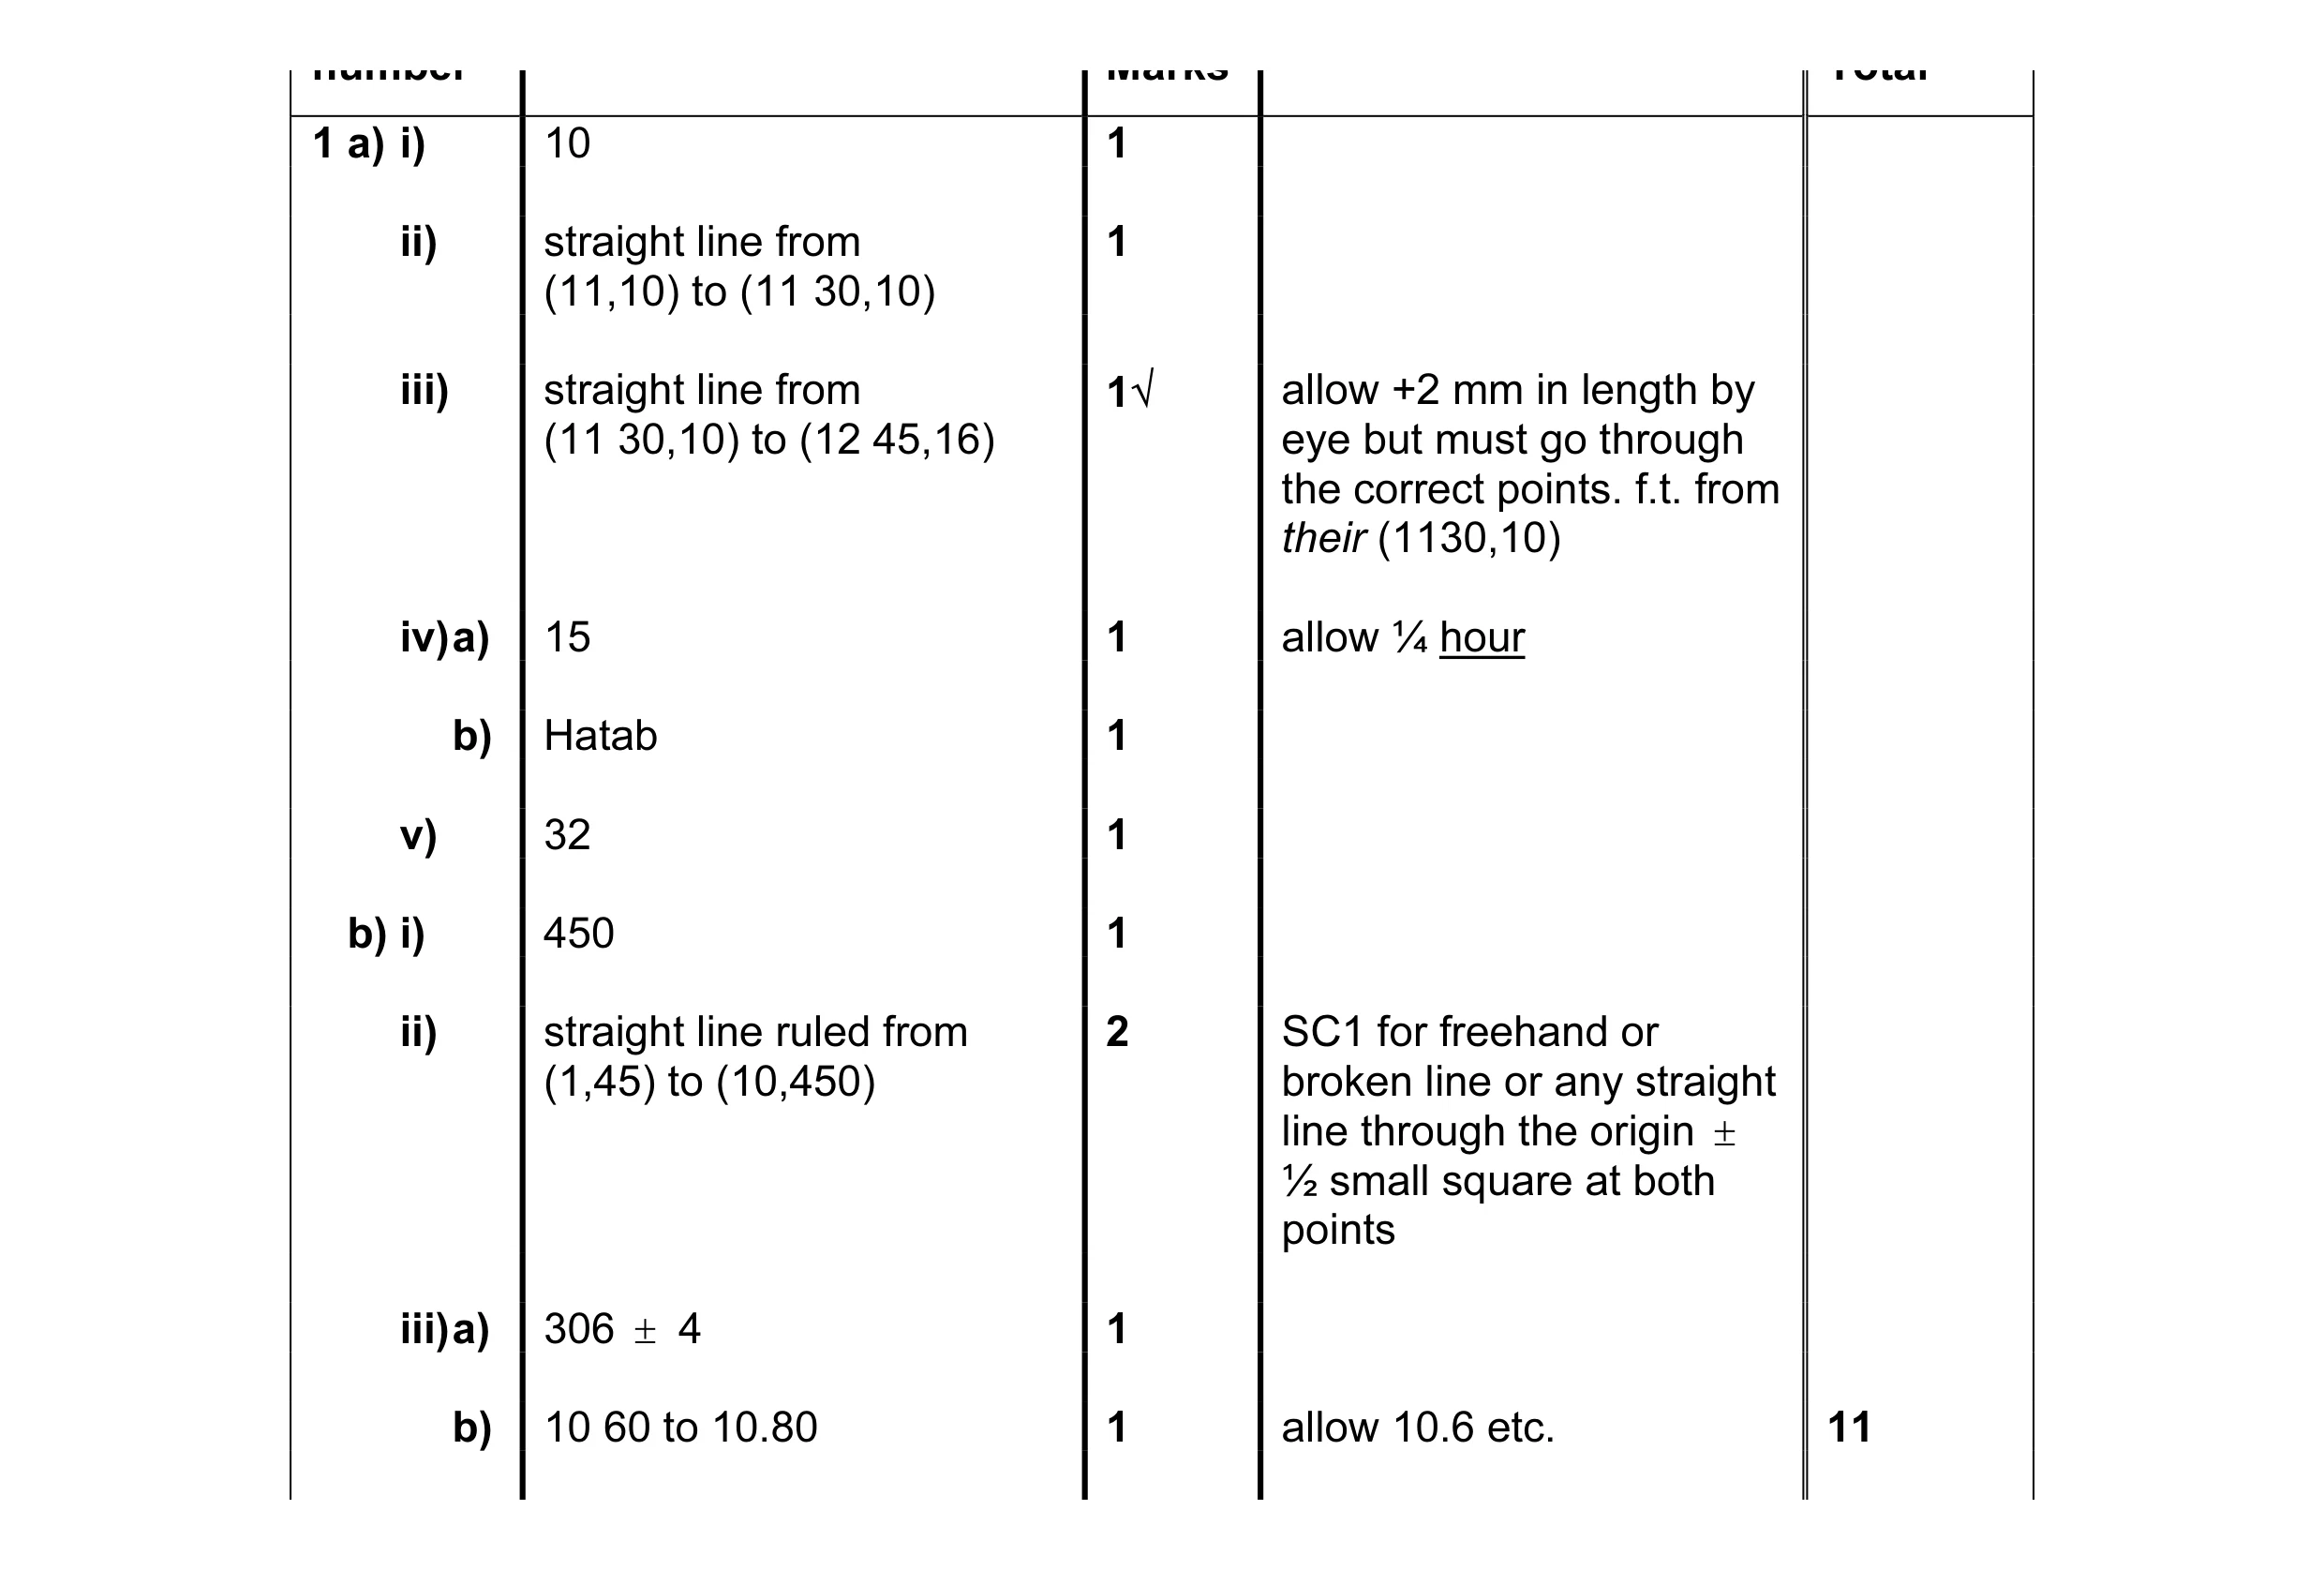
Mark scheme: number Marks Total 1 a) i) 10 1 ii) straight line from 1 (11,10) to (11 30,10) iii) straight line from 1√ allow +2 mm in length by (11 30,10) to (12 45,16) eye but must go through the correct points. f.t. from their (1130,10) iv) a) 15 1 allow ¼ hour b) Hatab 1 v) 32 1 b) i) 450 1 ii) straight line ruled from 2 SC1 for freehand or (1,45) to (10,450) broken line or any straight line through the origin ± ½ small square at both points iii) a) 306 ± 4 1 b) 10 60 to 10.80 1 allow 10.6 etc. 11
This question in 0580/31 Oct/Nov 2004
Q2 · 600 550 500 Seville 450 400 Distance from Madrid (km) 350 Cordoba 300 250 200 150 100 50… 0580/32 Oct/Nov 2014
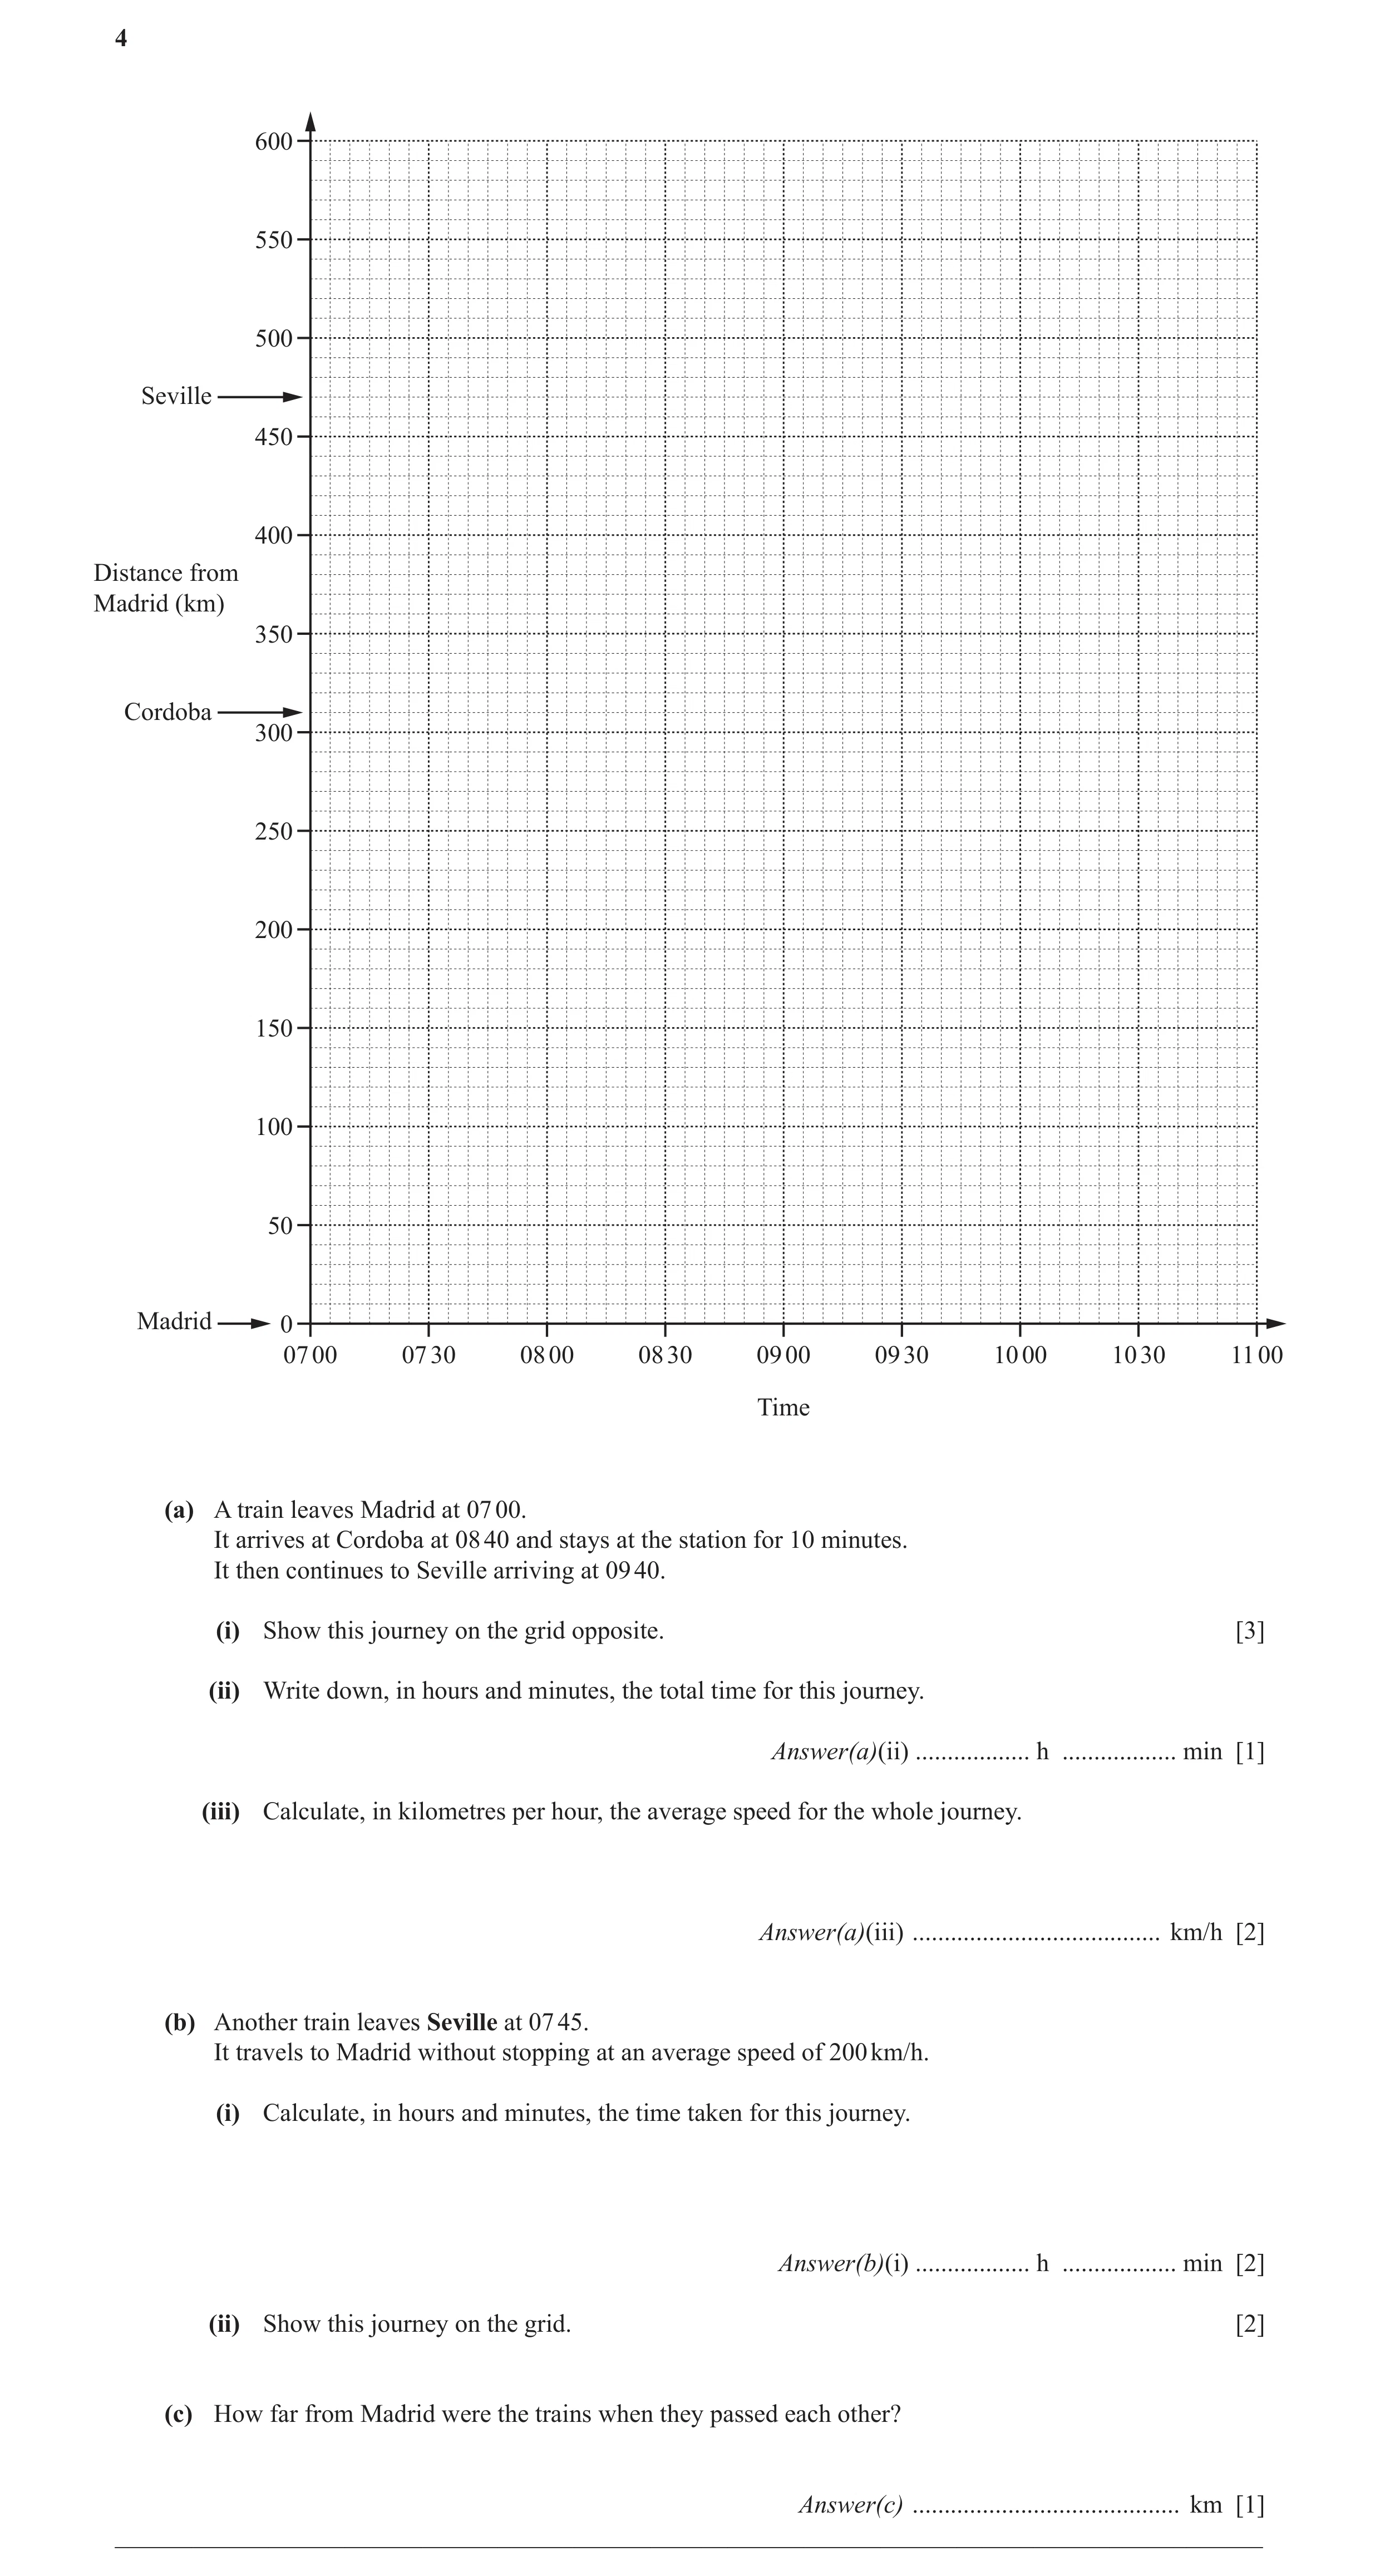
4 600 550 500 Seville 450 400 Distance from Madrid (km) 350 Cordoba 300 250 200 150 100 50 Madrid 0 07 00 07 30 08 00 08 30 09 00 09 30 10 00 10 30 11 00 Time (a) A train leaves Madrid at 07 00. It arrives at Cordoba at 08 40 and stays at the station for 10 minutes. It then continues to Seville arriving at 09 40. (i) Show this journey on the grid opposite. [3] (ii) Write down, in hours and minutes, the total time for this journey. Answer(a)(ii) … h … min [1] (iii) Calculate, in kilometres per hour, the average speed for the whole journey. Answer(a)(iii) … km/h [2] (b) Another train leaves Seville at 07 45. It travels to Madrid without stopping at an average speed of 200 km/h. (i) Calculate, in hours and minutes, the time taken for this journey. Answer(b)(i) … h … min [2] (ii) Show this journey on the grid. [2] (c) How far from Madrid were the trains when they passed each other? Answer(c) … km [1] __________________________________________________________________________________________
11 marks
Mark scheme: 4 (a) (i) Line (0700, 0) to (08 40, 310) 1 Lines need not be ruled and could be curves Horizontal line 2 squares 1FT with positive gradients throughout. Line their (08 50, 310) to (09 40, 470) 1FT (ii) 2[h]40[min] 1 (iii) 176.25 2 M1FT for 470 ÷ their (a)(ii) (b) (i) 2[h]21[min] 2 M1 for 470 ÷ 200 soi (ii) Line from (07 45, 470) to (their 10 06, 2FT B1 for (07 45, 470) correctly plotted 0) or B1FT for (their 10 06, 0) correctly plotted (c) 290 to 300 1FT (Correct or follow through) FT from intersection on their graph.
This question in 0580/32 Oct/Nov 2014
Q3 · The travel graph shows a journey of a train from A to C, stopping at B 0580/33 May/June 2015
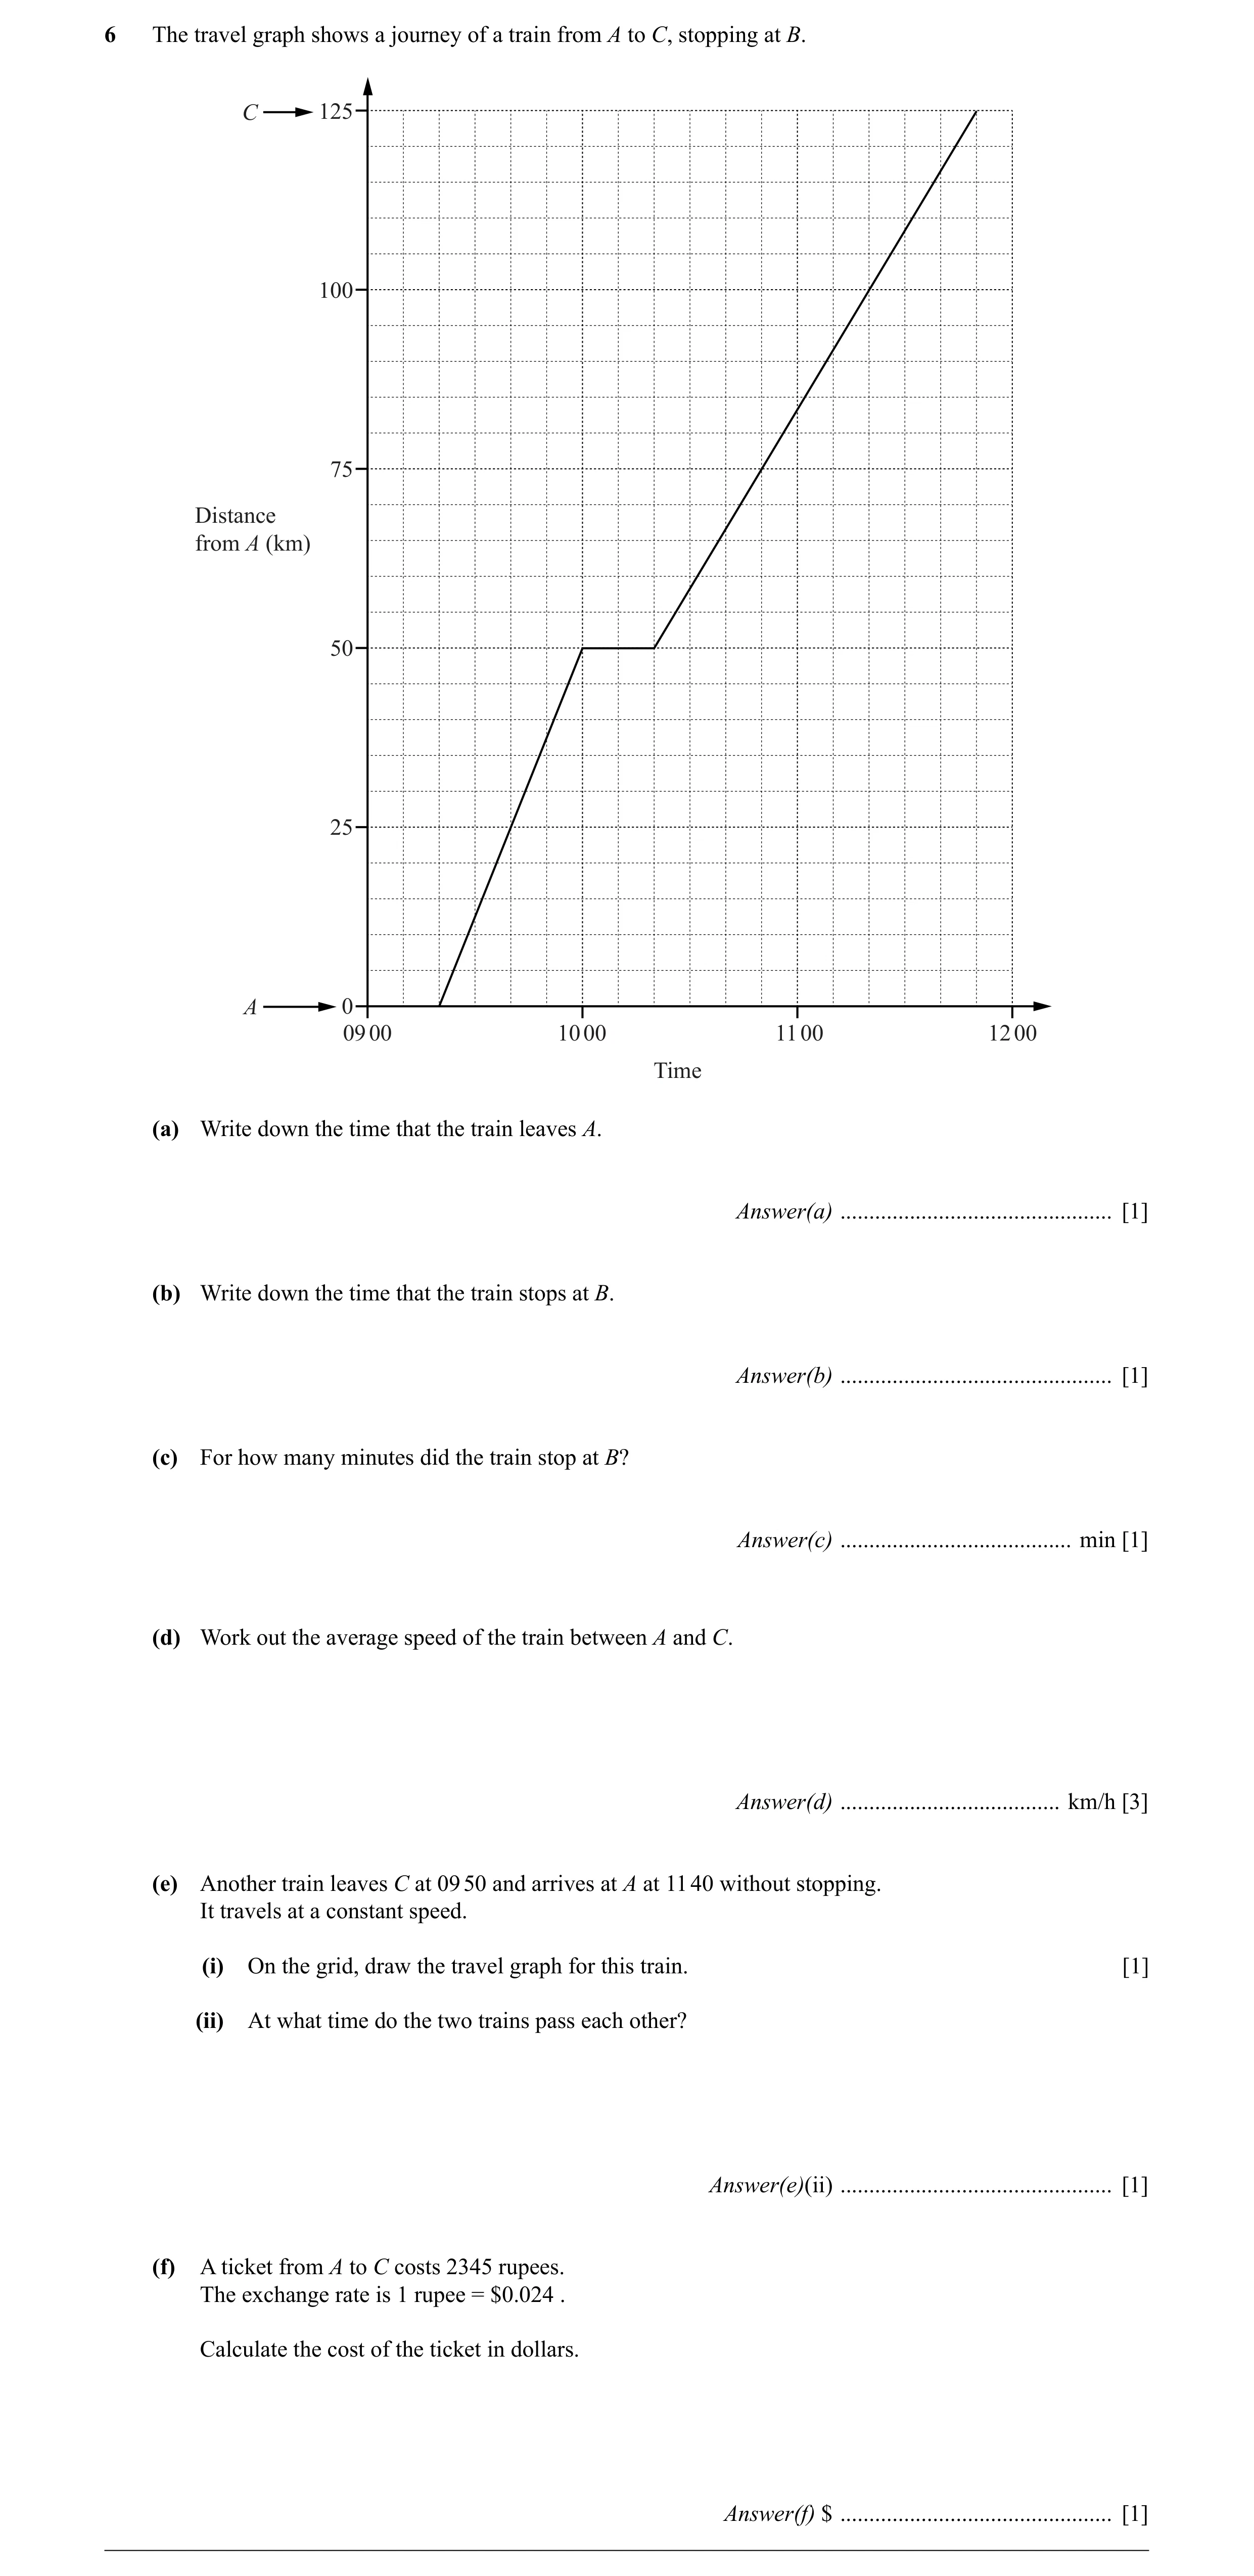
6 The travel graph shows a journey of a train from A to C, stopping at B. C 125 100 75 Distance from A (km) 50 25 A 0 09 00 10 00 11 00 12 00 Time (a) Write down the time that the train leaves A. Answer(a) … [1] (b) Write down the time that the train stops at B. Answer(b) … [1] (c) For how many minutes did the train stop at B? Answer(c) … min [1] (d) Work out the average speed of the train between A and C. Answer(d) … km/h [3] (e) Another train leaves C at 09 50 and arrives at A at 11 40 without stopping. It travels at a constant speed. (i) On the grid, draw the travel graph for this train. [1] (ii) At what time do the two trains pass each other? Answer(e)(ii) … [1] (f) A ticket from A to C costs 2345 rupees. The exchange rate is 1 rupee = $0.024 . Calculate the cost of the ticket in dollars. Answer(f) $ … [1]
9 marks
Mark scheme: 6 (a) 09 20 1 (b) 10 00 1 (c) 20 1 (d) 50 3 M1 for use of 125 ÷ their time B1 for time = 2.5 (e) (i) points (09 50, 125) and (11 40, 0) 1 plotted and joined with a ruled continuous line (ii) 10 40 to 10 50 1FT FT their line (f) 56.28 final answer cao 1
This question in 0580/33 May/June 2015
Q4 · 36 Wegmouth 32 28 Distance (km) 24 20 Tyneland 16 12 8 4 Seatown 0 11 00 11 30 12 00 12… 0580/33 May/June 2017
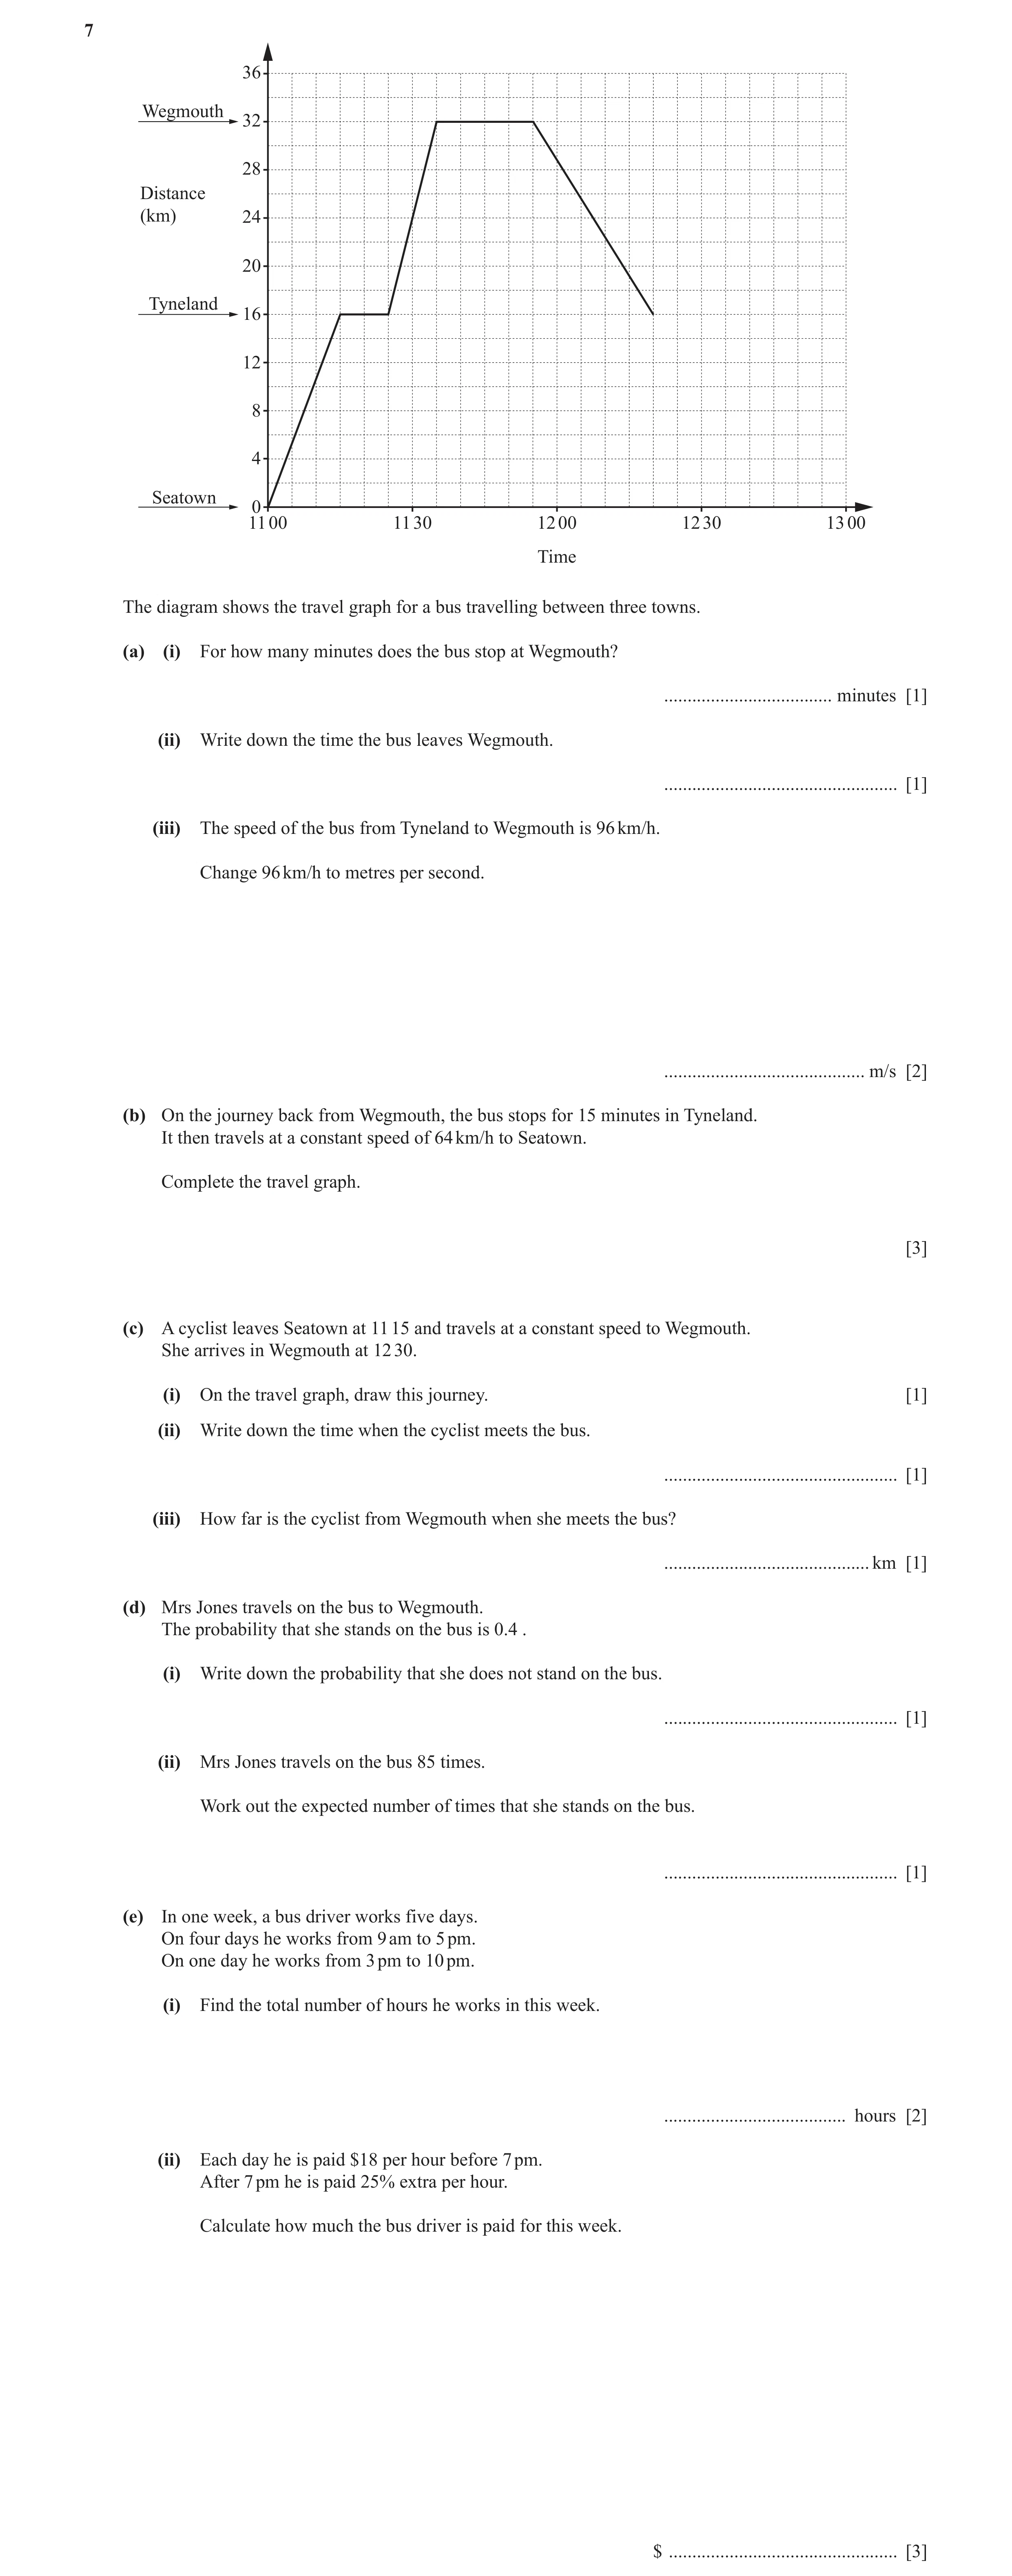
7 36 Wegmouth 32 28 Distance (km) 24 20 Tyneland 16 12 8 4 Seatown 0 11 00 11 30 12 00 12 30 13 00 Time The diagram shows the travel graph for a bus travelling between three towns. (a) (i) For how many minutes does the bus stop at Wegmouth? … minutes [1] (ii) Write down the time the bus leaves Wegmouth. … [1] (iii) The speed of the bus from Tyneland to Wegmouth is 96 km/h. Change 96 km/h to metres per second. … m/s [2] (b) On the journey back from Wegmouth, the bus stops for 15 minutes in Tyneland. It then travels at a constant speed of 64 km/h to Seatown. Complete the travel graph. [3] (c) A cyclist leaves Seatown at 11 15 and travels at a constant speed to Wegmouth. She arrives in Wegmouth at 12 30. (i) On the travel graph, draw this journey. [1] (ii) Write down the time when the cyclist meets the bus. … [1] (iii) How far is the cyclist from Wegmouth when she meets the bus? … km [1] (d) Mrs Jones travels on the bus to Wegmouth. The probability that she stands on the bus is 0.4 . (i) Write down the probability that she does not stand on the bus. … [1] (ii) Mrs Jones travels on the bus 85 times. Work out the expected number of times that she stands on the bus. … [1] (e) In one week, a bus driver works five days. On four days he works from 9 am to 5 pm. On one day he works from 3 pm to 10 pm. (i) Find the total number of hours he works in this week. … hours [2] (ii) Each day he is paid $18 per hour before 7 pm. After 7 pm he is paid 25% extra per hour. Calculate how much the bus driver is paid for this week. $ … [3]
17 marks
Mark scheme: 7(a)(i) 20 1 7(a)(ii) 11 55 1 7(a)(iii) 2 2 96 26 or 26.7 or 26.66 to 26.67 M1 for 96 × 1000 or oe 3 3600 or B1 for figs 267 or better 7(b) Ruled horizontal line from 1 (12 20, 16) to (12 35,16) Ruled line from 2 16 M1 for [ × 60 ] (their 12 35, 16) to 64 (their 12 35+15, 0) 7(c)(i) Ruled line from 1 (11 15, 0) to (12 30, 32) 7(c)(ii) 12 09 1FT FT their graph 7(c)(iii) 9 1FT FT their graph 7(d)(i) 0.6 oe 1 7(d)(ii) 34 1 7(e)(i) 39 2 B1 for 32 or 7 and 8 seen 7(e)(ii) 715.5[0] 3 M2 for (their e(i) – 3) × 18 + 3 × 18 × 1.25 oe or M1 for (their e(i) – 3) × 18 or [3] × 18 × 1.25 or [3] × 18 × 0.25 oe
This question in 0580/33 May/June 2017
Q5 · Three children from the same family travel from their home to the same school 0580/31 May/June 2018
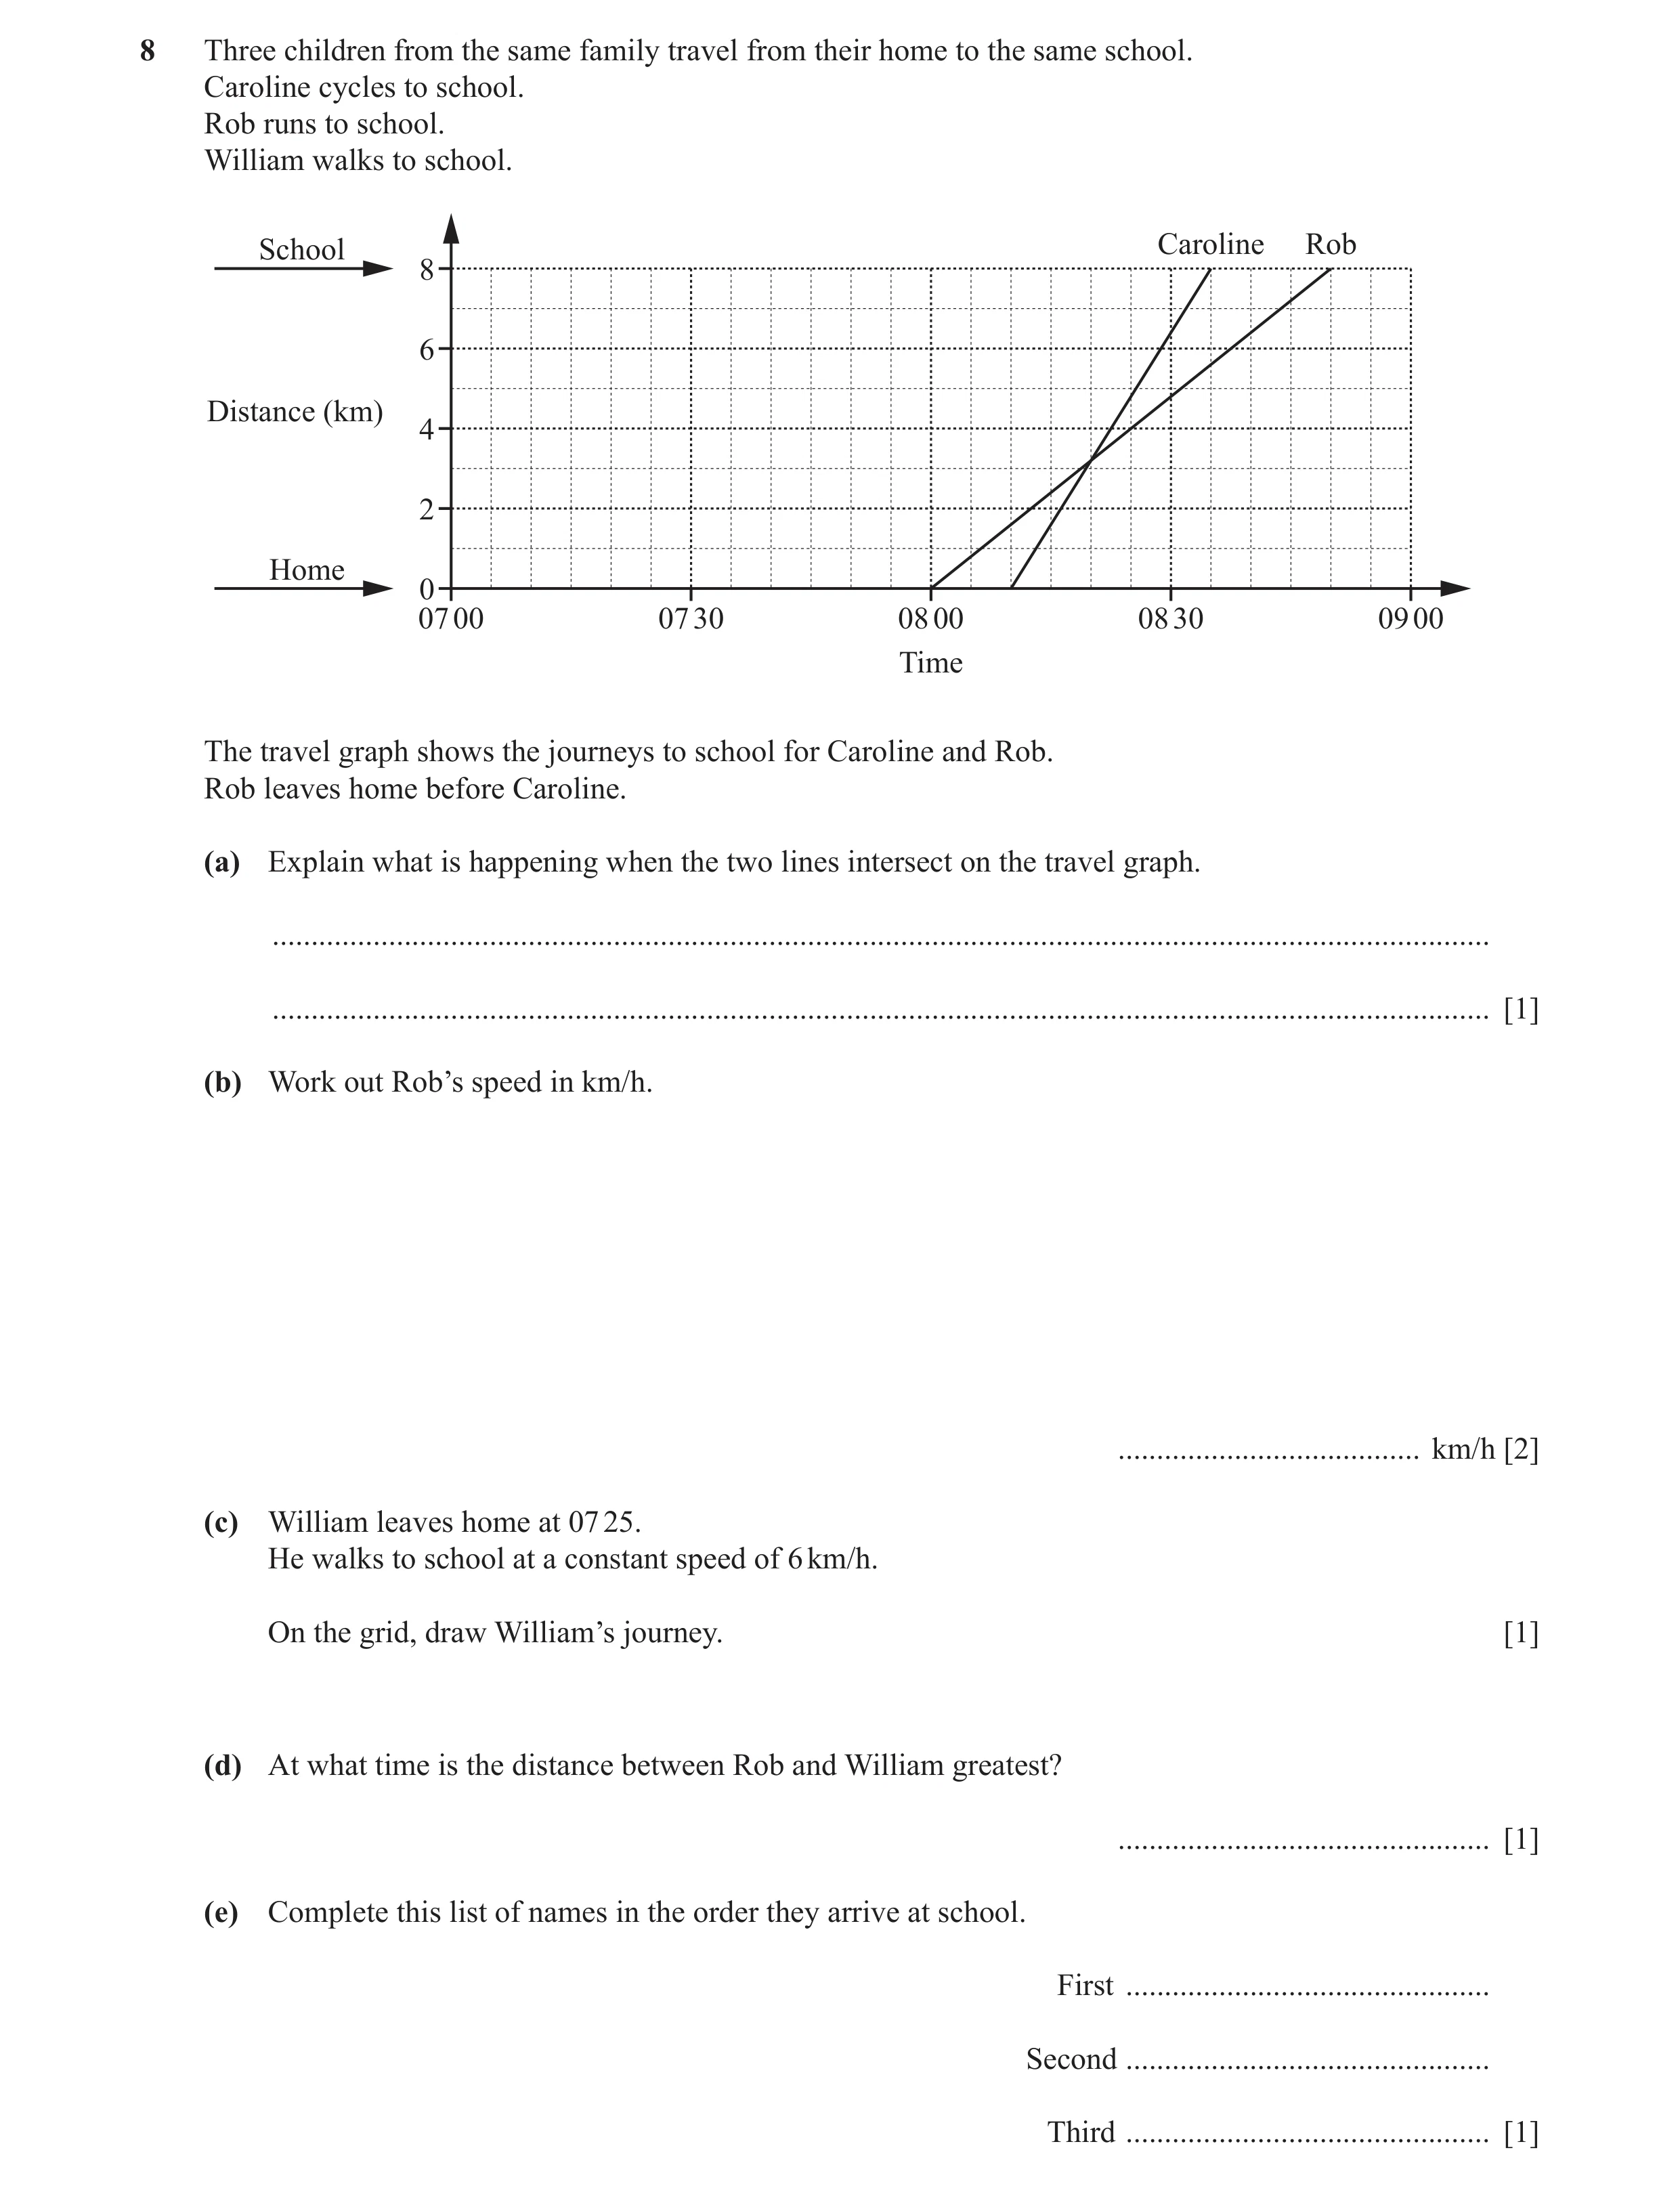
8 Three children from the same family travel from their home to the same school. Caroline cycles to school. Rob runs to school. William walks to school. School Caroline Rob 8 6 Distance (km) 4 2 Home 0 07 00 07 30 08 00 08 30 09 00 Time The travel graph shows the journeys to school for Caroline and Rob. Rob leaves home before Caroline. (a) Explain what is happening when the two lines intersect on the travel graph. … … [1] (b) Work out Rob’s speed in km/h. … km/h [2] (c) William leaves home at 07 25. He walks to school at a constant speed of 6 km/h. On the grid, draw William’s journey. [1] (d) At what time is the distance between Rob and William greatest? … [1] (e) Complete this list of names in the order they arrive at school. First … Second … Third … [1]
6 marks
Mark scheme: 8(a) Caroline cycles past Rob oe 1 8(b) 9.6 2 8 M1 for [× 60 ] 50 8(c) Ruled line from (07 25, 0) to 1 (08 45, 8) 8(d) 08 00 1 8(e) Caroline 1 FT from William’s straight line, provided it William reaches at 8 km Rob
This question in 0580/31 May/June 2018
Q6 · Louise leaves home at 09 55 and cycles the 5.6 km to the supermarket at a constant speed 0580/32 May/June 2018
7 Louise leaves home at 09 55 and cycles the 5.6 km to the supermarket at a constant speed. She takes 15 minutes to complete the journey. (a) Write down the time she arrives at the supermarket. … [1] (b) Calculate Louise’s average speed from her home to the supermarket (i) in kilometres per hour, … km/h [1] (ii) in metres per second, giving your answer correct to 1 decimal place. … m/s [2] (c) Louise stays at the supermarket for 23 minutes. On the grid opposite, draw the travel graph of her journey from home and her stay at the supermarket. [2] (d) Louise’s mother leaves home at 10 07 to meet Louise at the supermarket. She cycles at a constant speed of 28 km/h. (i) Work out how long she takes for the 5.6 km journey. Give your answer in minutes. … min [2] (ii) On the grid, show her mother’s journey. [1] (e) They cycle home together at a constant speed and arrive at 10 54. (i) On the grid, show their journey home. [1] (ii) Calculate, in km/h, their constant speed on the journey home. … km/h [2] 7 6 Supermarket 5 4 Distance from home (km) 3 2 1 Home 0 09 50 10 00 10 10 10 20 10 30 10 40 10 50 11 00 Time
12 marks
Mark scheme: 7(a) 10 10 1 7(b)(i) 22.4 1 7(b)(ii) 6.2 2 2FT their (b)(i) × 1000 ÷ (60 × 60) oe rounded to 1dp or M1 for their (b)(i) × 1000 ÷ (60 × 60) oe or 5600 ÷ (15 × 60) oe 7(c) Two correct ruled lines 2 B1FT for a line (09 55, 0) to (their 7(a), 5.6) B1FT for horizontal line (their 7(a), 5.6) to (their 7(a) + 23, 5.6) 7(d)(i) 12 2 M1 for 5.6 ÷ 28 [× 60] 7(d)(ii) Correct line 1 FT line from (10 07, 0) to (10 07 + their (d)(i), their 5.6) 7(e)(i) Correct line 1 FT line from (their 7(a) + 23, 5.6) to (10 54, 0) 7(e)(ii) 16 2 2FT 5.6 ÷ (their time in minutes) × 60 M1 for 5.6 ÷ 21 [× 60] soi or for 5.6 ÷ (their time in minutes)[× 60]
This question in 0580/32 May/June 2018
Q7 · C 40 30 Cost ($) 20 10 0 0 1 2 3 4 5 6 7 8 9 10 d Distance travelled (km) (i) The graph… 0580/32 Feb/March 2020
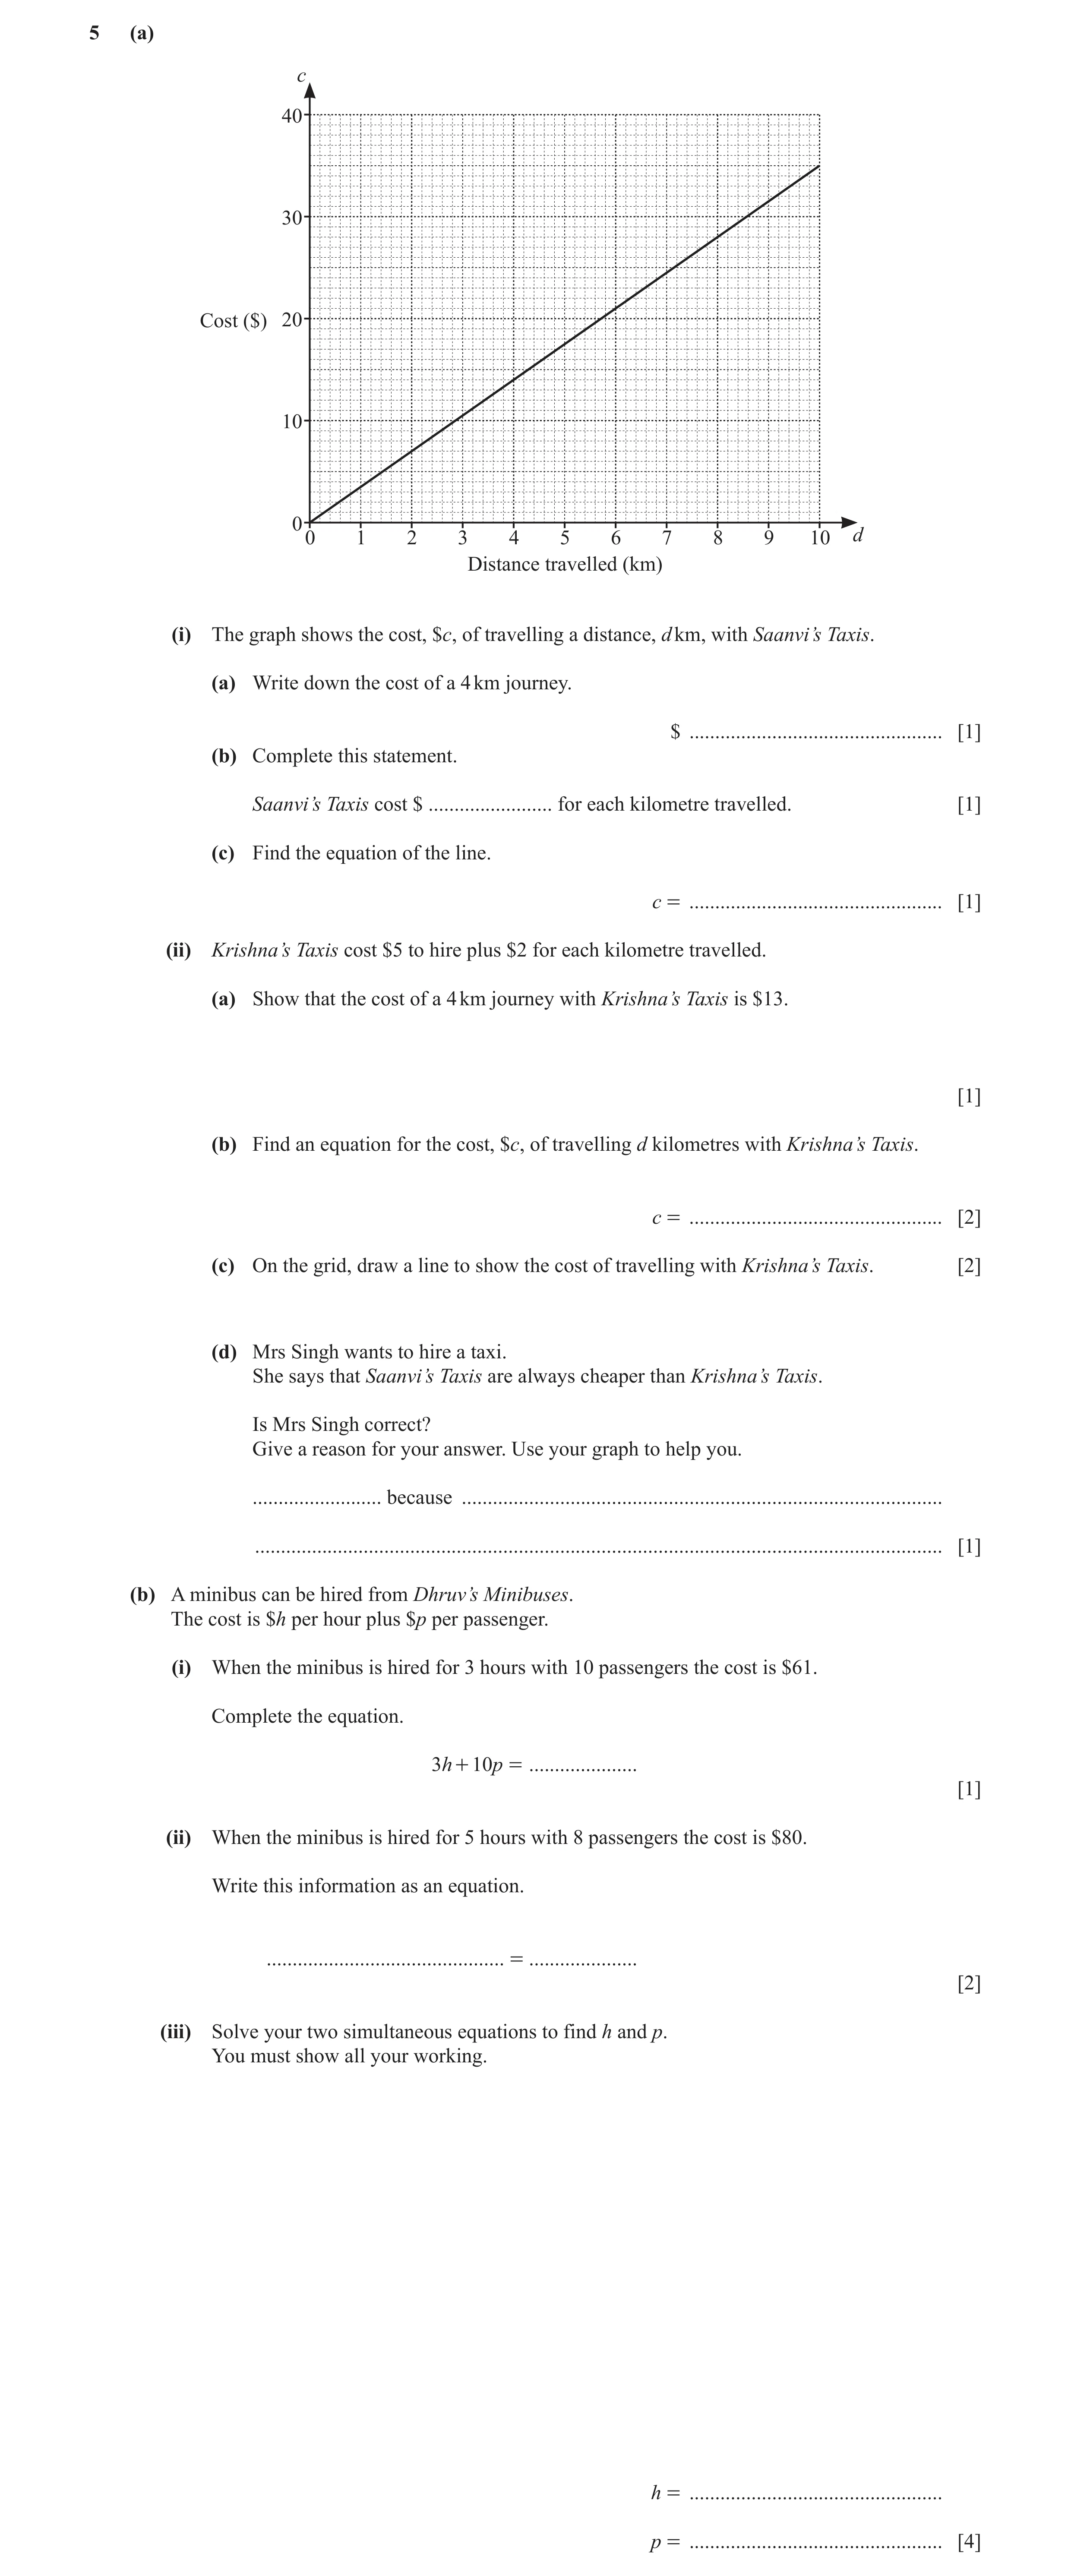
5 (a) c 40 30 Cost ($) 20 10 0 0 1 2 3 4 5 6 7 8 9 10 d Distance travelled (km) (i) The graph shows the cost, $c, of travelling a distance, d km, with Saanvi’s Taxis. (a) Write down the cost of a 4 km journey. $ … [1] (b) Complete this statement. Saanvi’s Taxis cost $ … for each kilometre travelled. [1] (c) Find the equation of the line. c = … [1] (ii) Krishna’s Taxis cost $5 to hire plus $2 for each kilometre travelled. (a) Show that the cost of a 4 km journey with Krishna’s Taxis is $13. [1] (b) Find an equation for the cost, $c, of travelling d kilometres with Krishna’s Taxis. c = … [2] (c) On the grid, draw a line to show the cost of travelling with Krishna’s Taxis. [2] (d) Mrs Singh wants to hire a taxi. She says that Saanvi’s Taxis are always cheaper than Krishna’s Taxis. Is Mrs Singh correct? Give a reason for your answer. Use your graph to help you. … because … … [1] (b) A minibus can be hired from Dhruv’s Minibuses. The cost is $h per hour plus $p per passenger. (i) When the minibus is hired for 3 hours with 10 passengers the cost is $61. Complete the equation. 3h + 10p = … [1] (ii) When the minibus is hired for 5 hours with 8 passengers the cost is $80. Write this information as an equation. … = … [2] (iii) Solve your two simultaneous equations to find h and p. You must show all your working. h = … p = … [4]
16 marks
Mark scheme: 5(a)(i)(a) 14 1 5(a)(i)(b) 3.5[0] 1 5(a)(i)(c) [c=] 3.5d 1 FT their (a)(i)(b) 5(a)(ii)(a) 2 × 4 + 5 1 5(a)(ii)(b) [c=] 2d + 5 2 M1 for 2 d + k or md + 5, m ≠ 0 5(a)(ii)(c) Correct ruled line 2 M1 for ruled line with intercept (0, 5) or for ruled line with gradient 2 or for 2 correct points plotted or for their c= 2d + 5 correctly drawn 5(a)(ii)(d) No, with correct reason 1 FT if two intersecting linear graphs 5(b)(i) 61 1 5(b)(ii) 5h + 8p = 80 2 M1 for 5h + 8p 5(b)(iii) For correctly equating one set of M1 coefficients For correct method to eliminate M1 one variable [h =] 12 A1 [p =] 2.5 A1 If 0 scored, SC1 for 2 values satisfying one of the original equations or SC1 for both correct but no working
This question in 0580/32 Feb/March 2020
Q8 · The diagram shows the travel graph of a train journey from Wengen to Kleine Scheidegg 0580/31 Oct/Nov 2021
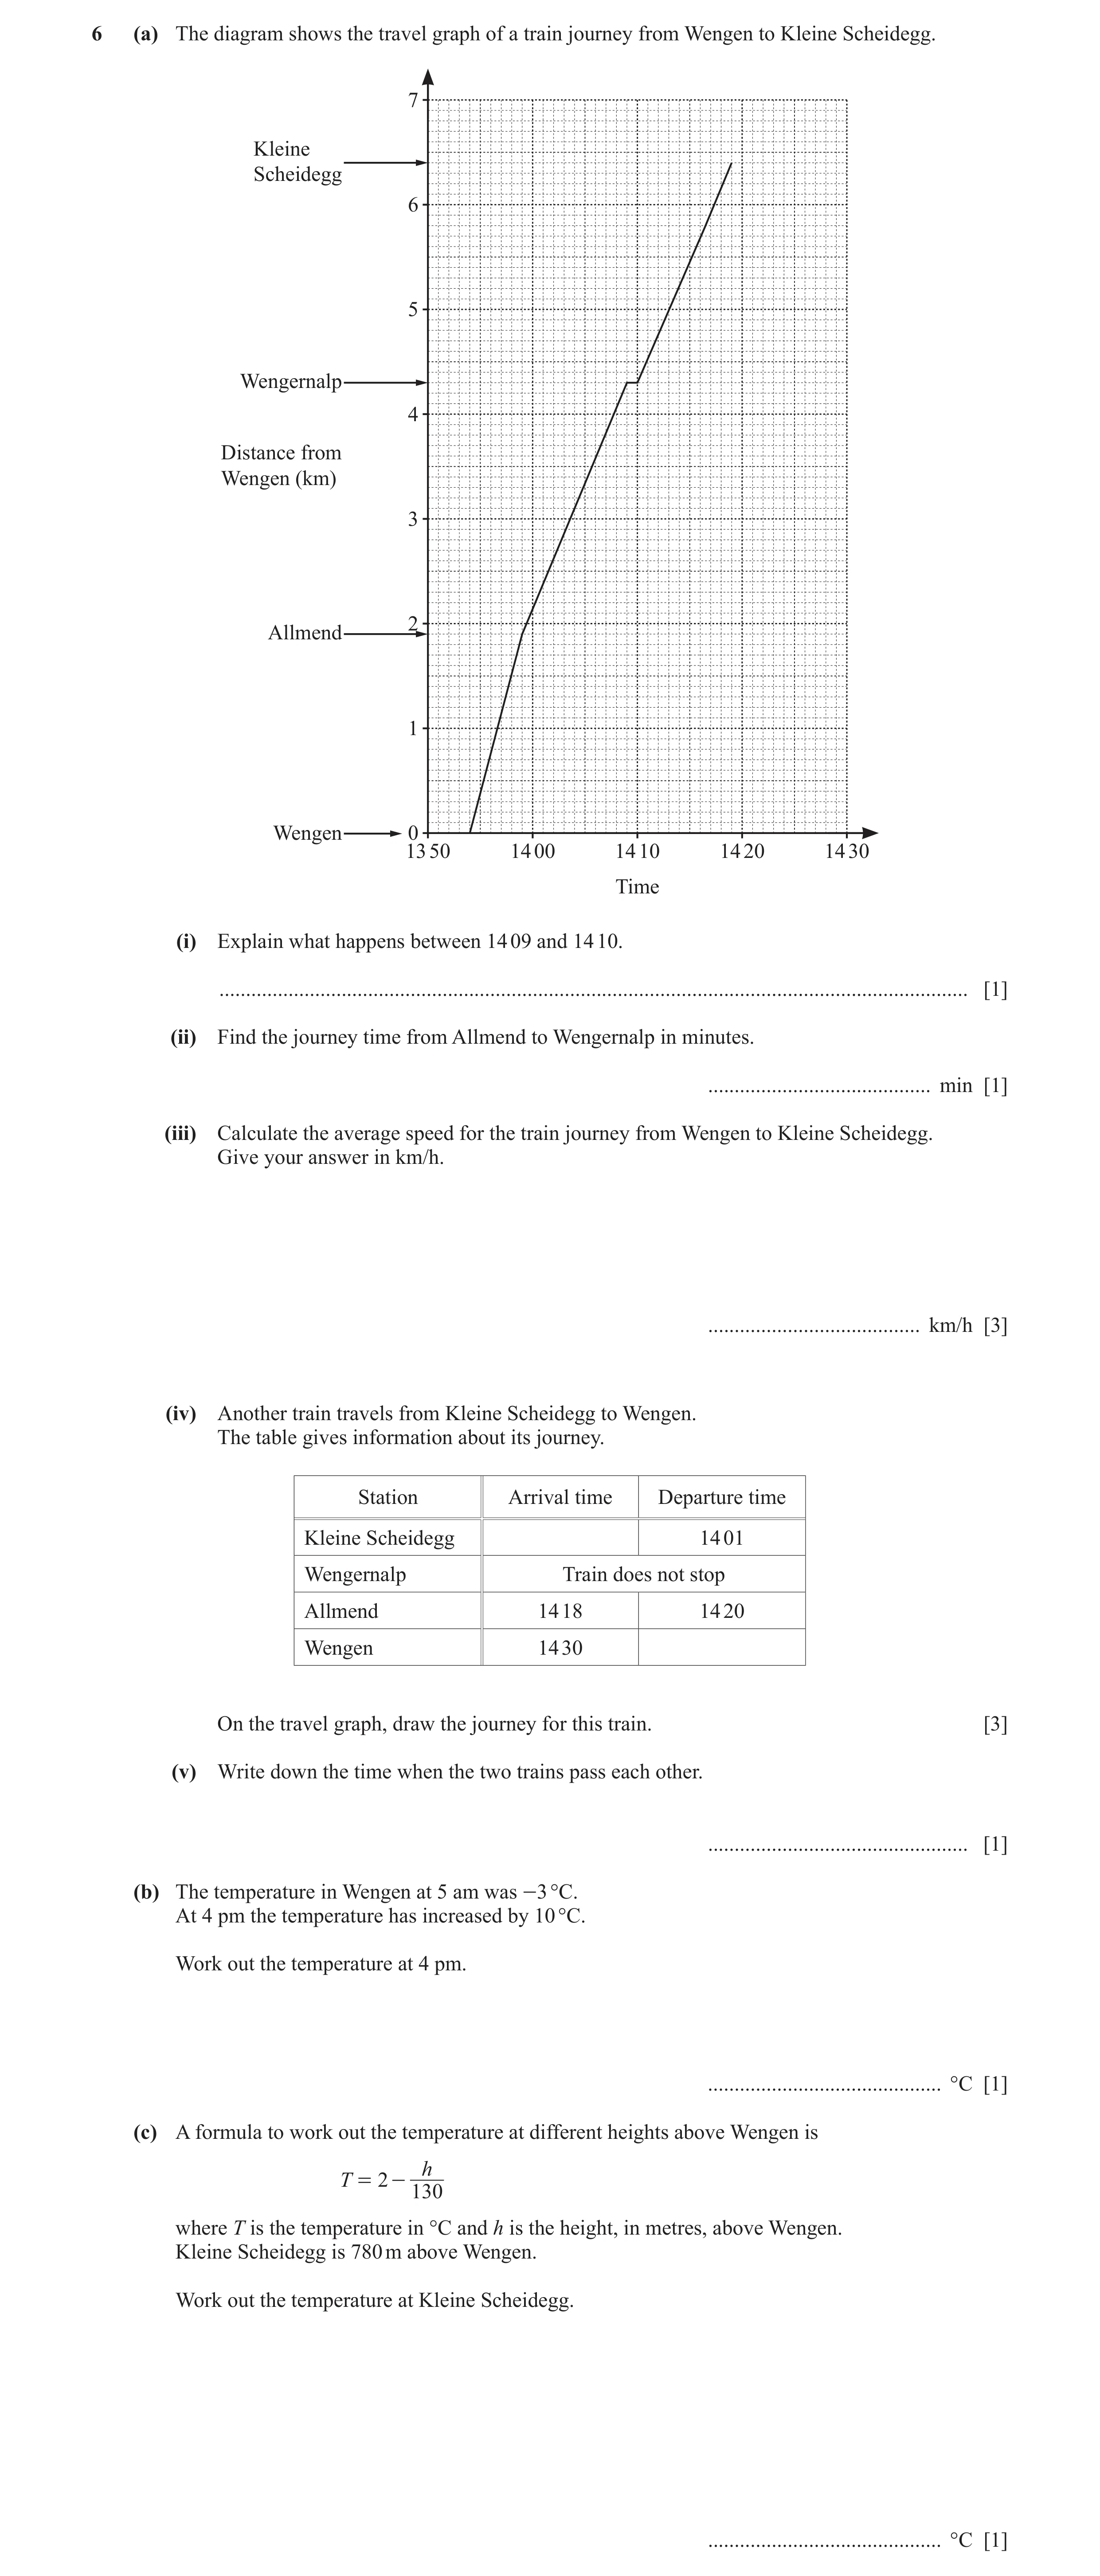
6 (a) The diagram shows the travel graph of a train journey from Wengen to Kleine Scheidegg. 7 Kleine Scheidegg 6 5 Wengernalp 4 Distance from Wengen (km) 3 2 Allmend 1 Wengen 0 13 50 14 00 14 10 14 20 14 30 Time (i) Explain what happens between 14 09 and 14 10. … [1] (ii) Find the journey time from Allmend to Wengernalp in minutes. … min [1] (iii) Calculate the average speed for the train journey from Wengen to Kleine Scheidegg. Give your answer in km/h. … km/h [3] (iv) Another train travels from Kleine Scheidegg to Wengen. The table gives information about its journey. Station Arrival time Departure time Kleine Scheidegg 14 01 Wengernalp Train does not stop Allmend 14 18 14 20 Wengen 14 30 On the travel graph, draw the journey for this train. [3] (v) Write down the time when the two trains pass each other. … [1] (b) The temperature in Wengen at 5 am was -3 °C. At 4 pm the temperature has increased by 10 °C. Work out the temperature at 4 pm. … °C [1] (c) A formula to work out the temperature at different heights above Wengen is h T = 2 - 130 where T is the temperature in °C and h is the height, in metres, above Wengen. Kleine Scheidegg is 780 m above Wengen. Work out the temperature at Kleine Scheidegg. … °C [1]
11 marks
Mark scheme: 6(a)(i) [Train] stopped oe 1 6(a)(ii) 10 1 6(a)(iii) 15.36 3 B1 for 25 [mins] or 6.4 [km] or 0.416[6…][h] or 0.417[h] soi M1 for 6.4 ÷ their time 6(a)(iv) Three correct ruled lines 3 B1 for a line from (14 01, 6.4) to (14 18, 1.9) B1FT for a line from their (14 18, 1.9) to (their 14 18 + 2, their 1.9) B1FT for a line from (their (14 18 + 2), (their 1.9) to (14 30, 0) 6(a)(v) 14 09 1 FT their (a)(iv) 6(b) 7 1 6(c) –4 1
This question in 0580/31 Oct/Nov 2021
Q9 · A path from Bay Park to Ocean Park passes through Sandy Cove 0580/33 Oct/Nov 2022
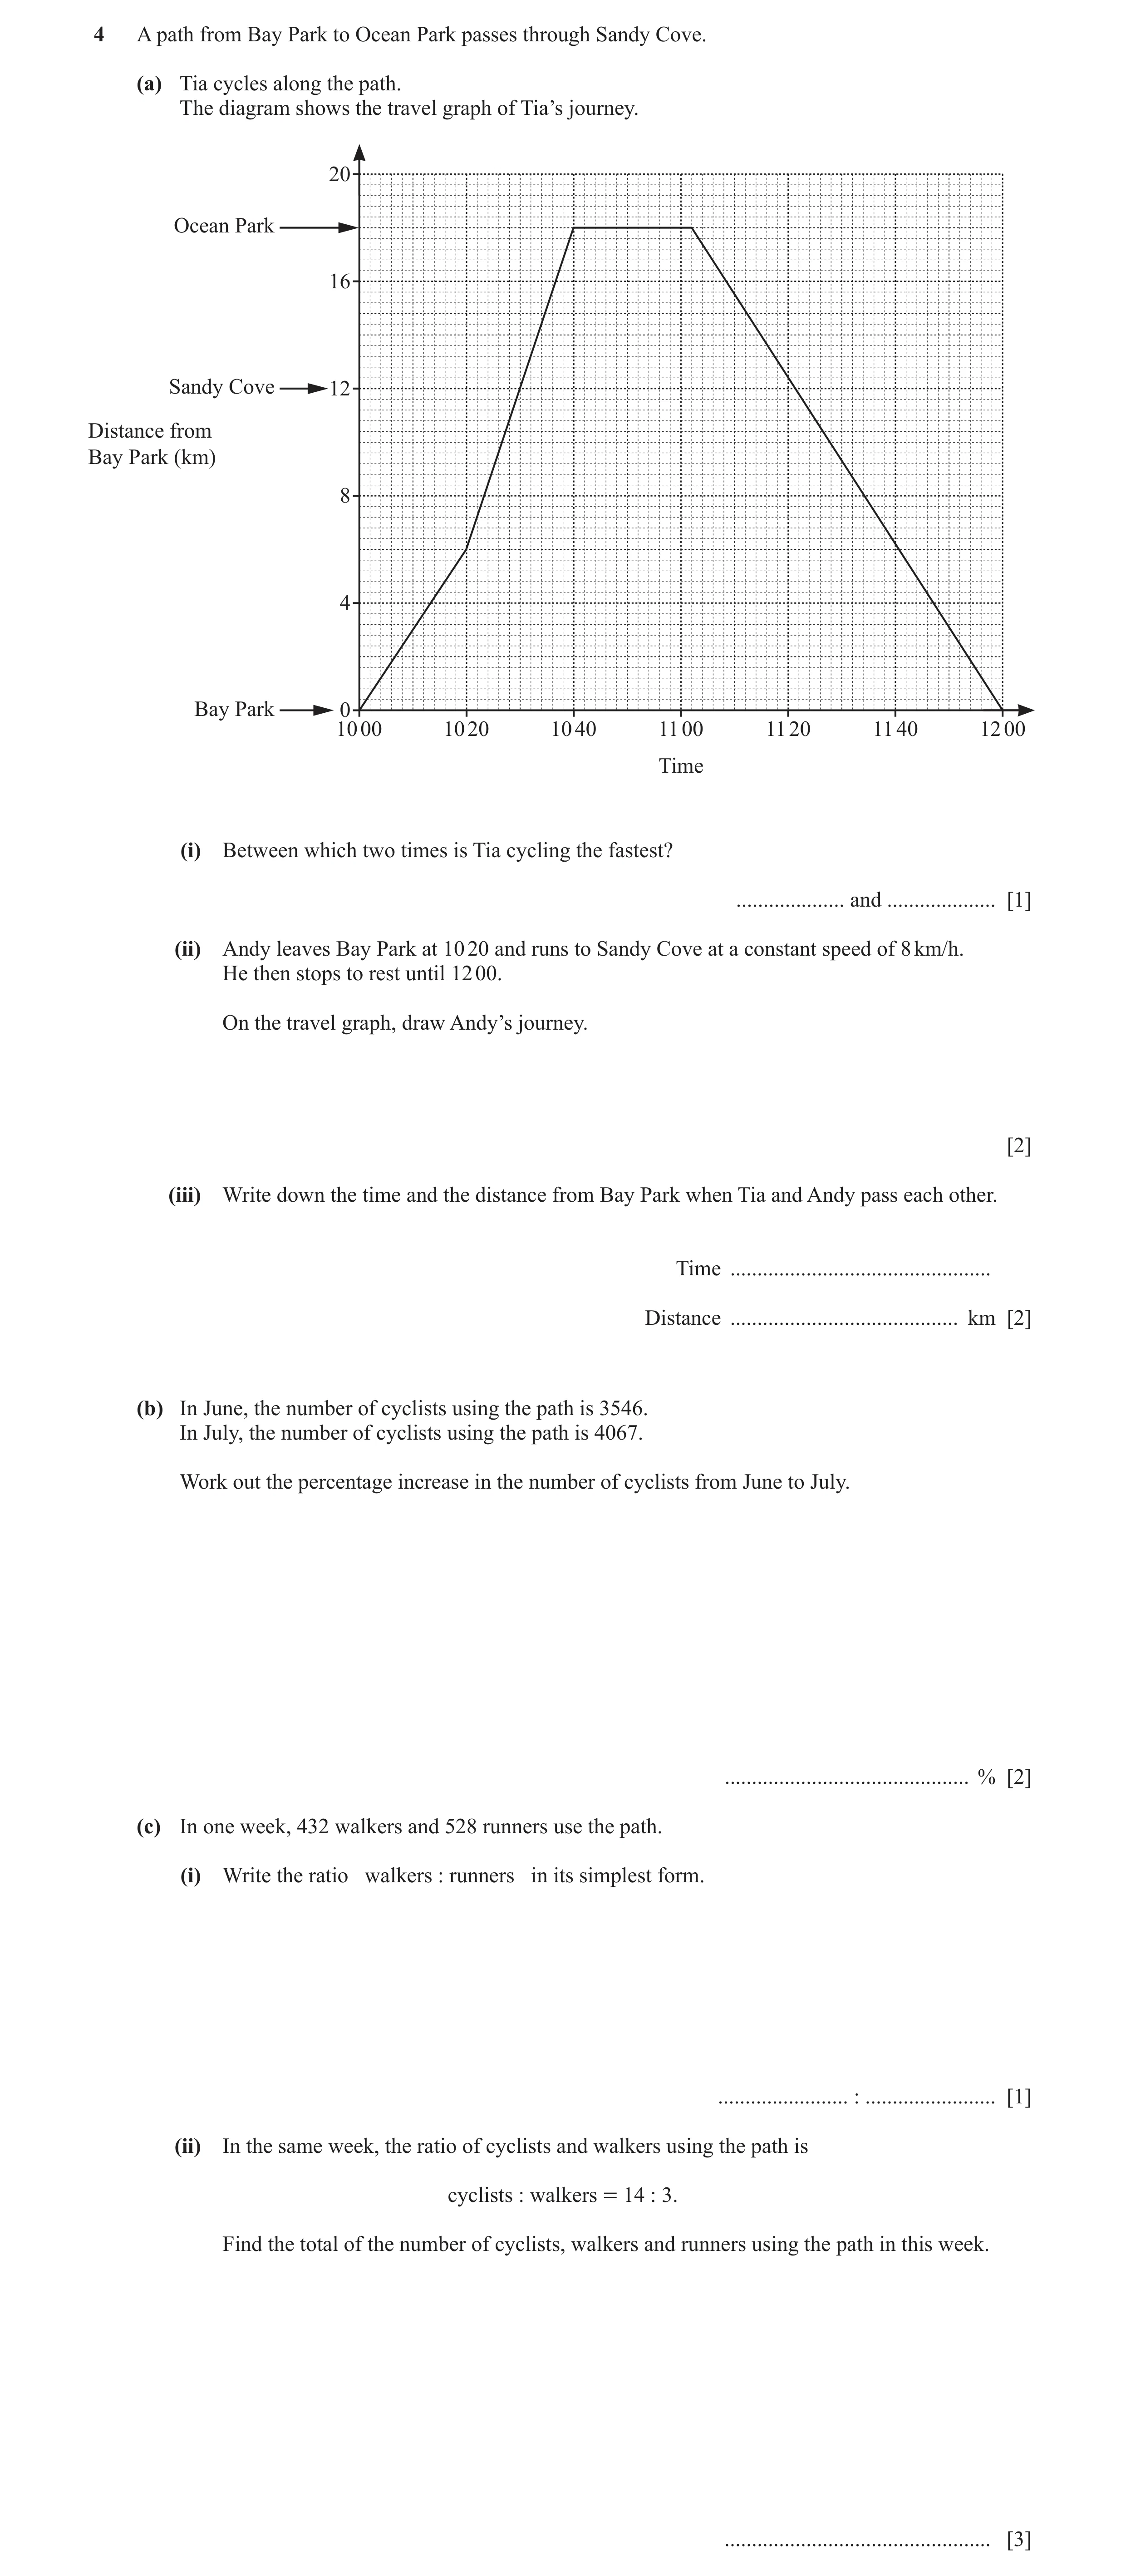
4 A path from Bay Park to Ocean Park passes through Sandy Cove. (a) Tia cycles along the path. The diagram shows the travel graph of Tia’s journey. 20 Ocean Park 16 Sandy Cove 12 Distance from Bay Park (km) 8 4 Bay Park 0 10 00 10 20 10 40 11 00 11 20 11 40 12 00 Time (i) Between which two times is Tia cycling the fastest? … and … [1] (ii) Andy leaves Bay Park at 10 20 and runs to Sandy Cove at a constant speed of 8 km/h. He then stops to rest until 12 00. On the travel graph, draw Andy’s journey. [2] (iii) Write down the time and the distance from Bay Park when Tia and Andy pass each other. Time … Distance … km [2] (b) In June, the number of cyclists using the path is 3546. In July, the number of cyclists using the path is 4067. Work out the percentage increase in the number of cyclists from June to July. … % [2] (c) In one week, 432 walkers and 528 runners use the path. (i) Write the ratio walkers : runners in its simplest form. … : … [1] (ii) In the same week, the ratio of cyclists and walkers using the path is cyclists : walkers = 14 : 3. Find the total of the number of cyclists, walkers and runners using the path in this week. … [3]
11 marks
Mark scheme: 4(a)(i) 10 20 10 40 1 4(a)(ii) Line from (10 20, 0) to (11 50, 12) 2 B1 for line from (10 20, 0) to (11 50, 12) and from (11 50, 12) to (12, 12) or B1FT for line from (their 11 50, 12) to (12, 12) 4(a)(iii) 11 30 2 Strict FT their graph 9.2 to 9.6 B1 for each 4(b) 14.7 or 14.69… 2 4067 − 3546 M1 for [ 100] 3546 4067 or − 1 [ 100] 3546 4067 or 100 [– 100] 3546 4(c)(i) 9 : 11 1 4(c)(ii) 2976 3 B2 for 2016 or 2448 or M1 for 432[k ] oe, k is 1, 14 or 17 3
This question in 0580/33 Oct/Nov 2022
Q10 · Bob travels from town A to town B 0580/31 Oct/Nov 2025
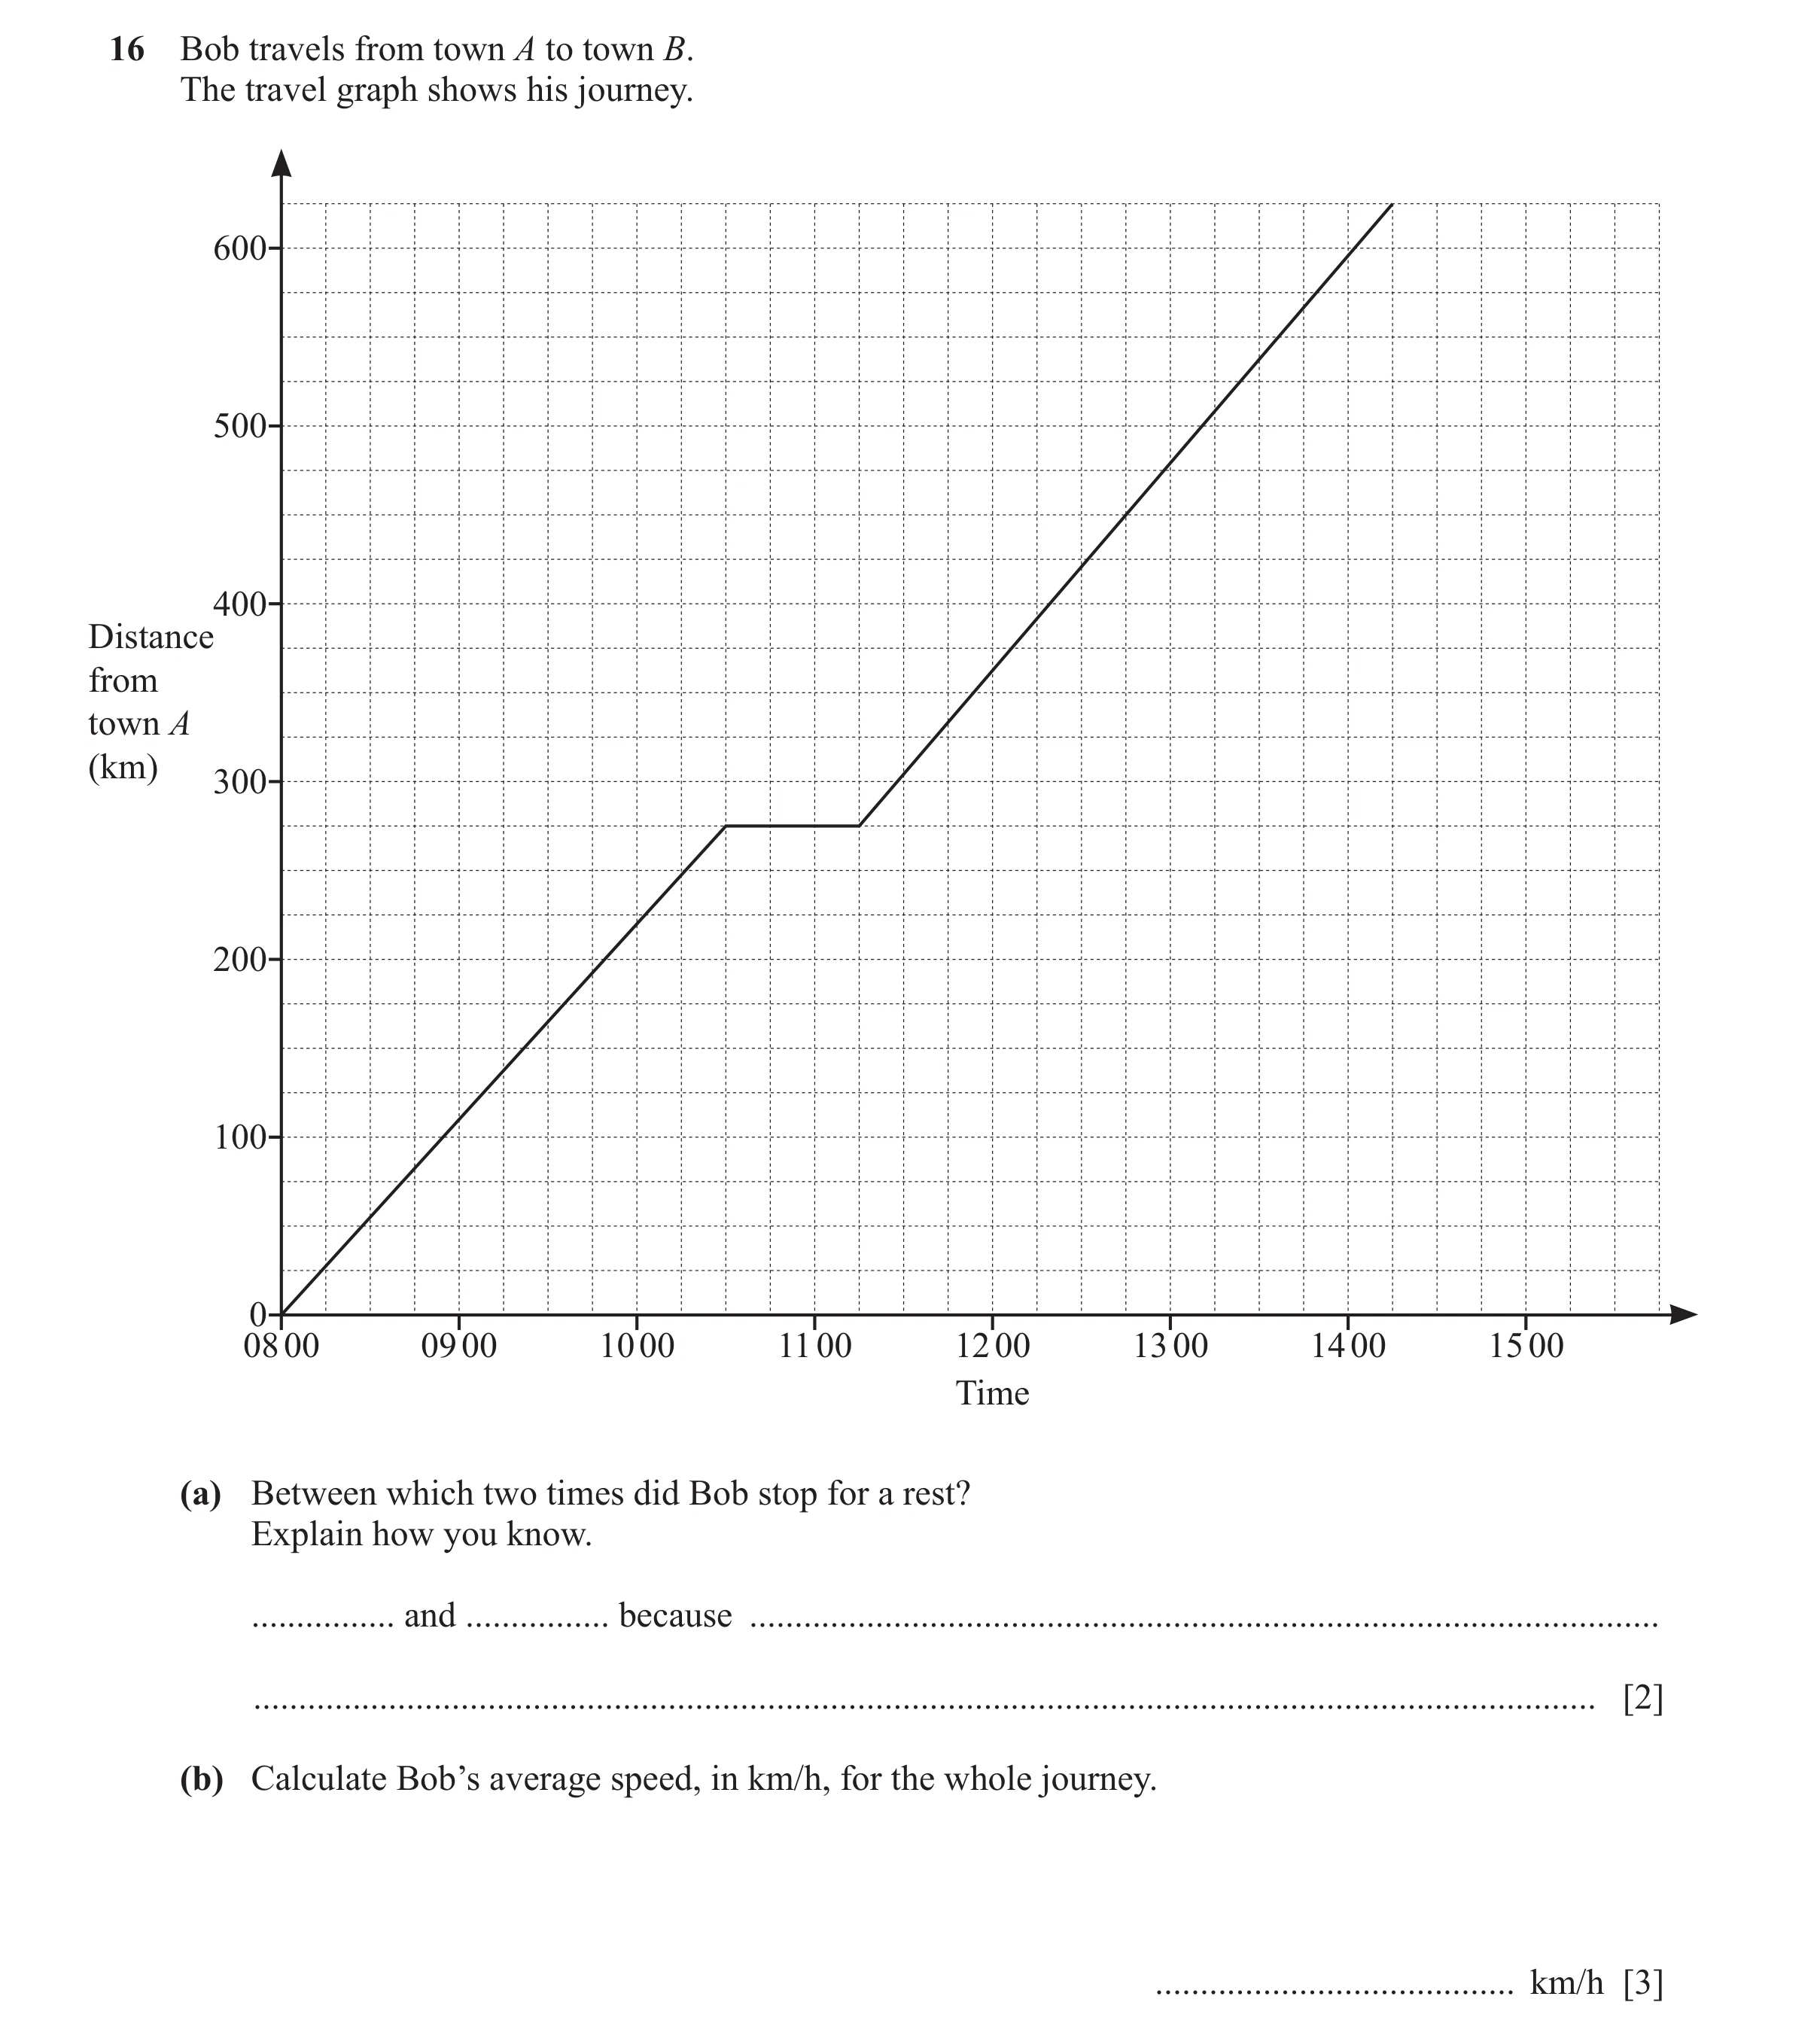
16 Bob travels from town A to town B. The travel graph shows his journey. 600 500 400 Distance from town A (km) 300 200 100 0 08 00 09 00 10 00 11 00 12 00 13 00 14 00 15 00 Time (a) Between which two times did Bob stop for a rest? Explain how you know. … and … because … … [2] (b) Calculate Bob’s average speed, in km/h, for the whole journey. … km/h [3]
5 marks
Mark scheme: 16(a) 10 30 and 11 15 1 line is horizontal oe 1 distance remains the same oe 16(b) 100 nfww 3 M2 for 625 ÷ 6.25 or M1 for 625 ÷ their time
This question in 0580/31 Oct/Nov 2025
 8 / 16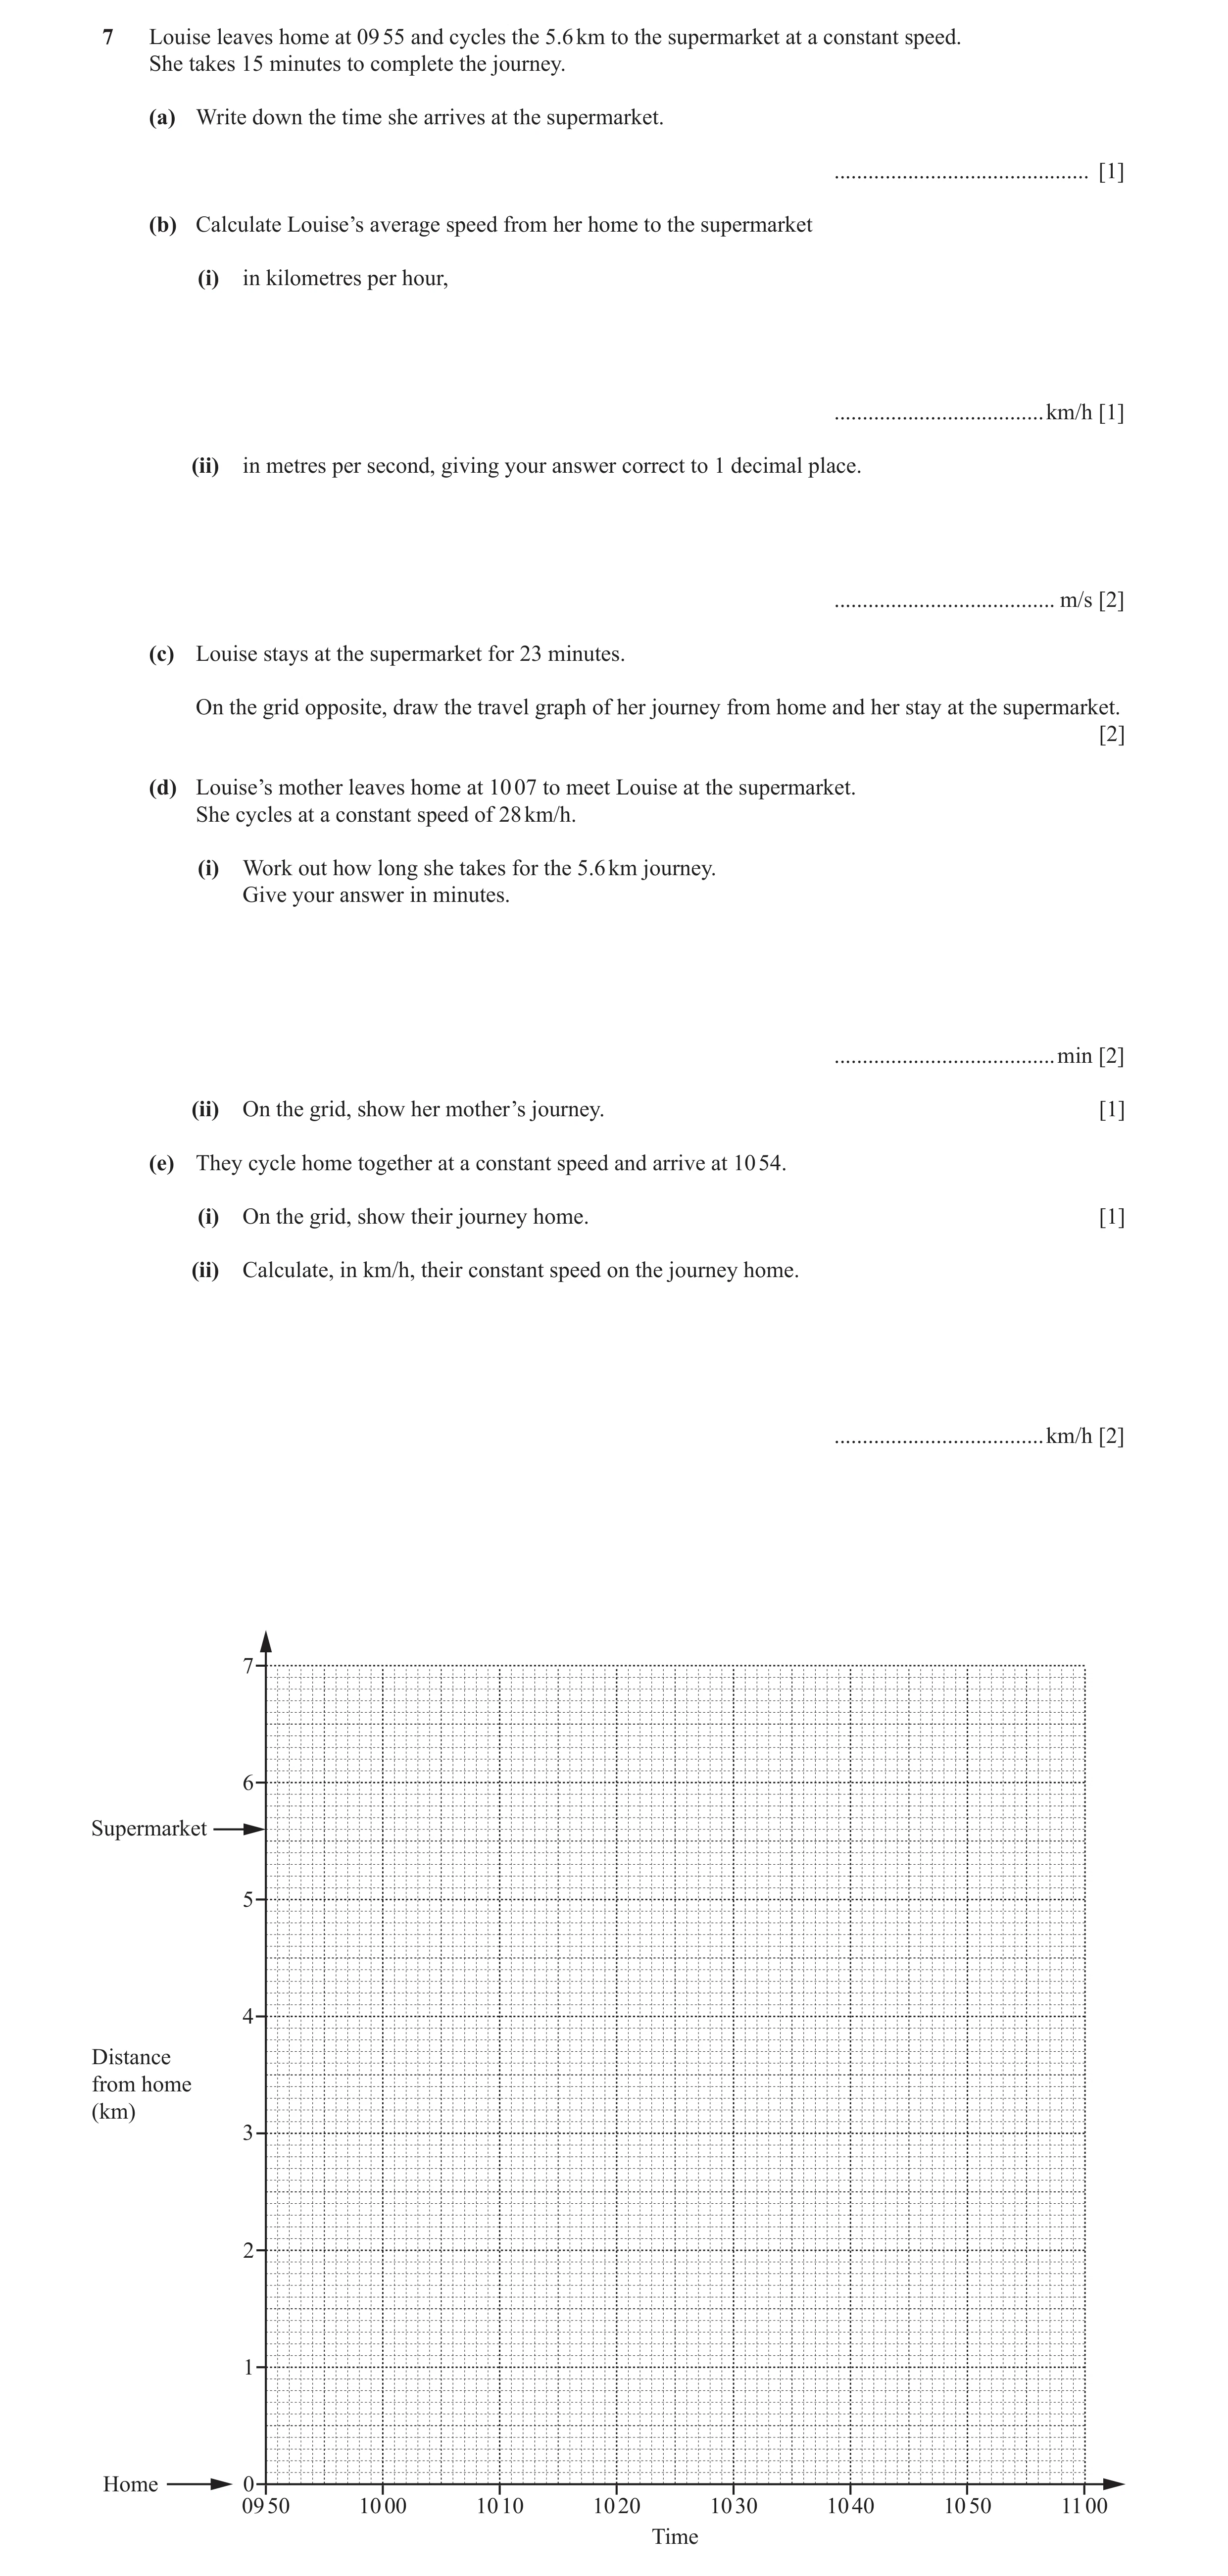
 16 / 16
 11
11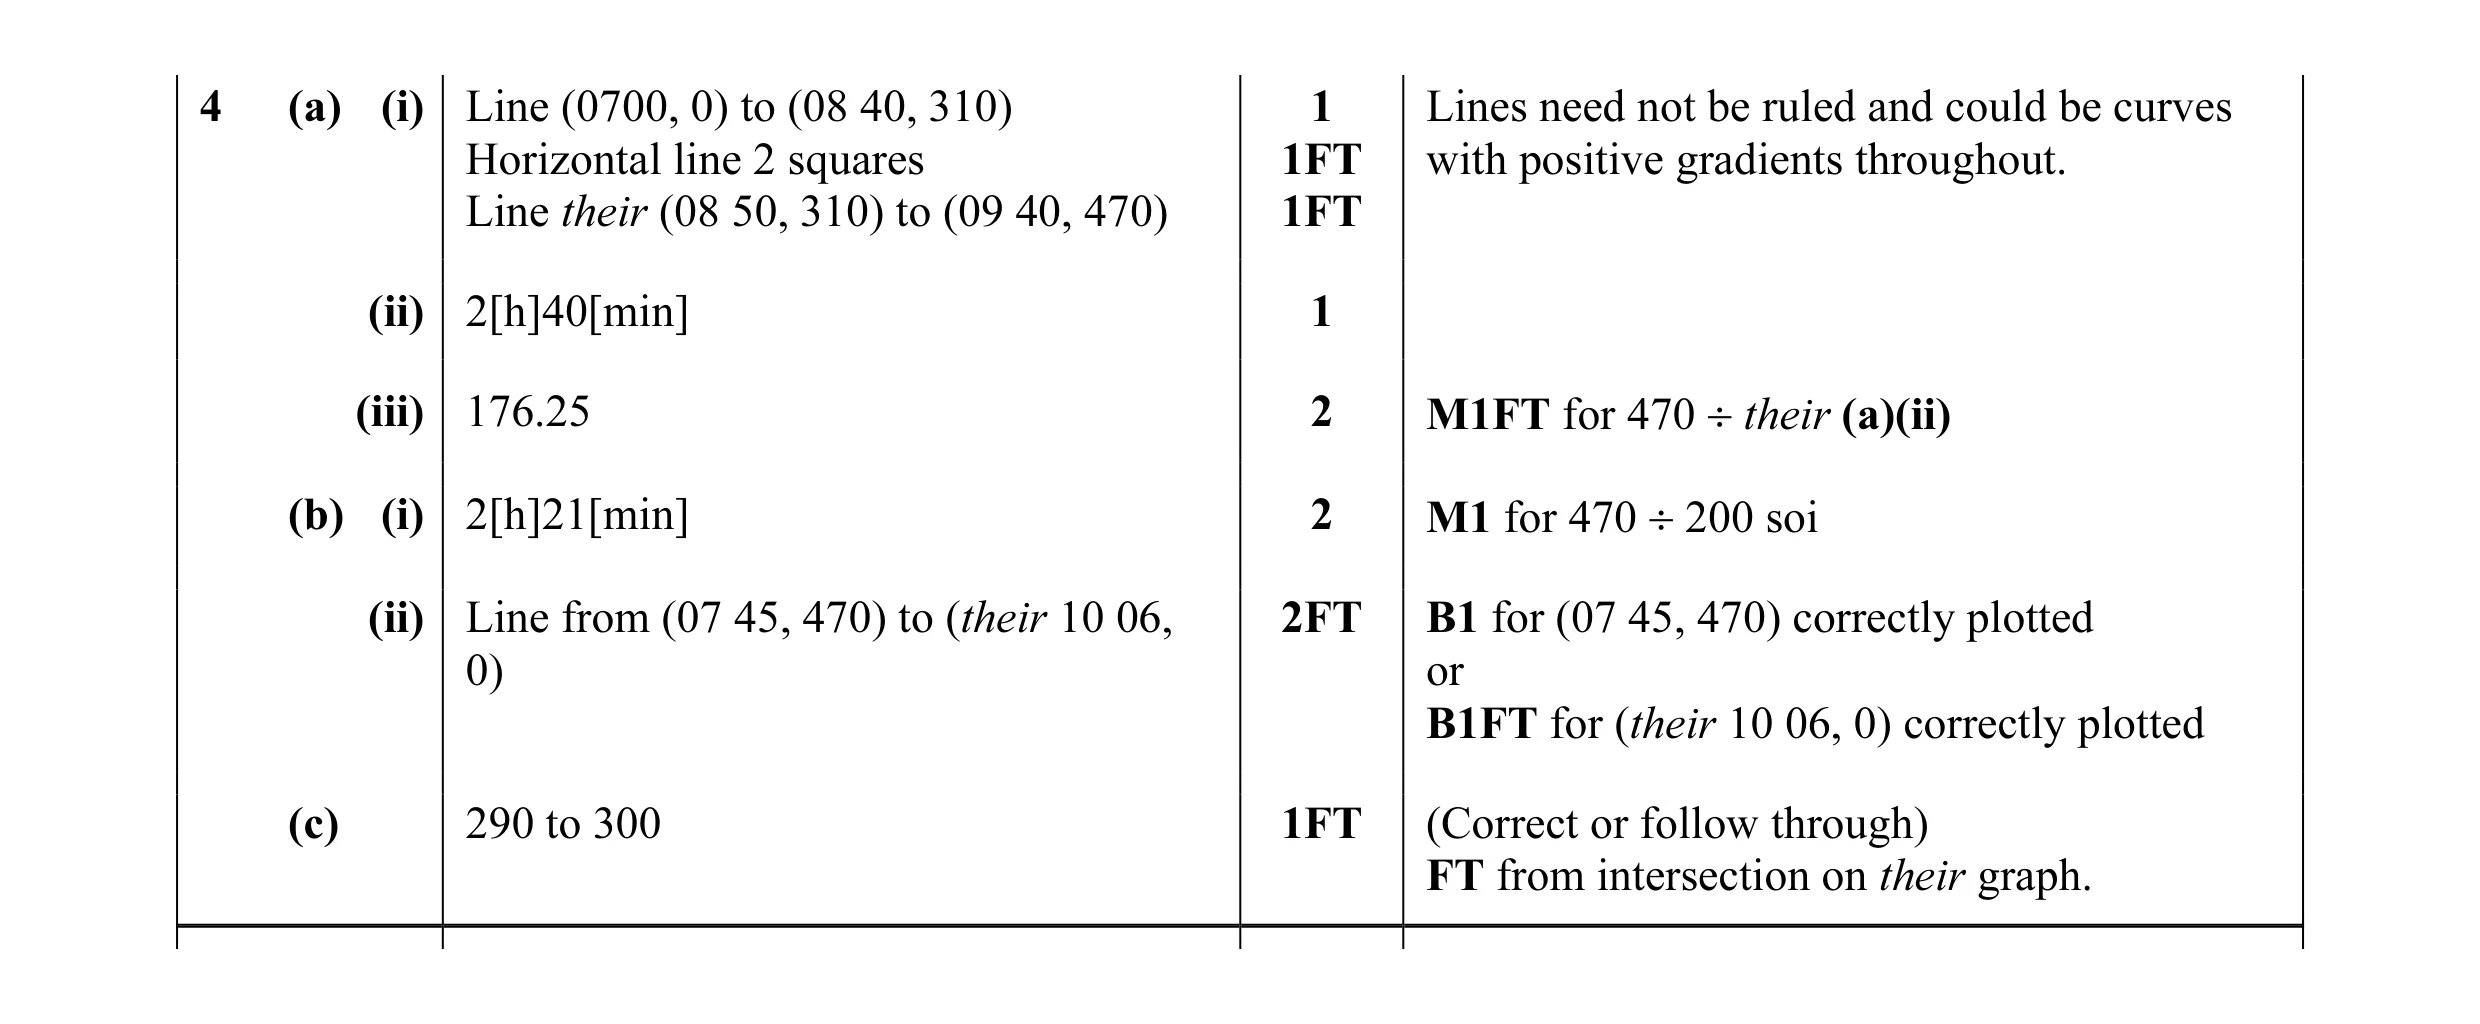 11
11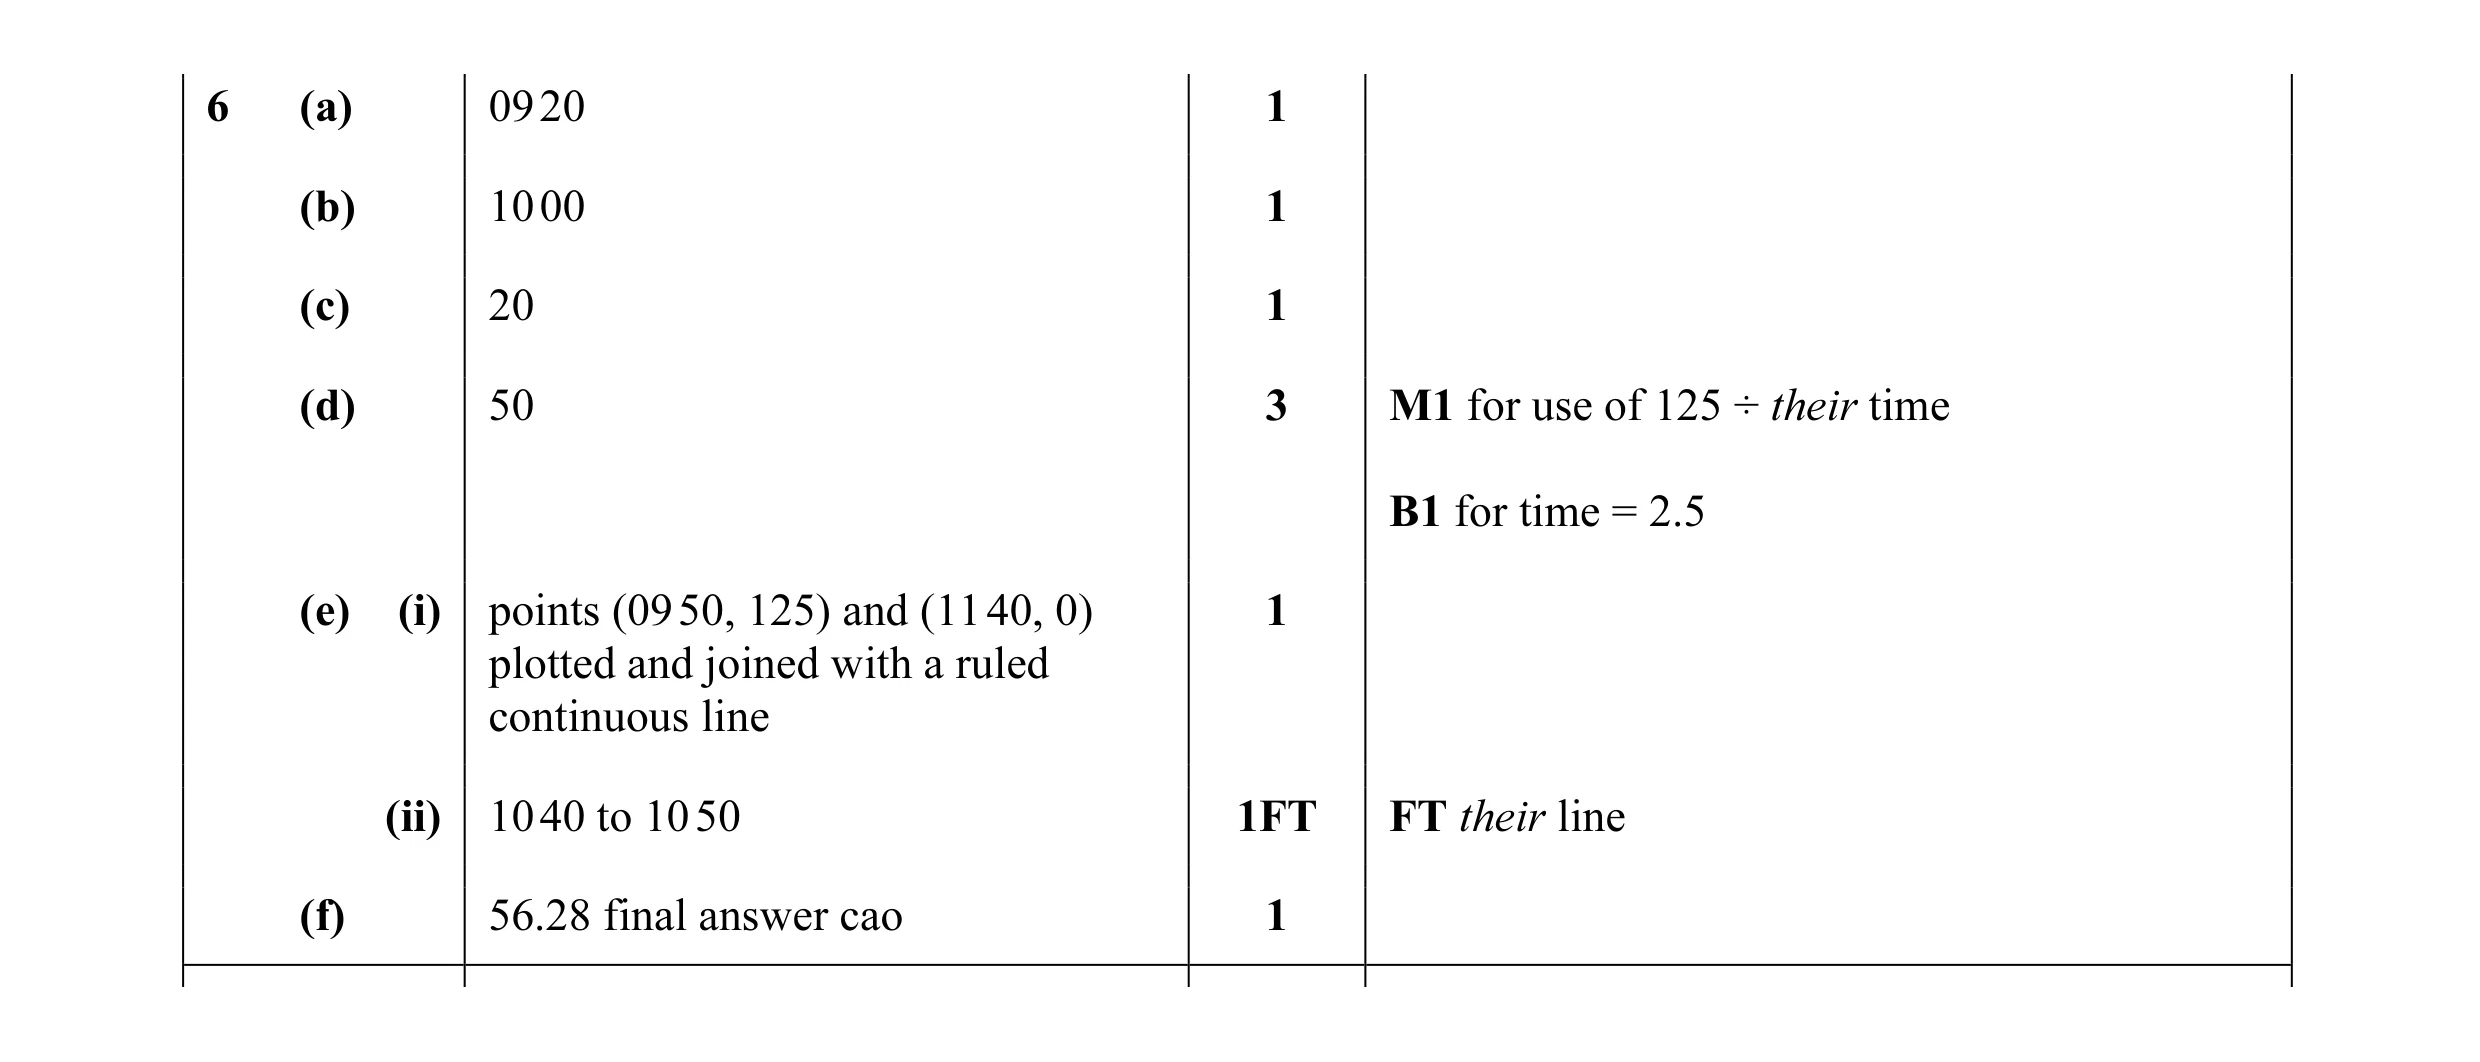 9
9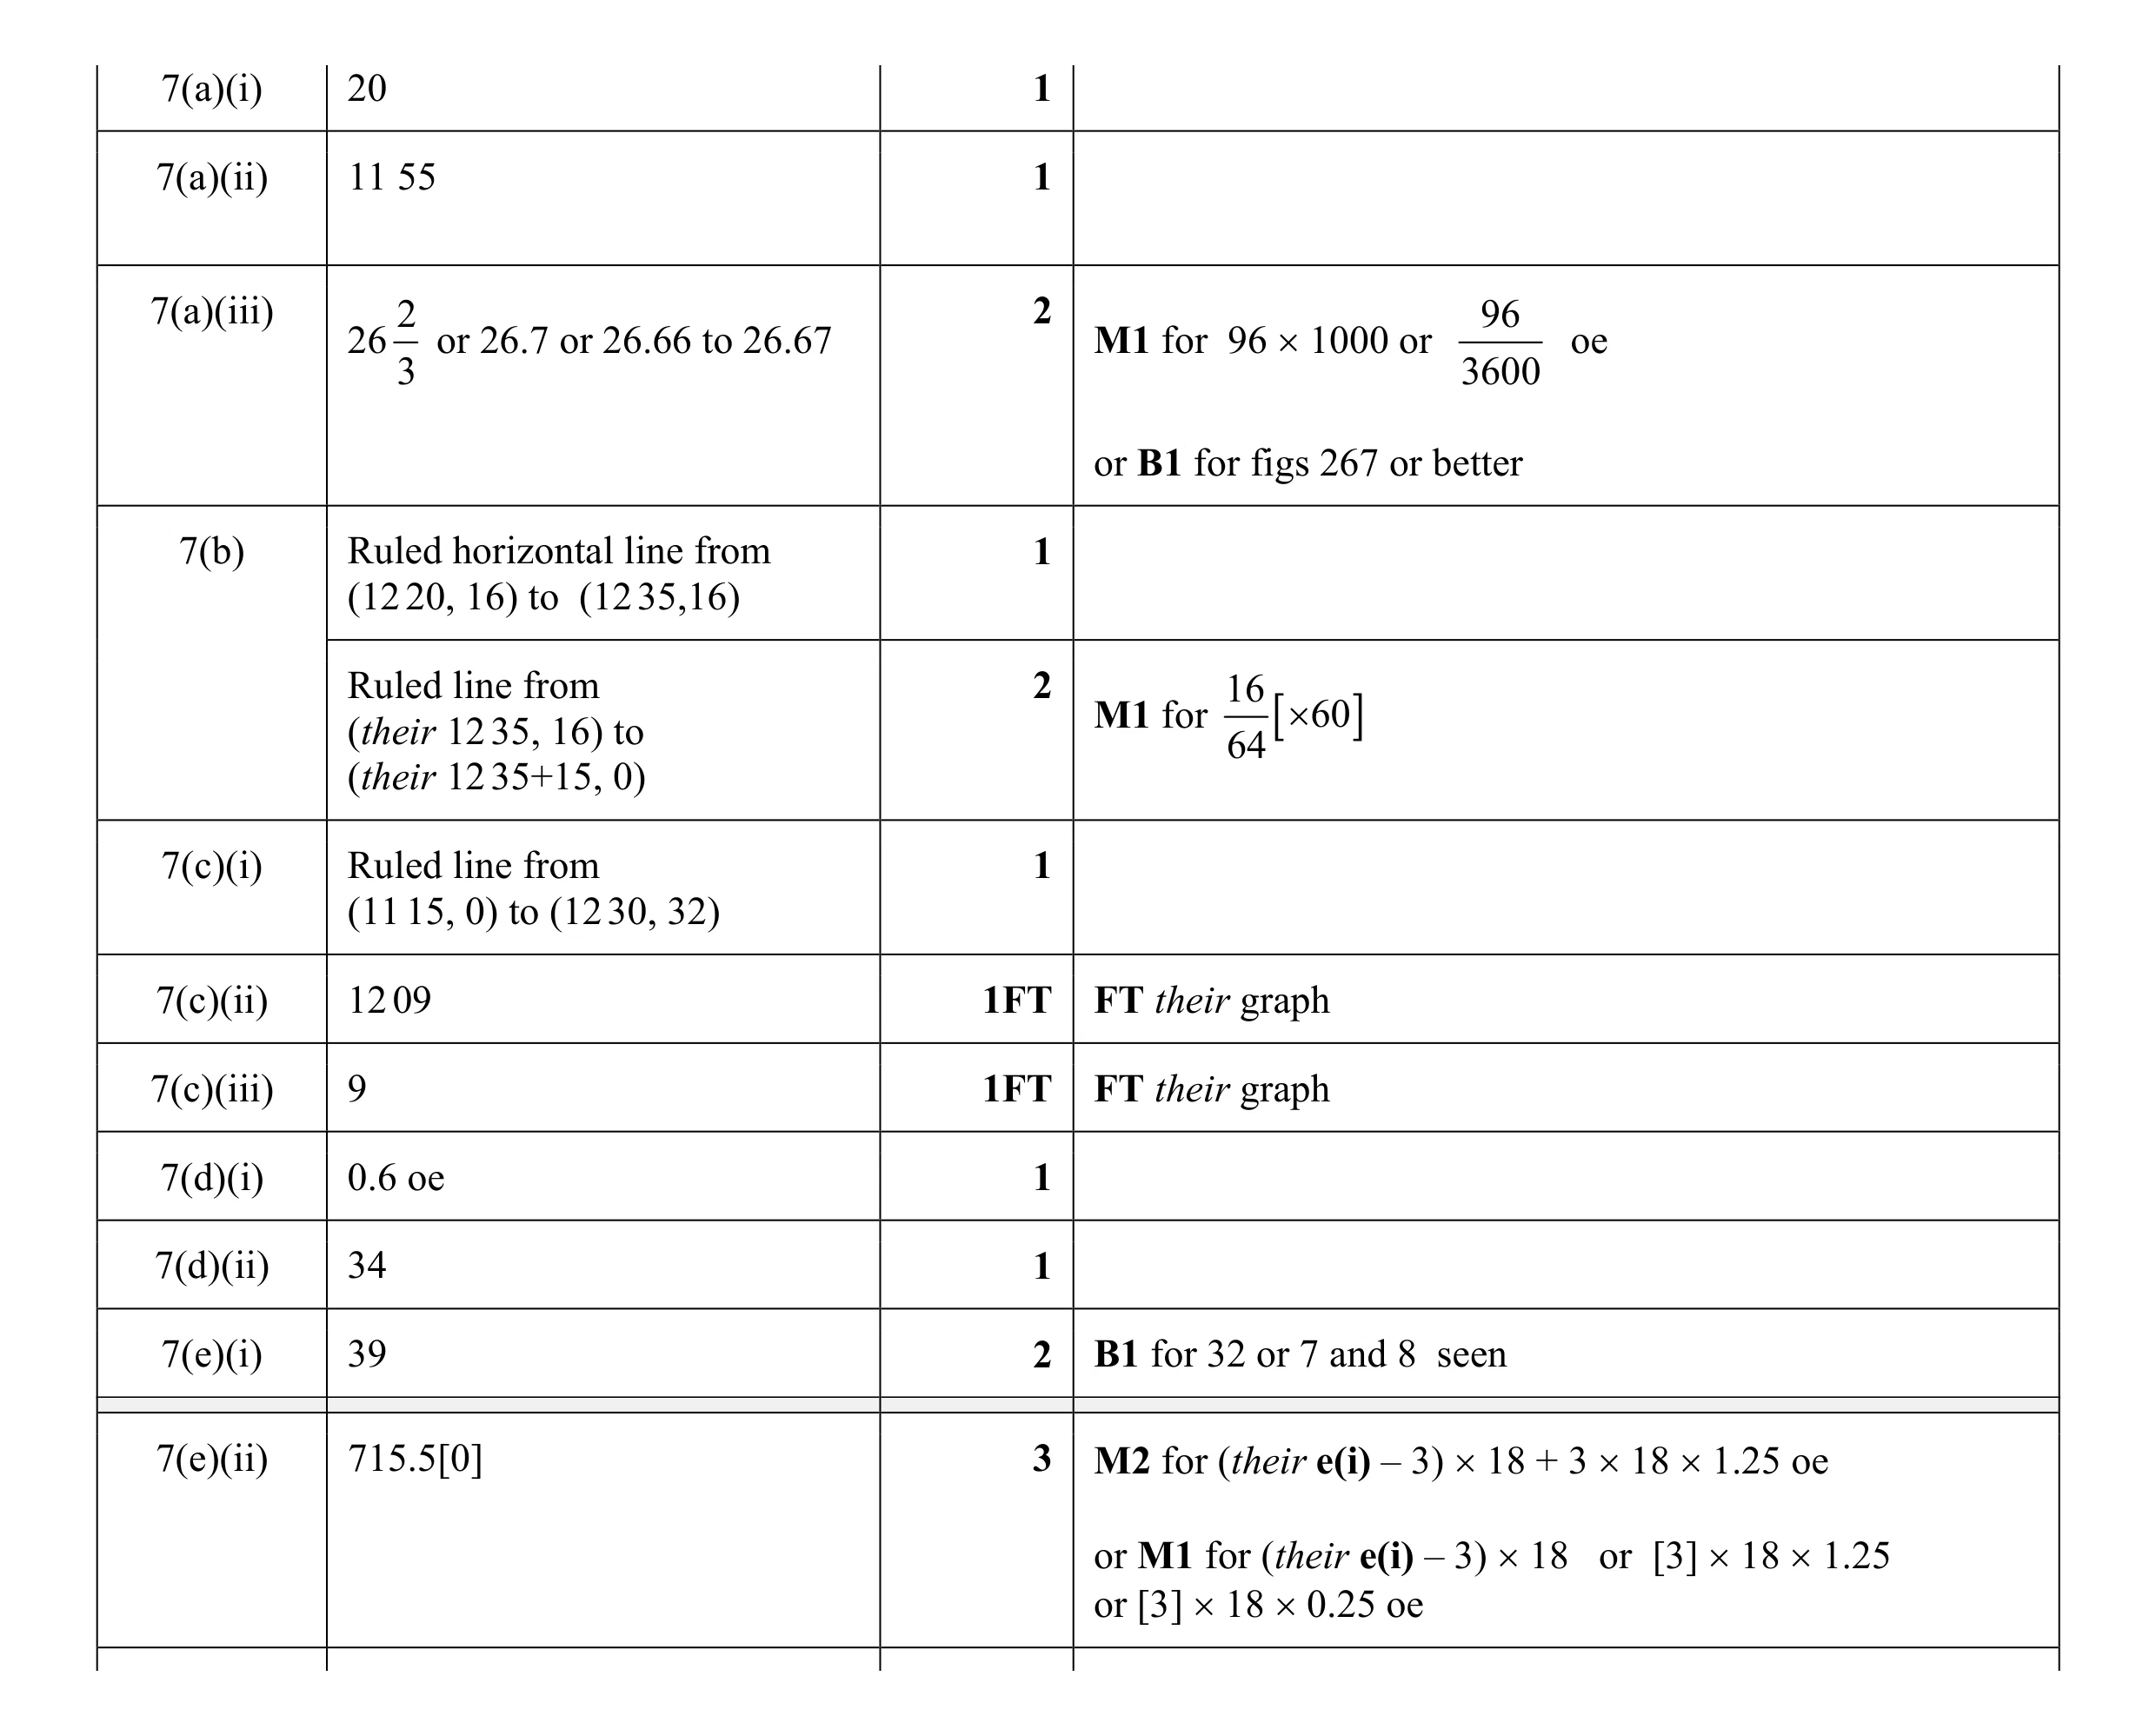 17
17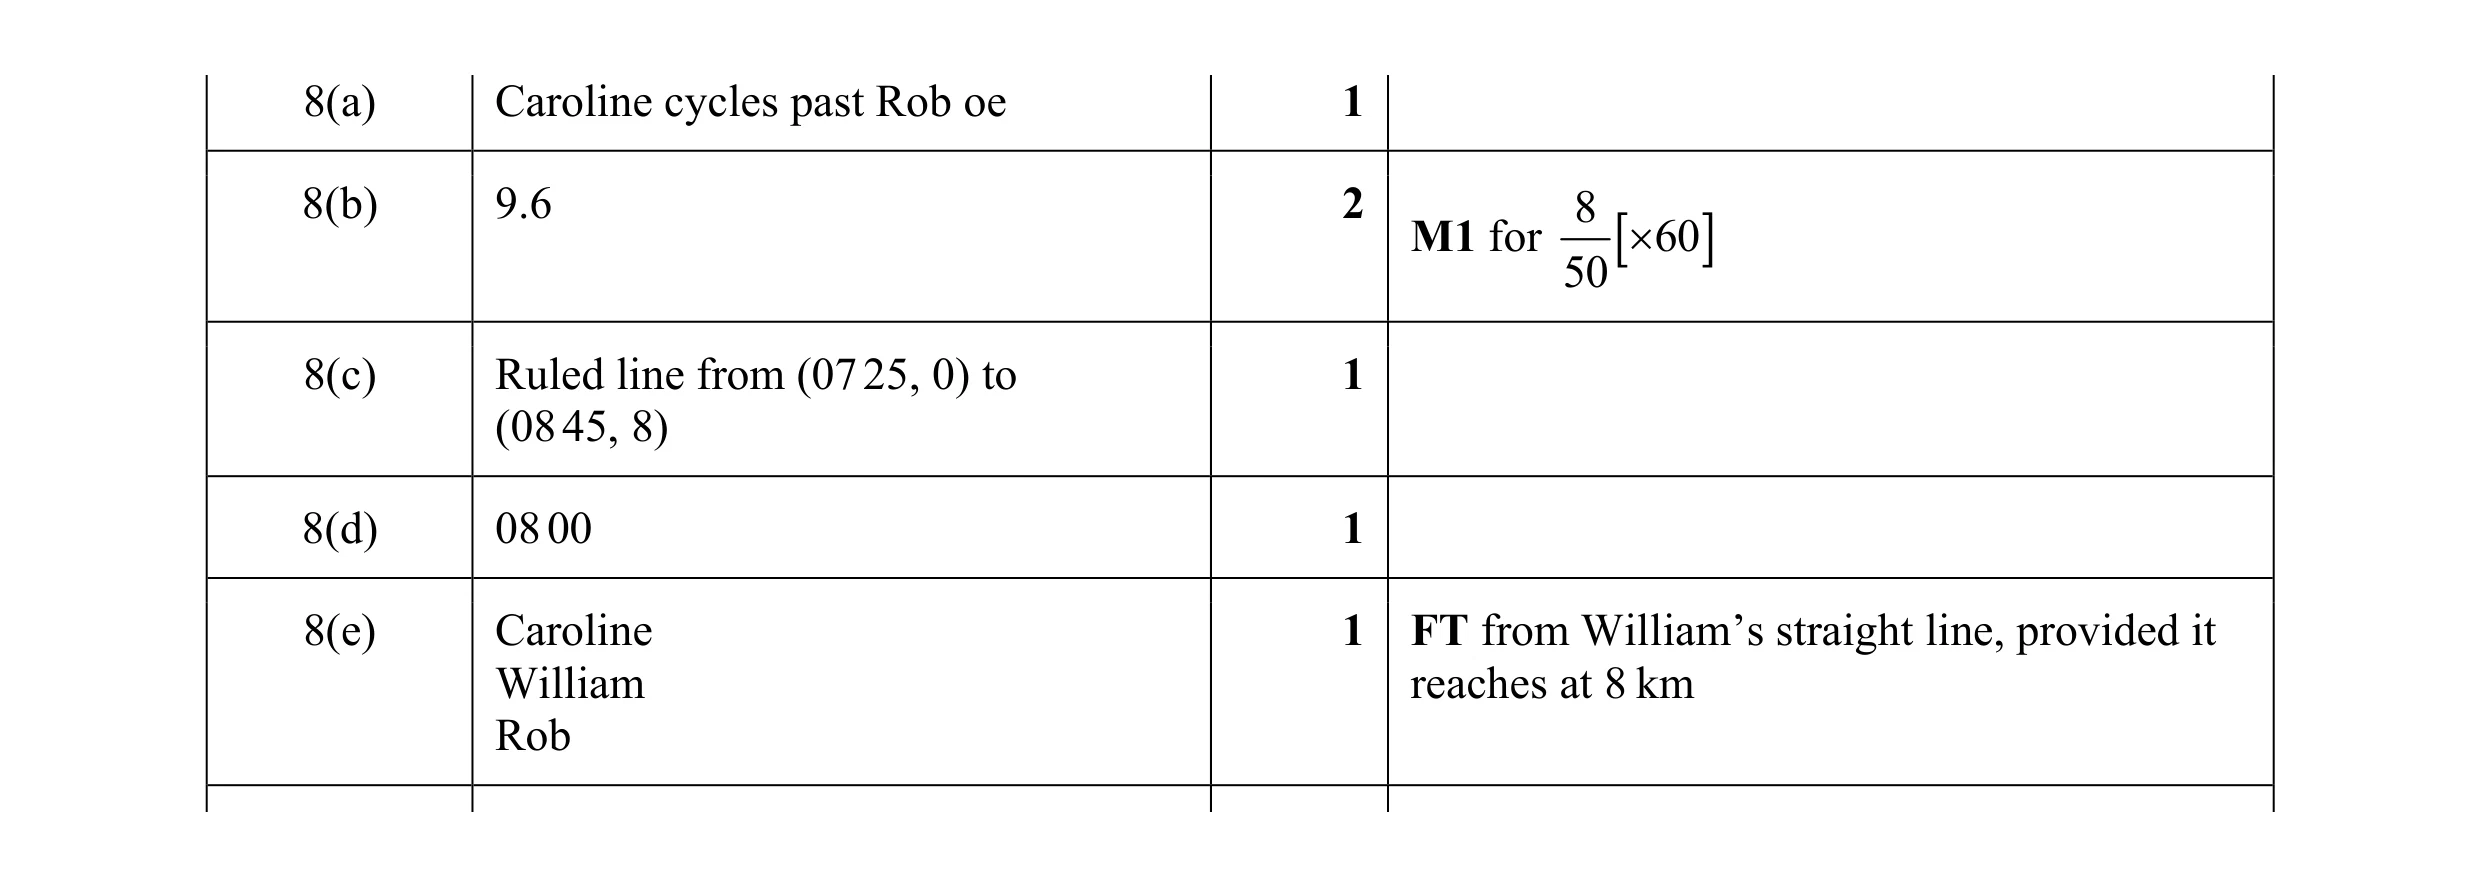 6
6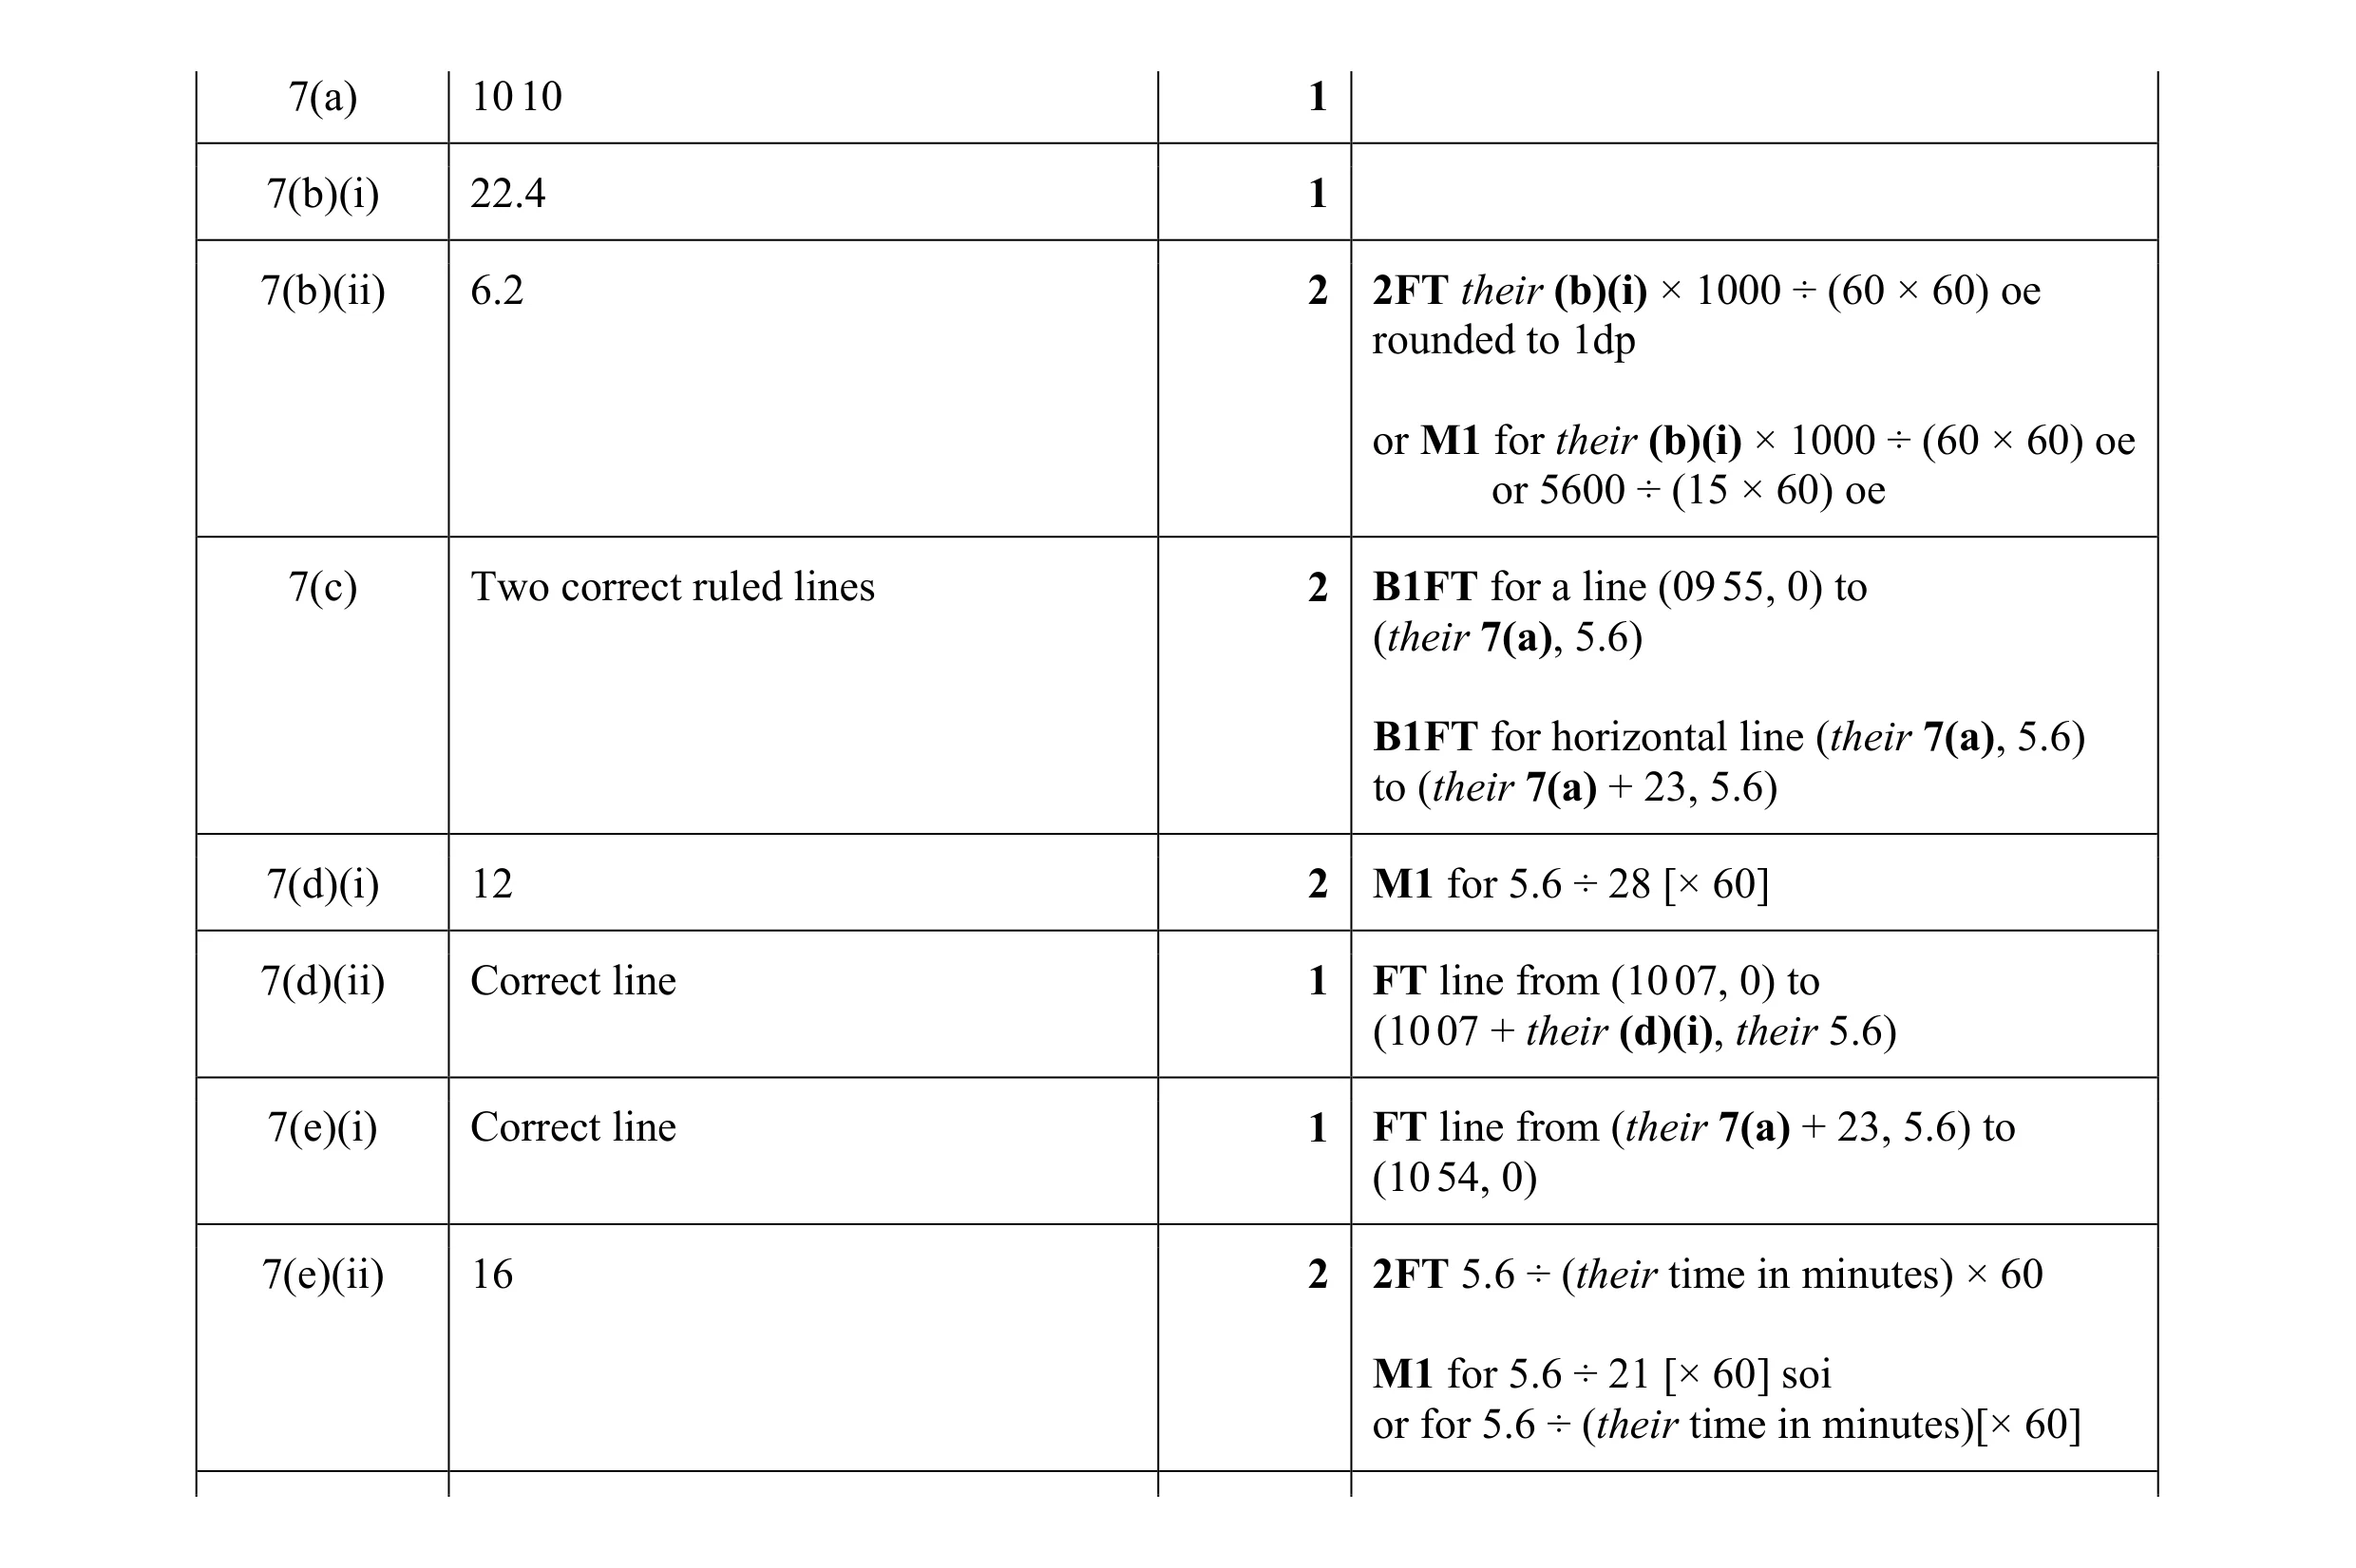 12
12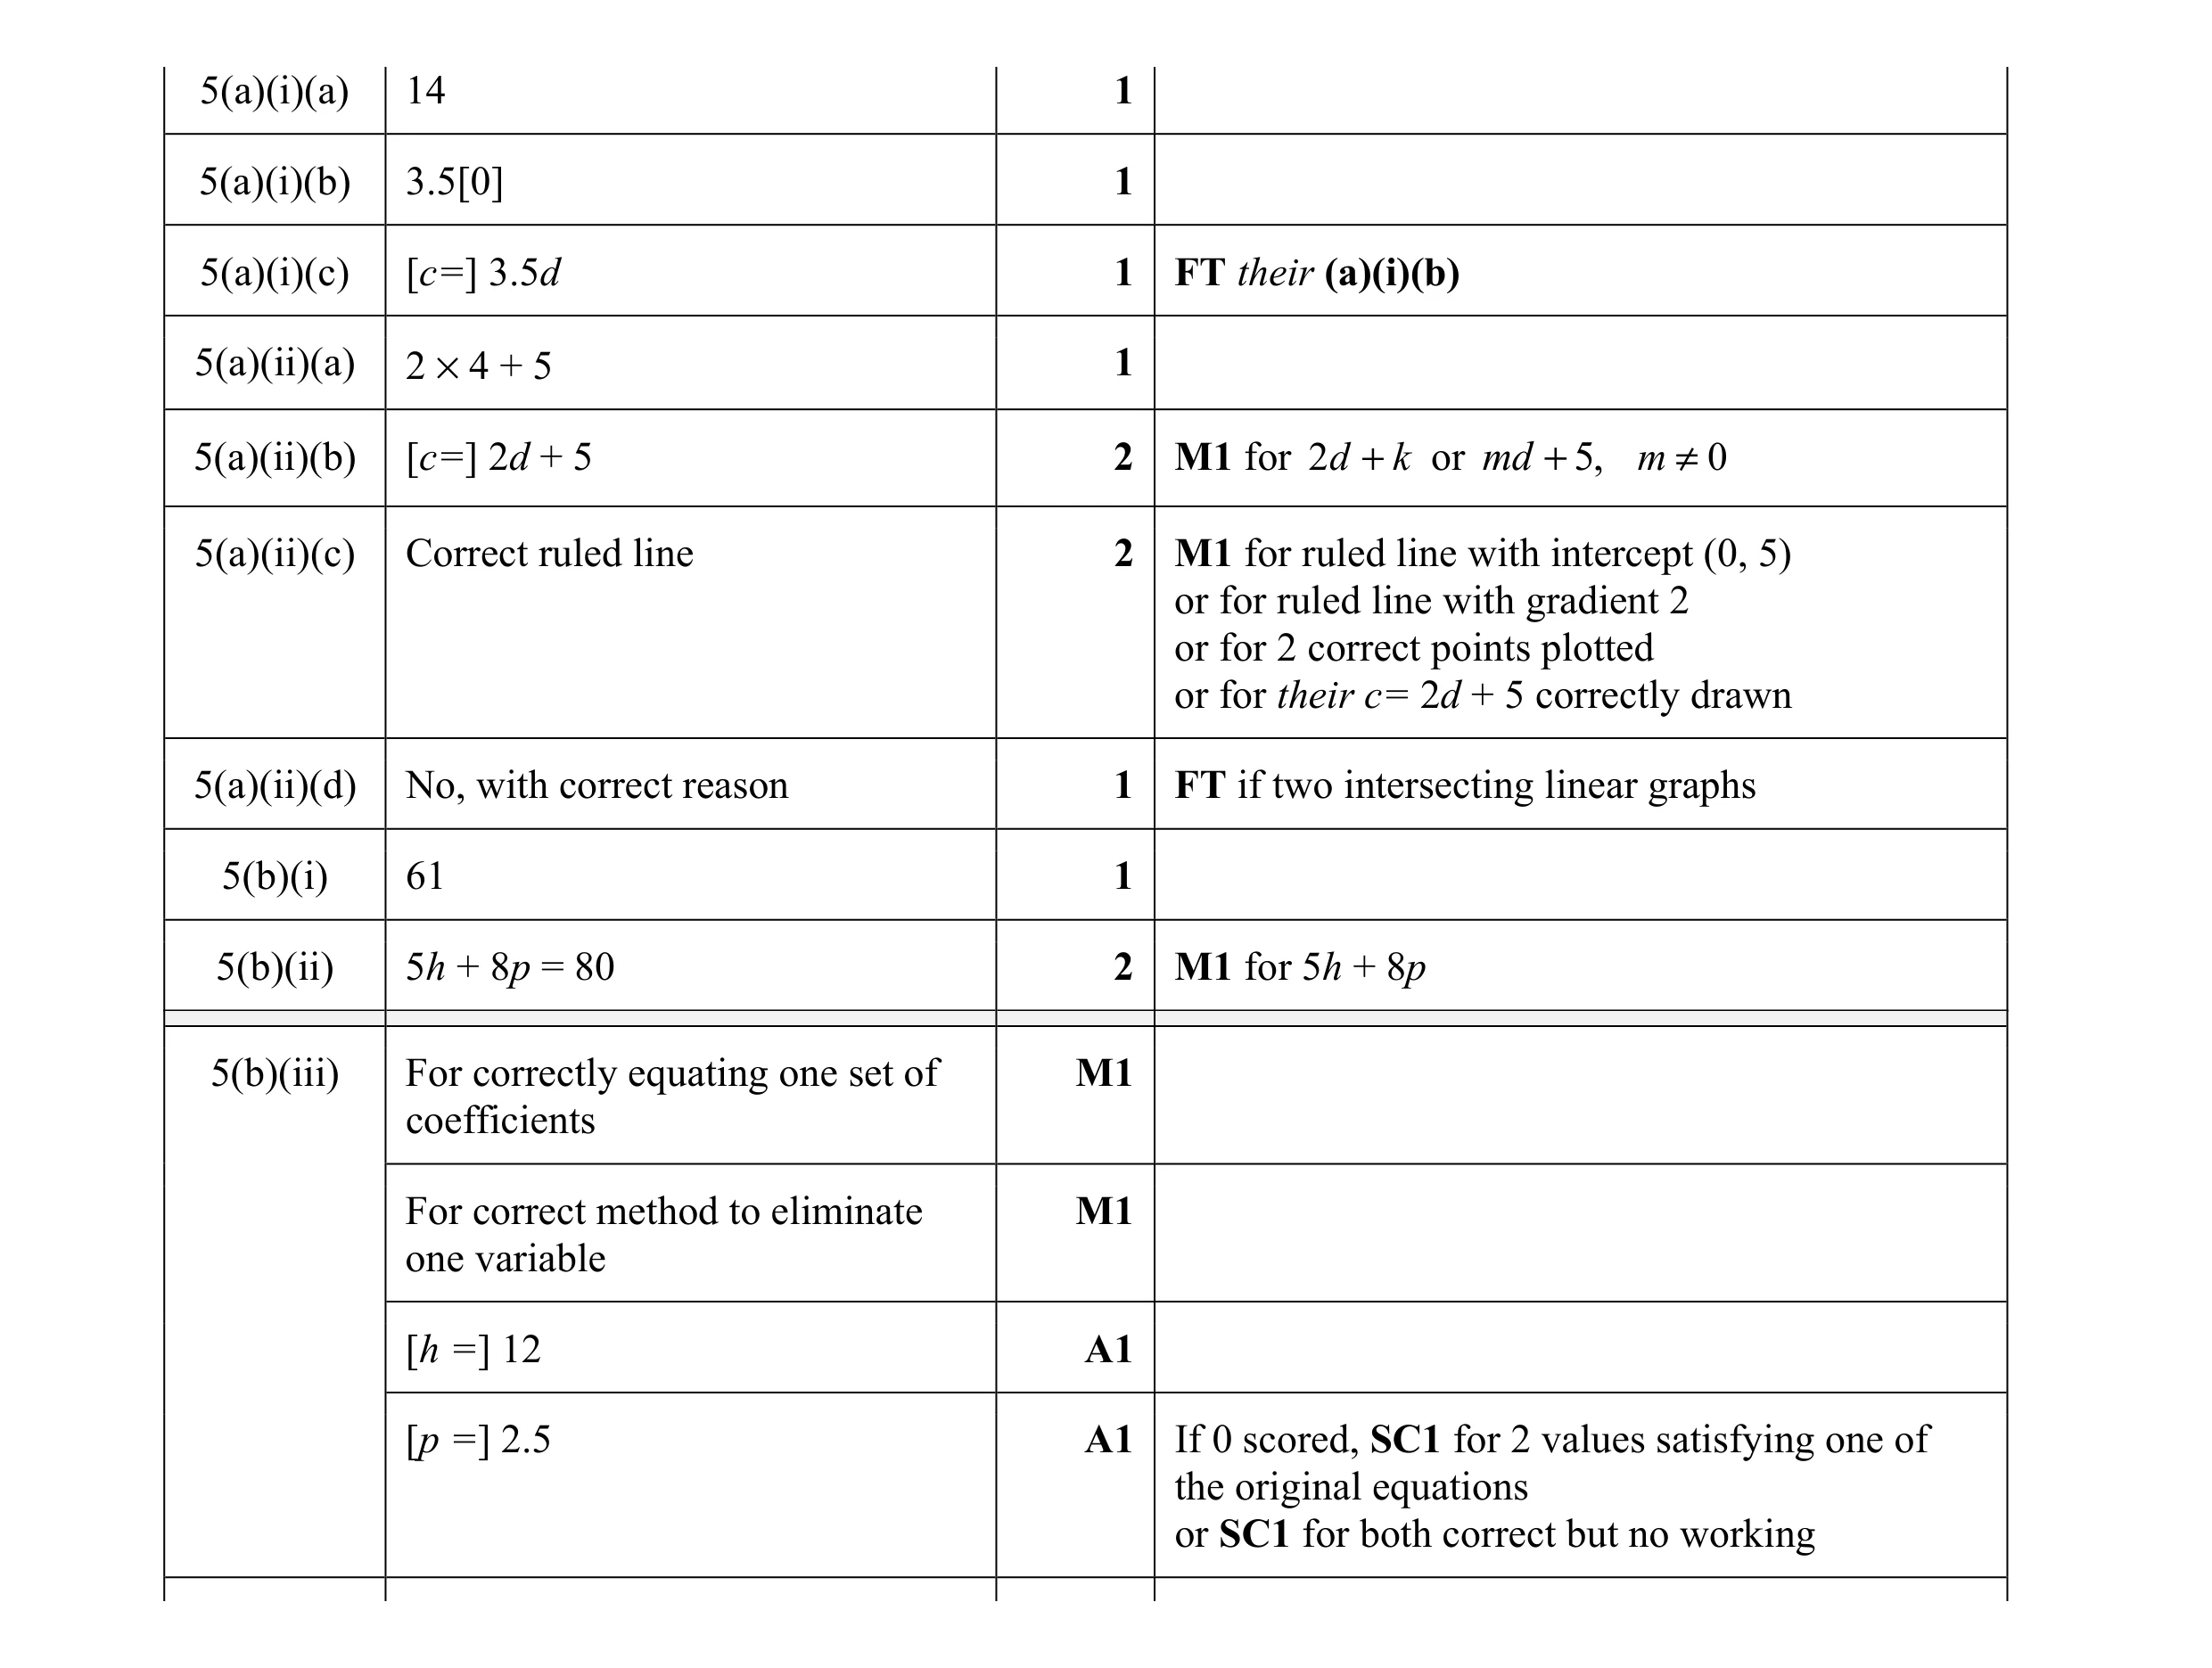 16
16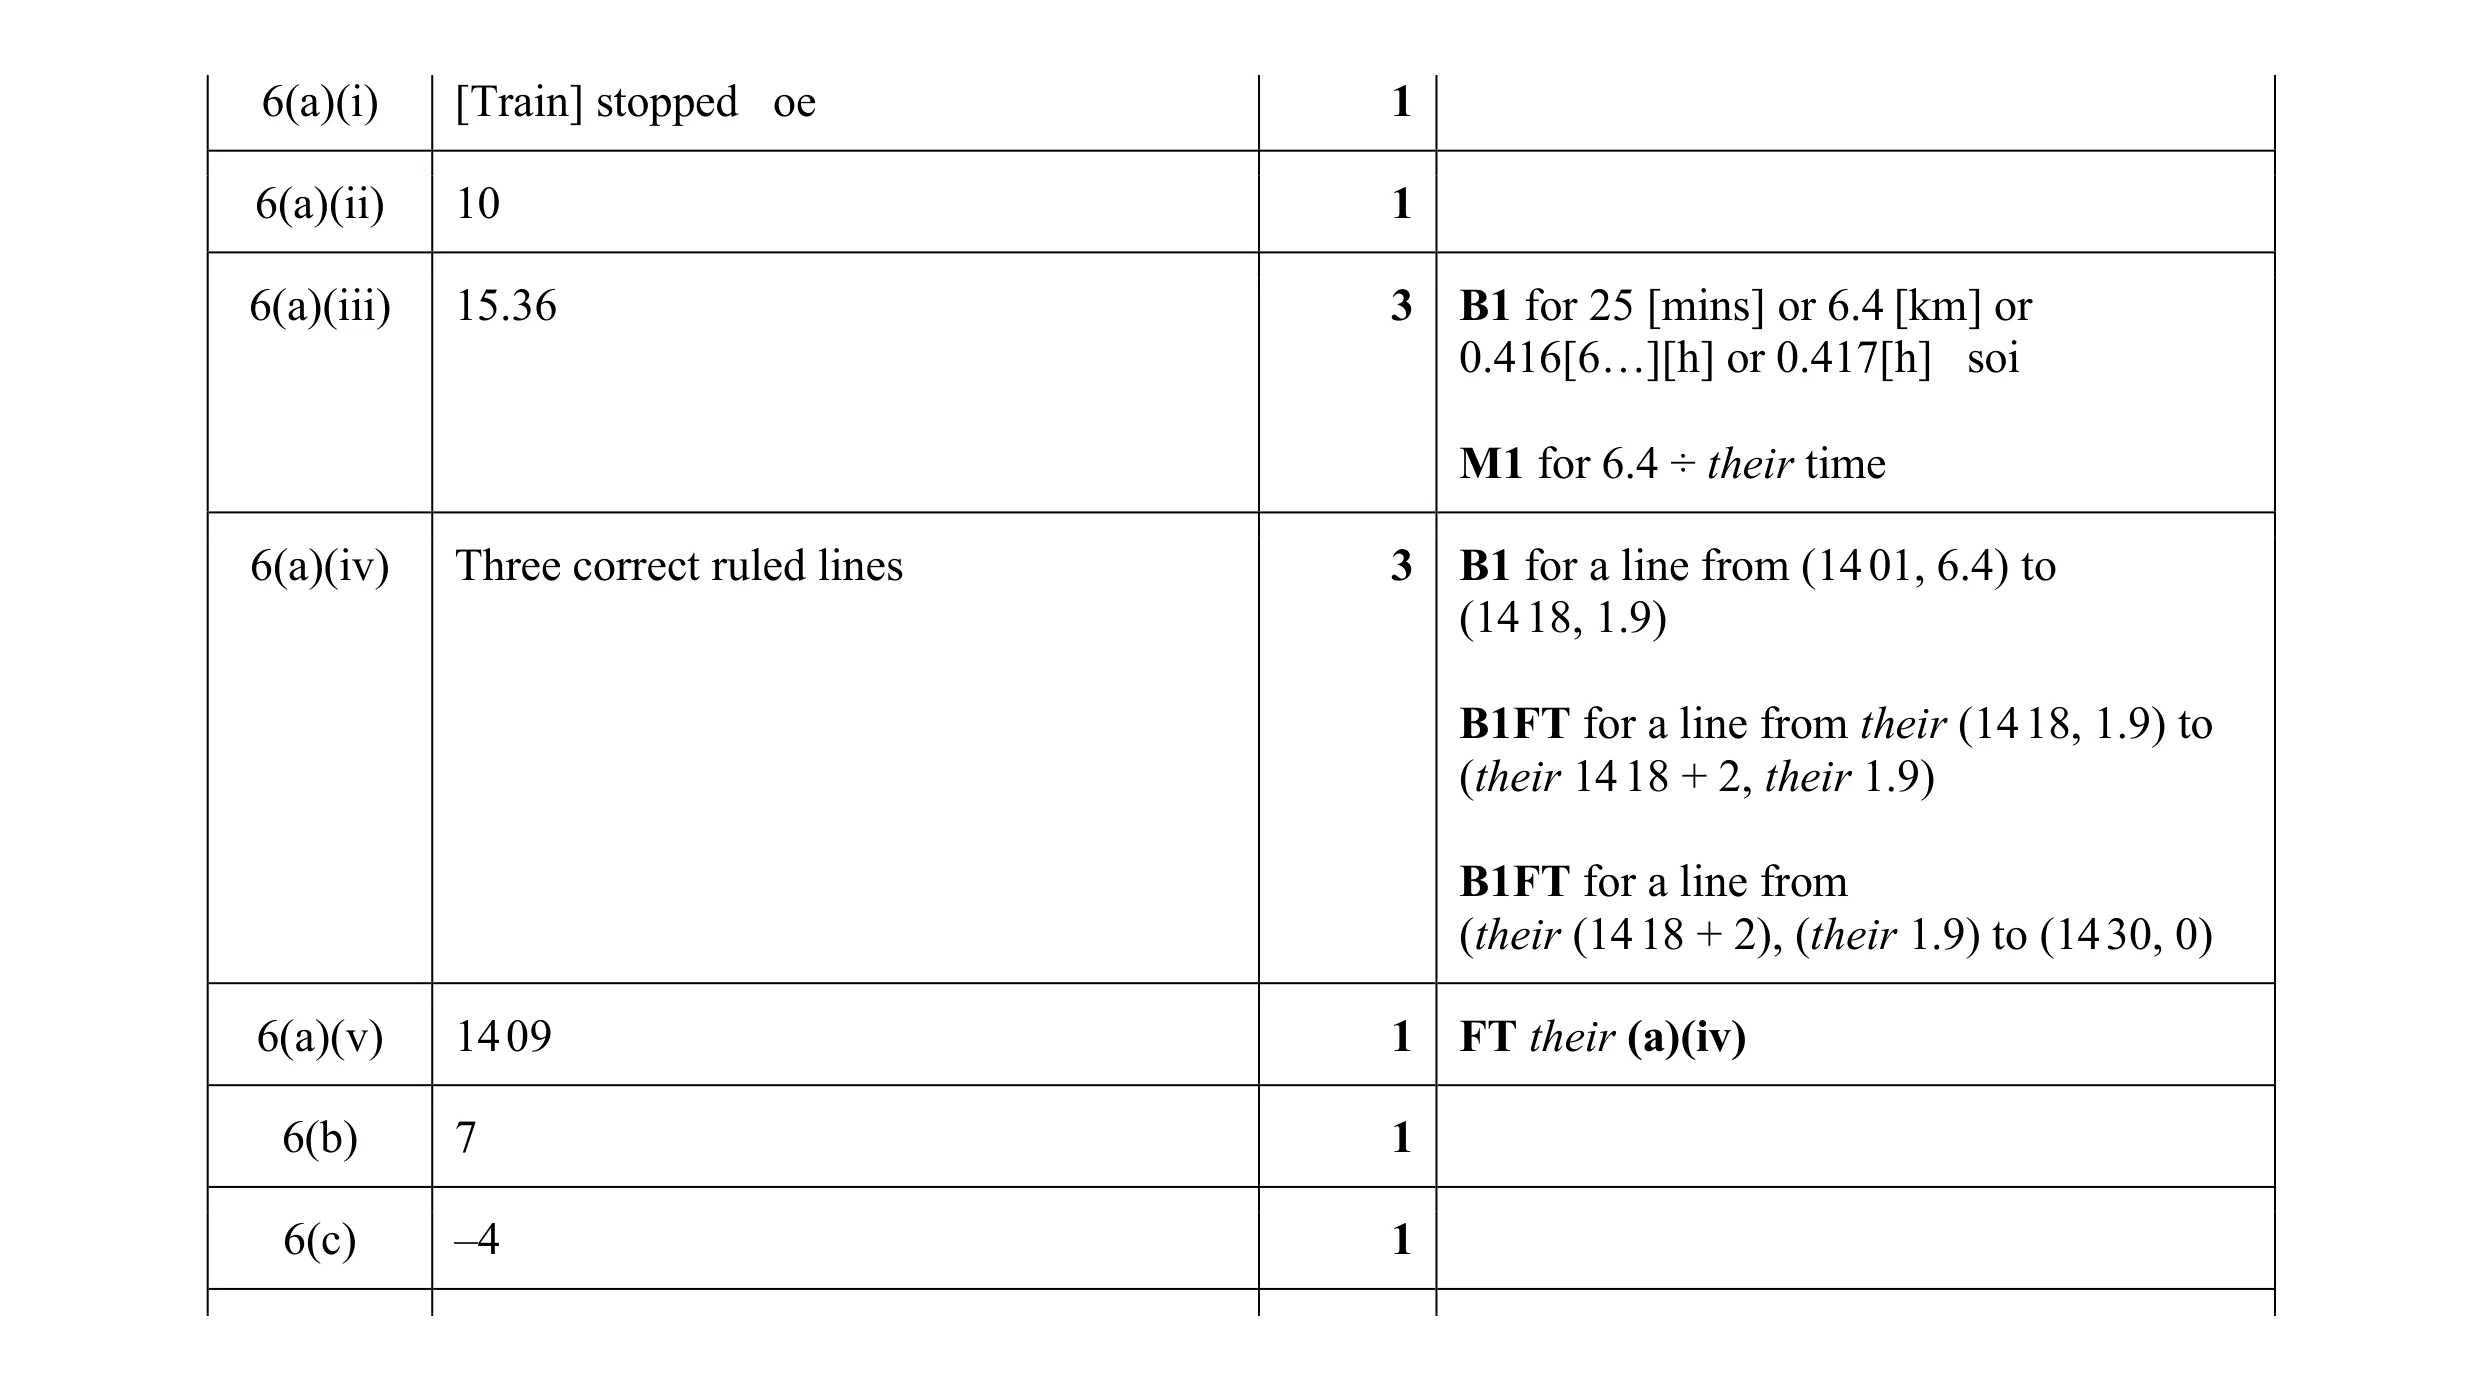 11
11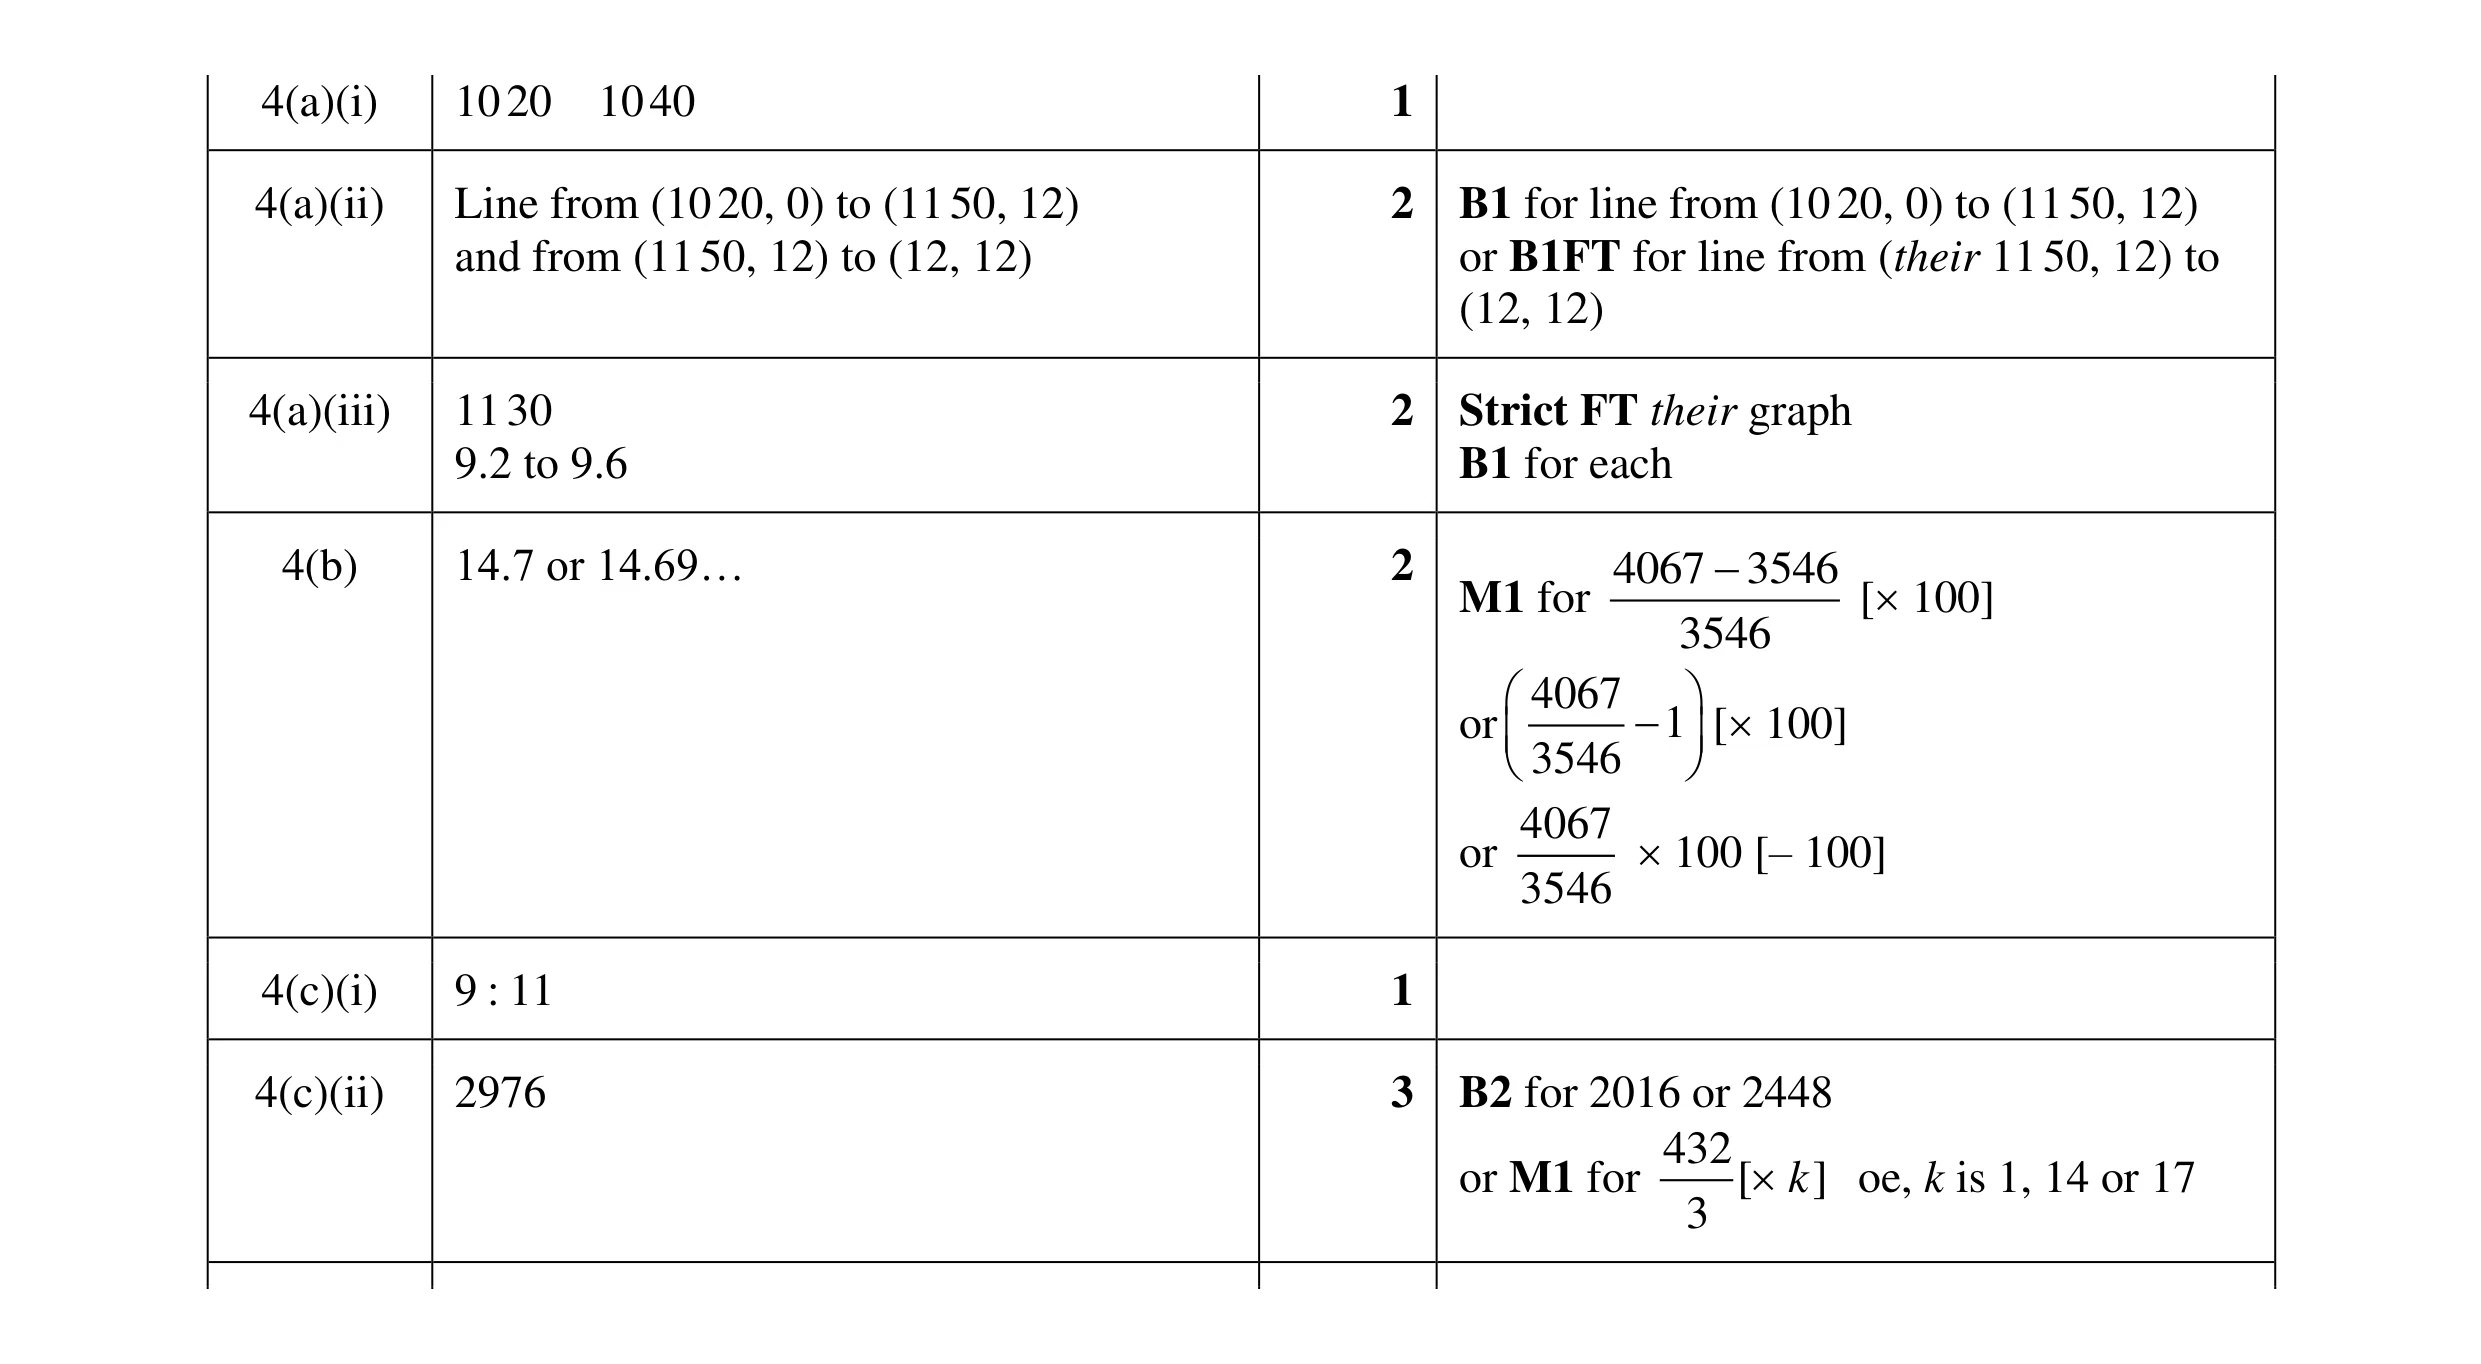 11
11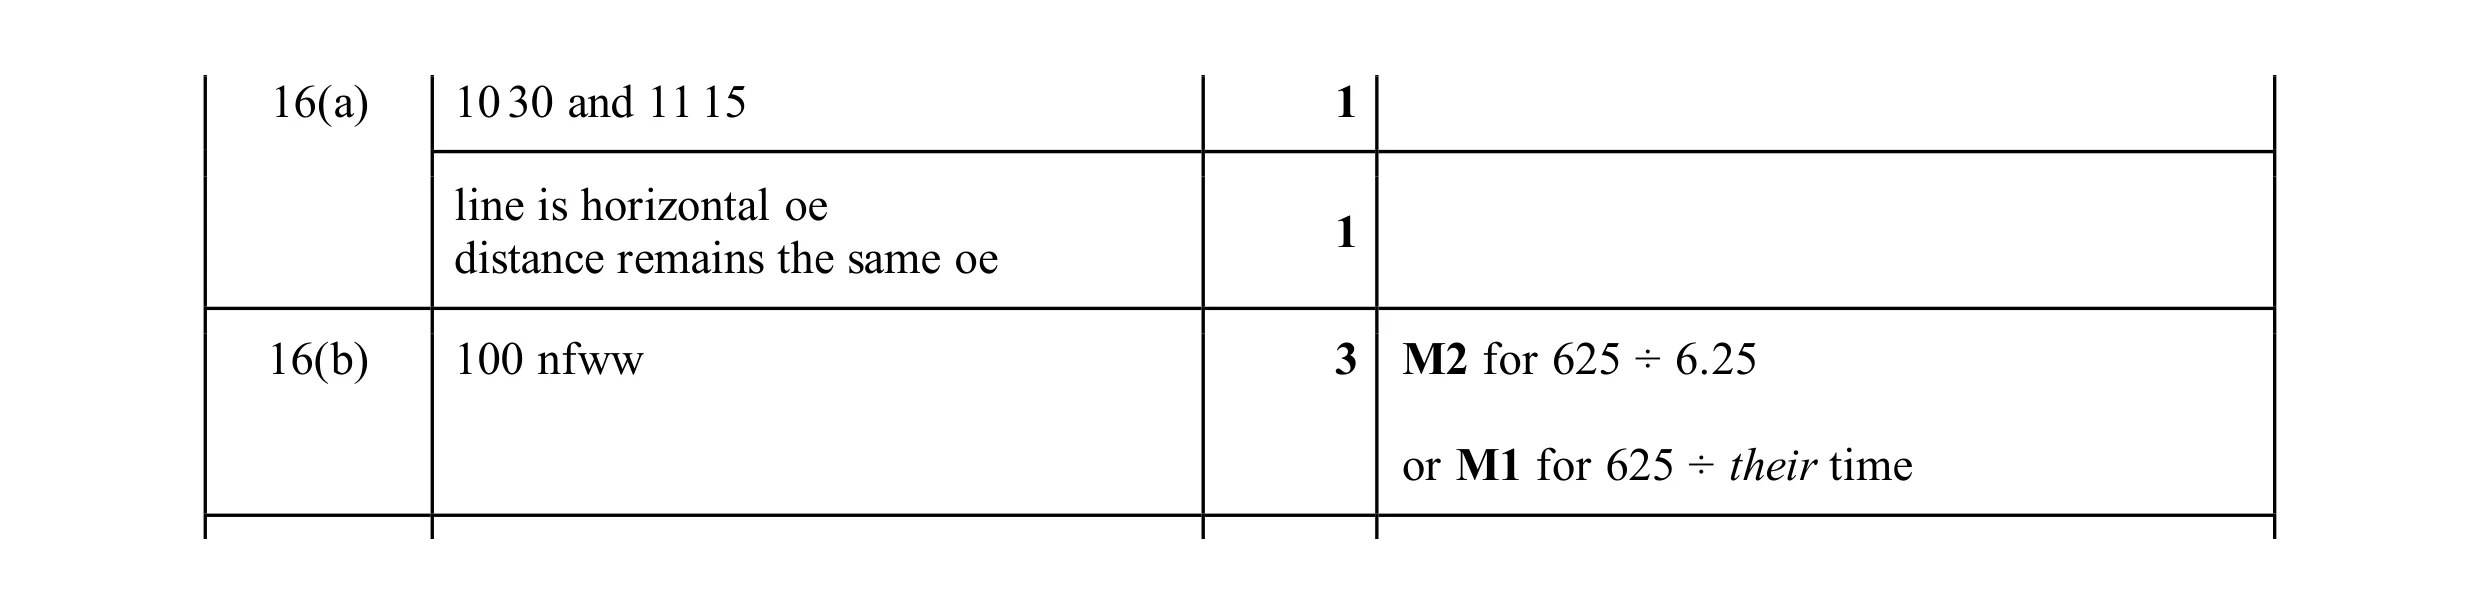 5
5