Cambridge IGCSE Geography 0460 — 2025 Feb/March Paper 4 · Variant 2
0460/42/F/M/25 · 2 questions · 60 marks · 90 min
The question paper and its mark scheme, free to read here and free to download. This is Cambridge’s own paper, exactly as it was sat.
Question paper16 pages

Mark scheme9 pages
Answers below. Sit the paper first if you are practising.
Questions as text
Q1 · Students in an upland area of the UK did fieldwork on a river
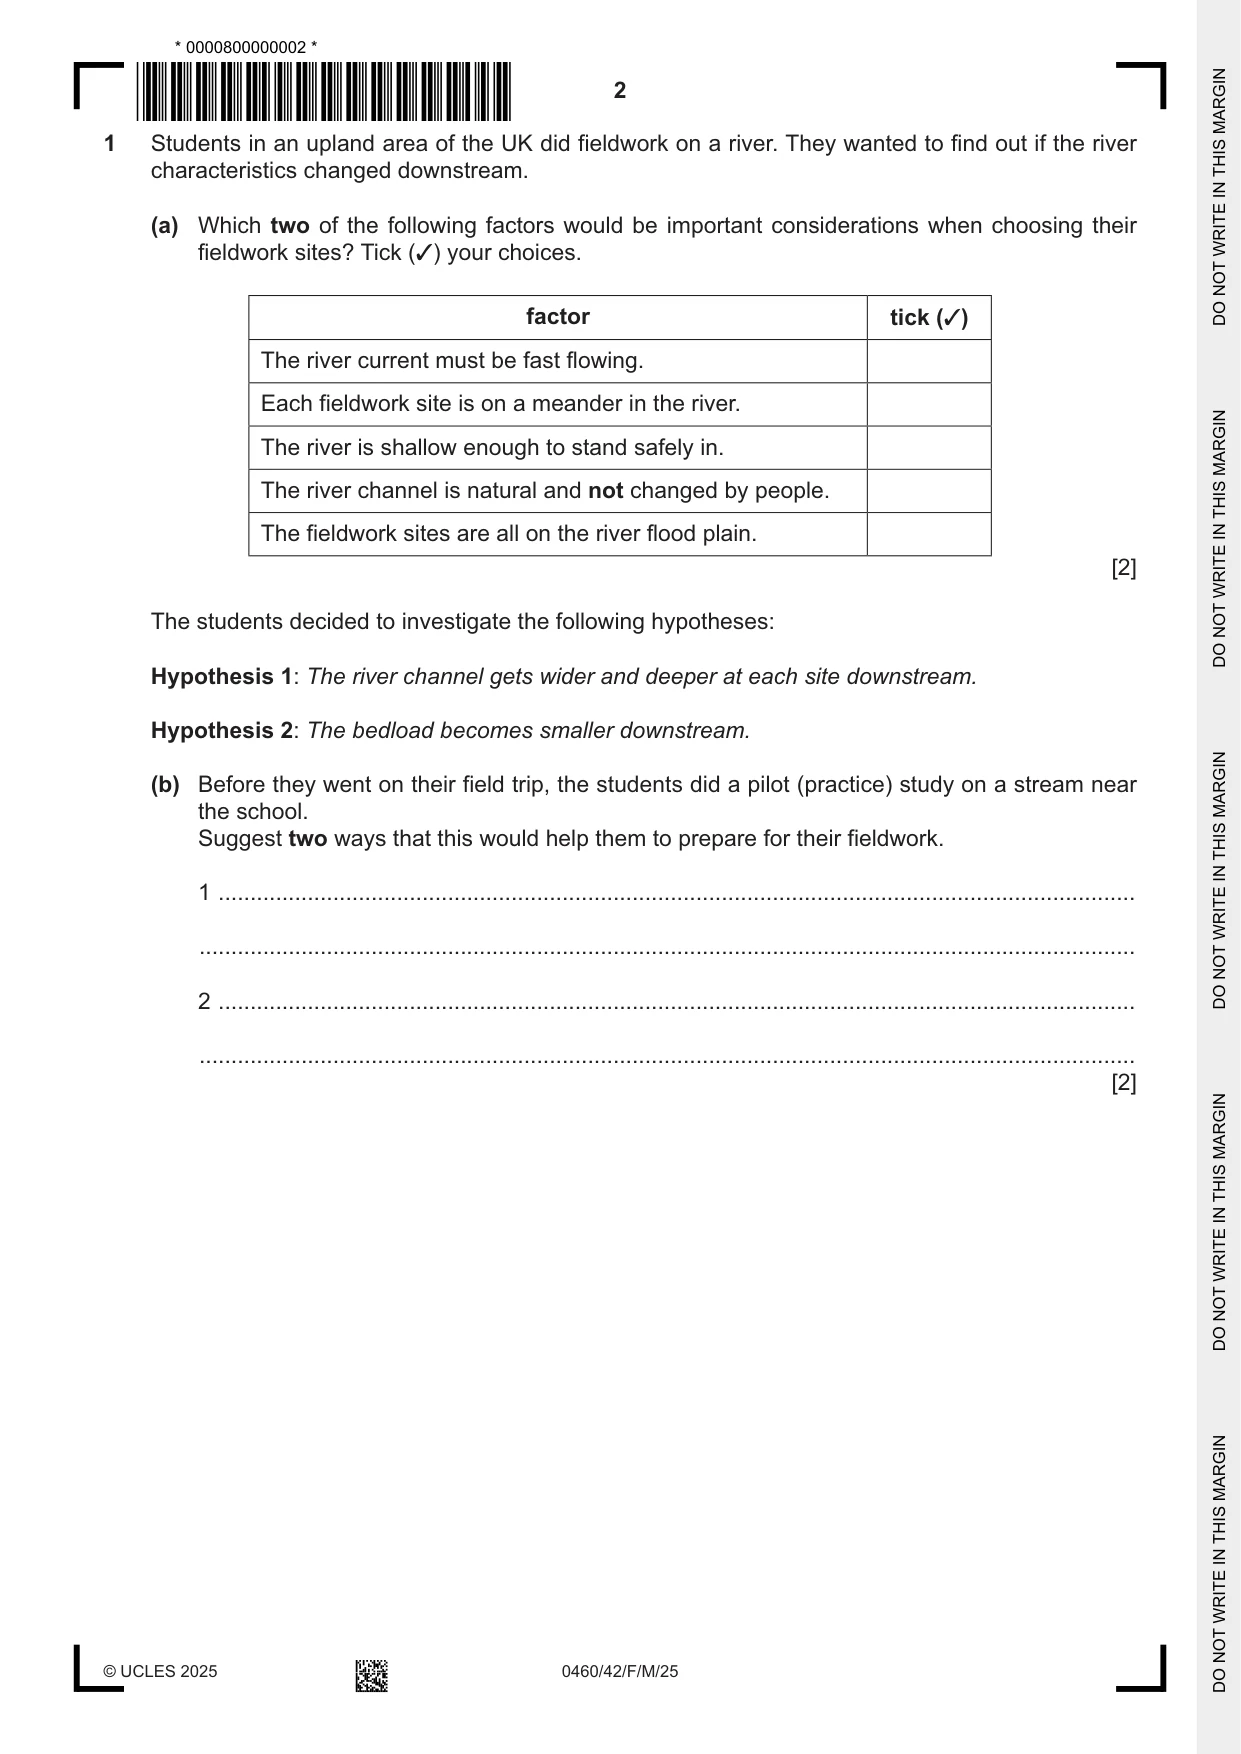
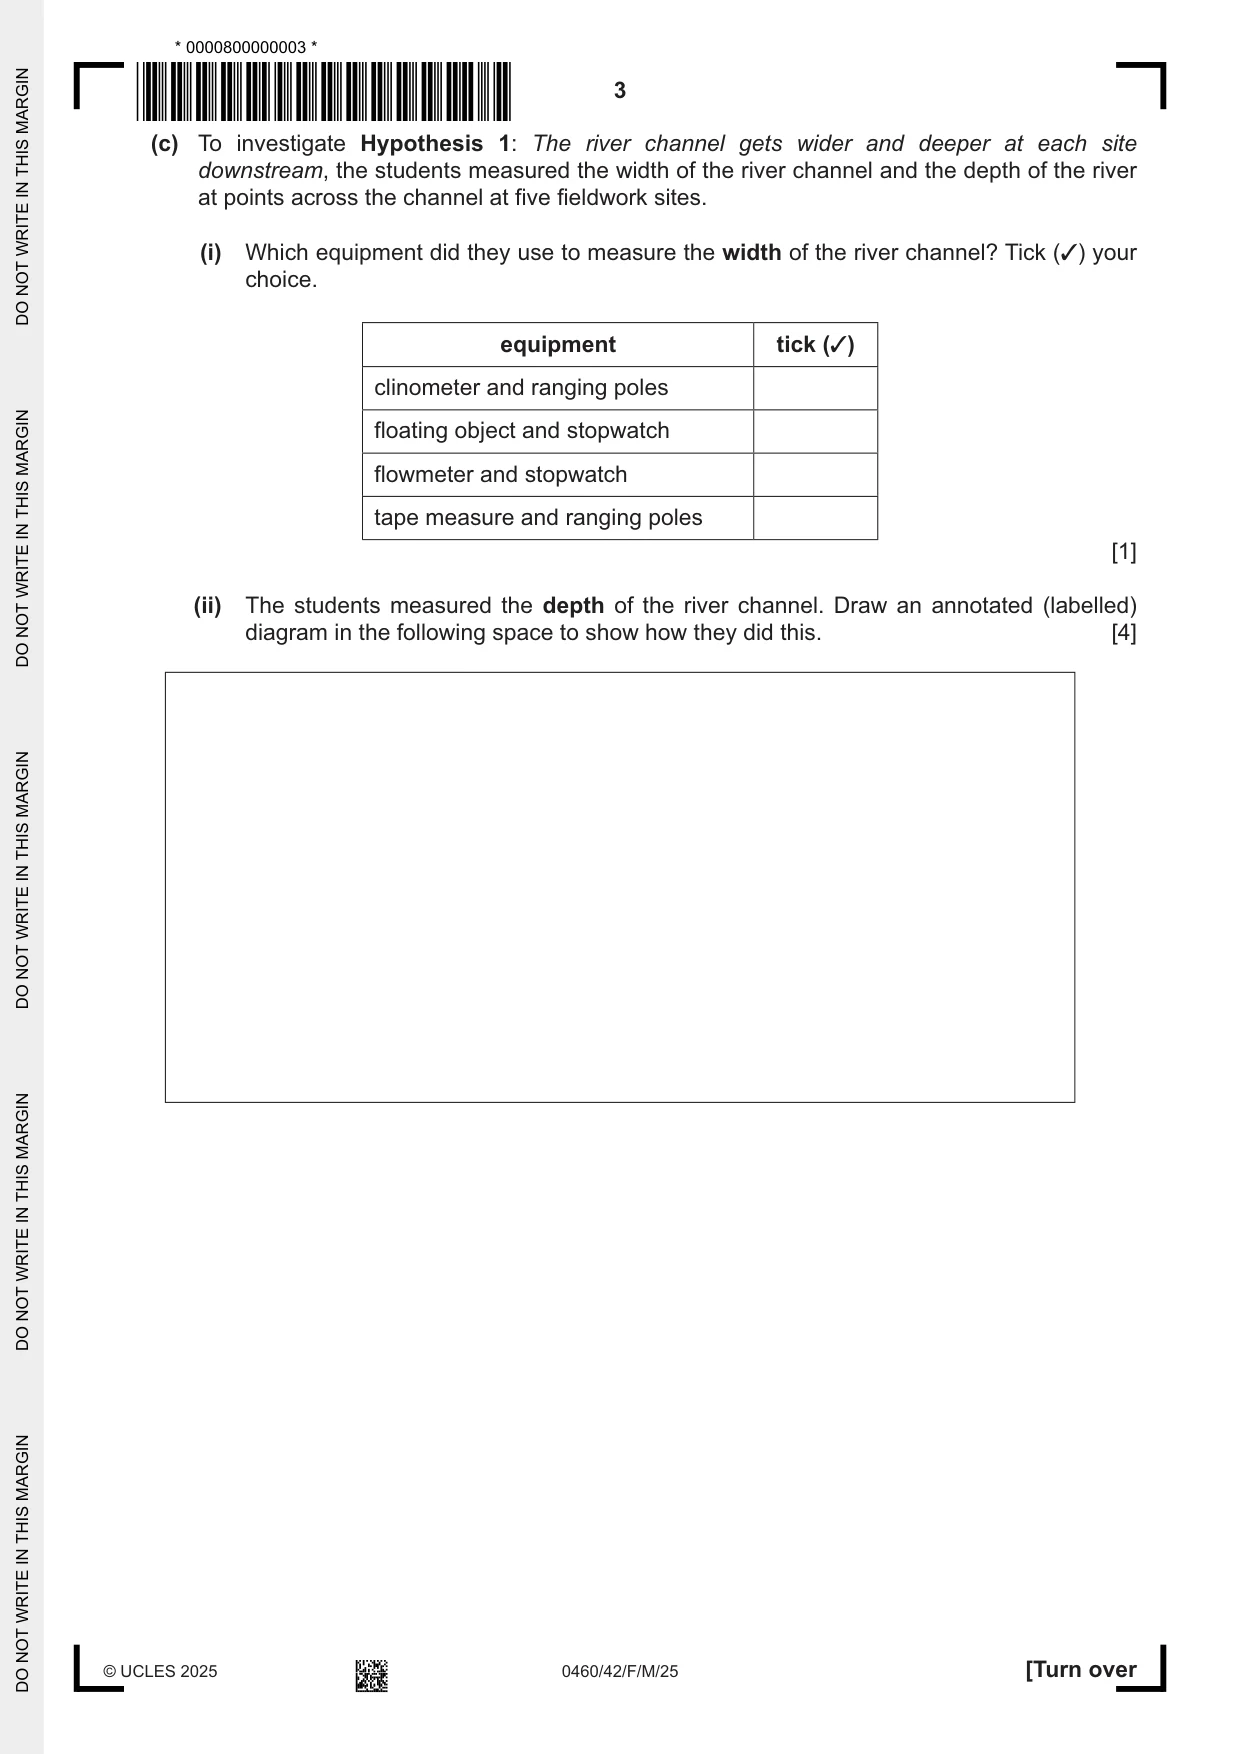
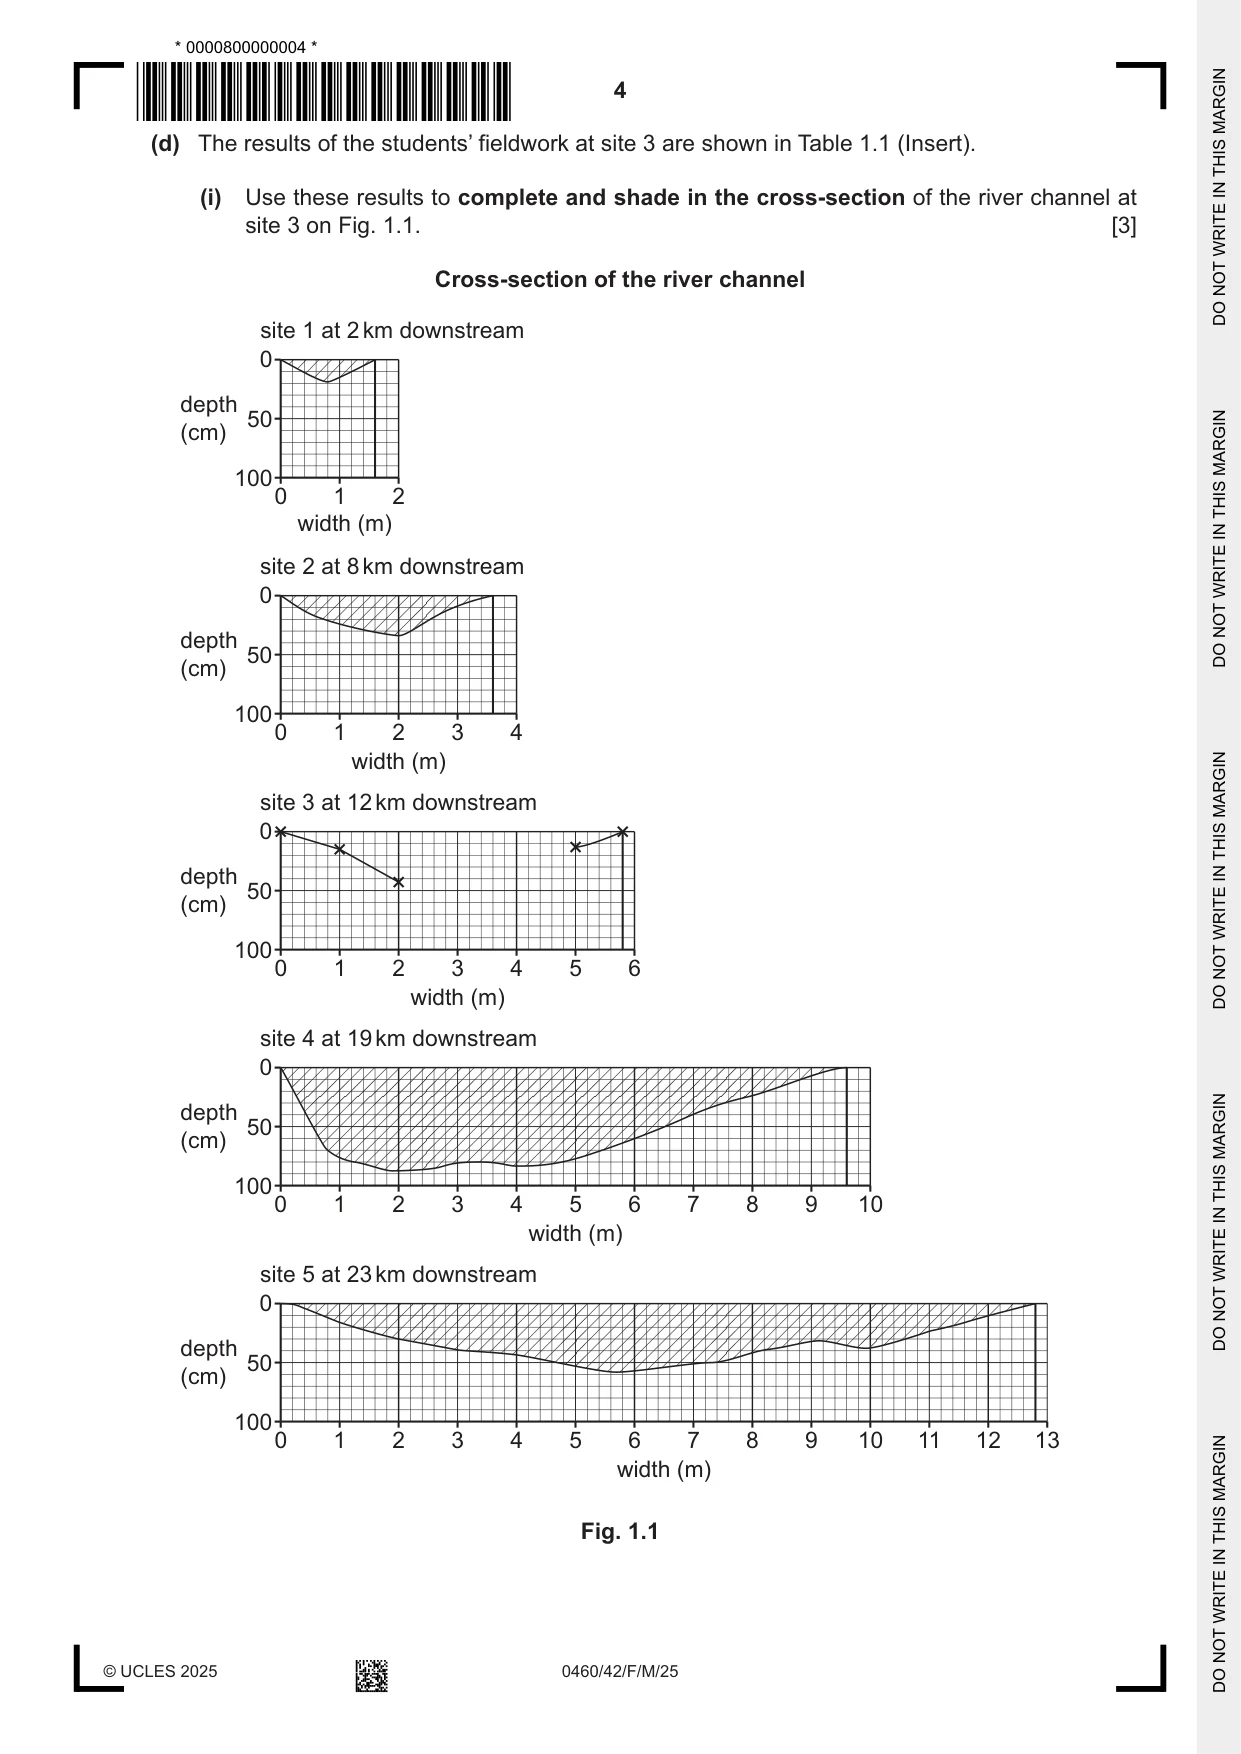
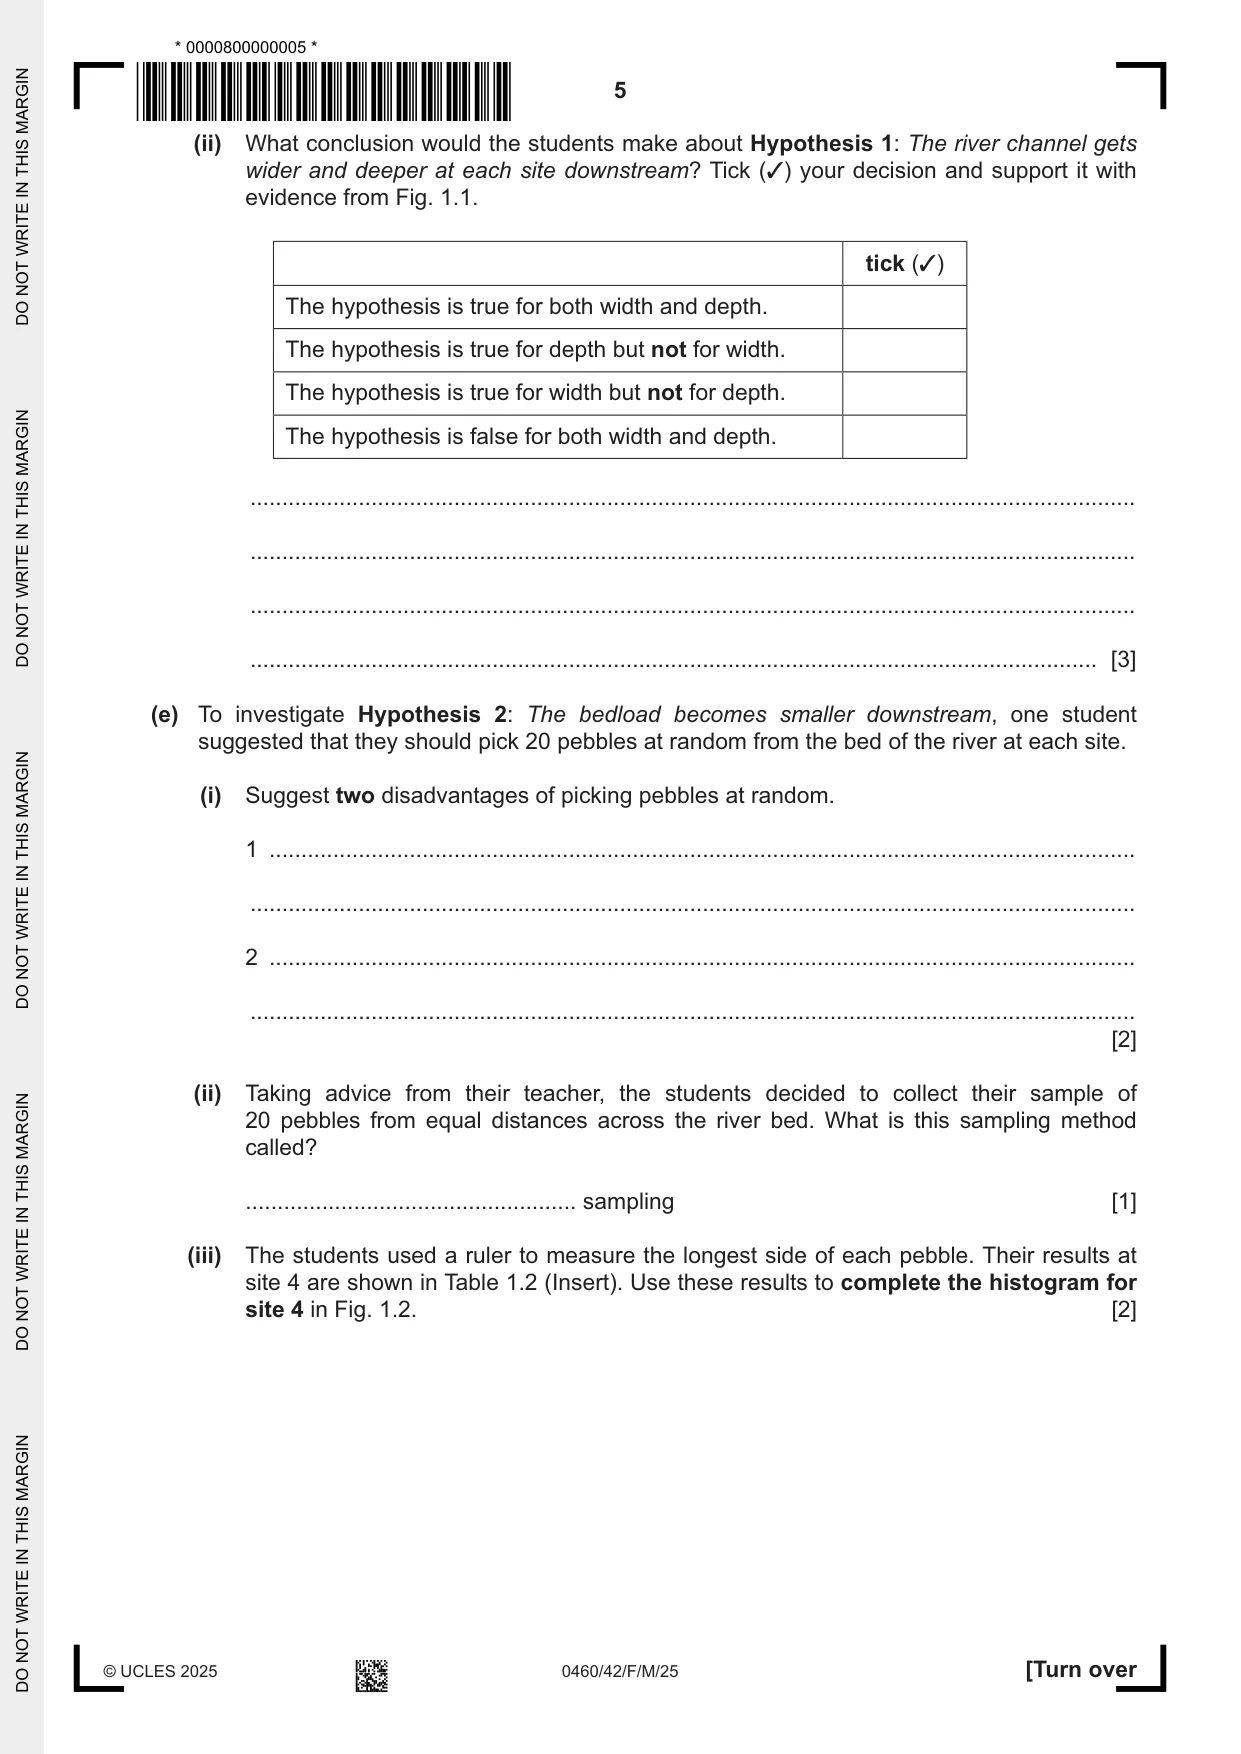
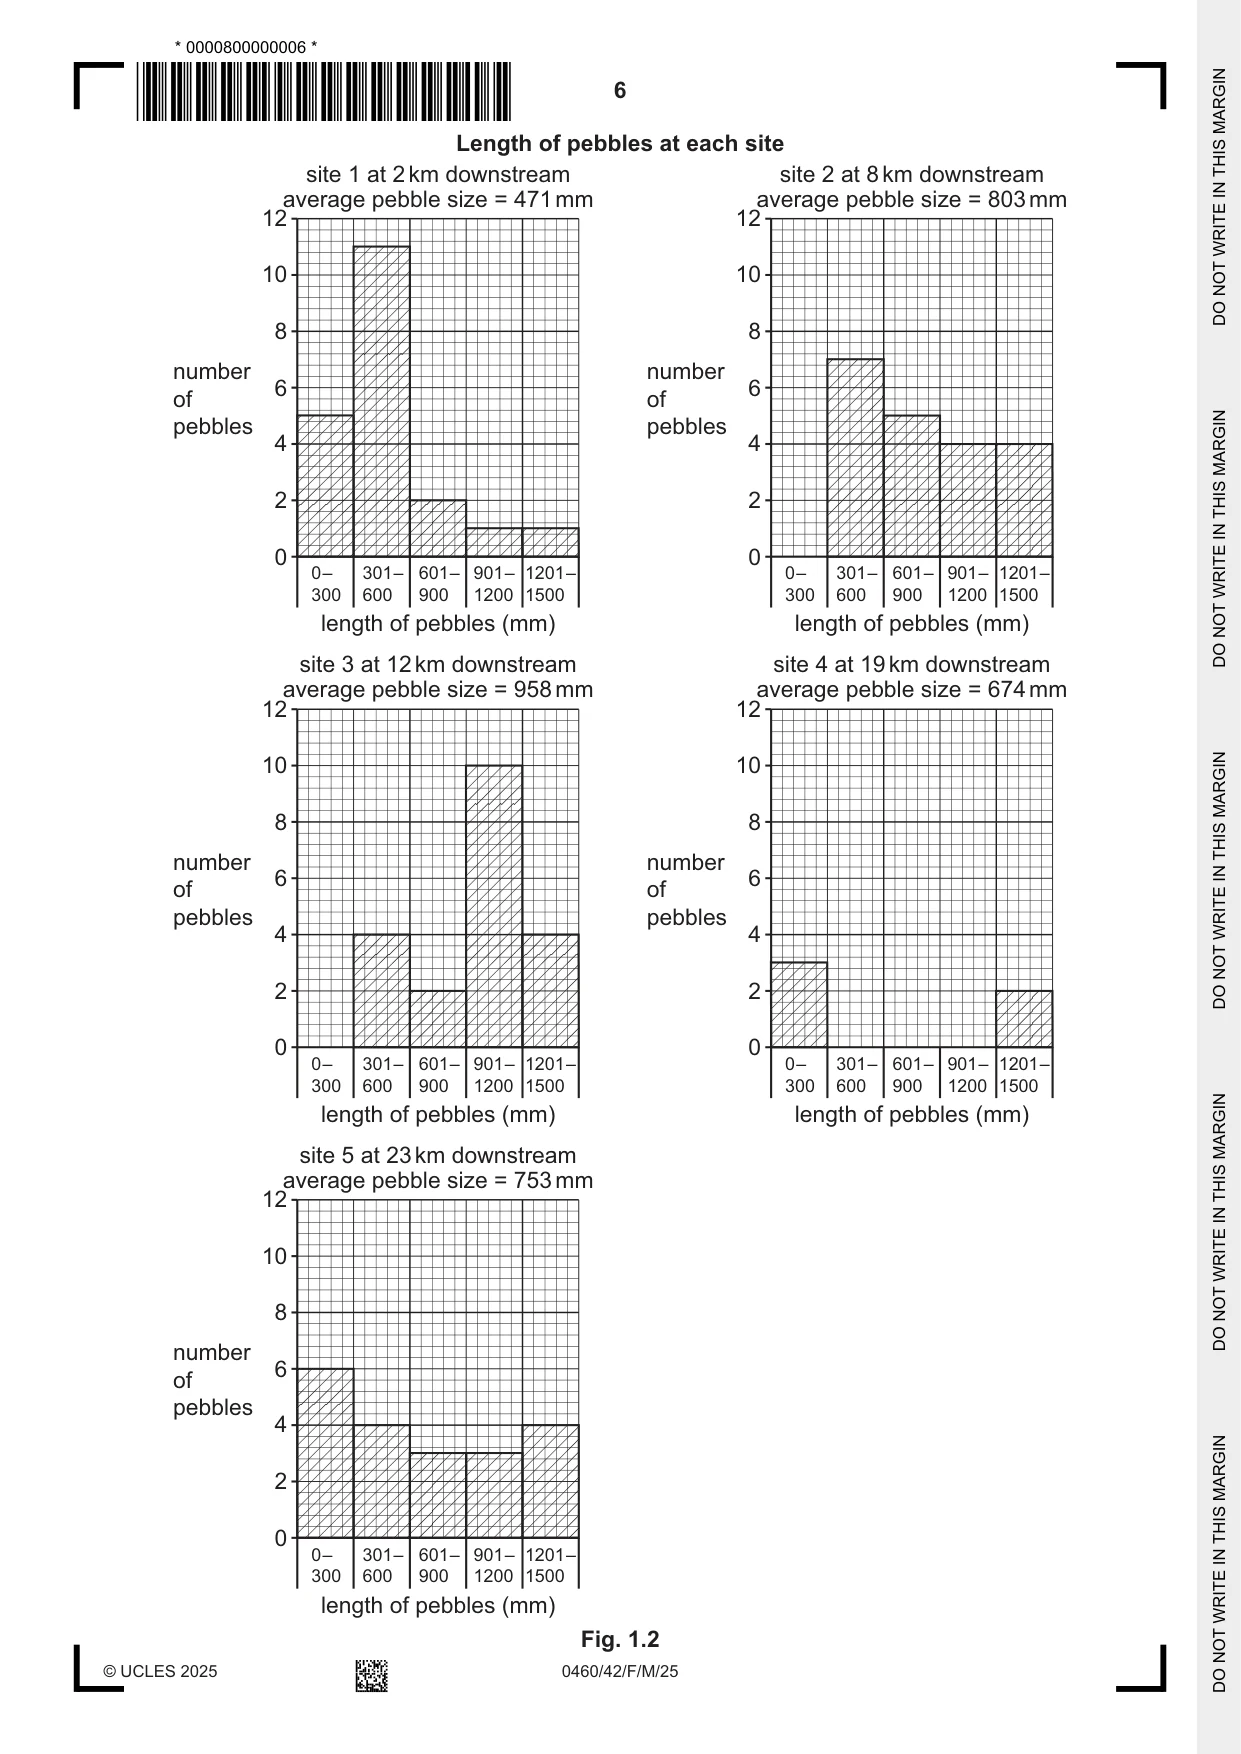
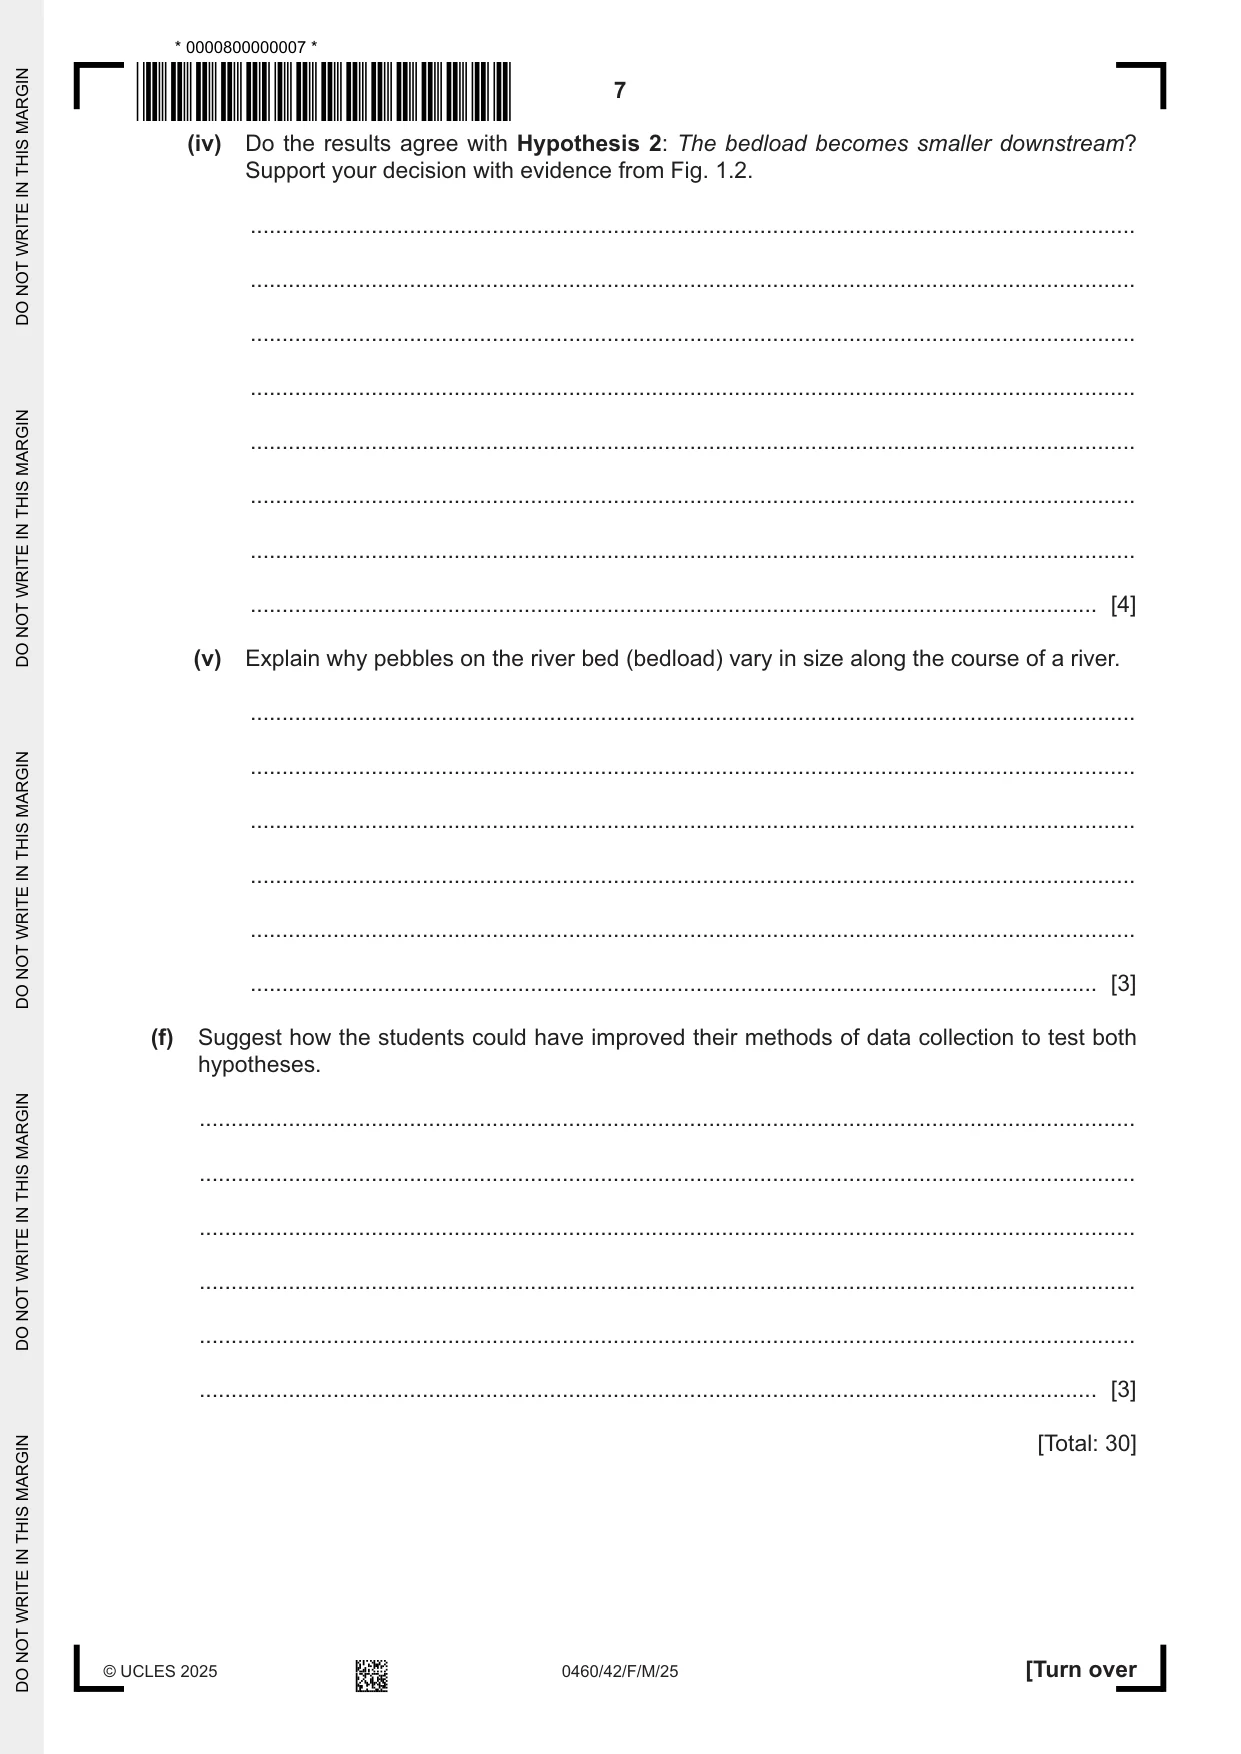
1 Students in an upland area of the UK did fieldwork on a river. They wanted to find out if the river characteristics changed downstream. (a) Which two of the following factors would be important considerations when choosing their fieldwork sites? Tick (3) your choices. factor tick (3) The river current must be fast flowing. Each fieldwork site is on a meander in the river. The river is shallow enough to stand safely in. The river channel is natural and not changed by people. The fieldwork sites are all on the river flood plain. [2] The students decided to investigate the following hypotheses: Hypothesis 1: The river channel gets wider and deeper at each site downstream. Hypothesis 2: The bedload becomes smaller downstream. (b) Before they went on their field trip, the students did a pilot (practice) study on a stream near the school. Suggest two ways that this would help them to prepare for their fieldwork. 1 ................................................................................................................................................ ................................................................................................................................................... 2 ................................................................................................................................................ ................................................................................................................................................... [2] (c) To investigate Hypothesis 1: The river channel gets wider and deeper at each site downstream, the students measured the width of the river channel and the depth of the river at points across the channel at five fieldwork sites. (i) Which equipment did they use to measure the width of the river channel? Tick (3) your choice. equipment tick (3) clinometer and ranging poles floating object and stopwatch flowmeter and stopwatch tape measure and ranging poles [1] (ii) The students measured the depth of the river channel. Draw an annotated (labelled) diagram in the following space to show how they did this. [4] (d) The results of the students’ fieldwork at site 3 are shown in Table 1.1 (Insert). (i) Use these results to complete and shade in the cross-section of the river channel at site 3 on Fig. 1.1. [3] Cross-section of the river channel site 1 at 2 km downstream 0 depth 50 (cm) 1000 1 2 width (m) site 2 at 8 km downstream 0 depth 50 (cm) 100 0 1 2 3 4 width (m) site 3 at 12 km downstream 0 depth 50 (cm) 100 0 1 2 3 4 5 6 width (m) site 4 at 19 km downstream 0 depth 50 (cm) 100 0 1 2 3 4 5 6 7 8 9 10 width (m) site 5 at 23 km downstream 0 depth 50 (cm) 100 0 1 2 3 4 5 6 7 8 9 10 11 12 13 width (m) Fig. 1.1 (ii) What conclusion would the students make about Hypothesis 1: The river channel gets wider and deeper at each site downstream? Tick (3) your decision and support it with evidence from Fig. 1.1. tick (3) The hypothesis is true for both width and depth. The hypothesis is true for depth but not for width. The hypothesis is true for width but not for depth. The hypothesis is false for both width and depth. ........................................................................................................................................... ........................................................................................................................................... ........................................................................................................................................... ..................................................................................................................................... [3] (e) To investigate Hypothesis 2: The bedload becomes smaller downstream, one student suggested that they should pick 20 pebbles at random from the bed of the river at each site. (i) Suggest two disadvantages of picking pebbles at random. 1 ........................................................................................................................................ ........................................................................................................................................... 2 ........................................................................................................................................ ........................................................................................................................................... [2] (ii) Taking advice from their teacher, the students decided to collect their sample of 20 pebbles from equal distances across the river bed. What is this sampling method called? .................................................... sampling [1] (iii) The students used a ruler to measure the longest side of each pebble. Their results at site 4 are shown in Table 1.2 (Insert). Use these results to complete the histogram for site 4 in Fig. 1.2. [2] Length of pebbles at each site site 1 at 2 km downstream site 2 at 8 km downstream average pebble size = 471 mm average pebble size = 803 mm 12 12 10 10 8 8 number number 6 6of of pebbles pebbles 4 4 2 2 0 0 0 – 301 – 601 – 901 – 1201 – 0 – 301 – 601 – 901 – 1201 – 300 600 900 1200 1500 300 600 900 1200 1500 length of pebbles (mm) length of pebbles (mm) site 3 at 12 km downstream site 4 at 19 km downstream average pebble size = 958 mm average pebble size = 674 mm 12 12 10 10 8 8 number number 6 6of of pebbles pebbles 4 4 2 2 0 0 0 – 301 – 601 – 901 – 1201 – 0 – 301 – 601 – 901 – 1201 – 300 600 900 1200 1500 300 600 900 1200 1500 length of pebbles (mm) length of pebbles (mm) site 5 at 23 km downstream average pebble size = 753 mm 12 10 8 number 6of pebbles 4 2 0 0 – 301 – 601 – 901 – 1201 – 300 600 900 1200 1500 length of pebbles (mm) Fig. 1.2 (iv) Do the results agree with Hypothesis 2: The bedload becomes smaller downstream? Support your decision with evidence from Fig. 1.2. ........................................................................................................................................... ........................................................................................................................................... ........................................................................................................................................... ........................................................................................................................................... ........................................................................................................................................... ........................................................................................................................................... ........................................................................................................................................... ..................................................................................................................................... [4] (v) Explain why pebbles on the river bed (bedload) vary in size along the course of a river. ........................................................................................................................................... ........................................................................................................................................... ........................................................................................................................................... ........................................................................................................................................... ........................................................................................................................................... ..................................................................................................................................... [3] (f) Suggest how the students could have improved their methods of data collection to test both hypotheses. ................................................................................................................................................... ................................................................................................................................................... ................................................................................................................................................... ................................................................................................................................................... ................................................................................................................................................... ............................................................................................................................................. [3] [Total: 30]
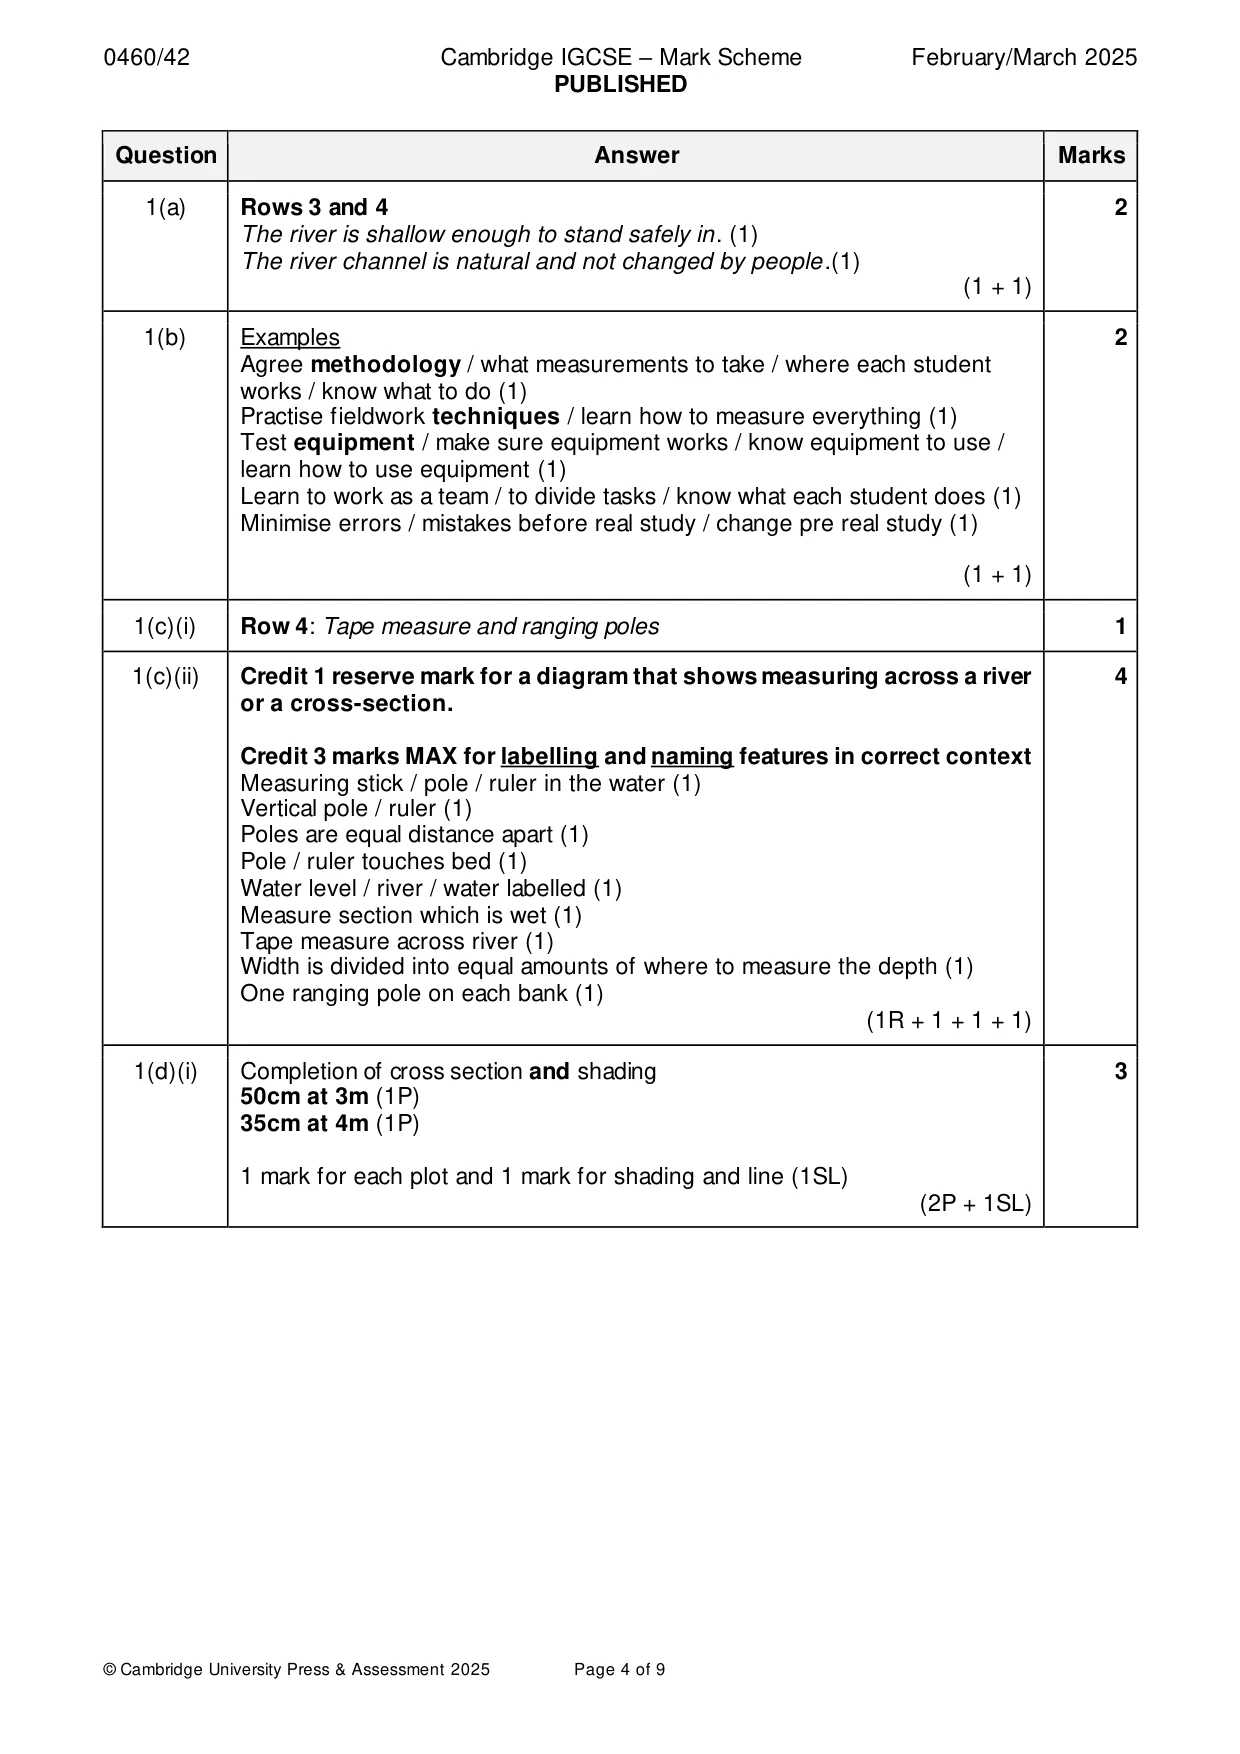
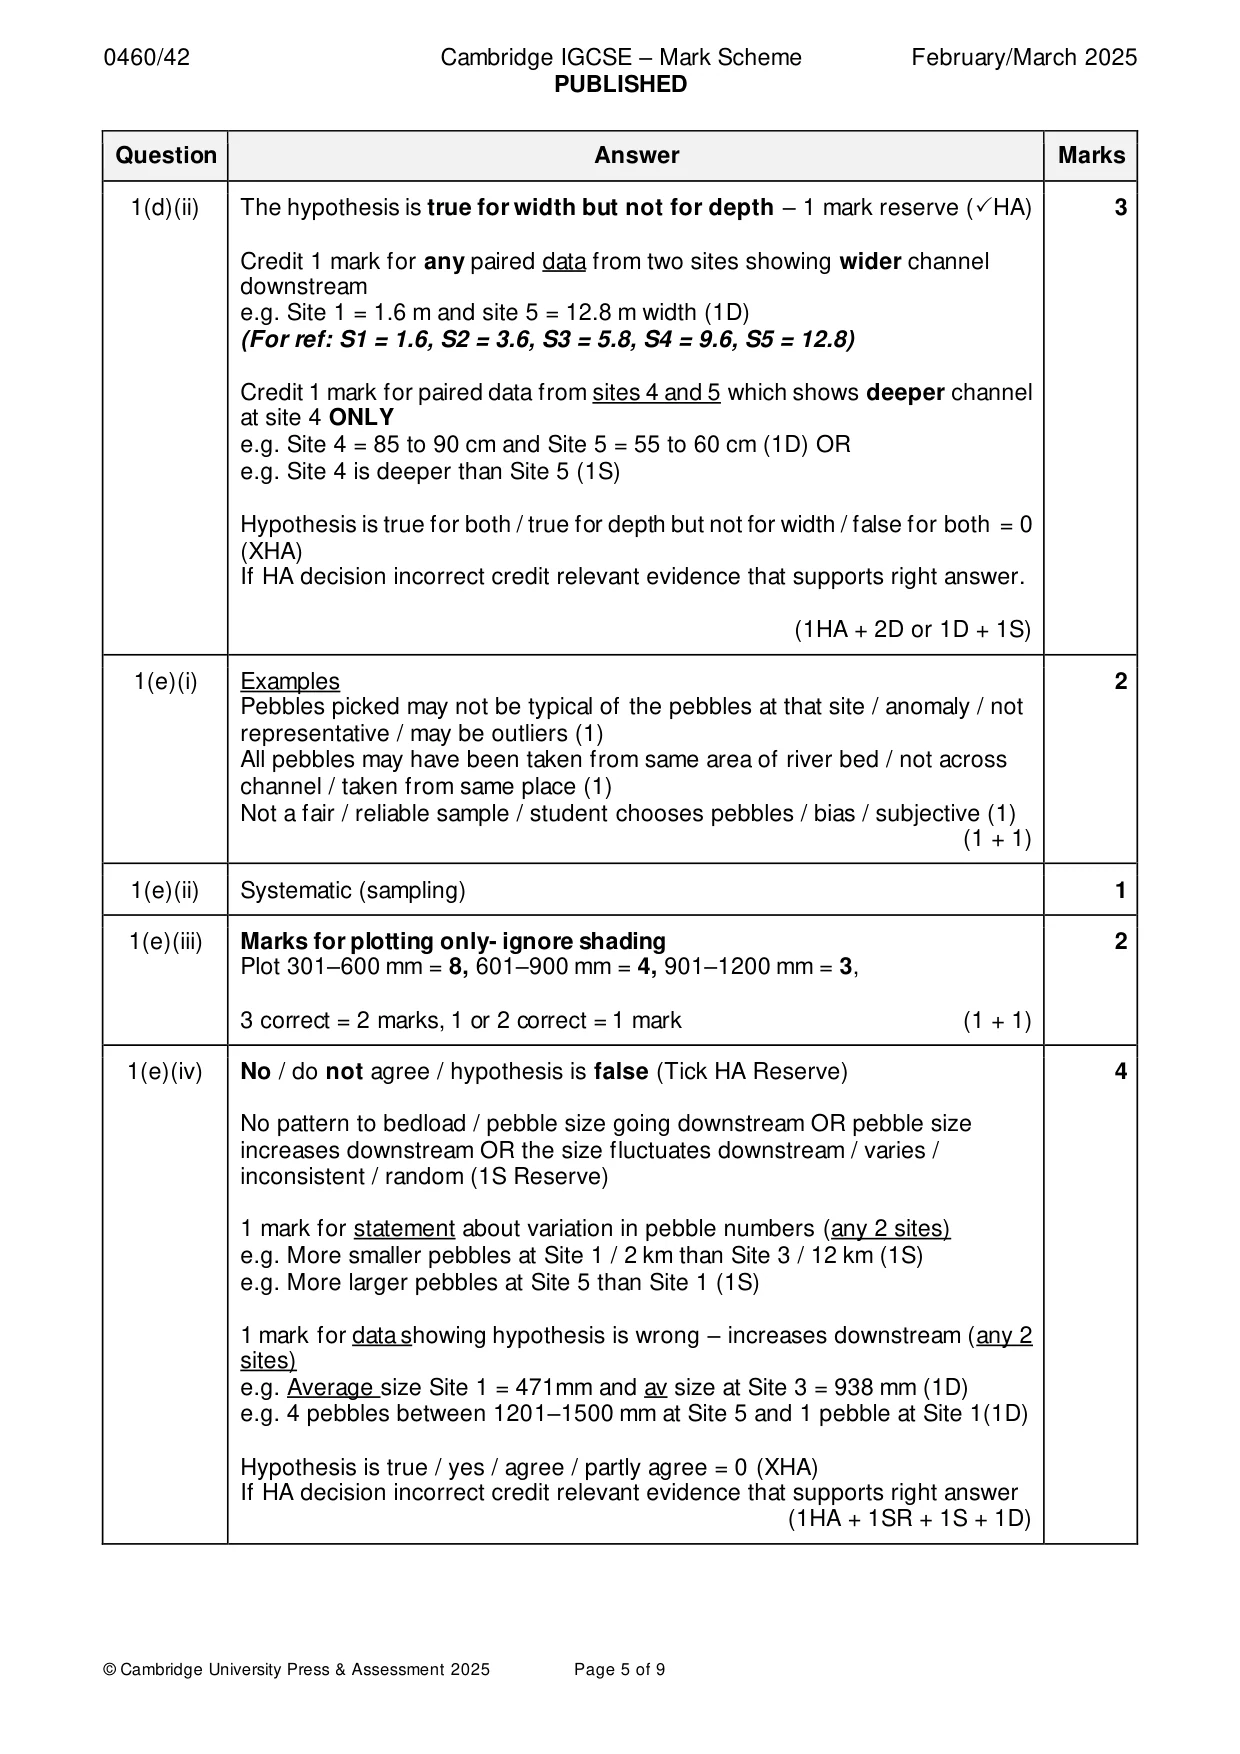
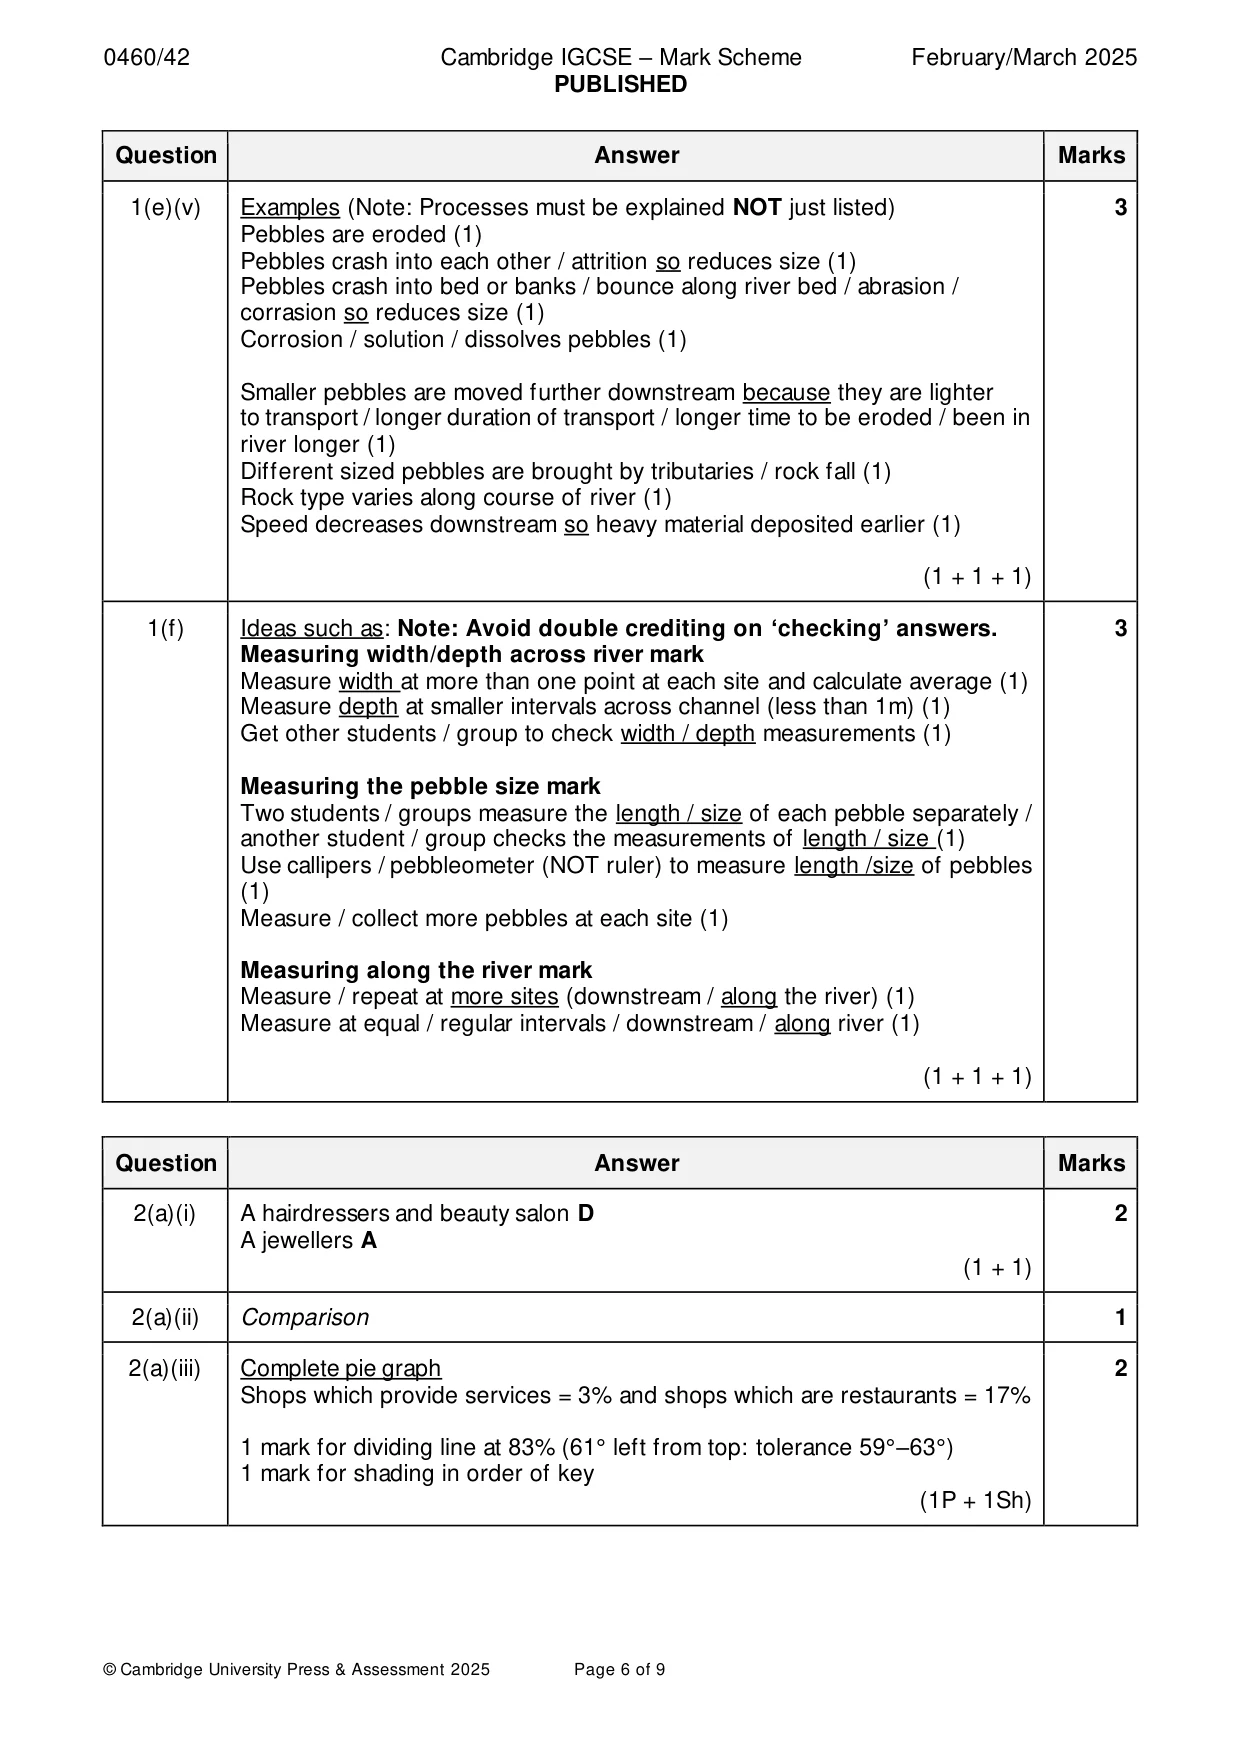
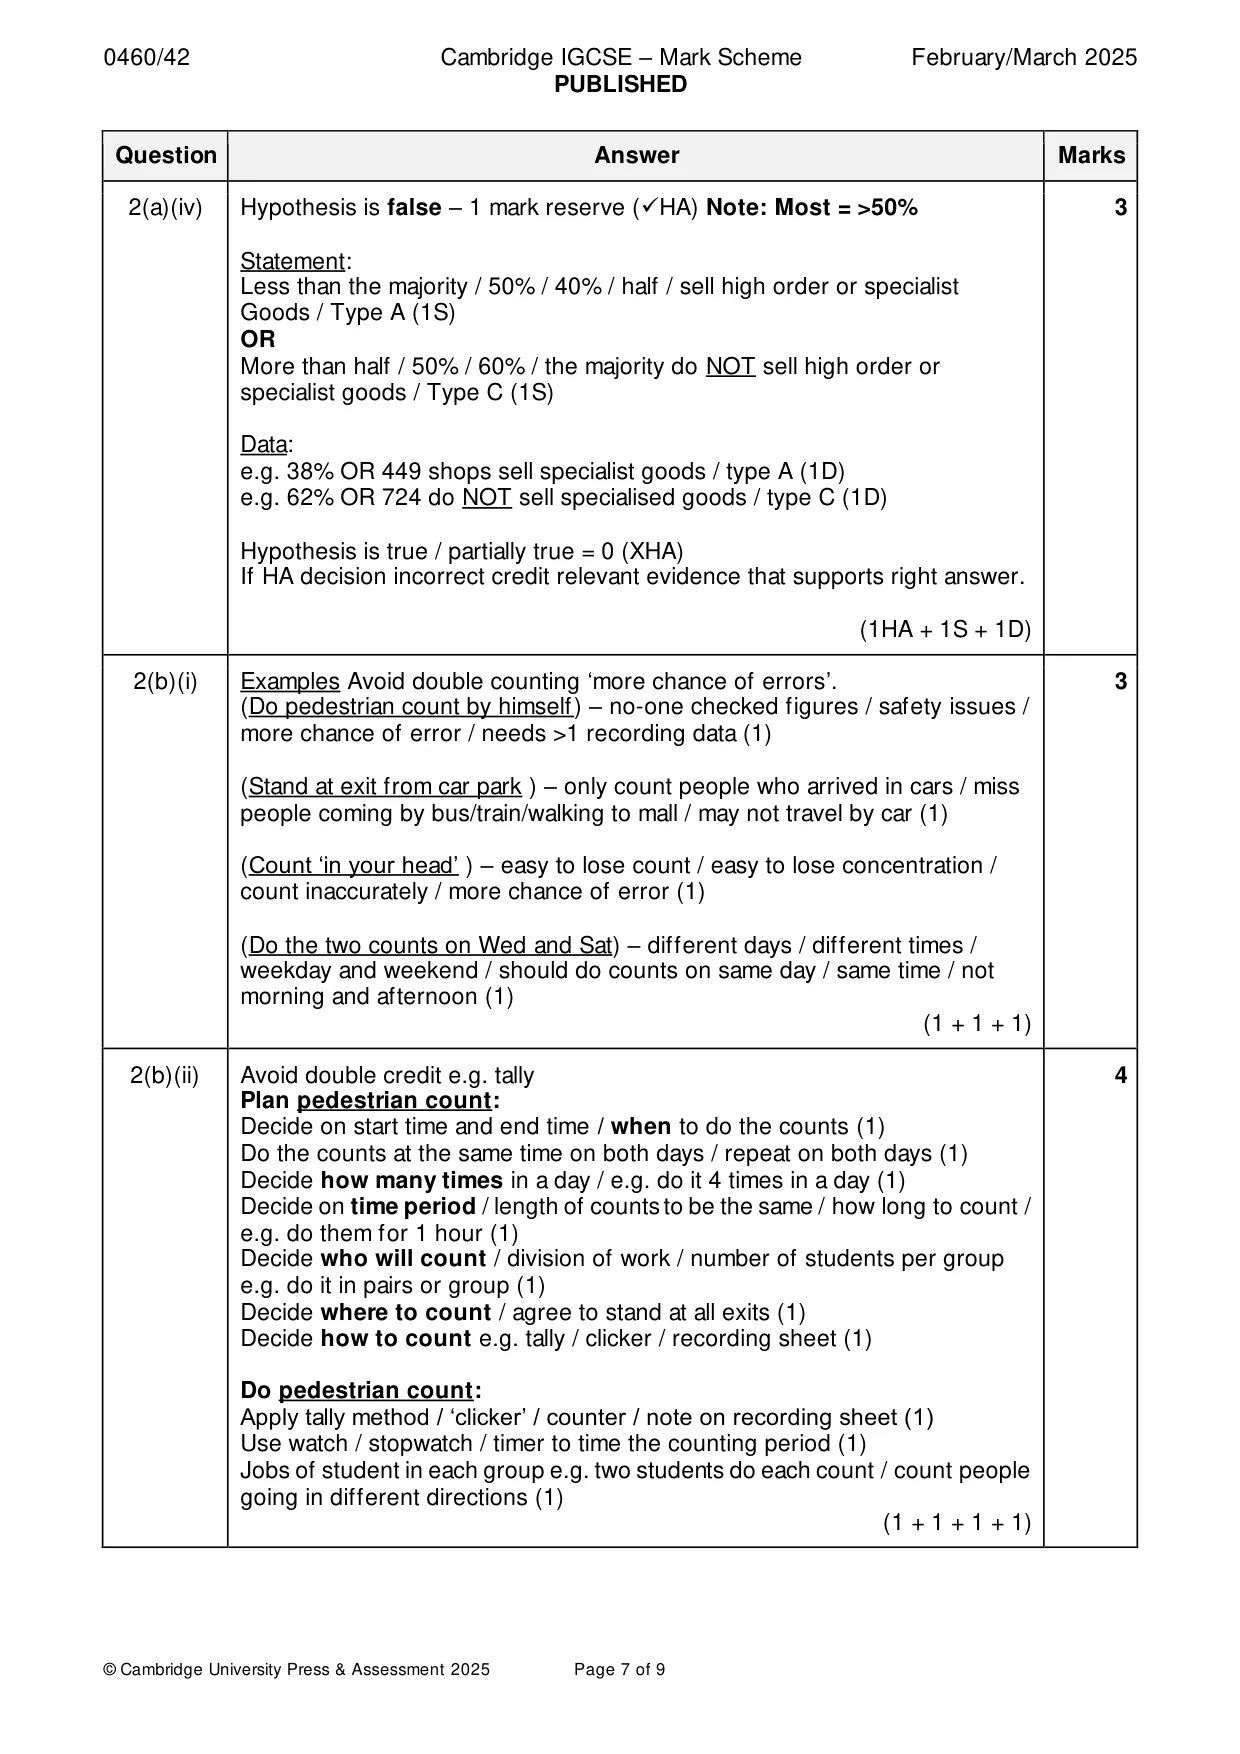
Mark scheme: Question Answer Marks 1(a) Rows 3 and 4 2 The river is shallow enough to stand safely in. (1) The river channel is natural and not changed by people.(1) (1 + 1) 1(b) Examples 2 Agree methodology / what measurements to take / where each student works / know what to do (1) Practise fieldwork techniques / learn how to measure everything (1) Test equipment / make sure equipment works / know equipment to use / learn how to use equipment (1) Learn to work as a team / to divide tasks / know what each student does (1) Minimise errors / mistakes before real study / change pre real study (1) (1 + 1) 1(c)(i) Row 4: Tape measure and ranging poles 1 1(c)(ii) Credit 1 reserve mark for a diagram that shows measuring across a river 4 or a cross-section. Credit 3 marks MAX for labelling and naming features in correct context Measuring stick / pole / ruler in the water (1) Vertical pole / ruler (1) Poles are equal distance apart (1) Pole / ruler touches bed (1) Water level / river / water labelled (1) Measure section which is wet (1) Tape measure across river (1) Width is divided into equal amounts of where to measure the depth (1) One ranging pole on each bank (1) (1R + 1 + 1 + 1) 1(d)(i) Completion of cross section and shading 3 50cm at 3m (1P) 35cm at 4m (1P) 1 mark for each plot and 1 mark for shading and line (1SL) (2P + 1SL) 1(d)(ii) The hypothesis is true for width but not for depth – 1 mark reserve (HA) 3 Credit 1 mark for any paired data from two sites showing wider channel downstream e.g. Site 1 = 1.6 m and site 5 = 12.8 m width (1D) (For ref: S1 = 1.6, S2 = 3.6, S3 = 5.8, S4 = 9.6, S5 = 12.8) Credit 1 mark for paired data from sites 4 and 5 which shows deeper channel at site 4 ONLY e.g. Site 4 = 85 to 90 cm and Site 5 = 55 to 60 cm (1D) OR e.g. Site 4 is deeper than Site 5 (1S) Hypothesis is true for both / true for depth but not for width / false for both = 0 (XHA) If HA decision incorrect credit relevant evidence that supports right answer. (1HA + 2D or 1D + 1S) 1(e)(i) Examples 2 Pebbles picked may not be typical of the pebbles at that site / anomaly / not representative / may be outliers (1) All pebbles may have been taken from same area of river bed / not across channel / taken from same place (1) Not a fair / reliable sample / student chooses pebbles / bias / subjective (1) (1 + 1) 1(e)(ii) Systematic (sampling) 1 1(e)(iii) Marks for plotting only- ignore shading 2 Plot 301–600 mm = 8, 601–900 mm = 4, 901–1200 mm = 3, 3 correct = 2 marks, 1 or 2 correct = 1 mark (1 + 1) 1(e)(iv) No / do not agree / hypothesis is false (Tick HA Reserve) 4 No pattern to bedload / pebble size going downstream OR pebble size increases downstream OR the size fluctuates downstream / varies / inconsistent / random (1S Reserve) 1 mark for statement about variation in pebble numbers (any 2 sites) e.g. More smaller pebbles at Site 1 / 2 km than Site 3 / 12 km (1S) e.g. More larger pebbles at Site 5 than Site 1 (1S) 1 mark for data showing hypothesis is wrong – increases downstream (any 2 sites) e.g. Average size Site 1 = 471mm and av size at Site 3 = 938 mm (1D) e.g. 4 pebbles between 1201–1500 mm at Site 5 and 1 pebble at Site 1(1D) Hypothesis is true / yes / agree / partly agree = 0 (XHA) If HA decision incorrect credit relevant evidence that supports right answer (1HA + 1SR + 1S + 1D) 1(e)(v) Examples (Note: Processes must be explained NOT just listed) 3 Pebbles are eroded (1) Pebbles crash into each other / attrition so reduces size (1) Pebbles crash into bed or banks / bounce along river bed / abrasion / corrasion so reduces size (1) Corrosion / solution / dissolves pebbles (1) Smaller pebbles are moved further downstream because they are lighter to transport / longer duration of transport / longer time to be eroded / been in river longer (1) Different sized pebbles are brought by tributaries / rock fall (1) Rock type varies along course of river (1) Speed decreases downstream so heavy material deposited earlier (1) (1 + 1 + 1) 1(f) Ideas such as: Note: Avoid double crediting on ‘checking’ answers. 3 Measuring width/depth across river mark Measure width at more than one point at each site and calculate average (1) Measure depth at smaller intervals across channel (less than 1m) (1) Get other students / group to check width / depth measurements (1) Measuring the pebble size mark Two students / groups measure the length / size of each pebble separately / another student / group checks the measurements of length / size (1) Use callipers / pebbleometer (NOT ruler) to measure length /size of pebbles (1) Measure / collect more pebbles at each site (1) Measuring along the river mark Measure / repeat at more sites (downstream / along the river) (1) Measure at equal / regular intervals / downstream / along river (1) (1 + 1 + 1)
Q2 · Students in Dubai, in the United Arab Emirates, did fieldwork in the Dubai Mall, a very…
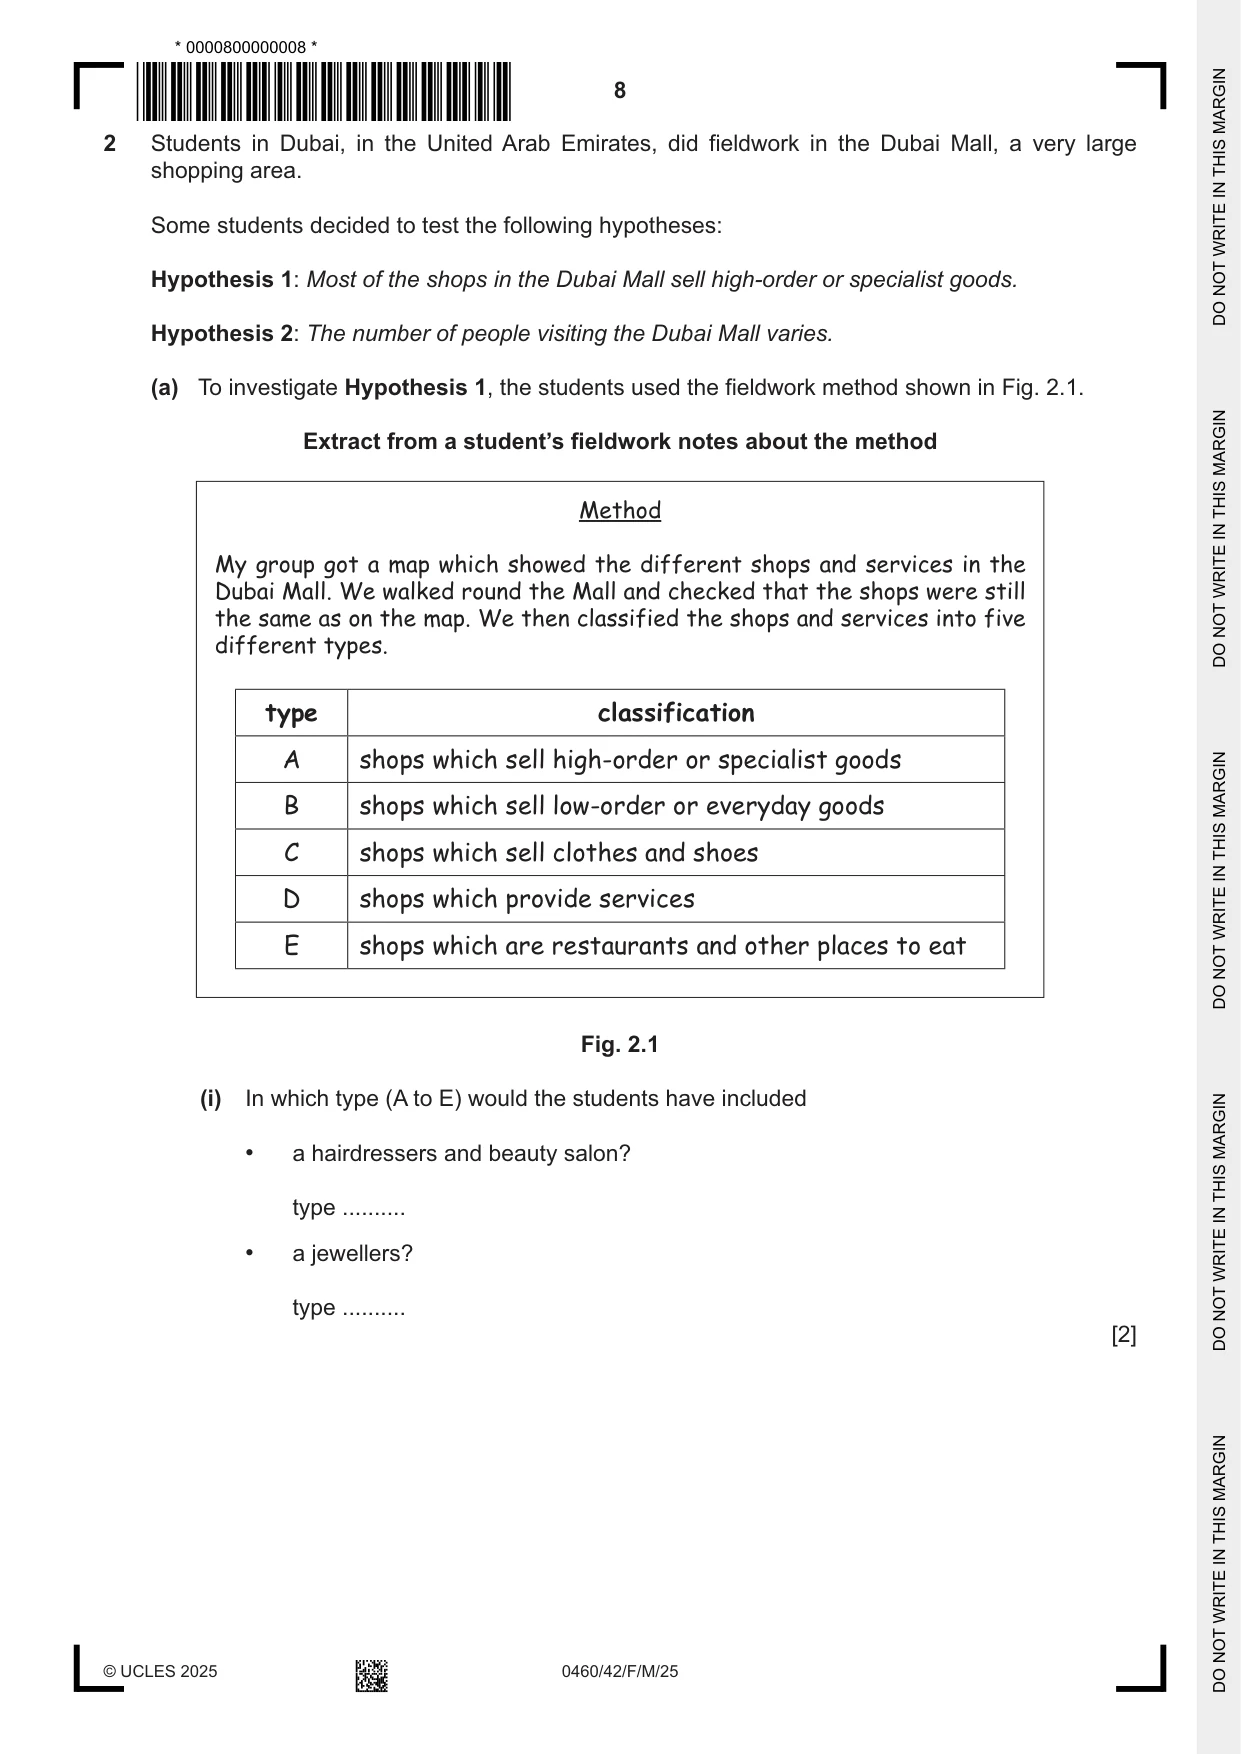
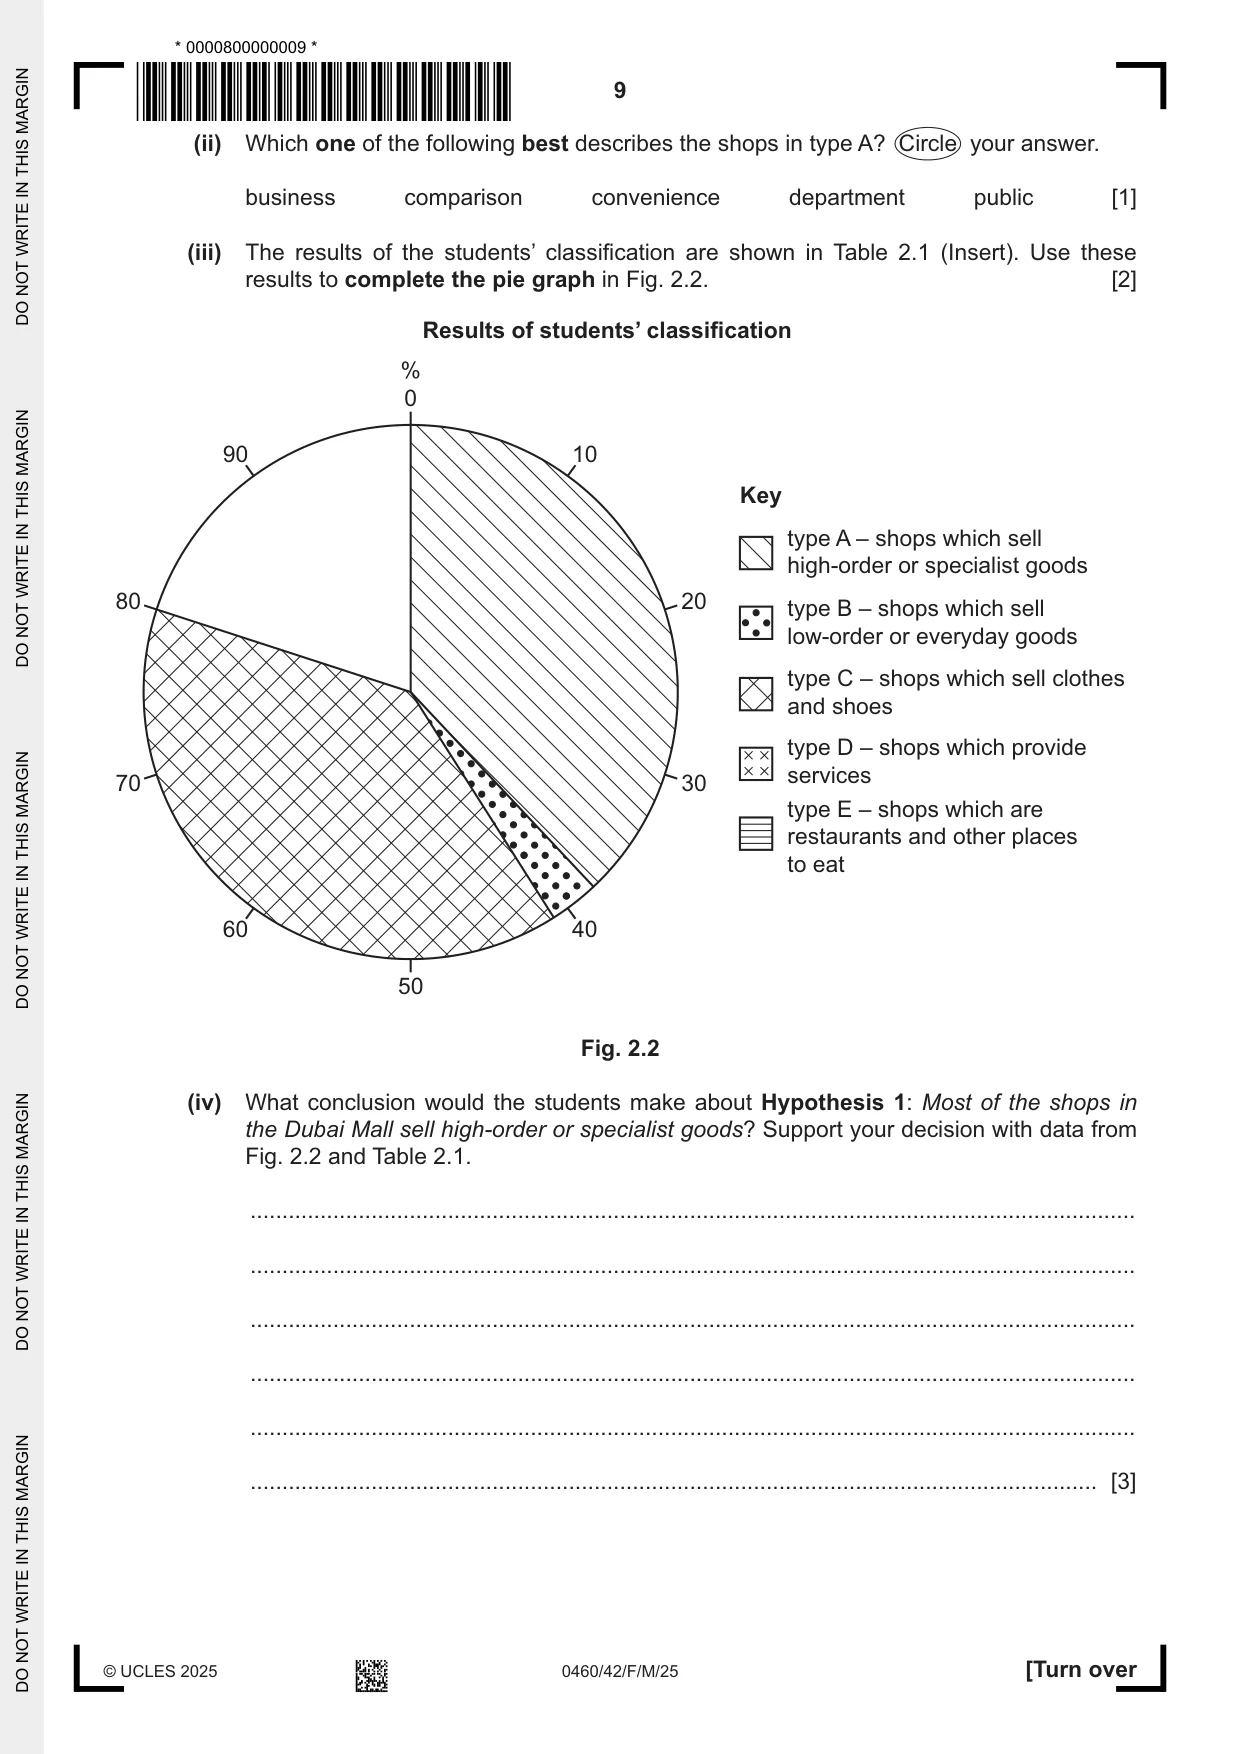
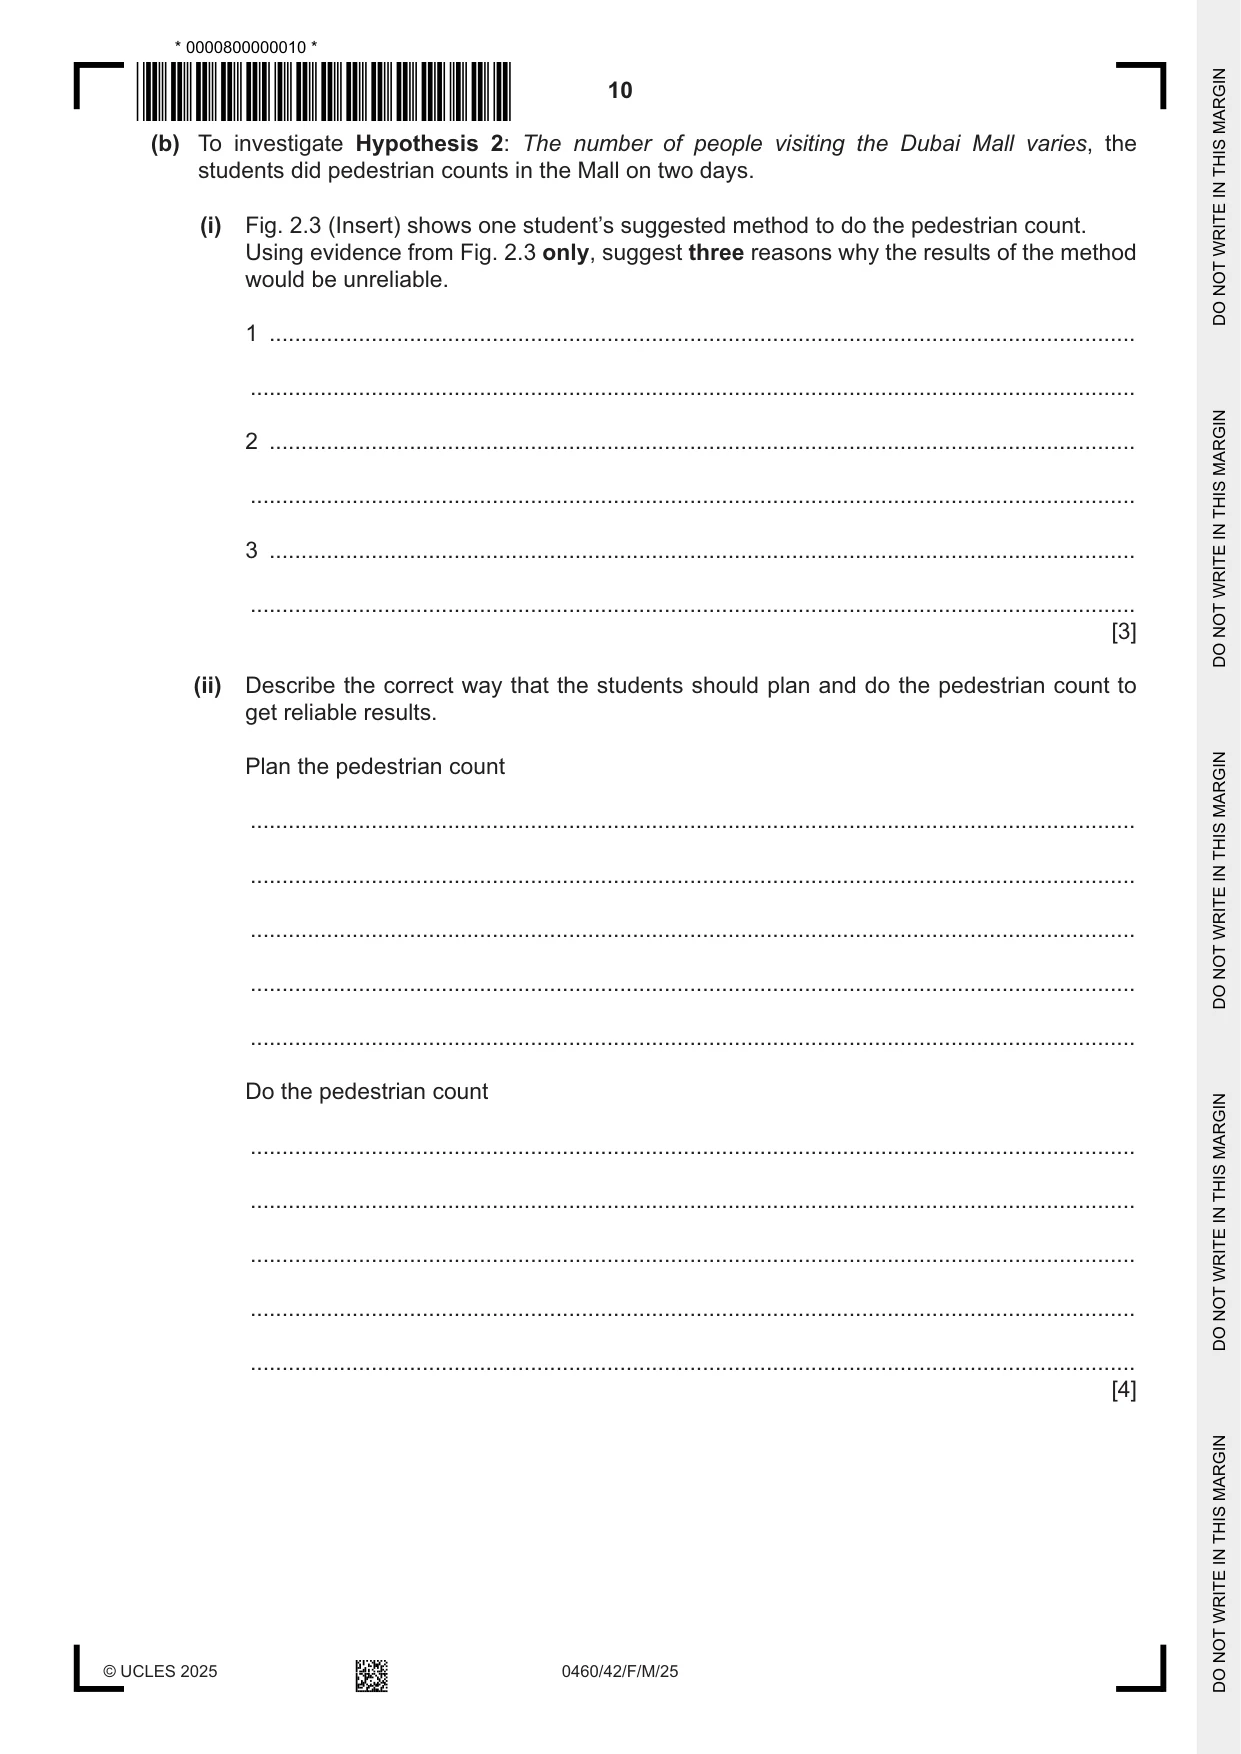
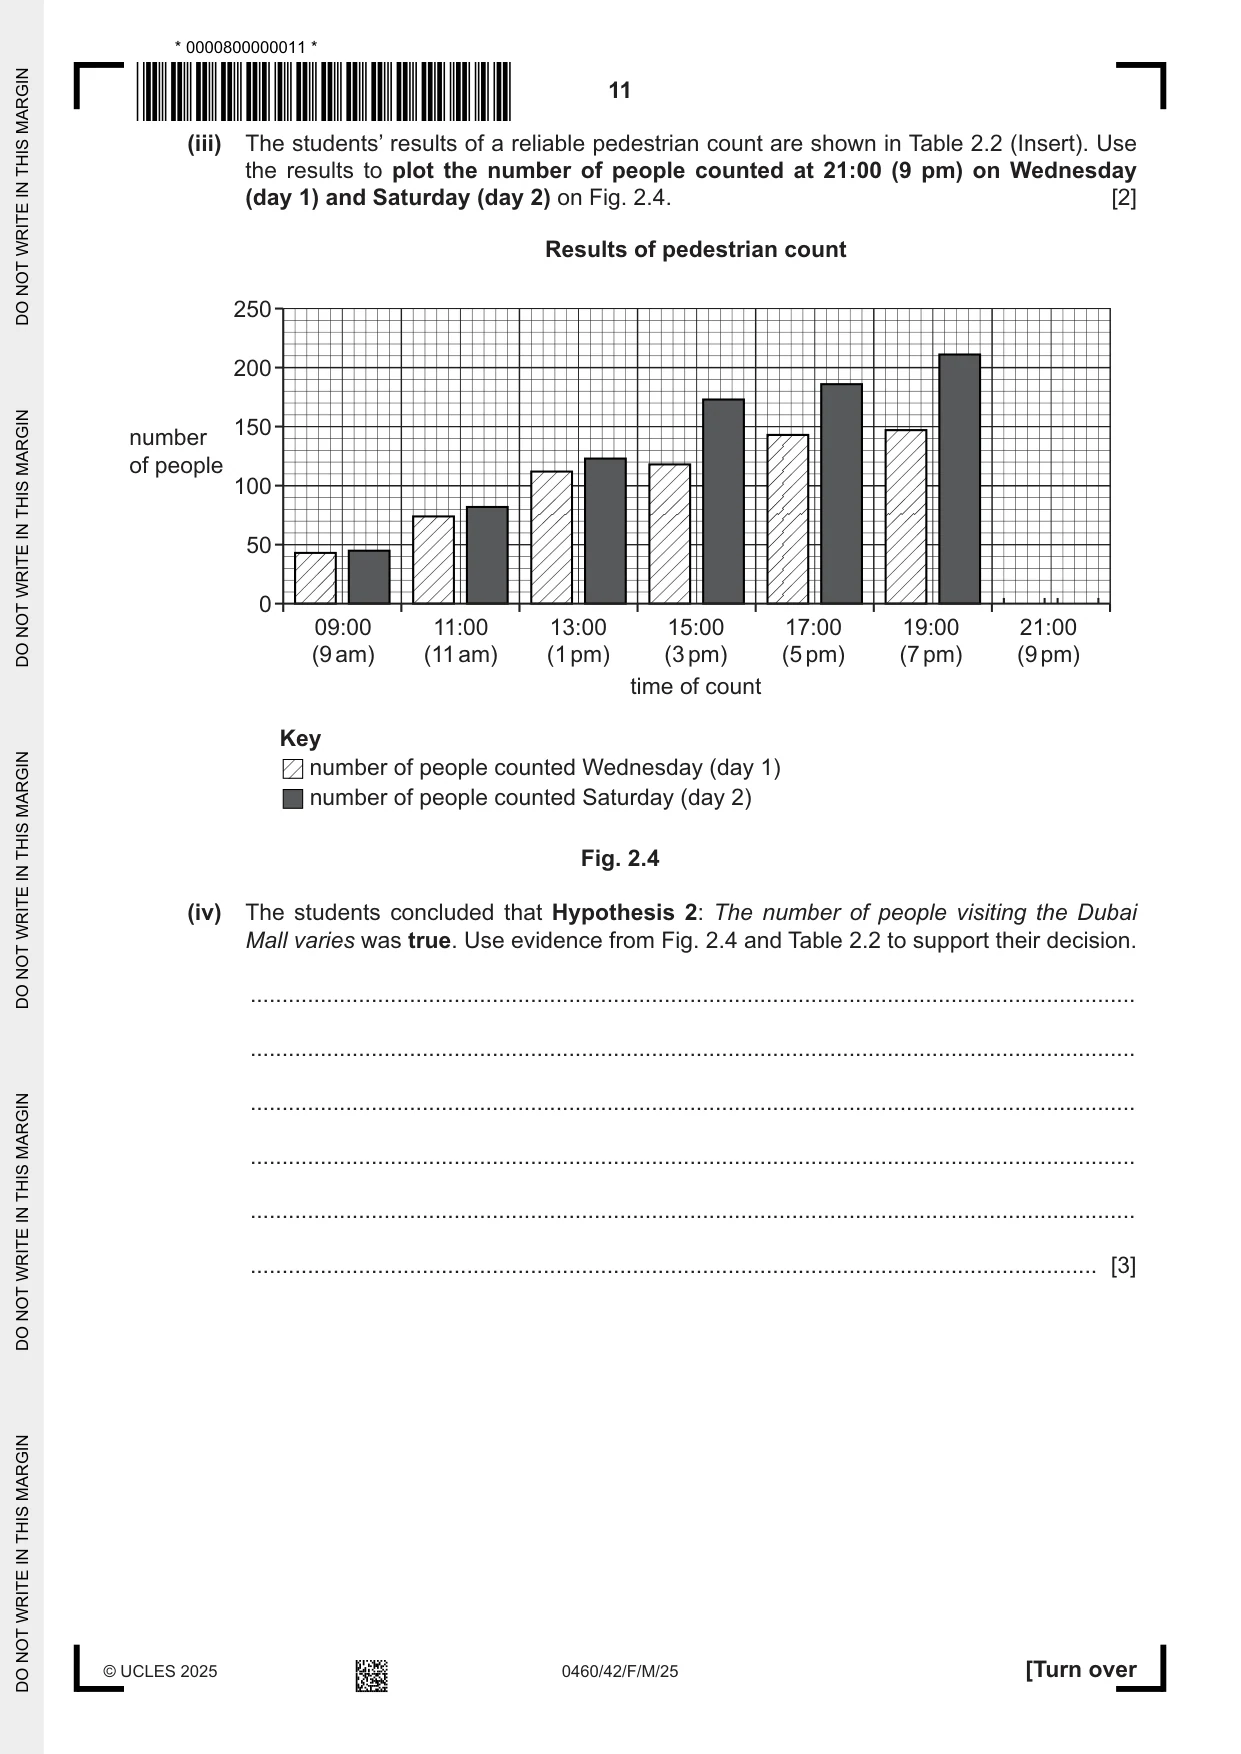
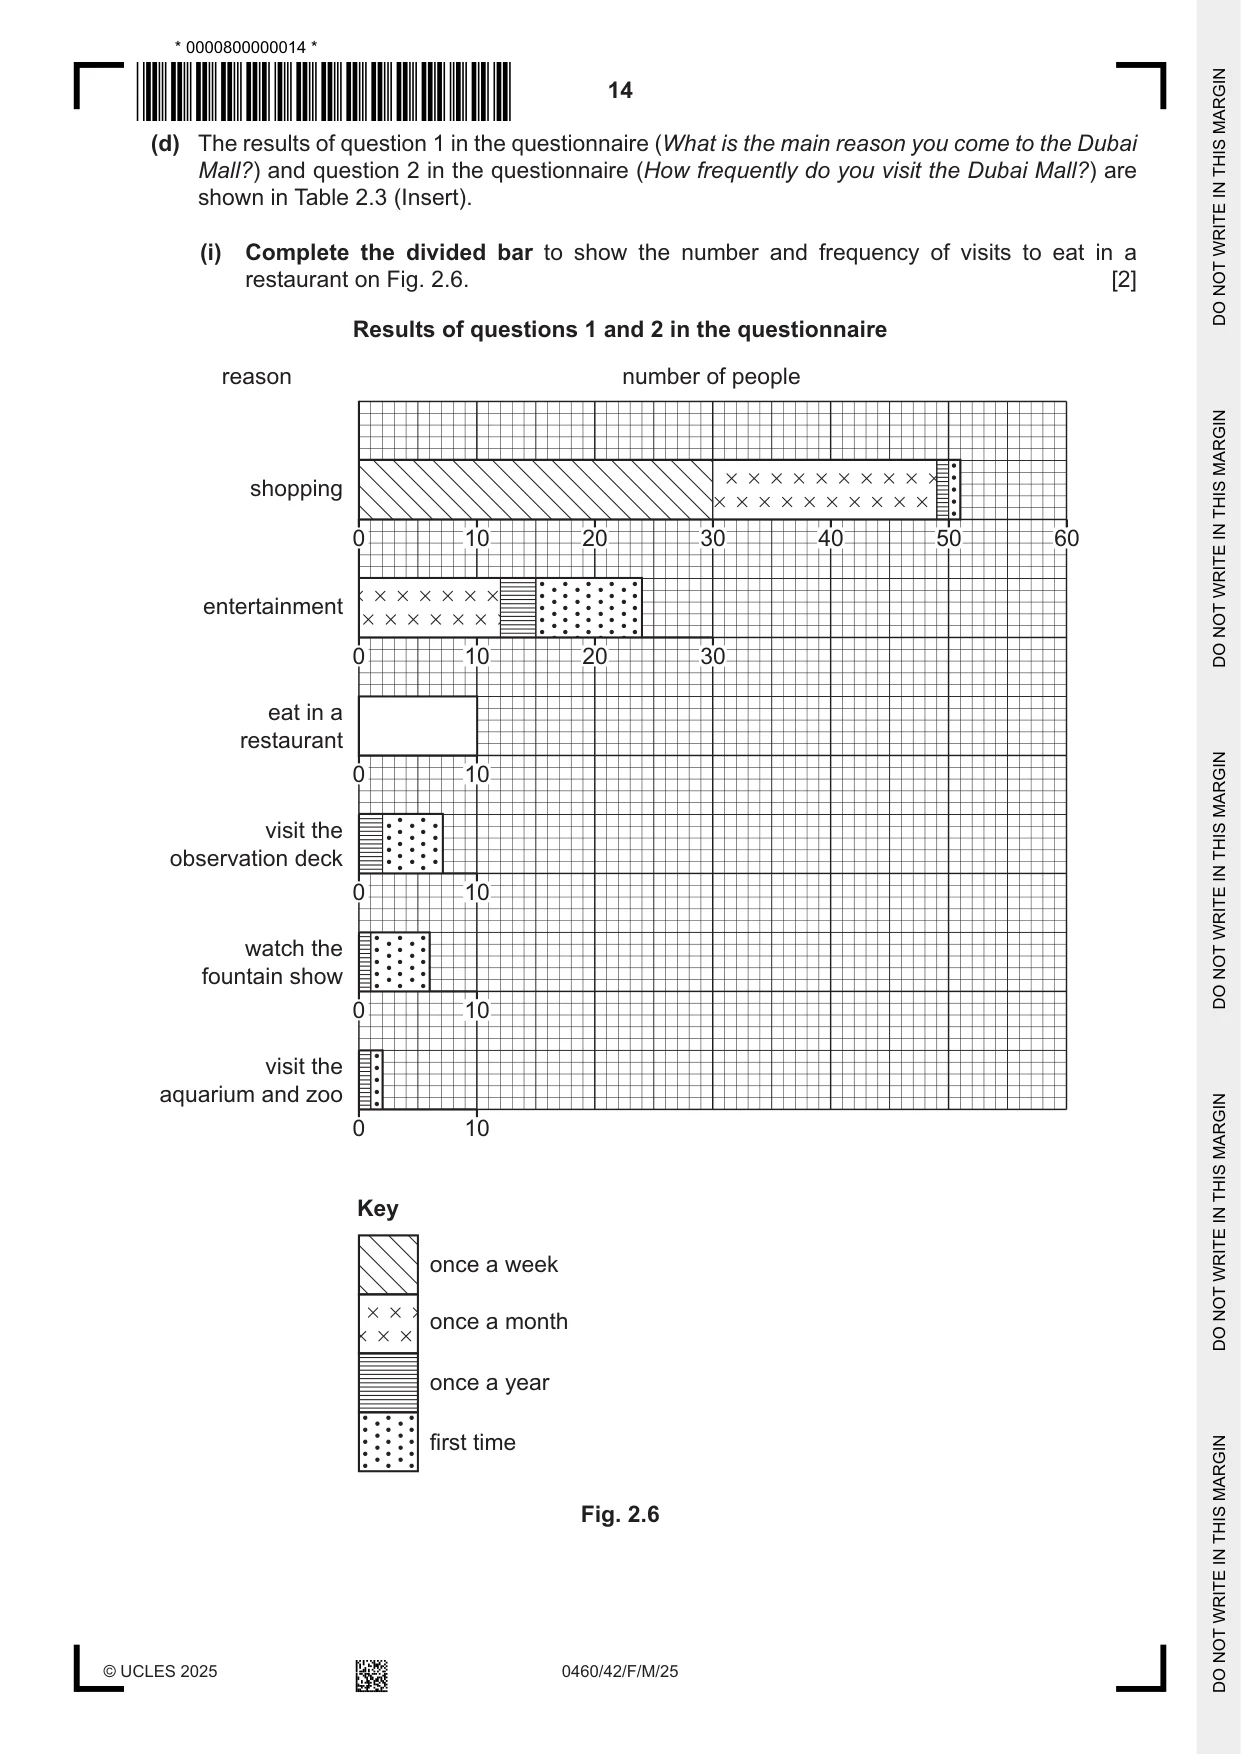
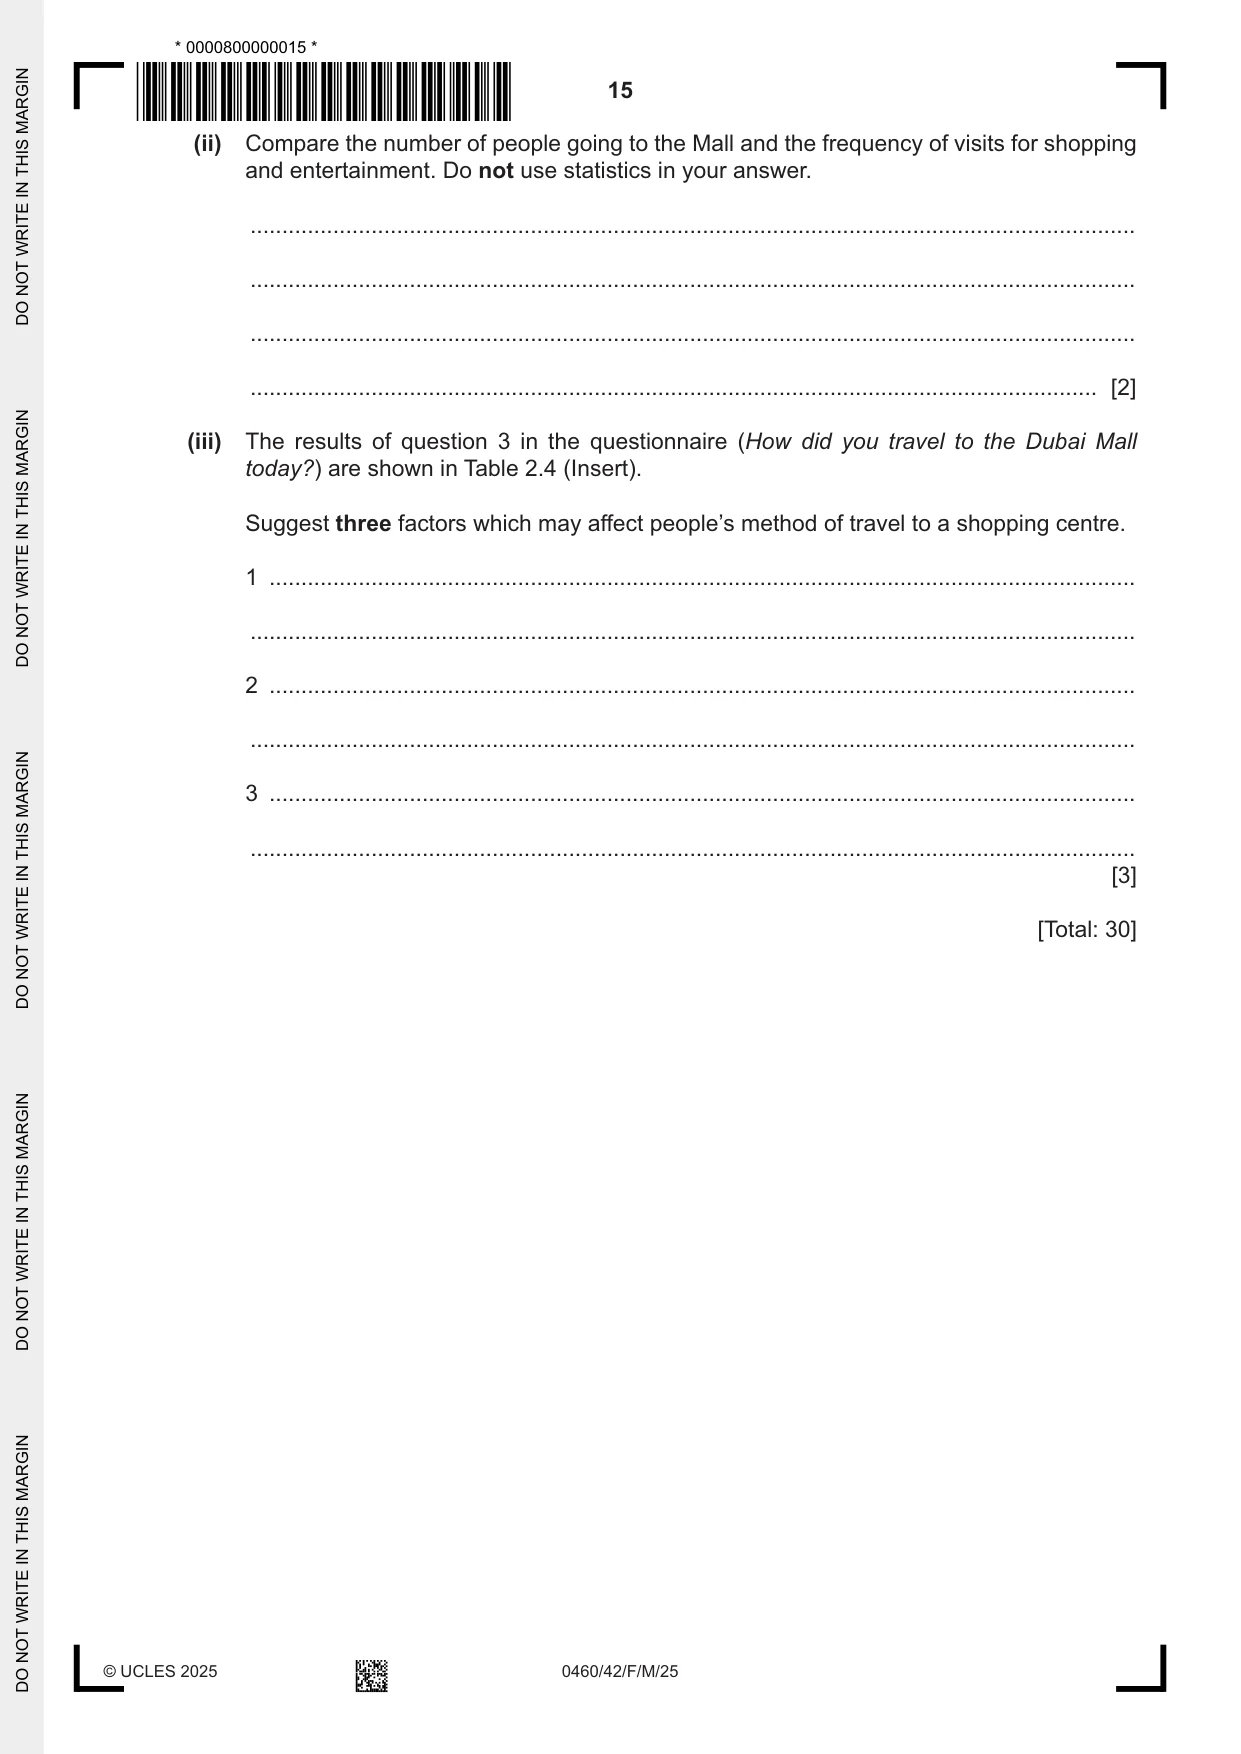
2 Students in Dubai, in the United Arab Emirates, did fieldwork in the Dubai Mall, a very large shopping area. Some students decided to test the following hypotheses: Hypothesis 1: Most of the shops in the Dubai Mall sell high-order or specialist goods. Hypothesis 2: The number of people visiting the Dubai Mall varies. (a) To investigate Hypothesis 1, the students used the fieldwork method shown in Fig. 2.1. Extract from a student’s fieldwork notes about the method Method My group got a map which showed the different shops and services in the Dubai Mall. We walked round the Mall and checked that the shops were still the same as on the map. We then classified the shops and services into five different types. type classification A shops which sell high-order or specialist goods B shops which sell low-order or everyday goods C shops which sell clothes and shoes D shops which provide services E shops which are restaurants and other places to eat Fig. 2.1 (i) In which type (A to E) would the students have included • a hairdressers and beauty salon? type .......... • a jewellers? type .......... [2] (ii) Which one of the following best describes the shops in type A? Circle your answer. business comparison convenience department public [1] (iii) The results of the students’ classification are shown in Table 2.1 (Insert). Use these results to complete the pie graph in Fig. 2.2. [2] Results of students’ classification % 0 90 10 Key type A – shops which sell high-order or specialist goods 80 20 type B – shops which sell low-order or everyday goods type C – shops which sell clothes and shoes type D – shops which provide services70 30 type E – shops which are restaurants and other places to eat 60 40 50 Fig. 2.2 (iv) What conclusion would the students make about Hypothesis 1: Most of the shops in the Dubai Mall sell high-order or specialist goods? Support your decision with data from Fig. 2.2 and Table 2.1. ........................................................................................................................................... ........................................................................................................................................... ........................................................................................................................................... ........................................................................................................................................... ........................................................................................................................................... ..................................................................................................................................... [3] (b) To investigate Hypothesis 2: The number of people visiting the Dubai Mall varies, the students did pedestrian counts in the Mall on two days. (i) Fig. 2.3 (Insert) shows one student’s suggested method to do the pedestrian count. Using evidence from Fig. 2.3 only, suggest three reasons why the results of the method would be unreliable. 1 ........................................................................................................................................ ........................................................................................................................................... 2 ........................................................................................................................................ ........................................................................................................................................... 3 ........................................................................................................................................ ........................................................................................................................................... [3] (ii) Describe the correct way that the students should plan and do the pedestrian count to get reliable results. Plan the pedestrian count ........................................................................................................................................... ........................................................................................................................................... ........................................................................................................................................... ........................................................................................................................................... ........................................................................................................................................... Do the pedestrian count ........................................................................................................................................... ........................................................................................................................................... ........................................................................................................................................... ........................................................................................................................................... ........................................................................................................................................... [4]
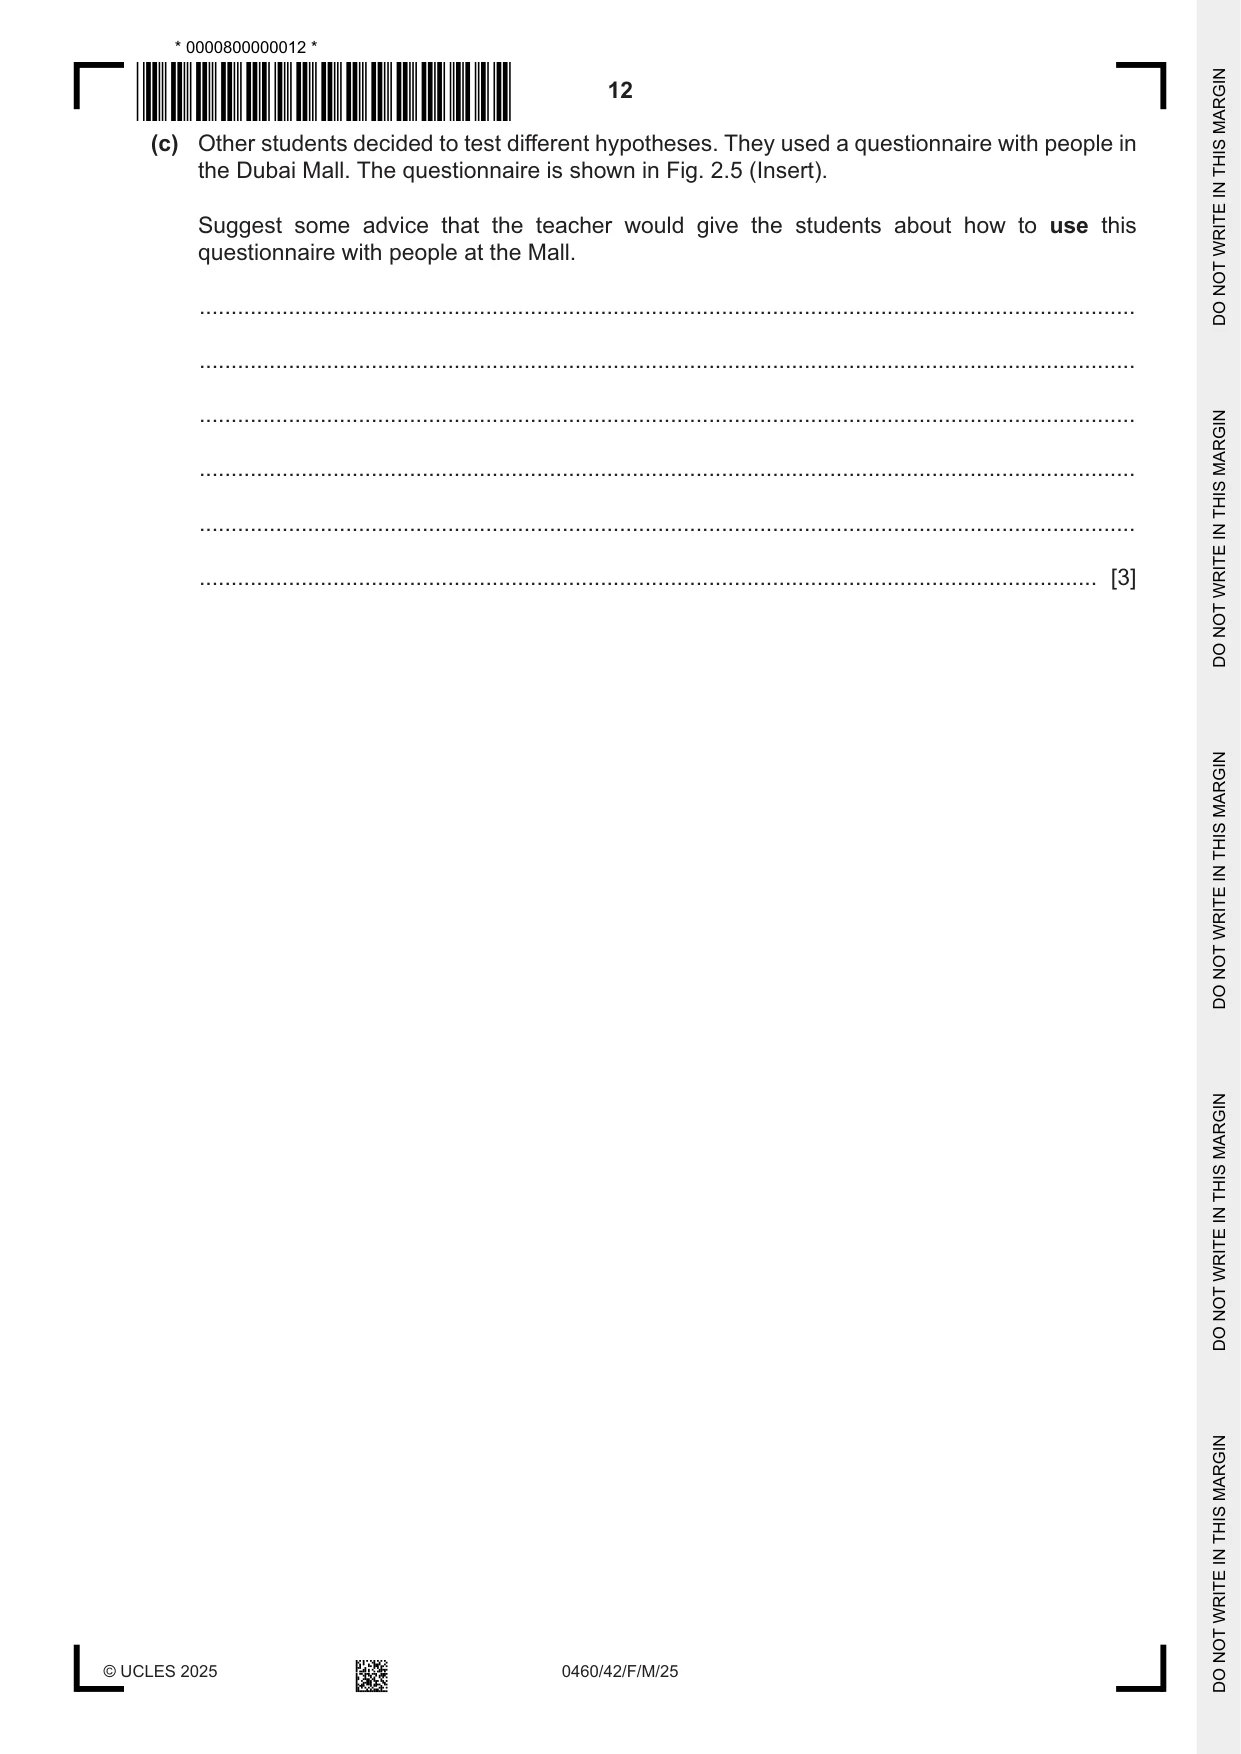
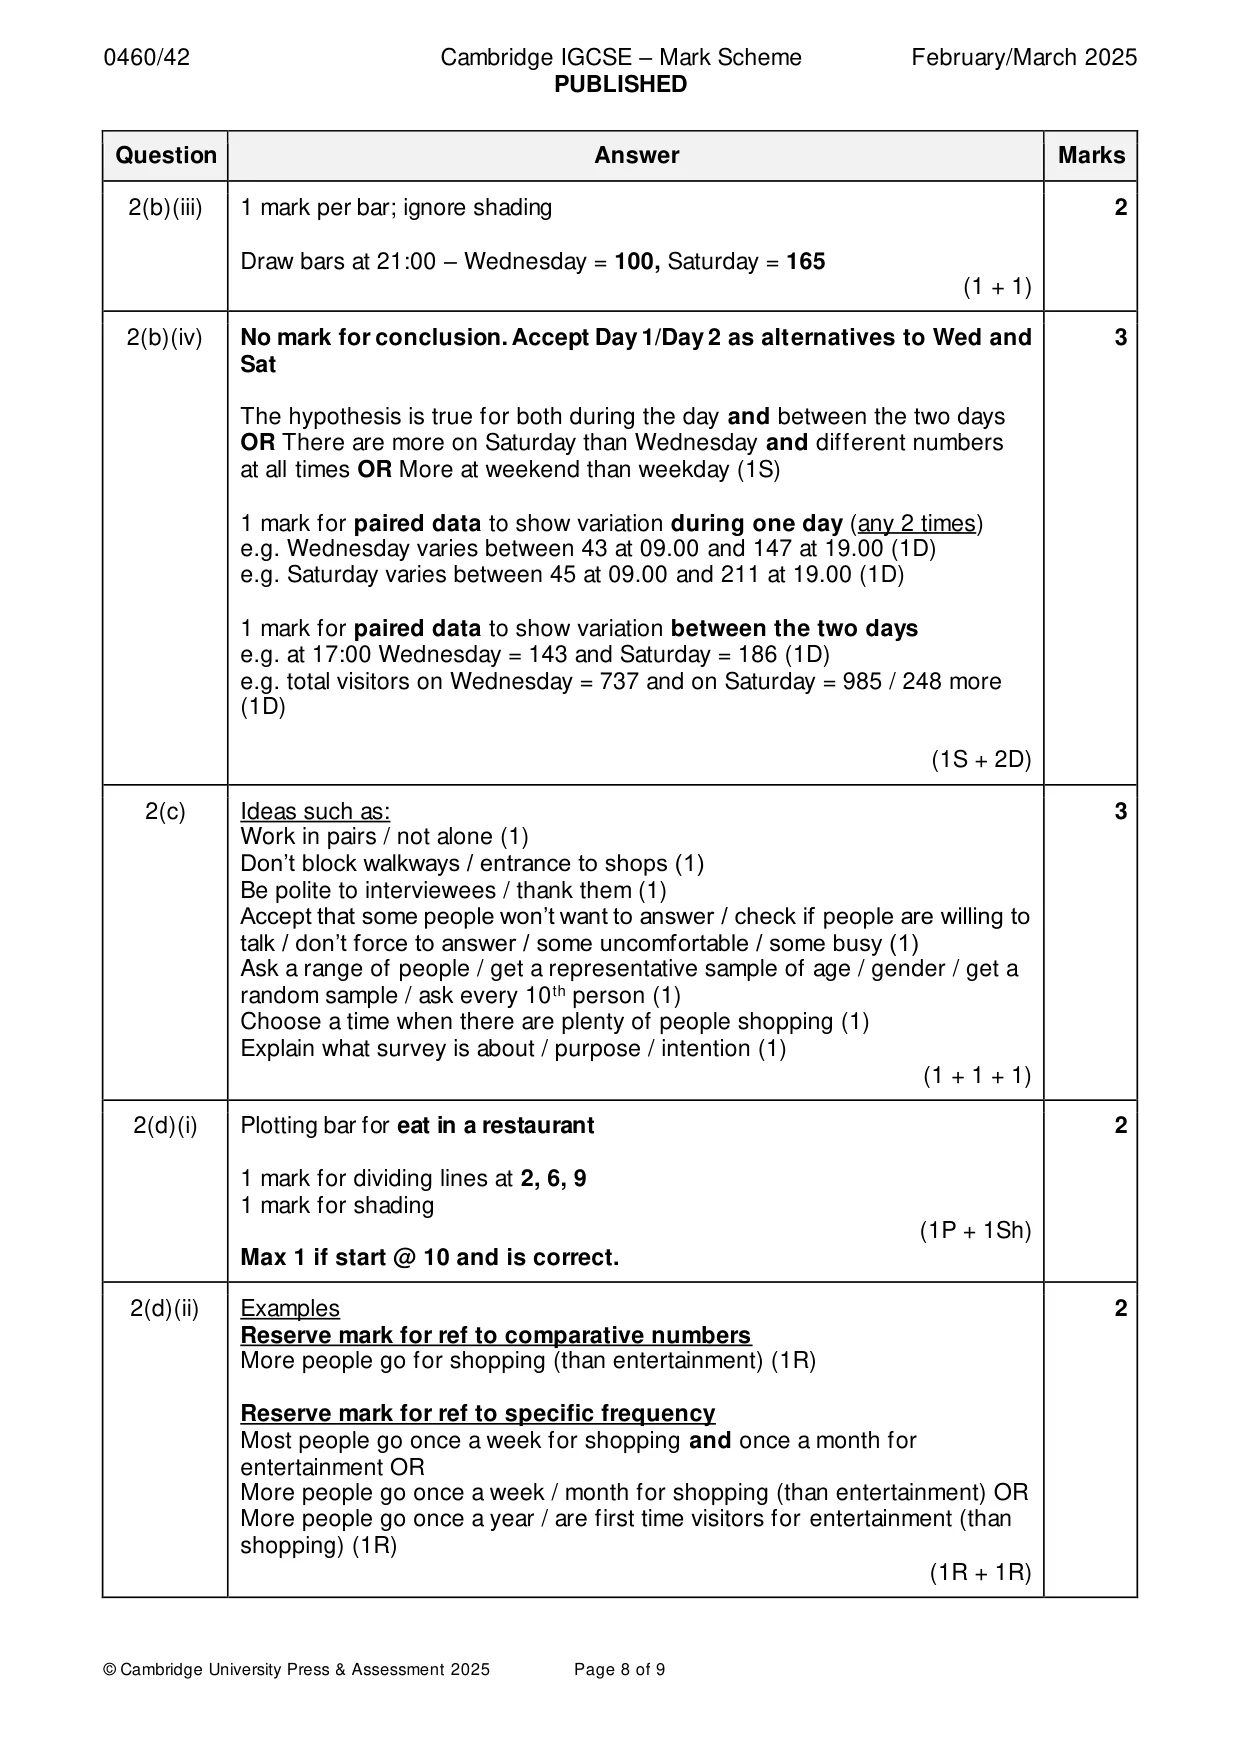
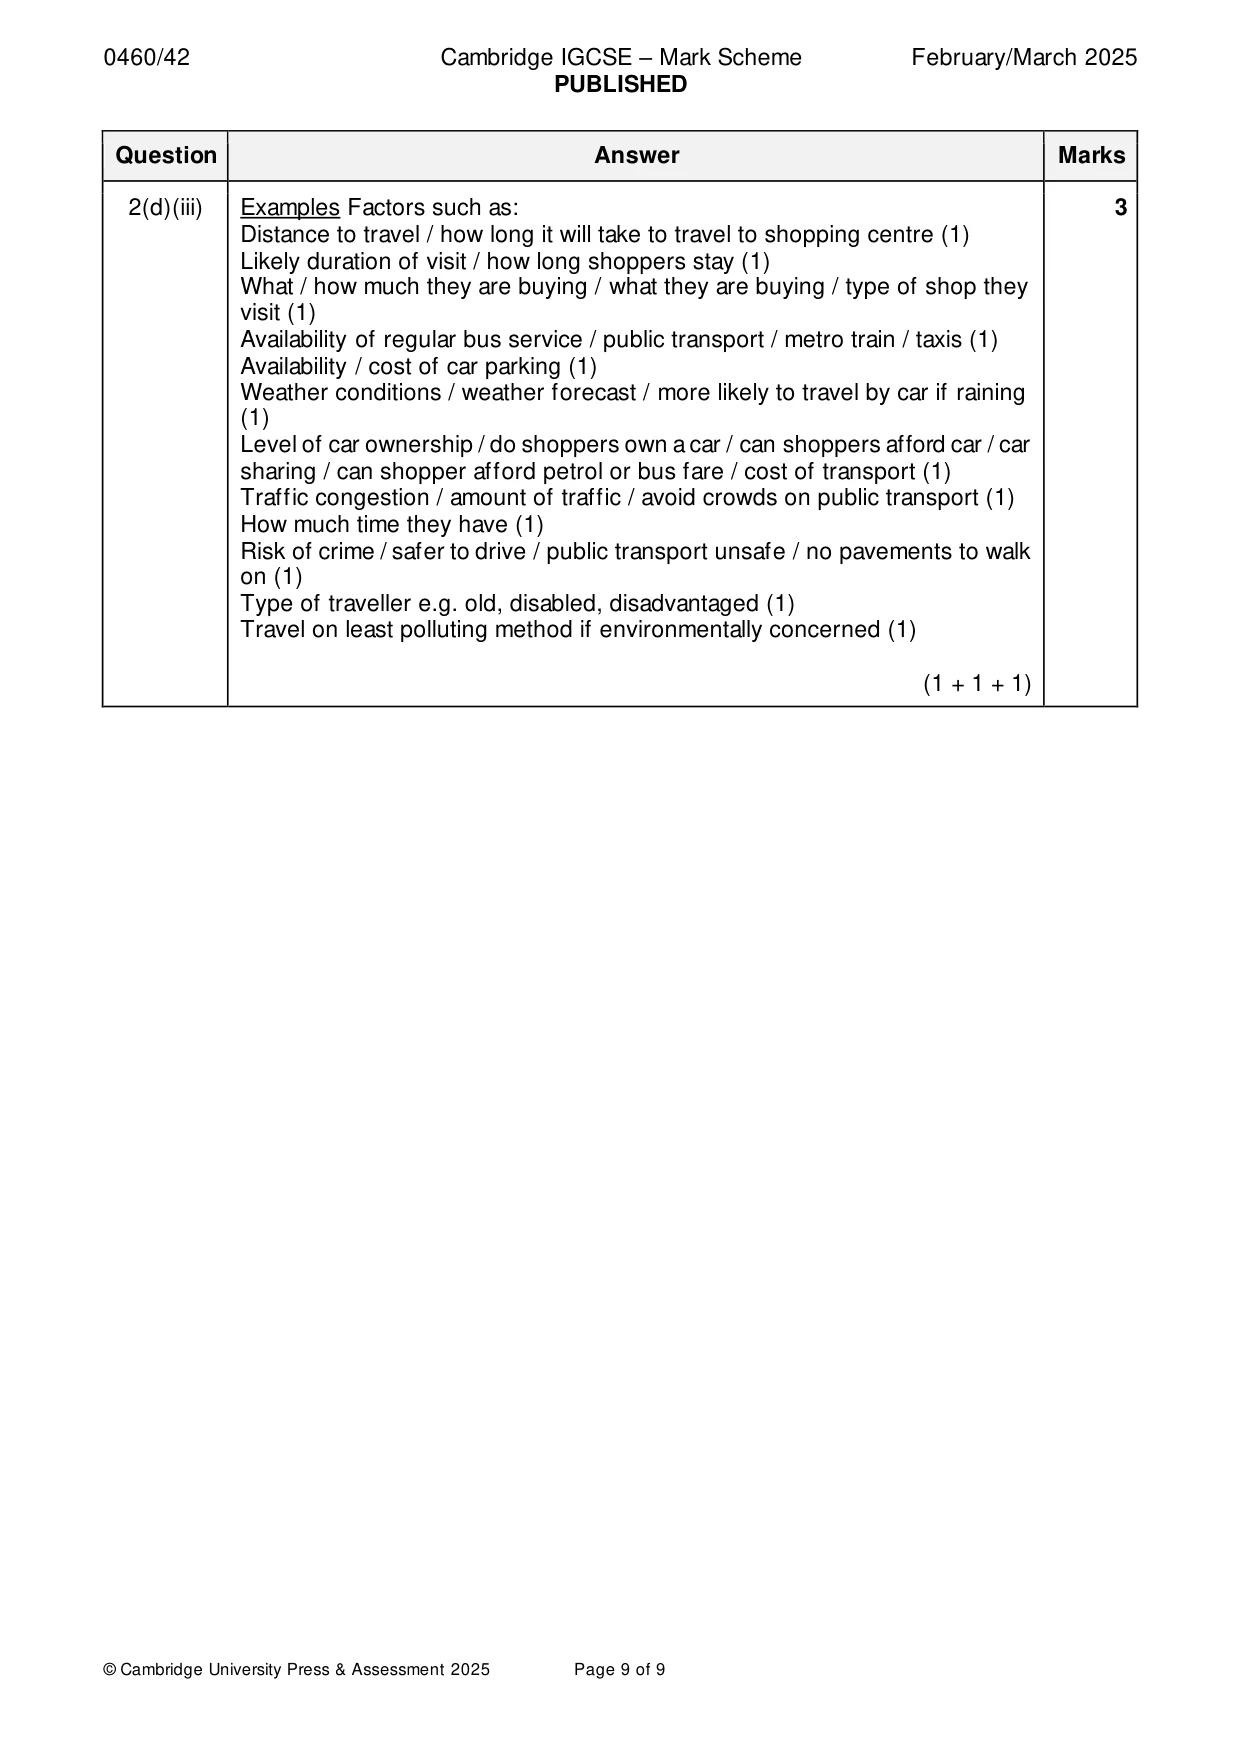
Mark scheme: 2(a)(i) A hairdressers and beauty salon D 2 A jewellers A (1 + 1) 2(a)(ii) Comparison 1 2(a)(iii) Complete pie graph 2 Shops which provide services = 3% and shops which are restaurants = 17% 1 mark for dividing line at 83% (61° left from top: tolerance 59°–63°) 1 mark for shading in order of key (1P + 1Sh) 2(a)(iv) Hypothesis is false – 1 mark reserve (✓HA) Note: Most = >50% 3 Statement: Less than the majority / 50% / 40% / half / sell high order or specialist Goods / Type A (1S) OR More than half / 50% / 60% / the majority do NOT sell high order or specialist goods / Type C (1S) Data: e.g. 38% OR 449 shops sell specialist goods / type A (1D) e.g. 62% OR 724 do NOT sell specialised goods / type C (1D) Hypothesis is true / partially true = 0 (XHA) If HA decision incorrect credit relevant evidence that supports right answer. (1HA + 1S + 1D) 2(b)(i) Examples Avoid double counting ‘more chance of errors’. 3 (Do pedestrian count by himself) – no-one checked figures / safety issues / more chance of error / needs >1 recording data (1) (Stand at exit from car park ) – only count people who arrived in cars / miss people coming by bus/train/walking to mall / may not travel by car (1) (Count ‘in your head’ ) – easy to lose count / easy to lose concentration / count inaccurately / more chance of error (1) (Do the two counts on Wed and Sat) – different days / different times / weekday and weekend / should do counts on same day / same time / not morning and afternoon (1) (1 + 1 + 1) 2(b)(ii) Avoid double credit e.g. tally 4 Plan pedestrian count: Decide on start time and end time / when to do the counts (1) Do the counts at the same time on both days / repeat on both days (1) Decide how many times in a day / e.g. do it 4 times in a day (1) Decide on time period / length of counts to be the same / how long to count / e.g. do them for 1 hour (1) Decide who will count / division of work / number of students per group e.g. do it in pairs or group (1) Decide where to count / agree to stand at all exits (1) Decide how to count e.g. tally / clicker / recording sheet (1) Do pedestrian count: Apply tally method / ‘clicker’ / counter / note on recording sheet (1) Use watch / stopwatch / timer to time the counting period (1) Jobs of student in each group e.g. two students do each count / count people going in different directions (1) (1 + 1 + 1 + 1) 2(b)(iii) 1 mark per bar; ignore shading 2 Draw bars at 21:00 – Wednesday = 100, Saturday = 165 (1 + 1) 2(b)(iv) No mark for conclusion. Accept Day 1/Day 2 as alternatives to Wed and 3 Sat The hypothesis is true for both during the day and between the two days OR There are more on Saturday than Wednesday and different numbers at all times OR More at weekend than weekday (1S) 1 mark for paired data to show variation during one day (any 2 times) e.g. Wednesday varies between 43 at 09.00 and 147 at 19.00 (1D) e.g. Saturday varies between 45 at 09.00 and 211 at 19.00 (1D) 1 mark for paired data to show variation between the two days e.g. at 17:00 Wednesday = 143 and Saturday = 186 (1D) e.g. total visitors on Wednesday = 737 and on Saturday = 985 / 248 more (1D) (1S + 2D) 2(c) Ideas such as: 3 Work in pairs / not alone (1) Don’t block walkways / entrance to shops (1) Be polite to interviewees / thank them (1) Accept that some people won’t want to answer / check if people are willing to talk / don’t force to answer / some uncomfortable / some busy (1) Ask a range of people / get a representative sample of age / gender / get a random sample / ask every 10th person (1) Choose a time when there are plenty of people shopping (1) Explain what survey is about / purpose / intention (1) (1 + 1 + 1) 2(d)(i) Plotting bar for eat in a restaurant 2 1 mark for dividing lines at 2, 6, 9 1 mark for shading (1P + 1Sh) Max 1 if start @ 10 and is correct. 2(d)(ii) Examples 2 Reserve mark for ref to comparative numbers More people go for shopping (than entertainment) (1R) Reserve mark for ref to specific frequency Most people go once a week for shopping and once a month for entertainment OR More people go once a week / month for shopping (than entertainment) OR More people go once a year / are first time visitors for entertainment (than shopping) (1R) (1R + 1R) 2(d)(iii) Examples Factors such as: 3 Distance to travel / how long it will take to travel to shopping centre (1) Likely duration of visit / how long shoppers stay (1) What / how much they are buying / what they are buying / type of shop they visit (1) Availability of regular bus service / public transport / metro train / taxis (1) Availability / cost of car parking (1) Weather conditions / weather forecast / more likely to travel by car if raining (1) Level of car ownership / do shoppers own a car / can shoppers afford car / car sharing / can shopper afford petrol or bus fare / cost of transport (1) Traffic congestion / amount of traffic / avoid crowds on public transport (1) How much time they have (1) Risk of crime / safer to drive / public transport unsafe / no pavements to walk on (1) Type of traveller e.g. old, disabled, disadvantaged (1) Travel on least polluting method if environmentally concerned (1) (1 + 1 + 1)
More questions on Settlements (rural and urban) and service provision
What was in this paper
The subtopics covered by these 2 questions, and how many questions each got. Open one in a new tab to see every Cambridge question on it.
What you needed in this session
Cambridge’s own grade thresholds for 2025 Feb/March, Paper 4 · Variant 2. A higher threshold means an easier paper — the bar moves with how the cohort did.