Cambridge IGCSE Geography 0460 — 2024 Feb/March Paper 4 · Variant 2
0460/42/F/M/24 · 2 questions · 60 marks · ≈68 min
The question paper and its mark scheme, free to read here and free to download. This is Cambridge’s own paper, exactly as it was sat.
Question paper20 pages












Mark scheme8 pages
Answers below. Sit the paper first if you are practising.





Questions as text
Q1 · Students did fieldwork on a local coastline
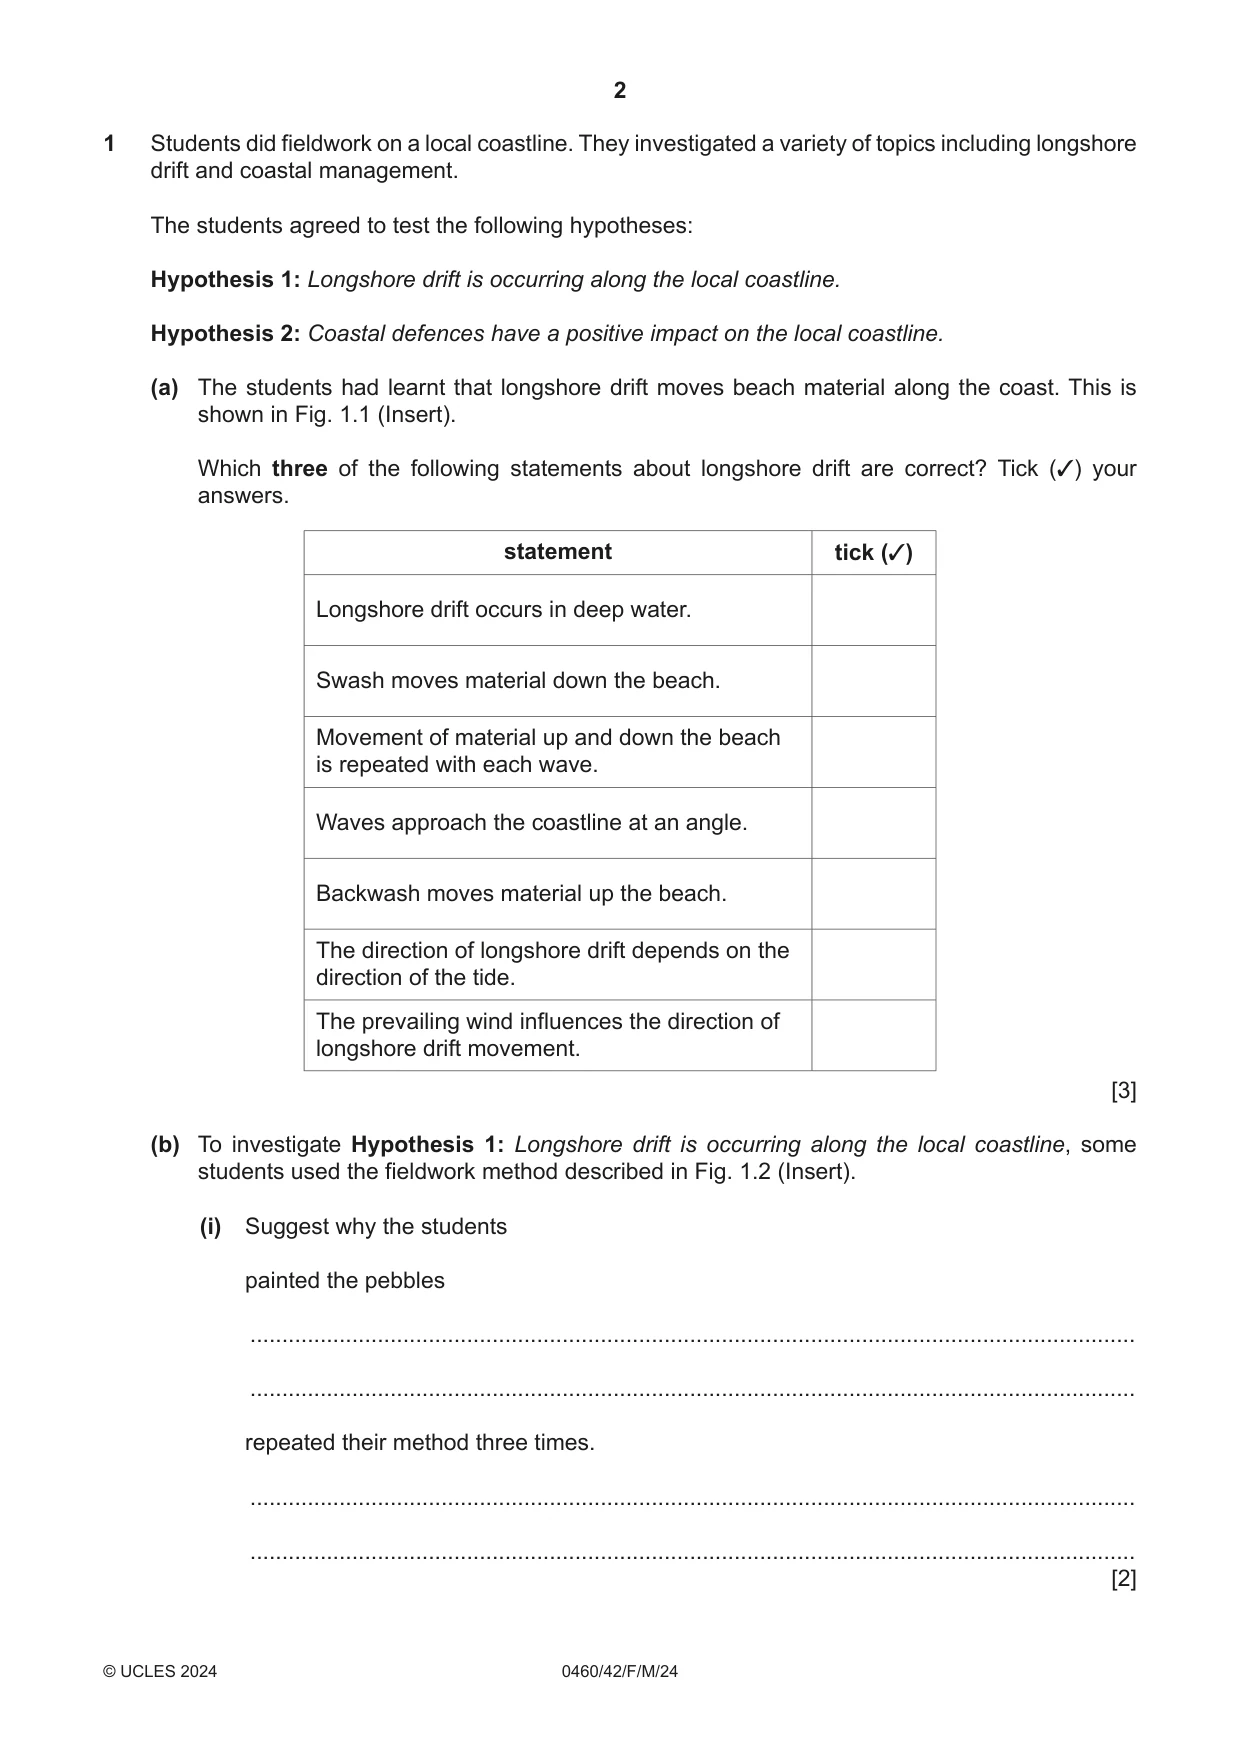
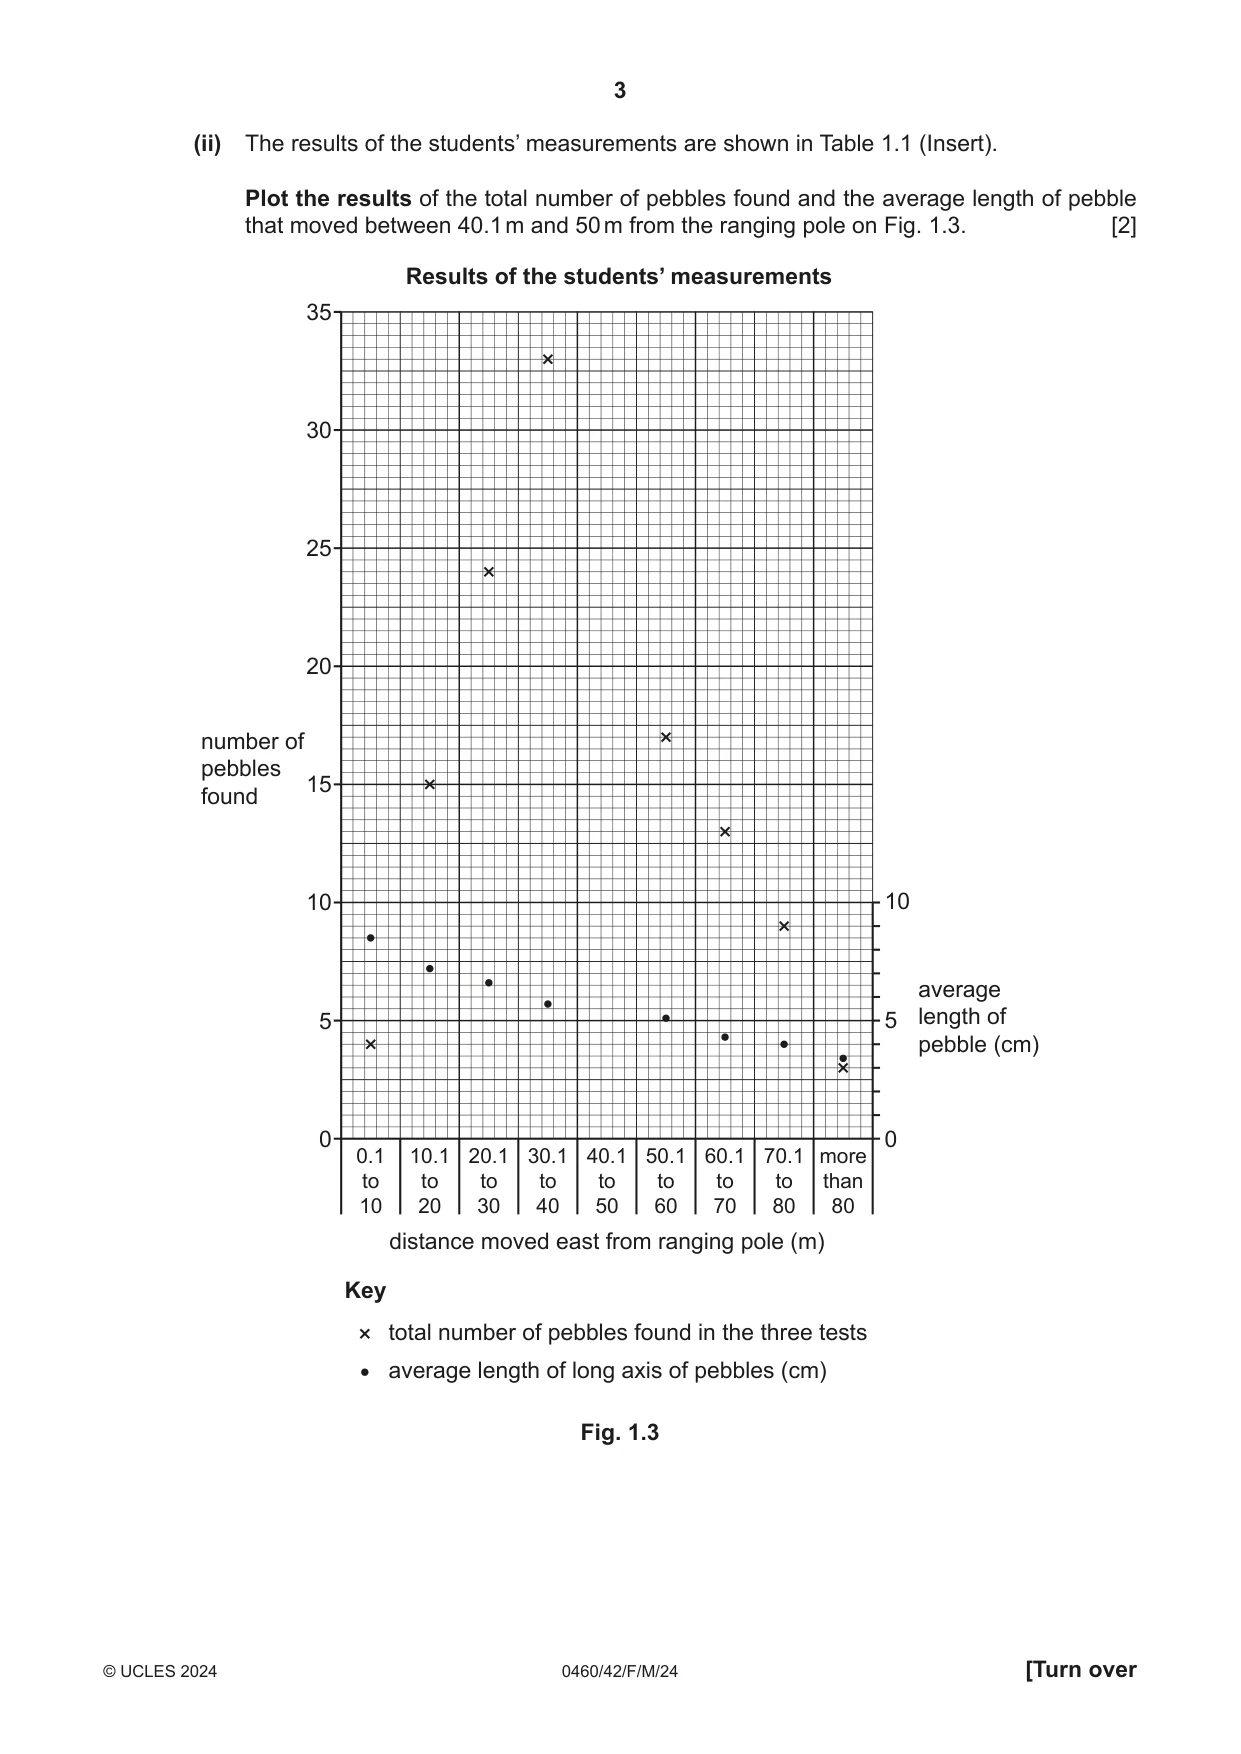
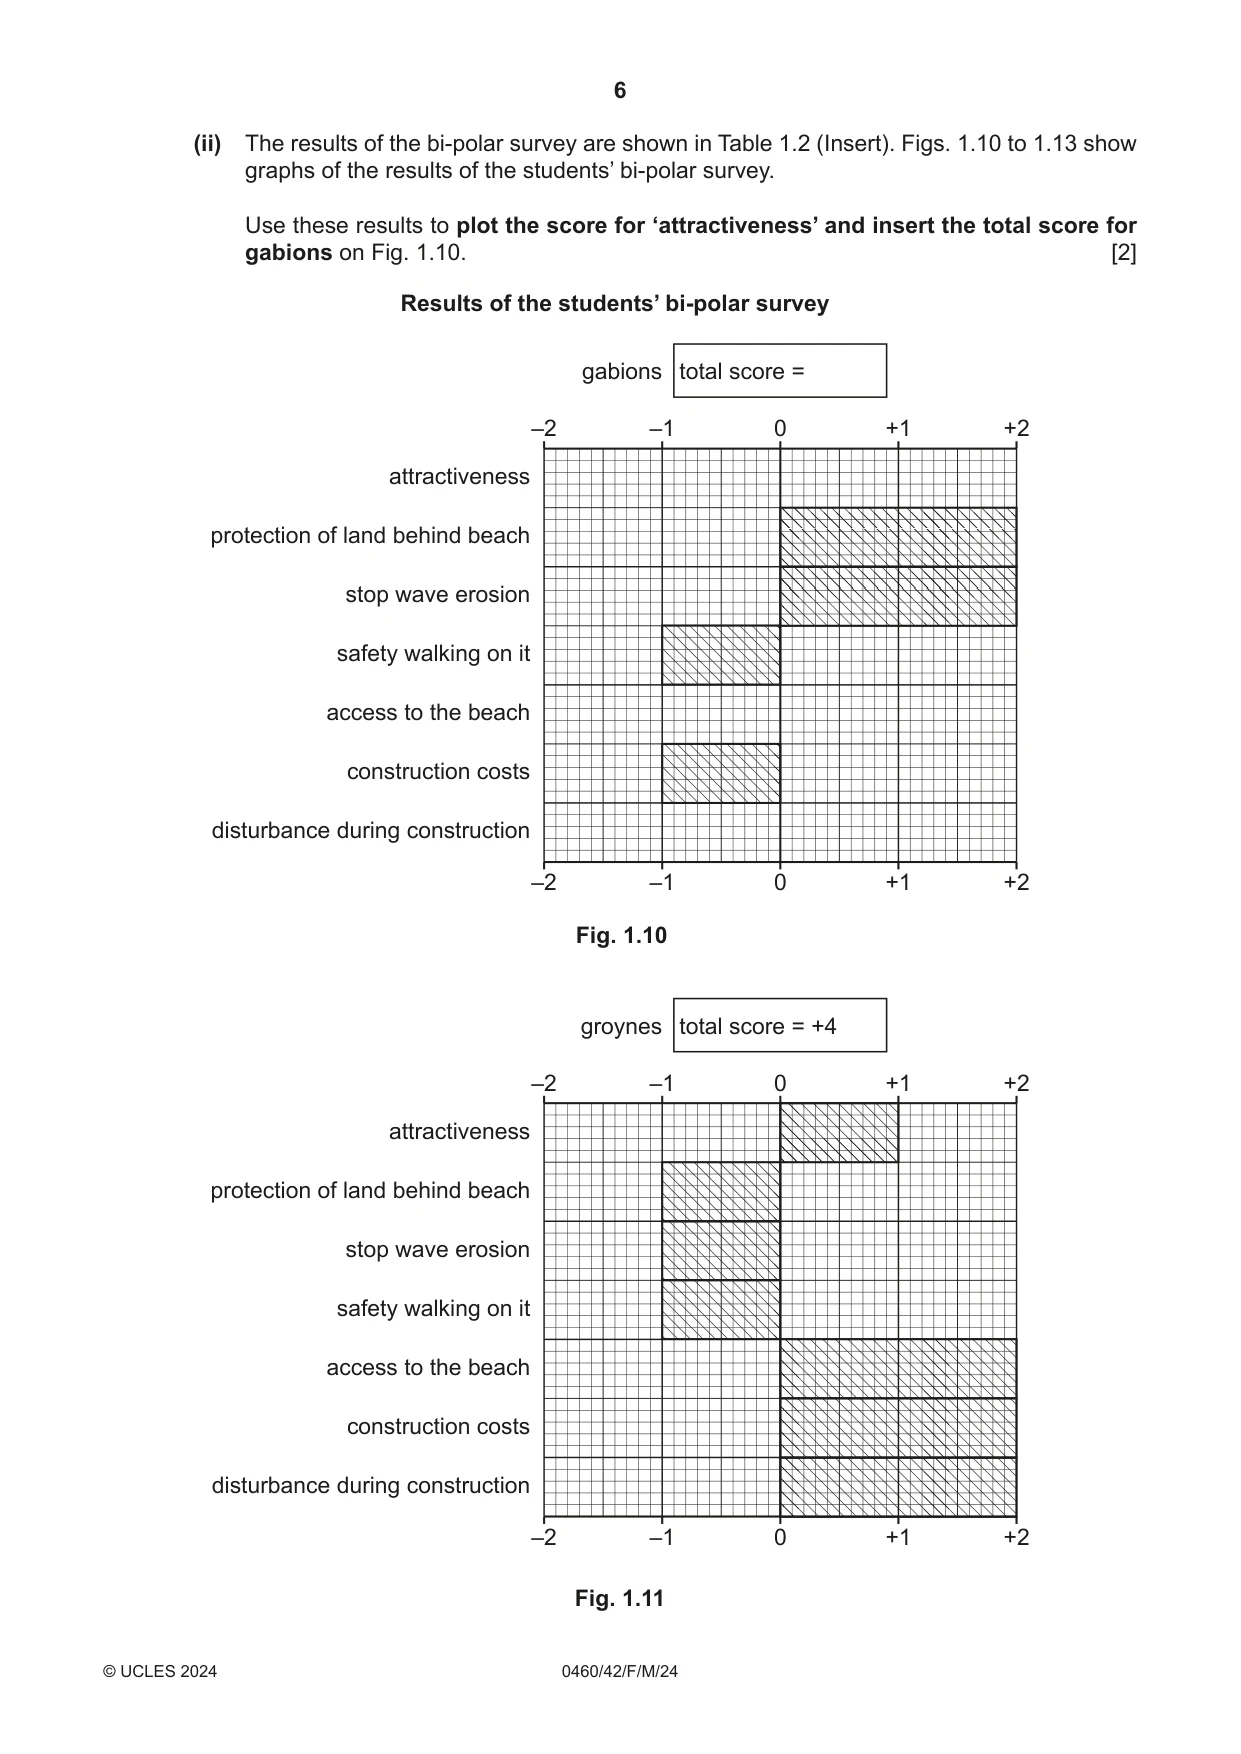
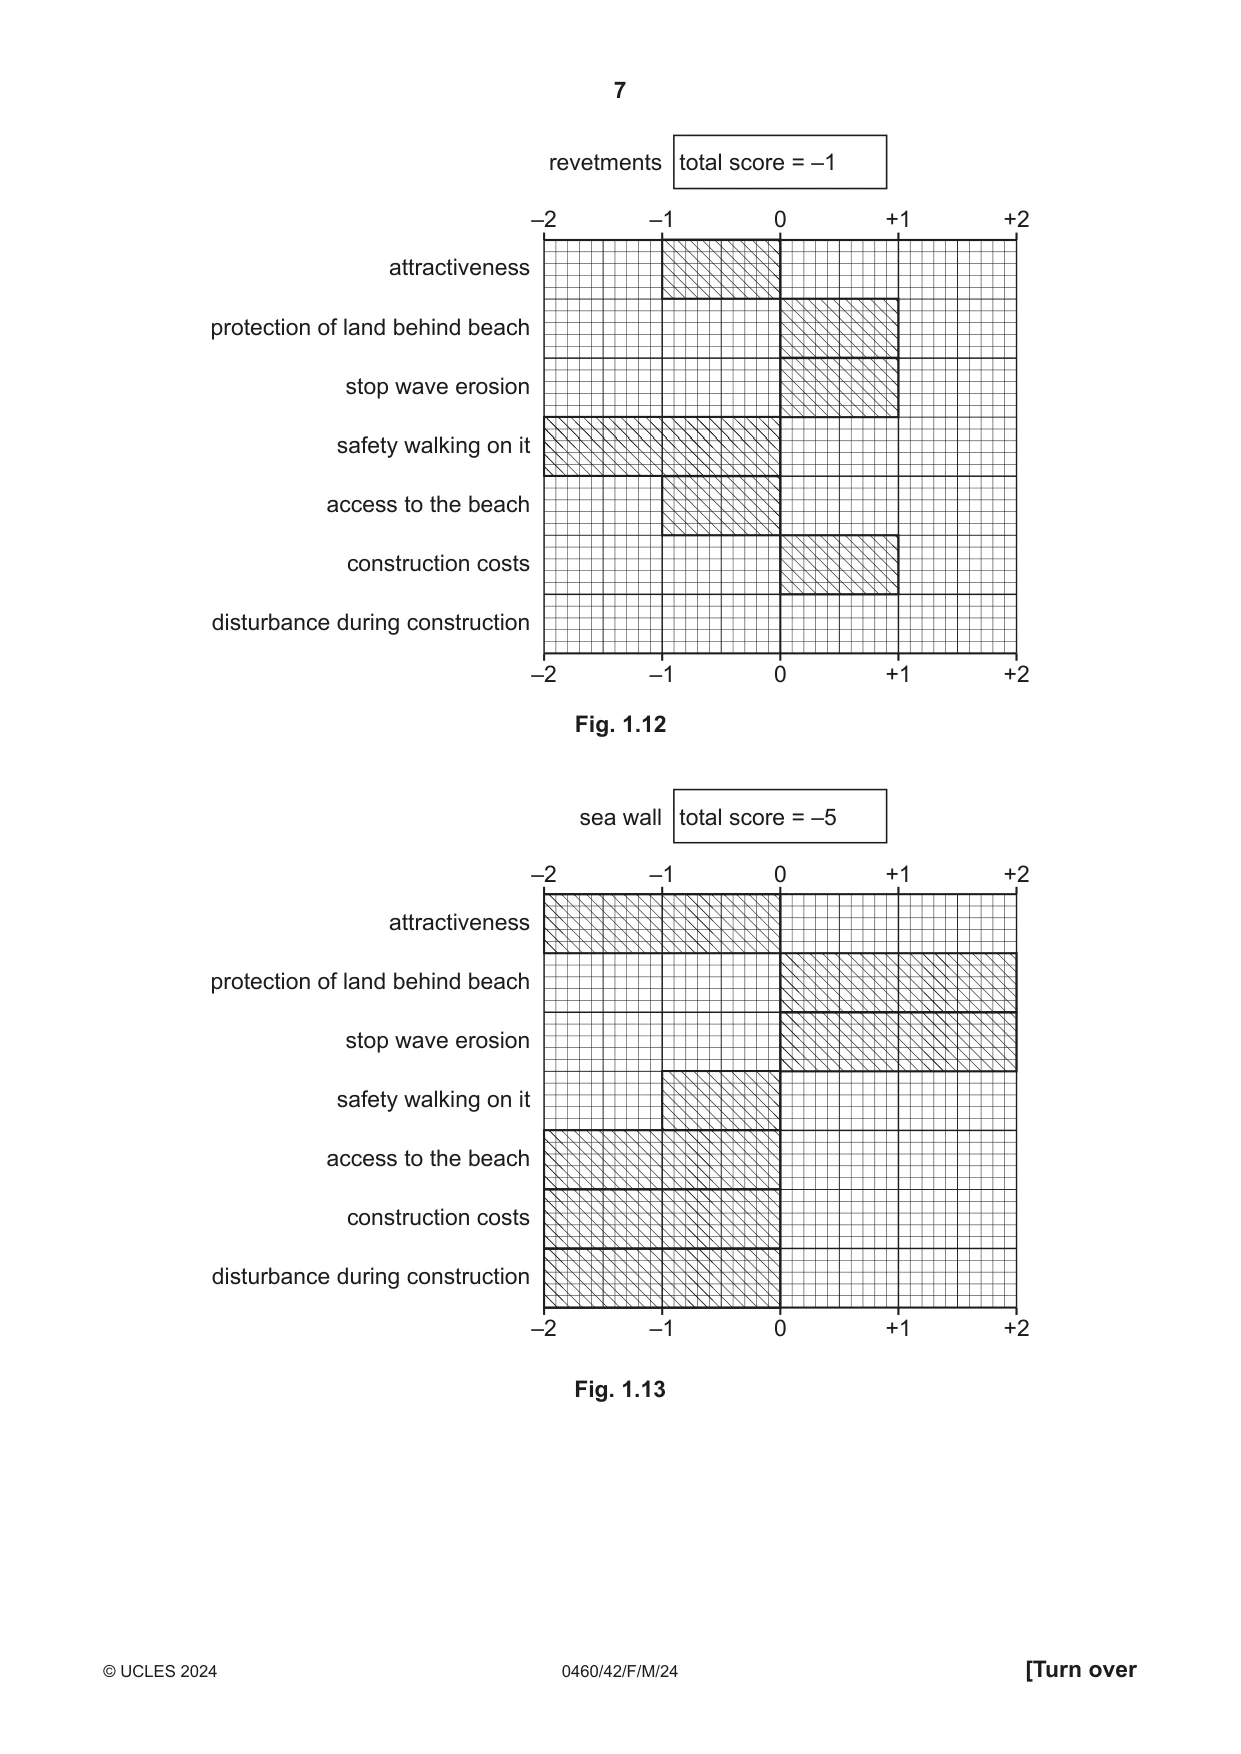
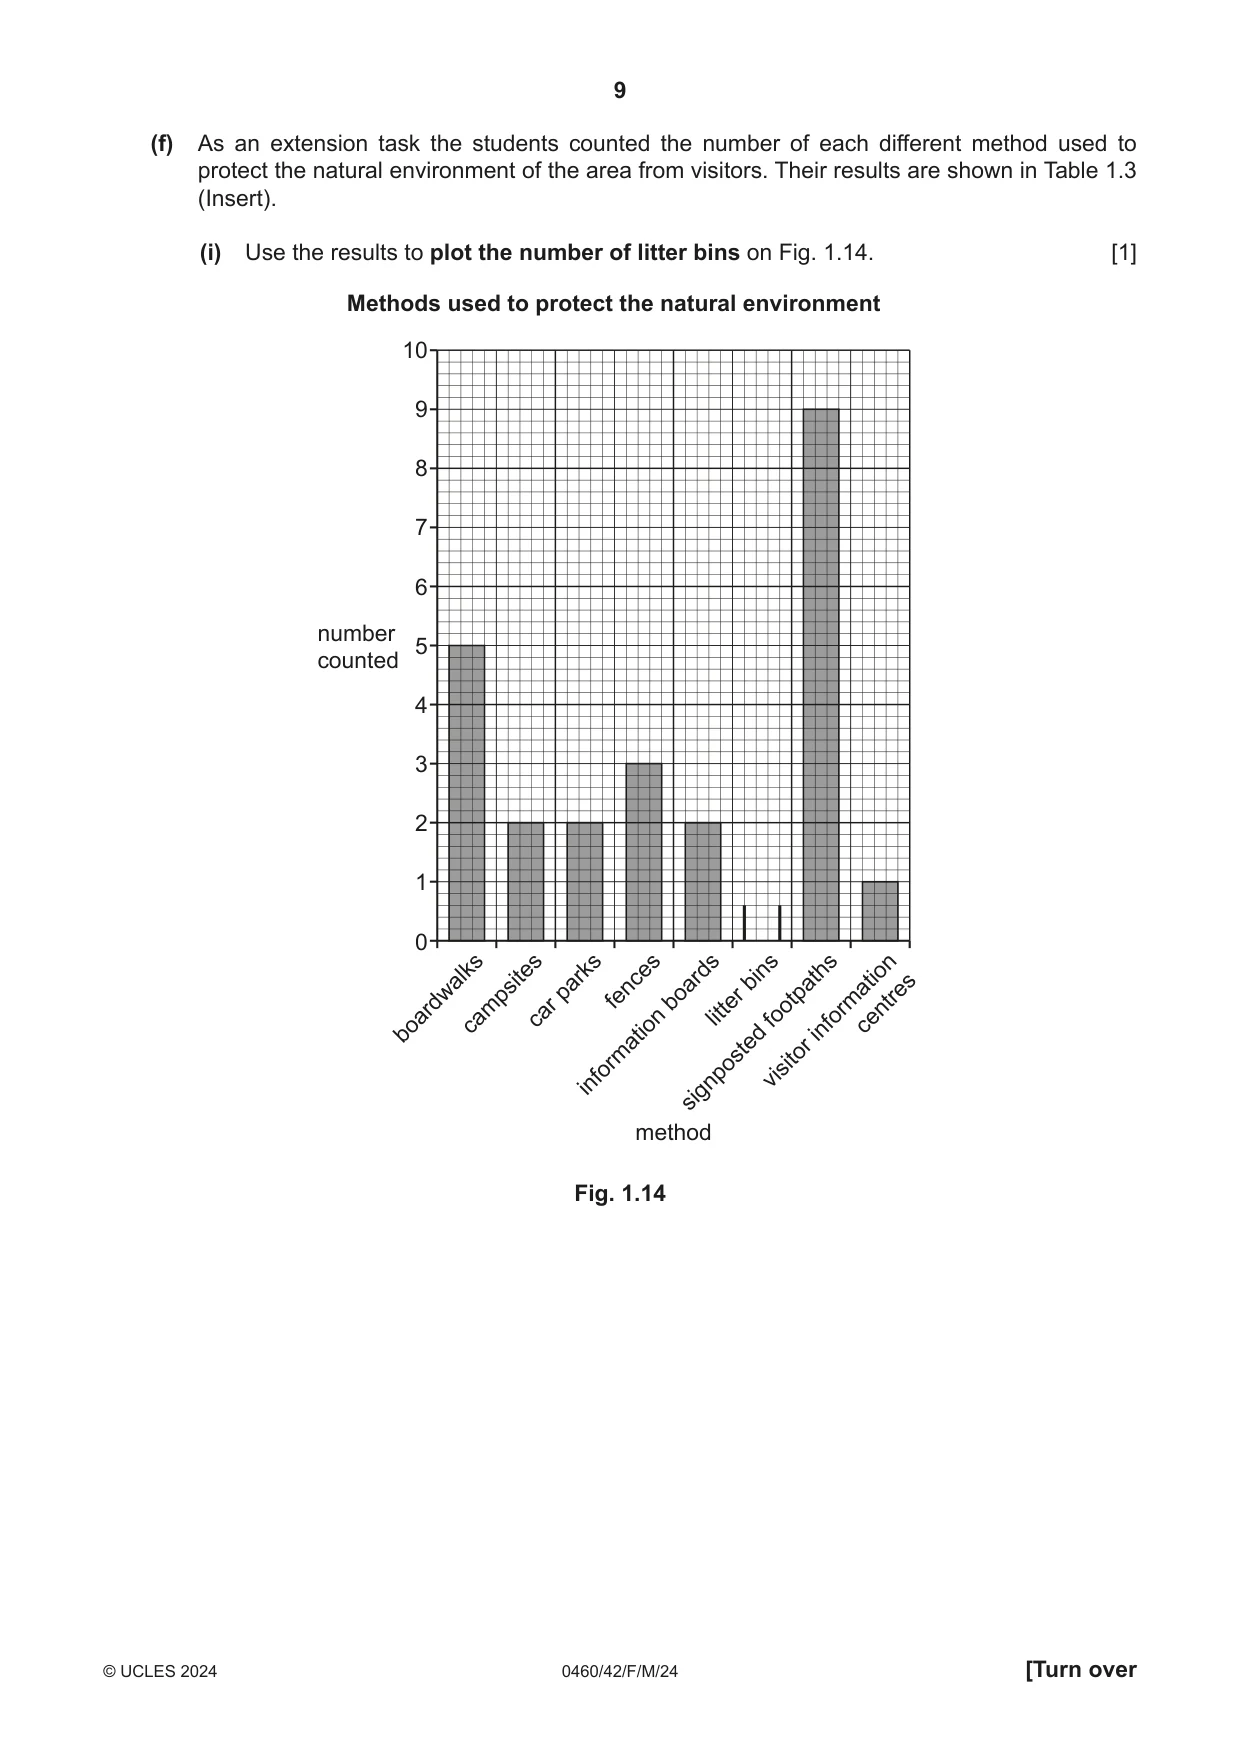
1 Students did fieldwork on a local coastline. They investigated a variety of topics including longshore drift and coastal management. The students agreed to test the following hypotheses: Hypothesis 1: Longshore drift is occurring along the local coastline. Hypothesis 2: Coastal defences have a positive impact on the local coastline. (a) The students had learnt that longshore drift moves beach material along the coast. This is shown in Fig. 1.1 (Insert). Which three of the following statements about longshore drift are correct? Tick (✓) your answers. statement tick (✓) Longshore drift occurs in deep water. Swash moves material down the beach. Movement of material up and down the beach is repeated with each wave. Waves approach the coastline at an angle. Backwash moves material up the beach. The direction of longshore drift depends on the direction of the tide. The prevailing wind influences the direction of longshore drift movement. [3] (b) To investigate Hypothesis 1: Longshore drift is occurring along the local coastline, some students used the fieldwork method described in Fig. 1.2 (Insert). (i) Suggest why the students painted the pebbles ........................................................................................................................................... ........................................................................................................................................... repeated their method three times. ........................................................................................................................................... ........................................................................................................................................... [2] (ii) The results of the students’ measurements are shown in Table 1.1 (Insert). Plot the results of the total number of pebbles found and the average length of pebble that moved between 40.1 m and 50 m from the ranging pole on Fig. 1.3. [2] Results of the students’ measurements 35 30 25 20 number of pebbles 15 found 10 10 average 5 5 length of pebble (cm) 0 0 0.1 10.1 20.1 30.1 40.1 50.1 60.1 70.1 more to to to to to to to to than 10 20 30 40 50 60 70 80 80 distance moved east from ranging pole (m) Key total number of pebbles found in the three tests average length of long axis of pebbles (cm) Fig. 1.3 (iii) Do the results shown in Fig. 1.3 and Table 1.1 support Hypothesis 1: Longshore drift is occurring along the local coastline? Use data to support your conclusion. ........................................................................................................................................... ........................................................................................................................................... ........................................................................................................................................... ........................................................................................................................................... ........................................................................................................................................... ........................................................................................................................................... ........................................................................................................................................... ..................................................................................................................................... [4] (c) Other students used a different method to investigate longshore drift. Their method is described in Fig. 1.4 (Insert). Suggest two reasons why this method might produce unreliable results. 1 ................................................................................................................................................ ................................................................................................................................................... 2 ................................................................................................................................................ ................................................................................................................................................... [2] (d) In an area further along the coast the students saw some groynes such as the ones shown in Fig. 1.5 (Insert). Describe the groynes and explain how they can reduce the effect of longshore drift. ................................................................................................................................................... ................................................................................................................................................... ................................................................................................................................................... ................................................................................................................................................... ................................................................................................................................................... ............................................................................................................................................. [3] (e) To investigate Hypothesis 2: Coastal defences have a positive impact on the local coastline, the students did a bi-polar survey of four types of defences built along the coastline. Groynes are shown in Fig. 1.5 (Insert), gabions are shown in Fig. 1.6 (Insert), revetments are shown in Fig. 1.7 (Insert) and a sea wall is shown in Fig. 1.8 (Insert). (i) The students filled in a bi-polar survey recording form as they looked at each type of defence. This is shown in Fig. 1.9 (Insert). Suggest three ways of collecting the information for each type of defence that would help make the results of the students’ bi-polar survey more reliable. 1 ........................................................................................................................................ ........................................................................................................................................... 2 ........................................................................................................................................ ........................................................................................................................................... 3 ........................................................................................................................................ ........................................................................................................................................... [3] (ii) The results of the bi-polar survey are shown in Table 1.2 (Insert). Figs. 1.10 to 1.13 show graphs of the results of the students’ bi-polar survey. Use these results to plot the score for ‘attractiveness’ and insert the total score for gabions on Fig. 1.10. [2] Results of the students’ bi-polar survey gabions total score = –2 –1 0 +1 +2 attractiveness protection of land behind beach stop wave erosion safety walking on it access to the beach construction costs disturbance during construction –2 –1 0 +1 +2 Fig. 1.10 groynes total score = +4 –2 –1 0 +1 +2 attractiveness protection of land behind beach stop wave erosion safety walking on it access to the beach construction costs disturbance during construction –2 –1 0 +1 +2 Fig. 1.11 revetments total score = –1 –2 –1 0 +1 +2 attractiveness protection of land behind beach stop wave erosion safety walking on it access to the beach construction costs disturbance during construction –2 –1 0 +1 +2 Fig. 1.12 sea wall total score = –5 –2 –1 0 +1 +2 attractiveness protection of land behind beach stop wave erosion safety walking on it access to the beach construction costs disturbance during construction –2 –1 0 +1 +2 Fig. 1.13 (iii) Do the results of the fieldwork support Hypothesis 2: Coastal defences have a positive impact on the local coastline? Tick (✓) your conclusion. Support your conclusion with total scores from Figs. 1.10, 1.11, 1.12 and 1.13. tick (✓) The conclusion is true for all defences. The conclusion is true for some defences. The conclusion is false for all defences. ........................................................................................................................................... ........................................................................................................................................... ........................................................................................................................................... ........................................................................................................................................... ........................................................................................................................................... ..................................................................................................................................... [4] (f) As an extension task the students counted the number of each different method used to protect the natural environment of the area from visitors. Their results are shown in Table 1.3 (Insert). (i) Use the results to plot the number of litter bins on Fig. 1.14. [1] Methods used to protect the natural environment 10 9 8 7 6 number 5 counted 4 3 2 1 0 centres car litter footpathsinformation boardwalkscampsitesparksfencesboards bins visitor information signposted method Fig. 1.14 (ii) Describe different ways each of the following can be used to protect the natural environment from visitors. litter bins ........................................................................................................................................... ........................................................................................................................................... car parks ........................................................................................................................................... ........................................................................................................................................... signposted footpaths ........................................................................................................................................... ........................................................................................................................................... visitor information centres ........................................................................................................................................... ........................................................................................................................................... [4] [Total: 30]
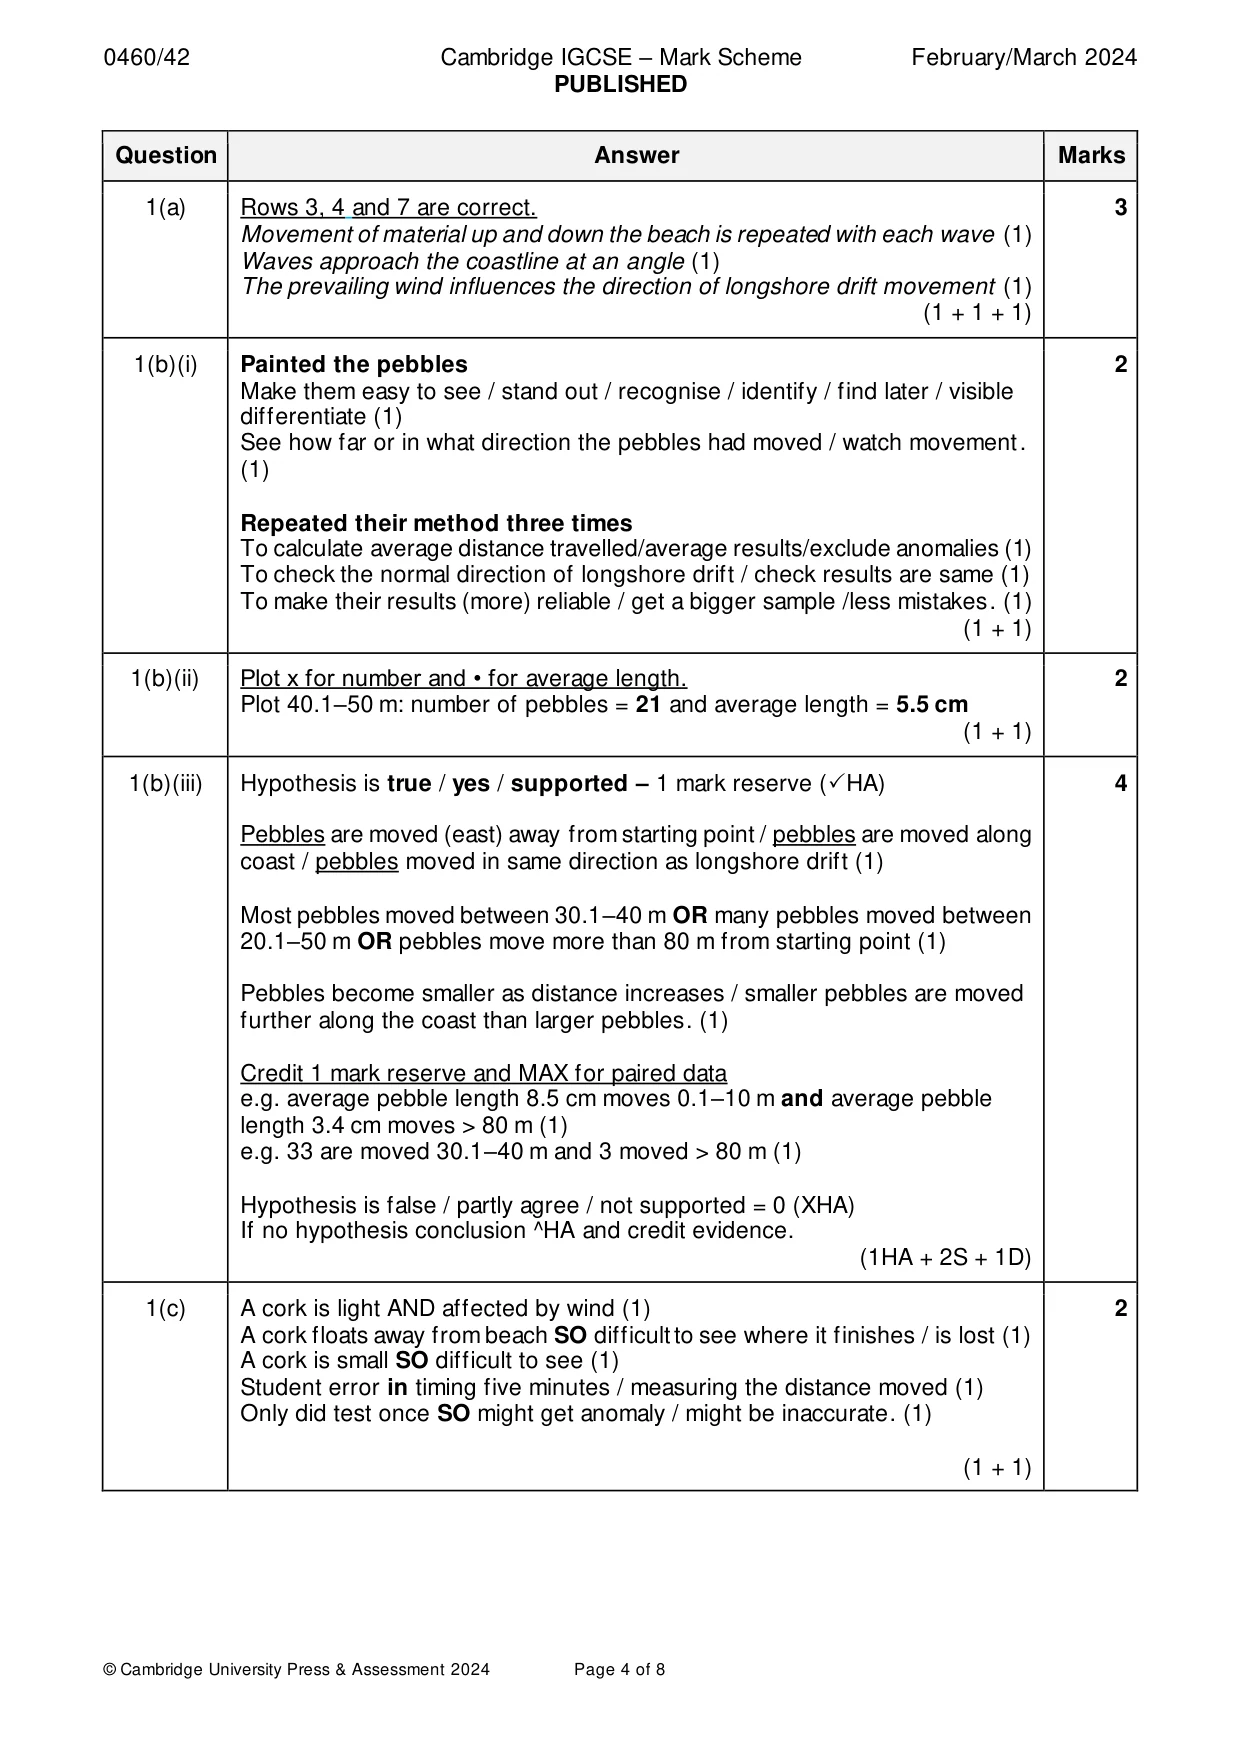
Mark scheme: Question Answer Marks 1(a) Rows 3, 4 and 7 are correct. 3 Movement of material up and down the beach is repeated with each wave (1) Waves approach the coastline at an angle (1) The prevailing wind influences the direction of longshore drift movement (1) (1 + 1 + 1) 1(b)(i) Painted the pebbles 2 Make them easy to see / stand out / recognise / identify / find later / visible differentiate (1) See how far or in what direction the pebbles had moved / watch movement. (1) Repeated their method three times To calculate average distance travelled/average results/exclude anomalies (1) To check the normal direction of longshore drift / check results are same (1) To make their results (more) reliable / get a bigger sample /less mistakes. (1) (1 + 1) 1(b)(ii) Plot x for number and • for average length. 2 Plot 40.1–50 m: number of pebbles = 21 and average length = 5.5 cm (1 + 1) 1(b)(iii) Hypothesis is true / yes / supported – 1 mark reserve (HA) 4 Pebbles are moved (east) away from starting point / pebbles are moved along coast / pebbles moved in same direction as longshore drift (1) Most pebbles moved between 30.1–40 m OR many pebbles moved between 20.1–50 m OR pebbles move more than 80 m from starting point (1) Pebbles become smaller as distance increases / smaller pebbles are moved further along the coast than larger pebbles. (1) Credit 1 mark reserve and MAX for paired data e.g. average pebble length 8.5 cm moves 0.1–10 m and average pebble length 3.4 cm moves > 80 m (1) e.g. 33 are moved 30.1–40 m and 3 moved > 80 m (1) Hypothesis is false / partly agree / not supported = 0 (XHA) If no hypothesis conclusion ^HA and credit evidence. (1HA + 2S + 1D) 1(c) A cork is light AND affected by wind (1) 2 A cork floats away from beach SO difficult to see where it finishes / is lost (1) A cork is small SO difficult to see (1) Student error in timing five minutes / measuring the distance moved (1) Only did test once SO might get anomaly / might be inaccurate. (1) (1 + 1) 1(d) Description (1D Reserve) 3 Wooden / fences / barriers (1) Go from the back of the beach to the sea / perpendicular or vertical to coast. (1) How they reduce longshore drift (1E Reserve) Trap pebbles or sand or beach material (1) NOT: Break waves/reduce velocity Prevents movement of material along coast / beach. (1) (1D + 1E + 1) 1(e)(i) Examples 3 Work as a group and agree the scores for each factor (1) Survey all four defences when sea conditions are similar (1) Do a practice / pilot survey to check recording form is appropriate (1) Do a practice / pilot survey to ensure students understand instructions / know what to do (1) =0 Ask people. (1 + 1 + 1) 1(e)(ii) Ignore shading 2 Plot attractiveness of gabion = –1 and total score for gabion = +1 (1 + 1) 1(e)(iii) The conclusion is true for some defences – 1 mark reserve (HA) 4 True OR positive scores for gabion and groyne (1S) False OR negative scores for revetment and sea wall (1S) Groyne TRUE and Sea Wall FALSE but gabion and revetment too close to be either. (1S) Credit 1 mark reserve/MAX for paired total data 1 positive and 1 negative score e.g. groyne = +4 and sea wall = –5 (1D) No credit for individual scores Hypothesis is true for all defences / false for all defences = 0 (XHA) If no hypothesis conclusion ^HA and credit evidence. (1HA + 2S + 1D) 1(f)(i) Plot litter bins = 8. Ignore shading. TICK/CROSS. 1 1(f)(ii) Litter bins: reduce litter dropped / improve appearance of the environment / 4 stop animals choking on litter / area cleaner / litter put in bin. (1) Car parks: reduce number of vehicles parking anywhere / reduces threat to habitats (1) NOT: reduces air pollution / congestion. Signposted footpaths: stops people trampling on OR harming vegetation / keeps people on a path / protects habitats. (1) Visitor information centres: educates people about the environment / shows trails or walks / makes people aware. (1) (1 + 1 + 1 + 1)
Q2 · Students in Scotland, UK, (an MEDC in Europe) visited a local manufacturing industry
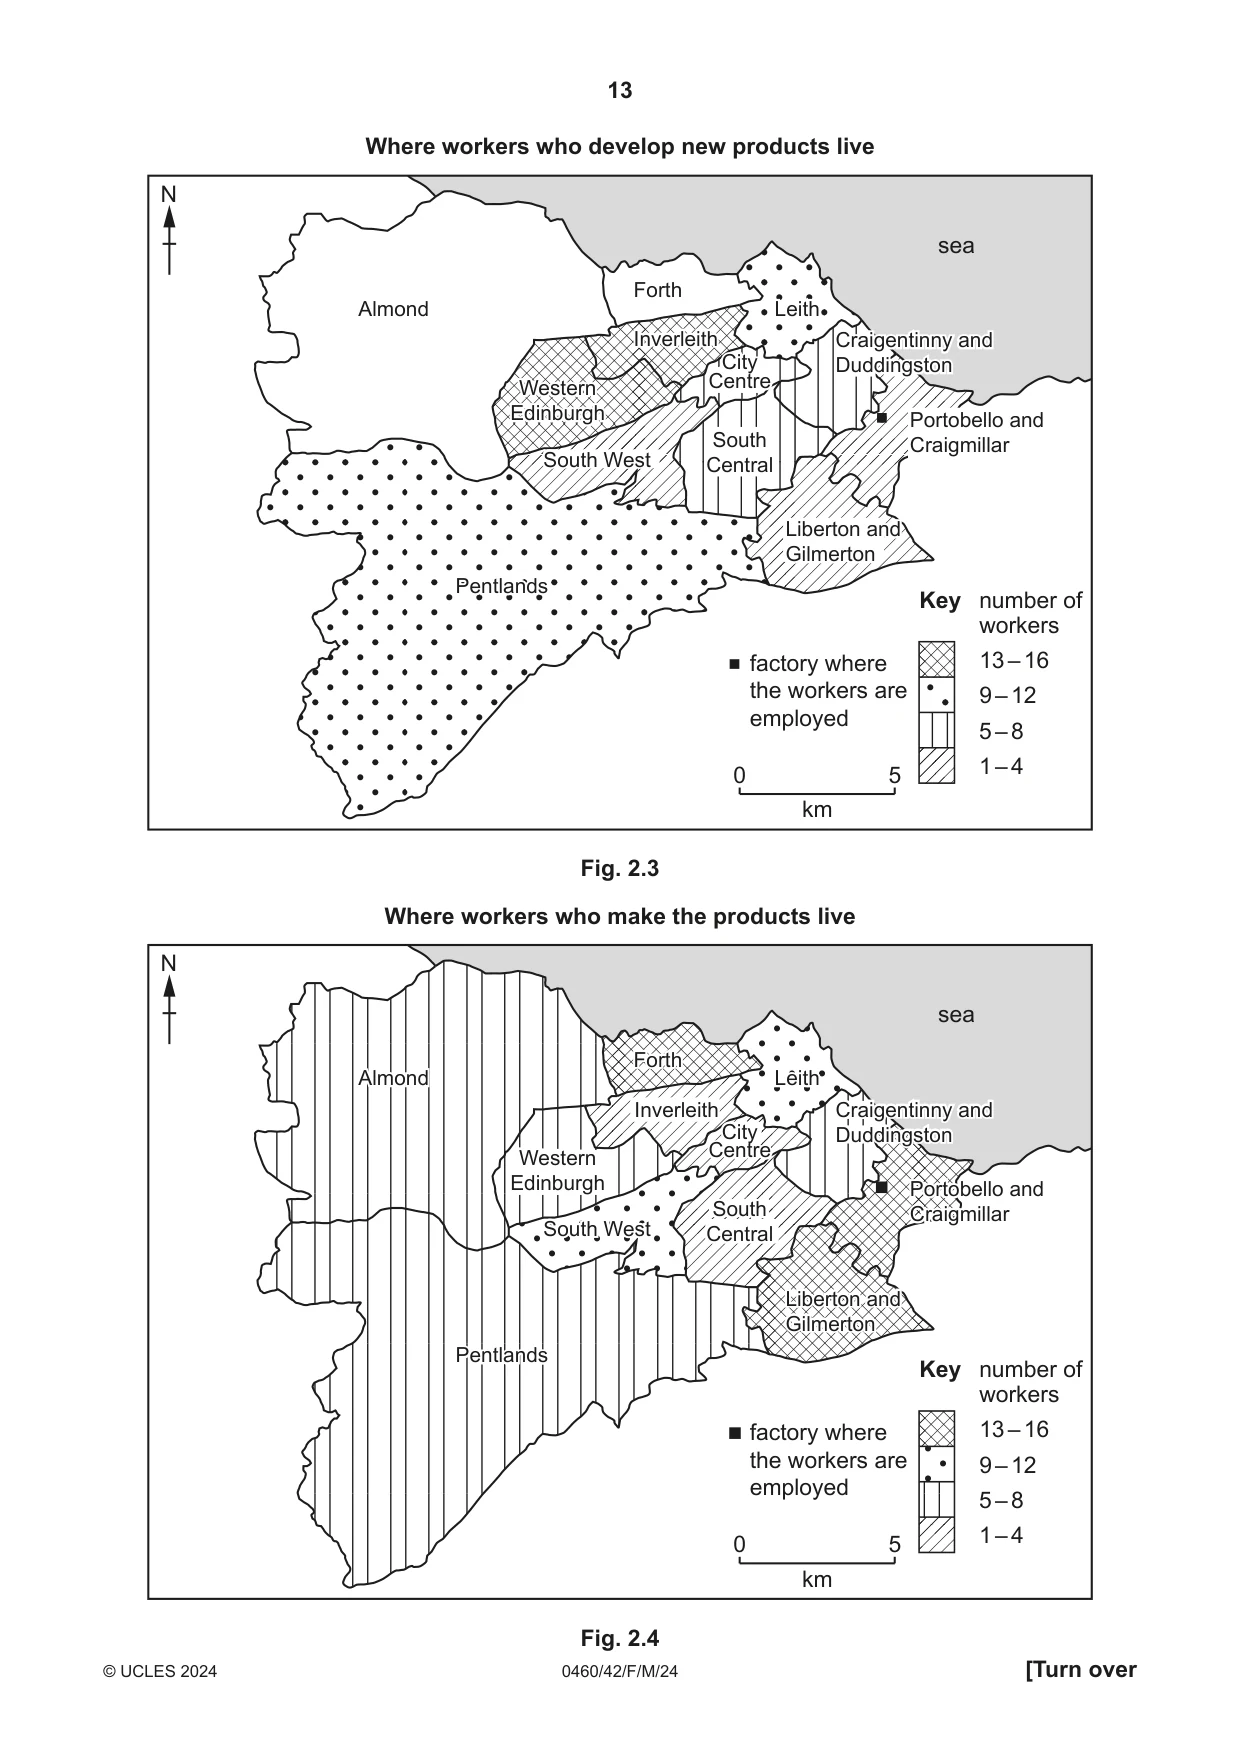
2 Students in Scotland, UK, (an MEDC in Europe) visited a local manufacturing industry. The factory is located near to the centre of a large urban area. Two groups of workers are employed in the factory: one group develops new products and the other group makes the products from imported components. The students did some fieldwork to investigate where the workers lived and to find out what were the main advantages and disadvantages of living there. One student used the results of their fieldwork to investigate the following hypotheses: Hypothesis 1: The two groups of workers live in different parts of the urban area. Hypothesis 2: Workers think that travelling to and from work is the main disadvantage of where they live. (a) (i) To collect data to test these hypotheses the students produced a questionnaire. This is shown in Fig. 2.1 (Insert). Name and describe a suitable method of selecting workers to complete the questionnaire to get a representative sample. Name of sampling method ....................................................... Description ........................................................................................................................................... ........................................................................................................................................... ........................................................................................................................................... ..................................................................................................................................... [3] (ii) Part of the recording sheet which the students used is shown in Fig. 2.2 (Insert). Describe this method of recording results. ........................................................................................................................................... ........................................................................................................................................... ........................................................................................................................................... ..................................................................................................................................... [2] (b) The results for question 1 in the questionnaire (In which part of the urban area do you live?) are shown in Table 2.1 (Insert). (i) A student used these results to draw the maps shown in Figs. 2.3 and 2.4. Use Table 2.1 to complete Fig. 2.3 to show the number of workers who develop new products living in Almond and Forth. [2] Where workers who develop new products live N sea ForthForth AlmondAlmond LeithLeith InverleithInverleith CraigentinnyCraigentinny andand CityCity DuddingstonDuddingston CentreCentre WesternWestern EdinburghEdinburgh PortobelloPortobello andand SouthSouth CraigmillarCraigmillar SouthSouth WestWest CentralCentral LibertonLiberton andand GilmertonGilmerton PentlandsPentlands Key number of workers factory where 13 – 16 the workers are 9 – 12 employed 5 – 8 1 – 4 0 5 km Fig. 2.3 Where workers who make the products live N sea ForthForth AlmondAlmond LeithLeith InverleithInverleith CraigentinnyCraigentinny andand CityCity DuddingstonDuddingston CentreCentre WesternWestern EdinburghEdinburgh PortobelloPortobello andand SouthSouth CraigmillarCraigmillar SouthSouth WestWest CentralCentral LibertonLiberton andand GilmertonGilmerton PentlandsPentlands Key number of workers factory where 13 – 16 the workers are 9 – 12 employed 5 – 8 1 – 4 0 5 km Fig. 2.4 (ii) Name the type of map shown in Figs. 2.3 and 2.4. Choose from the following list. Tick (✓) your choice. [1] tick (✓) choropleth map flow line map isoline map relief map (iii) Give two advantages of using this type of map to present data. advantage 1 ........................................................................................................................................... ........................................................................................................................................... advantage 2 ........................................................................................................................................... ........................................................................................................................................... [2] (iv) What conclusion did the student make about Hypothesis 1: The two groups of workers live in different parts of the urban area? Support your decision with data from Figs. 2.3 and 2.4 and Table 2.1. ........................................................................................................................................... ........................................................................................................................................... ........................................................................................................................................... ........................................................................................................................................... ........................................................................................................................................... ........................................................................................................................................... ........................................................................................................................................... ..................................................................................................................................... [4]
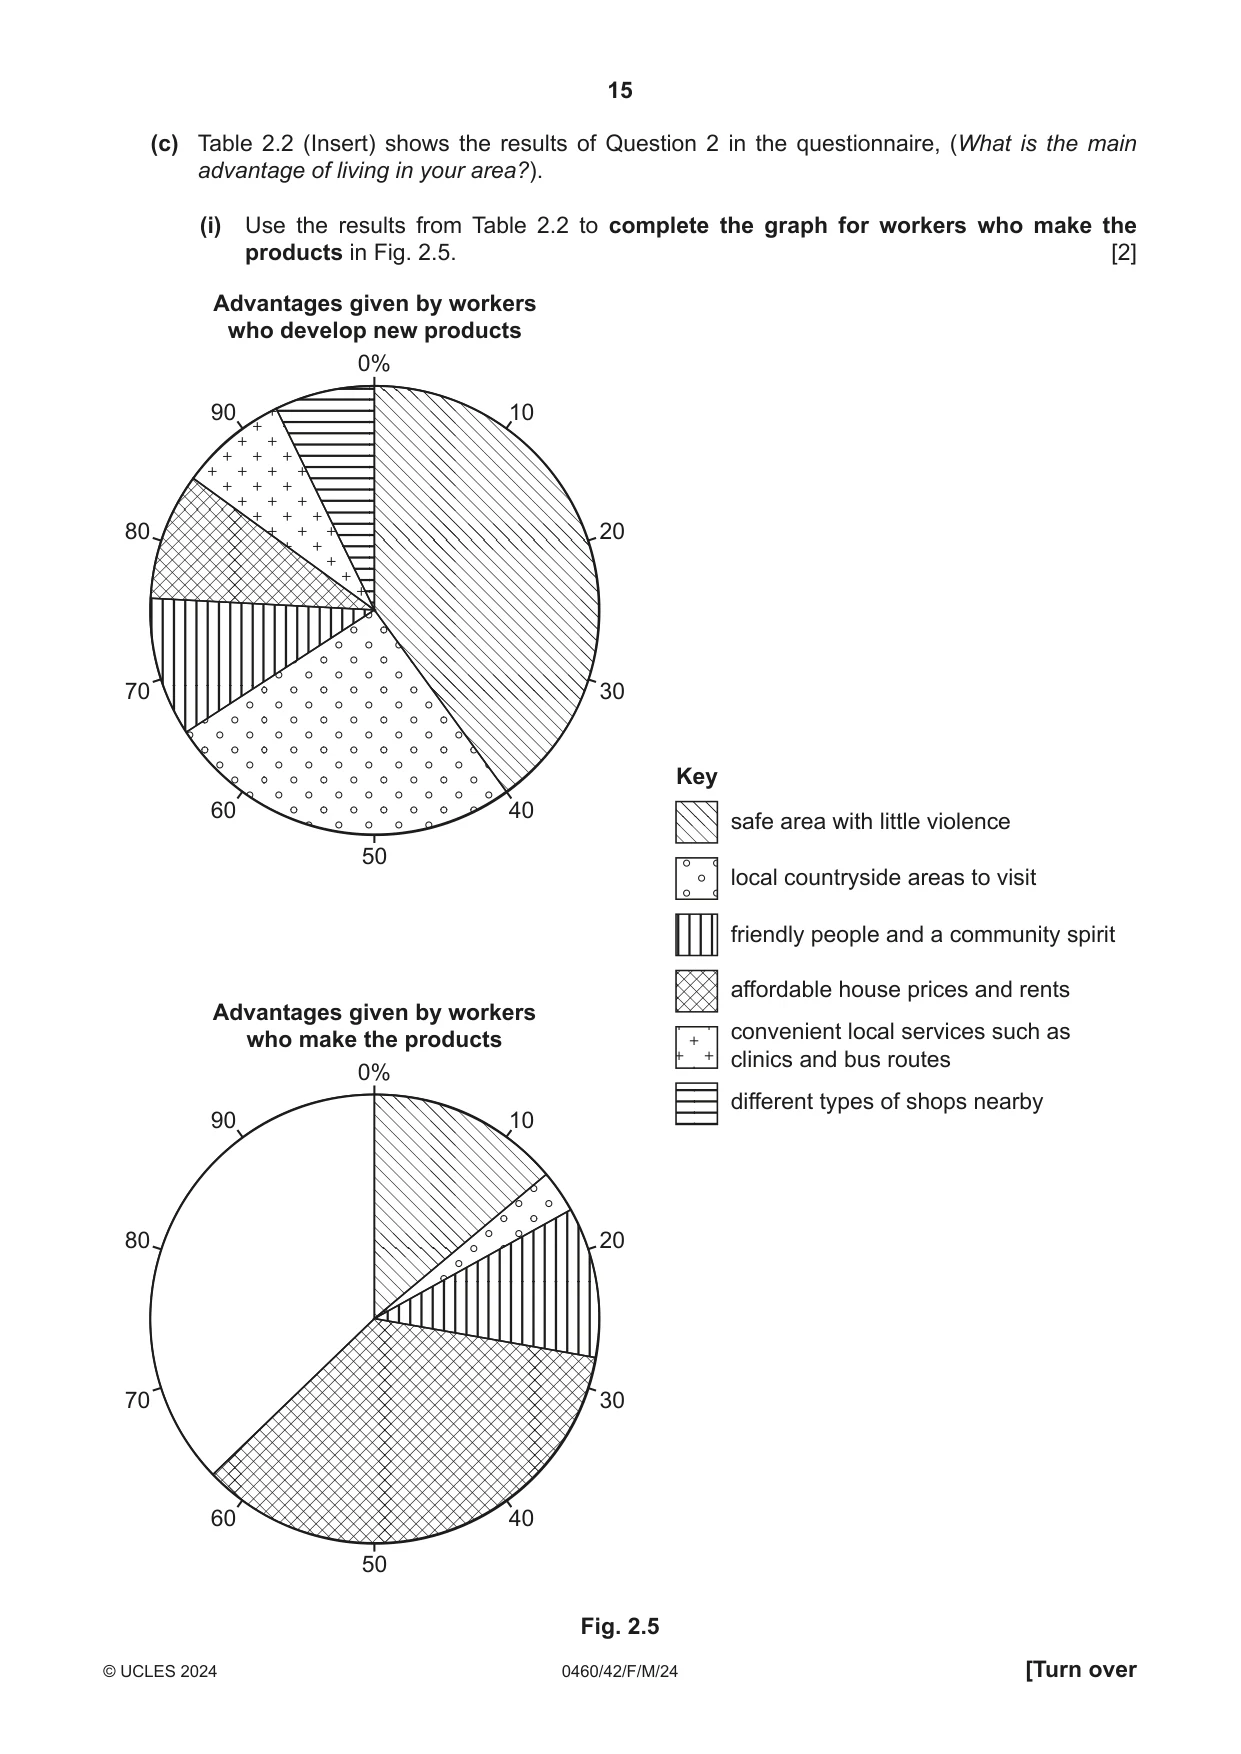
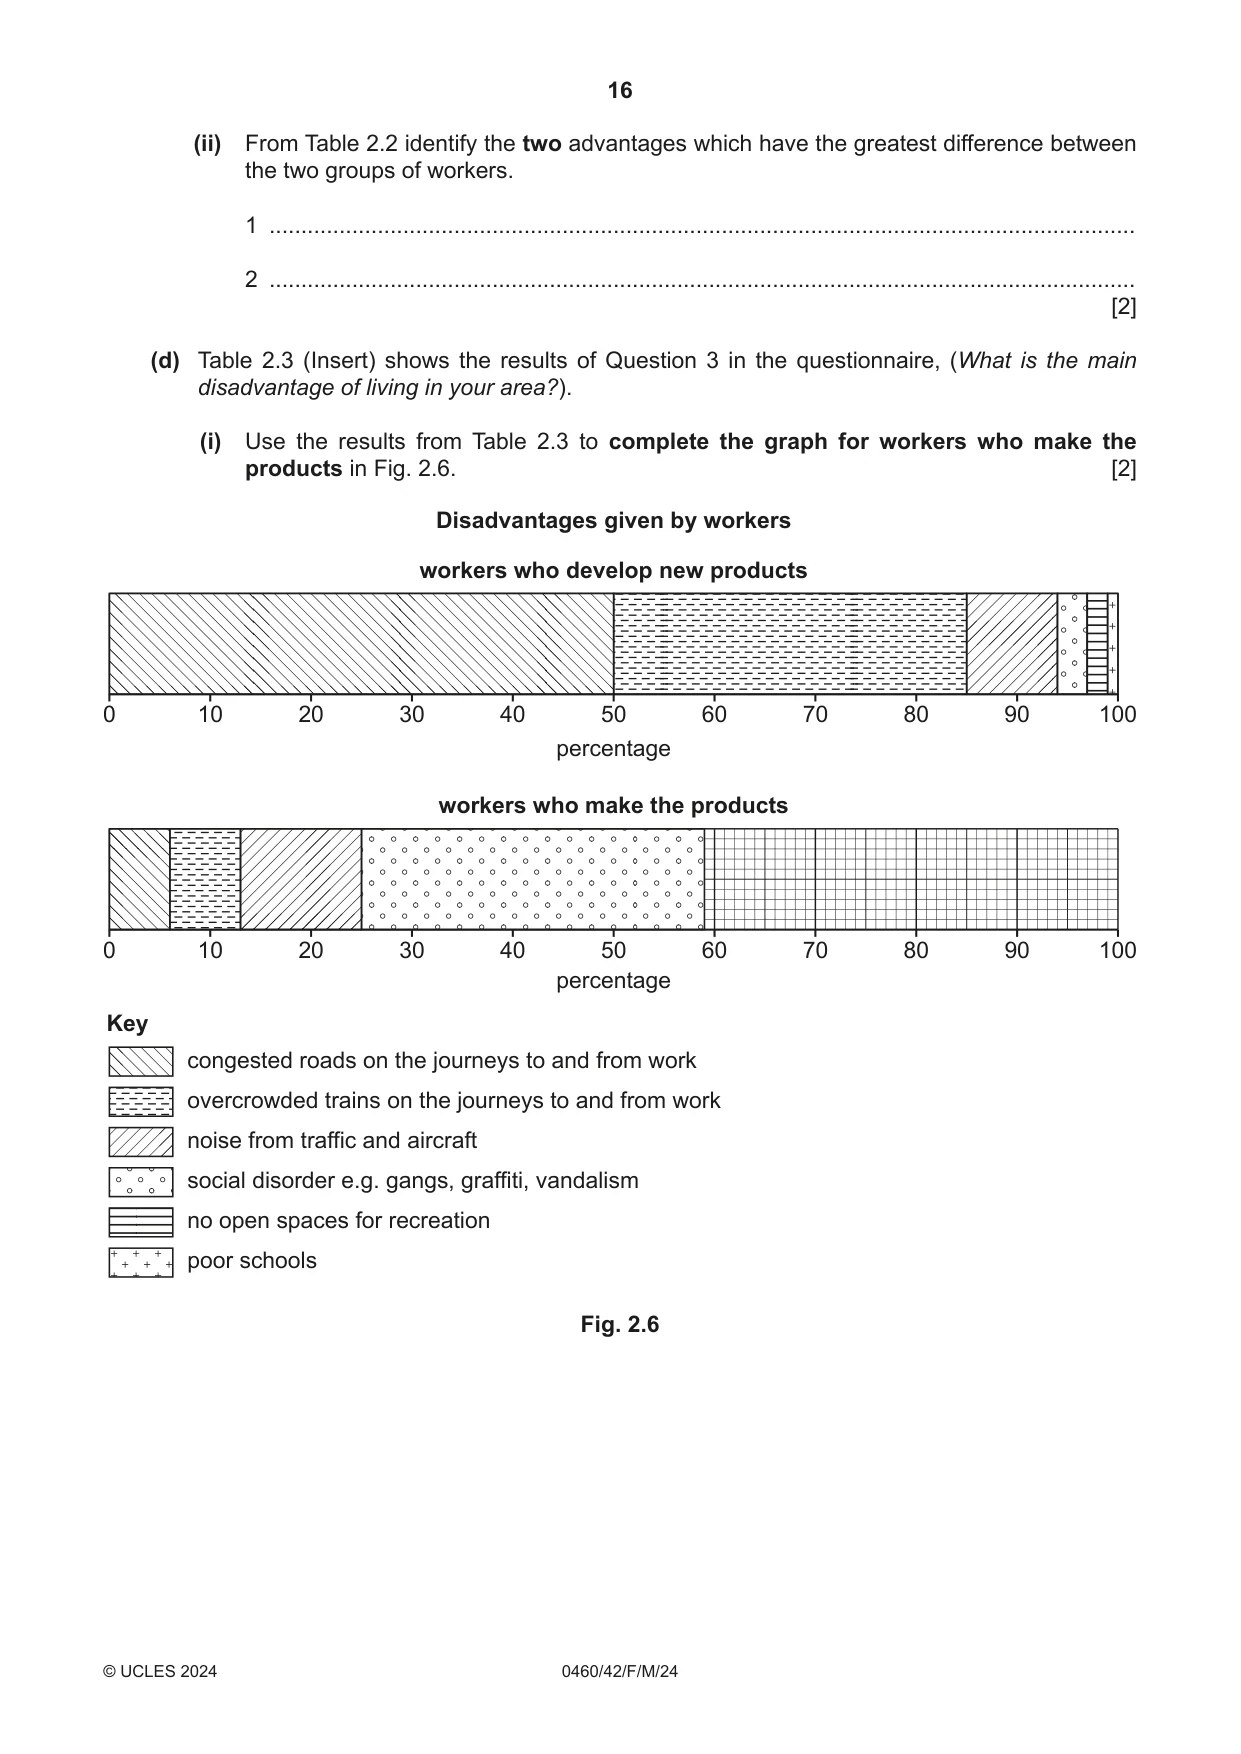
Mark scheme: 2(a)(i) Stratified: (1) 3 Find out gender or age balance of workers (1) Ask a balanced number or proportionate number of workers of different age group and gender / get a balance of different ages or gender. (1) Systematic: (1) Choose workers at regular / same / equal intervals (1) Every tenth / nth worker they meet. (1) Random: (1) Use random number table or similar method e.g. pick numbers out of a hat (1) This determines the workers they give the questionnaire to. (1) OR Ask anybody / next person / no pattern (1 mark) 1 mark for name of method, 2 marks for description If no/incorrect name credit appropriate description If name doesn’t match description, credit name only. (1M + 2D) 2(a)(ii) Examples 2 Tally method / tally chart / tallying (1) Mark one line for each person counted (1) Record results in multiples / groups of five. (1) (1 + 1) 2(b)(i) Shade Almond (13 crisscross) and Forth (5 vertical) 2 (1 + 1) 2(b)(ii) Choropleth map 1 2(b)(iii) Examples 2 Shows overall pattern (1) Easy to identify similar areas/differentiate or pick out groups/compare areas (1) Visual / clear / detailed (1) Easy to read / easy to understand / quick to read. (1) (1 + 1) 2(b)(iv) Hypothesis is true – 1 mark reserve (HA) 4 Workers who develop products mainly live in areas further from factory (1) Workers who develop products mainly live closer to city centre (1) Most who develop products live in Inverleith / W.Edinburgh / Almond and most who make products live in Liberton and Gilmerton / Portobello and Craigmillar (1) Most who develop live in NORTH/NW/W and most who make live in EAST. (1) Credit 1 mark MAX for comparative data e.g. In Inverleith 16/13–16 workers who develop products and 4/1–4 workers who make products (1D) e.g.16/13–16 workers who develop products live in Inverleith and 15/13–16 workers who make products live in Liberton and Gilmerton. (1D) Hypothesis is false = 0 (XHA) If no hypothesis conclusion ^HA and credit evidence If partly/generally true = ^HA and credit evidence (1HA + 2S + 1D) 2(c)(i) Complete pie graph 2 Convenient local services such as clinics and bus routes =18 Different types of shops are nearby =19 1 mark for dividing line at 81(68 degrees west of N), 1 mark for shading. (1 + 1) 2(c)(ii) Examples 2 Affordable house prices and rents (1) The area is safe with little violence. (1) (1 + 1) 2(d)(i) Complete divided bar graph 2 No open spaces for recreation = 23 Poor schools = 18 1 mark for dividing line at 82, 1 mark for shading. (1 + 1) 2(d)(ii) Hypothesis is true for one group of workers – 1 mark reserve (HA) 4 True for workers who develop new products (1) Workers developing products think main disadvantages are congested roads and overcrowded trains (1) Workers making products think social disorder is the main disadvantage. (1) Credit 2 Max marks for data e.g. 85%/50 + 35 who develop products agree and13%/ 6 + 7 who make products agree (1) e.g. 34%/34 who make think that social disorder is the main disadvantage and 3 who develop. (1) Hypothesis is true for both groups / for neither group = 0 (XHA) If no hypothesis conclusion ^HA and credit evidence. (1 HA + 1S + 2D or 1HA + 2S + 1D) 2(e)(i) Examples 2 Air pollution / CO2 emissions (1) Difficult for emergency services to get through (1) Frustration / anger / ‘road rage’ / accidents (1) Noise (1) Deliveries late / children late to school / late to work / longer to get to work / less work time (1) Waste of fuel. (1) (1 + 1) 2(e)(ii) Ideas such as: 4 Many or more people live OR work in urban areas OR move or migrate to live in urban areas (1) Road network not designed for large numbers of vehicles / roads too narrow / not enough roads (1) Parking on verges / pavements / not enough car parks (1) Growth in car ownership / many or more people have or can afford cars (1) Many people commute / travel to work at the same time / rush hours (1) Inadequate public transport / lack of cycle lanes etc (1) Many lorries / vans / delivery vehicles on the roads (1) Temporary work e.g. roadworks / accidents / construction work / traffic lights not working, roads flooded, diversions. (1) (1 + 1 + 1 + 1)
What was in this paper
The subtopics covered by these 2 questions, and how many questions each got. Open one in a new tab to see every Cambridge question on it.
What you needed in this session
Cambridge’s own grade thresholds for 2024 Feb/March, Paper 4 · Variant 2. A higher threshold means an easier paper — the bar moves with how the cohort did.