Cambridge IGCSE Geography 0460 — 2023 Feb/March Paper 4 · Variant 2
0460/42/F/M/23 · 2 questions · 60 marks · ≈68 min
The question paper and its mark scheme, free to read here and free to download. This is Cambridge’s own paper, exactly as it was sat.
Question paper16 pages
Mark scheme9 pages
Answers below. Sit the paper first if you are practising.

Questions as text
Q1 · Some students in Canada did fieldwork to compare different areas of a local town
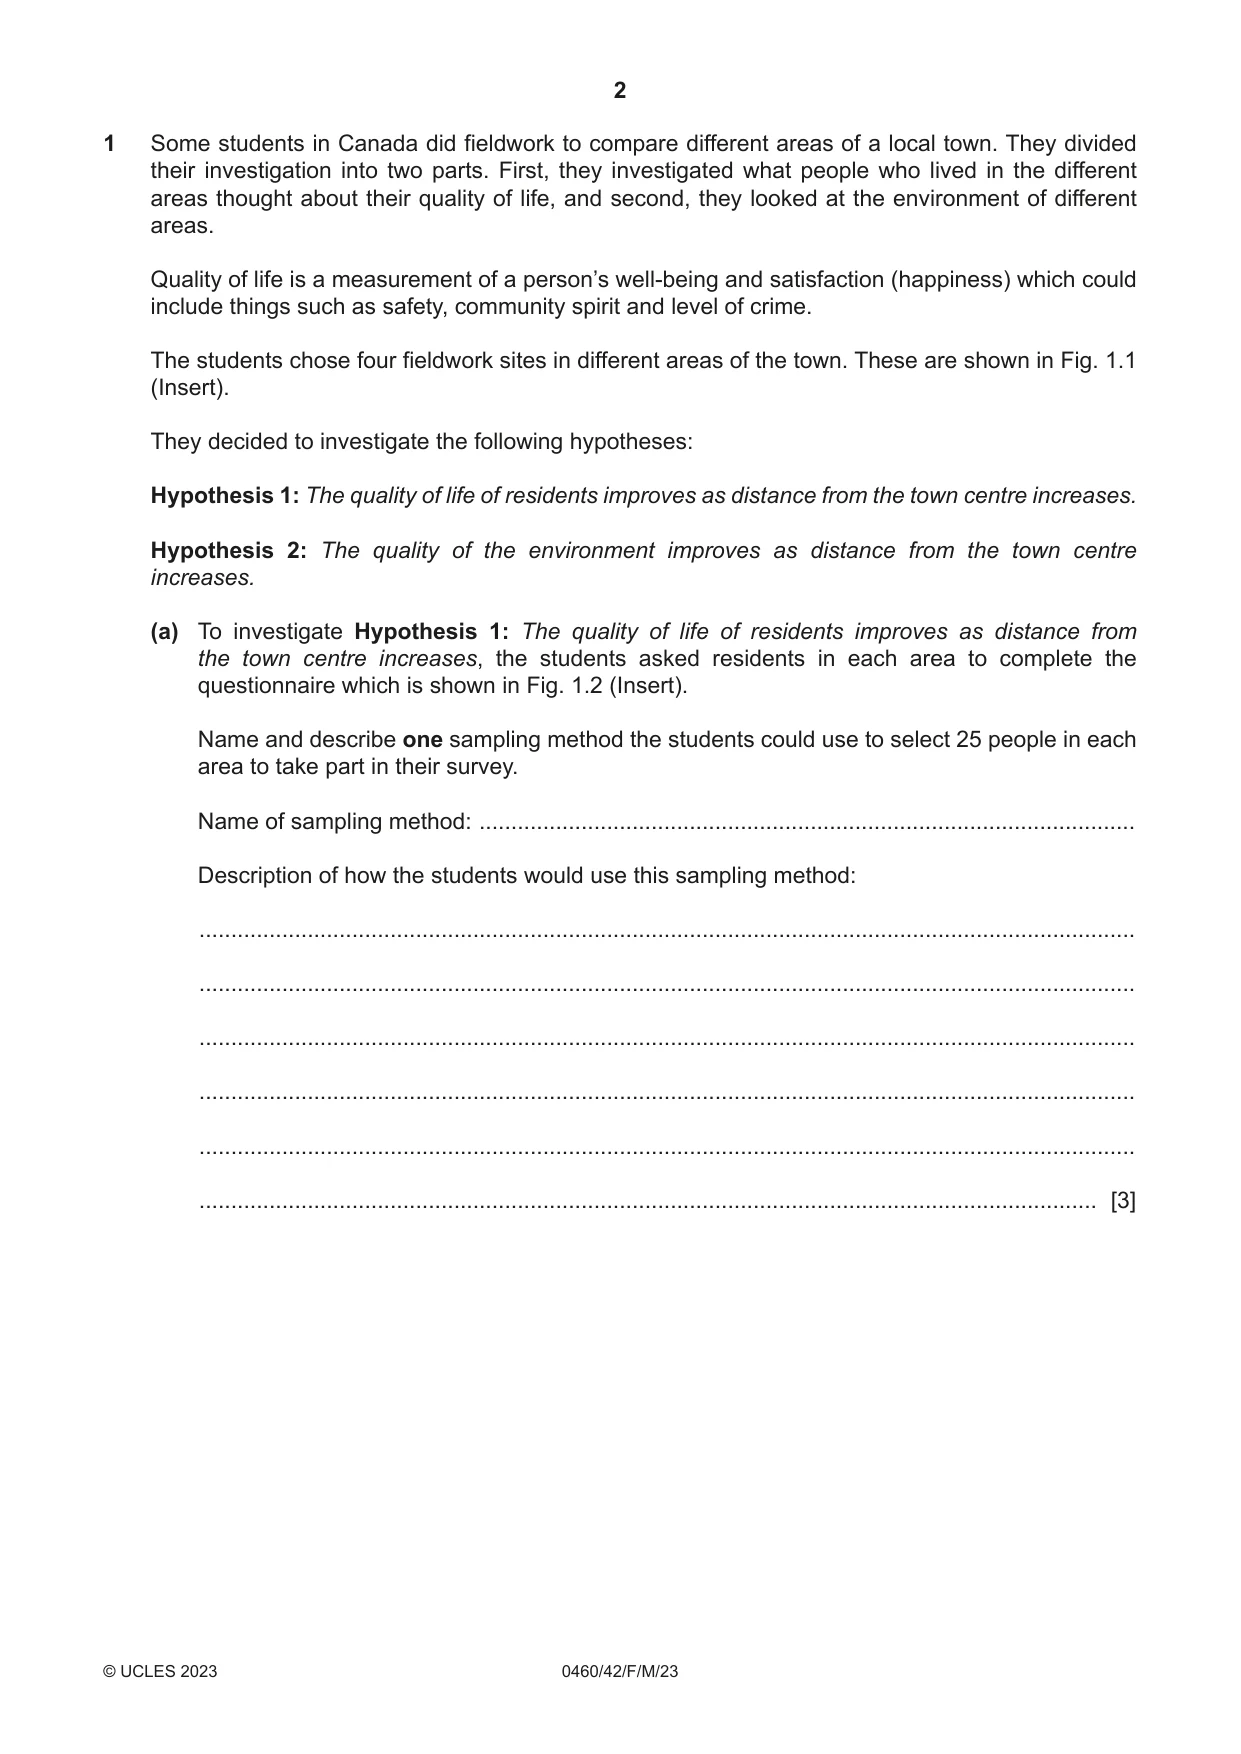
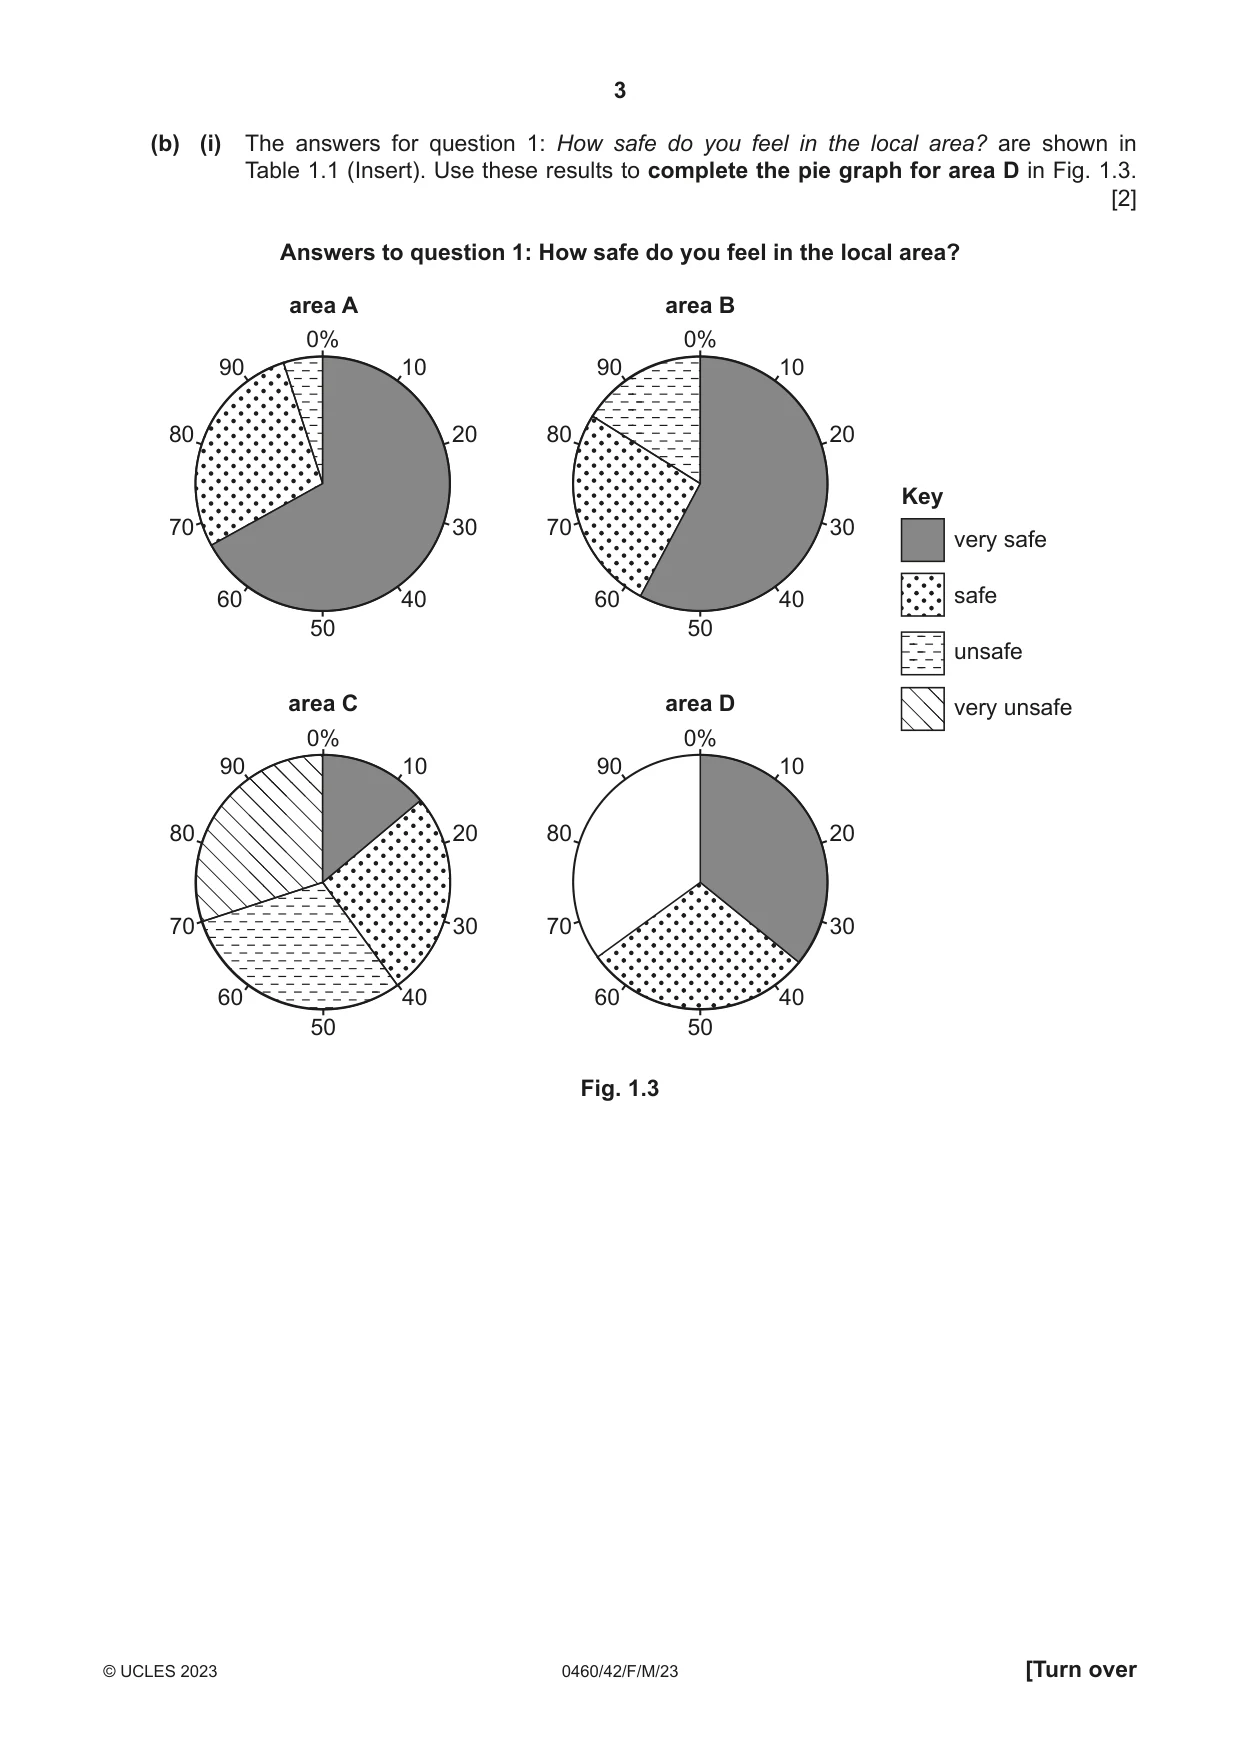
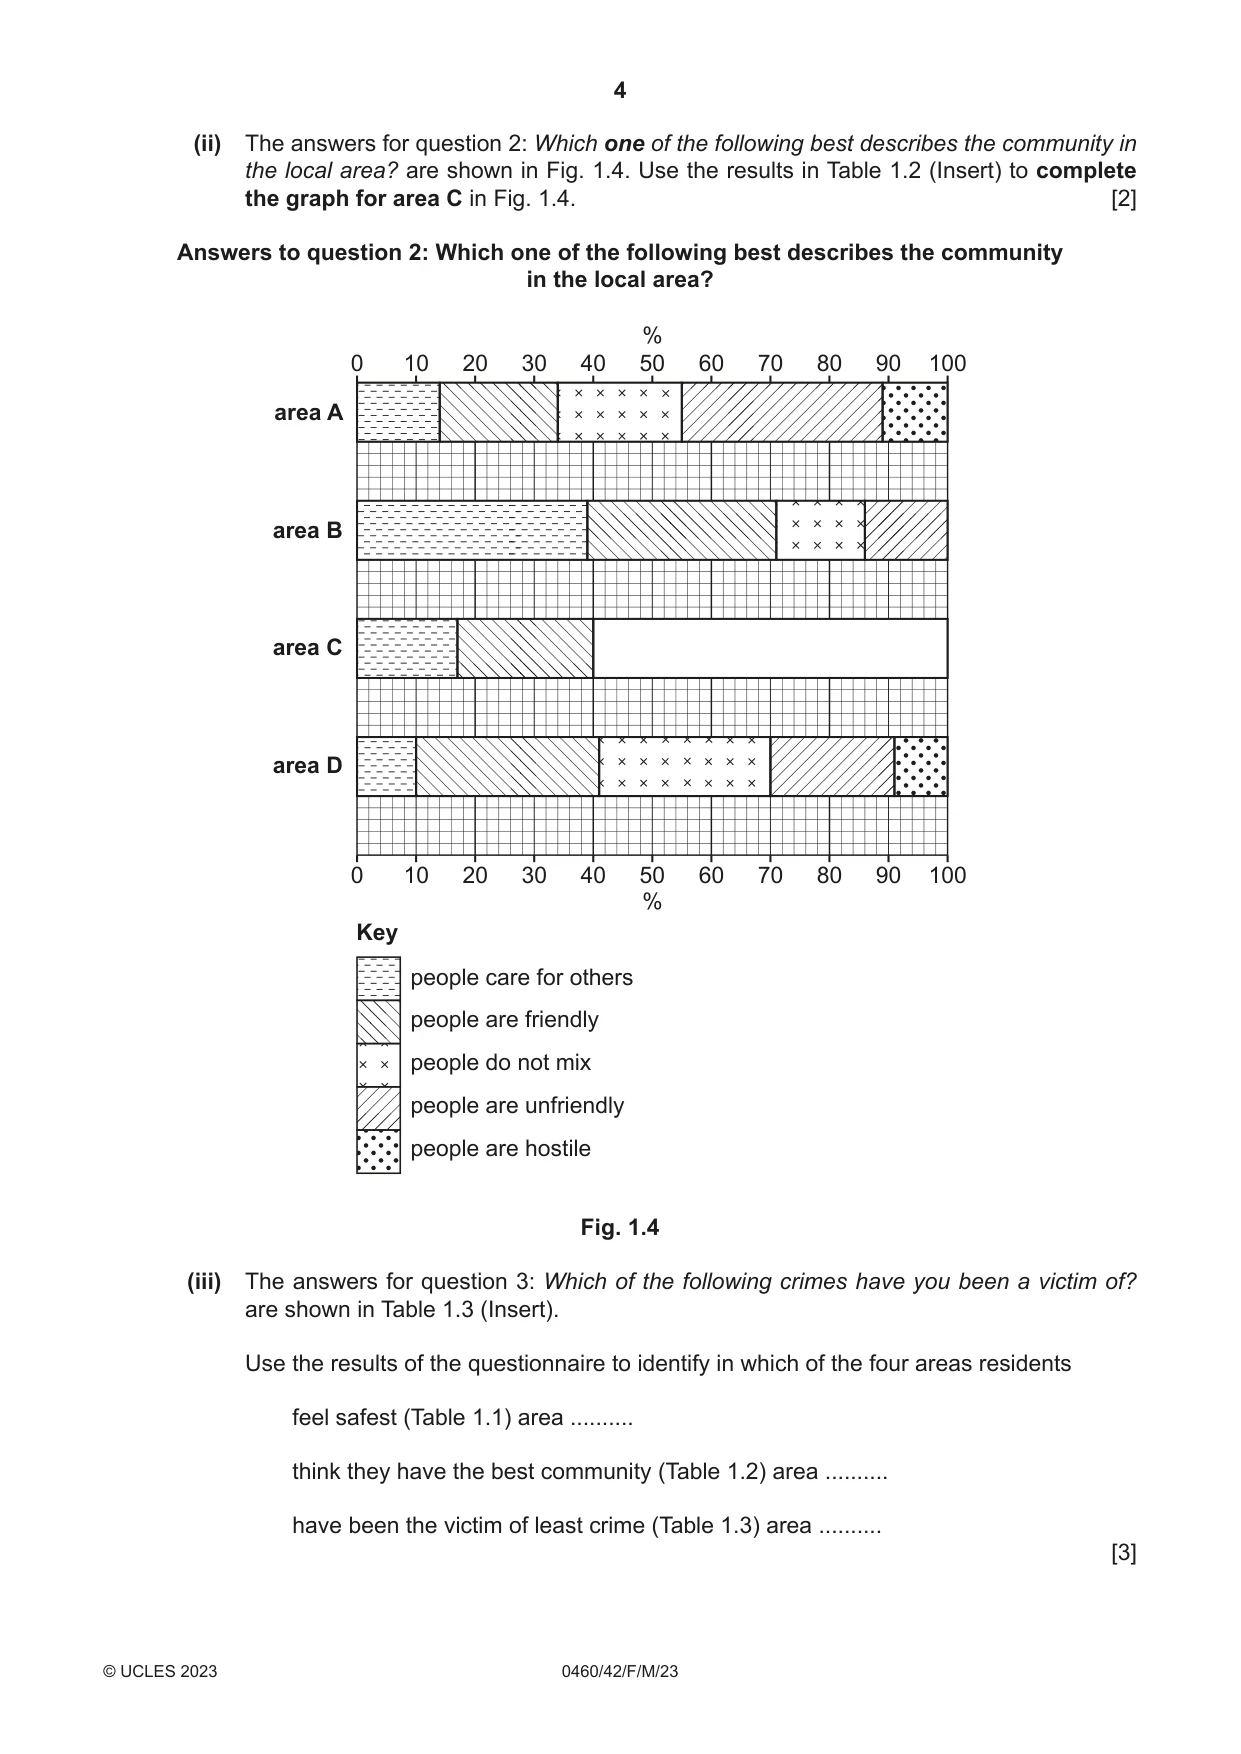
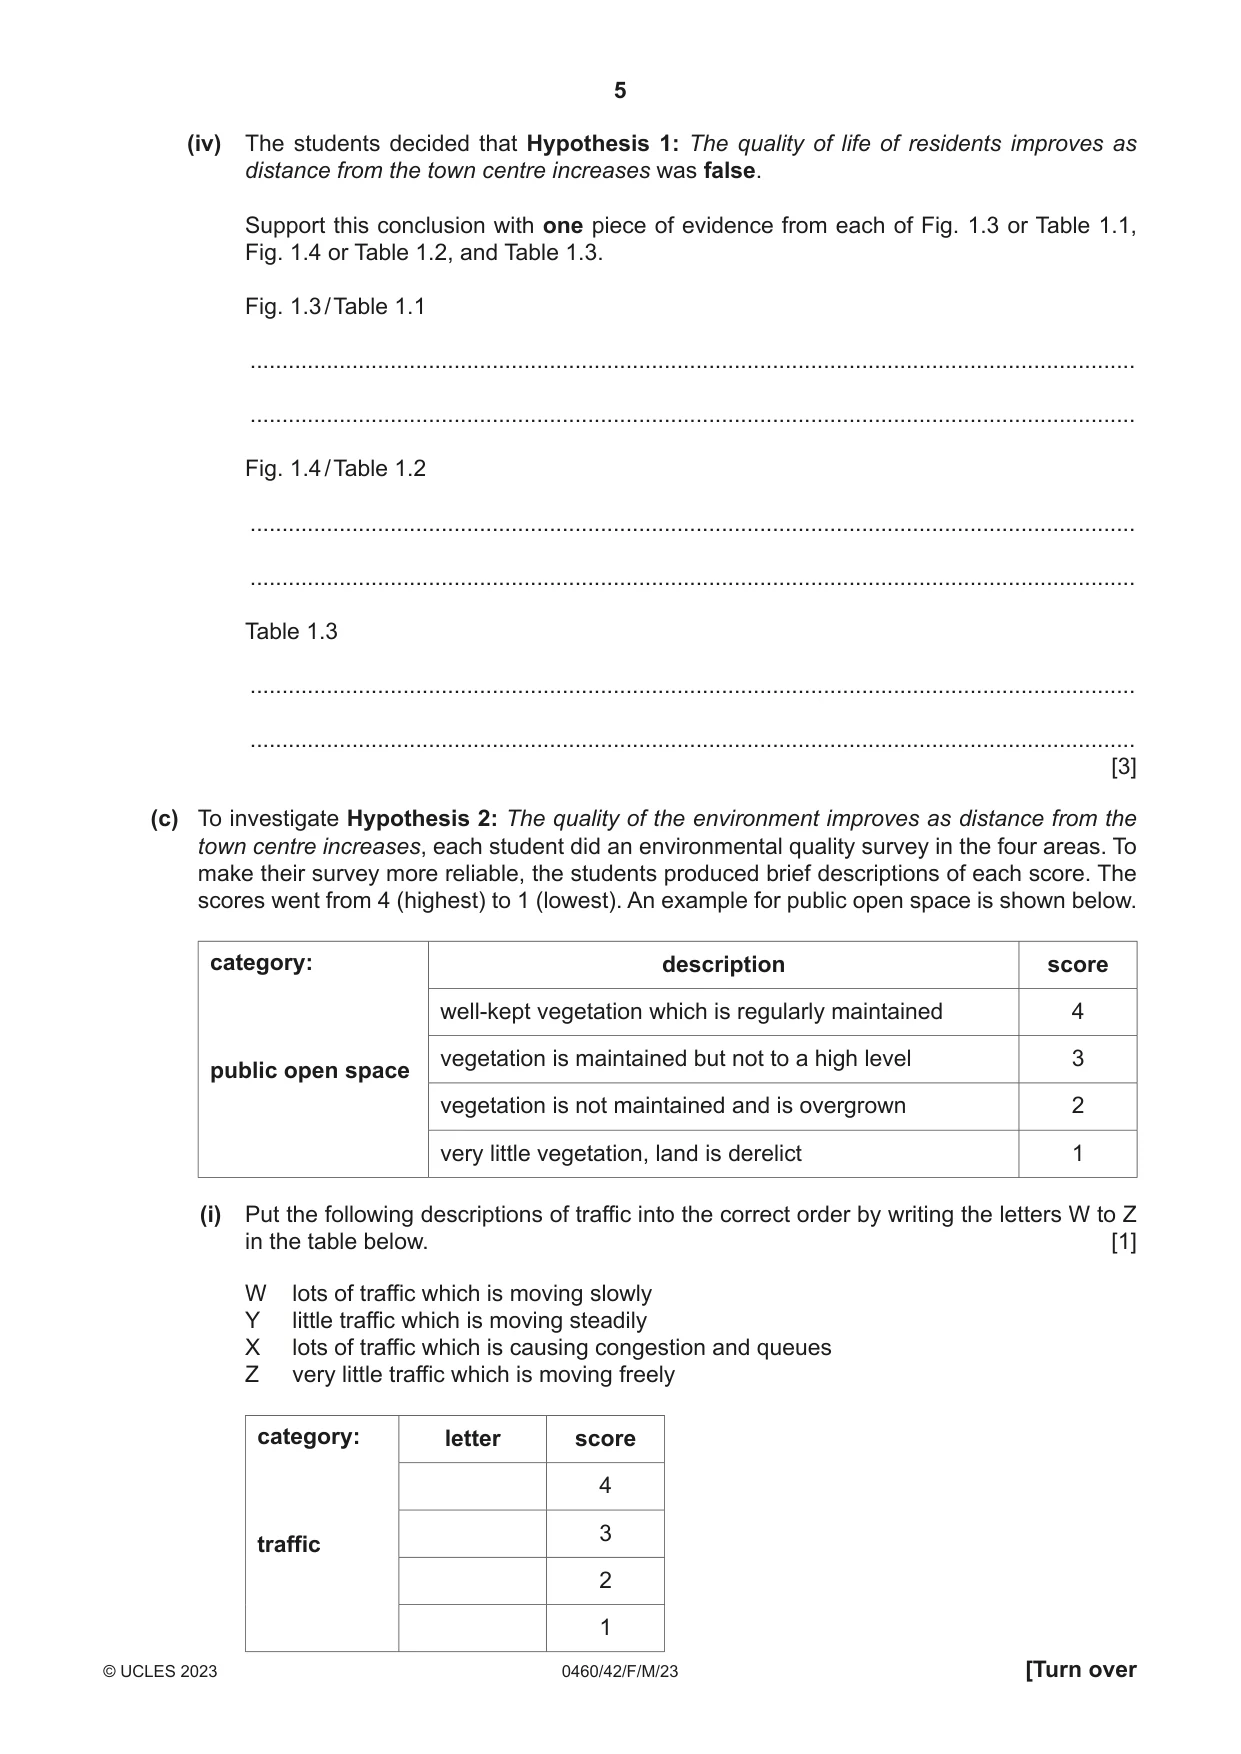
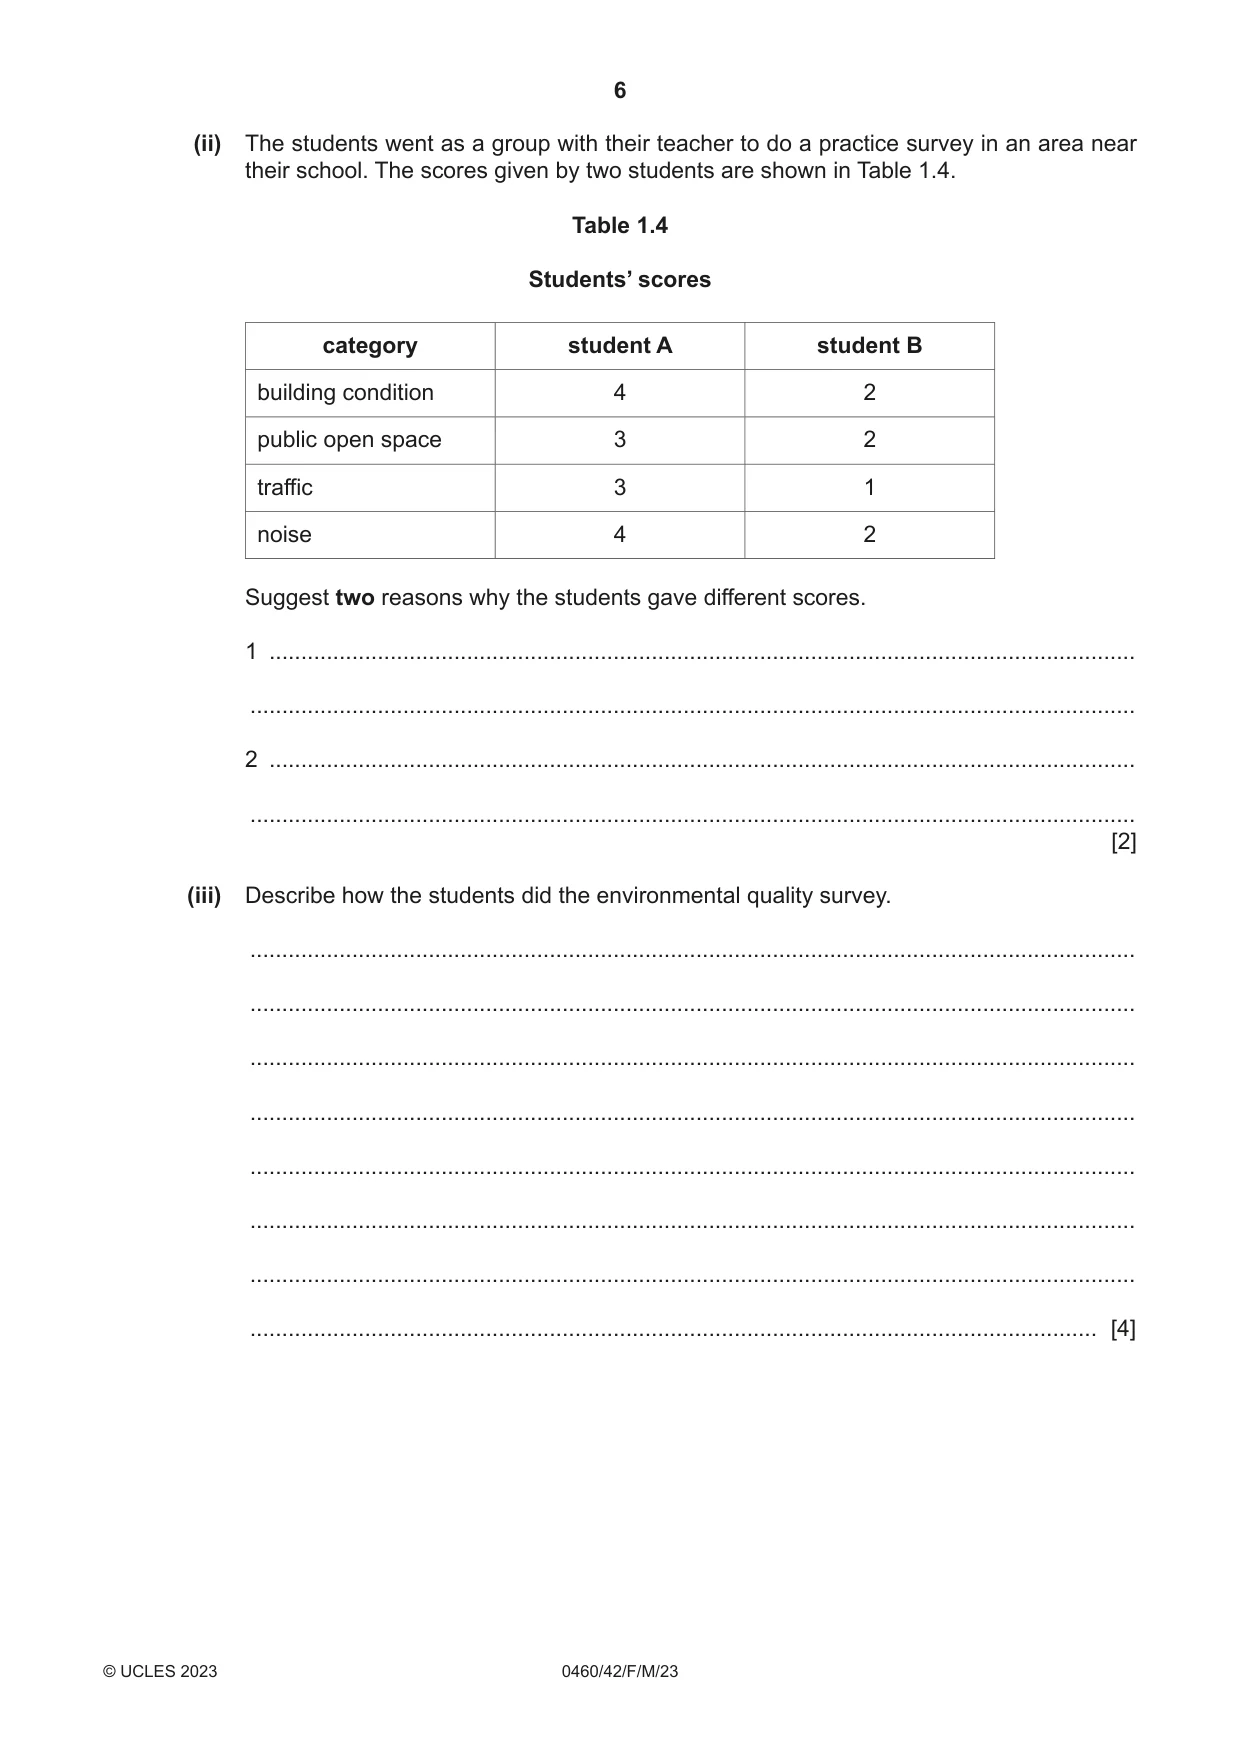
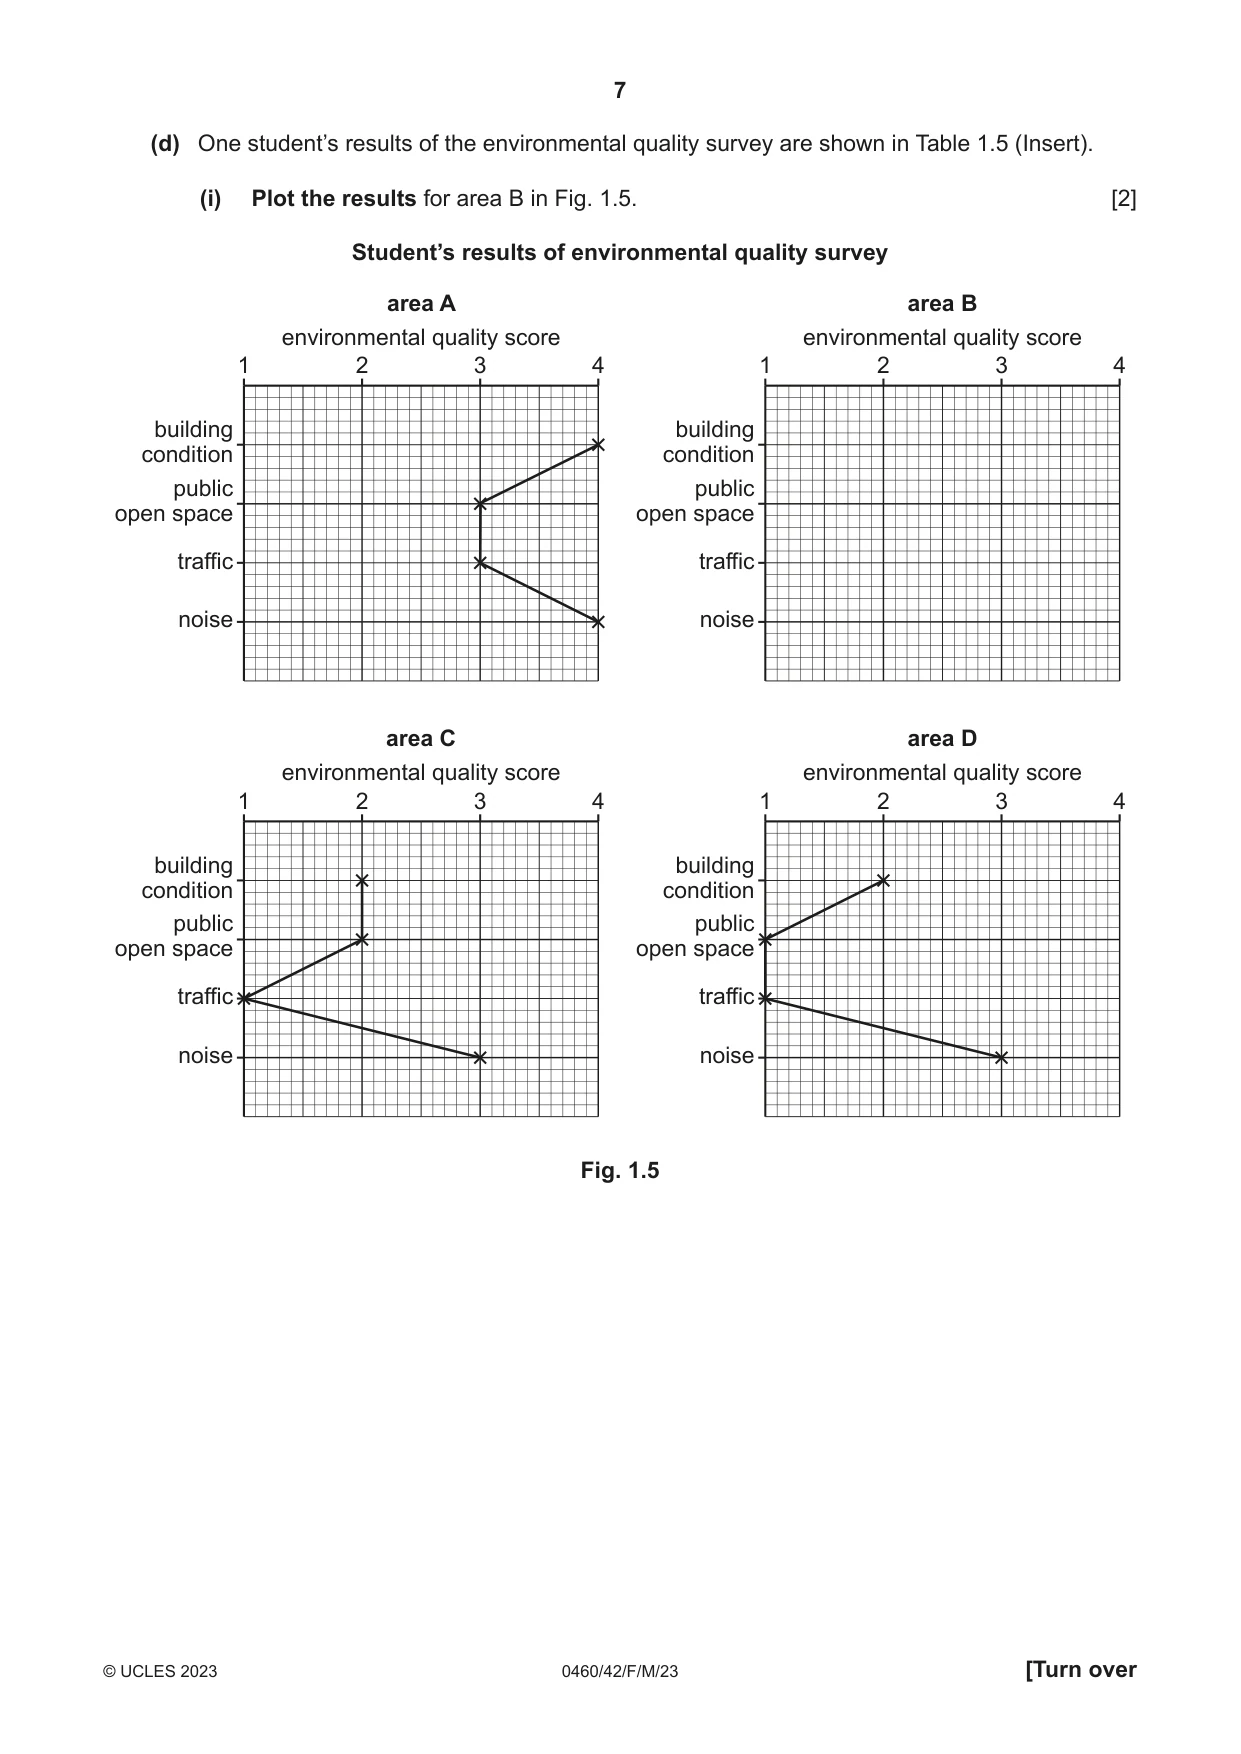
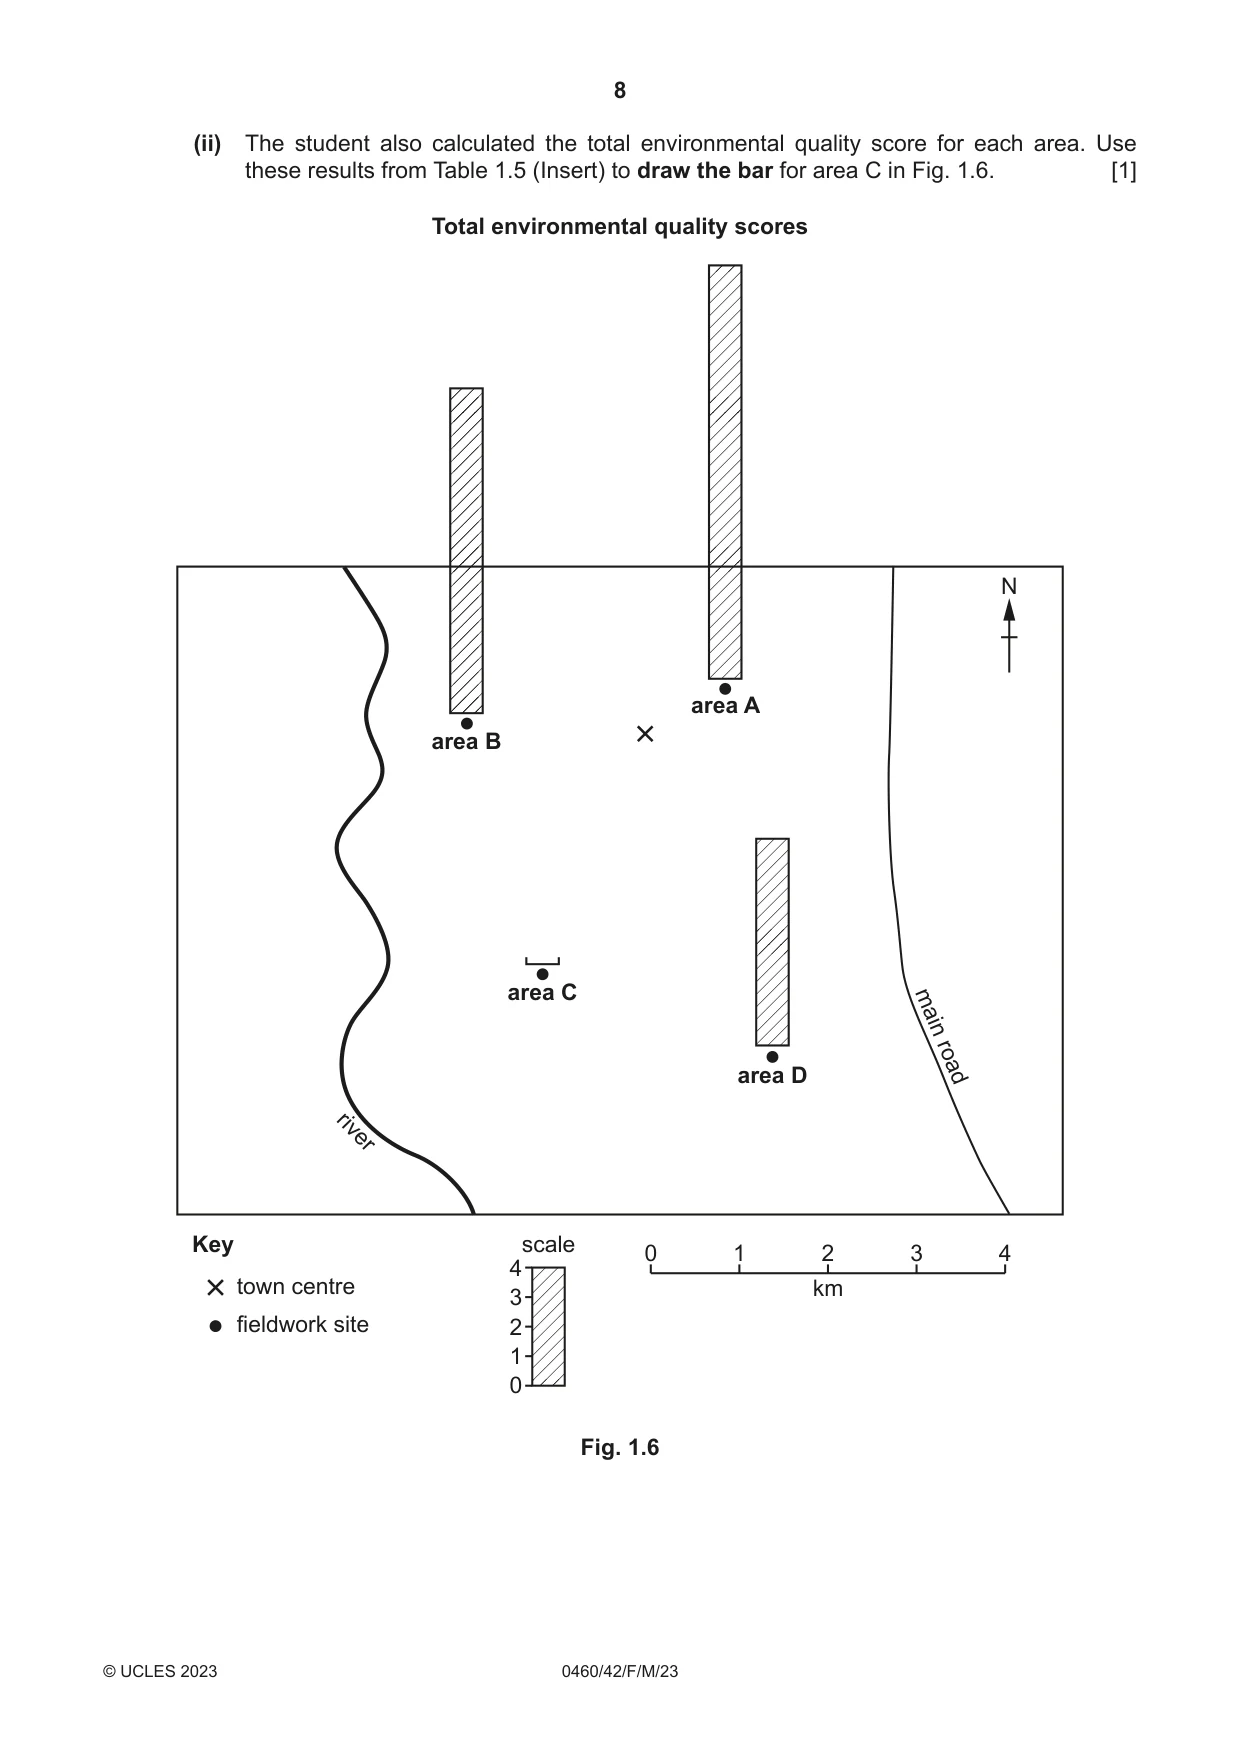
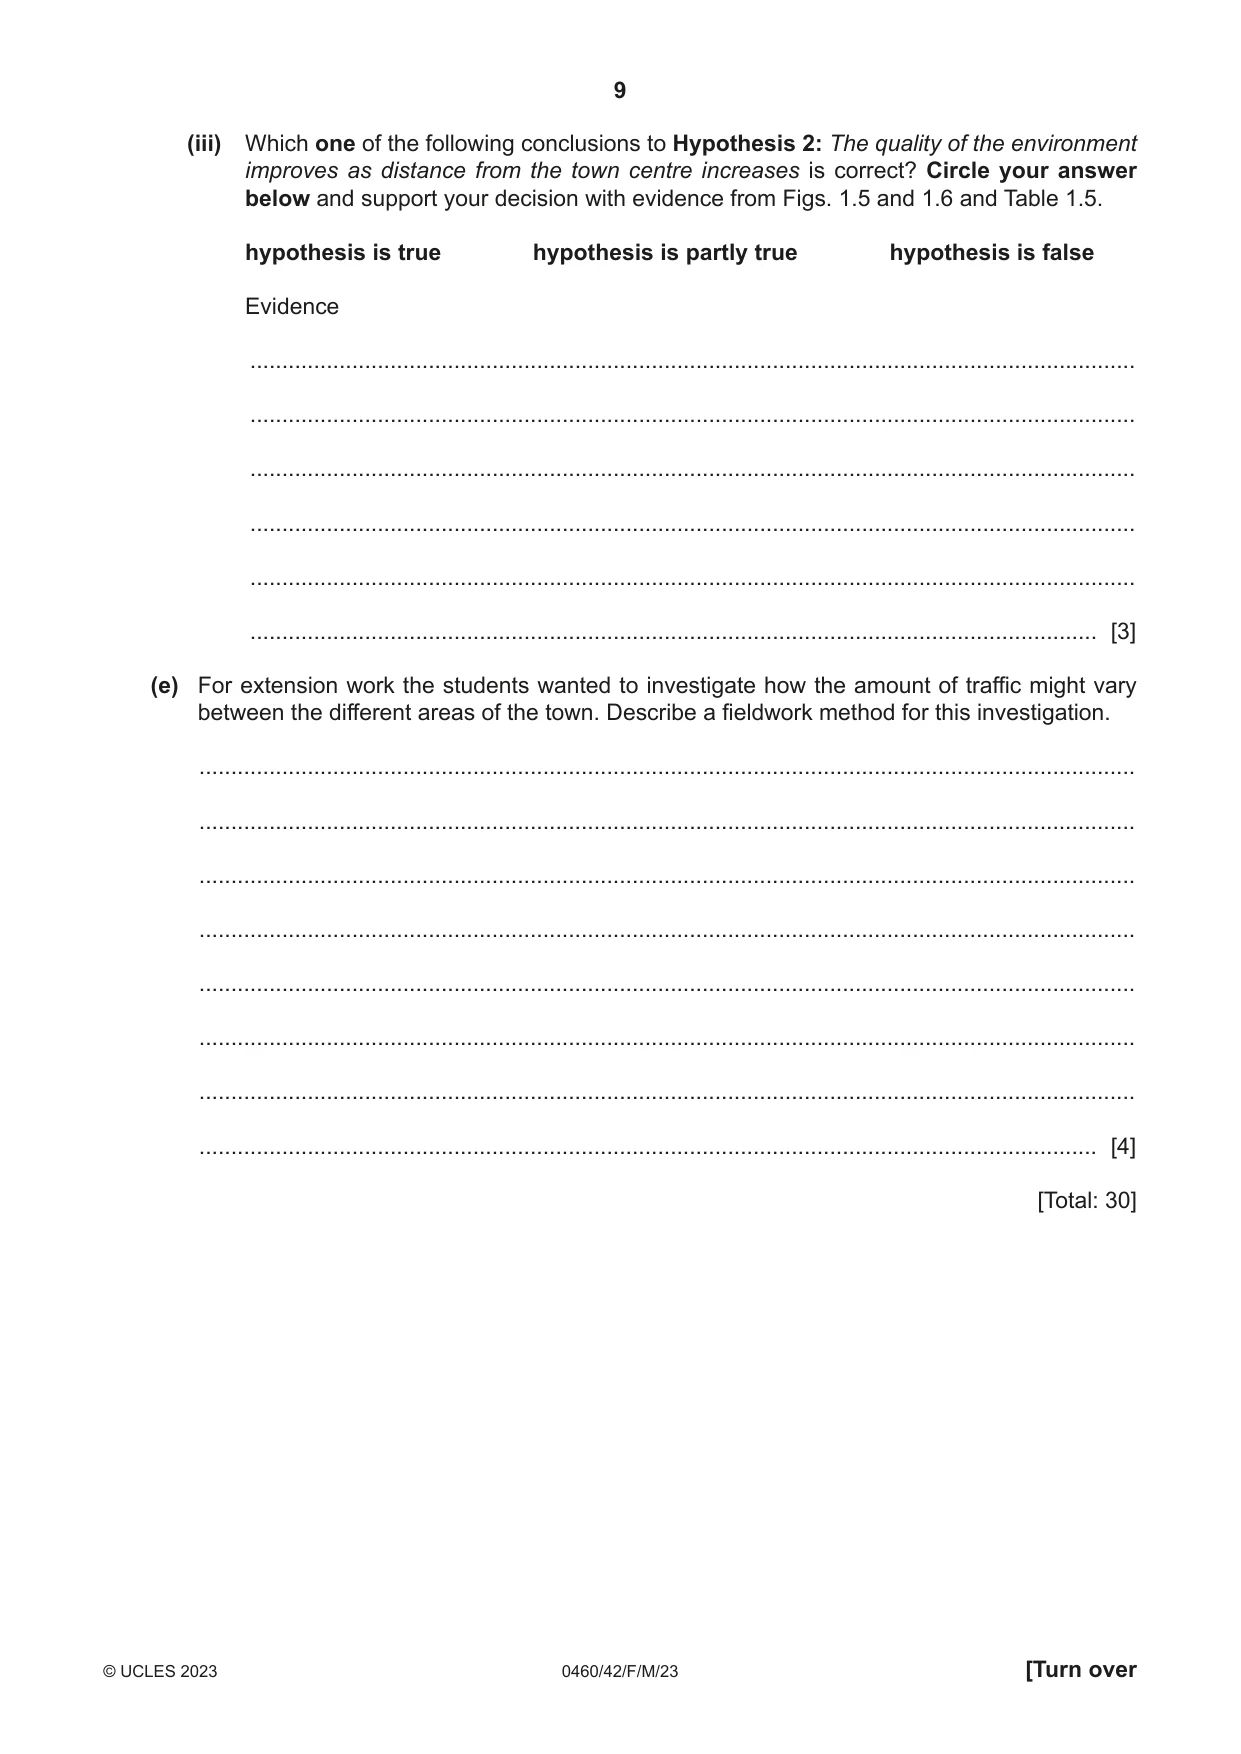
1 Some students in Canada did fieldwork to compare different areas of a local town. They divided their investigation into two parts. First, they investigated what people who lived in the different areas thought about their quality of life, and second, they looked at the environment of different areas. Quality of life is a measurement of a person’s well-being and satisfaction (happiness) which could include things such as safety, community spirit and level of crime. The students chose four fieldwork sites in different areas of the town. These are shown in Fig. 1.1 (Insert). They decided to investigate the following hypotheses: Hypothesis 1: The quality of life of residents improves as distance from the town centre increases. Hypothesis 2: The quality of the environment improves as distance from the town centre increases. (a) To investigate Hypothesis 1: The quality of life of residents improves as distance from the town centre increases, the students asked residents in each area to complete the questionnaire which is shown in Fig. 1.2 (Insert). Name and describe one sampling method the students could use to select 25 people in each area to take part in their survey. Name of sampling method: ....................................................................................................... Description of how the students would use this sampling method: ................................................................................................................................................... ................................................................................................................................................... ................................................................................................................................................... ................................................................................................................................................... ................................................................................................................................................... ............................................................................................................................................. [3] (b) (i) The answers for question 1: How safe do you feel in the local area? are shown in Table 1.1 (Insert). Use these results to complete the pie graph for area D in Fig. 1.3. [2] Answers to question 1: How safe do you feel in the local area? area A area B 0% 0% 90 10 90 10 80 20 80 20 Key 70 30 70 30 very safe 60 40 60 40 safe 50 50 unsafe area C area D very unsafe 0% 0% 90 10 90 10 80 20 80 20 70 30 70 30 60 40 60 40 50 50 Fig. 1.3 (ii) The answers for question 2: Which one of the following best describes the community in the local area? are shown in Fig. 1.4. Use the results in Table 1.2 (Insert) to complete the graph for area C in Fig. 1.4. [2] Answers to question 2: Which one of the following best describes the community in the local area? % 0 10 20 30 40 50 60 70 80 90 100 area A area B area C area D 0 10 20 30 40 50 60 70 80 90 100 % Key people care for others people are friendly people do not mix people are unfriendly people are hostile Fig. 1.4 (iii) The answers for question 3: Which of the following crimes have you been a victim of? are shown in Table 1.3 (Insert). Use the results of the questionnaire to identify in which of the four areas residents feel safest (Table 1.1) area .......... think they have the best community (Table 1.2) area .......... have been the victim of least crime (Table 1.3) area .......... [3] (iv) The students decided that Hypothesis 1: The quality of life of residents improves as distance from the town centre increases was false. Support this conclusion with one piece of evidence from each of Fig. 1.3 or Table 1.1, Fig. 1.4 or Table 1.2, and Table 1.3. Fig. 1.3 / Table 1.1 ........................................................................................................................................... ........................................................................................................................................... Fig. 1.4 / Table 1.2 ........................................................................................................................................... ........................................................................................................................................... Table 1.3 ........................................................................................................................................... ........................................................................................................................................... [3] (c) To investigate Hypothesis 2: The quality of the environment improves as distance from the town centre increases, each student did an environmental quality survey in the four areas. To make their survey more reliable, the students produced brief descriptions of each score. The scores went from 4 (highest) to 1 (lowest). An example for public open space is shown below. category: description score well-kept vegetation which is regularly maintained 4 vegetation is maintained but not to a high level 3 public open space vegetation is not maintained and is overgrown 2 very little vegetation, land is derelict 1 (i) Put the following descriptions of traffic into the correct order by writing the letters W to Z in the table below. [1] W lots of traffic which is moving slowly Y little traffic which is moving steadily X lots of traffic which is causing congestion and queues Z very little traffic which is moving freely category: letter score 4 3 traffic 2 1 (ii) The students went as a group with their teacher to do a practice survey in an area near their school. The scores given by two students are shown in Table 1.4. Table 1.4 Students’ scores category student A student B building condition 4 2 public open space 3 2 traffic 3 1 noise 4 2 Suggest two reasons why the students gave different scores. 1 ........................................................................................................................................ ........................................................................................................................................... 2 ........................................................................................................................................ ........................................................................................................................................... [2] (iii) Describe how the students did the environmental quality survey. ........................................................................................................................................... ........................................................................................................................................... ........................................................................................................................................... ........................................................................................................................................... ........................................................................................................................................... ........................................................................................................................................... ........................................................................................................................................... ..................................................................................................................................... [4] (d) One student’s results of the environmental quality survey are shown in Table 1.5 (Insert). (i) Plot the results for area B in Fig. 1.5. [2] Student’s results of environmental quality survey area A area B environmental quality score environmental quality score 1 2 3 4 1 2 3 4 building building condition condition public public open space open space traffic traffic noise noise area C area D environmental quality score environmental quality score 1 2 3 4 1 2 3 4 building building condition condition public public open space open space traffic traffic noise noise Fig. 1.5 (ii) The student also calculated the total environmental quality score for each area. Use these results from Table 1.5 (Insert) to draw the bar for area C in Fig. 1.6. [1] Total environmental quality scores N area A area B area C main area D road river Key scale 0 1 2 3 4 4 town centre km 3 fieldwork site 2 1 0 Fig. 1.6 (iii) Which one of the following conclusions to Hypothesis 2: The quality of the environment improves as distance from the town centre increases is correct? Circle your answer below and support your decision with evidence from Figs. 1.5 and 1.6 and Table 1.5. hypothesis is true hypothesis is partly true hypothesis is false Evidence ........................................................................................................................................... ........................................................................................................................................... ........................................................................................................................................... ........................................................................................................................................... ........................................................................................................................................... ..................................................................................................................................... [3] (e) For extension work the students wanted to investigate how the amount of traffic might vary between the different areas of the town. Describe a fieldwork method for this investigation. ................................................................................................................................................... ................................................................................................................................................... ................................................................................................................................................... ................................................................................................................................................... ................................................................................................................................................... ................................................................................................................................................... ................................................................................................................................................... ............................................................................................................................................. [4] [Total: 30]
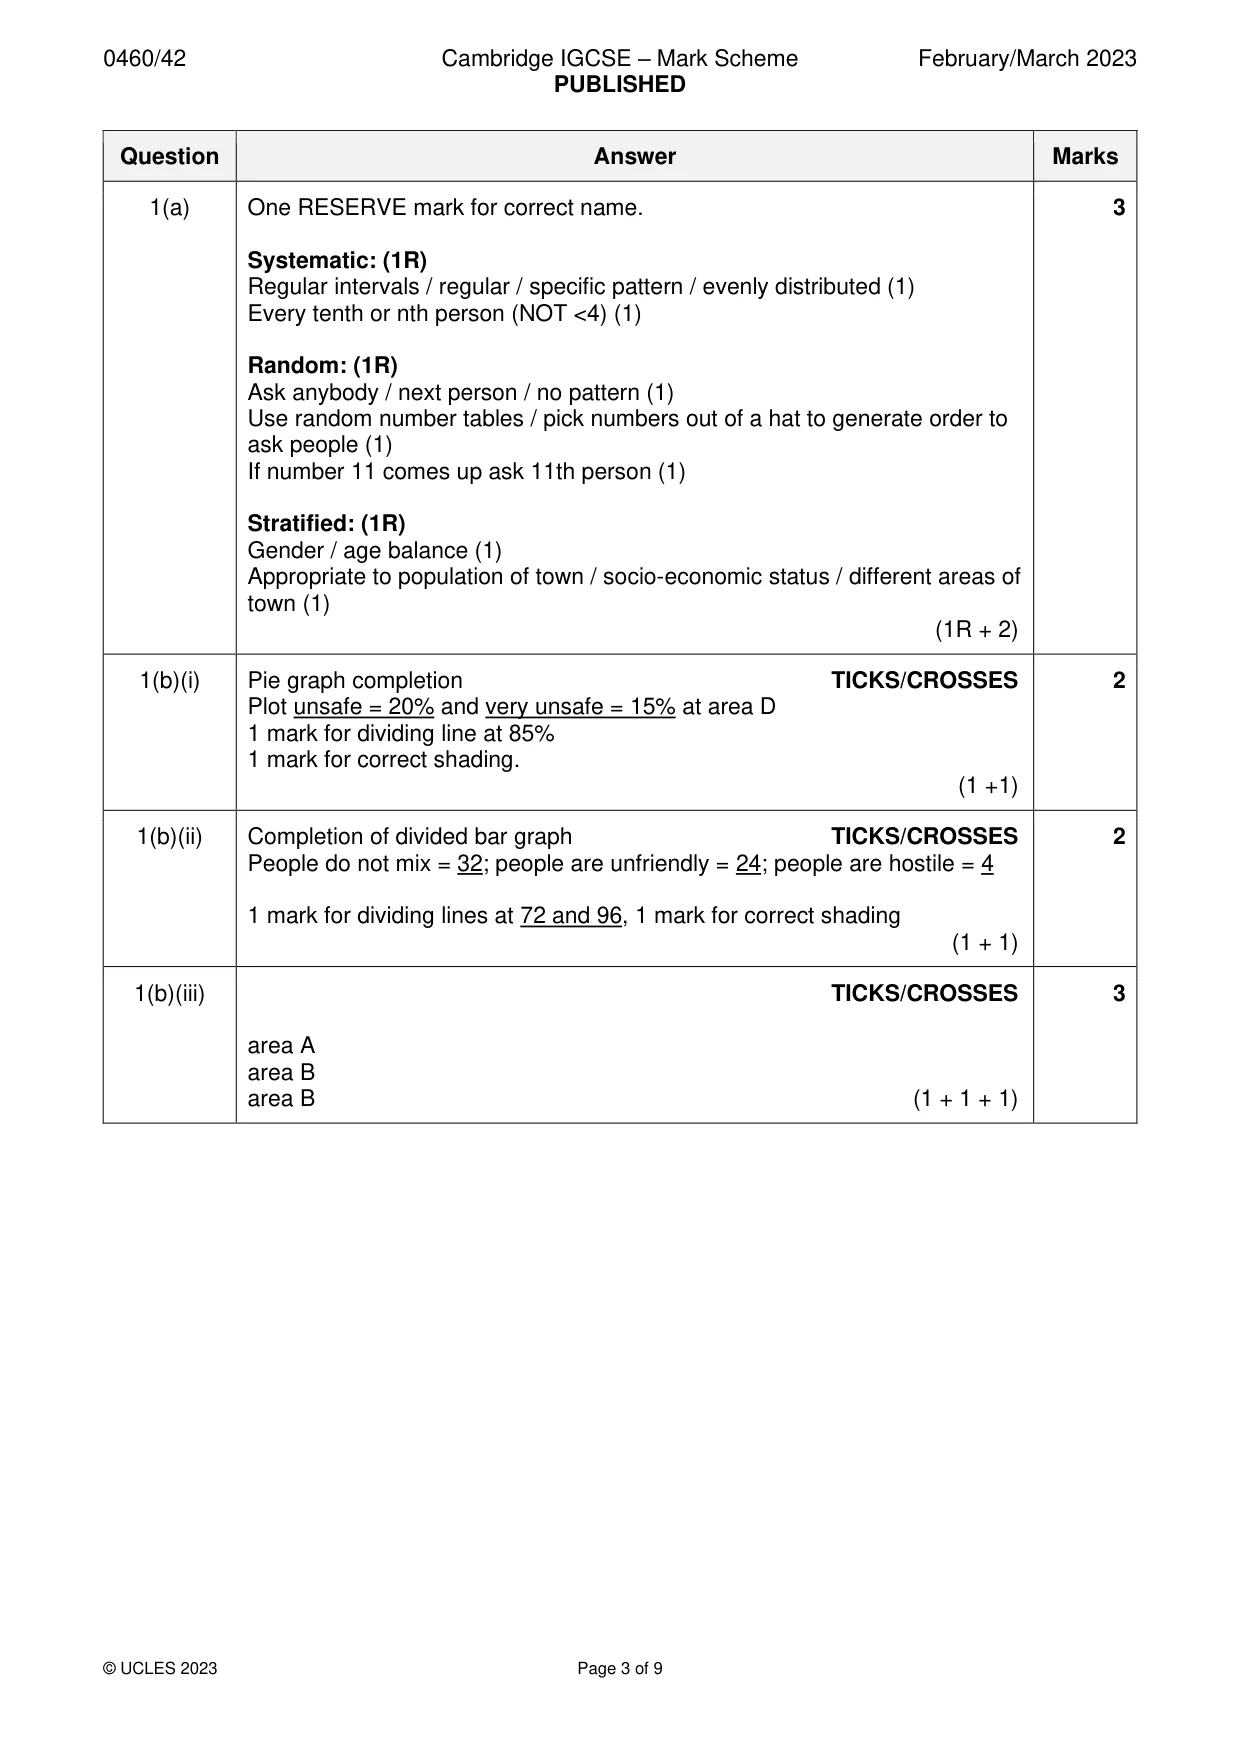
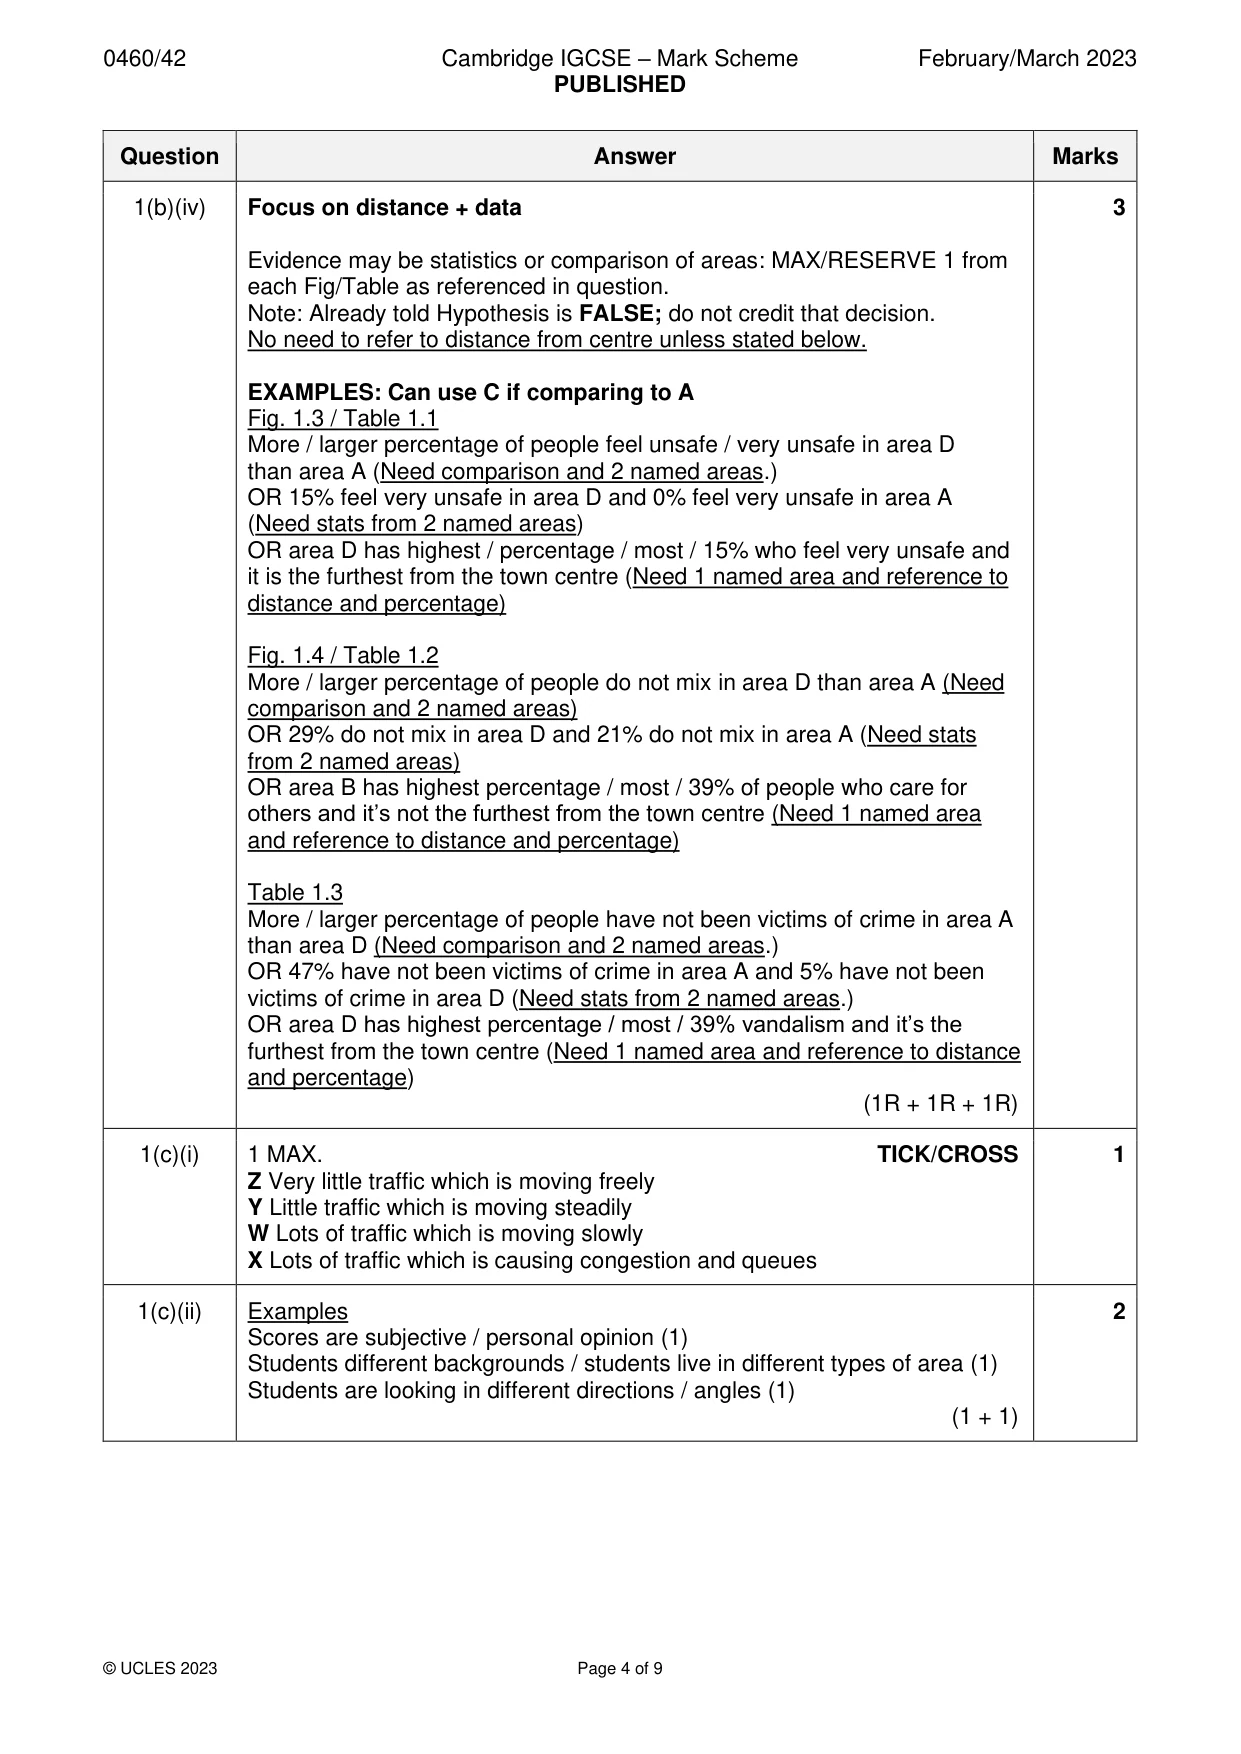
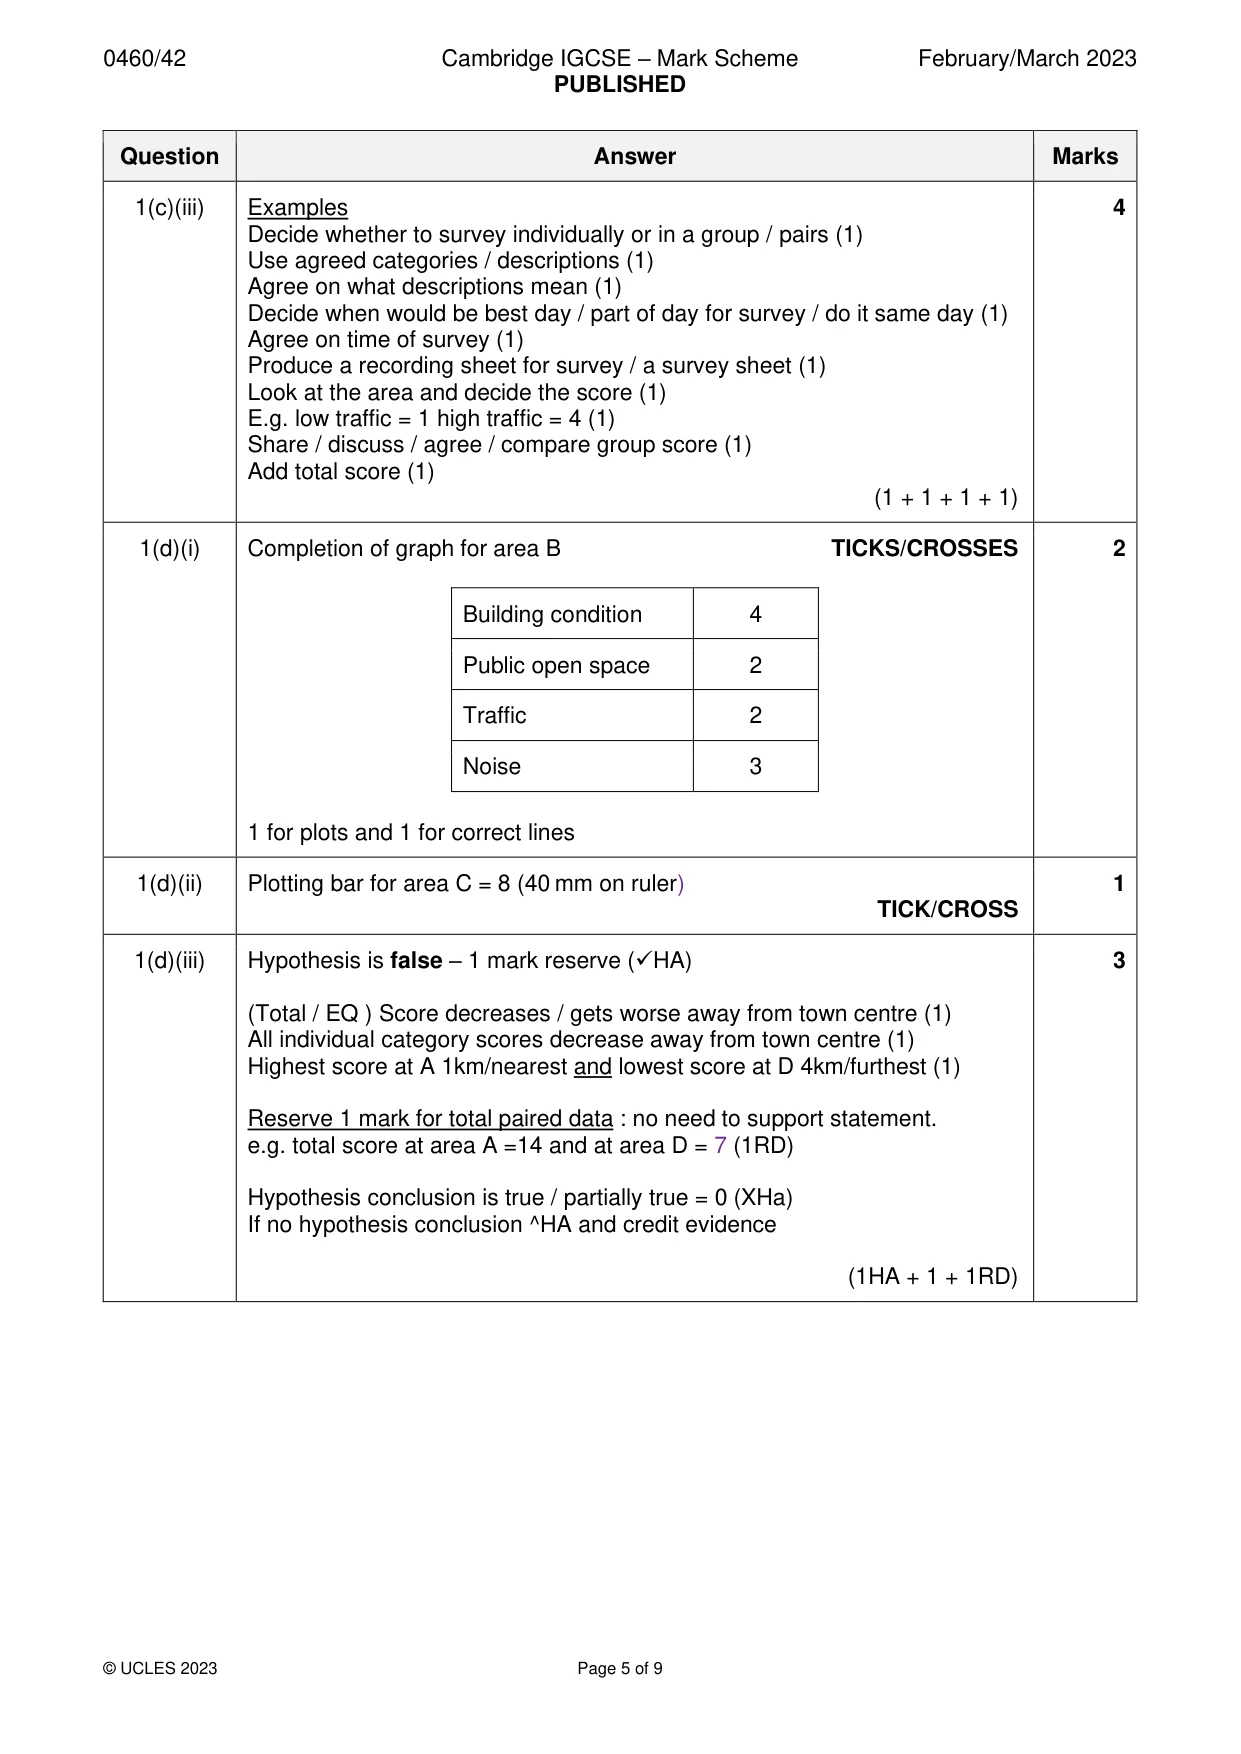
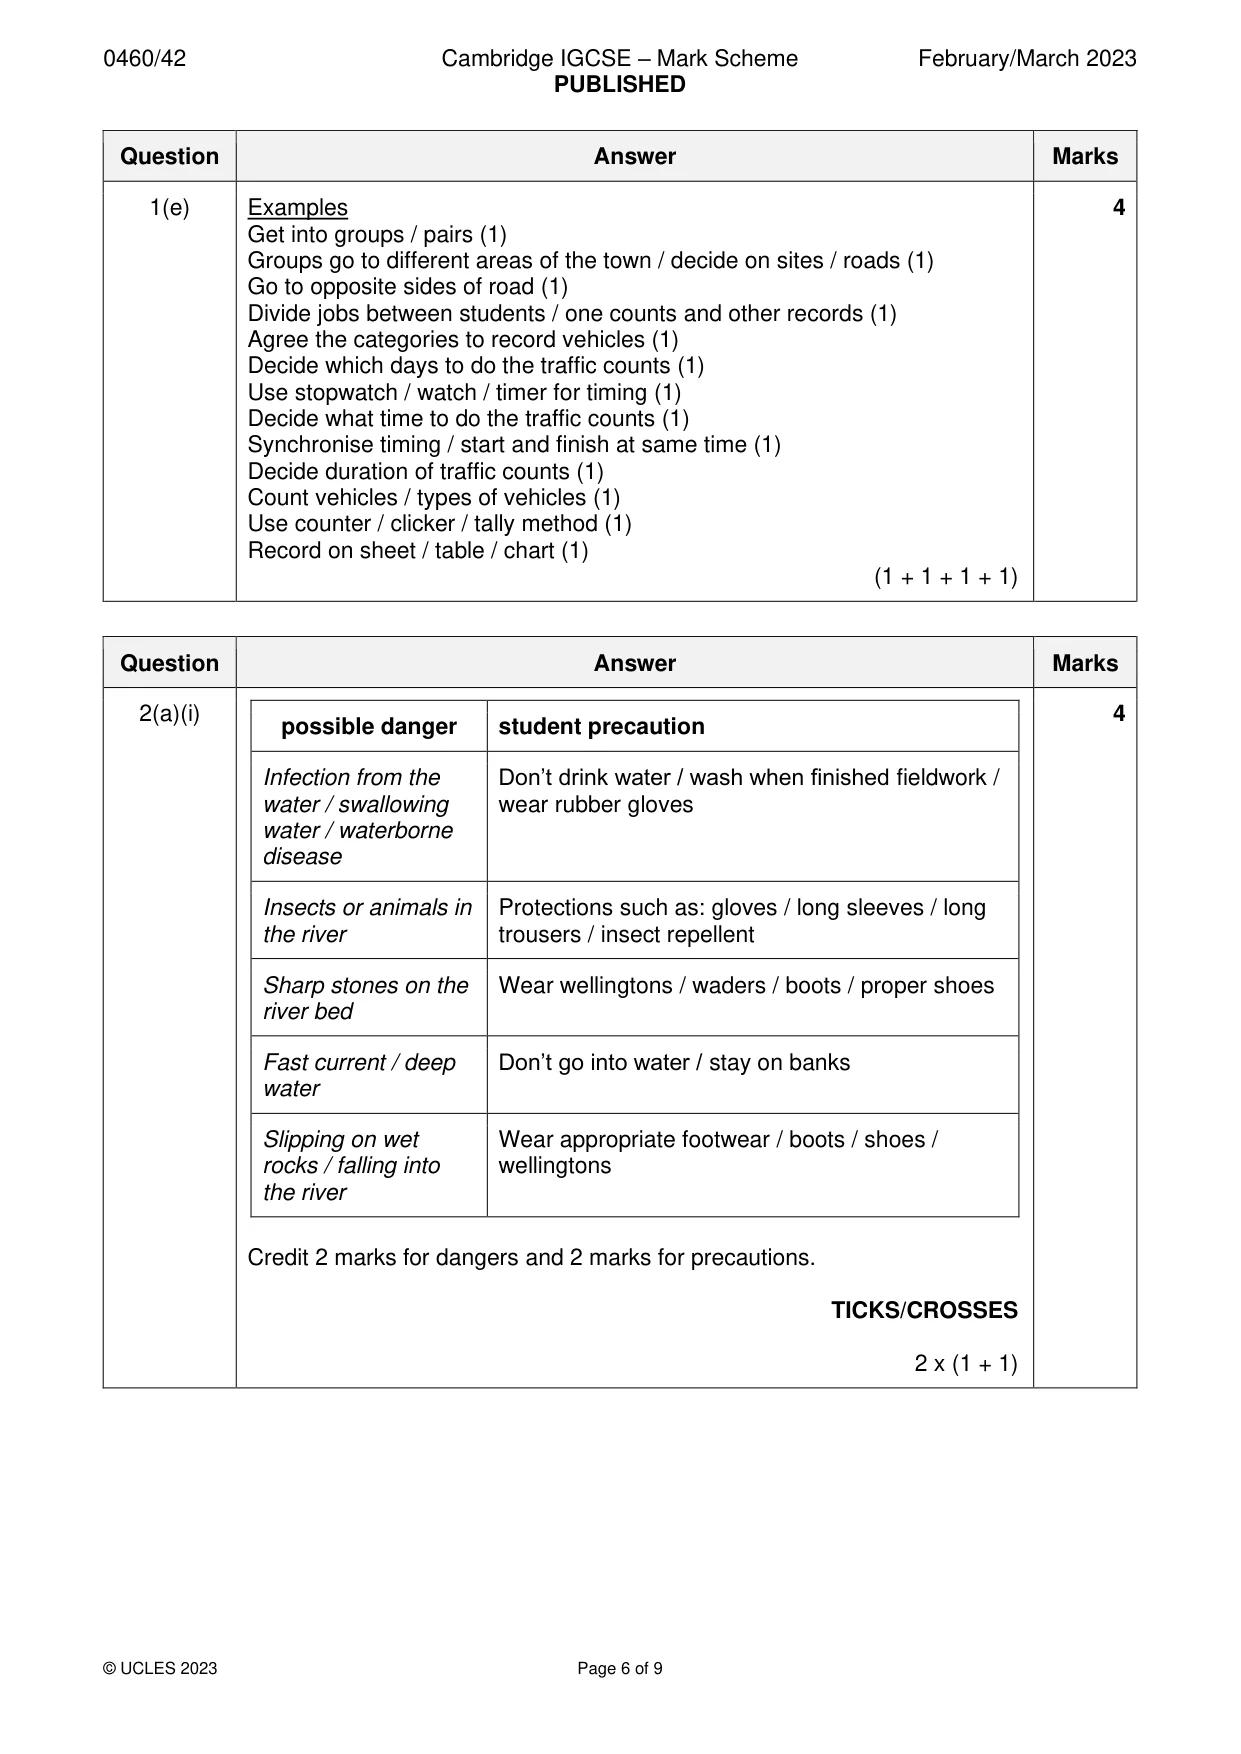
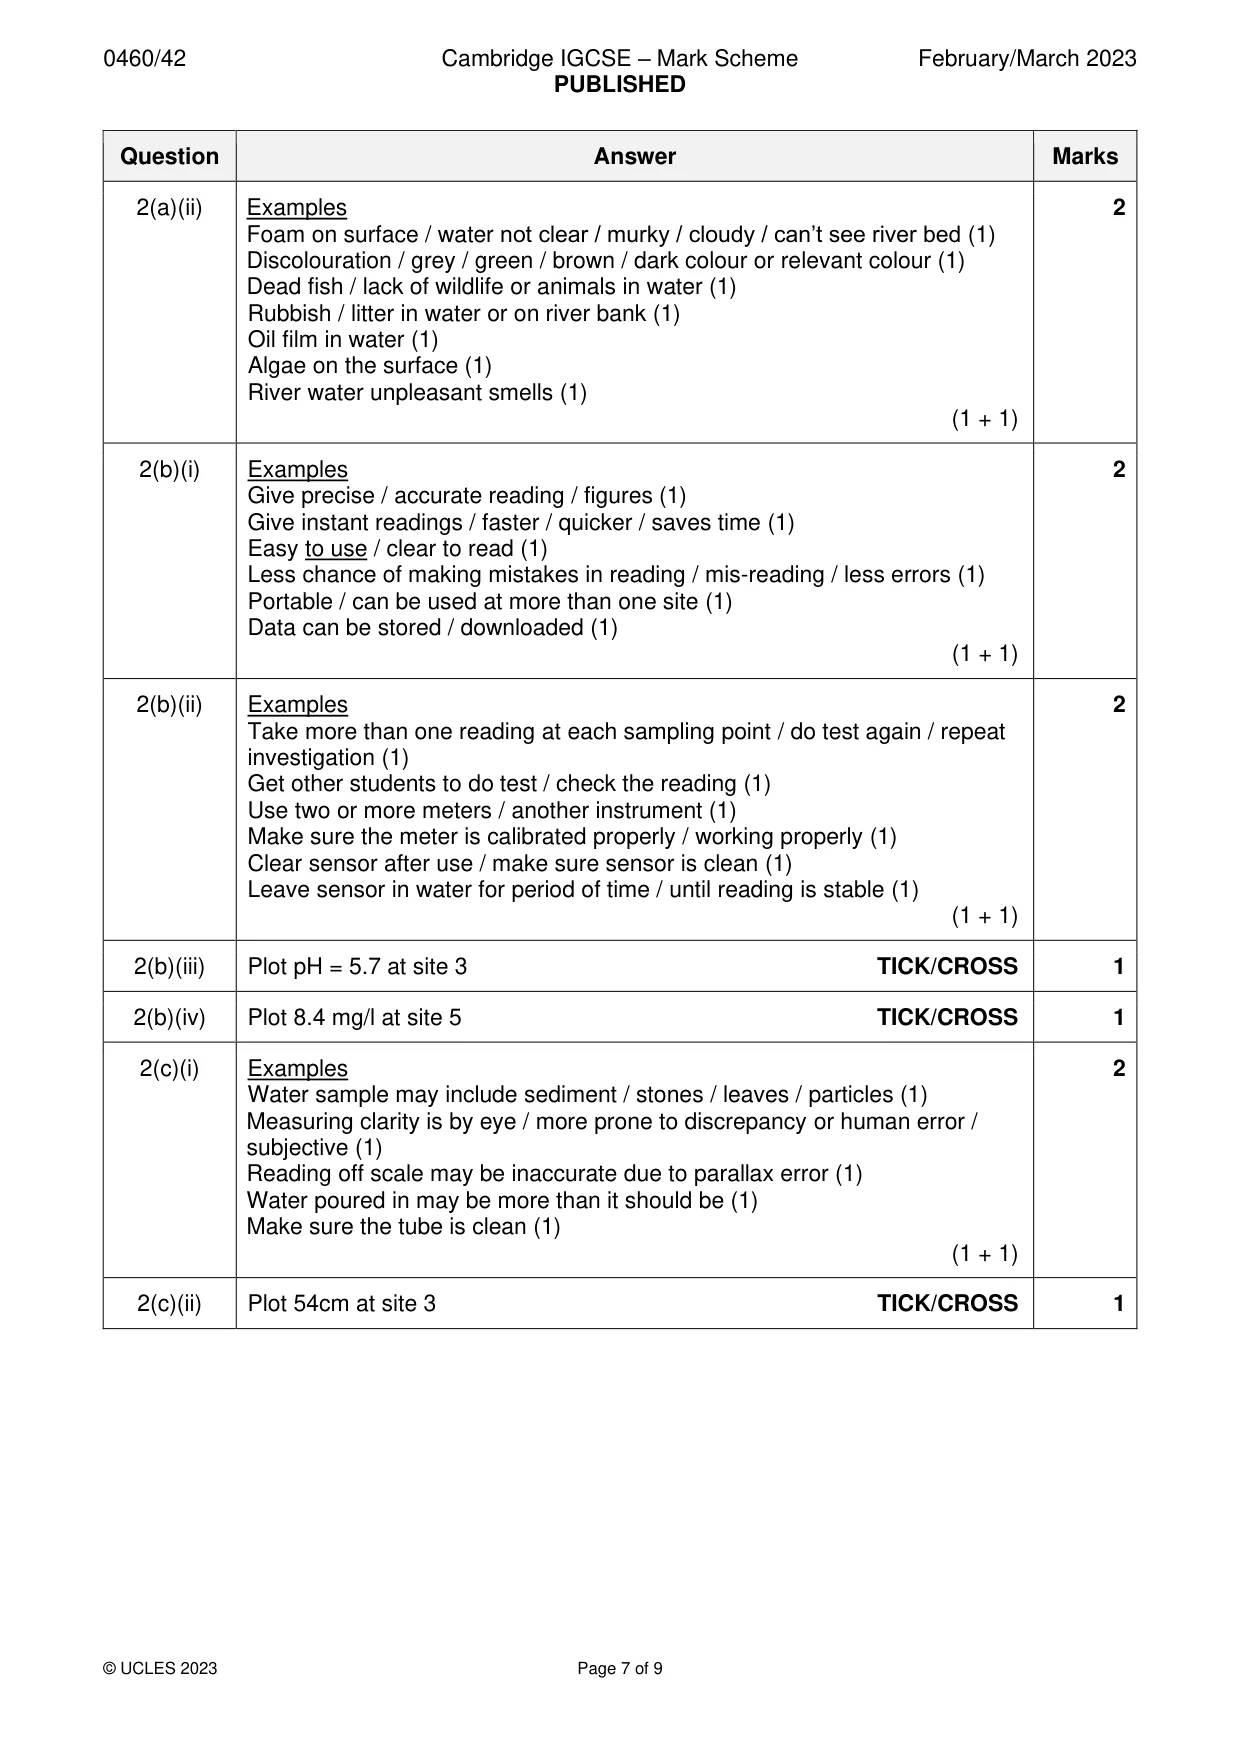
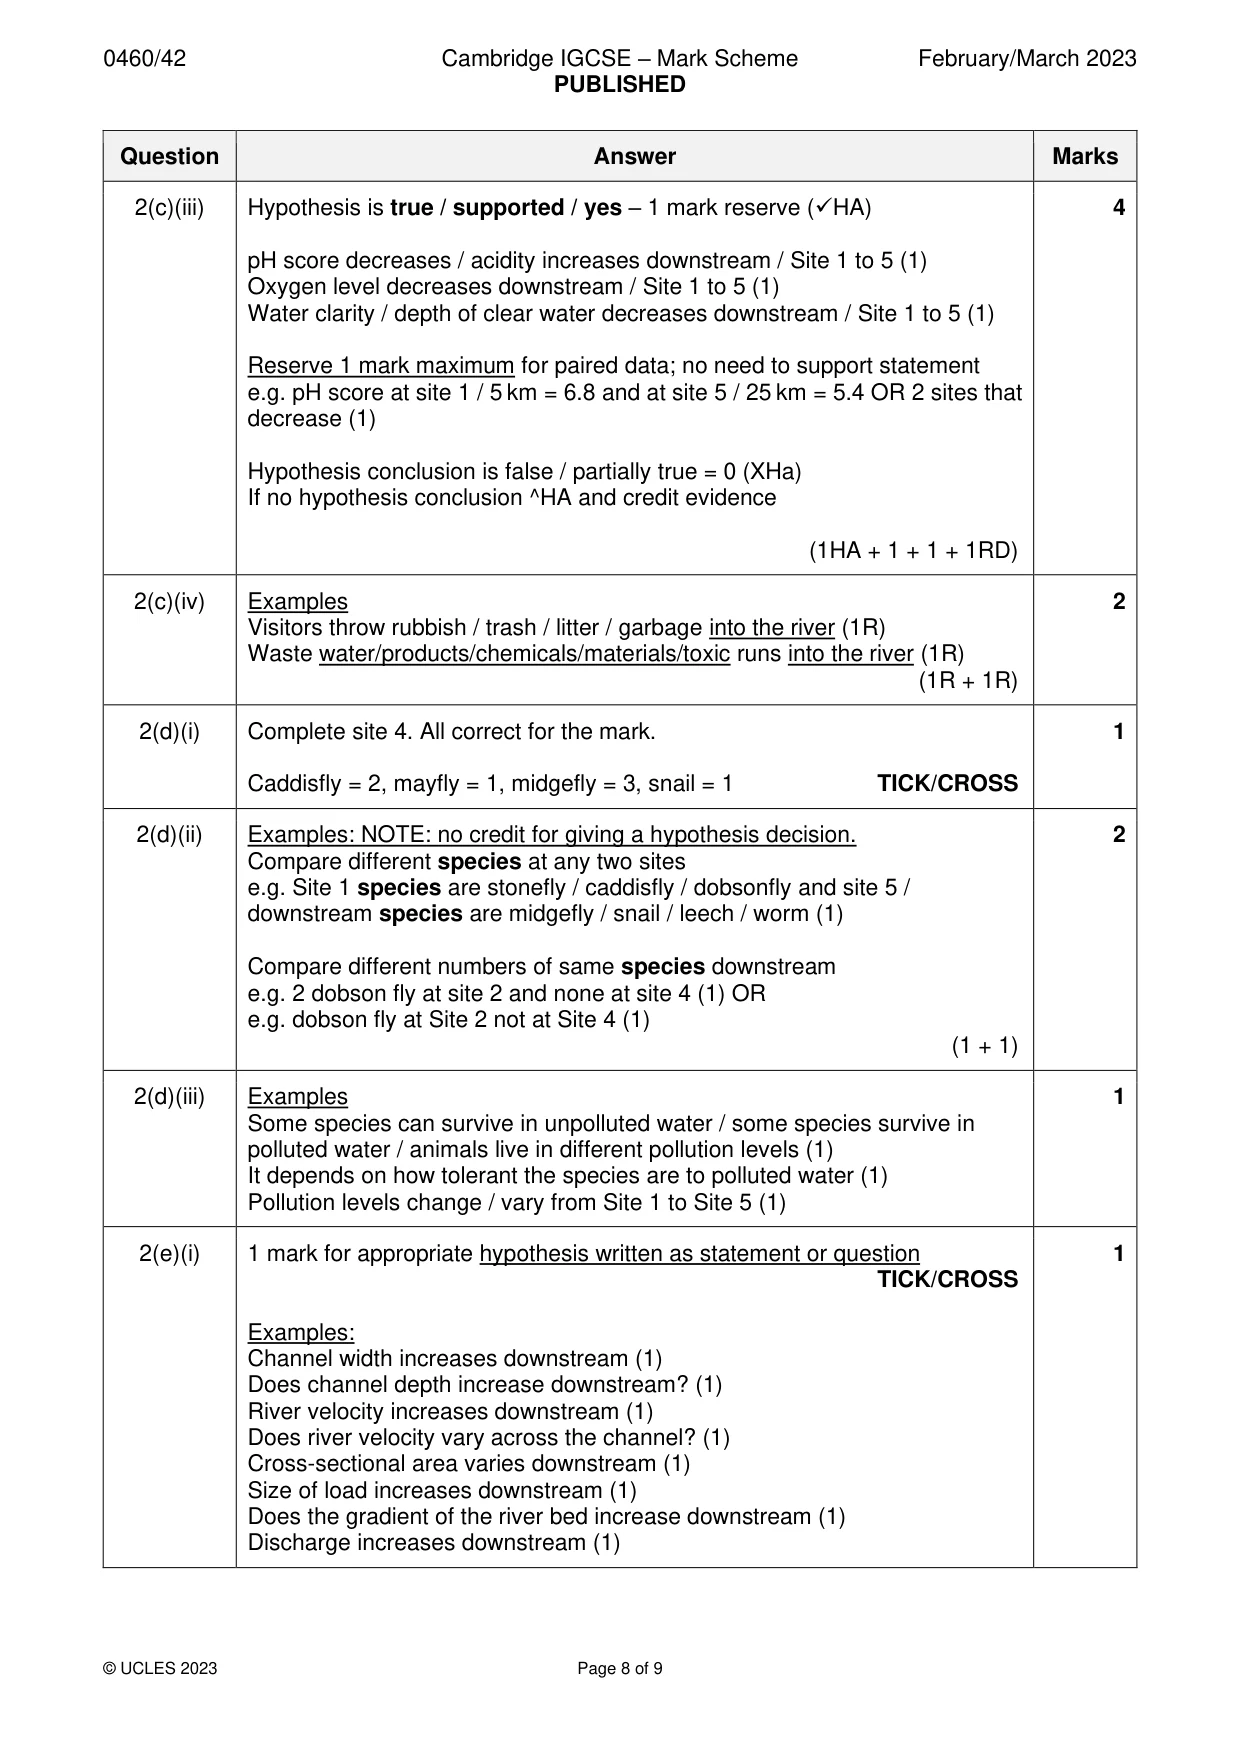
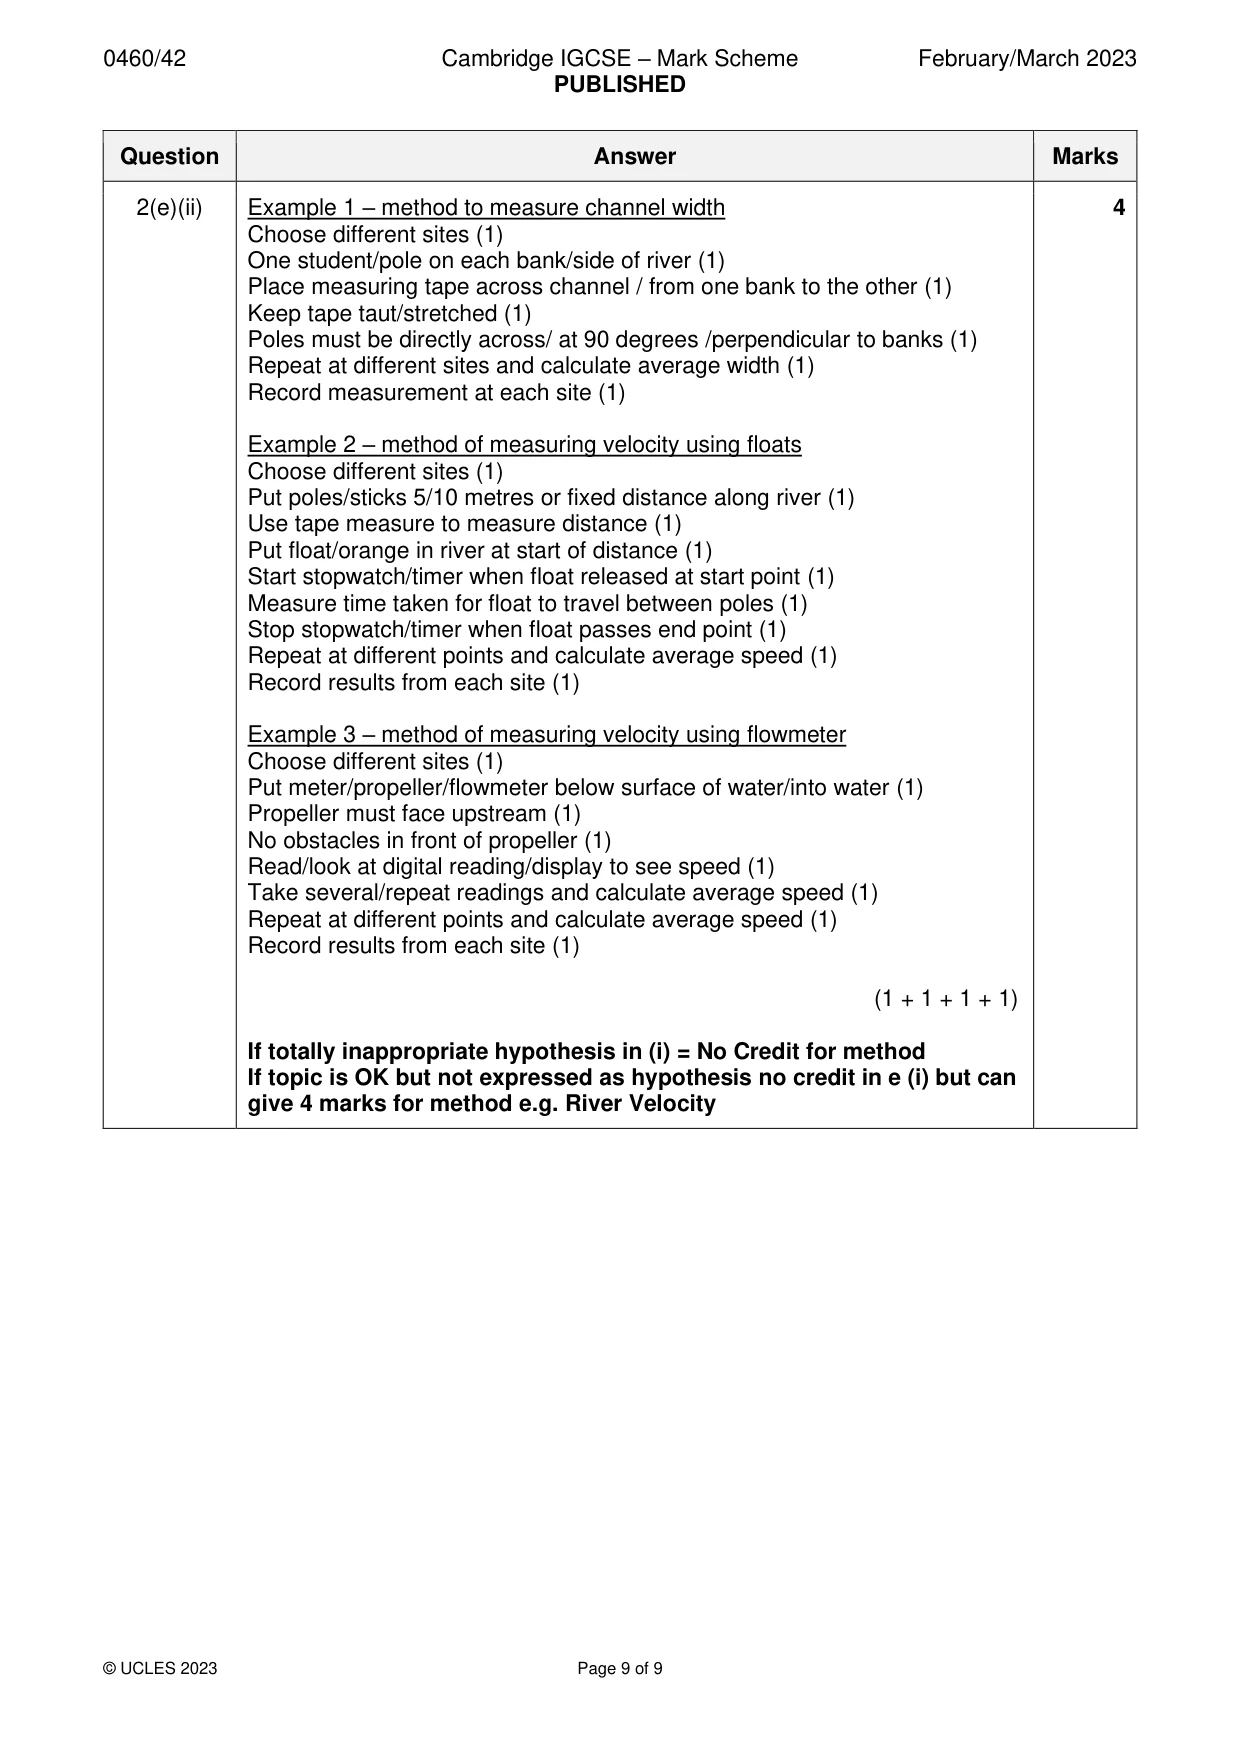
Mark scheme: Question Answer Marks 1(a) One RESERVE mark for correct name. 3 Systematic: (1R) Regular intervals / regular / specific pattern / evenly distributed (1) Every tenth or nth person (NOT <4) (1) Random: (1R) Ask anybody / next person / no pattern (1) Use random number tables / pick numbers out of a hat to generate order to ask people (1) If number 11 comes up ask 11th person (1) Stratified: (1R) Gender / age balance (1) Appropriate to population of town / socio-economic status / different areas of town (1) (1R + 2) 1(b)(i) Pie graph completion TICKS/CROSSES 2 Plot unsafe = 20% and very unsafe = 15% at area D 1 mark for dividing line at 85% 1 mark for correct shading. (1 +1) 1(b)(ii) Completion of divided bar graph TICKS/CROSSES 2 People do not mix = 32; people are unfriendly = 24; people are hostile = 4 1 mark for dividing lines at 72 and 96, 1 mark for correct shading (1 + 1) 1(b)(iii) TICKS/CROSSES 3 area A area B area B (1 + 1 + 1) 1(b)(iv) Focus on distance + data 3 Evidence may be statistics or comparison of areas: MAX/RESERVE 1 from each Fig/Table as referenced in question. Note: Already told Hypothesis is FALSE; do not credit that decision. No need to refer to distance from centre unless stated below. EXAMPLES: Can use C if comparing to A Fig. 1.3 / Table 1.1 More / larger percentage of people feel unsafe / very unsafe in area D than area A (Need comparison and 2 named areas.) OR 15% feel very unsafe in area D and 0% feel very unsafe in area A (Need stats from 2 named areas) OR area D has highest / percentage / most / 15% who feel very unsafe and it is the furthest from the town centre (Need 1 named area and reference to distance and percentage) Fig. 1.4 / Table 1.2 More / larger percentage of people do not mix in area D than area A (Need comparison and 2 named areas) OR 29% do not mix in area D and 21% do not mix in area A (Need stats from 2 named areas) OR area B has highest percentage / most / 39% of people who care for others and it’s not the furthest from the town centre (Need 1 named area and reference to distance and percentage) Table 1.3 More / larger percentage of people have not been victims of crime in area A than area D (Need comparison and 2 named areas.) OR 47% have not been victims of crime in area A and 5% have not been victims of crime in area D (Need stats from 2 named areas.) OR area D has highest percentage / most / 39% vandalism and it’s the furthest from the town centre (Need 1 named area and reference to distance and percentage) (1R + 1R + 1R) 1(c)(i) 1 MAX. TICK/CROSS 1 Z Very little traffic which is moving freely Y Little traffic which is moving steadily W Lots of traffic which is moving slowly X Lots of traffic which is causing congestion and queues 1(c)(ii) Examples 2 Scores are subjective / personal opinion (1) Students different backgrounds / students live in different types of area (1) Students are looking in different directions / angles (1) (1 + 1) 1(c)(iii) Examples 4 Decide whether to survey individually or in a group / pairs (1) Use agreed categories / descriptions (1) Agree on what descriptions mean (1) Decide when would be best day / part of day for survey / do it same day (1) Agree on time of survey (1) Produce a recording sheet for survey / a survey sheet (1) Look at the area and decide the score (1) E.g. low traffic = 1 high traffic = 4 (1) Share / discuss / agree / compare group score (1) Add total score (1) (1 + 1 + 1 + 1) 1(d)(i) Completion of graph for area B TICKS/CROSSES 2 Building condition 4 Public open space 2 Traffic 2 Noise 3 1 for plots and 1 for correct lines 1(d)(ii) Plotting bar for area C = 8 (40 mm on ruler) 1 TICK/CROSS 1(d)(iii) Hypothesis is false – 1 mark reserve (✓HA) 3 (Total / EQ ) Score decreases / gets worse away from town centre (1) All individual category scores decrease away from town centre (1) Highest score at A 1km/nearest and lowest score at D 4km/furthest (1) Reserve 1 mark for total paired data : no need to support statement. e.g. total score at area A =14 and at area D = 7 (1RD) Hypothesis conclusion is true / partially true = 0 (XHa) If no hypothesis conclusion ^HA and credit evidence (1HA + 1 + 1RD) 1(e) Examples 4 Get into groups / pairs (1) Groups go to different areas of the town / decide on sites / roads (1) Go to opposite sides of road (1) Divide jobs between students / one counts and other records (1) Agree the categories to record vehicles (1) Decide which days to do the traffic counts (1) Use stopwatch / watch / timer for timing (1) Decide what time to do the traffic counts (1) Synchronise timing / start and finish at same time (1) Decide duration of traffic counts (1) Count vehicles / types of vehicles (1) Use counter / clicker / tally method (1) Record on sheet / table / chart (1) (1 + 1 + 1 + 1)
Q2 · Students in Norfolk, UK, read a newspaper report about water pollution in a local river
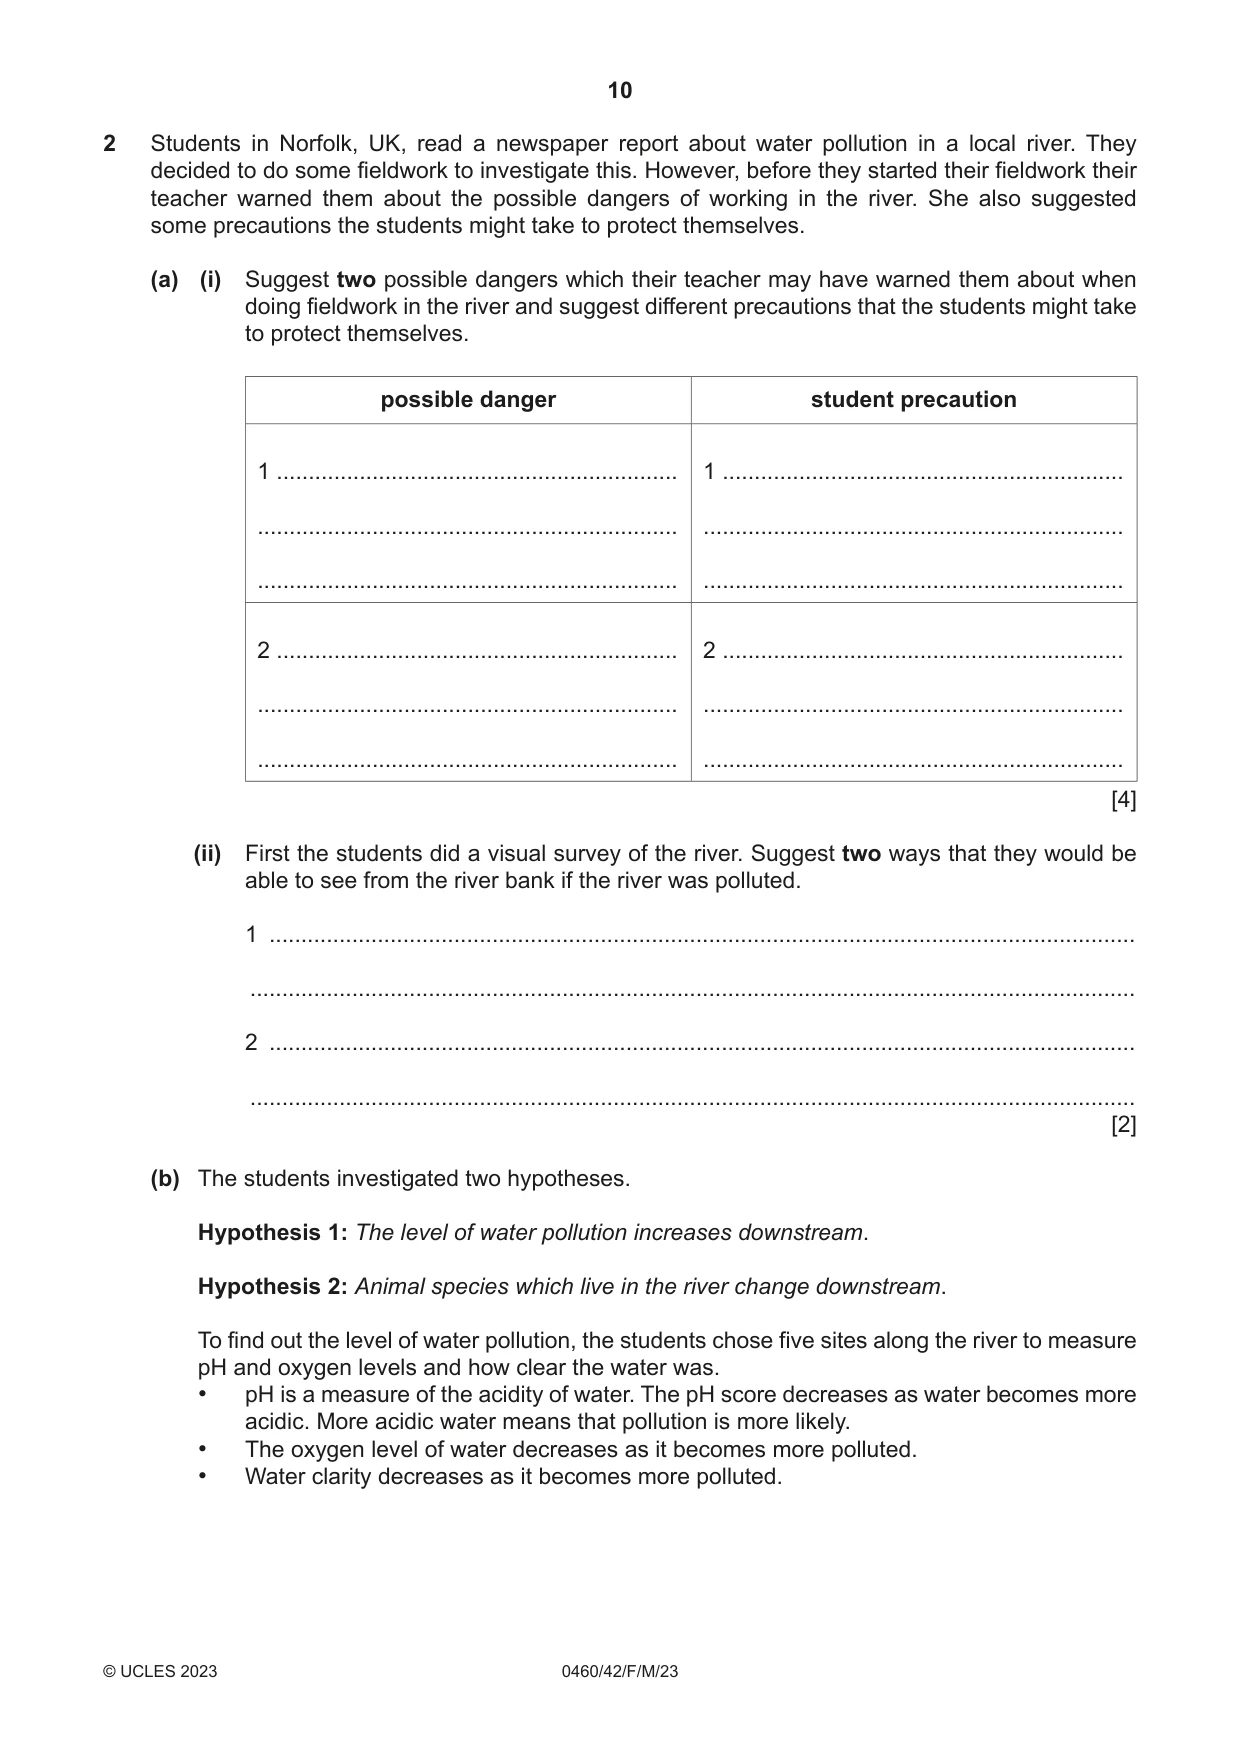
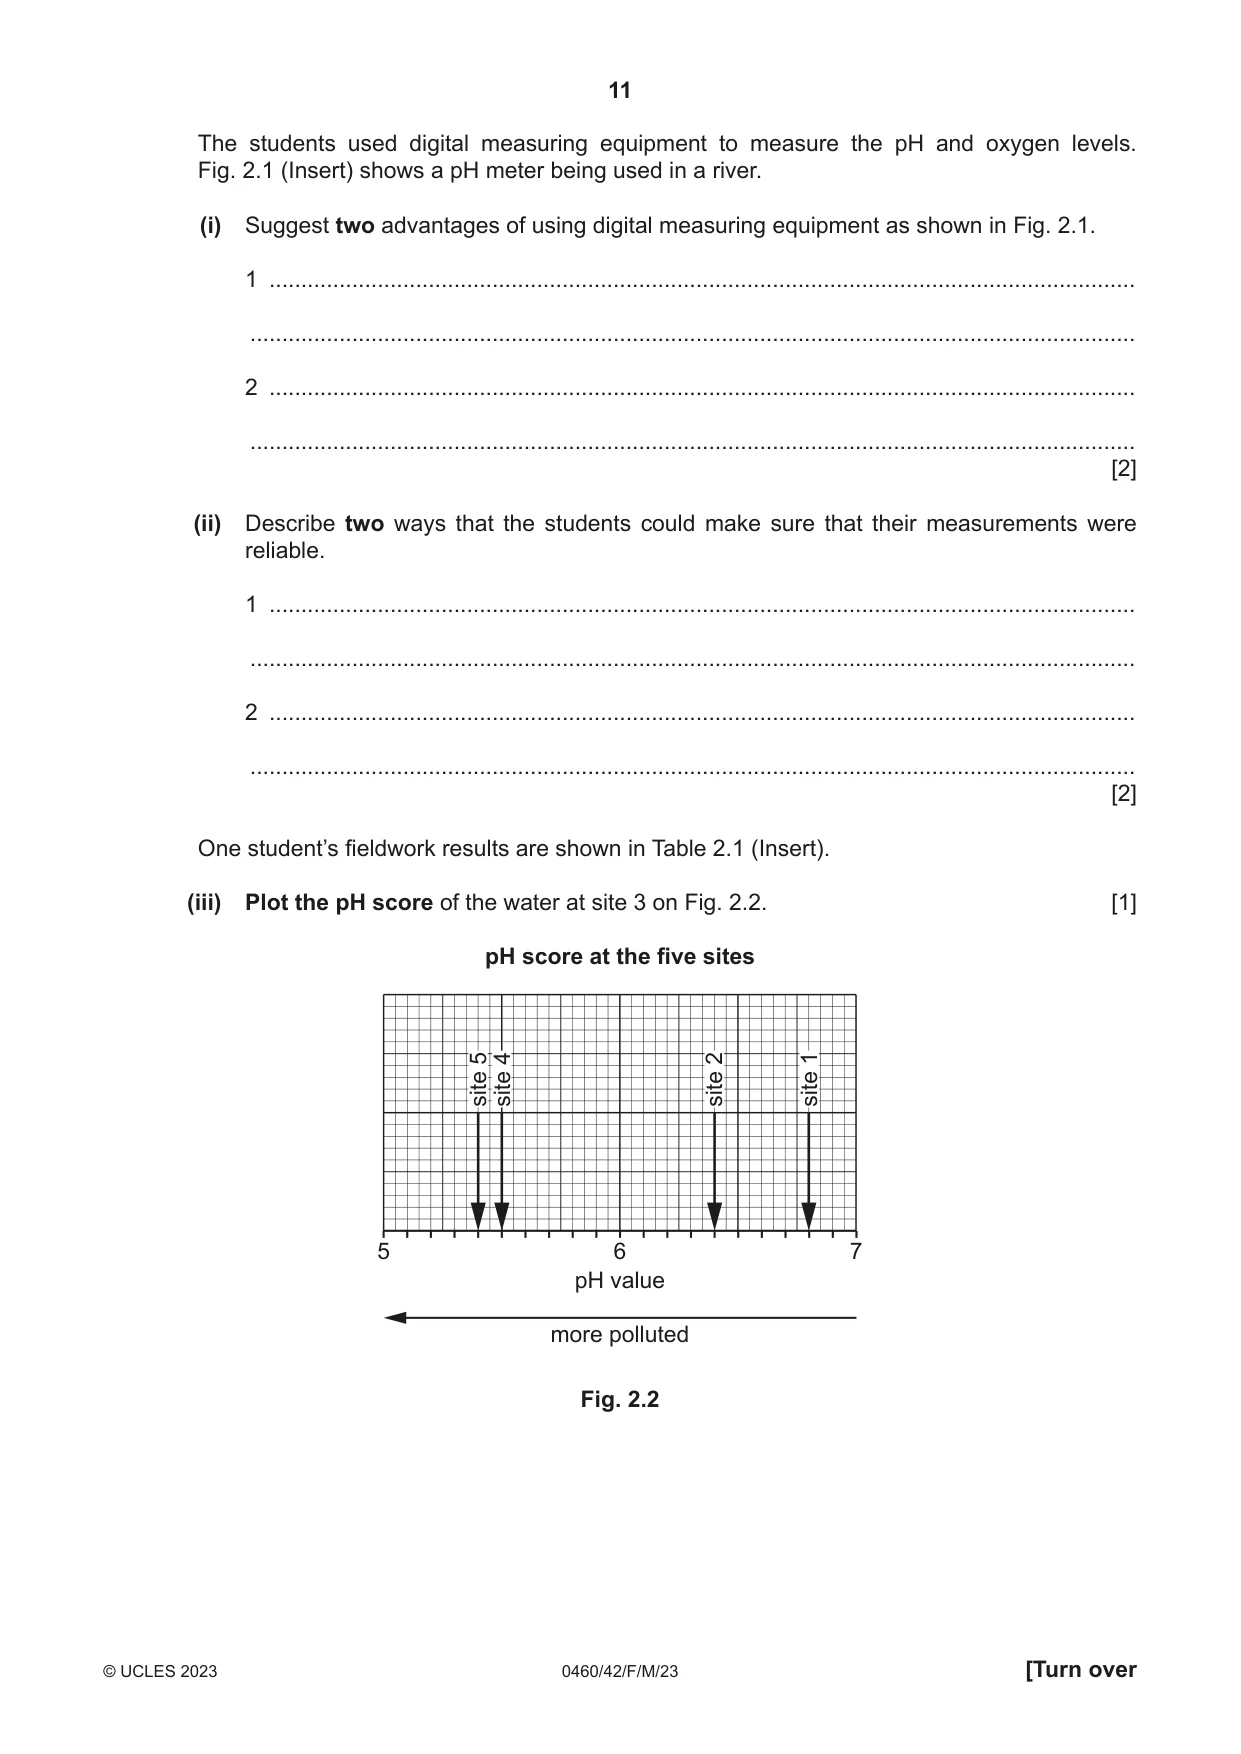
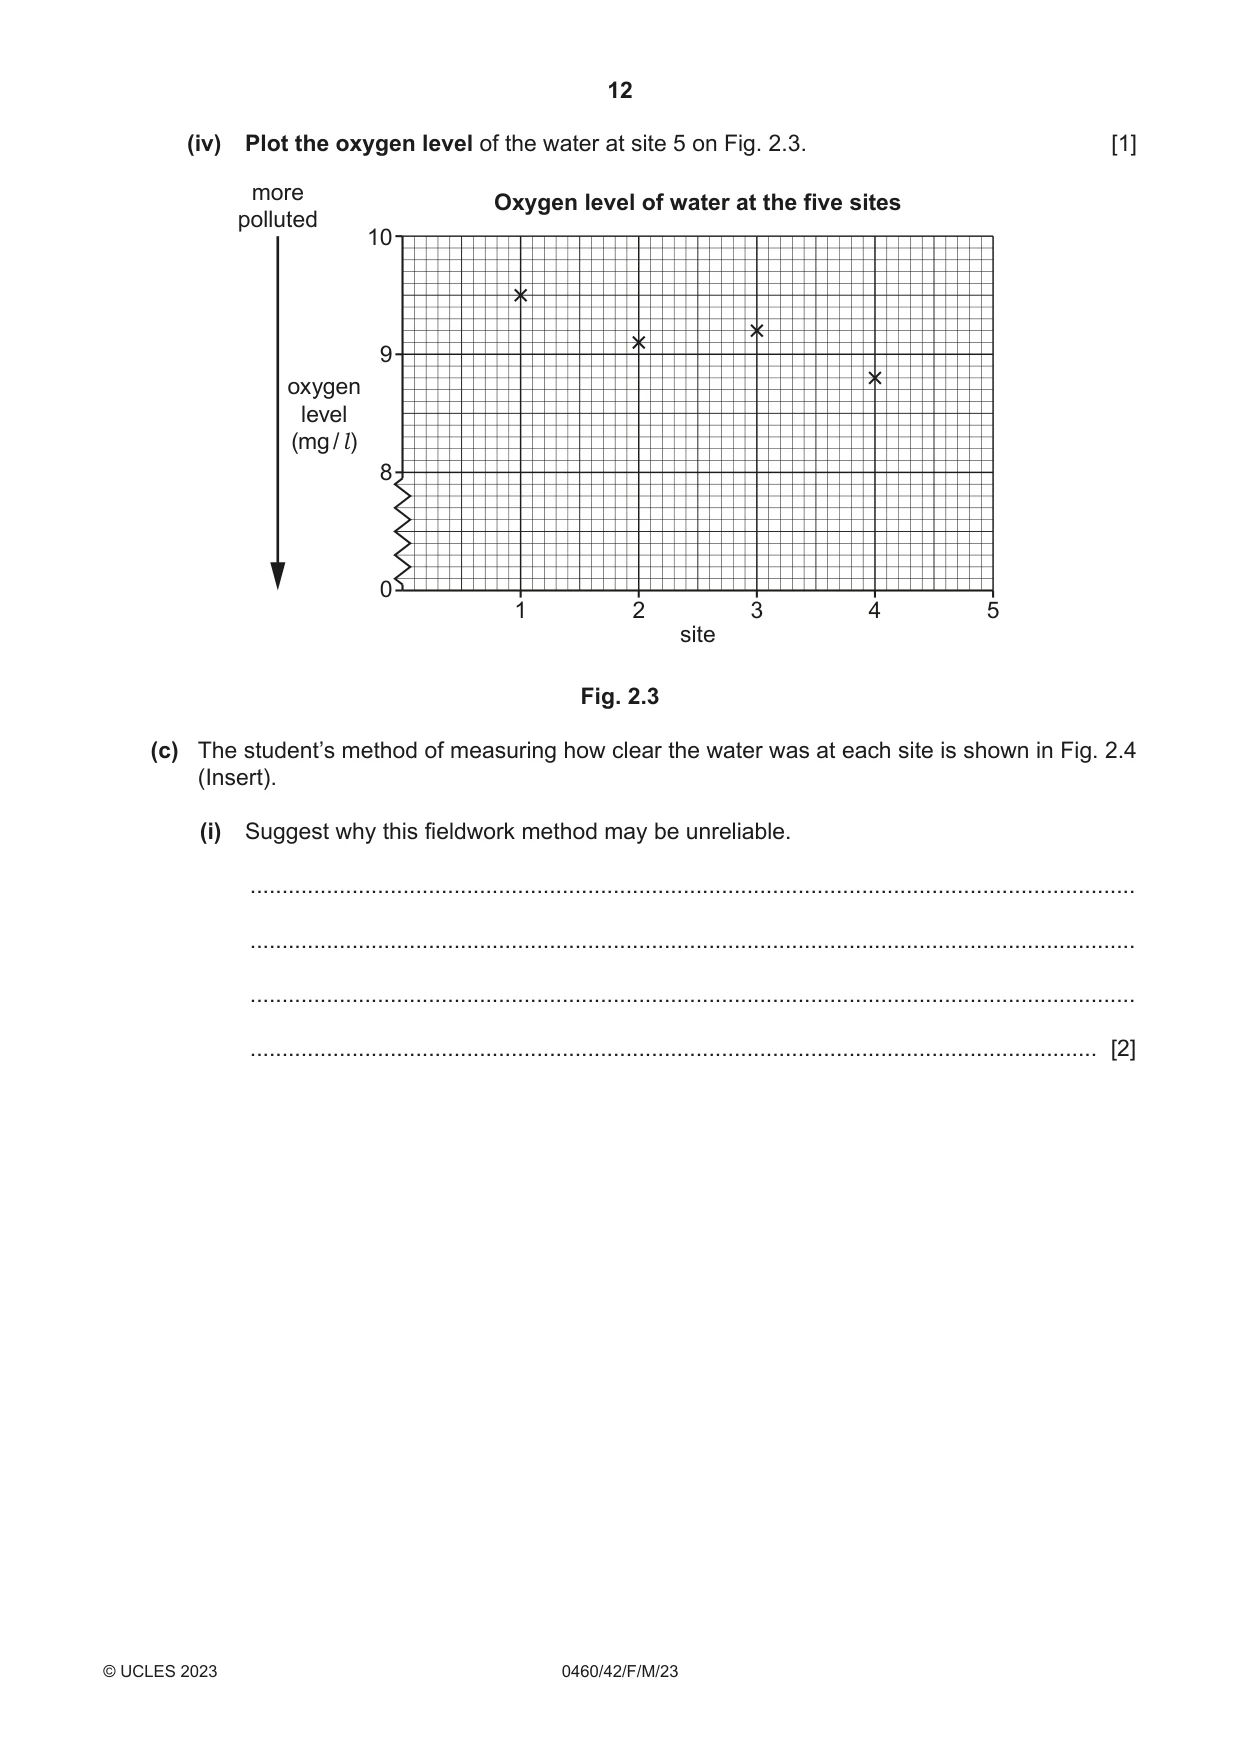
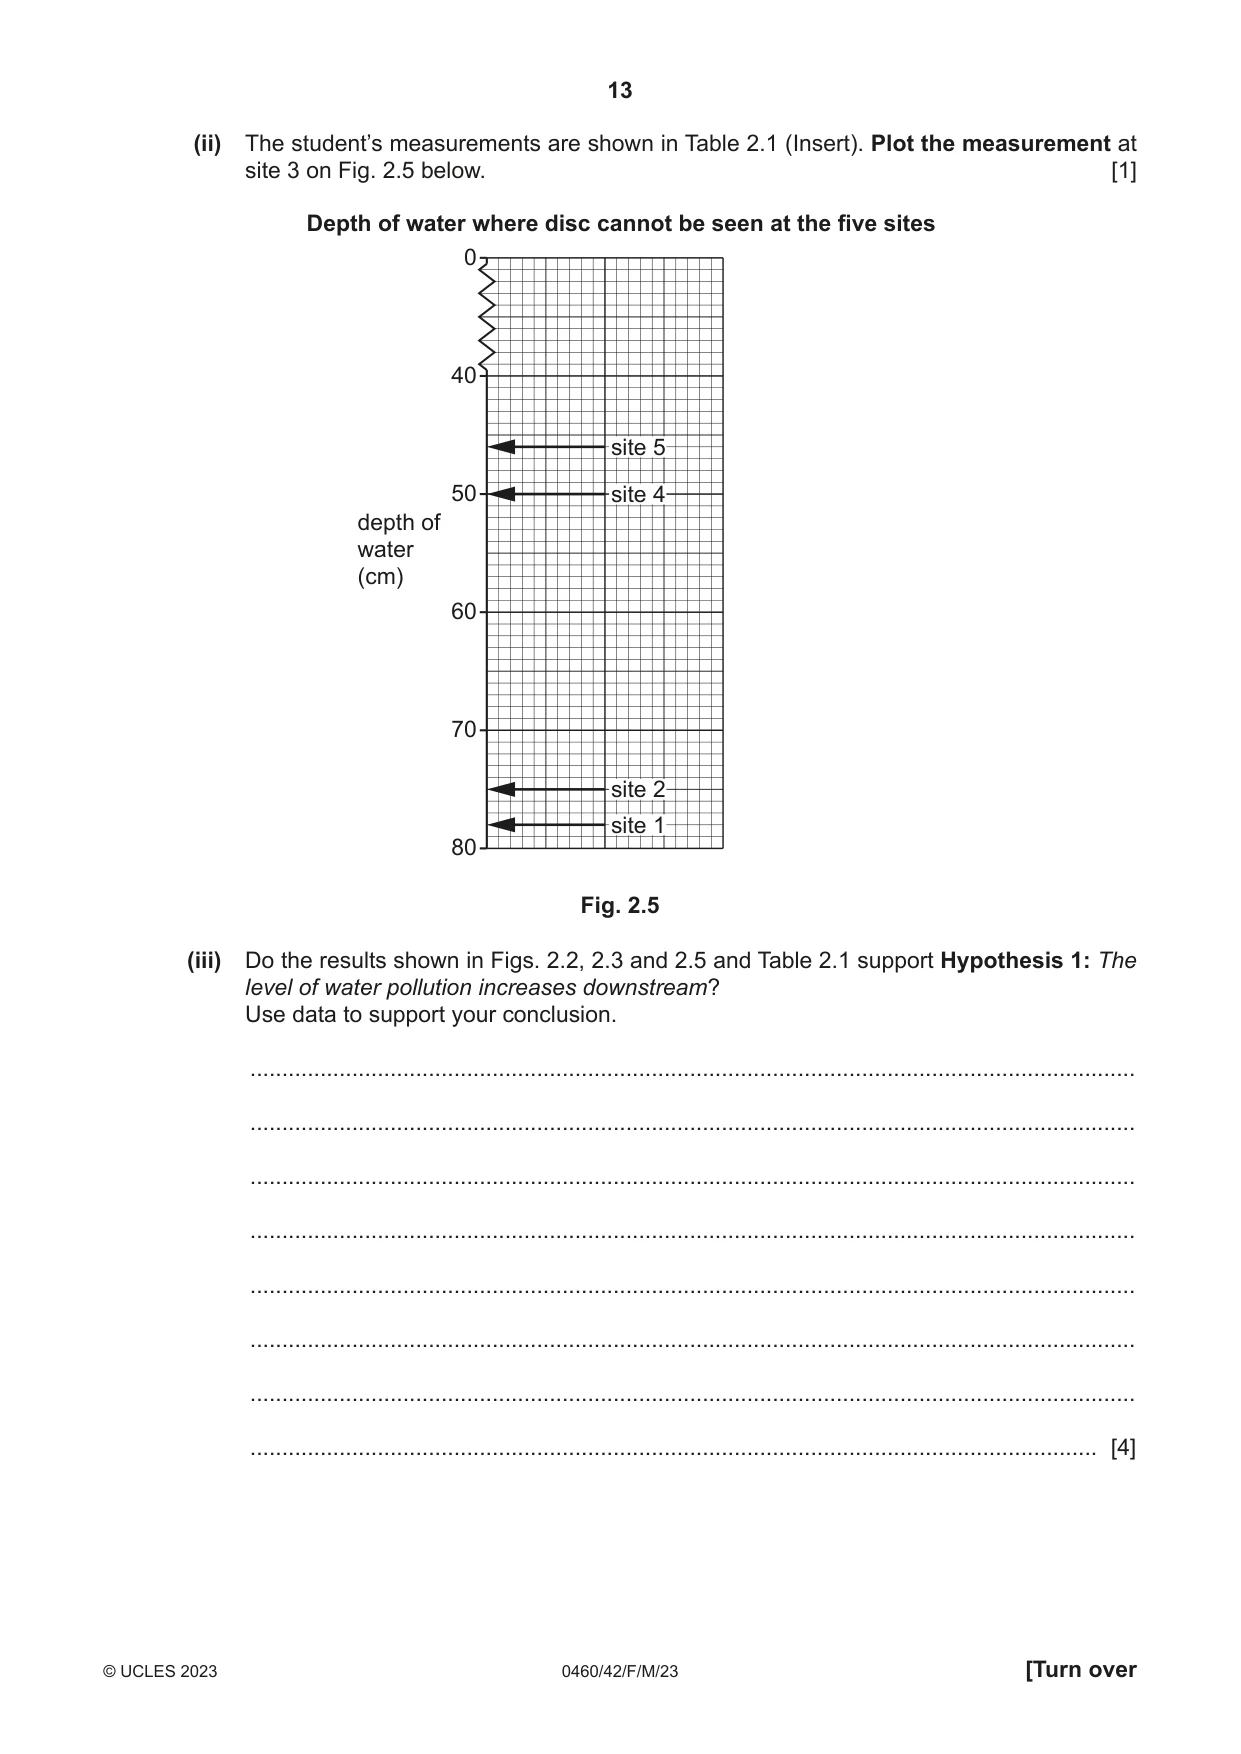
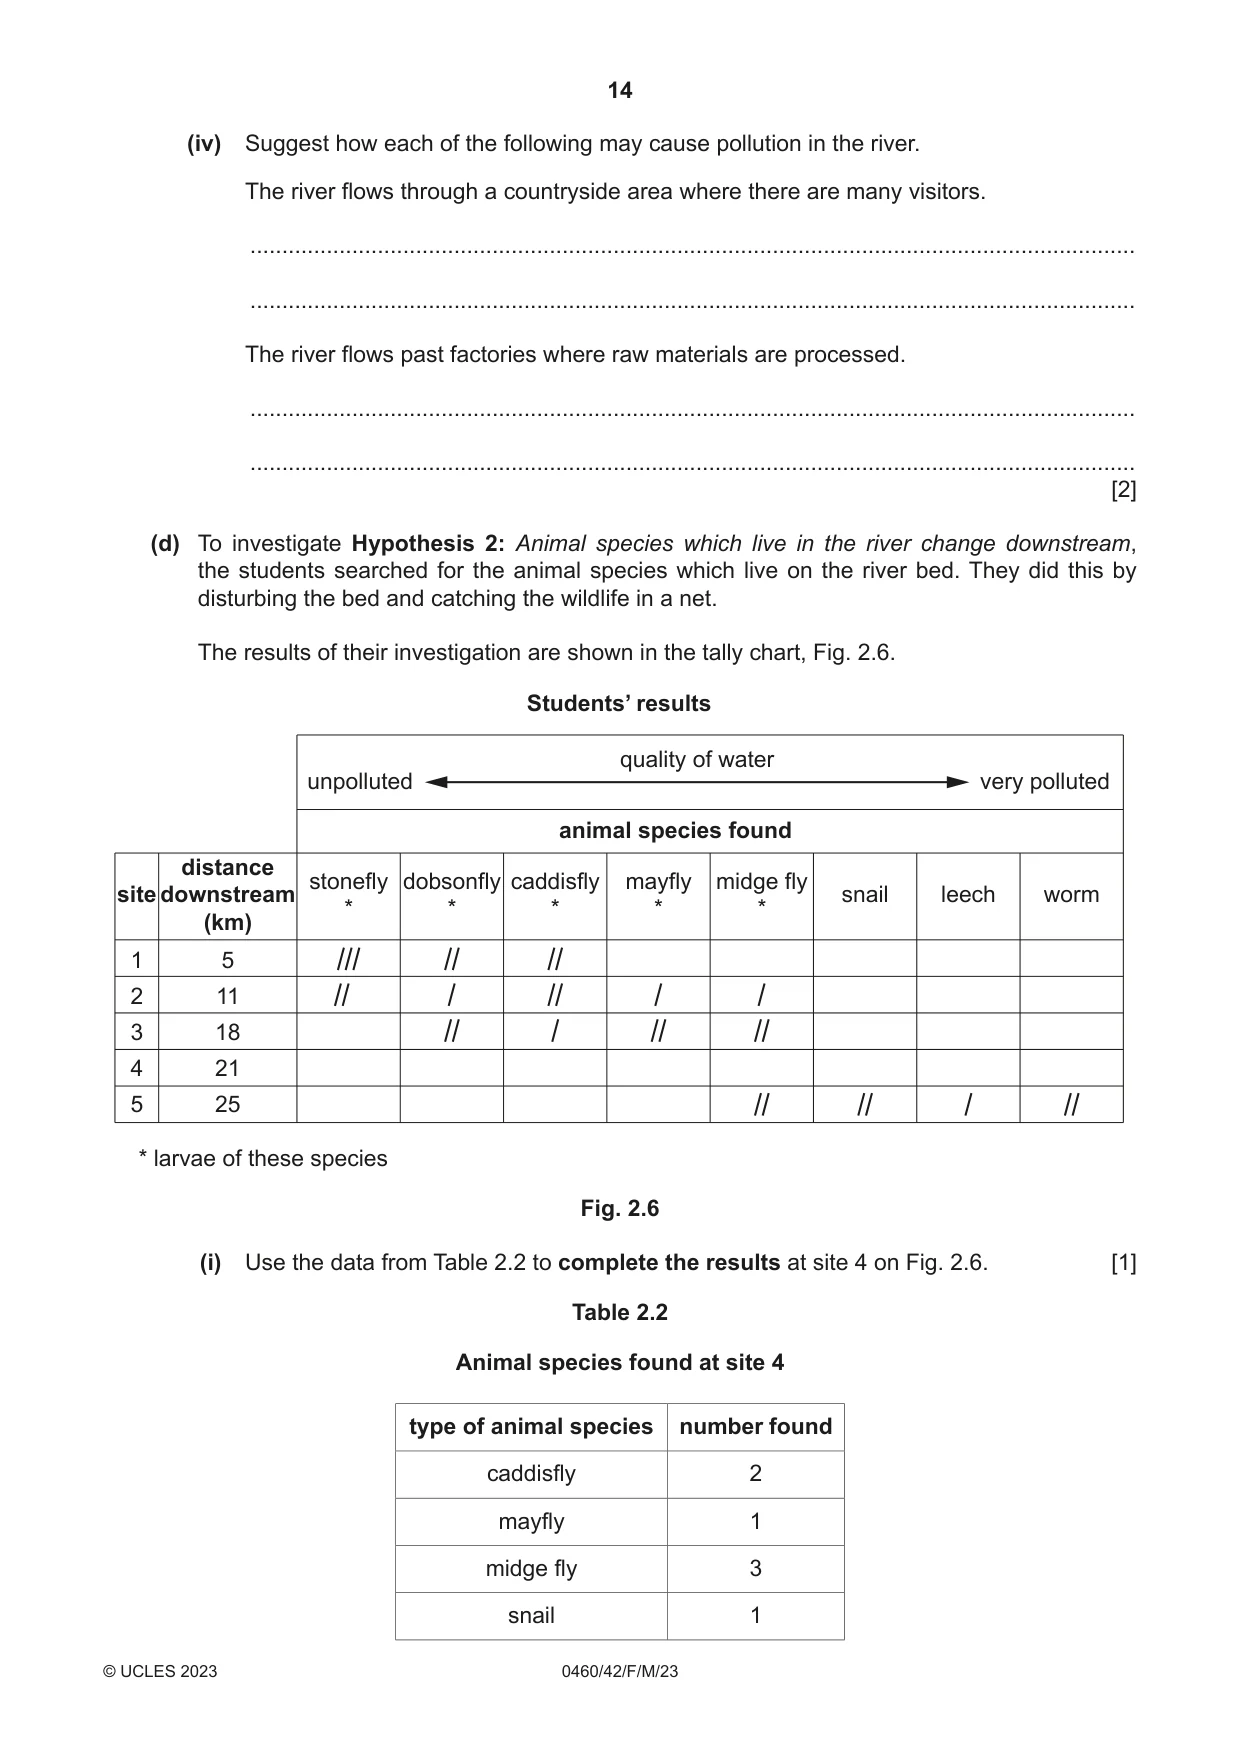
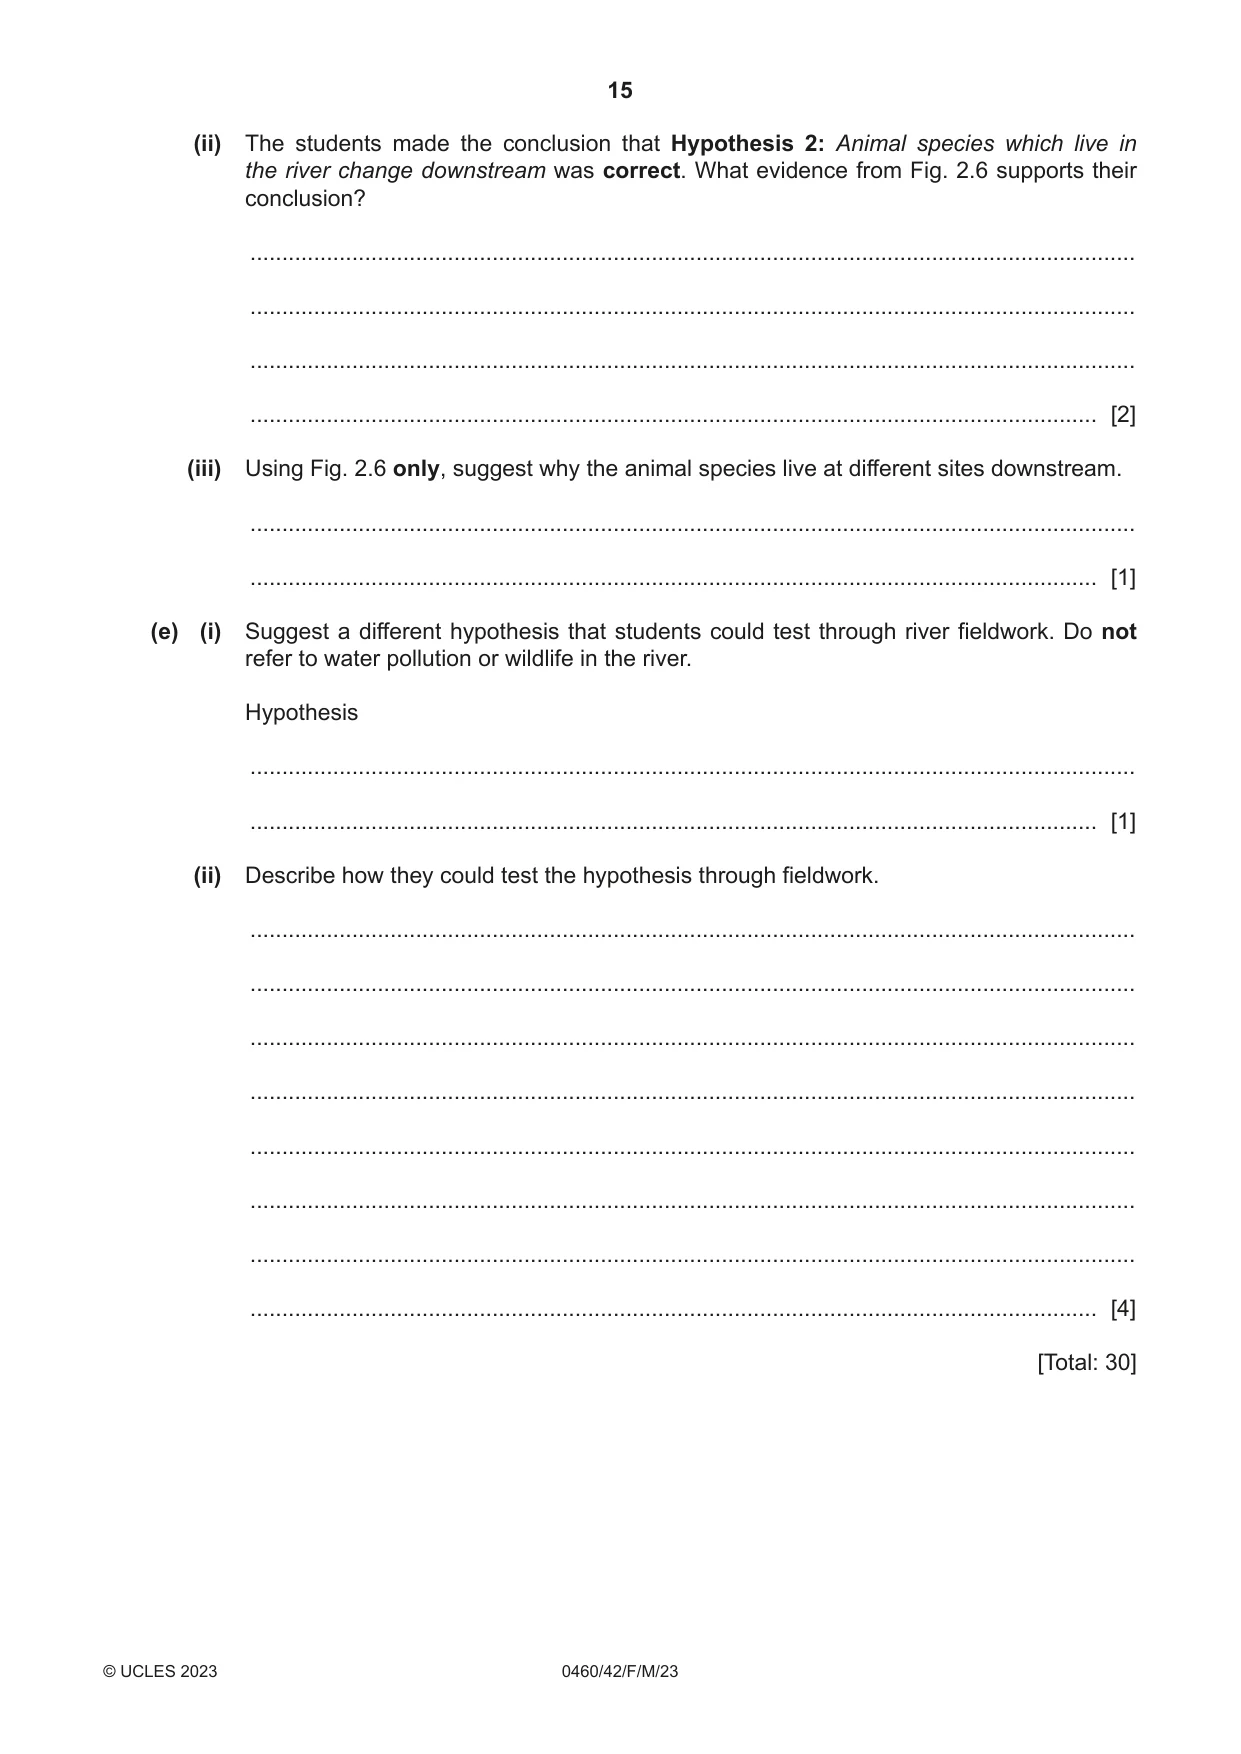
2 Students in Norfolk, UK, read a newspaper report about water pollution in a local river. They decided to do some fieldwork to investigate this. However, before they started their fieldwork their teacher warned them about the possible dangers of working in the river. She also suggested some precautions the students might take to protect themselves. (a) (i) Suggest two possible dangers which their teacher may have warned them about when doing fieldwork in the river and suggest different precautions that the students might take to protect themselves. possible danger student precaution 1 ............................................................... 1 ............................................................... .................................................................. .................................................................. .................................................................. .................................................................. 2 ............................................................... 2 ............................................................... .................................................................. .................................................................. .................................................................. .................................................................. [4] (ii) First the students did a visual survey of the river. Suggest two ways that they would be able to see from the river bank if the river was polluted. 1 ........................................................................................................................................ ........................................................................................................................................... 2 ........................................................................................................................................ ........................................................................................................................................... [2] (b) The students investigated two hypotheses. Hypothesis 1: The level of water pollution increases downstream. Hypothesis 2: Animal species which live in the river change downstream. To find out the level of water pollution, the students chose five sites along the river to measure pH and oxygen levels and how clear the water was. • pH is a measure of the acidity of water. The pH score decreases as water becomes more acidic. More acidic water means that pollution is more likely. • The oxygen level of water decreases as it becomes more polluted. • Water clarity decreases as it becomes more polluted. The students used digital measuring equipment to measure the pH and oxygen levels. Fig. 2.1 (Insert) shows a pH meter being used in a river. (i) Suggest two advantages of using digital measuring equipment as shown in Fig. 2.1. 1 ........................................................................................................................................ ........................................................................................................................................... 2 ........................................................................................................................................ ........................................................................................................................................... [2] (ii) Describe two ways that the students could make sure that their measurements were reliable. 1 ........................................................................................................................................ ........................................................................................................................................... 2 ........................................................................................................................................ ........................................................................................................................................... [2] One student’s fieldwork results are shown in Table 2.1 (Insert). (iii) Plot the pH score of the water at site 3 on Fig. 2.2. [1] pH score at the five sites 54 2 1 sitesite site site 5 6 7 pH value more polluted Fig. 2.2 (iv) Plot the oxygen level of the water at site 5 on Fig. 2.3. [1] more Oxygen level of water at the five sites polluted 10 9 oxygen level (mg / l) 8 0 1 2 3 4 5 site Fig. 2.3 (c) The student’s method of measuring how clear the water was at each site is shown in Fig. 2.4 (Insert). (i) Suggest why this fieldwork method may be unreliable. ........................................................................................................................................... ........................................................................................................................................... ........................................................................................................................................... ..................................................................................................................................... [2]
Mark scheme: 2(a)(i) 4 possible danger student precaution Infection from the Don’t drink water / wash when finished fieldwork / water / swallowing wear rubber gloves water / waterborne disease Insects or animals in Protections such as: gloves / long sleeves / long the river trousers / insect repellent Sharp stones on the Wear wellingtons / waders / boots / proper shoes river bed Fast current / deep Don’t go into water / stay on banks water Slipping on wet Wear appropriate footwear / boots / shoes / rocks / falling into wellingtons the river Credit 2 marks for dangers and 2 marks for precautions. TICKS/CROSSES 2 x (1 + 1) 2(a)(ii) Examples 2 Foam on surface / water not clear / murky / cloudy / can’t see river bed (1) Discolouration / grey / green / brown / dark colour or relevant colour (1) Dead fish / lack of wildlife or animals in water (1) Rubbish / litter in water or on river bank (1) Oil film in water (1) Algae on the surface (1) River water unpleasant smells (1) (1 + 1) 2(b)(i) Examples 2 Give precise / accurate reading / figures (1) Give instant readings / faster / quicker / saves time (1) Easy to use / clear to read (1) Less chance of making mistakes in reading / mis-reading / less errors (1) Portable / can be used at more than one site (1) Data can be stored / downloaded (1) (1 + 1) 2(b)(ii) Examples 2 Take more than one reading at each sampling point / do test again / repeat investigation (1) Get other students to do test / check the reading (1) Use two or more meters / another instrument (1) Make sure the meter is calibrated properly / working properly (1) Clear sensor after use / make sure sensor is clean (1) Leave sensor in water for period of time / until reading is stable (1) (1 + 1) 2(b)(iii) Plot pH = 5.7 at site 3 TICK/CROSS 1 2(b)(iv) Plot 8.4 mg/l at site 5 TICK/CROSS 1 2(c)(i) Examples 2 Water sample may include sediment / stones / leaves / particles (1) Measuring clarity is by eye / more prone to discrepancy or human error / subjective (1) Reading off scale may be inaccurate due to parallax error (1) Water poured in may be more than it should be (1) Make sure the tube is clean (1) (1 + 1) 2(c)(ii) Plot 54cm at site 3 TICK/CROSS 1 2(c)(iii) Hypothesis is true / supported / yes – 1 mark reserve (✓HA) 4 pH score decreases / acidity increases downstream / Site 1 to 5 (1) Oxygen level decreases downstream / Site 1 to 5 (1) Water clarity / depth of clear water decreases downstream / Site 1 to 5 (1) Reserve 1 mark maximum for paired data; no need to support statement e.g. pH score at site 1 / 5 km = 6.8 and at site 5 / 25 km = 5.4 OR 2 sites that decrease (1) Hypothesis conclusion is false / partially true = 0 (XHa) If no hypothesis conclusion ^HA and credit evidence (1HA + 1 + 1 + 1RD) 2(c)(iv) Examples 2 Visitors throw rubbish / trash / litter / garbage into the river (1R) Waste water/products/chemicals/materials/toxic runs into the river (1R) (1R + 1R) 2(d)(i) Complete site 4. All correct for the mark. 1 Caddisfly = 2, mayfly = 1, midgefly = 3, snail = 1 TICK/CROSS 2(d)(ii) Examples: NOTE: no credit for giving a hypothesis decision. 2 Compare different species at any two sites e.g. Site 1 species are stonefly / caddisfly / dobsonfly and site 5 / downstream species are midgefly / snail / leech / worm (1) Compare different numbers of same species downstream e.g. 2 dobson fly at site 2 and none at site 4 (1) OR e.g. dobson fly at Site 2 not at Site 4 (1) (1 + 1) 2(d)(iii) Examples 1 Some species can survive in unpolluted water / some species survive in polluted water / animals live in different pollution levels (1) It depends on how tolerant the species are to polluted water (1) Pollution levels change / vary from Site 1 to Site 5 (1) 2(e)(i) 1 mark for appropriate hypothesis written as statement or question 1 TICK/CROSS Examples: Channel width increases downstream (1) Does channel depth increase downstream? (1) River velocity increases downstream (1) Does river velocity vary across the channel? (1) Cross-sectional area varies downstream (1) Size of load increases downstream (1) Does the gradient of the river bed increase downstream (1) Discharge increases downstream (1) 2(e)(ii) Example 1 – method to measure channel width 4 Choose different sites (1) One student/pole on each bank/side of river (1) Place measuring tape across channel / from one bank to the other (1) Keep tape taut/stretched (1) Poles must be directly across/ at 90 degrees /perpendicular to banks (1) Repeat at different sites and calculate average width (1) Record measurement at each site (1) Example 2 – method of measuring velocity using floats Choose different sites (1) Put poles/sticks 5/10 metres or fixed distance along river (1) Use tape measure to measure distance (1) Put float/orange in river at start of distance (1) Start stopwatch/timer when float released at start point (1) Measure time taken for float to travel between poles (1) Stop stopwatch/timer when float passes end point (1) Repeat at different points and calculate average speed (1) Record results from each site (1) Example 3 – method of measuring velocity using flowmeter Choose different sites (1) Put meter/propeller/flowmeter below surface of water/into water (1) Propeller must face upstream (1) No obstacles in front of propeller (1) Read/look at digital reading/display to see speed (1) Take several/repeat readings and calculate average speed (1) Repeat at different points and calculate average speed (1) Record results from each site (1) (1 + 1 + 1 + 1) If totally inappropriate hypothesis in (i) = No Credit for method If topic is OK but not expressed as hypothesis no credit in e (i) but can give 4 marks for method e.g. River Velocity
More questions on Environmental risks of economic development
What was in this paper
The subtopics covered by these 2 questions, and how many questions each got. Open one in a new tab to see every Cambridge question on it.
What you needed in this session
Cambridge’s own grade thresholds for 2023 Feb/March, Paper 4 · Variant 2. A higher threshold means an easier paper — the bar moves with how the cohort did.