Cambridge IGCSE Geography 0460 — 2022 Oct/Nov Paper 4 · Variant 3
0460/43/O/N/22 · 2 questions · 60 marks · ≈68 min
The question paper and its mark scheme, free to read here and free to download. This is Cambridge’s own paper, exactly as it was sat.
Question paper20 pages





Mark scheme8 pages
Answers below. Sit the paper first if you are practising.

Questions as text
Q1 · Students in Rohtak, India, did fieldwork to compare two retail (shopping) areas in the…
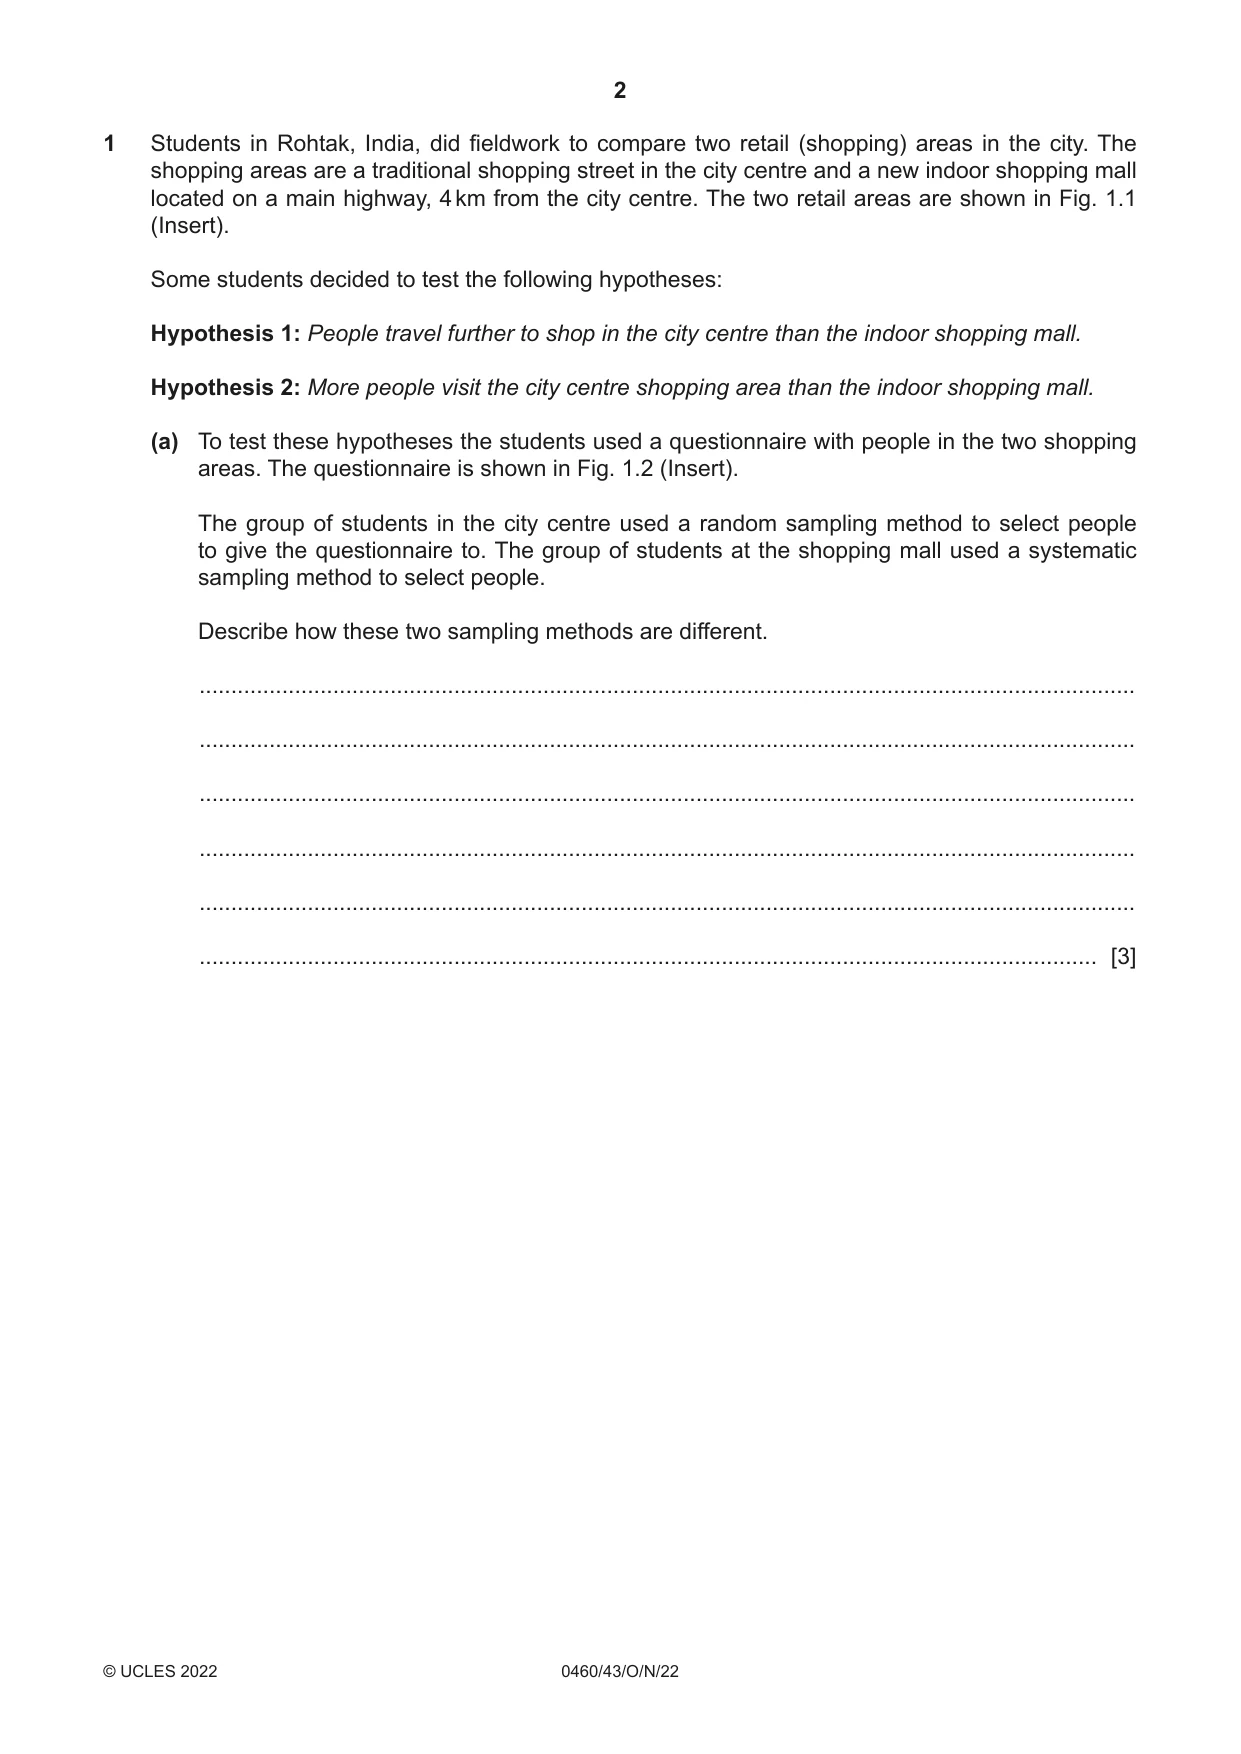
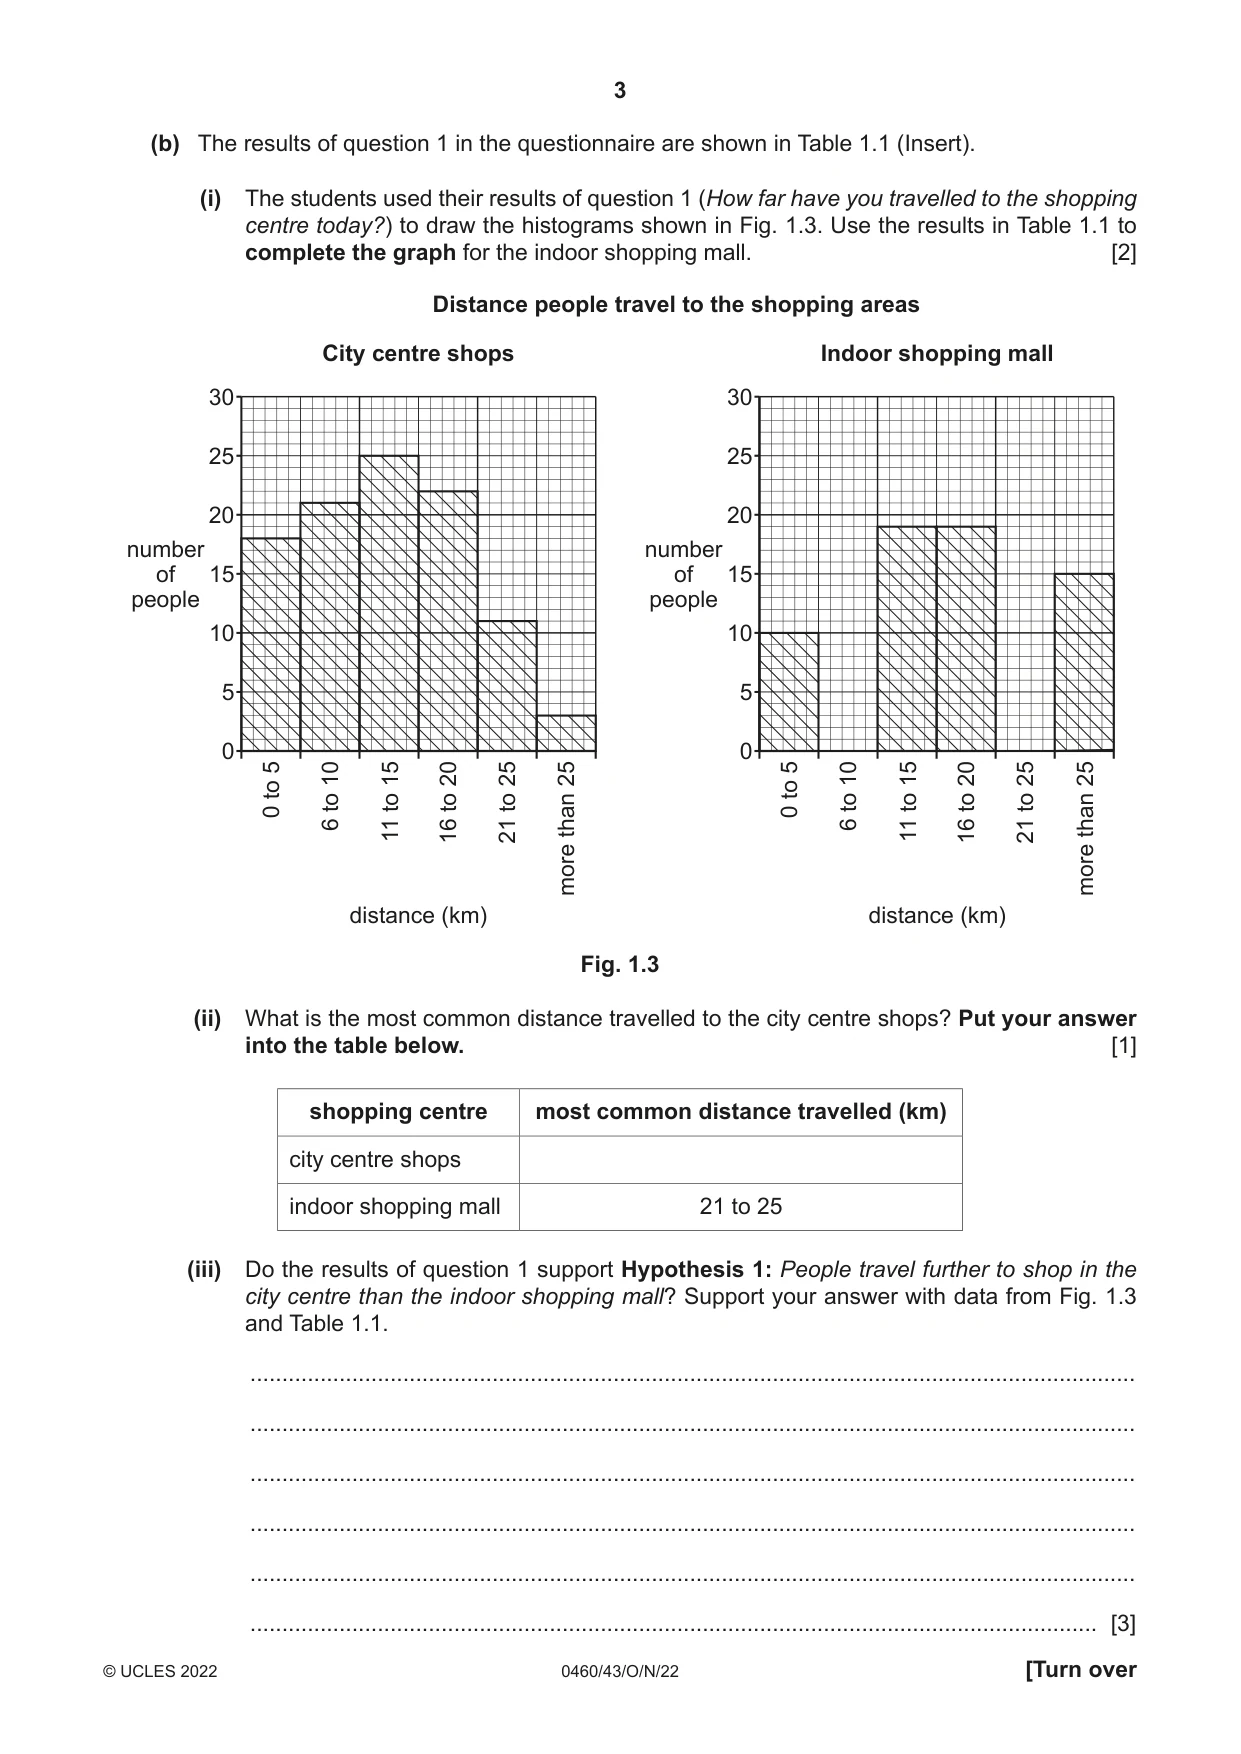
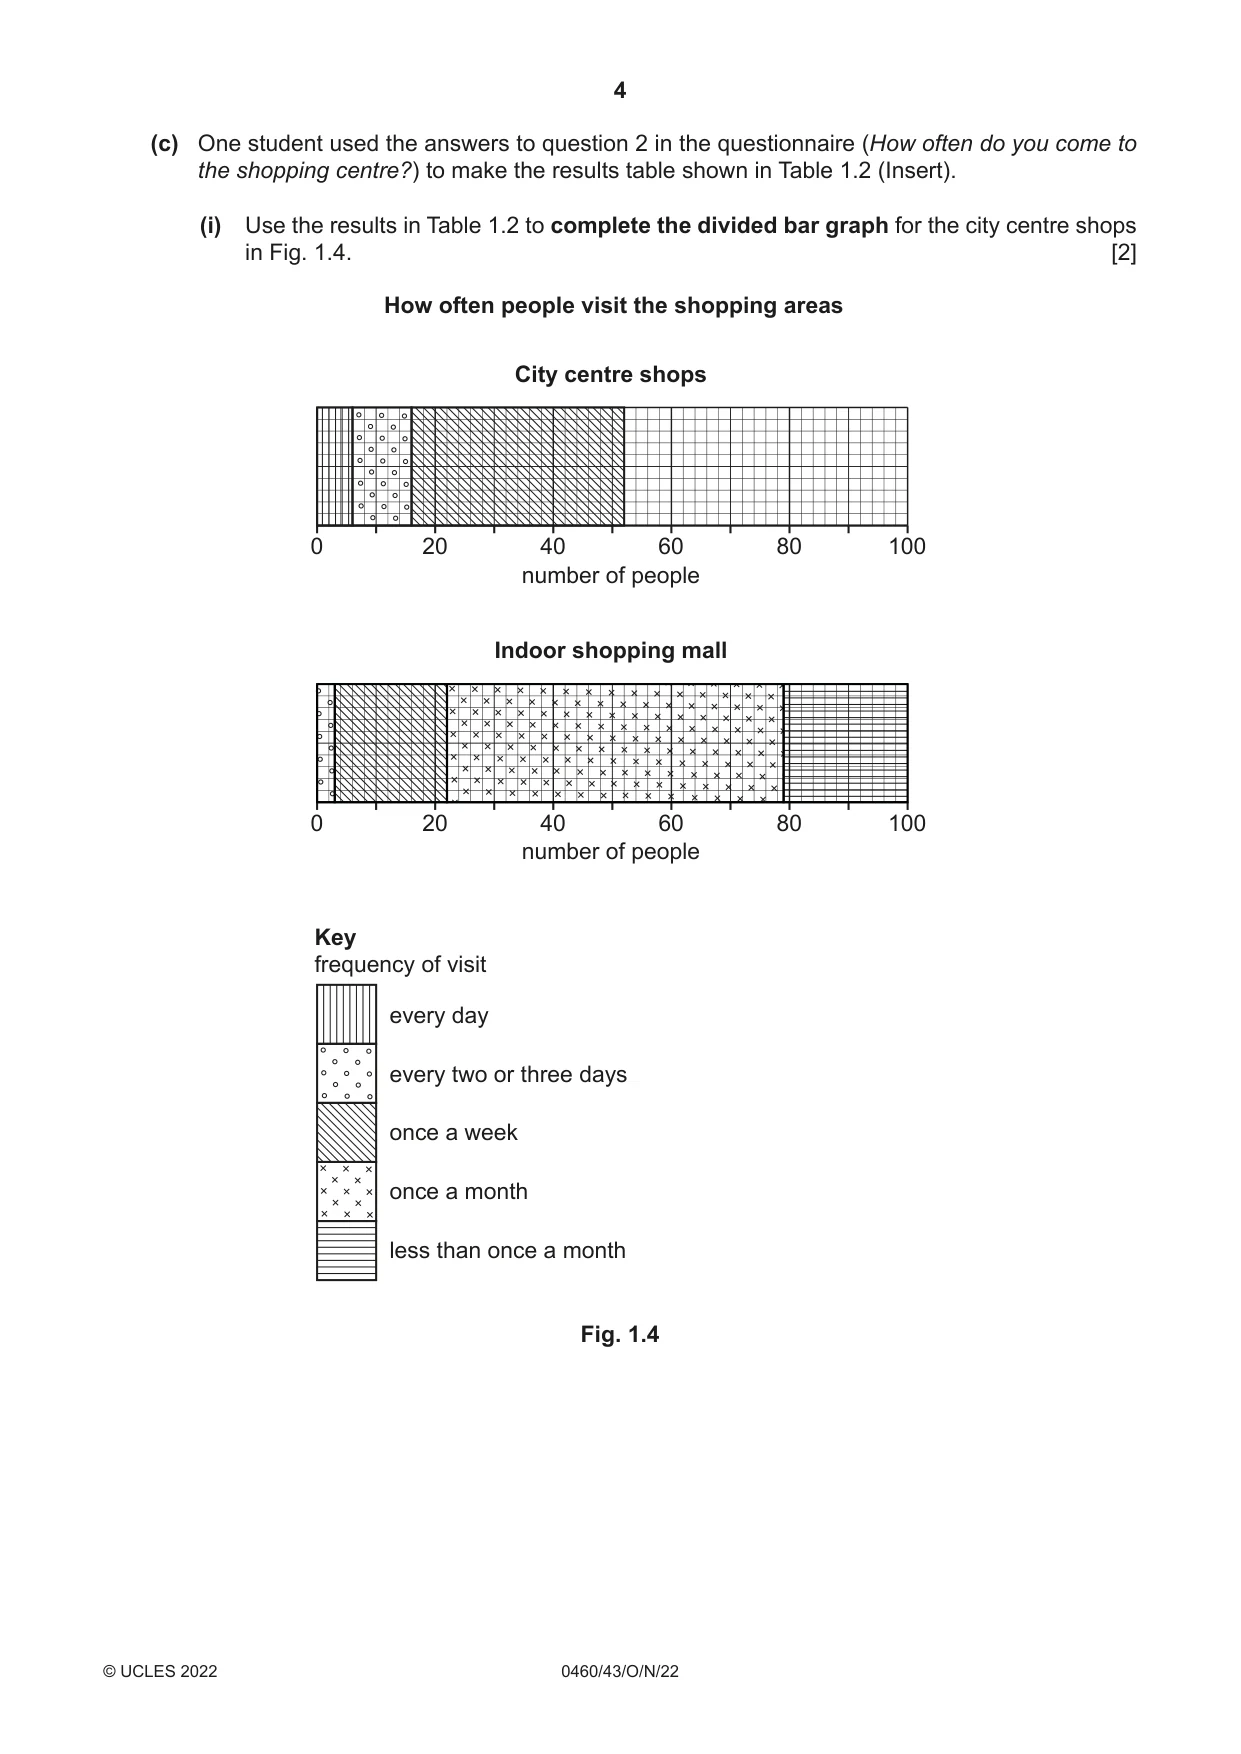
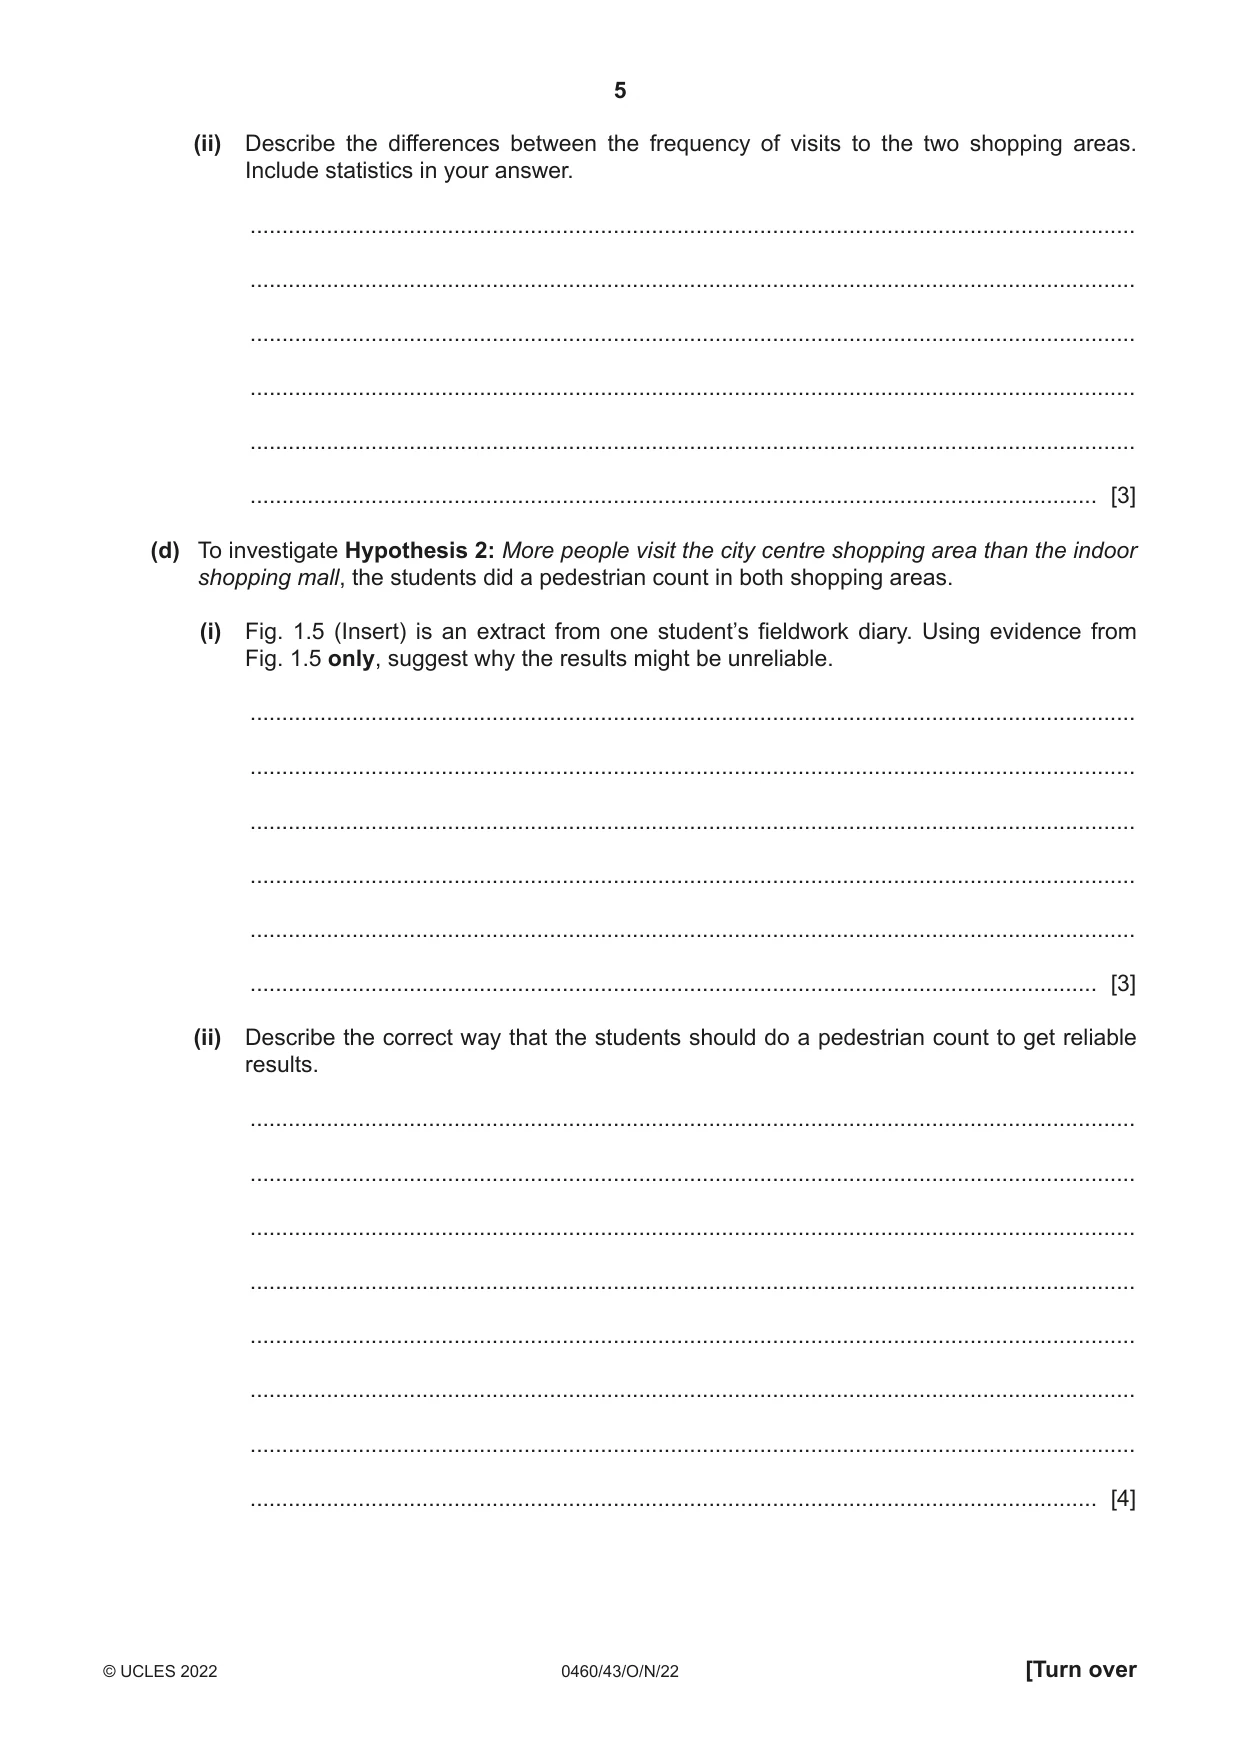
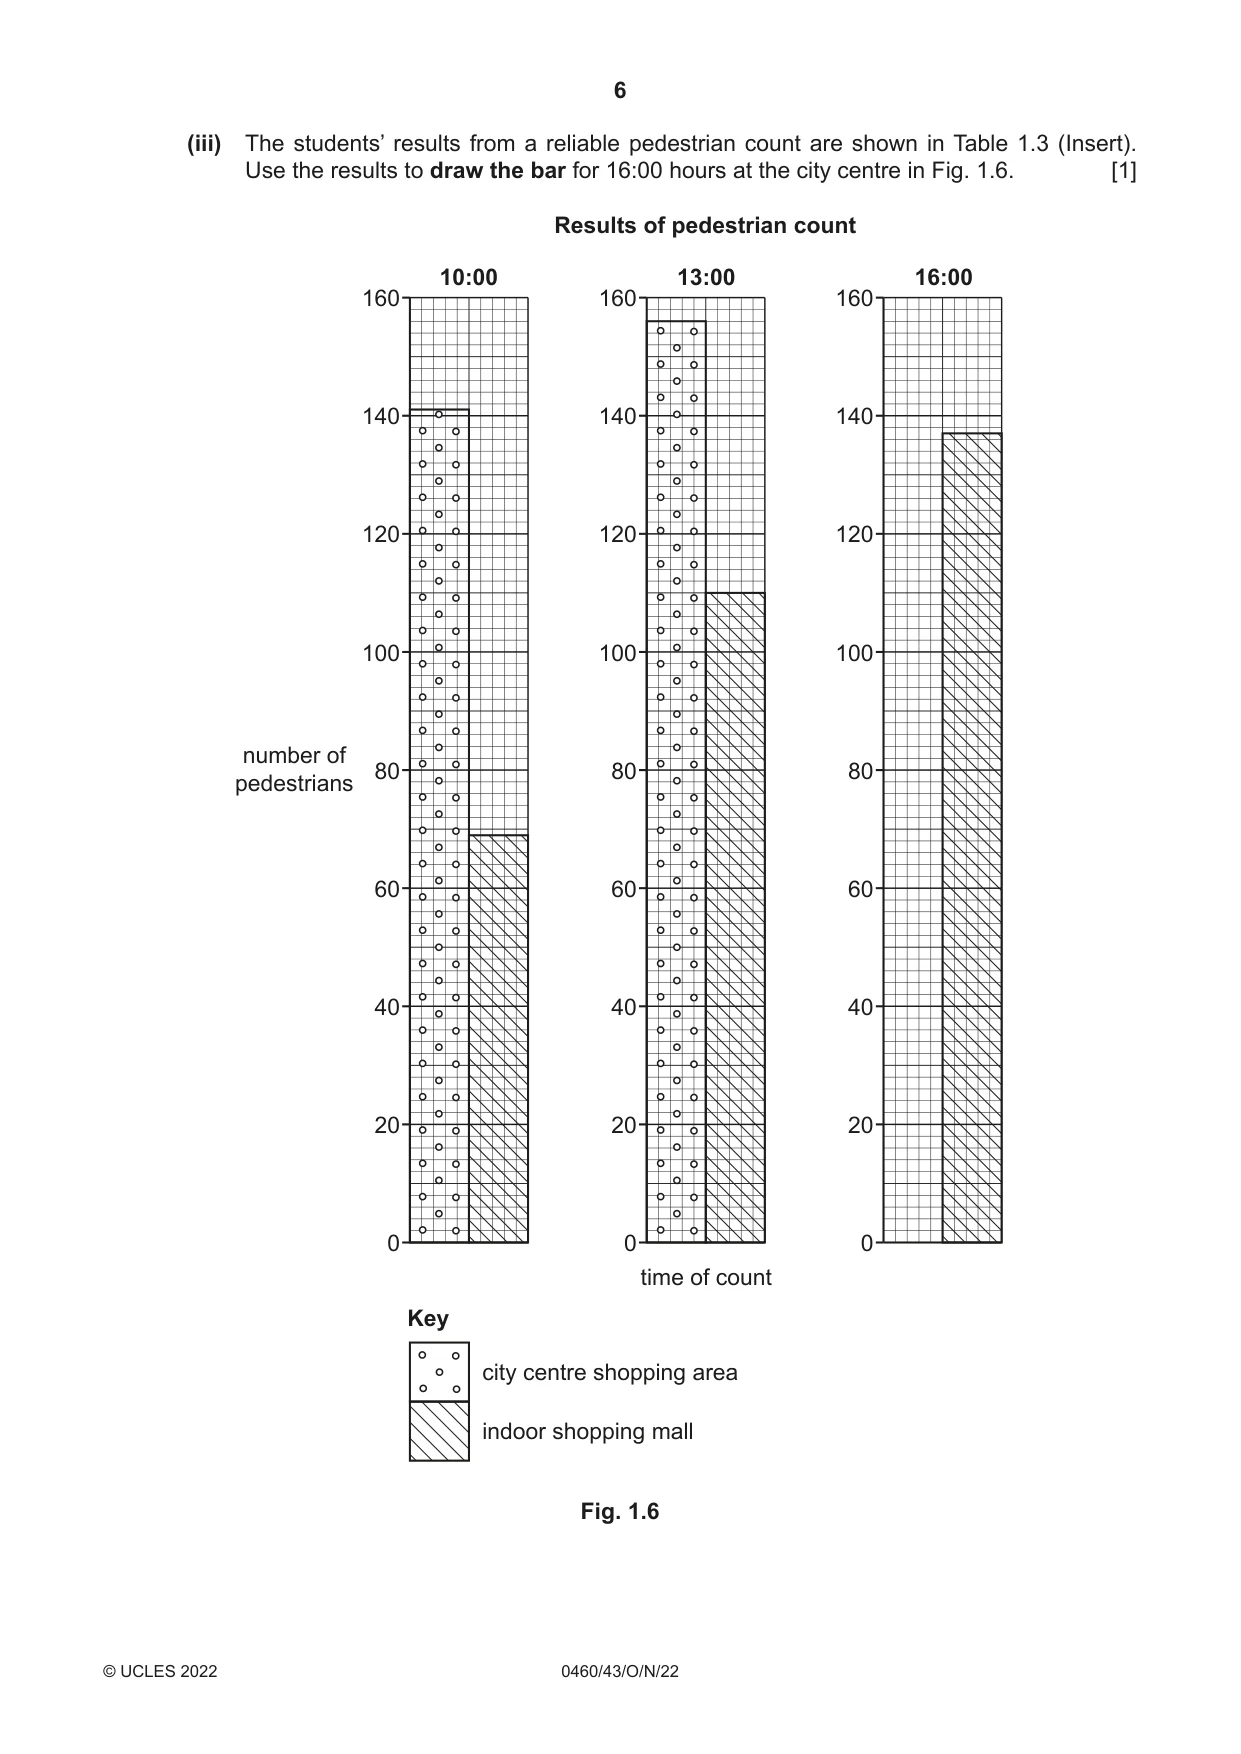
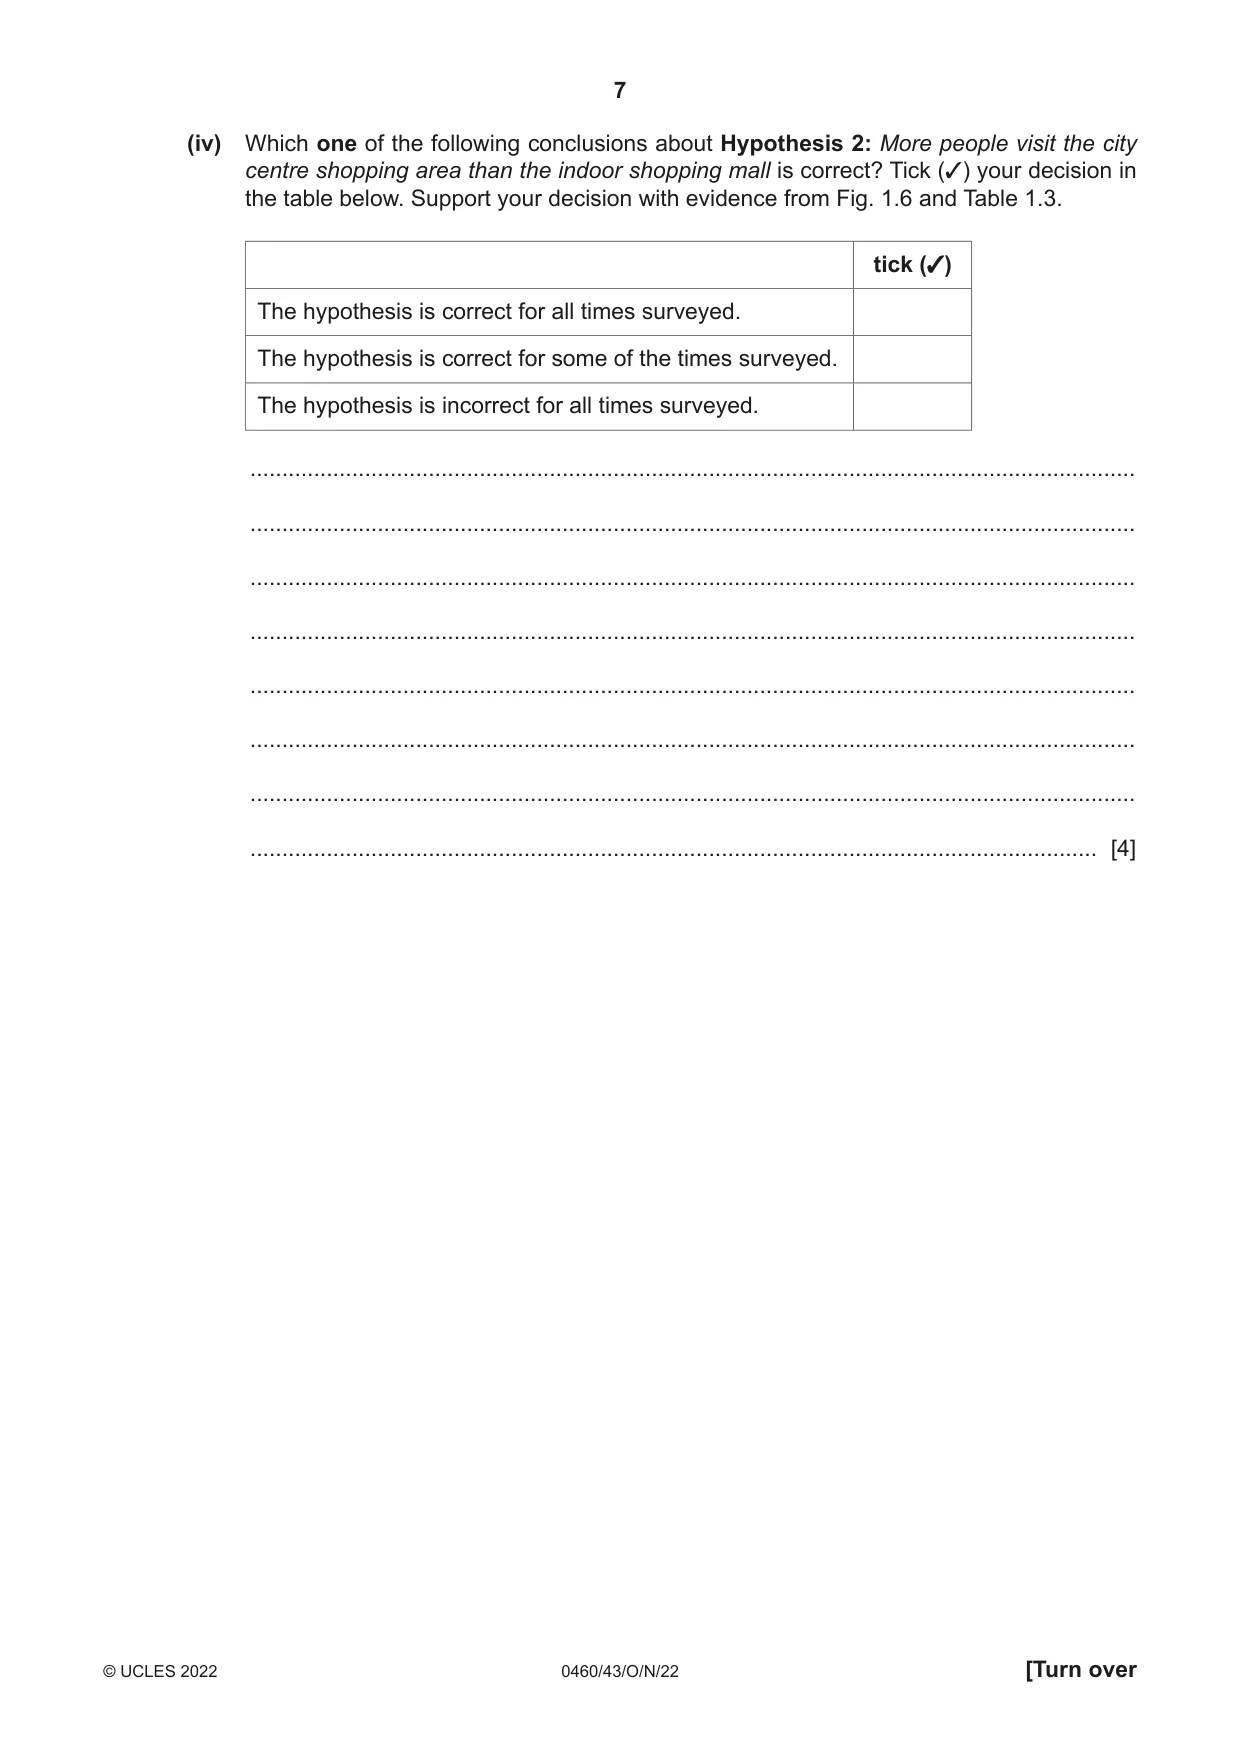
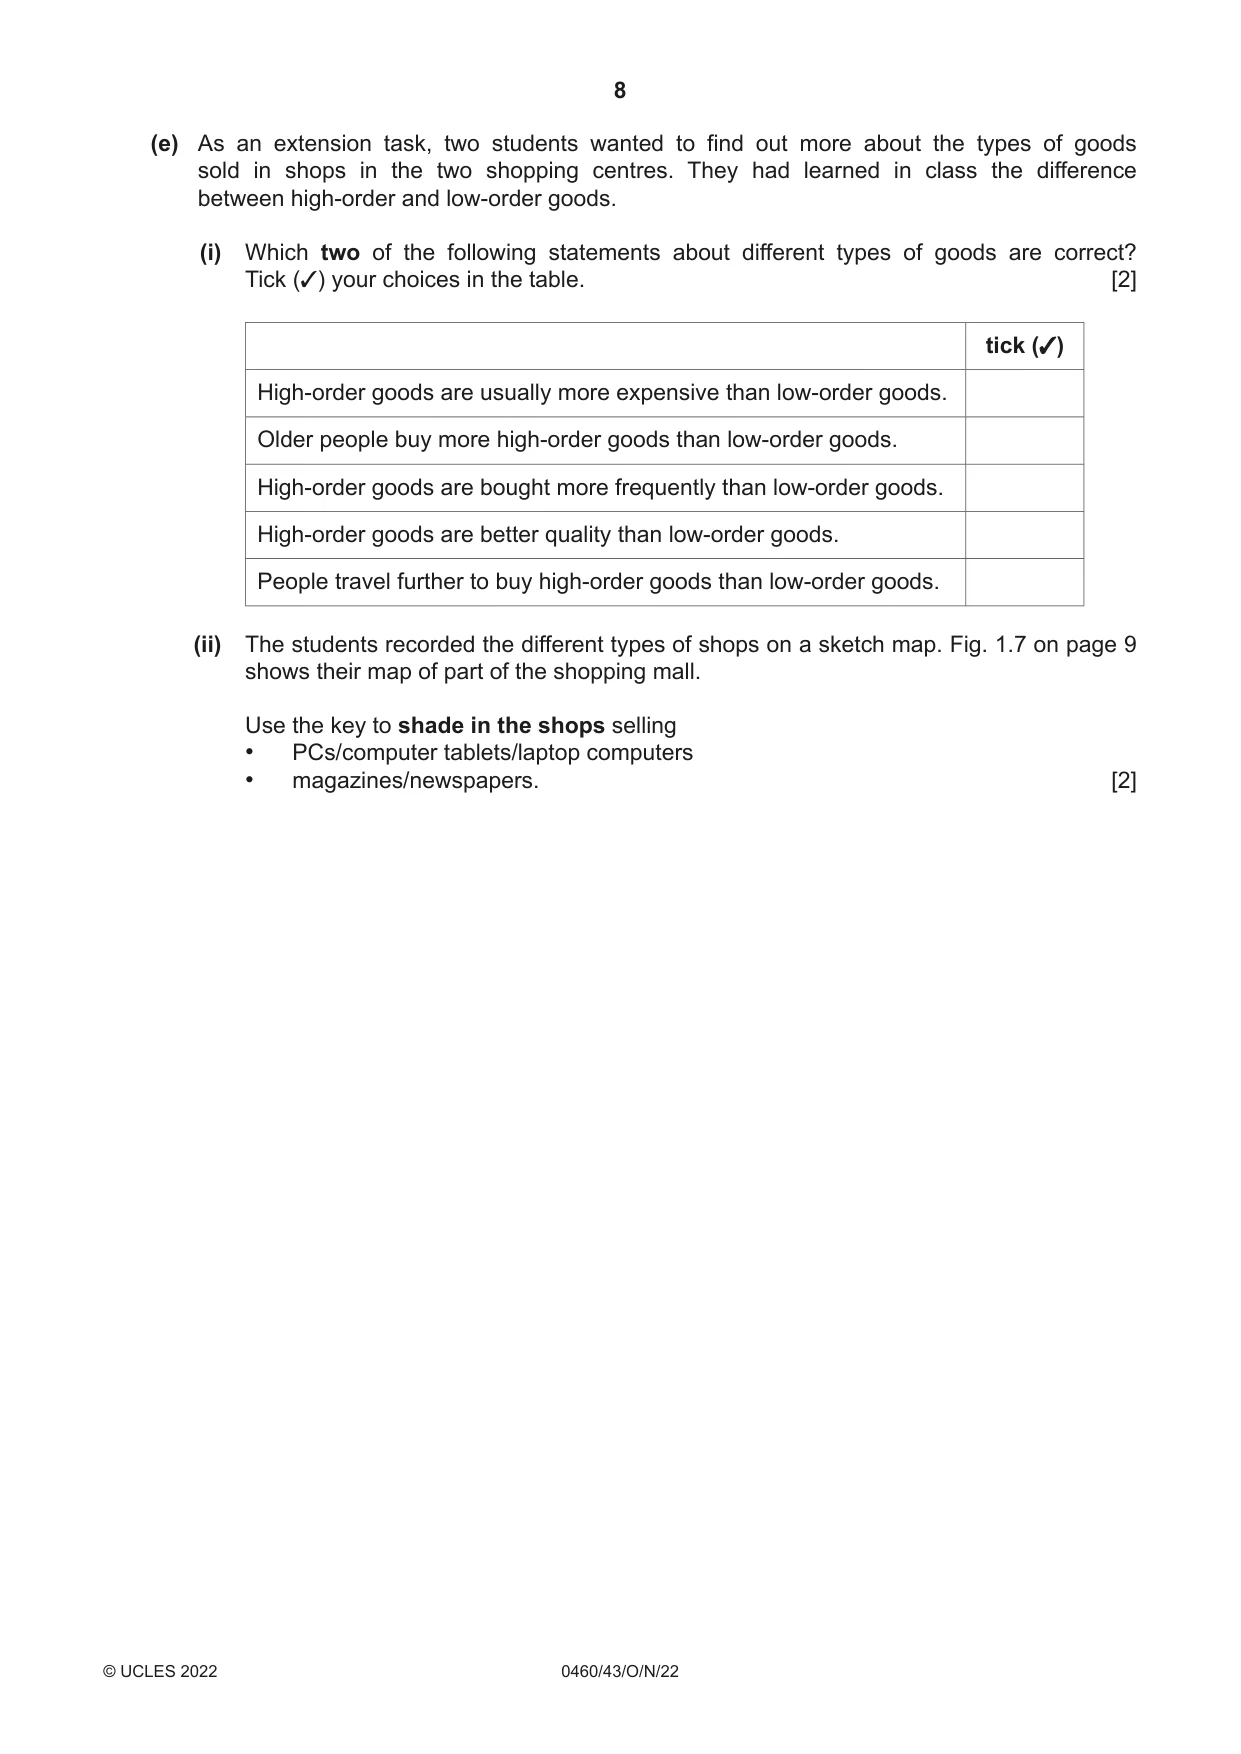
1 Students in Rohtak, India, did fieldwork to compare two retail (shopping) areas in the city. The shopping areas are a traditional shopping street in the city centre and a new indoor shopping mall located on a main highway, 4 km from the city centre. The two retail areas are shown in Fig. 1.1 (Insert). Some students decided to test the following hypotheses: Hypothesis 1: People travel further to shop in the city centre than the indoor shopping mall. Hypothesis 2: More people visit the city centre shopping area than the indoor shopping mall. (a) To test these hypotheses the students used a questionnaire with people in the two shopping areas. The questionnaire is shown in Fig. 1.2 (Insert). The group of students in the city centre used a random sampling method to select people to give the questionnaire to. The group of students at the shopping mall used a systematic sampling method to select people. Describe how these two sampling methods are different. ................................................................................................................................................... ................................................................................................................................................... ................................................................................................................................................... ................................................................................................................................................... ................................................................................................................................................... ............................................................................................................................................. [3] (b) The results of question 1 in the questionnaire are shown in Table 1.1 (Insert). (i) The students used their results of question 1 (How far have you travelled to the shopping centre today?) to draw the histograms shown in Fig. 1.3. Use the results in Table 1.1 to complete the graph for the indoor shopping mall. [2] Distance people travel to the shopping areas City centre shops Indoor shopping mall 30 30 25 25 20 20 number number of 15 of 15 people people 10 10 5 5 0 0 5 10 15 20 25 25 5 10 15 20 25 25 to to to to to to to to to to 0 0 than 11 16 21 than 6 11 16 21 6 more more distance (km) distance (km) Fig. 1.3 (ii) What is the most common distance travelled to the city centre shops? Put your answer into the table below. [1] shopping centre most common distance travelled (km) city centre shops indoor shopping mall 21 to 25 (iii) Do the results of question 1 support Hypothesis 1: People travel further to shop in the city centre than the indoor shopping mall? Support your answer with data from Fig. 1.3 and Table 1.1. ........................................................................................................................................... ........................................................................................................................................... ........................................................................................................................................... ........................................................................................................................................... ........................................................................................................................................... ..................................................................................................................................... [3] (c) One student used the answers to question 2 in the questionnaire (How often do you come to the shopping centre?) to make the results table shown in Table 1.2 (Insert). (i) Use the results in Table 1.2 to complete the divided bar graph for the city centre shops in Fig. 1.4. [2] How often people visit the shopping areas City centre shops 0 20 40 60 80 100 number of people Indoor shopping mall 0 20 40 60 80 100 number of people Key frequency of visit every day every two or three days once a week once a month less than once a month Fig. 1.4 (ii) Describe the differences between the frequency of visits to the two shopping areas. Include statistics in your answer. ........................................................................................................................................... ........................................................................................................................................... ........................................................................................................................................... ........................................................................................................................................... ........................................................................................................................................... ..................................................................................................................................... [3] (d) To investigate Hypothesis 2: More people visit the city centre shopping area than the indoor shopping mall, the students did a pedestrian count in both shopping areas. (i) Fig. 1.5 (Insert) is an extract from one student’s fieldwork diary. Using evidence from Fig. 1.5 only, suggest why the results might be unreliable. ........................................................................................................................................... ........................................................................................................................................... ........................................................................................................................................... ........................................................................................................................................... ........................................................................................................................................... ..................................................................................................................................... [3] (ii) Describe the correct way that the students should do a pedestrian count to get reliable results. ........................................................................................................................................... ........................................................................................................................................... ........................................................................................................................................... ........................................................................................................................................... ........................................................................................................................................... ........................................................................................................................................... ........................................................................................................................................... ..................................................................................................................................... [4] (iii) The students’ results from a reliable pedestrian count are shown in Table 1.3 (Insert). Use the results to draw the bar for 16:00 hours at the city centre in Fig. 1.6. [1] Results of pedestrian count 10:00 13:00 16:00 160 160 160 140 140 140 120 120 120 100 100 100 number of 80 80 80 pedestrians 60 60 60 40 40 40 20 20 20 0 0 0 time of count Key city centre shopping area indoor shopping mall Fig. 1.6 (iv) Which one of the following conclusions about Hypothesis 2: More people visit the city centre shopping area than the indoor shopping mall is correct? Tick (3) your decision in the table below. Support your decision with evidence from Fig. 1.6 and Table 1.3. tick (3) The hypothesis is correct for all times surveyed. The hypothesis is correct for some of the times surveyed. The hypothesis is incorrect for all times surveyed. ........................................................................................................................................... ........................................................................................................................................... ........................................................................................................................................... ........................................................................................................................................... ........................................................................................................................................... ........................................................................................................................................... ........................................................................................................................................... ..................................................................................................................................... [4] (e) As an extension task, two students wanted to find out more about the types of goods sold in shops in the two shopping centres. They had learned in class the difference between high-order and low-order goods. (i) Which two of the following statements about different types of goods are correct? Tick (3) your choices in the table. [2] tick (3) High-order goods are usually more expensive than low-order goods. Older people buy more high-order goods than low-order goods. High-order goods are bought more frequently than low-order goods. High-order goods are better quality than low-order goods. People travel further to buy high-order goods than low-order goods. (ii) The students recorded the different types of shops on a sketch map. Fig. 1.7 on page 9 shows their map of part of the shopping mall. Use the key to shade in the shops selling • PCs/computer tablets/laptop computers • magazines/newspapers. [2] Sketch map of part of the shopping mall health and cinema sportswear beauty products jewellery restaurant pedestrian furniture mall fashionclothes magazines/newspapers tablets/ PCs/ computers computerlaptop chemiststore) (drug cakes cafe Key service high-order goods low-order goods Fig. 1.7 [Total: 30]
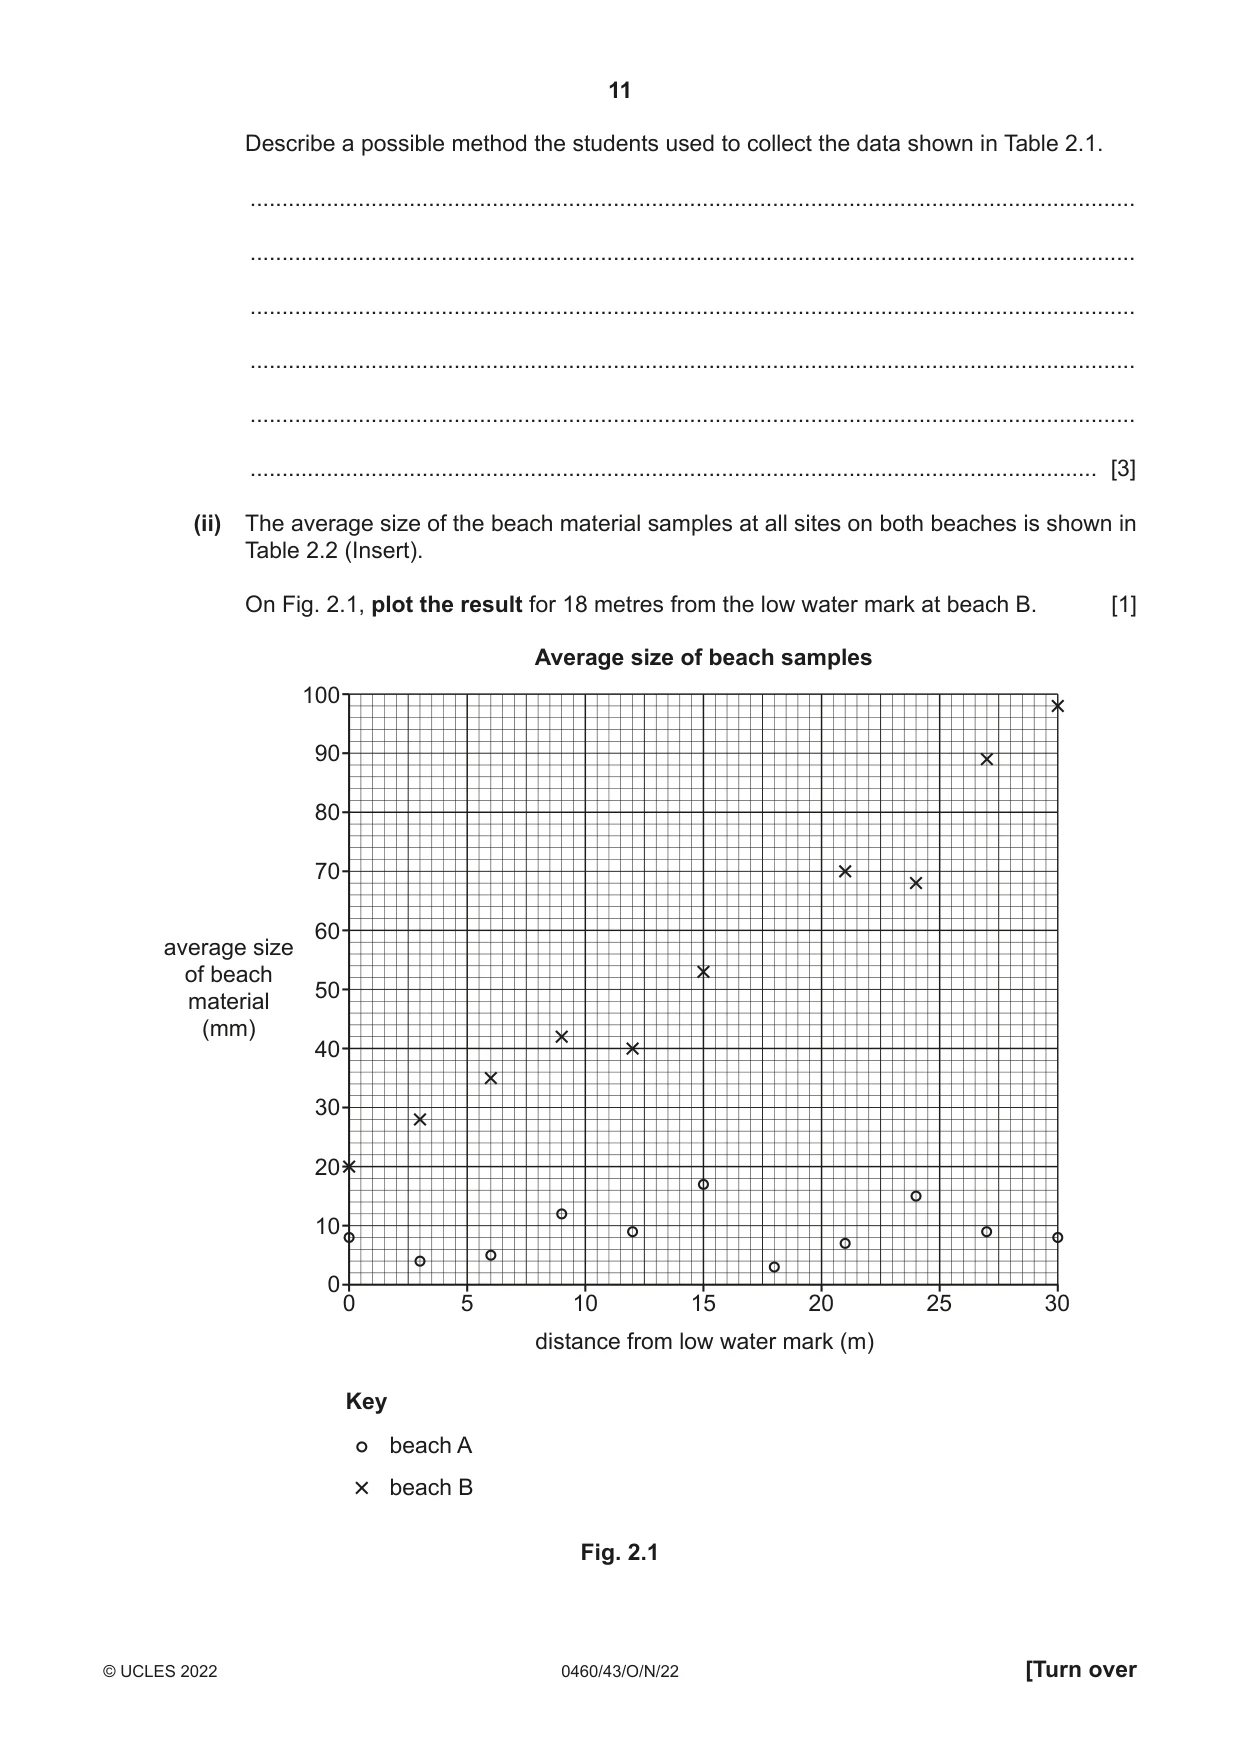
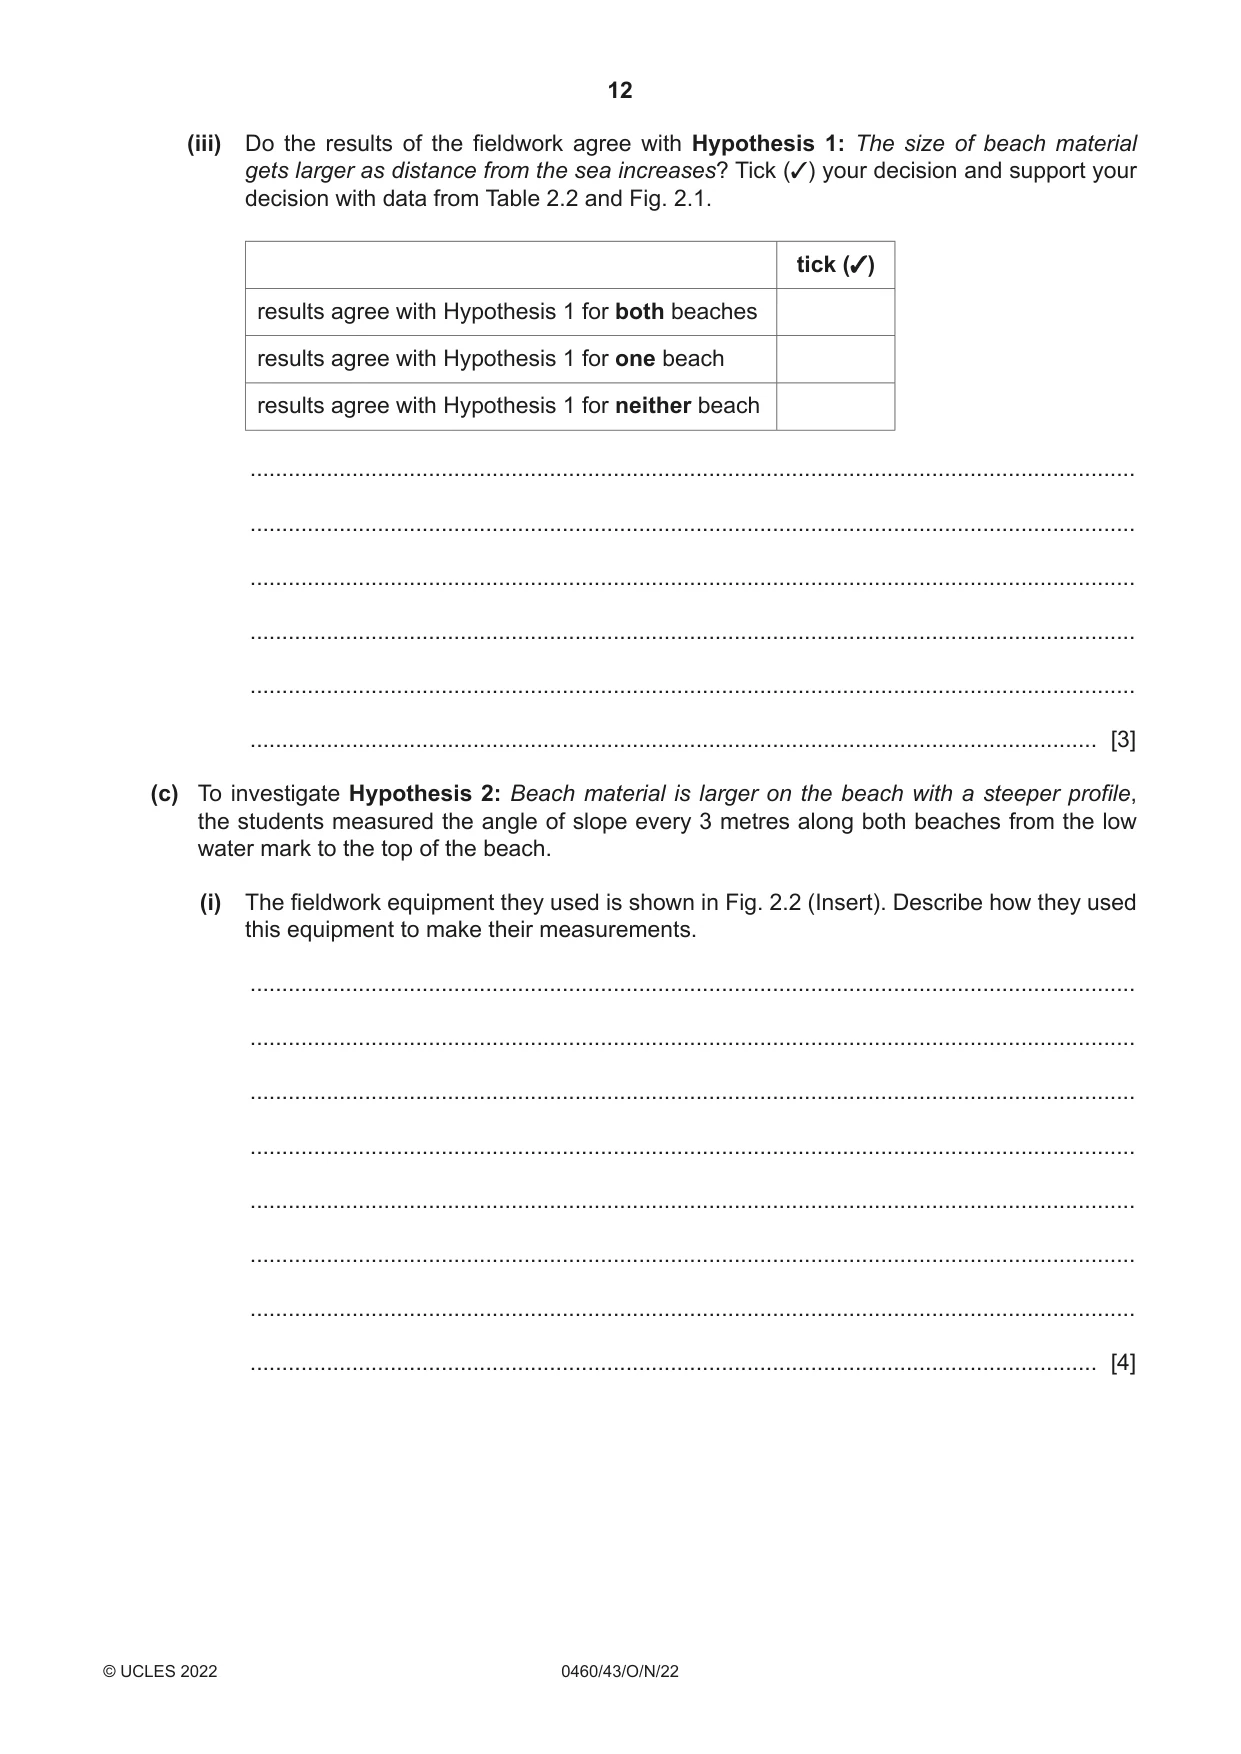
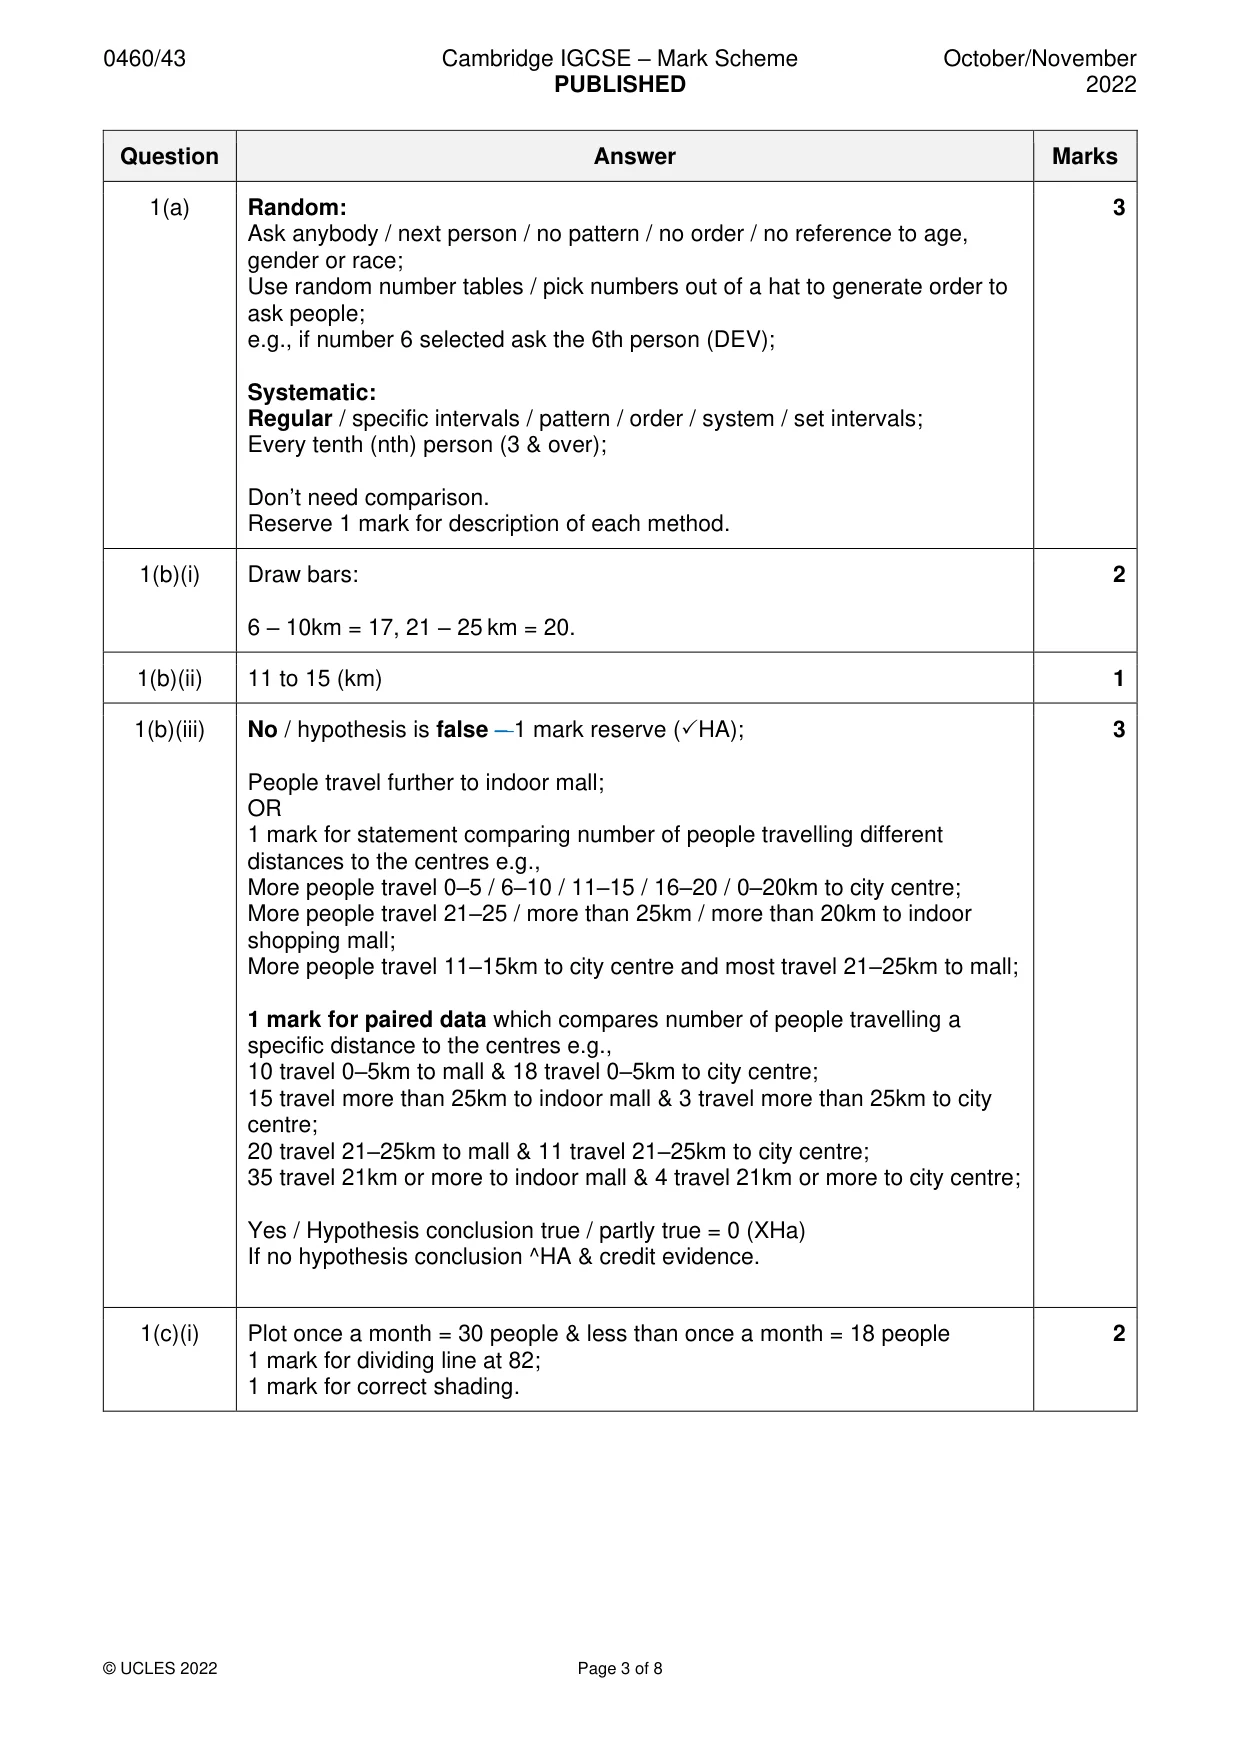
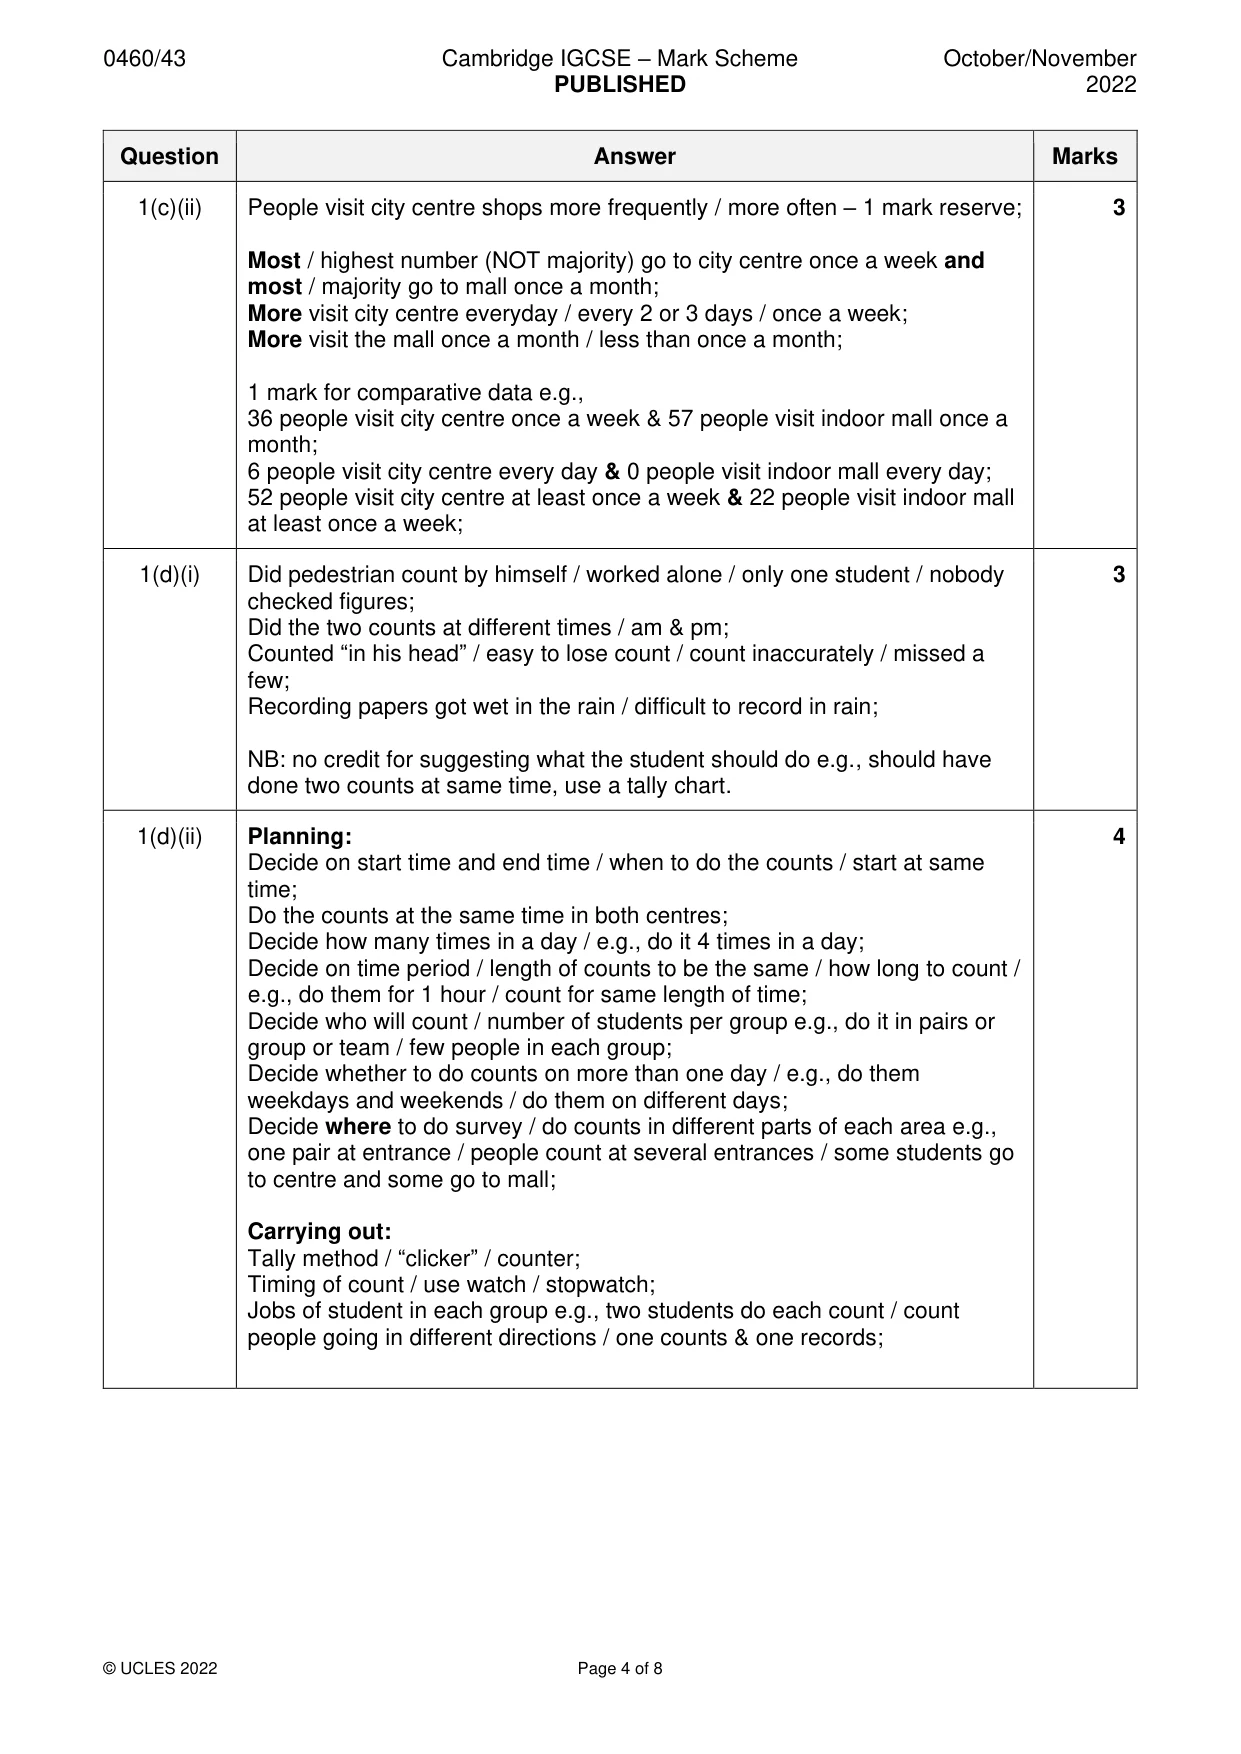
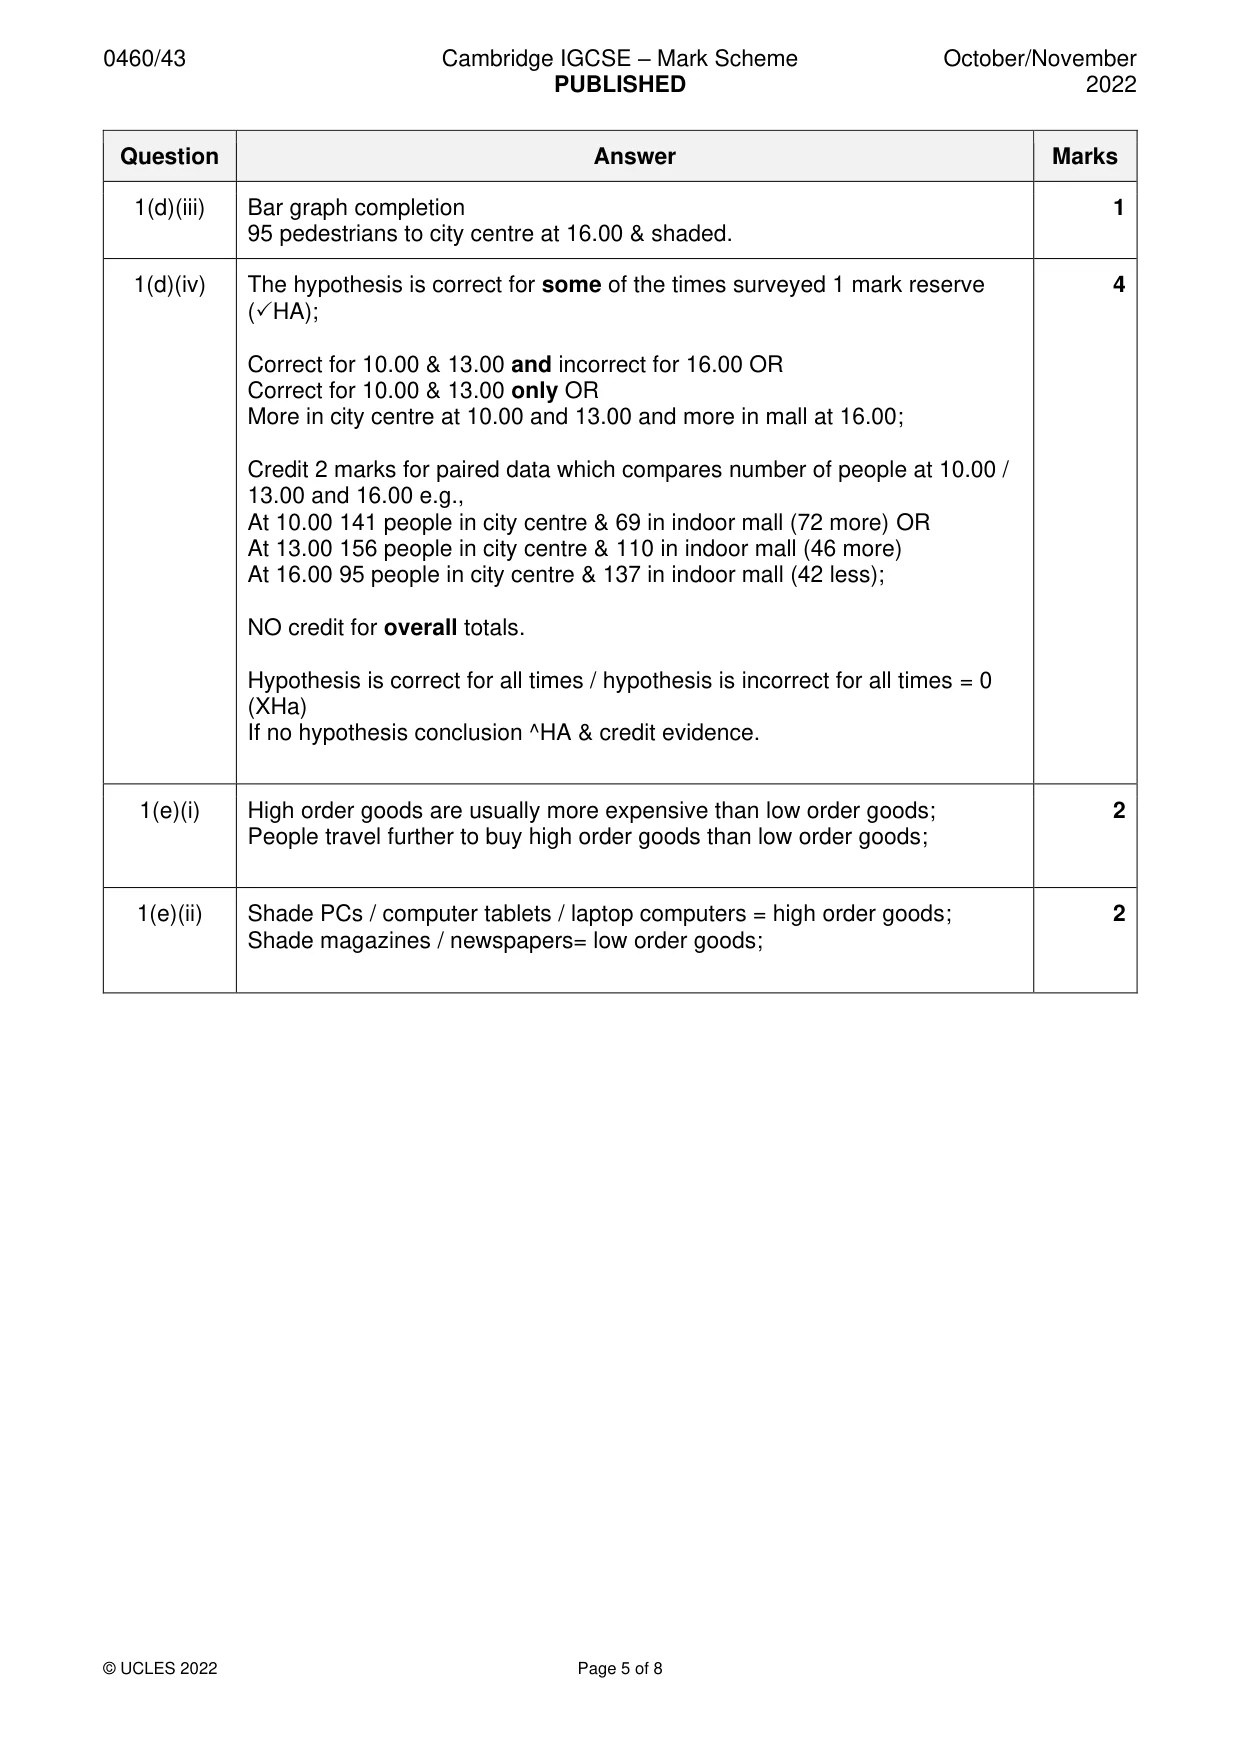
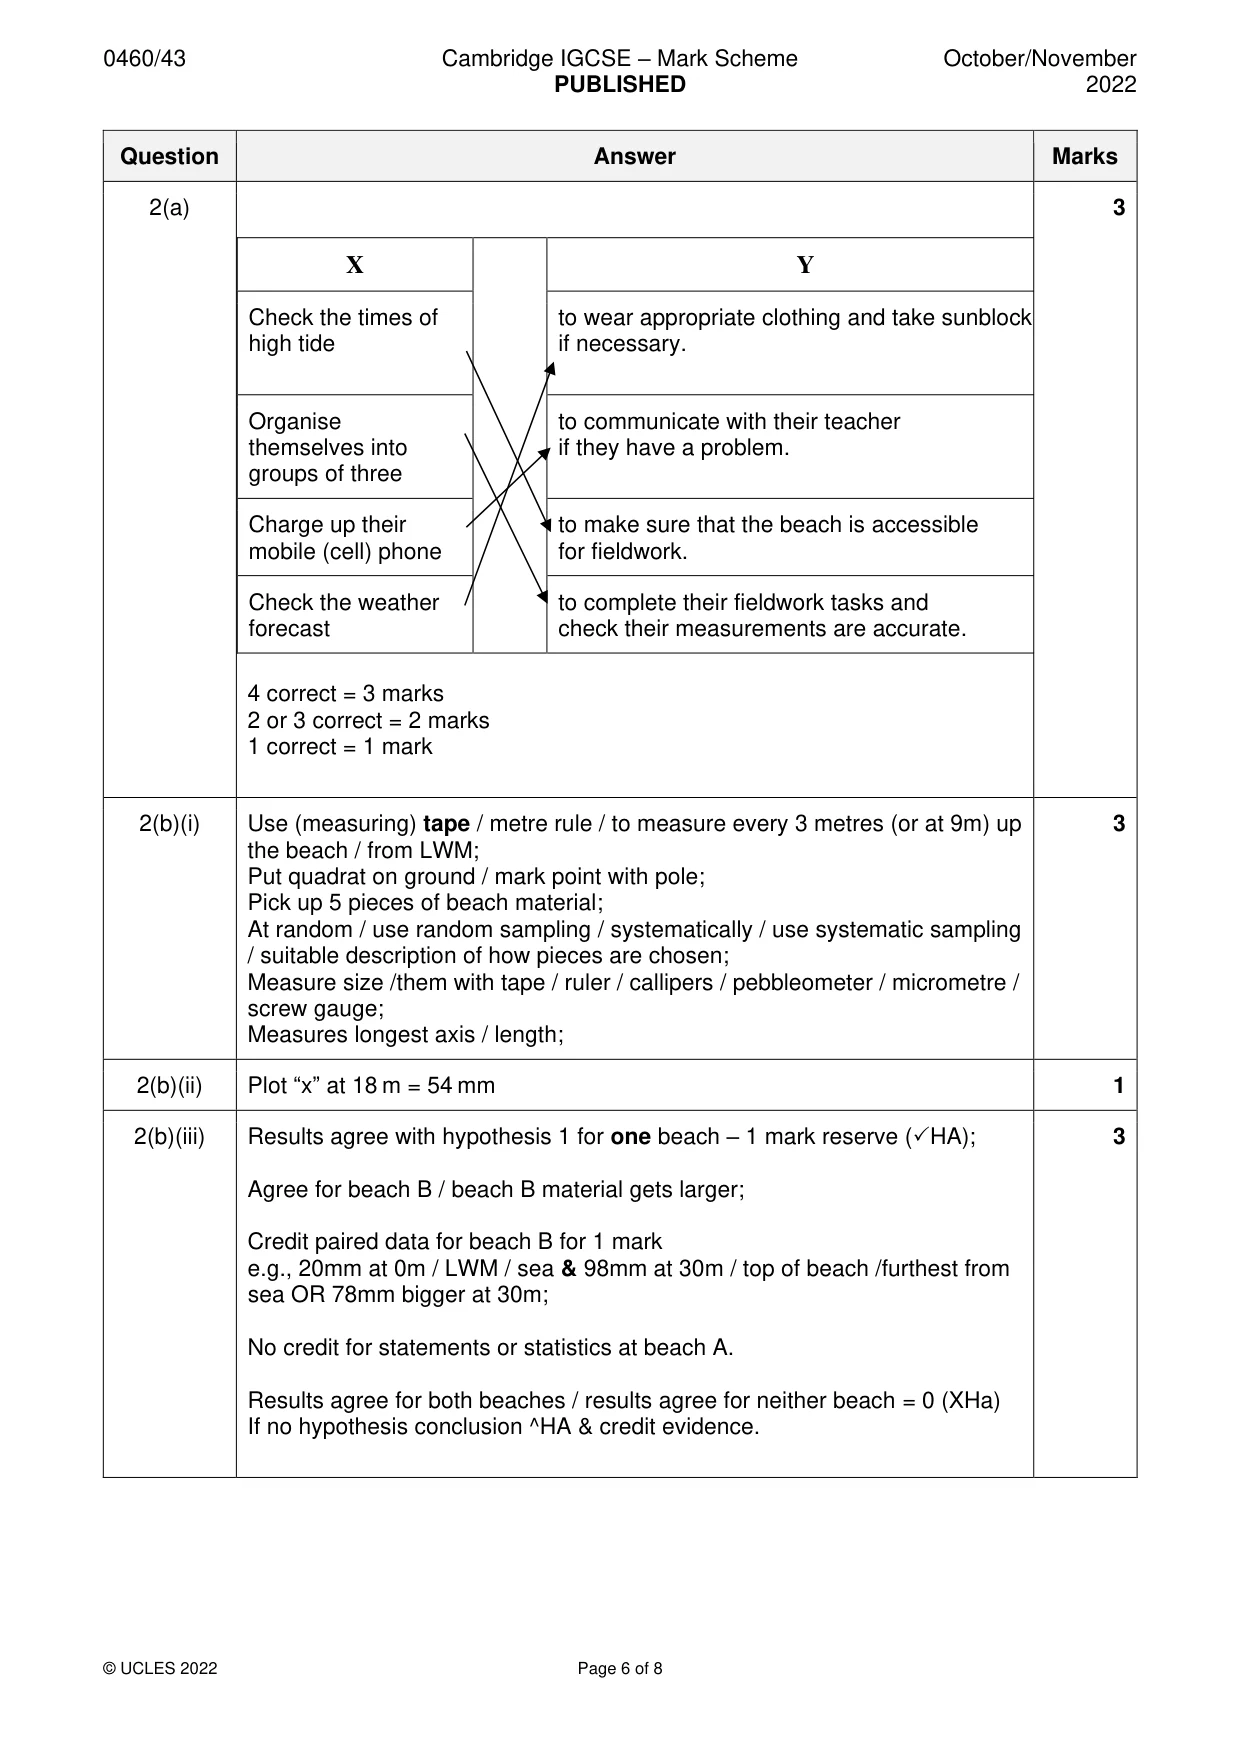
Mark scheme: Question Answer Marks 1(a) Random: 3 Ask anybody / next person / no pattern / no order / no reference to age, gender or race; Use random number tables / pick numbers out of a hat to generate order to ask people; e.g., if number 6 selected ask the 6th person (DEV); Systematic: Regular / specific intervals / pattern / order / system / set intervals; Every tenth (nth) person (3 & over); Don’t need comparison. Reserve 1 mark for description of each method. 1(b)(i) Draw bars: 2 6 – 10km = 17, 21 – 25 km = 20. 1(b)(ii) 11 to 15 (km) 1 1(b)(iii) No / hypothesis is false – 1 mark reserve (HA); 3 People travel further to indoor mall; OR 1 mark for statement comparing number of people travelling different distances to the centres e.g., More people travel 0–5 / 6–10 / 11–15 / 16–20 / 0–20km to city centre; More people travel 21–25 / more than 25km / more than 20km to indoor shopping mall; More people travel 11–15km to city centre and most travel 21–25km to mall; 1 mark for paired data which compares number of people travelling a specific distance to the centres e.g., 10 travel 0–5km to mall & 18 travel 0–5km to city centre; 15 travel more than 25km to indoor mall & 3 travel more than 25km to city centre; 20 travel 21–25km to mall & 11 travel 21–25km to city centre; 35 travel 21km or more to indoor mall & 4 travel 21km or more to city centre; Yes / Hypothesis conclusion true / partly true = 0 (XHa) If no hypothesis conclusion ^HA & credit evidence. 1(c)(i) Plot once a month = 30 people & less than once a month = 18 people 2 1 mark for dividing line at 82; 1 mark for correct shading. 1(c)(ii) People visit city centre shops more frequently / more often – 1 mark reserve; 3 Most / highest number (NOT majority) go to city centre once a week and most / majority go to mall once a month; More visit city centre everyday / every 2 or 3 days / once a week; More visit the mall once a month / less than once a month; 1 mark for comparative data e.g., 36 people visit city centre once a week & 57 people visit indoor mall once a month; 6 people visit city centre every day & 0 people visit indoor mall every day; 52 people visit city centre at least once a week & 22 people visit indoor mall at least once a week; 1(d)(i) Did pedestrian count by himself / worked alone / only one student / nobody 3 checked figures; Did the two counts at different times / am & pm; Counted “in his head” / easy to lose count / count inaccurately / missed a few; Recording papers got wet in the rain / difficult to record in rain; NB: no credit for suggesting what the student should do e.g., should have done two counts at same time, use a tally chart. 1(d)(ii) Planning: 4 Decide on start time and end time / when to do the counts / start at same time; Do the counts at the same time in both centres; Decide how many times in a day / e.g., do it 4 times in a day; Decide on time period / length of counts to be the same / how long to count / e.g., do them for 1 hour / count for same length of time; Decide who will count / number of students per group e.g., do it in pairs or group or team / few people in each group; Decide whether to do counts on more than one day / e.g., do them weekdays and weekends / do them on different days; Decide where to do survey / do counts in different parts of each area e.g., one pair at entrance / people count at several entrances / some students go to centre and some go to mall; Carrying out: Tally method / “clicker” / counter; Timing of count / use watch / stopwatch; Jobs of student in each group e.g., two students do each count / count people going in different directions / one counts & one records; 1(d)(iii) Bar graph completion 1 95 pedestrians to city centre at 16.00 & shaded. 1(d)(iv) The hypothesis is correct for some of the times surveyed 1 mark reserve 4 (HA); Correct for 10.00 & 13.00 and incorrect for 16.00 OR Correct for 10.00 & 13.00 only OR More in city centre at 10.00 and 13.00 and more in mall at 16.00; Credit 2 marks for paired data which compares number of people at 10.00 / 13.00 and 16.00 e.g., At 10.00 141 people in city centre & 69 in indoor mall (72 more) OR At 13.00 156 people in city centre & 110 in indoor mall (46 more) At 16.00 95 people in city centre & 137 in indoor mall (42 less); NO credit for overall totals. Hypothesis is correct for all times / hypothesis is incorrect for all times = 0 (XHa) If no hypothesis conclusion ^HA & credit evidence. 1(e)(i) High order goods are usually more expensive than low order goods; 2 People travel further to buy high order goods than low order goods; 1(e)(ii) Shade PCs / computer tablets / laptop computers = high order goods; 2 Shade magazines / newspapers= low order goods; 2(a) 3 X Y Check the times of to wear appropriate clothing and take sunblock high tide if necessary. Organise to communicate with their teacher themselves into if they have a problem. groups of three Charge up their to make sure that the beach is accessible mobile (cell) phone for fieldwork. Check the weather to complete their fieldwork tasks and forecast check their measurements are accurate. 4 correct = 3 marks 2 or 3 correct = 2 marks 1 correct = 1 mark 2(b)(i) Use (measuring) tape / metre rule / to measure every 3 metres (or at 9m) up 3 the beach / from LWM; Put quadrat on ground / mark point with pole; Pick up 5 pieces of beach material; At random / use random sampling / systematically / use systematic sampling / suitable description of how pieces are chosen; Measure size /them with tape / ruler / callipers / pebbleometer / micrometre / screw gauge; Measures longest axis / length; 2(b)(ii) Plot “x” at 18 m = 54 mm 1 2(b)(iii) Results agree with hypothesis 1 for one beach – 1 mark reserve (HA); 3 Agree for beach B / beach B material gets larger; Credit paired data for beach B for 1 mark e.g., 20mm at 0m / LWM / sea & 98mm at 30m / top of beach /furthest from sea OR 78mm bigger at 30m; No credit for statements or statistics at beach A. Results agree for both beaches / results agree for neither beach = 0 (XHa) If no hypothesis conclusion ^HA & credit evidence.
More questions on Settlements (rural and urban) and service provision
Q2 · Students in Scotland, UK, planned fieldwork at two local beaches (beach A and beach B)
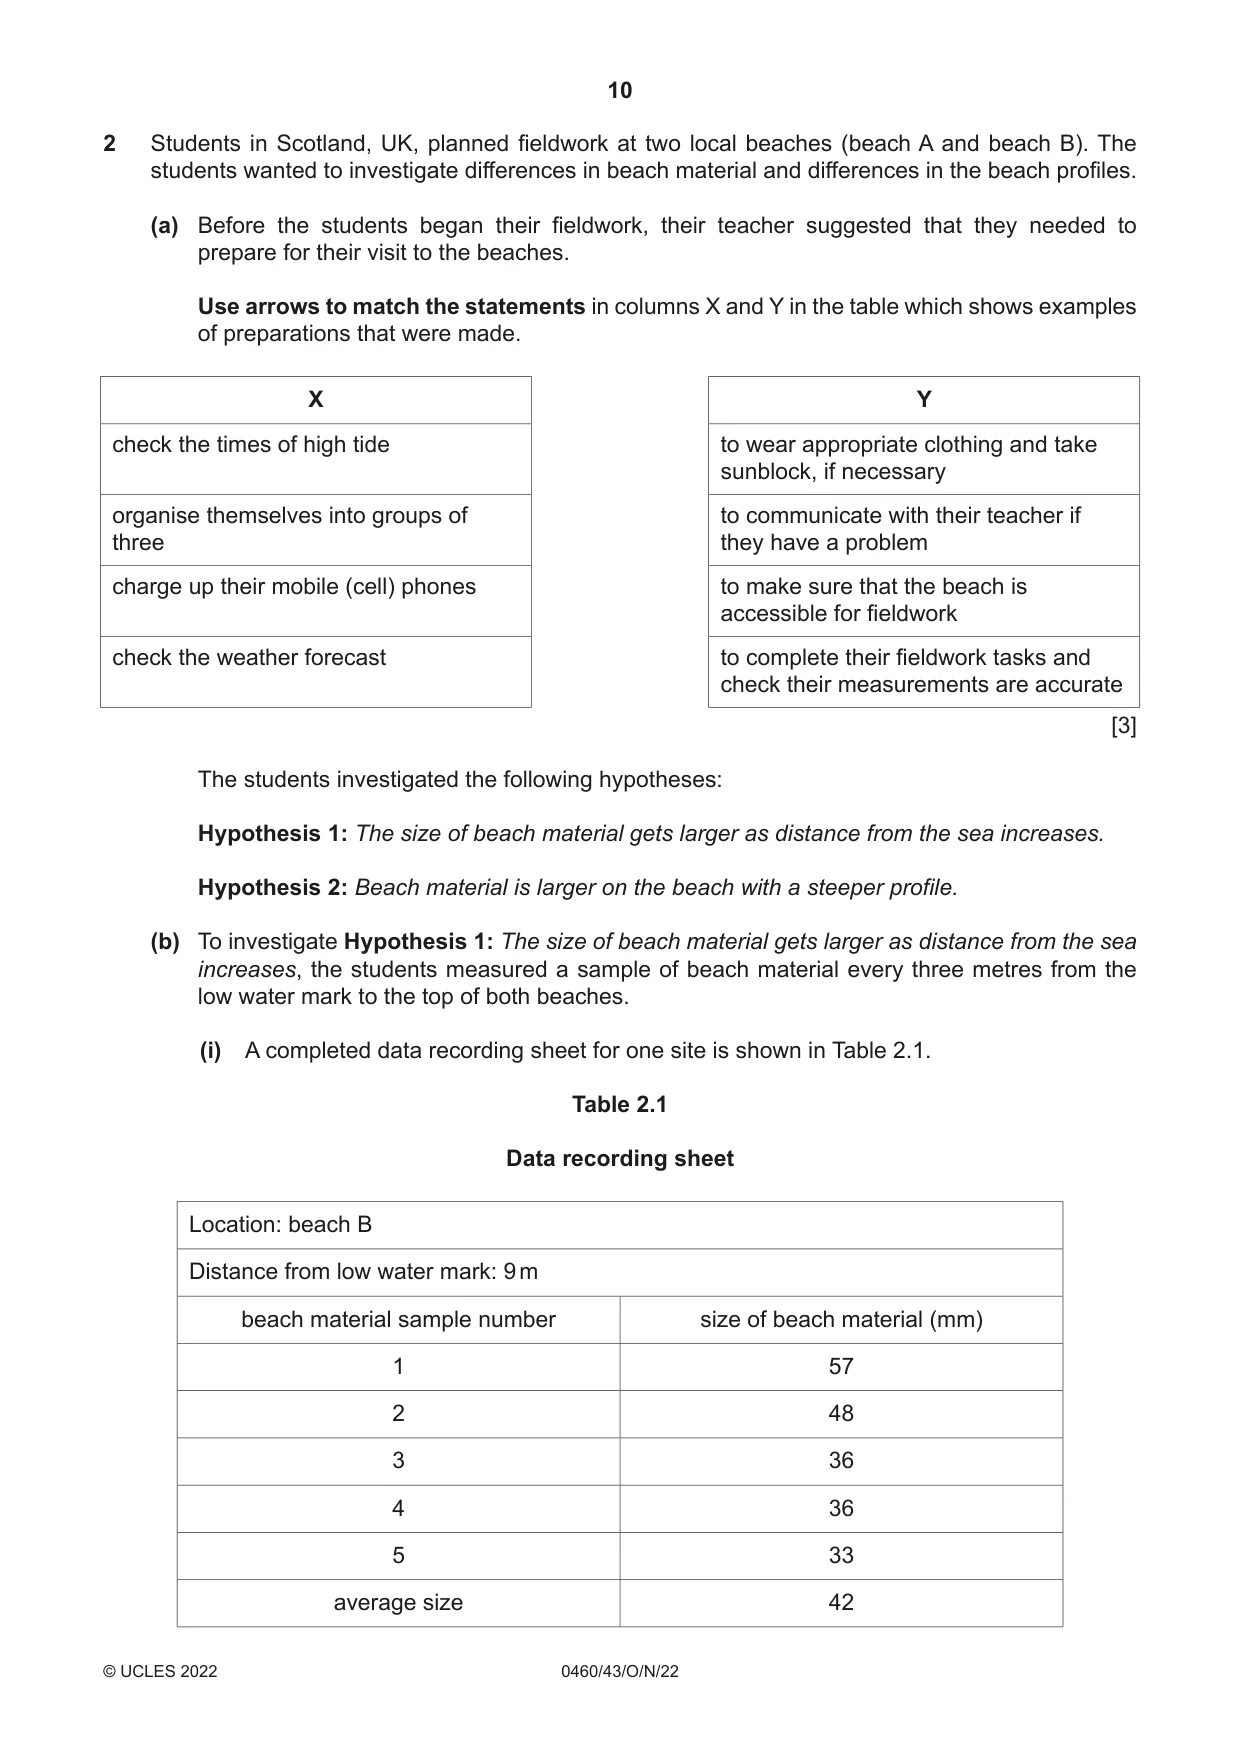
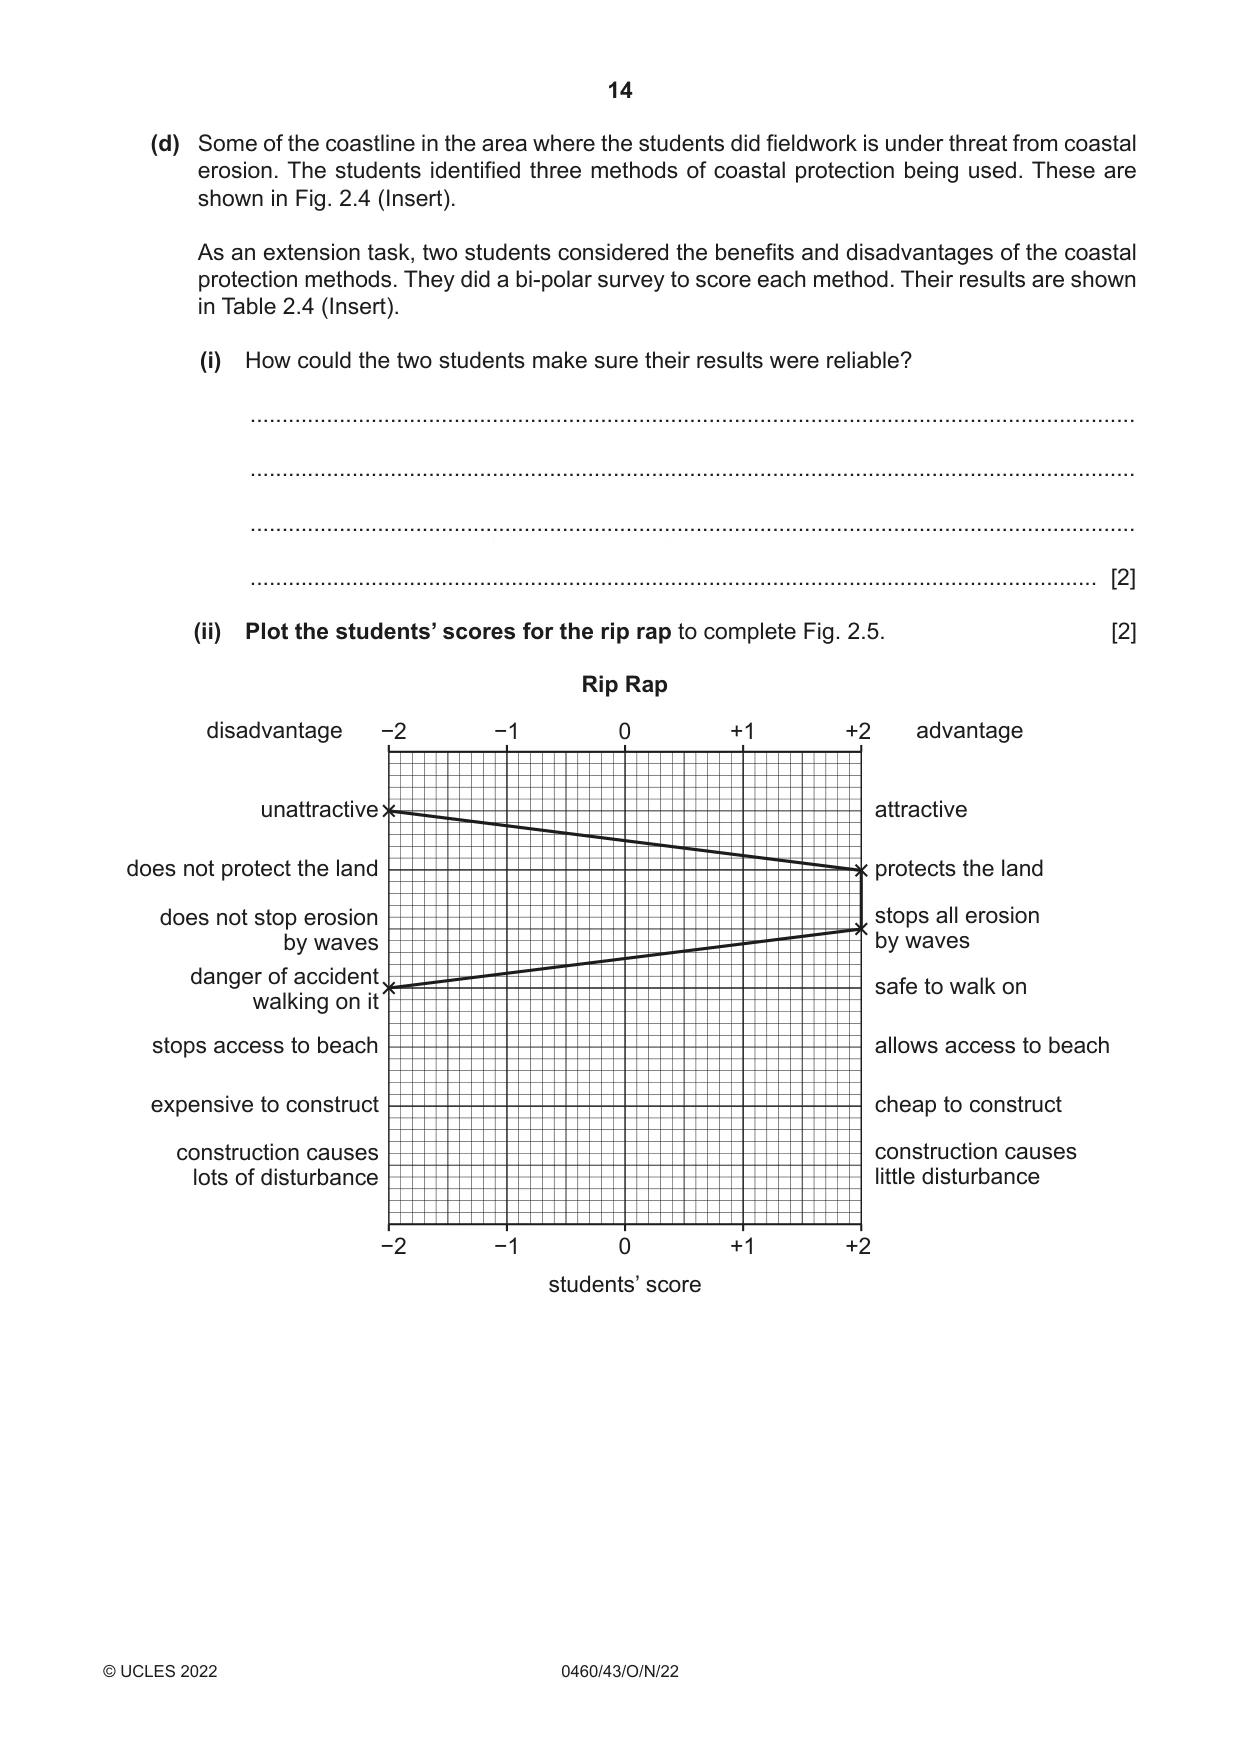
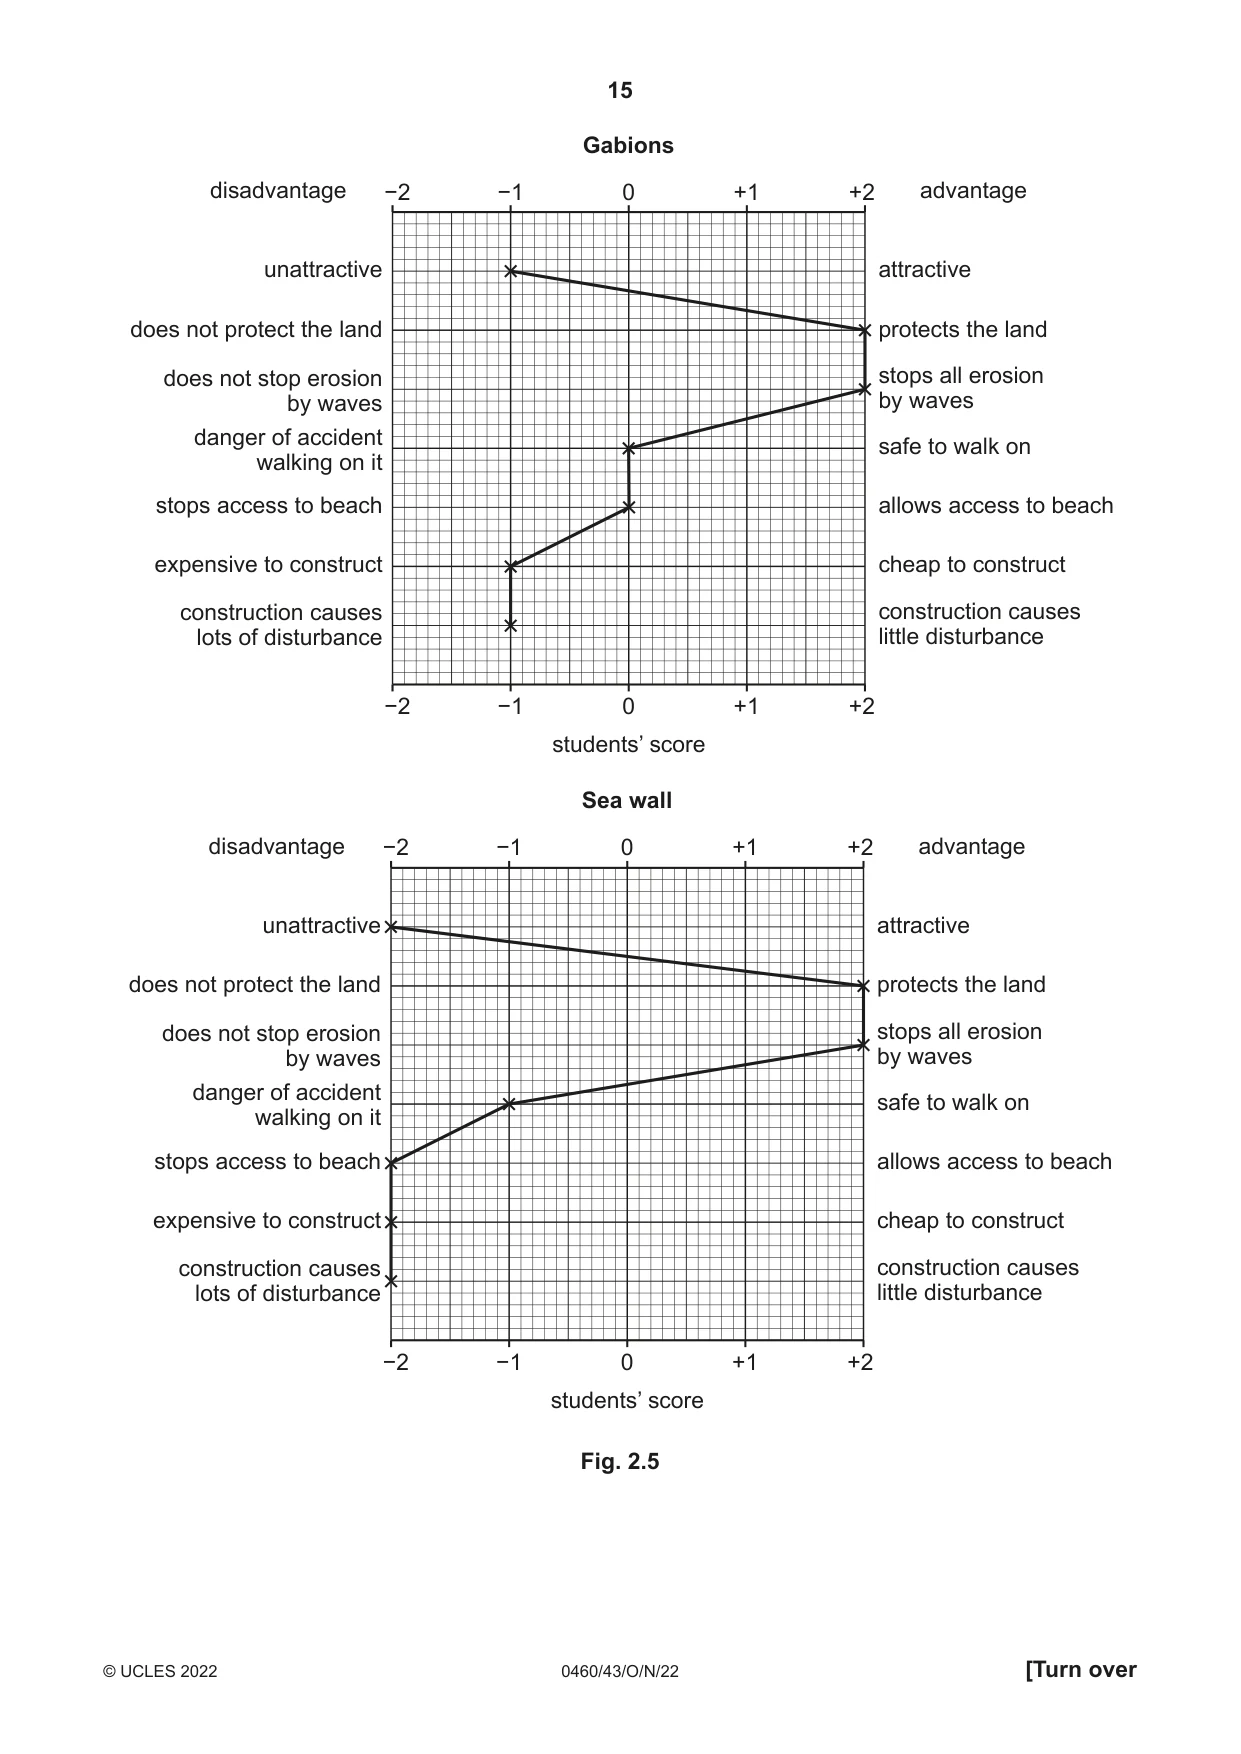
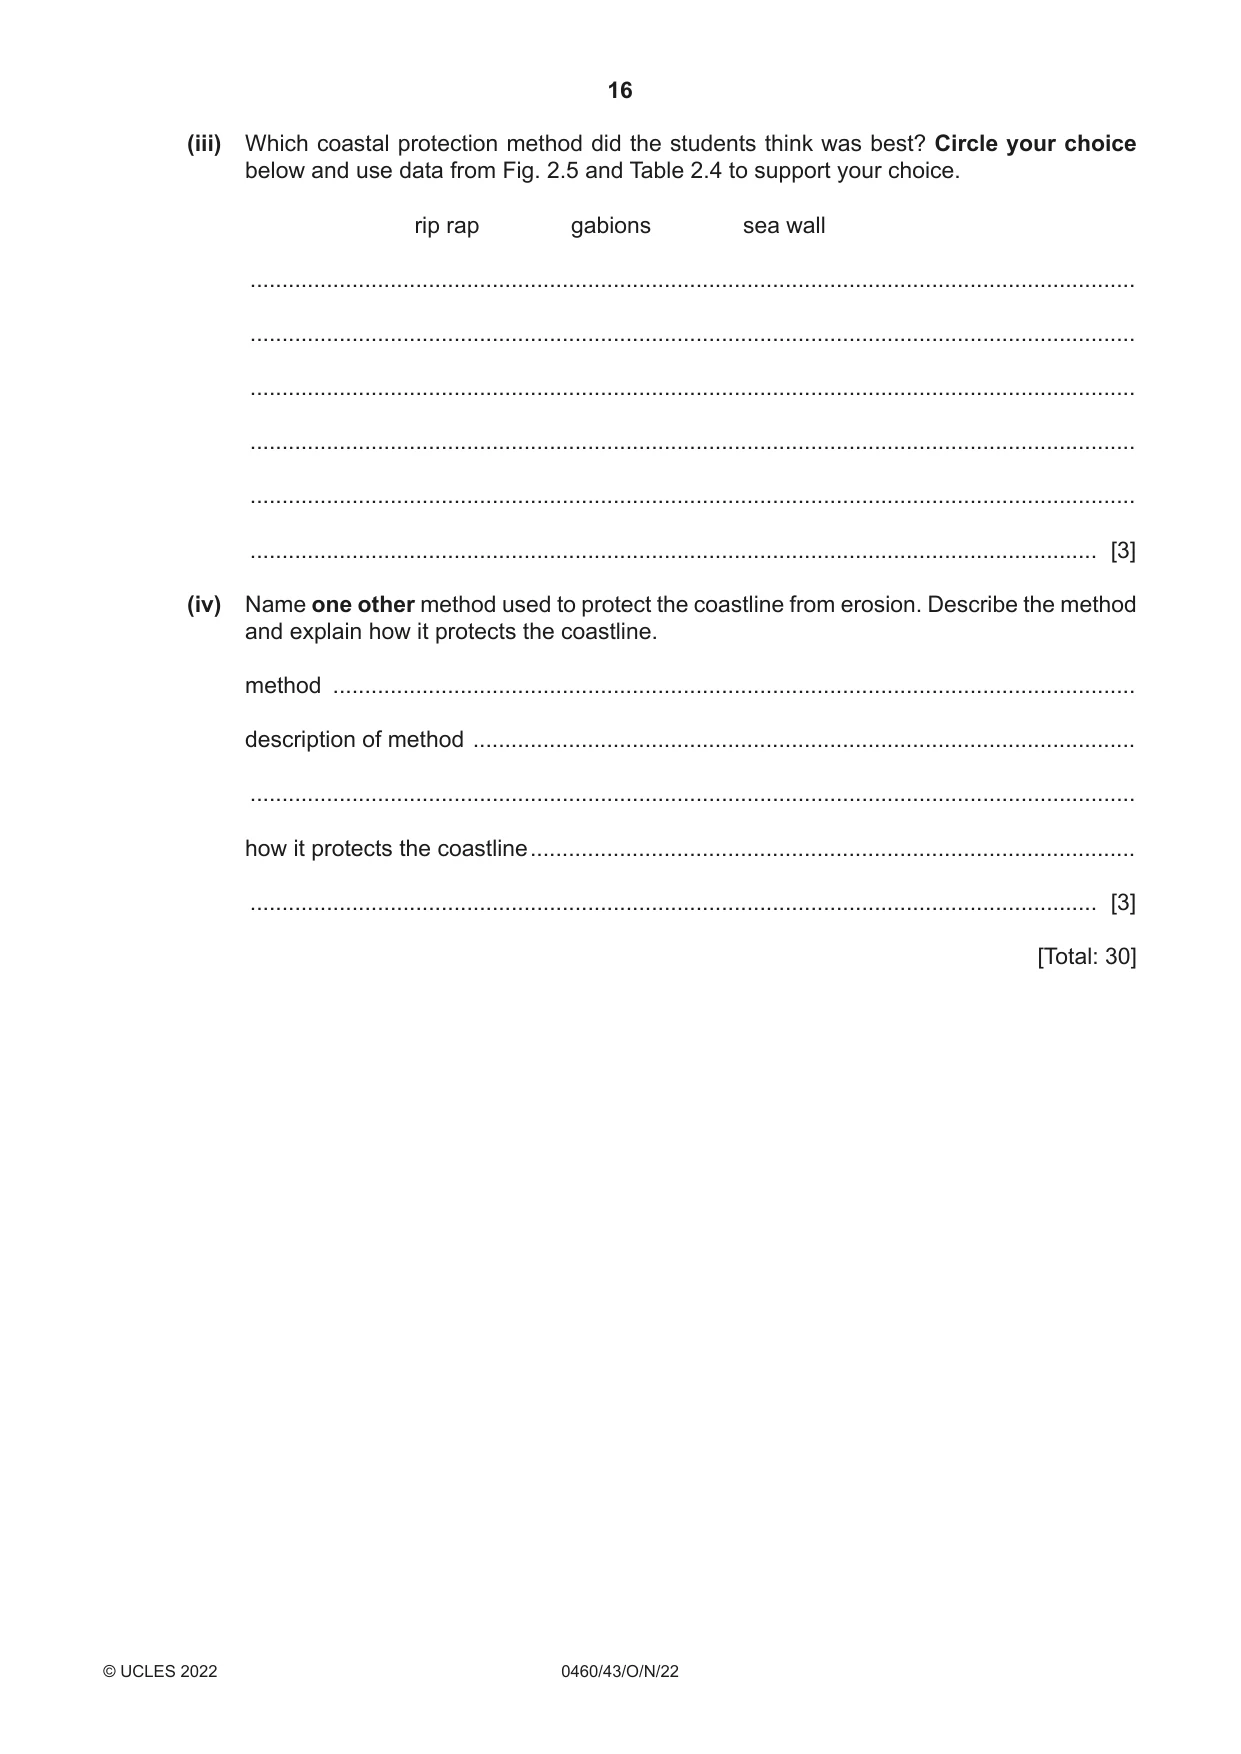
2 Students in Scotland, UK, planned fieldwork at two local beaches (beach A and beach B). The students wanted to investigate differences in beach material and differences in the beach profiles. (a) Before the students began their fieldwork, their teacher suggested that they needed to prepare for their visit to the beaches. Use arrows to match the statements in columns X and Y in the table which shows examples of preparations that were made. X Y check the times of high tide to wear appropriate clothing and take sunblock, if necessary organise themselves into groups of to communicate with their teacher if three they have a problem charge up their mobile (cell) phones to make sure that the beach is accessible for fieldwork check the weather forecast to complete their fieldwork tasks and check their measurements are accurate [3] The students investigated the following hypotheses: Hypothesis 1: The size of beach material gets larger as distance from the sea increases. Hypothesis 2: Beach material is larger on the beach with a steeper profile. (b) To investigate Hypothesis 1: The size of beach material gets larger as distance from the sea increases, the students measured a sample of beach material every three metres from the low water mark to the top of both beaches. (i) A completed data recording sheet for one site is shown in Table 2.1. Table 2.1 Data recording sheet Location: beach B Distance from low water mark: 9 m beach material sample number size of beach material (mm) 1 57 2 48 3 36 4 36 5 33 average size 42 Describe a possible method the students used to collect the data shown in Table 2.1. ........................................................................................................................................... ........................................................................................................................................... ........................................................................................................................................... ........................................................................................................................................... ........................................................................................................................................... ..................................................................................................................................... [3] (ii) The average size of the beach material samples at all sites on both beaches is shown in Table 2.2 (Insert). On Fig. 2.1, plot the result for 18 metres from the low water mark at beach B. [1] Average size of beach samples 100 90 80 70 60 average size of beach 50 material (mm) 40 30 20 10 0 0 5 10 15 20 25 30 distance from low water mark (m) Key beach A beach B Fig. 2.1 (iii) Do the results of the fieldwork agree with Hypothesis 1: The size of beach material gets larger as distance from the sea increases? Tick (3) your decision and support your decision with data from Table 2.2 and Fig. 2.1. tick (3) results agree with Hypothesis 1 for both beaches results agree with Hypothesis 1 for one beach results agree with Hypothesis 1 for neither beach ........................................................................................................................................... ........................................................................................................................................... ........................................................................................................................................... ........................................................................................................................................... ........................................................................................................................................... ..................................................................................................................................... [3] (c) To investigate Hypothesis 2: Beach material is larger on the beach with a steeper profile, the students measured the angle of slope every 3 metres along both beaches from the low water mark to the top of the beach. (i) The fieldwork equipment they used is shown in Fig. 2.2 (Insert). Describe how they used this equipment to make their measurements. ........................................................................................................................................... ........................................................................................................................................... ........................................................................................................................................... ........................................................................................................................................... ........................................................................................................................................... ........................................................................................................................................... ........................................................................................................................................... ..................................................................................................................................... [4]
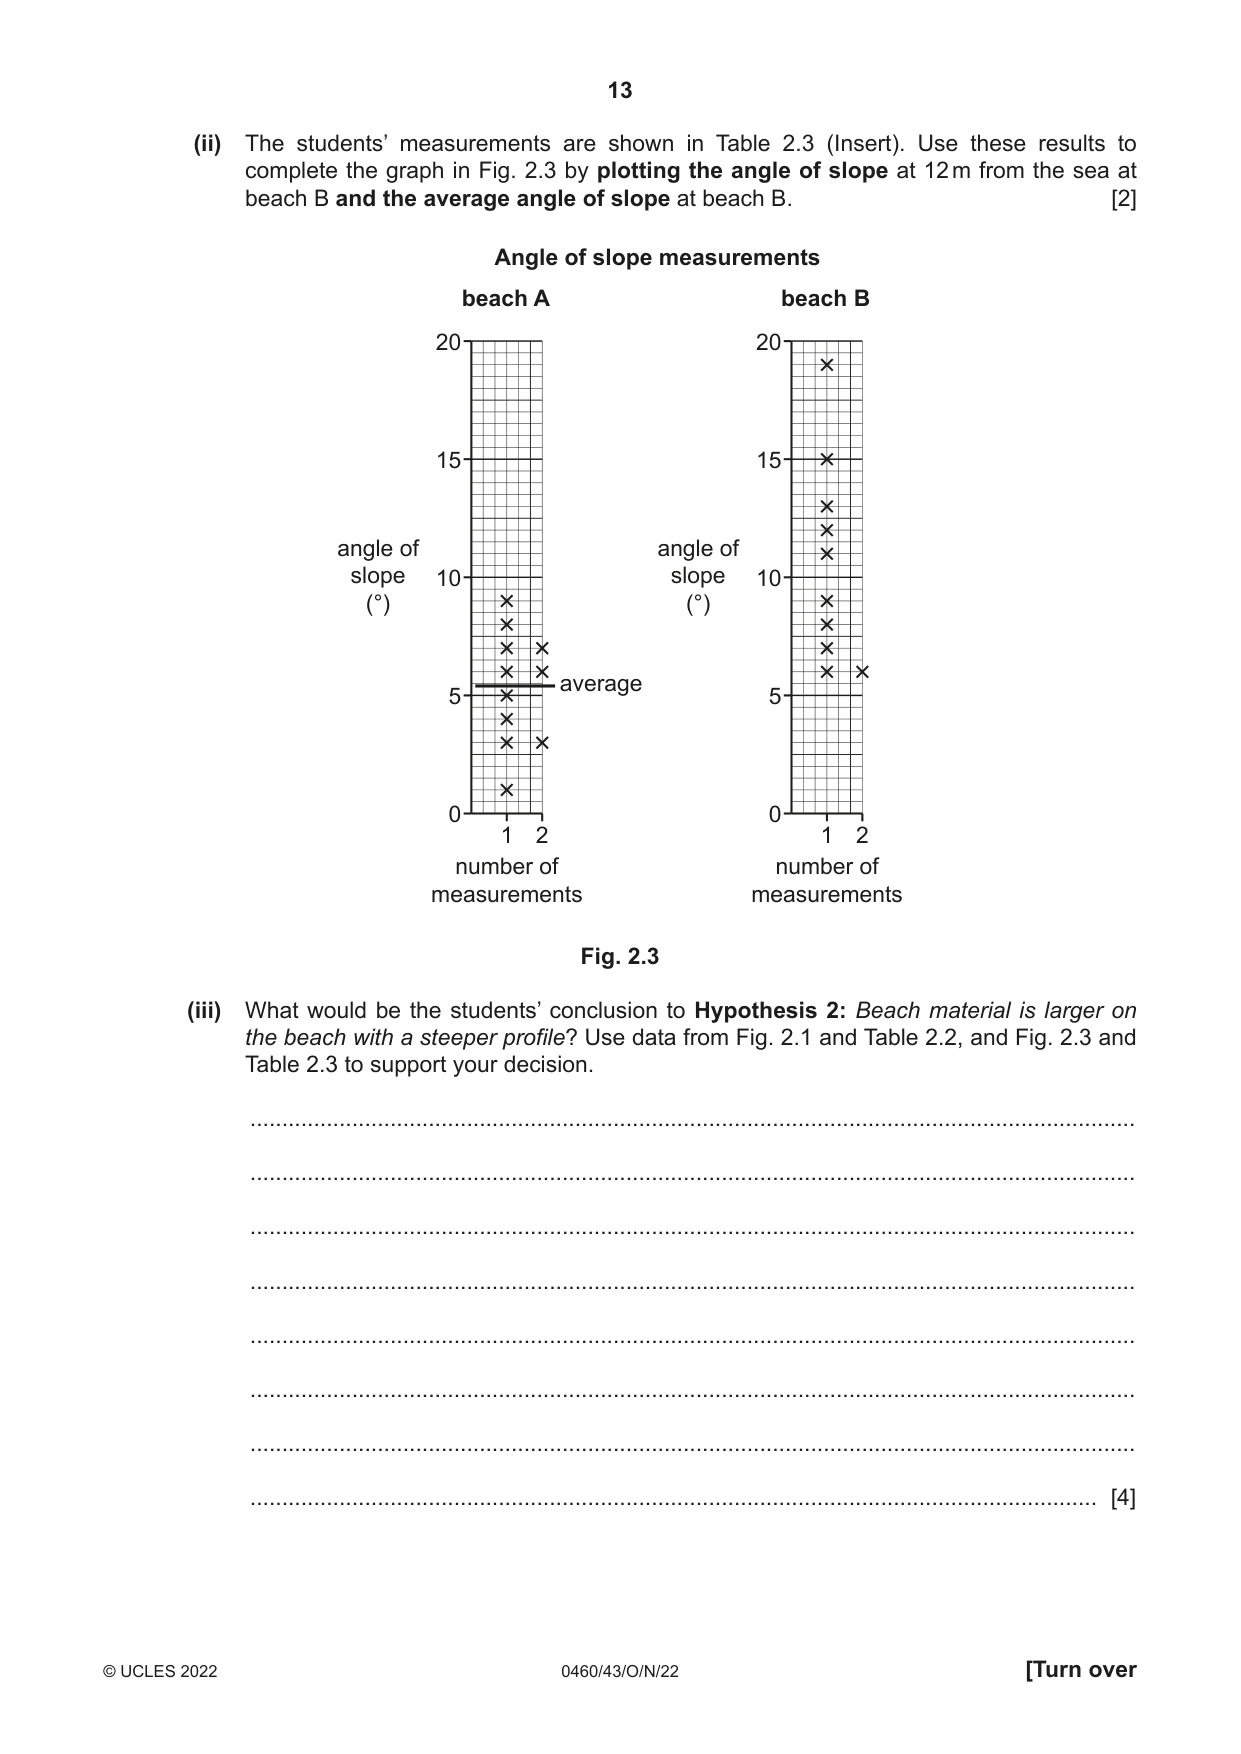
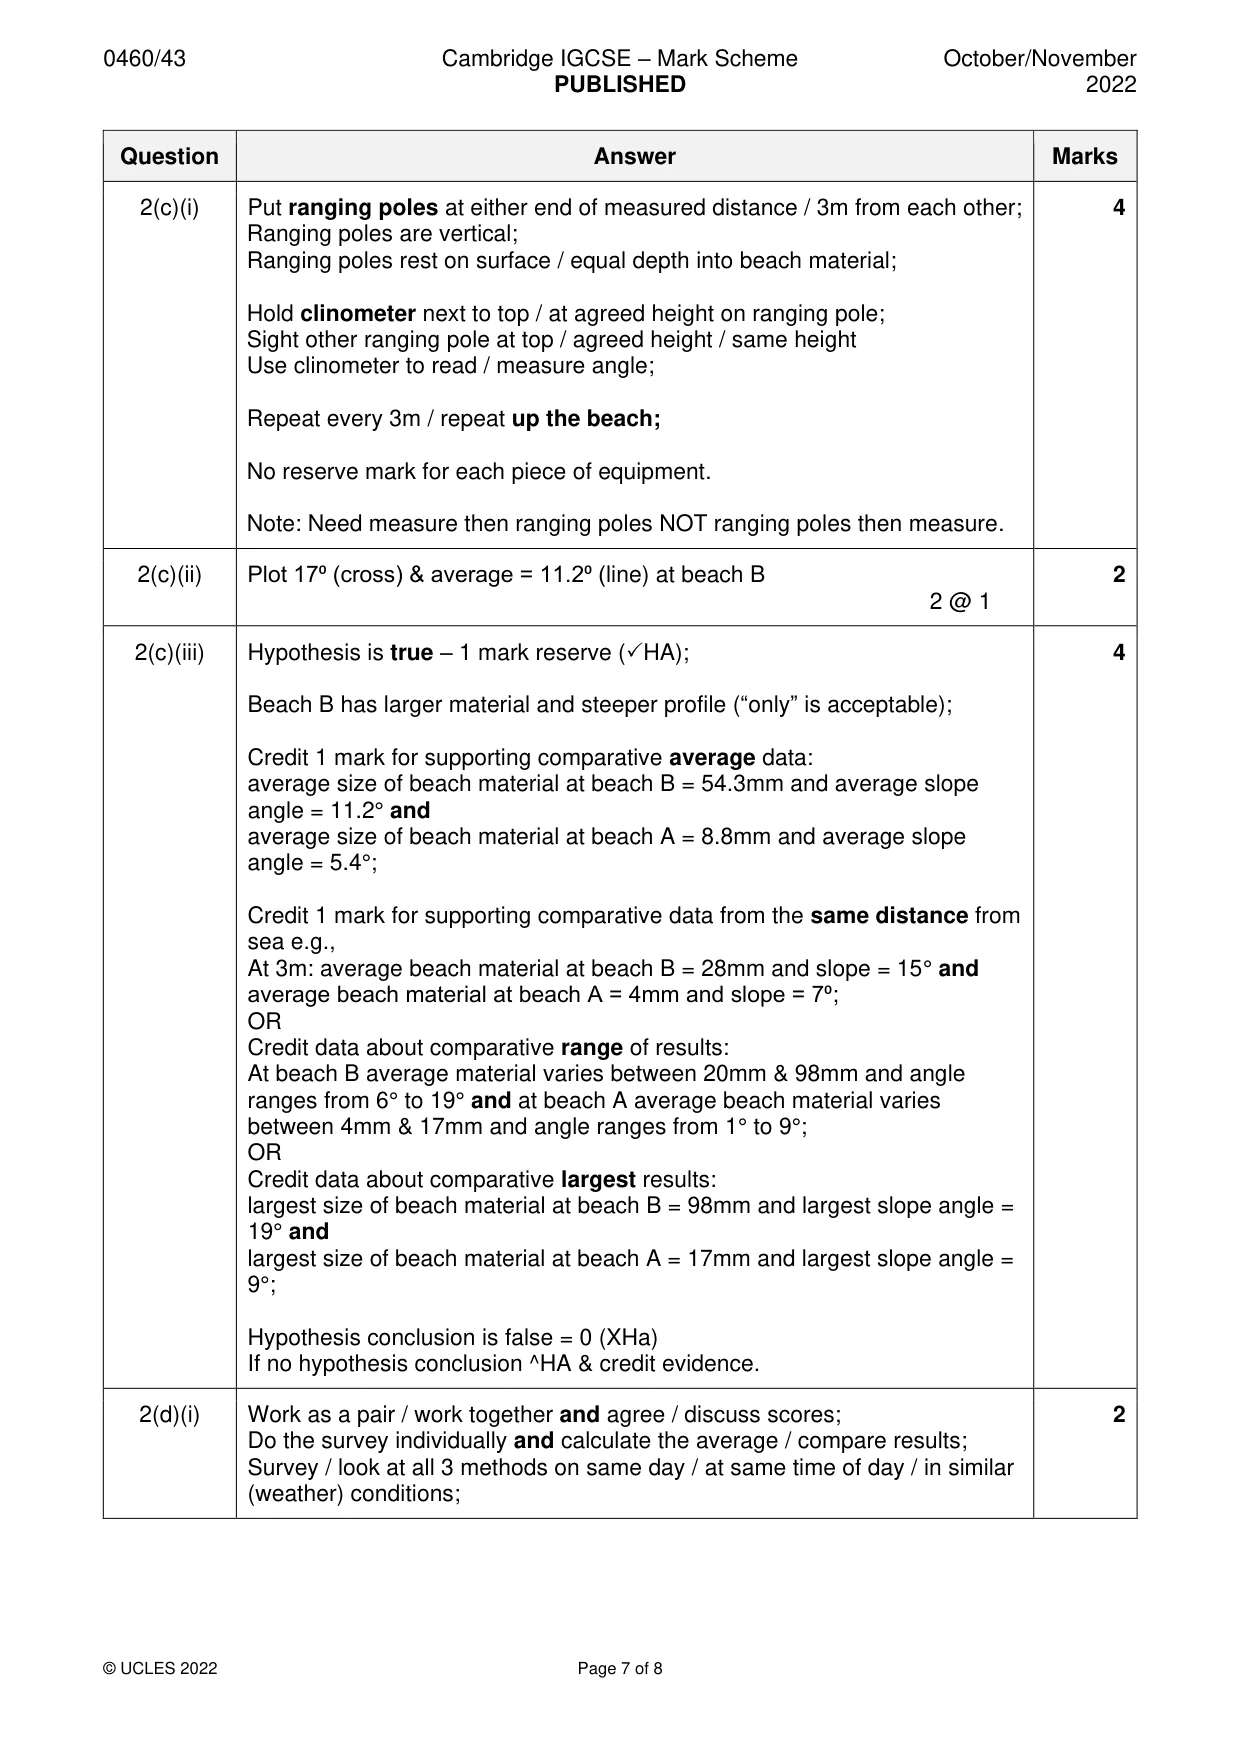
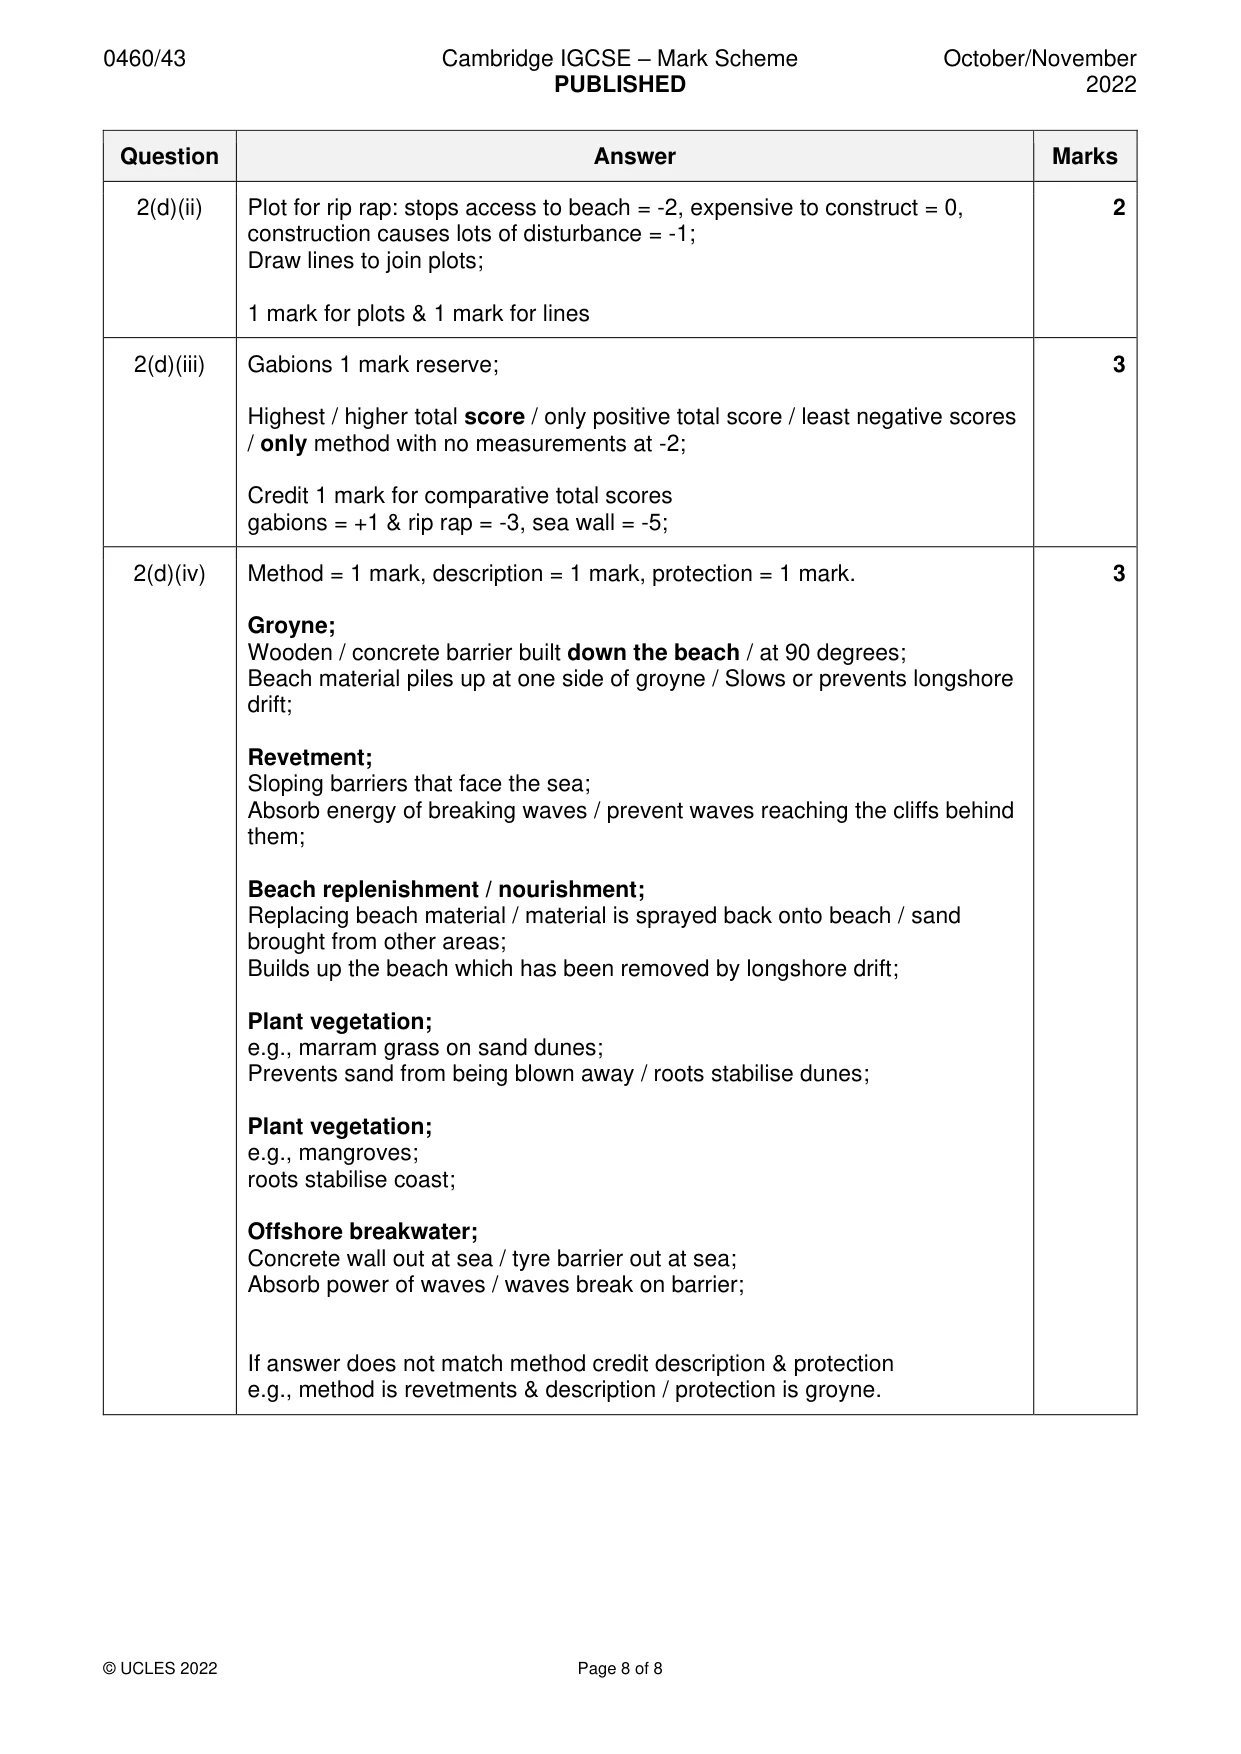
Mark scheme: 2(c)(i) Put ranging poles at either end of measured distance / 3m from each other; 4 Ranging poles are vertical; Ranging poles rest on surface / equal depth into beach material; Hold clinometer next to top / at agreed height on ranging pole; Sight other ranging pole at top / agreed height / same height Use clinometer to read / measure angle; Repeat every 3m / repeat up the beach; No reserve mark for each piece of equipment. Note: Need measure then ranging poles NOT ranging poles then measure. 2(c)(ii) Plot 17⁰ (cross) & average = 11.2⁰ (line) at beach B 2 2 @ 1 2(c)(iii) Hypothesis is true – 1 mark reserve (HA); 4 Beach B has larger material and steeper profile (“only” is acceptable); Credit 1 mark for supporting comparative average data: average size of beach material at beach B = 54.3mm and average slope angle = 11.2° and average size of beach material at beach A = 8.8mm and average slope angle = 5.4°; Credit 1 mark for supporting comparative data from the same distance from sea e.g., At 3m: average beach material at beach B = 28mm and slope = 15° and average beach material at beach A = 4mm and slope = 7⁰; OR Credit data about comparative range of results: At beach B average material varies between 20mm & 98mm and angle ranges from 6° to 19° and at beach A average beach material varies between 4mm & 17mm and angle ranges from 1° to 9°; OR Credit data about comparative largest results: largest size of beach material at beach B = 98mm and largest slope angle = 19° and largest size of beach material at beach A = 17mm and largest slope angle = 9°; Hypothesis conclusion is false = 0 (XHa) If no hypothesis conclusion ^HA & credit evidence. 2(d)(i) Work as a pair / work together and agree / discuss scores; 2 Do the survey individually and calculate the average / compare results; Survey / look at all 3 methods on same day / at same time of day / in similar (weather) conditions; 2(d)(ii) Plot for rip rap: stops access to beach = -2, expensive to construct = 0, 2 construction causes lots of disturbance = -1; Draw lines to join plots; 1 mark for plots & 1 mark for lines 2(d)(iii) Gabions 1 mark reserve; 3 Highest / higher total score / only positive total score / least negative scores / only method with no measurements at -2; Credit 1 mark for comparative total scores gabions = +1 & rip rap = -3, sea wall = -5; 2(d)(iv) Method = 1 mark, description = 1 mark, protection = 1 mark. 3 Groyne; Wooden / concrete barrier built down the beach / at 90 degrees; Beach material piles up at one side of groyne / Slows or prevents longshore drift; Revetment; Sloping barriers that face the sea; Absorb energy of breaking waves / prevent waves reaching the cliffs behind them; Beach replenishment / nourishment; Replacing beach material / material is sprayed back onto beach / sand brought from other areas; Builds up the beach which has been removed by longshore drift; Plant vegetation; e.g., marram grass on sand dunes; Prevents sand from being blown away / roots stabilise dunes; Plant vegetation; e.g., mangroves; roots stabilise coast; Offshore breakwater; Concrete wall out at sea / tyre barrier out at sea; Absorb power of waves / waves break on barrier; If answer does not match method credit description & protection e.g., method is revetments & description / protection is groyne.
What was in this paper
The subtopics covered by these 2 questions, and how many questions each got. Open one in a new tab to see every Cambridge question on it.
What you needed in this session
Cambridge’s own grade thresholds for 2022 Oct/Nov, Paper 4 · Variant 3. A higher threshold means an easier paper — the bar moves with how the cohort did.