Cambridge IGCSE Geography 0460 — 2022 Oct/Nov Paper 4 · Variant 1
0460/41/O/N/22 · 2 questions · 60 marks · ≈68 min
The question paper and its mark scheme, free to read here and free to download. This is Cambridge’s own paper, exactly as it was sat.
Question paper16 pages








Mark scheme7 pages
Answers below. Sit the paper first if you are practising.


Questions as text
Q1 · A group of students visited Jwaneng, a large open-pit diamond mine in Botswana, an LEDC…
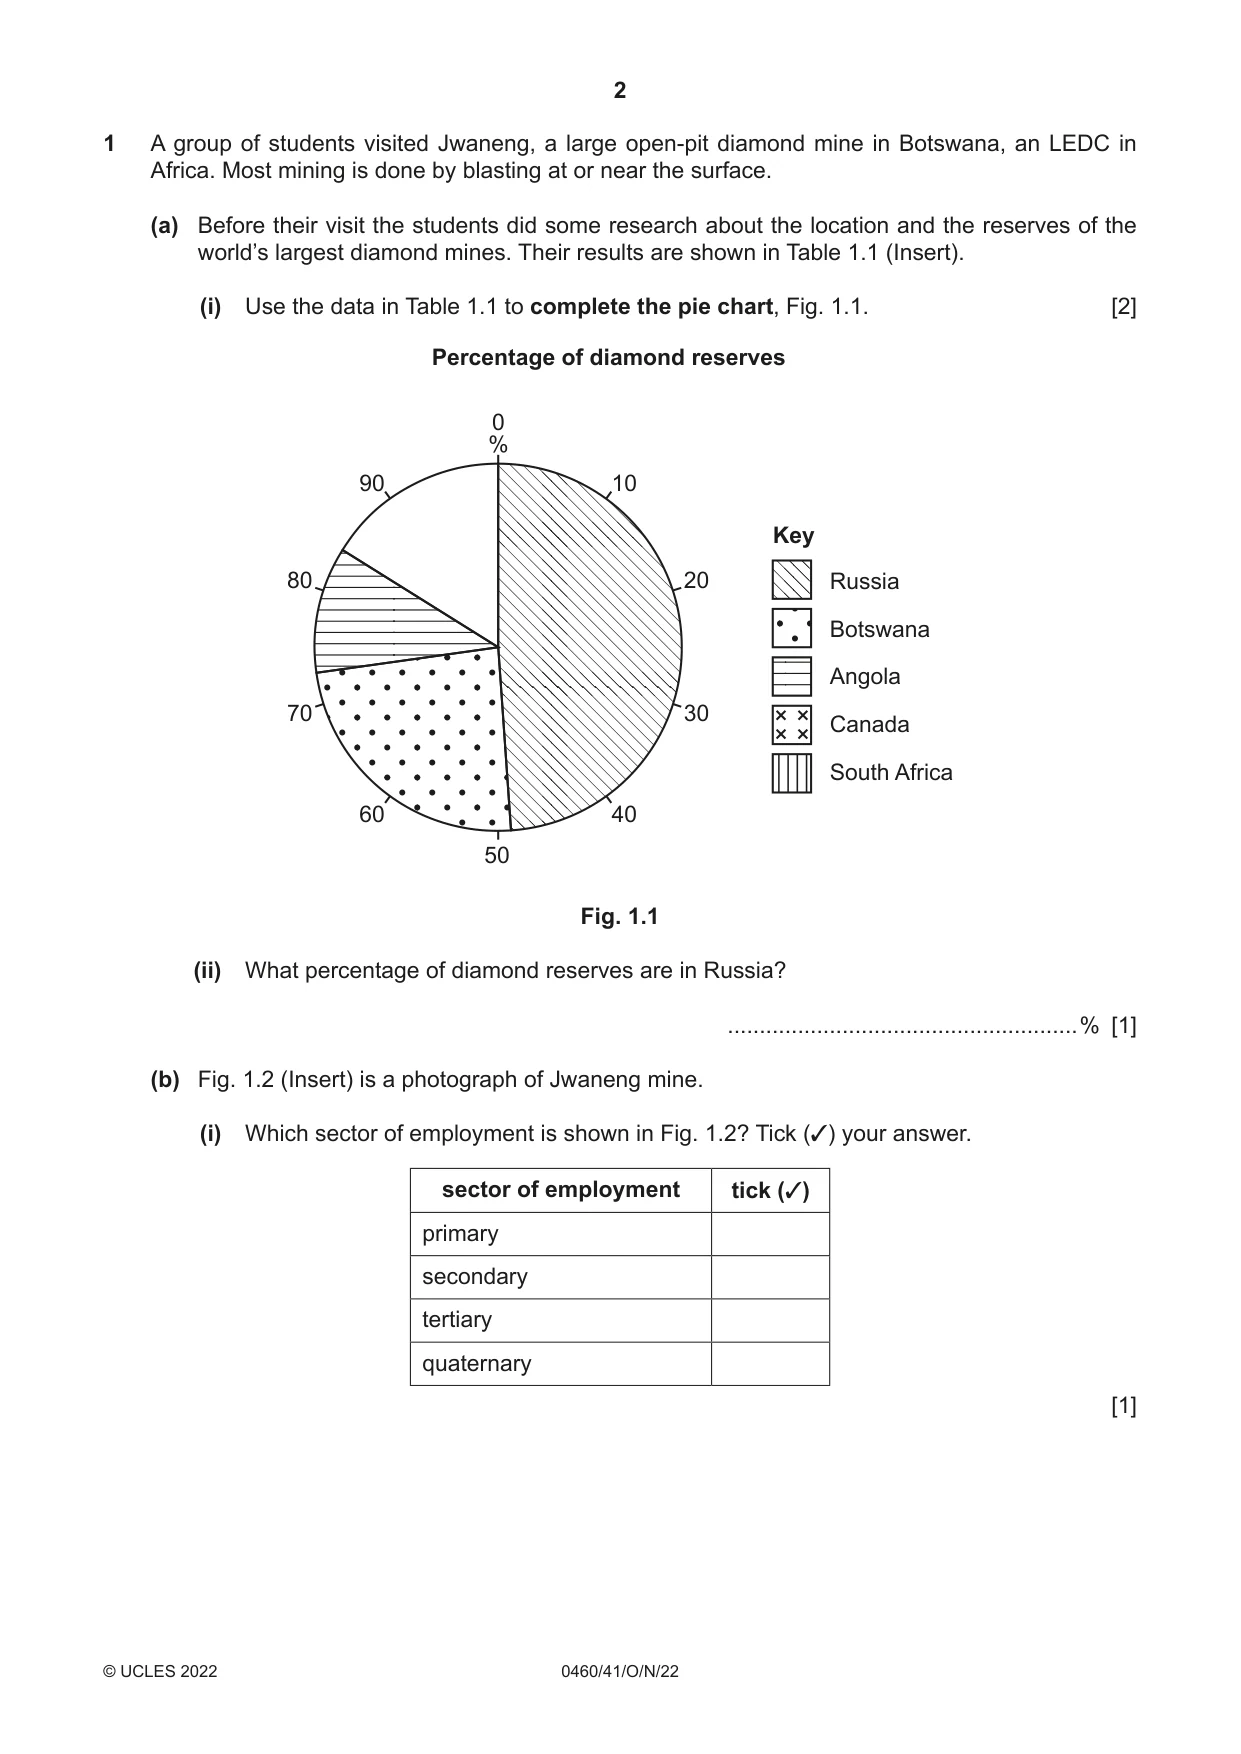
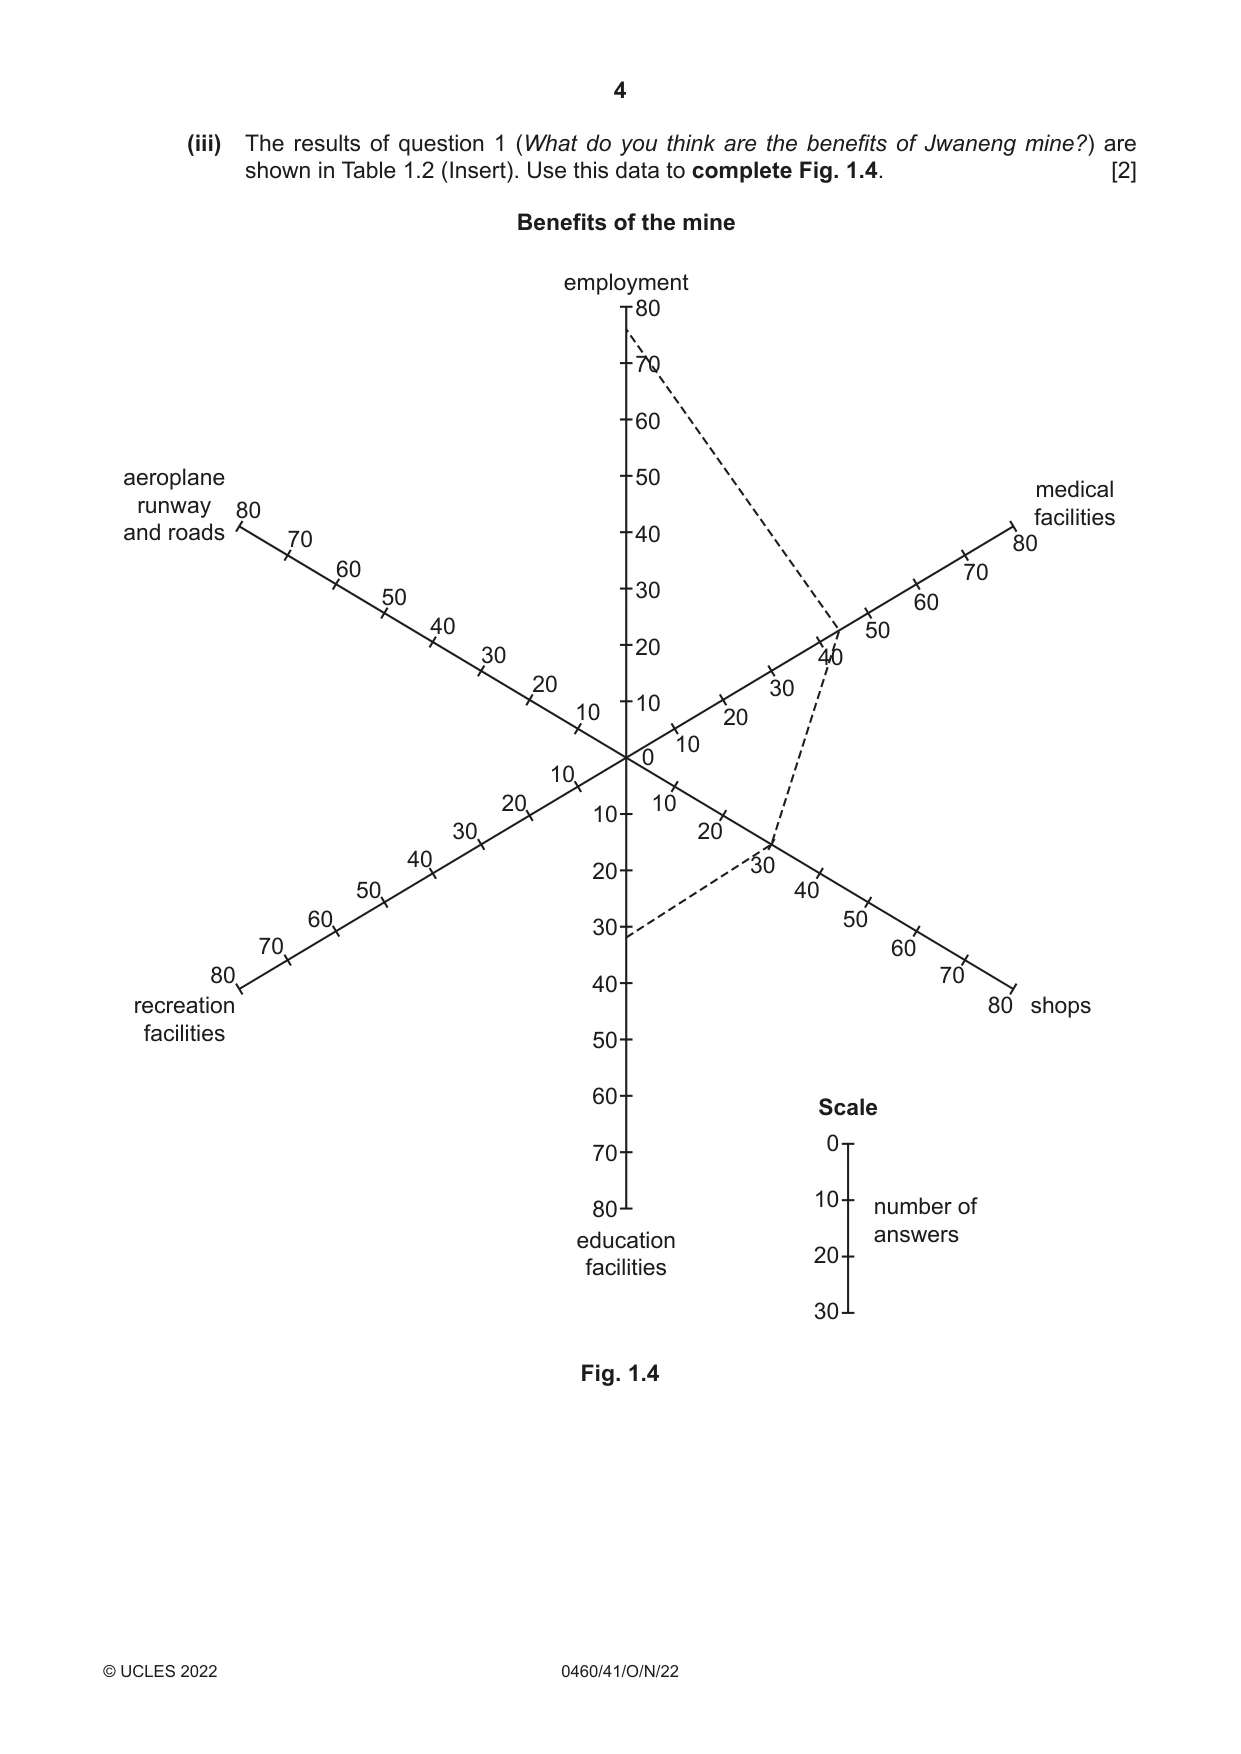
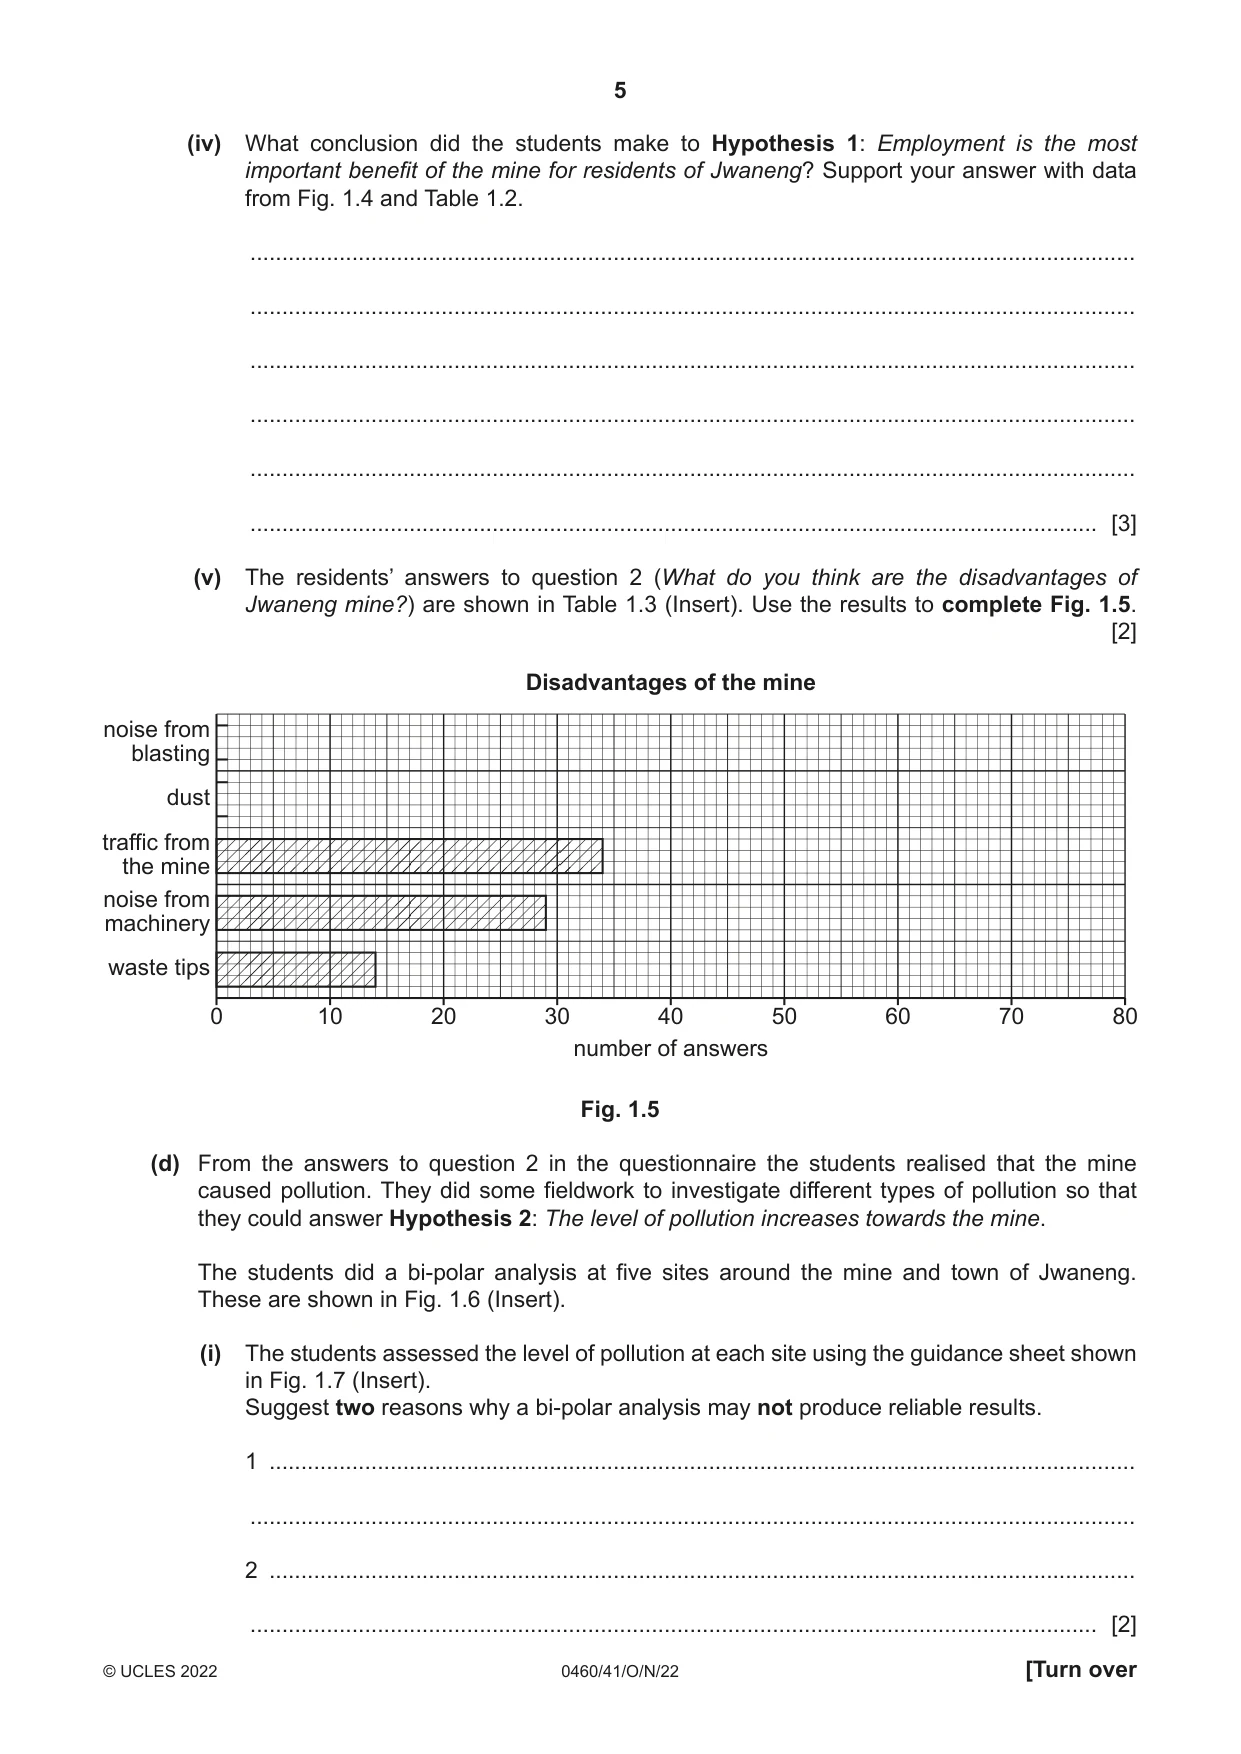
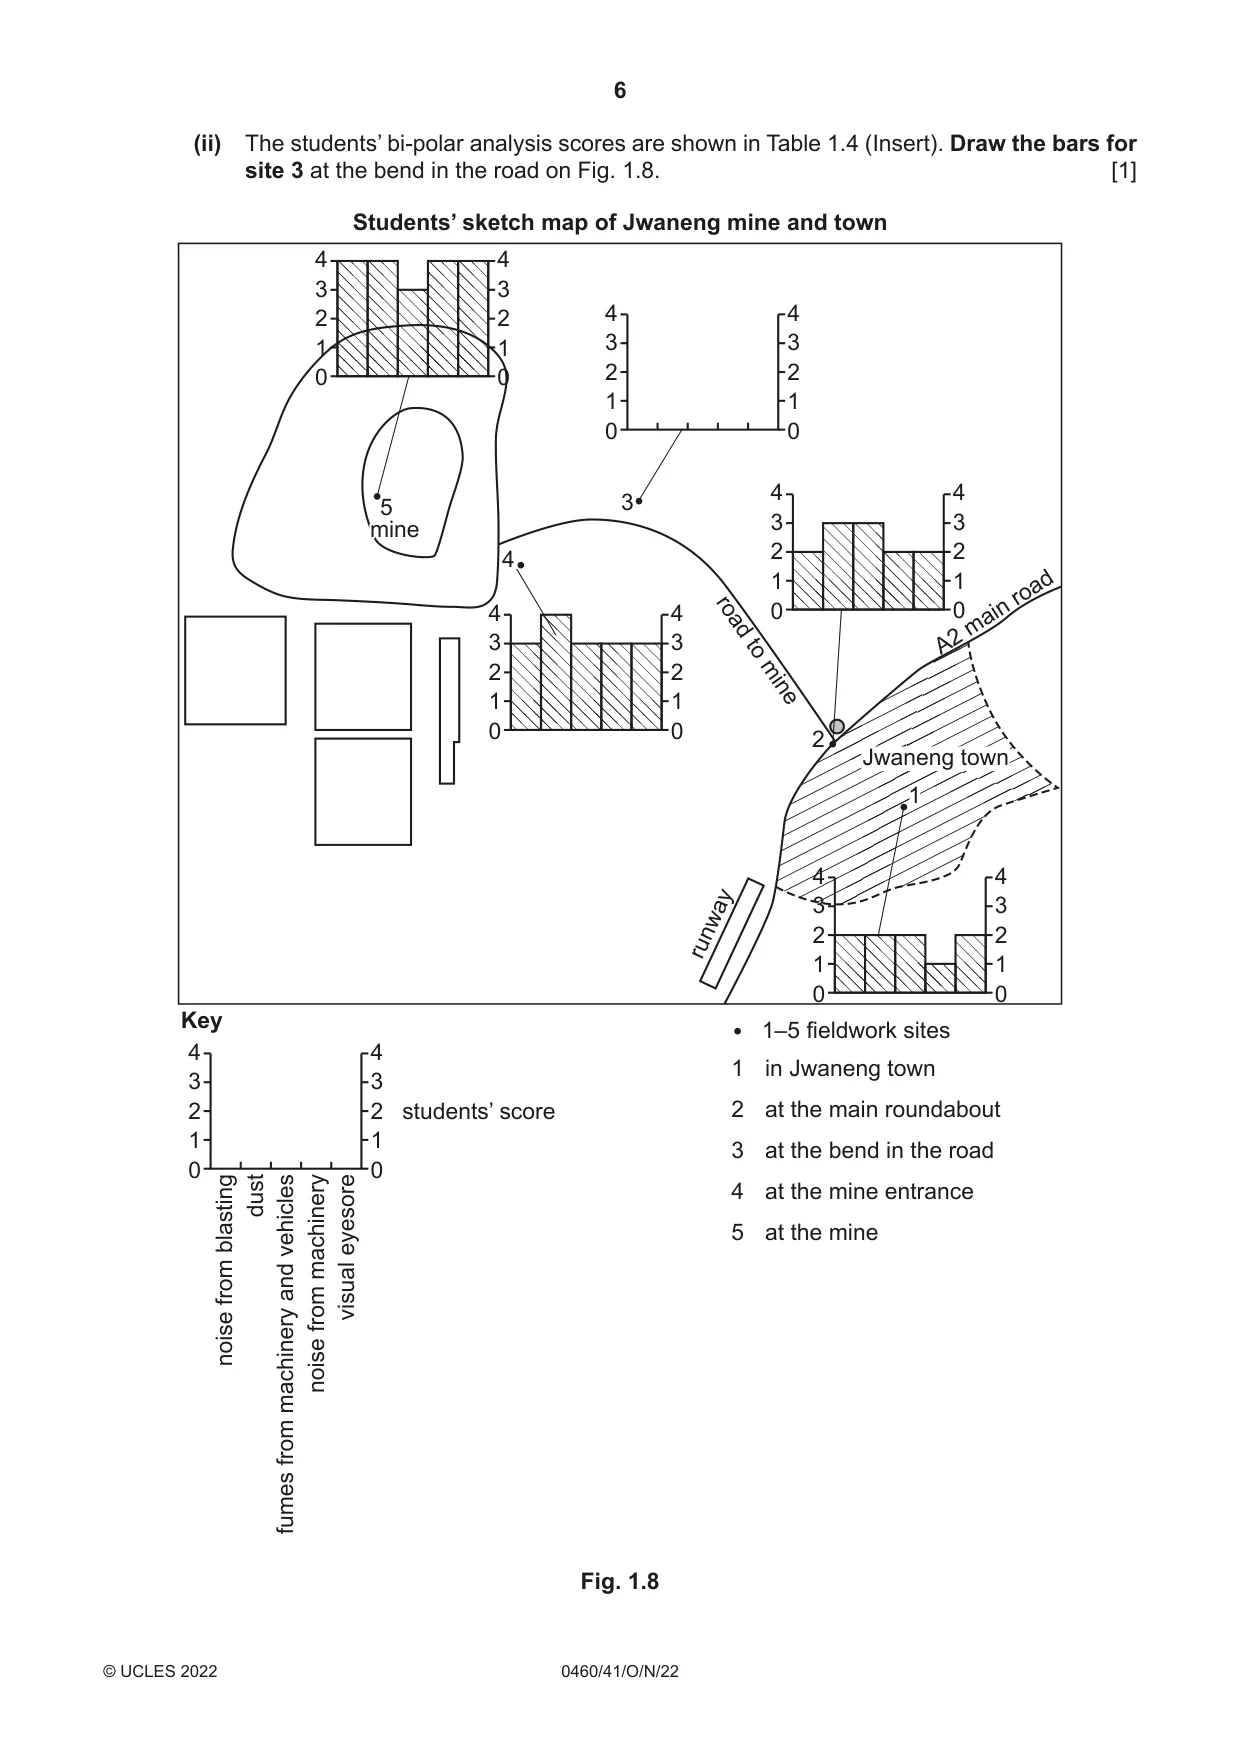
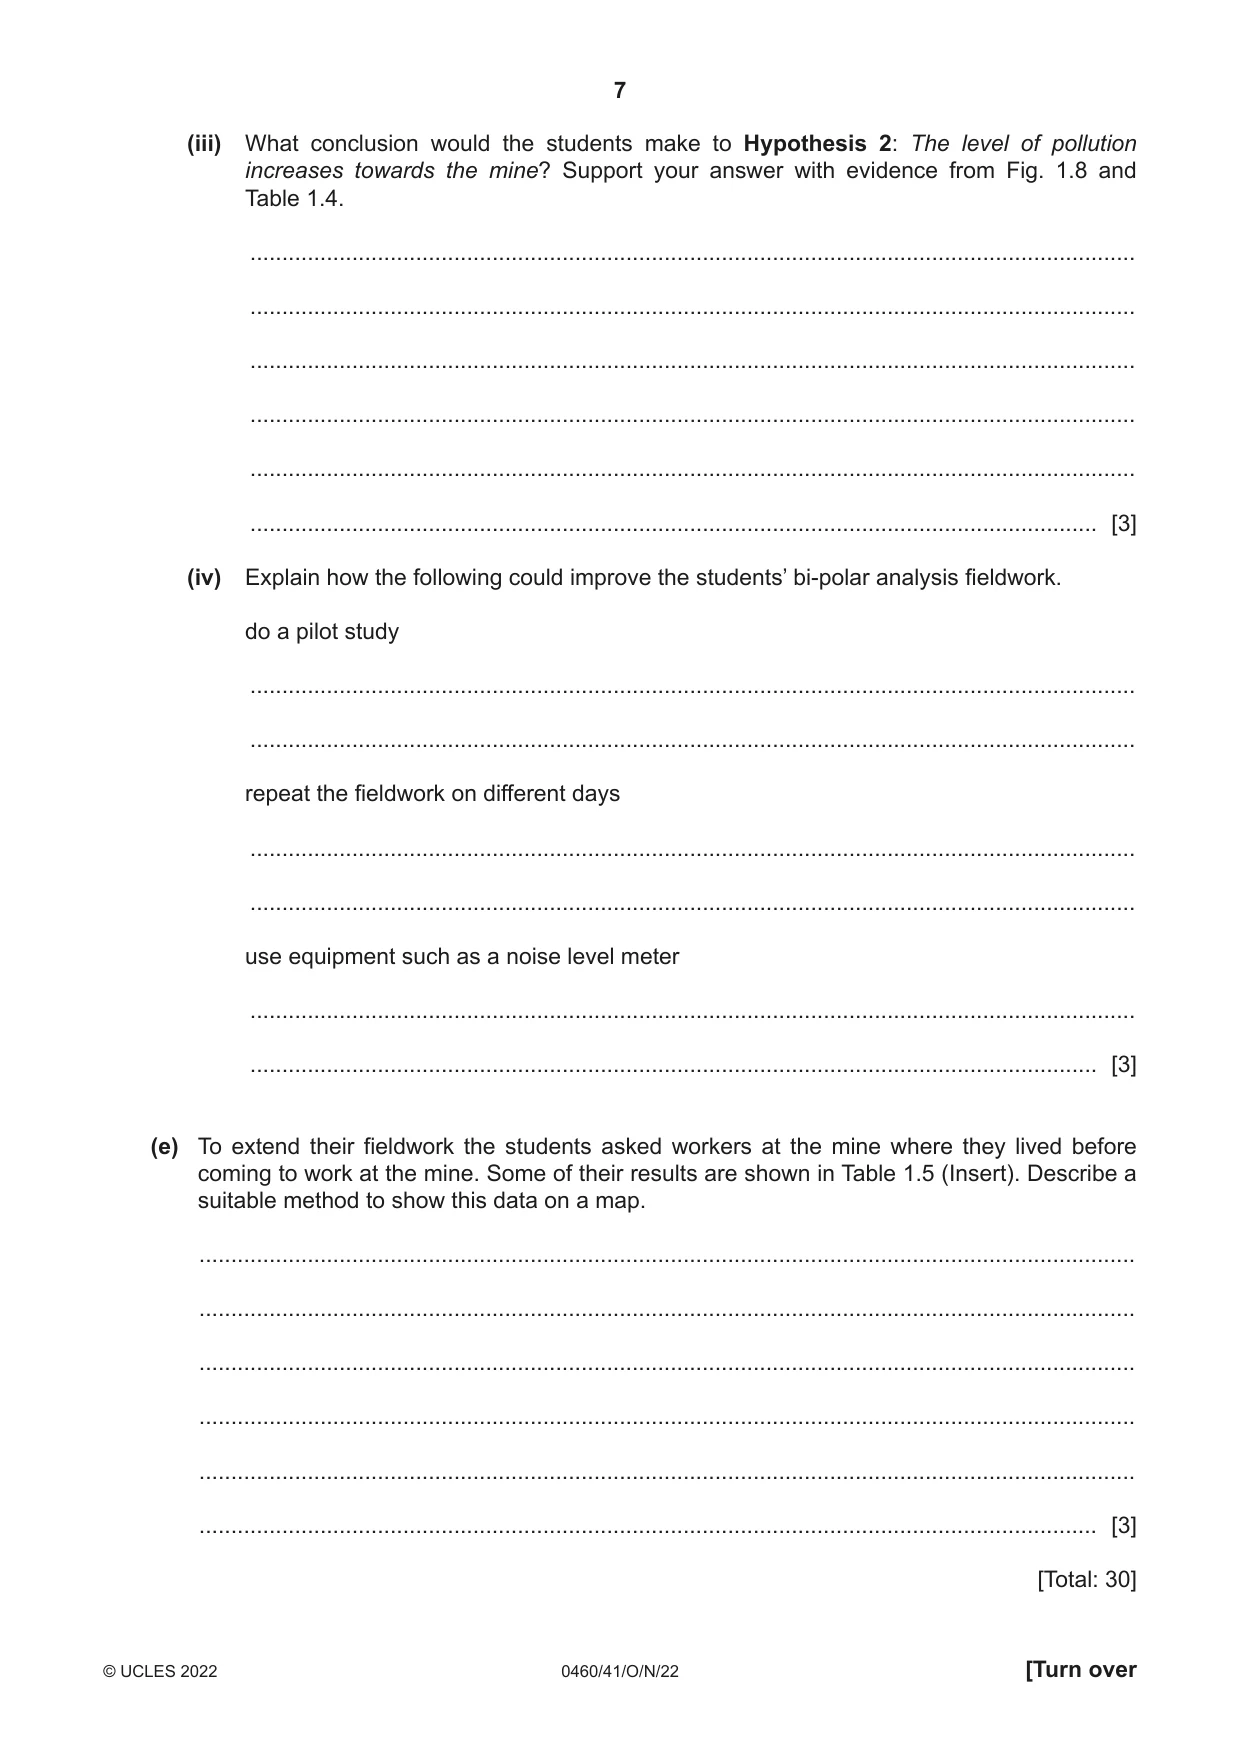
1 A group of students visited Jwaneng, a large open-pit diamond mine in Botswana, an LEDC in Africa. Most mining is done by blasting at or near the surface. (a) Before their visit the students did some research about the location and the reserves of the world’s largest diamond mines. Their results are shown in Table 1.1 (Insert). (i) Use the data in Table 1.1 to complete the pie chart, Fig. 1.1. [2] Percentage of diamond reserves 0 % 90 10 Key 80 20 Russia Botswana Angola 70 30 Canada South Africa 60 40 50 Fig. 1.1 (ii) What percentage of diamond reserves are in Russia? .......................................................% [1] (b) Fig. 1.2 (Insert) is a photograph of Jwaneng mine. (i) Which sector of employment is shown in Fig. 1.2? Tick (3) your answer. sector of employment tick (3) primary secondary tertiary quaternary [1] (ii) Describe two features of the mine shown in Fig. 1.2. 1 ........................................................................................................................................ ........................................................................................................................................... 2 ........................................................................................................................................ ..................................................................................................................................... [2] The students tested the following hypotheses: Hypothesis 1: Employment is the most important benefit of the mine for residents of Jwaneng. Hypothesis 2: The level of pollution increases towards the mine. (c) To investigate Hypothesis 1 the students used a questionnaire with 100 local residents to study the impacts of Jwaneng mine. This questionnaire is shown in Fig. 1.3 (Insert). (i) The population of Jwaneng is 13 500. Do you think 100 people is an appropriate sample size? Circle your choice below and explain your answer. YES NO ........................................................................................................................................... ........................................................................................................................................... ........................................................................................................................................... ..................................................................................................................................... [2] (ii) Name a suitable sampling method for the students to select 100 people. Describe the method and explain why it is a suitable method. Name of sampling method ............................................................ ........................................................................................................................................... ........................................................................................................................................... ........................................................................................................................................... ..................................................................................................................................... [3] (iii) The results of question 1 (What do you think are the benefits of Jwaneng mine?) are shown in Table 1.2 (Insert). Use this data to complete Fig. 1.4. [2] Benefits of the mine employment 80 70 60 aeroplane 50 medical runway 80 facilities and roads 70 40 80 60 70 30 50 60 40 50 20 30 40 20 30 10 10 20 10 0 10 20 10 10 30 20 40 20 30 50 40 60 50 30 70 60 80 70 40 recreation 80 shops facilities 50 60 Scale 0 70 10 80 number of education answers 20 facilities 30 Fig. 1.4 (iv) What conclusion did the students make to Hypothesis 1: Employment is the most important benefit of the mine for residents of Jwaneng? Support your answer with data from Fig. 1.4 and Table 1.2. ........................................................................................................................................... ........................................................................................................................................... ........................................................................................................................................... ........................................................................................................................................... ........................................................................................................................................... ..................................................................................................................................... [3] (v) The residents’ answers to question 2 (What do you think are the disadvantages of Jwaneng mine?) are shown in Table 1.3 (Insert). Use the results to complete Fig. 1.5. [2] Disadvantages of the mine noise from blasting dust traffic from the mine noise from machinery waste tips 0 10 20 30 40 50 60 70 80 number of answers Fig. 1.5 (d) From the answers to question 2 in the questionnaire the students realised that the mine caused pollution. They did some fieldwork to investigate different types of pollution so that they could answer Hypothesis 2: The level of pollution increases towards the mine. The students did a bi-polar analysis at five sites around the mine and town of Jwaneng. These are shown in Fig. 1.6 (Insert). (i) The students assessed the level of pollution at each site using the guidance sheet shown in Fig. 1.7 (Insert). Suggest two reasons why a bi-polar analysis may not produce reliable results. 1 ........................................................................................................................................ ........................................................................................................................................... 2 ........................................................................................................................................ ..................................................................................................................................... [2] (ii) The students’ bi-polar analysis scores are shown in Table 1.4 (Insert). Draw the bars for site 3 at the bend in the road on Fig. 1.8. [1] Students’ sketch map of Jwaneng mine and town 4 4 3 3 2 2 4 4 1 1 3 3 0 0 2 2 1 1 0 0 4 4 5 3 3 3 minemine 2 2 4 1 1 road 4 4 0 0main road 3 3 to A2 2 2 1 mine 1 0 0 2 Jwaneng town 1 4 4 3 3 2 2 runway 1 1 0 0 Key 1–5 fieldwork sites 4 4 1 in Jwaneng town 3 3 2 2 students’ score 2 at the main roundabout 1 1 3 at the bend in the road 0 0 5 at the mine blastingdustvehiclesmachineryeyesore 4 at the mine entrance from and visual from noise noise machinery from fumes Fig. 1.8 (iii) What conclusion would the students make to Hypothesis 2: The level of pollution increases towards the mine? Support your answer with evidence from Fig. 1.8 and Table 1.4. ........................................................................................................................................... ........................................................................................................................................... ........................................................................................................................................... ........................................................................................................................................... ........................................................................................................................................... ..................................................................................................................................... [3] (iv) Explain how the following could improve the students’ bi-polar analysis fieldwork. do a pilot study ........................................................................................................................................... ........................................................................................................................................... repeat the fieldwork on different days ........................................................................................................................................... ........................................................................................................................................... use equipment such as a noise level meter ........................................................................................................................................... ..................................................................................................................................... [3] (e) To extend their fieldwork the students asked workers at the mine where they lived before coming to work at the mine. Some of their results are shown in Table 1.5 (Insert). Describe a suitable method to show this data on a map. ................................................................................................................................................... ................................................................................................................................................... ................................................................................................................................................... ................................................................................................................................................... ................................................................................................................................................... ............................................................................................................................................. [3] [Total: 30]
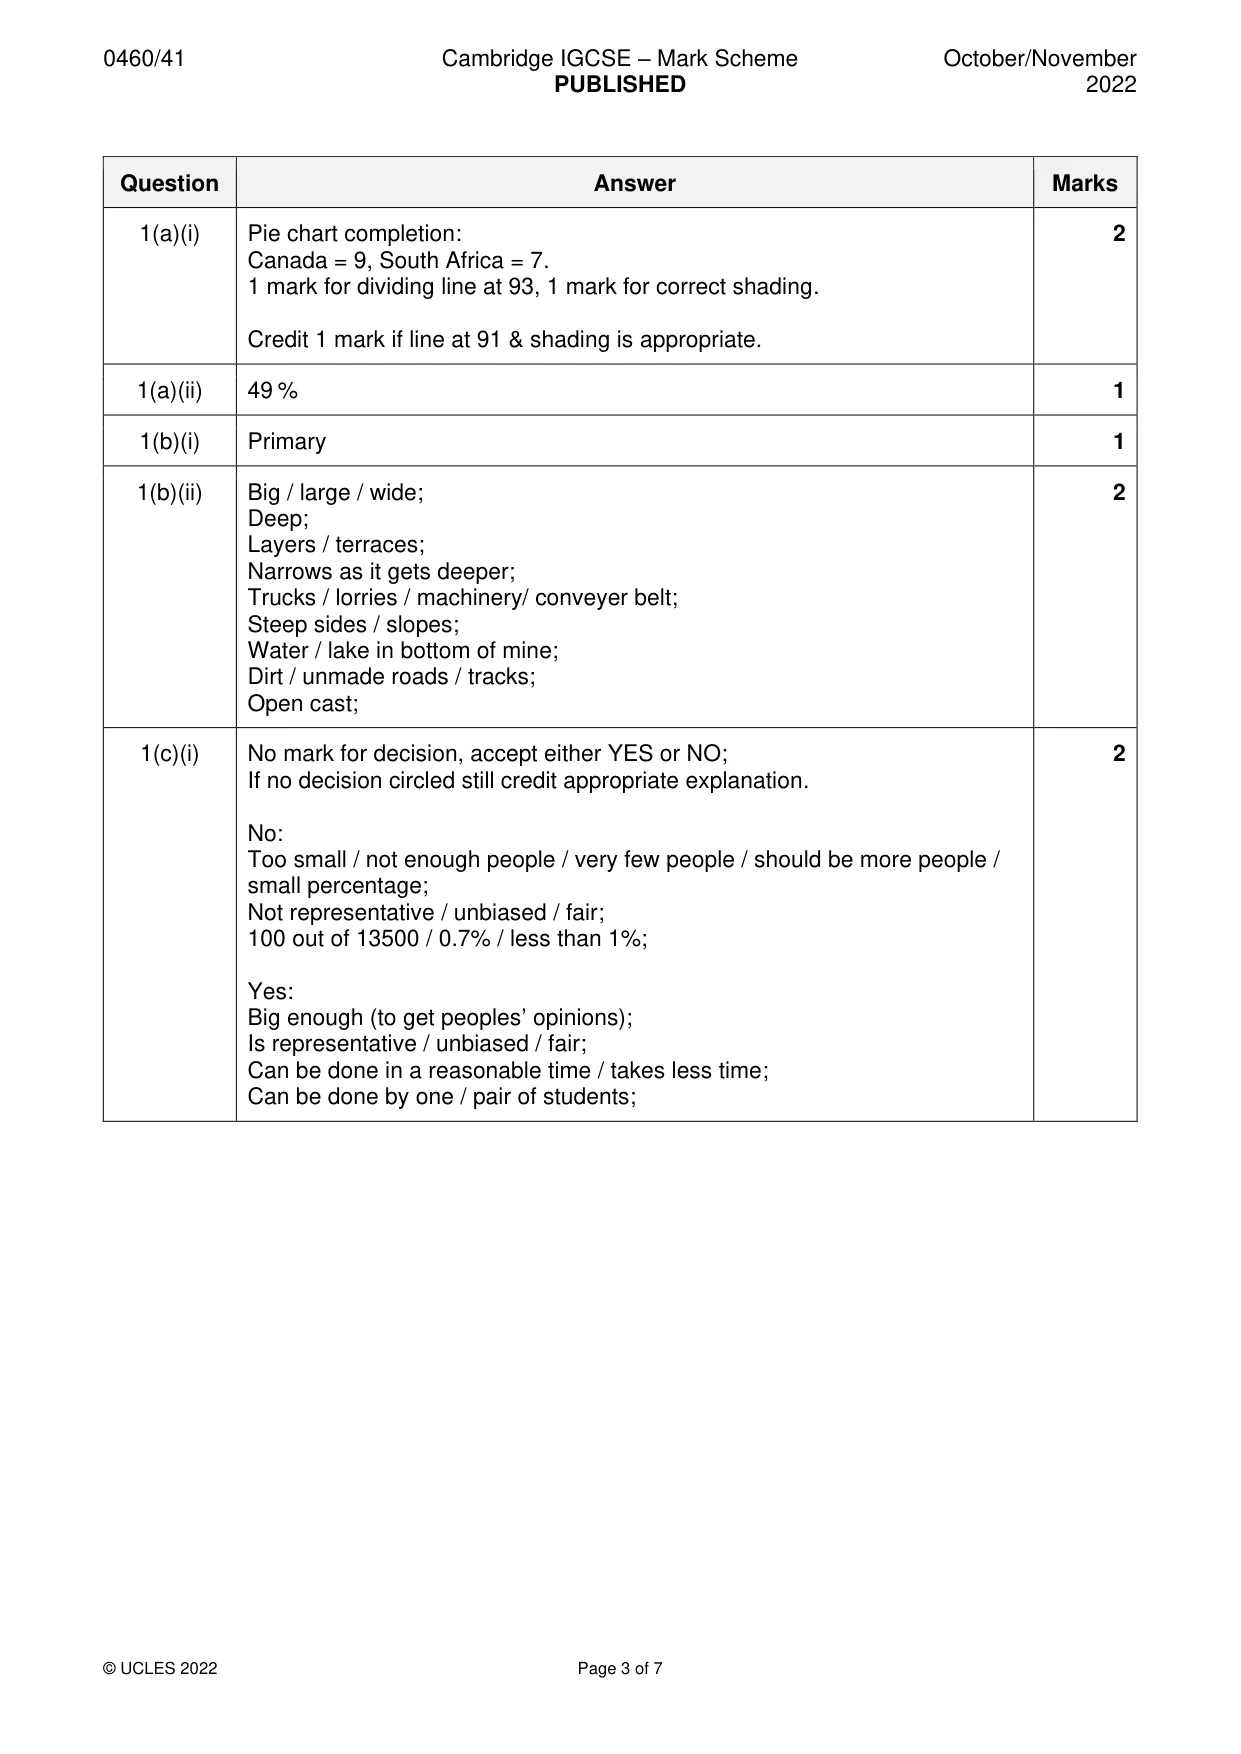
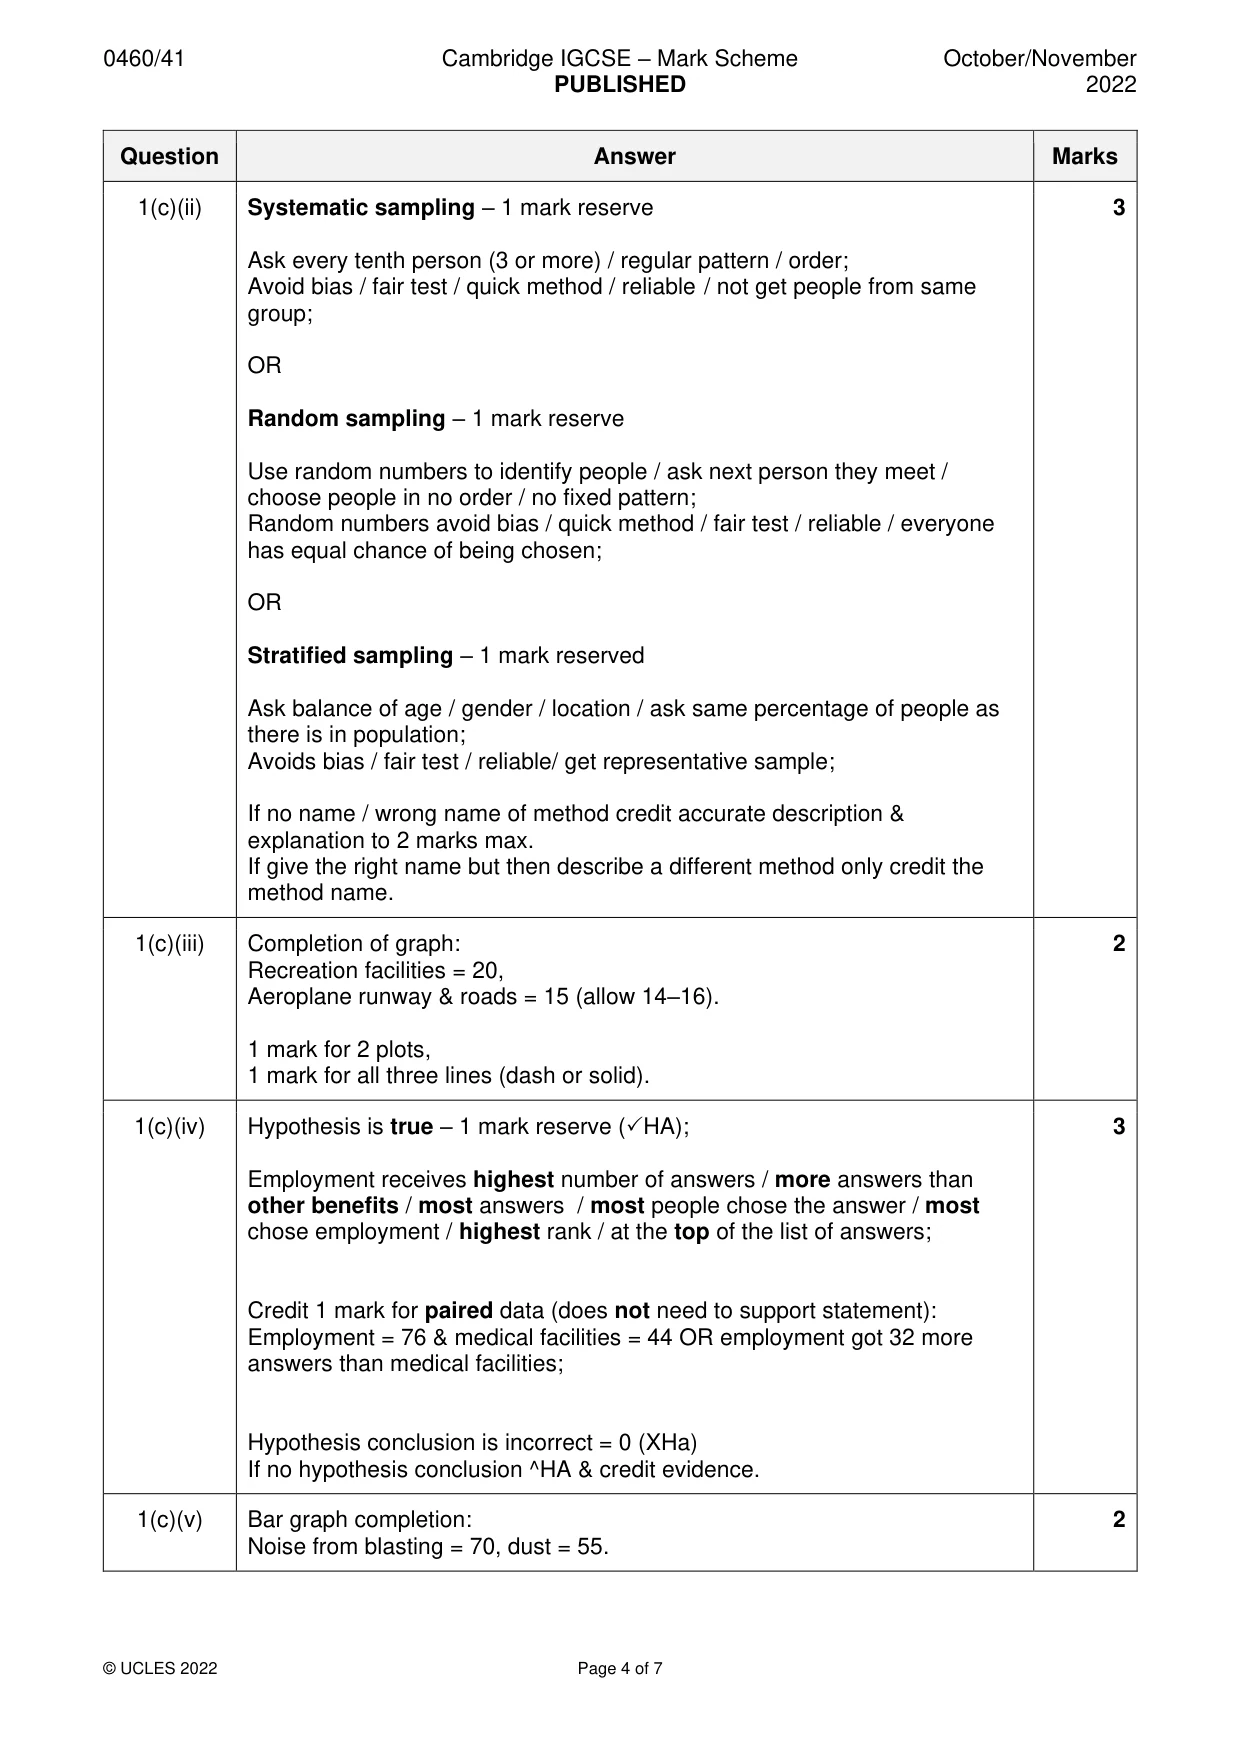
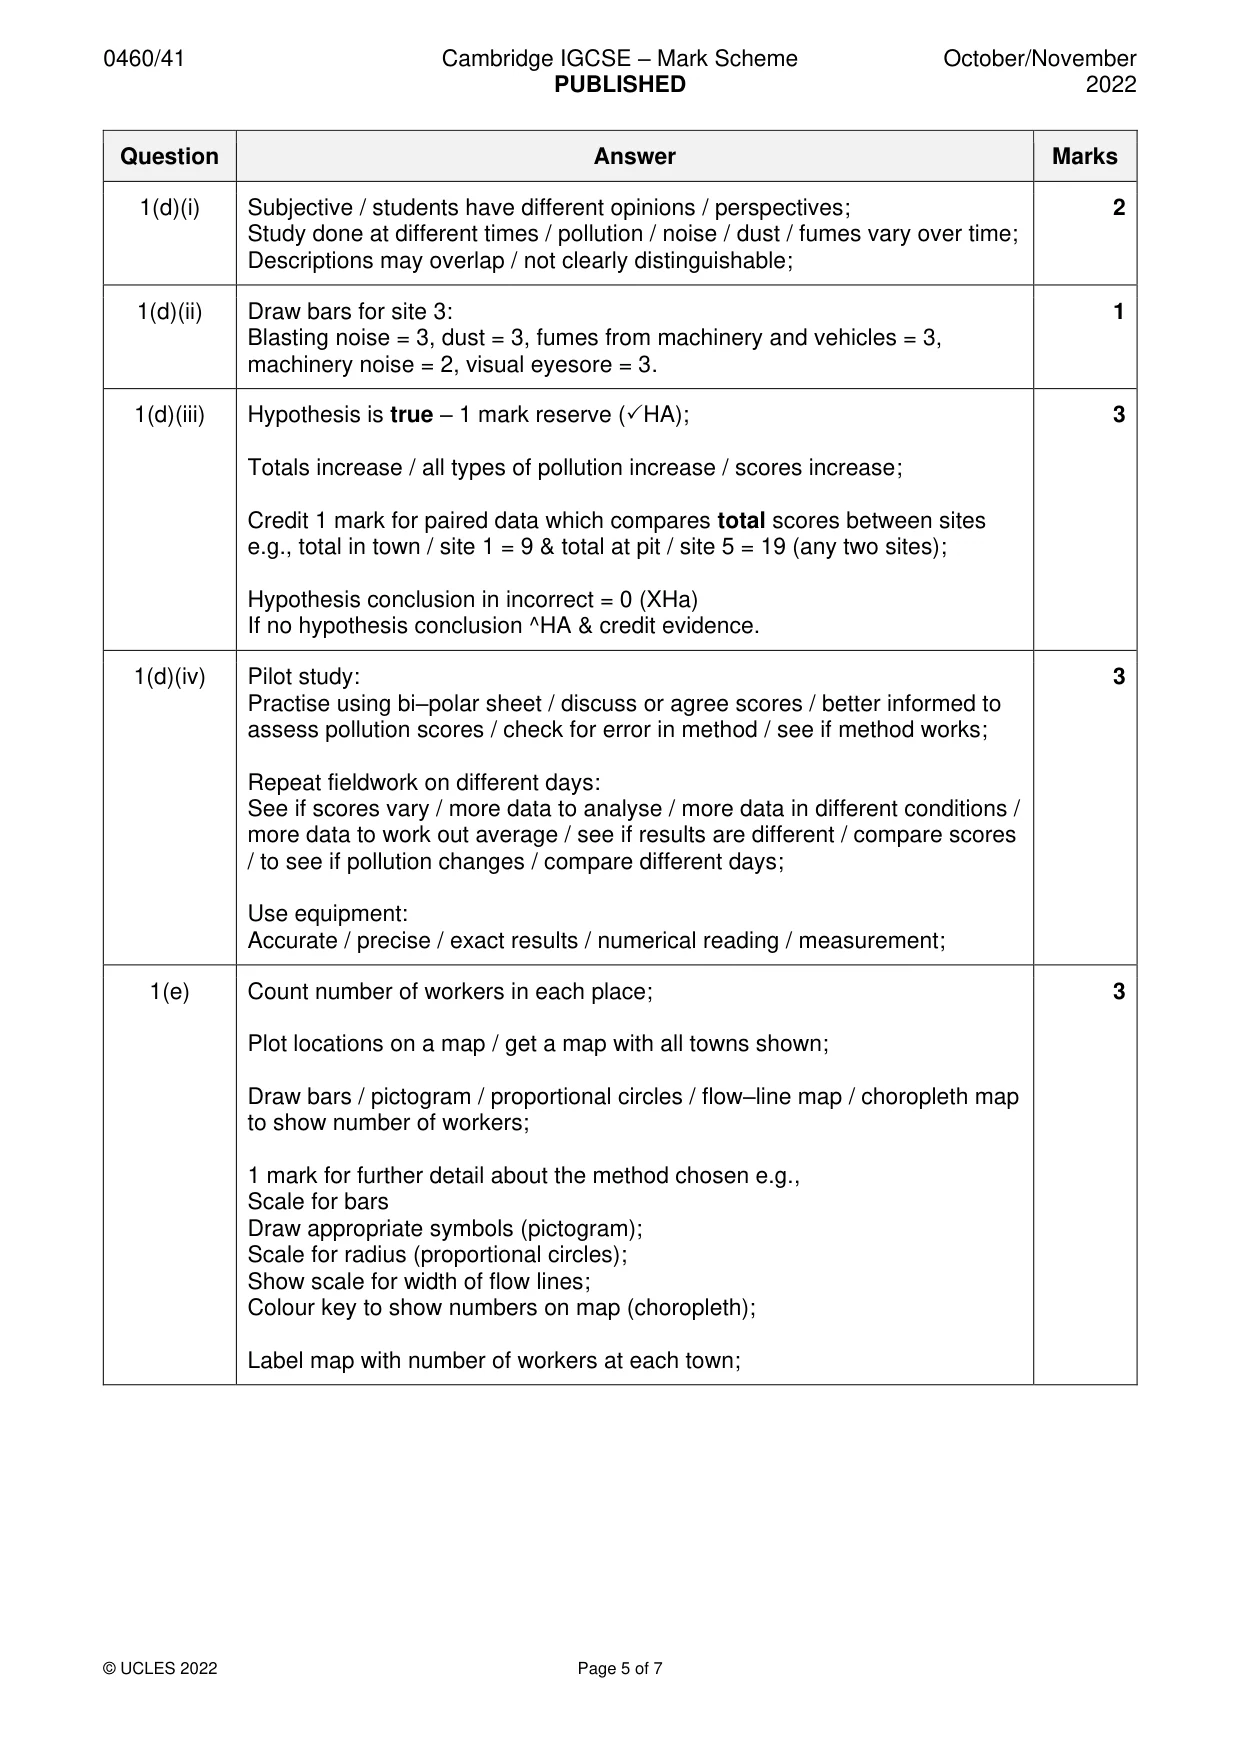
Mark scheme: Question Answer Marks 1(a)(i) Pie chart completion: 2 Canada = 9, South Africa = 7. 1 mark for dividing line at 93, 1 mark for correct shading. Credit 1 mark if line at 91 & shading is appropriate. 1(a)(ii) 49 % 1 1(b)(i) Primary 1 1(b)(ii) Big / large / wide; 2 Deep; Layers / terraces; Narrows as it gets deeper; Trucks / lorries / machinery/ conveyer belt; Steep sides / slopes; Water / lake in bottom of mine; Dirt / unmade roads / tracks; Open cast; 1(c)(i) No mark for decision, accept either YES or NO; 2 If no decision circled still credit appropriate explanation. No: Too small / not enough people / very few people / should be more people / small percentage; Not representative / unbiased / fair; 100 out of 13500 / 0.7% / less than 1%; Yes: Big enough (to get peoples’ opinions); Is representative / unbiased / fair; Can be done in a reasonable time / takes less time; Can be done by one / pair of students; 1(c)(ii) Systematic sampling – 1 mark reserve 3 Ask every tenth person (3 or more) / regular pattern / order; Avoid bias / fair test / quick method / reliable / not get people from same group; OR Random sampling – 1 mark reserve Use random numbers to identify people / ask next person they meet / choose people in no order / no fixed pattern; Random numbers avoid bias / quick method / fair test / reliable / everyone has equal chance of being chosen; OR Stratified sampling – 1 mark reserved Ask balance of age / gender / location / ask same percentage of people as there is in population; Avoids bias / fair test / reliable/ get representative sample; If no name / wrong name of method credit accurate description & explanation to 2 marks max. If give the right name but then describe a different method only credit the method name. 1(c)(iii) Completion of graph: 2 Recreation facilities = 20, Aeroplane runway & roads = 15 (allow 14–16). 1 mark for 2 plots, 1 mark for all three lines (dash or solid). 1(c)(iv) Hypothesis is true – 1 mark reserve (HA); 3 Employment receives highest number of answers / more answers than other benefits / most answers / most people chose the answer / most chose employment / highest rank / at the top of the list of answers; Credit 1 mark for paired data (does not need to support statement): Employment = 76 & medical facilities = 44 OR employment got 32 more answers than medical facilities; Hypothesis conclusion is incorrect = 0 (XHa) If no hypothesis conclusion ^HA & credit evidence. 1(c)(v) Bar graph completion: 2 Noise from blasting = 70, dust = 55. 1(d)(i) Subjective / students have different opinions / perspectives; 2 Study done at different times / pollution / noise / dust / fumes vary over time; Descriptions may overlap / not clearly distinguishable; 1(d)(ii) Draw bars for site 3: 1 Blasting noise = 3, dust = 3, fumes from machinery and vehicles = 3, machinery noise = 2, visual eyesore = 3. 1(d)(iii) Hypothesis is true – 1 mark reserve (HA); 3 Totals increase / all types of pollution increase / scores increase; Credit 1 mark for paired data which compares total scores between sites e.g., total in town / site 1 = 9 & total at pit / site 5 = 19 (any two sites); Hypothesis conclusion in incorrect = 0 (XHa) If no hypothesis conclusion ^HA & credit evidence. 1(d)(iv) Pilot study: 3 Practise using bi–polar sheet / discuss or agree scores / better informed to assess pollution scores / check for error in method / see if method works; Repeat fieldwork on different days: See if scores vary / more data to analyse / more data in different conditions / more data to work out average / see if results are different / compare scores / to see if pollution changes / compare different days; Use equipment: Accurate / precise / exact results / numerical reading / measurement; 1(e) Count number of workers in each place; 3 Plot locations on a map / get a map with all towns shown; Draw bars / pictogram / proportional circles / flow–line map / choropleth map to show number of workers; 1 mark for further detail about the method chosen e.g., Scale for bars Draw appropriate symbols (pictogram); Scale for radius (proportional circles); Show scale for width of flow lines; Colour key to show numbers on map (choropleth); Label map with number of workers at each town;
Q2 · Students in China did fieldwork on the acidity of rainfall in their urban area
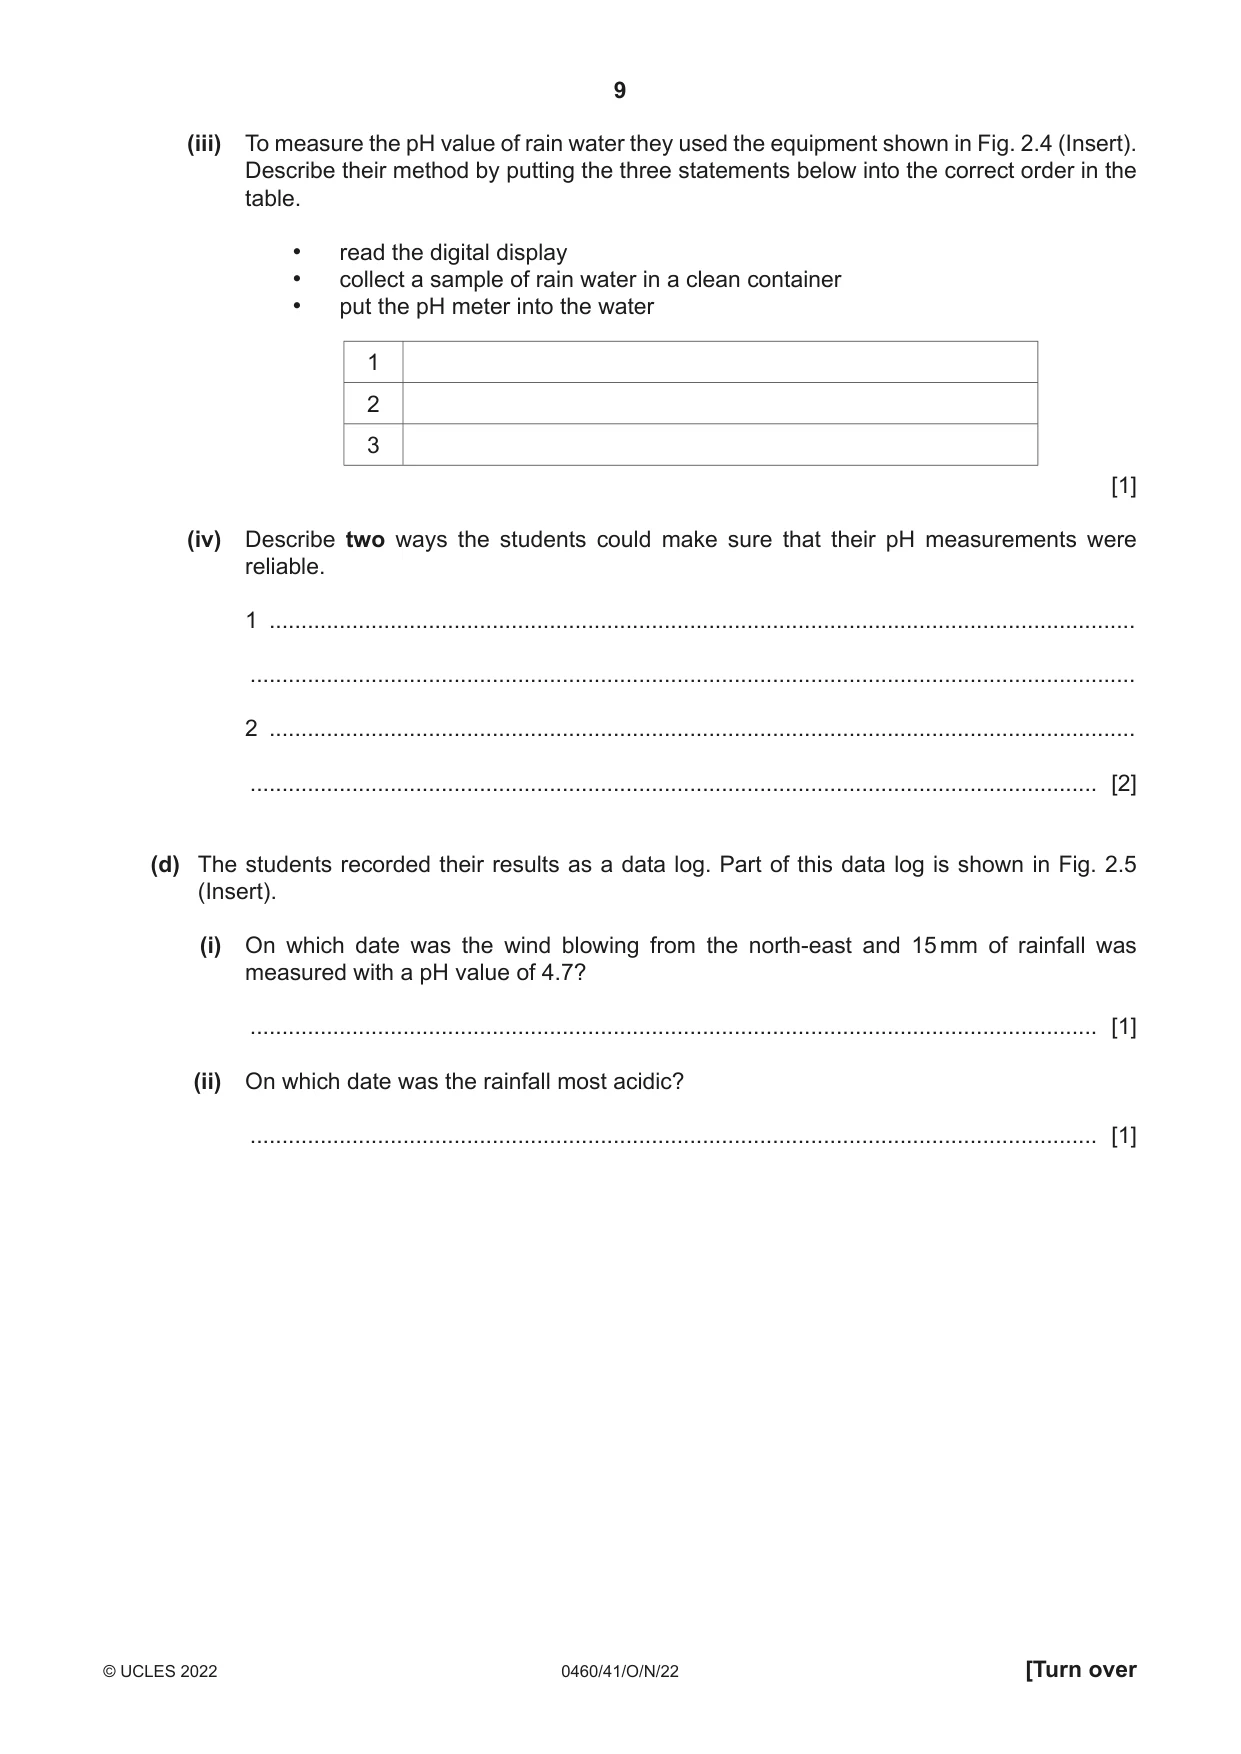
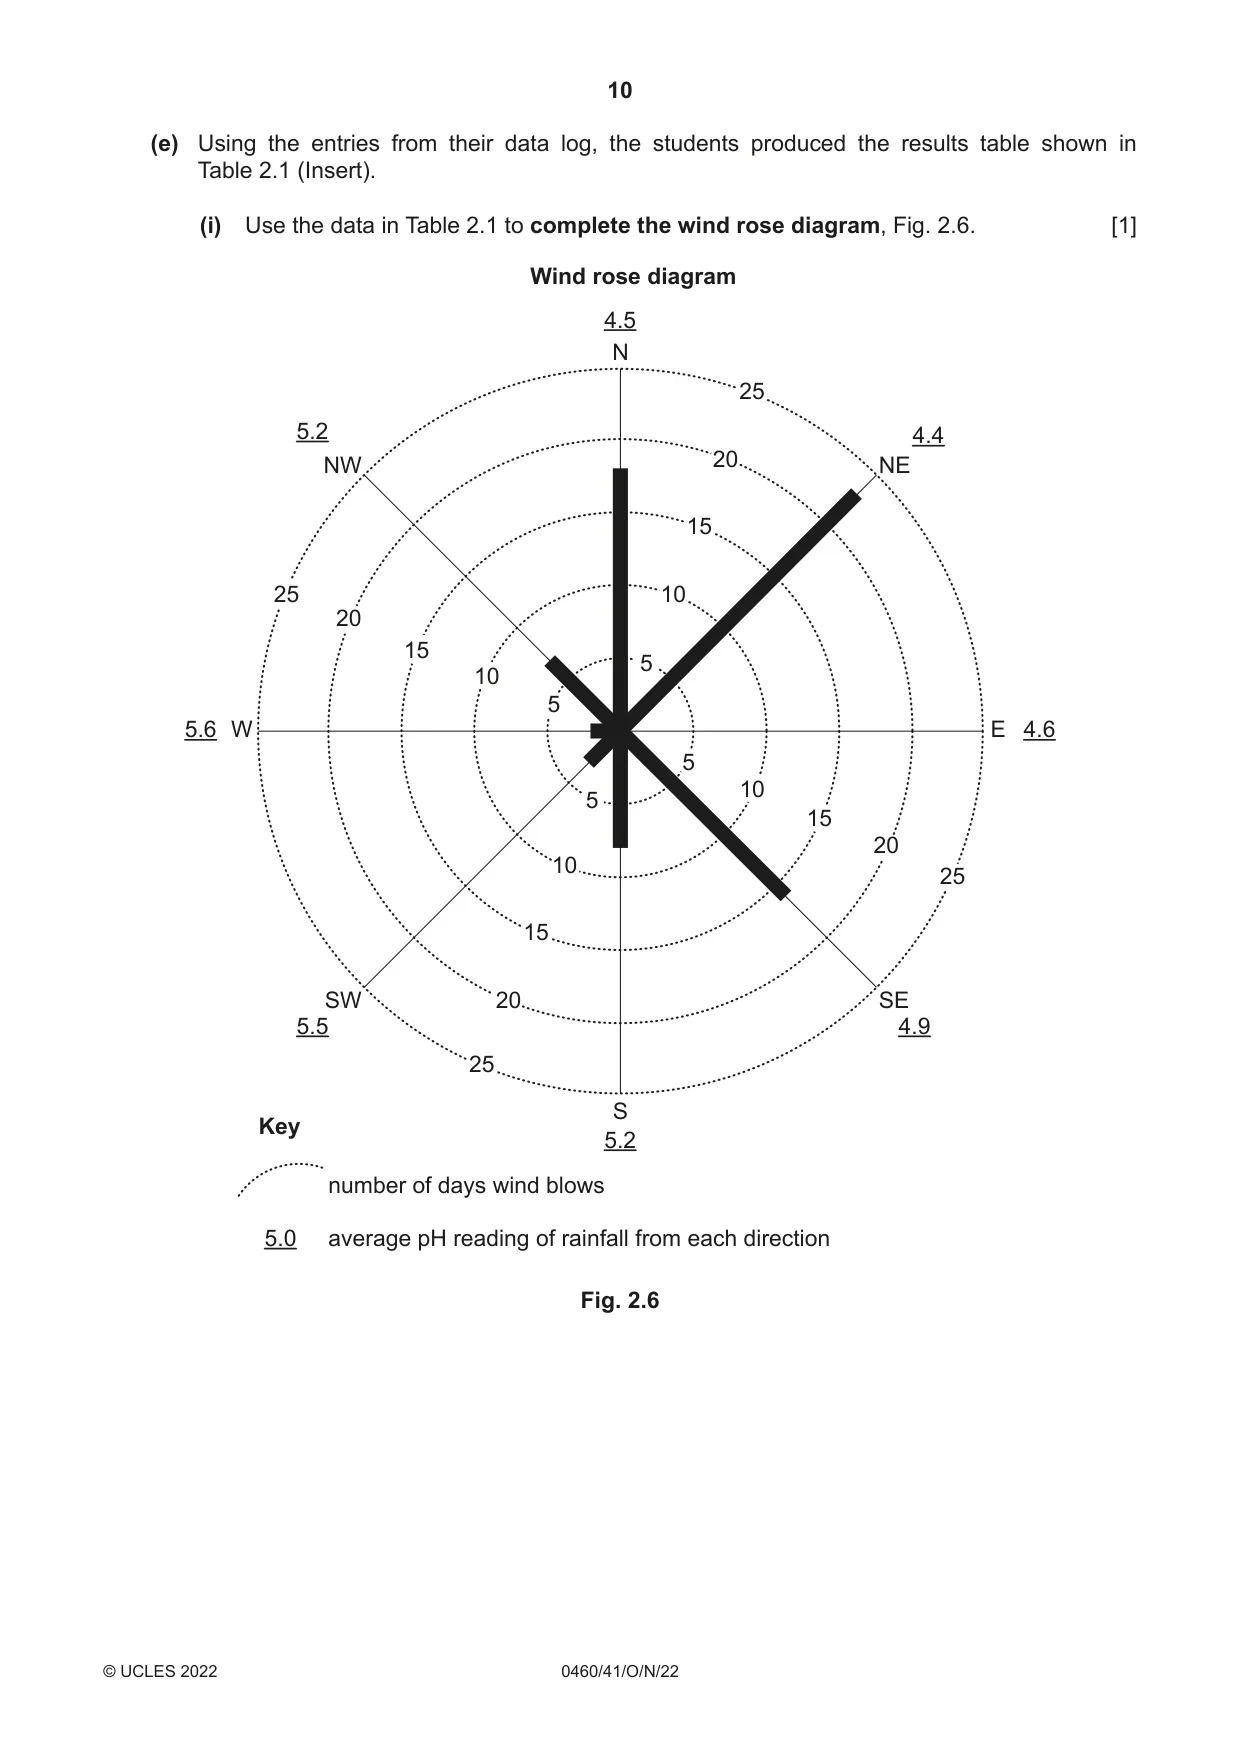
2 Students in China did fieldwork on the acidity of rainfall in their urban area. First, they researched acid rain and made a fact file. This is shown in Fig. 2.1 (Insert). (a) What is the acidity of normal rain water on the pH scale? .......................................................... [1] The students tested the following hypotheses: Hypothesis 1: Rainfall is more acidic (pH value is lower) when the wind blows from the north and north-east directions. Hypothesis 2: Rainfall is more acidic (pH value is lower) as the number of dry days before rainfall increases. (b) Fig. 2.2 (Insert) is a sketch map of the urban area where the students live. Which direction is the prevailing wind blowing from? .......................................................... [1] (c) Each day the students recorded: • the direction the wind came from • the amount of rain that had fallen in the previous 24 hours • the pH value of any rain water collected. (i) Describe how the students would measure wind direction. ........................................................................................................................................... ........................................................................................................................................... ........................................................................................................................................... ..................................................................................................................................... [2] (ii) Describe how the students used the instrument shown in Fig. 2.3 (Insert) to measure daily rainfall. ........................................................................................................................................... ........................................................................................................................................... ........................................................................................................................................... ........................................................................................................................................... ........................................................................................................................................... ........................................................................................................................................... ........................................................................................................................................... ..................................................................................................................................... [4] (iii) To measure the pH value of rain water they used the equipment shown in Fig. 2.4 (Insert). Describe their method by putting the three statements below into the correct order in the table. • read the digital display • collect a sample of rain water in a clean container • put the pH meter into the water 1 2 3 [1] (iv) Describe two ways the students could make sure that their pH measurements were reliable. 1 ........................................................................................................................................ ........................................................................................................................................... 2 ........................................................................................................................................ ..................................................................................................................................... [2] (d) The students recorded their results as a data log. Part of this data log is shown in Fig. 2.5 (Insert). (i) On which date was the wind blowing from the north-east and 15 mm of rainfall was measured with a pH value of 4.7? ..................................................................................................................................... [1] (ii) On which date was the rainfall most acidic? ..................................................................................................................................... [1] (e) Using the entries from their data log, the students produced the results table shown in Table 2.1 (Insert). (i) Use the data in Table 2.1 to complete the wind rose diagram, Fig. 2.6. [1] Wind rose diagram 4.5 N 25 5.2 4.4 NW 20 NE 15 25 10 20 15 5 10 5 5.6 W E 4.6 5 10 5 15 20 10 25 15 SW 20 SE 5.5 4.9 25 S Key 5.2 number of days wind blows 5.0 average pH reading of rainfall from each direction Fig. 2.6
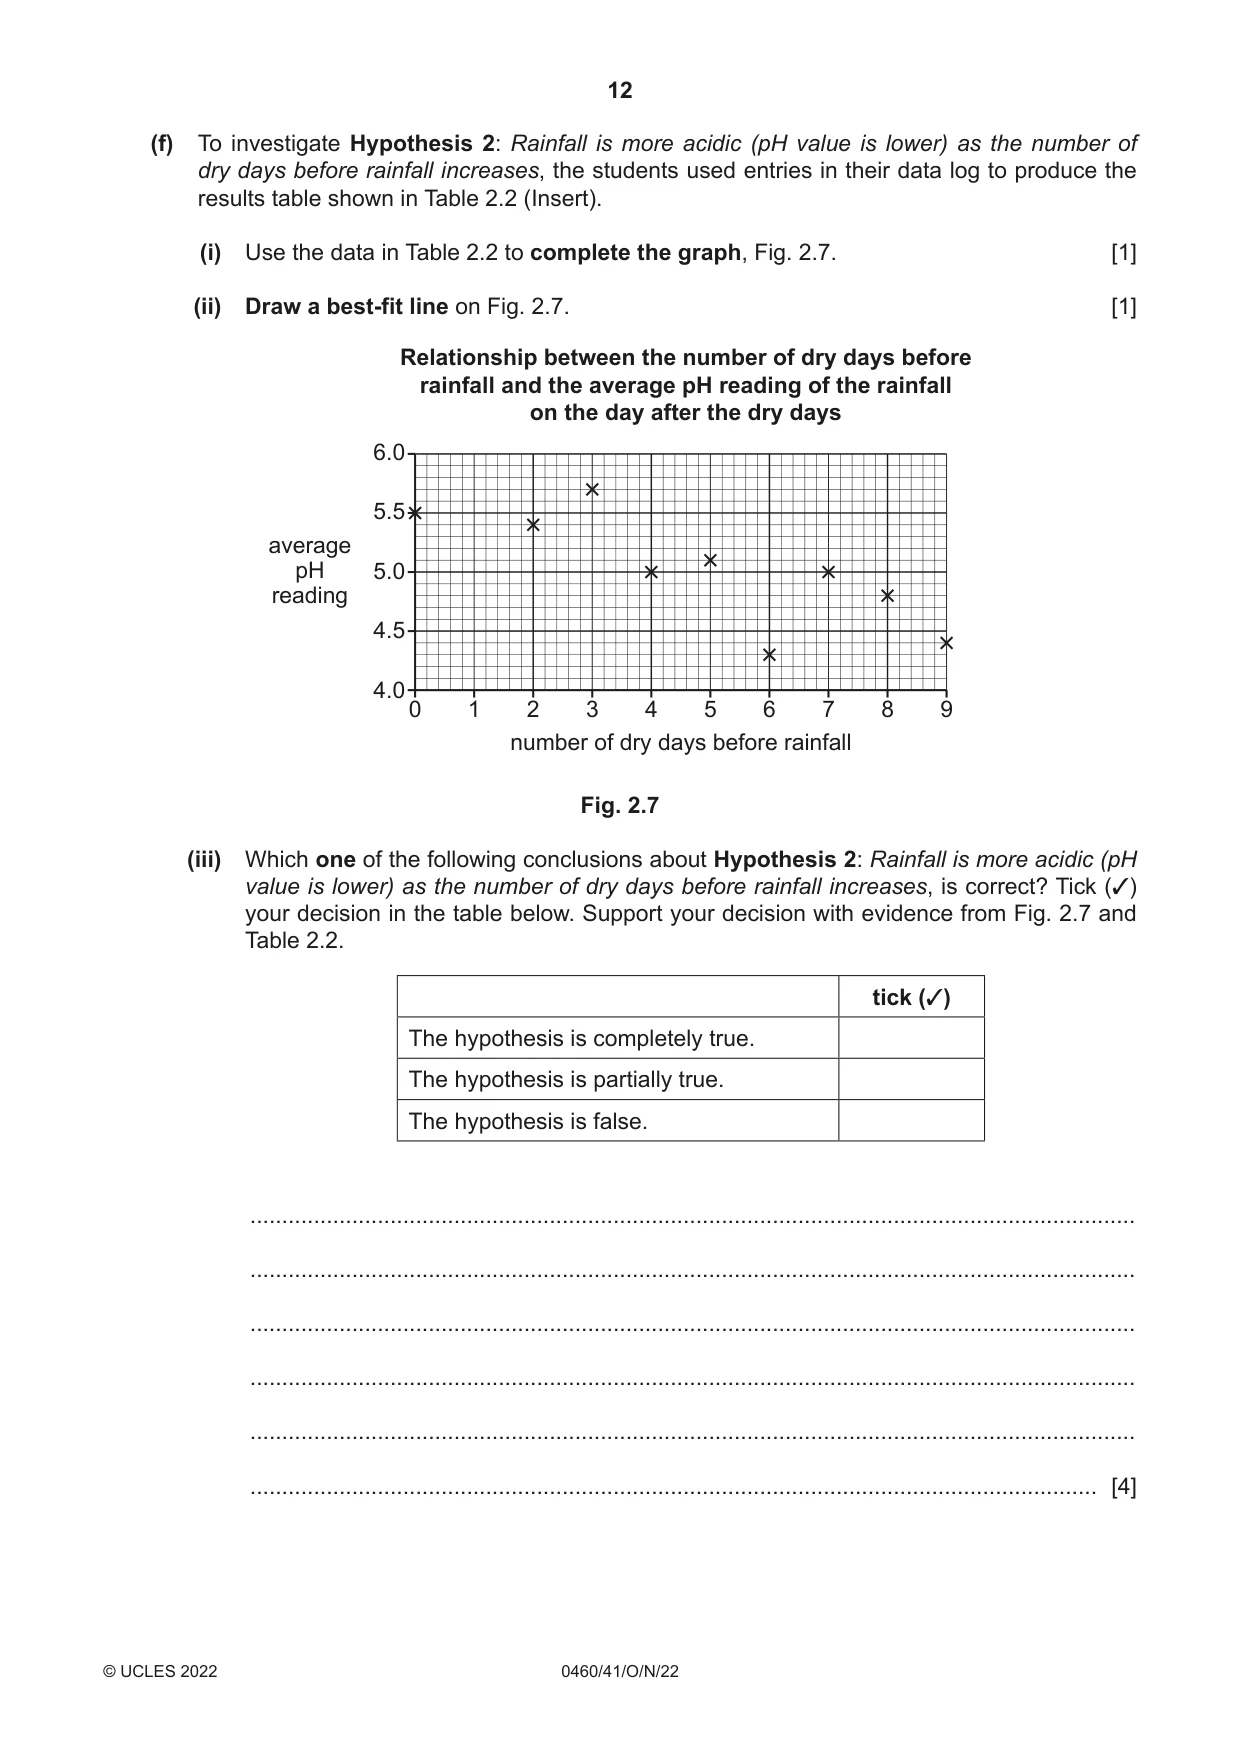
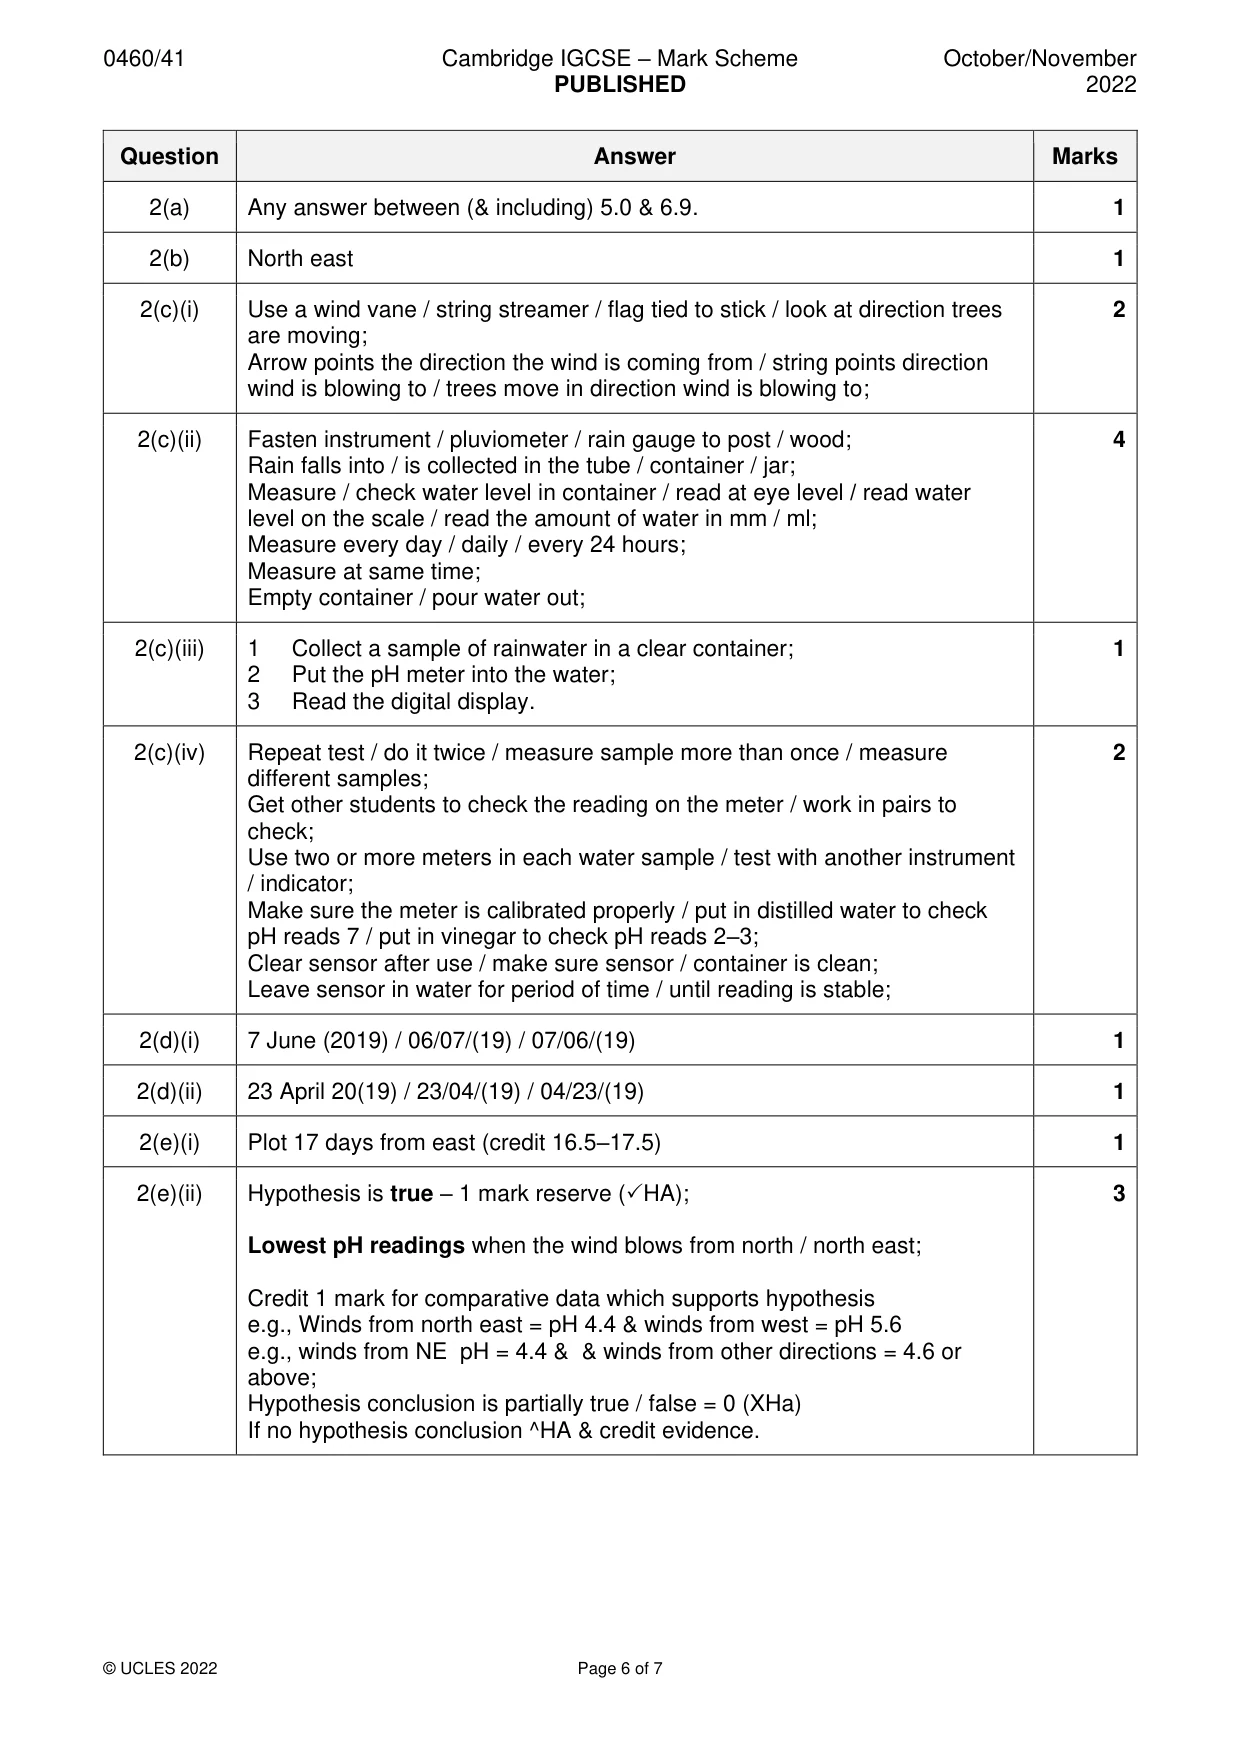
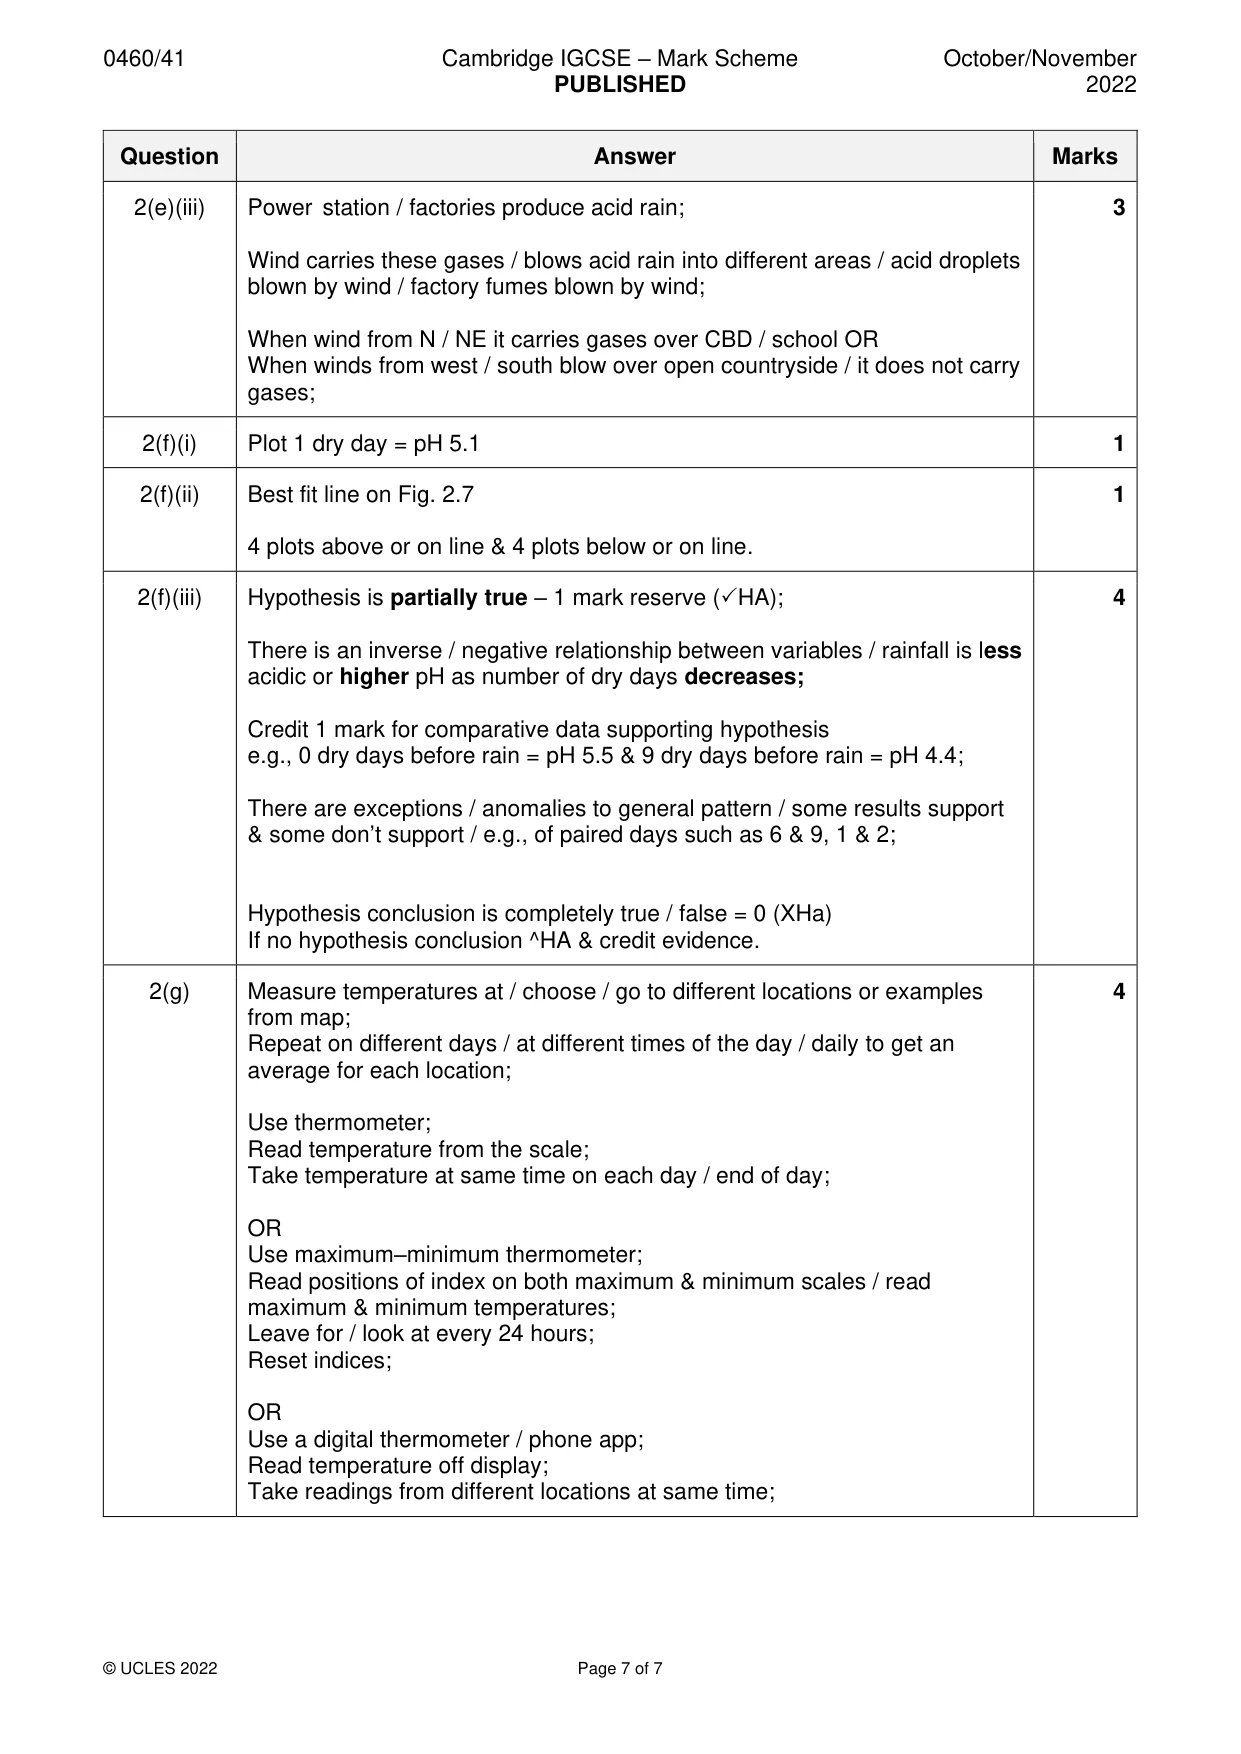
Mark scheme: 2(a) Any answer between (& including) 5.0 & 6.9. 1 2(b) North east 1 2(c)(i) Use a wind vane / string streamer / flag tied to stick / look at direction trees 2 are moving; Arrow points the direction the wind is coming from / string points direction wind is blowing to / trees move in direction wind is blowing to; 2(c)(ii) Fasten instrument / pluviometer / rain gauge to post / wood; 4 Rain falls into / is collected in the tube / container / jar; Measure / check water level in container / read at eye level / read water level on the scale / read the amount of water in mm / ml; Measure every day / daily / every 24 hours; Measure at same time; Empty container / pour water out; 2(c)(iii) 1 Collect a sample of rainwater in a clear container; 1 2 Put the pH meter into the water; 3 Read the digital display. 2(c)(iv) Repeat test / do it twice / measure sample more than once / measure 2 different samples; Get other students to check the reading on the meter / work in pairs to check; Use two or more meters in each water sample / test with another instrument / indicator; Make sure the meter is calibrated properly / put in distilled water to check pH reads 7 / put in vinegar to check pH reads 2–3; Clear sensor after use / make sure sensor / container is clean; Leave sensor in water for period of time / until reading is stable; 2(d)(i) 7 June (2019) / 06/07/(19) / 07/06/(19) 1 2(d)(ii) 23 April 20(19) / 23/04/(19) / 04/23/(19) 1 2(e)(i) Plot 17 days from east (credit 16.5–17.5) 1 2(e)(ii) Hypothesis is true – 1 mark reserve (HA); 3 Lowest pH readings when the wind blows from north / north east; Credit 1 mark for comparative data which supports hypothesis e.g., Winds from north east = pH 4.4 & winds from west = pH 5.6 e.g., winds from NE pH = 4.4 & & winds from other directions = 4.6 or above; Hypothesis conclusion is partially true / false = 0 (XHa) If no hypothesis conclusion ^HA & credit evidence. 2(e)(iii) Power station / factories produce acid rain; 3 Wind carries these gases / blows acid rain into different areas / acid droplets blown by wind / factory fumes blown by wind; When wind from N / NE it carries gases over CBD / school OR When winds from west / south blow over open countryside / it does not carry gases; 2(f)(i) Plot 1 dry day = pH 5.1 1 2(f)(ii) Best fit line on Fig. 2.7 1 4 plots above or on line & 4 plots below or on line. 2(f)(iii) Hypothesis is partially true – 1 mark reserve (HA); 4 There is an inverse / negative relationship between variables / rainfall is less acidic or higher pH as number of dry days decreases; Credit 1 mark for comparative data supporting hypothesis e.g., 0 dry days before rain = pH 5.5 & 9 dry days before rain = pH 4.4; There are exceptions / anomalies to general pattern / some results support & some don’t support / e.g., of paired days such as 6 & 9, 1 & 2; Hypothesis conclusion is completely true / false = 0 (XHa) If no hypothesis conclusion ^HA & credit evidence. 2(g) Measure temperatures at / choose / go to different locations or examples 4 from map; Repeat on different days / at different times of the day / daily to get an average for each location; Use thermometer; Read temperature from the scale; Take temperature at same time on each day / end of day; OR Use maximum–minimum thermometer; Read positions of index on both maximum & minimum scales / read maximum & minimum temperatures; Leave for / look at every 24 hours; Reset indices; OR Use a digital thermometer / phone app; Read temperature off display; Take readings from different locations at same time;
What was in this paper
The subtopics covered by these 2 questions, and how many questions each got. Open one in a new tab to see every Cambridge question on it.
What you needed in this session
Cambridge’s own grade thresholds for 2022 Oct/Nov, Paper 4 · Variant 1. A higher threshold means an easier paper — the bar moves with how the cohort did.