Cambridge IGCSE Geography 0460 — 2021 Oct/Nov Paper 4 · Variant 3
0460/43/O/N/21 · 2 questions · 60 marks · ≈68 min
The question paper and its mark scheme, free to read here and free to download. This is Cambridge’s own paper, exactly as it was sat.
Question paper16 pages



Mark scheme8 pages
Answers below. Sit the paper first if you are practising.
Questions as text
Q1 · A class of students did fieldwork at five sites along a local river to see how it changed…
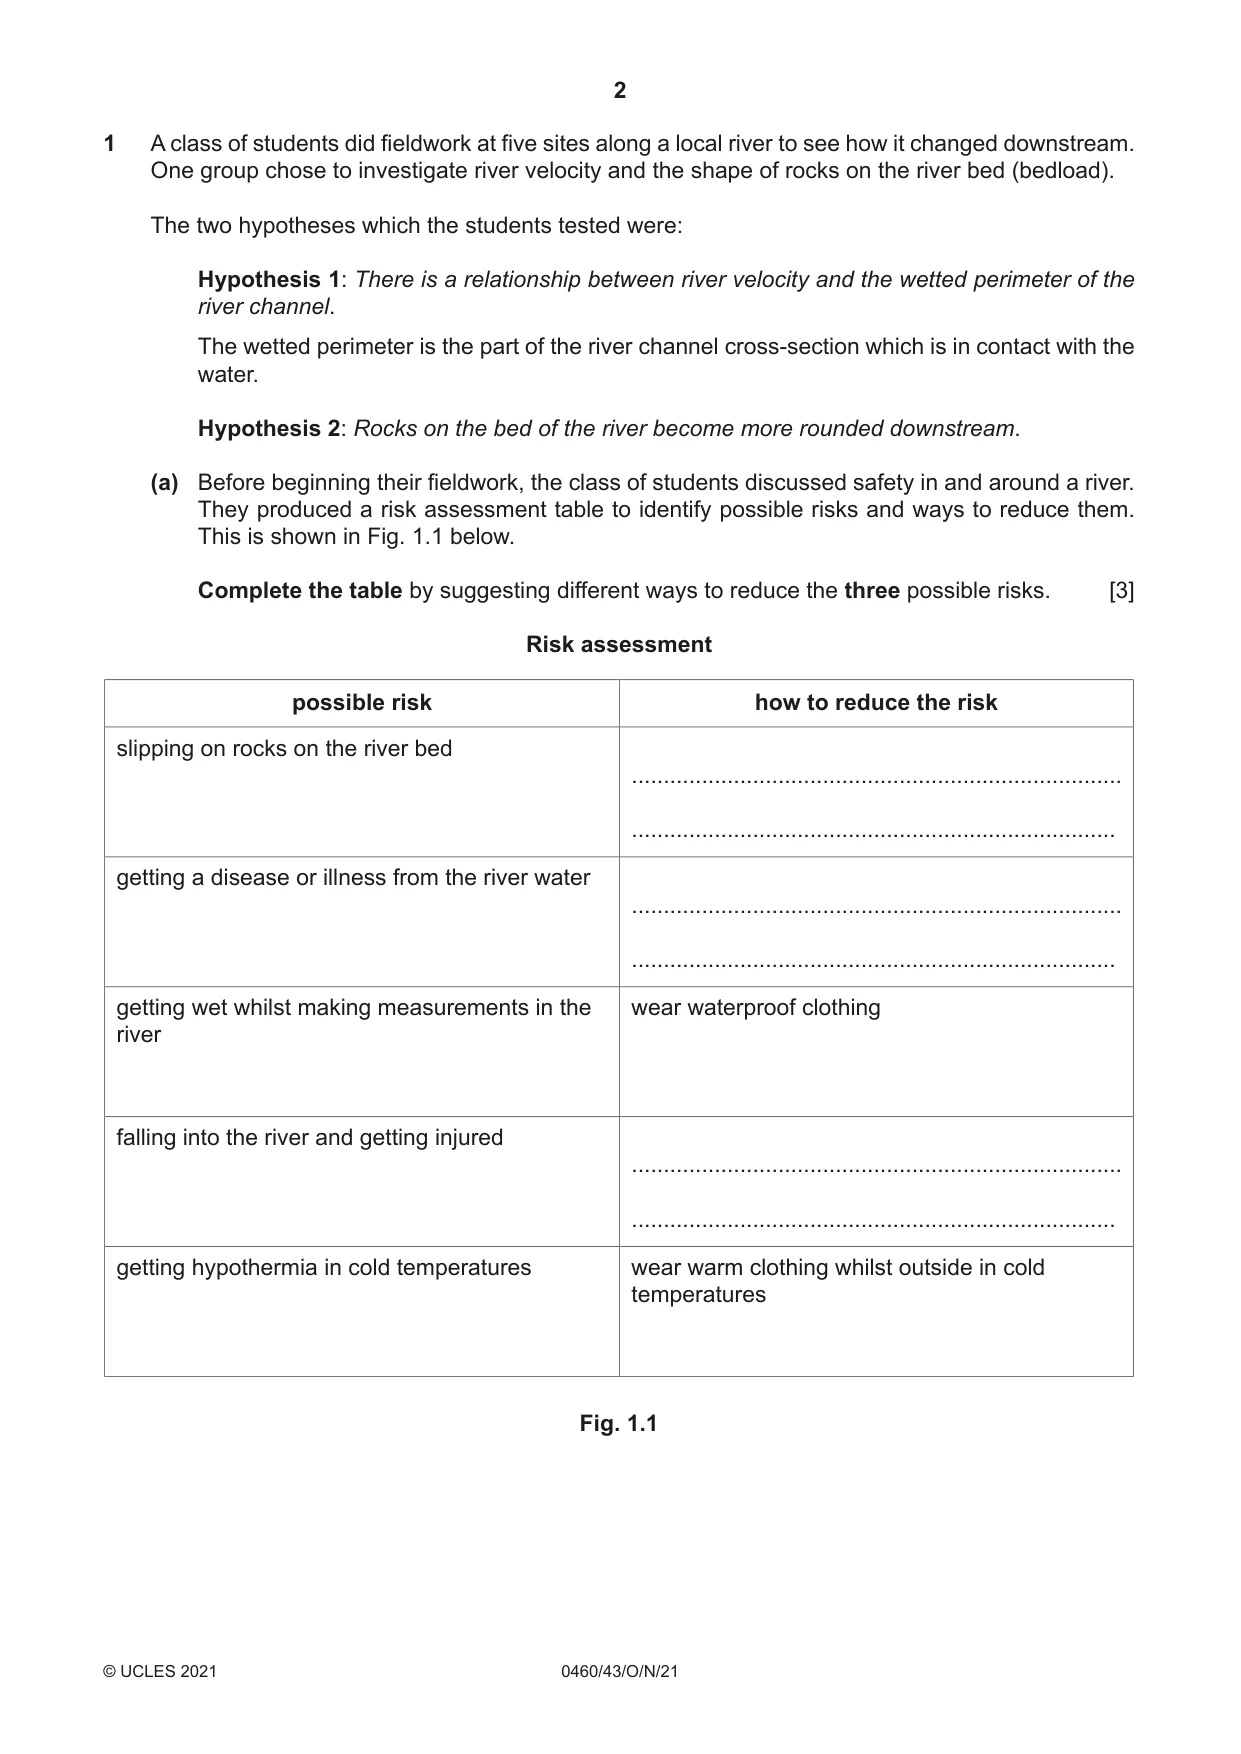
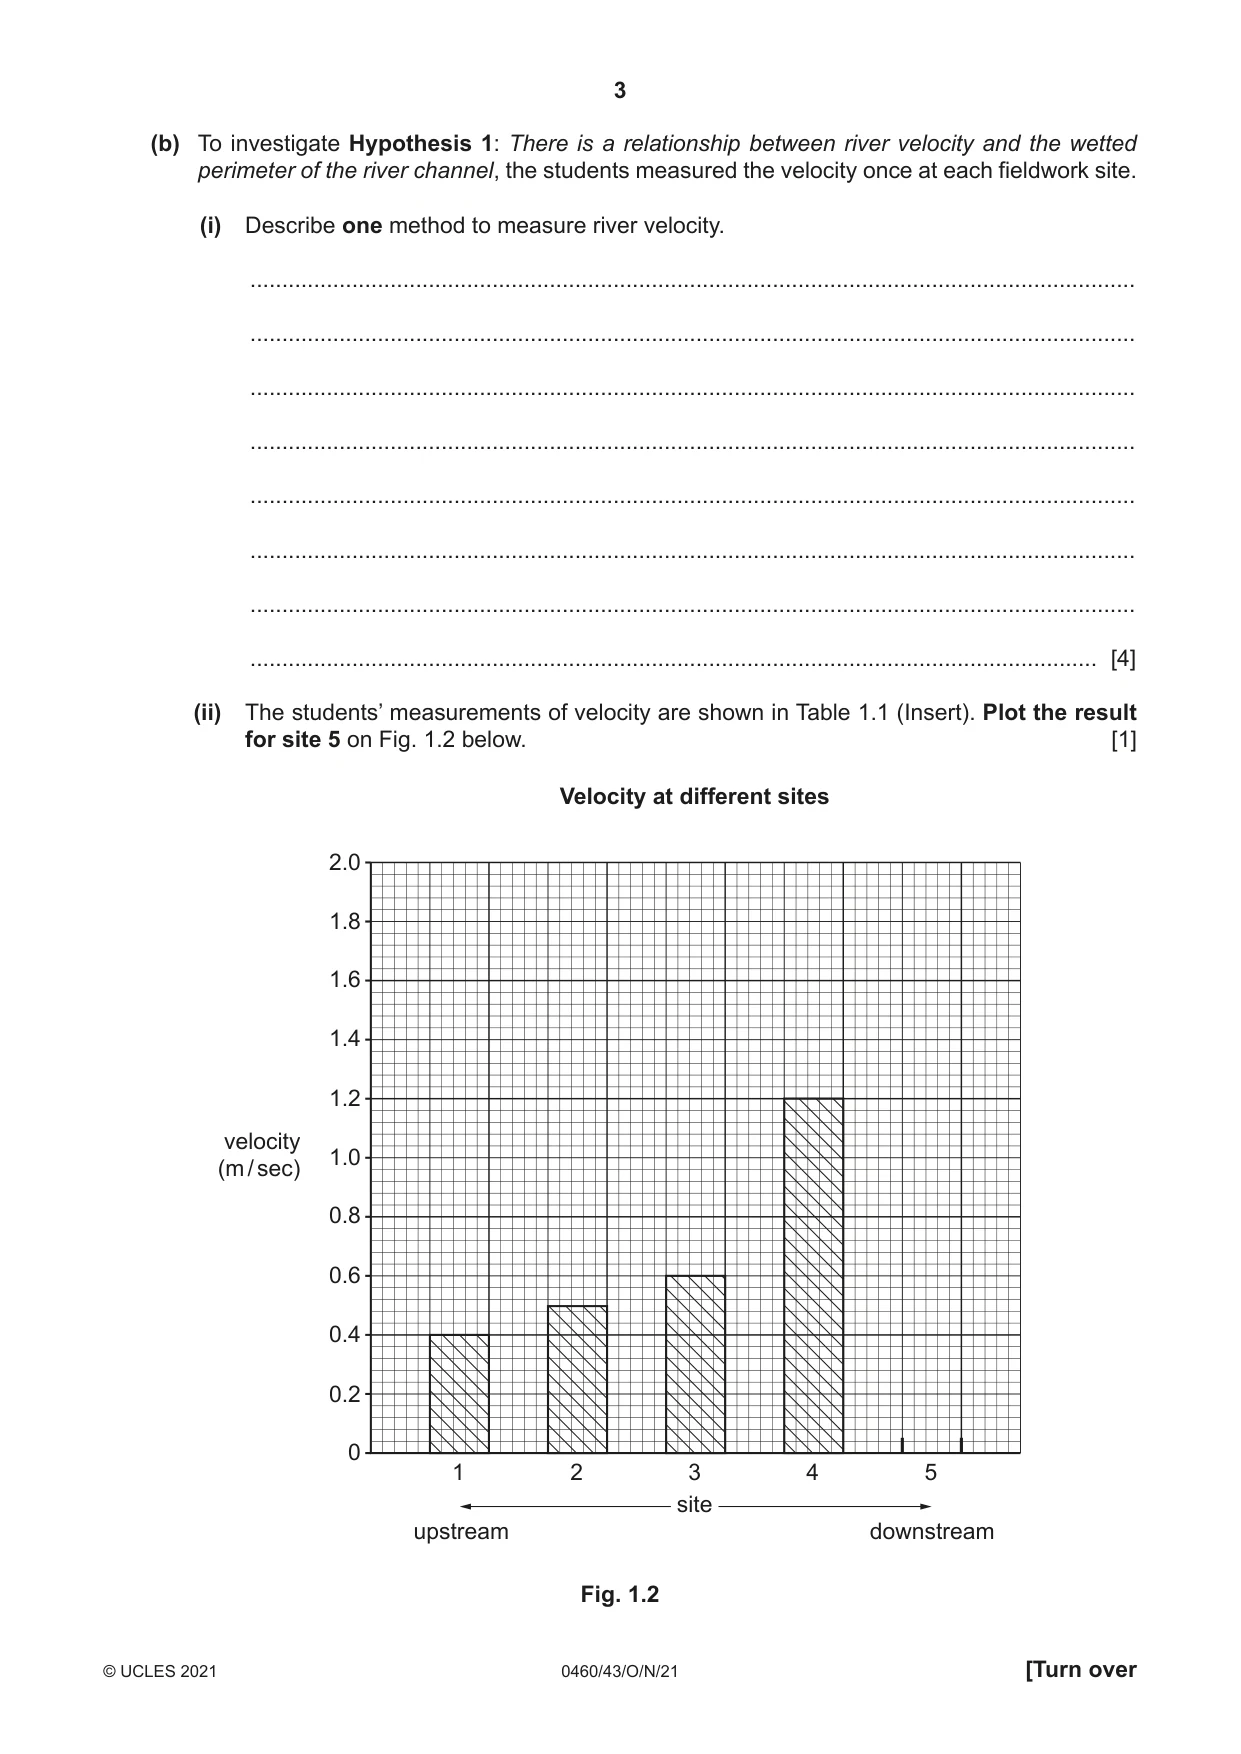
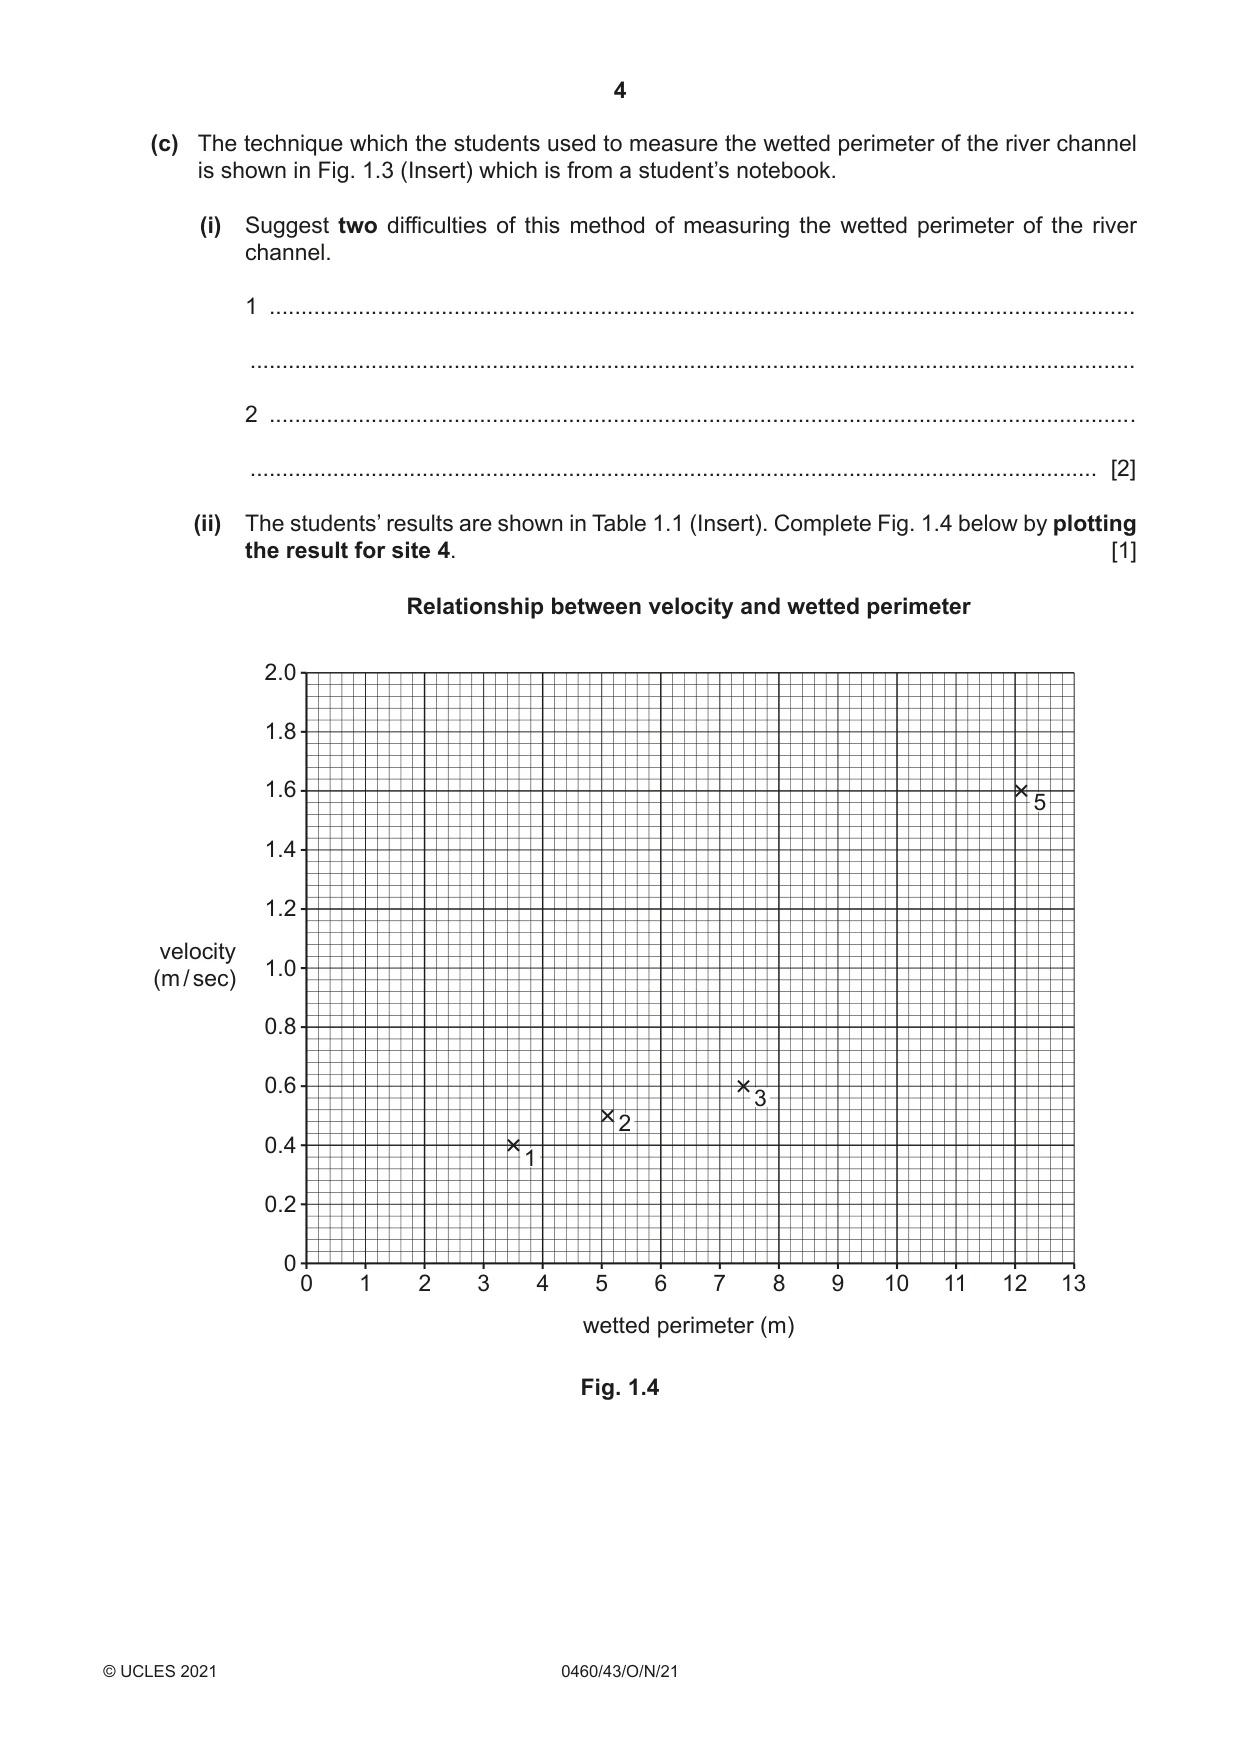
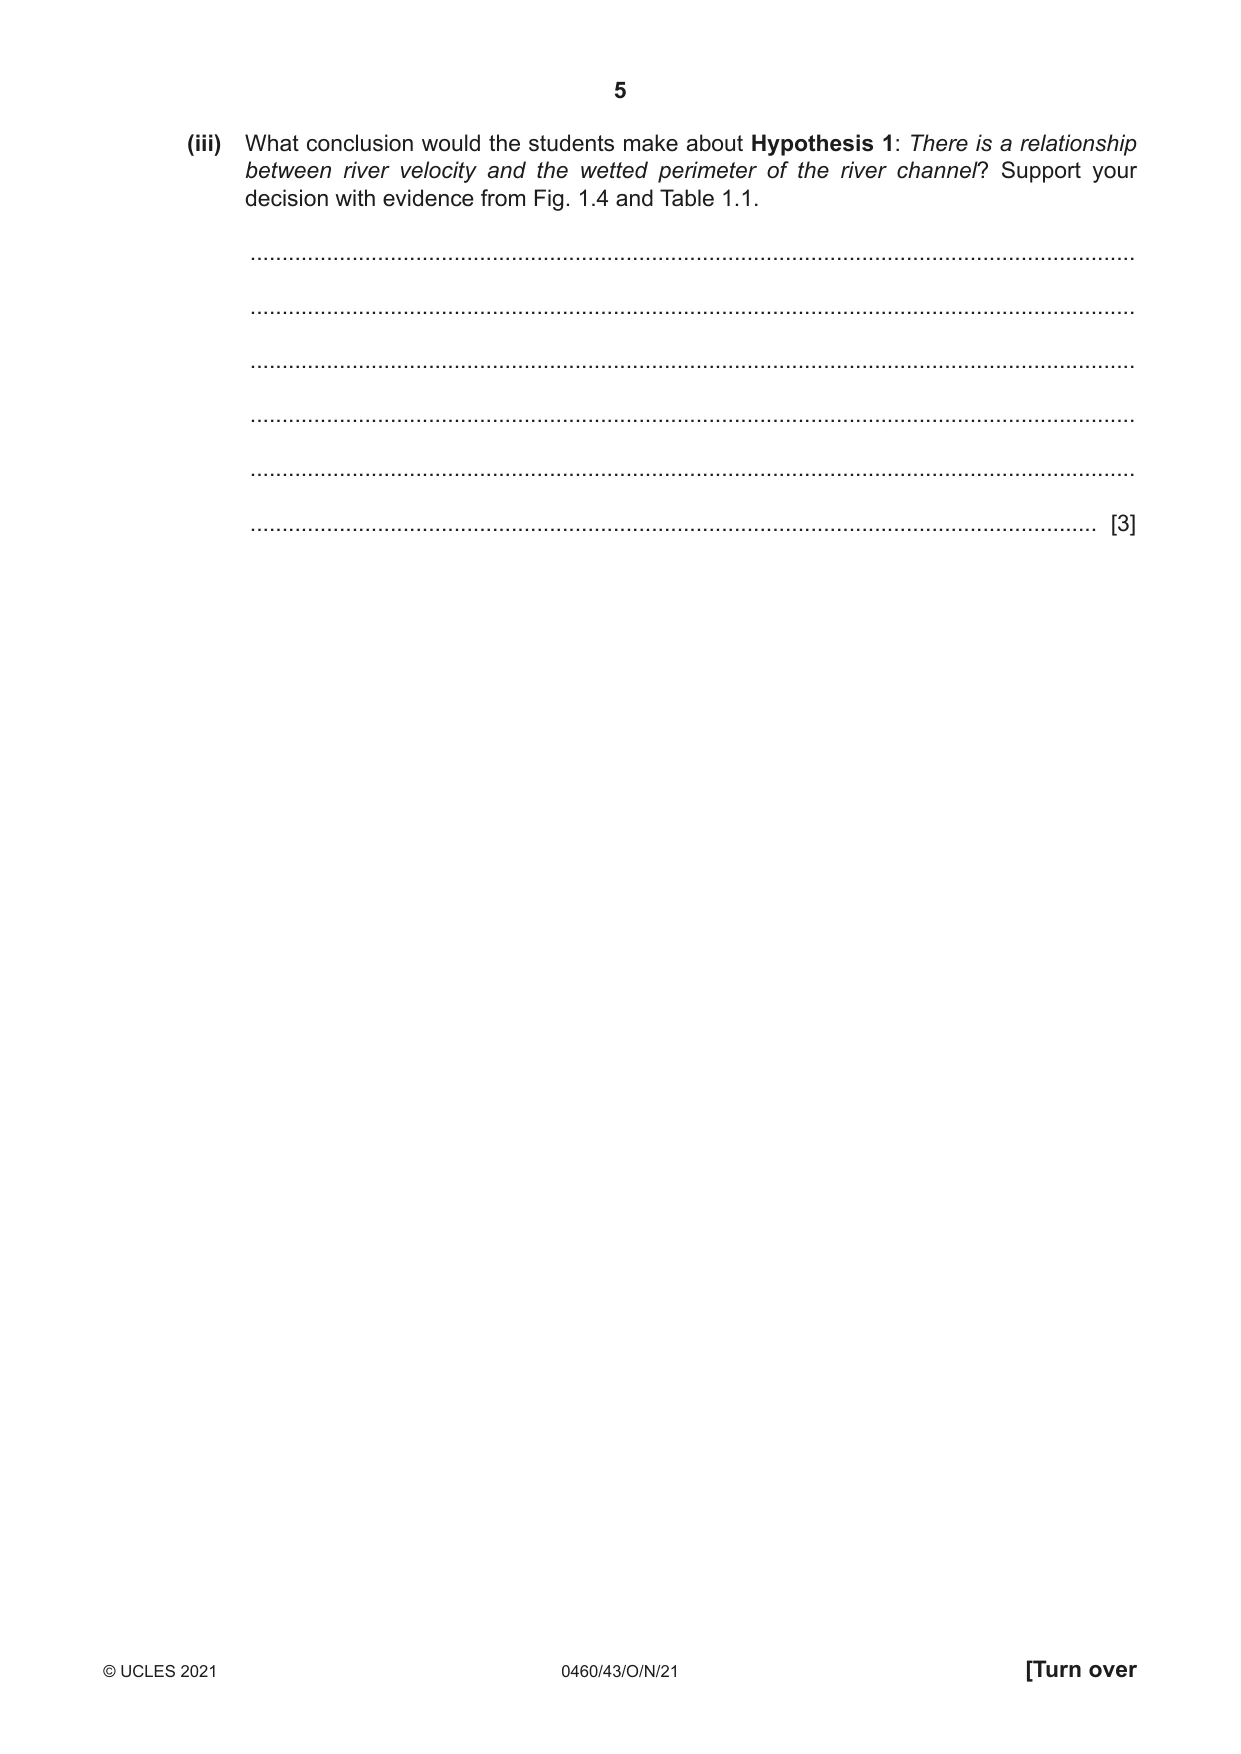
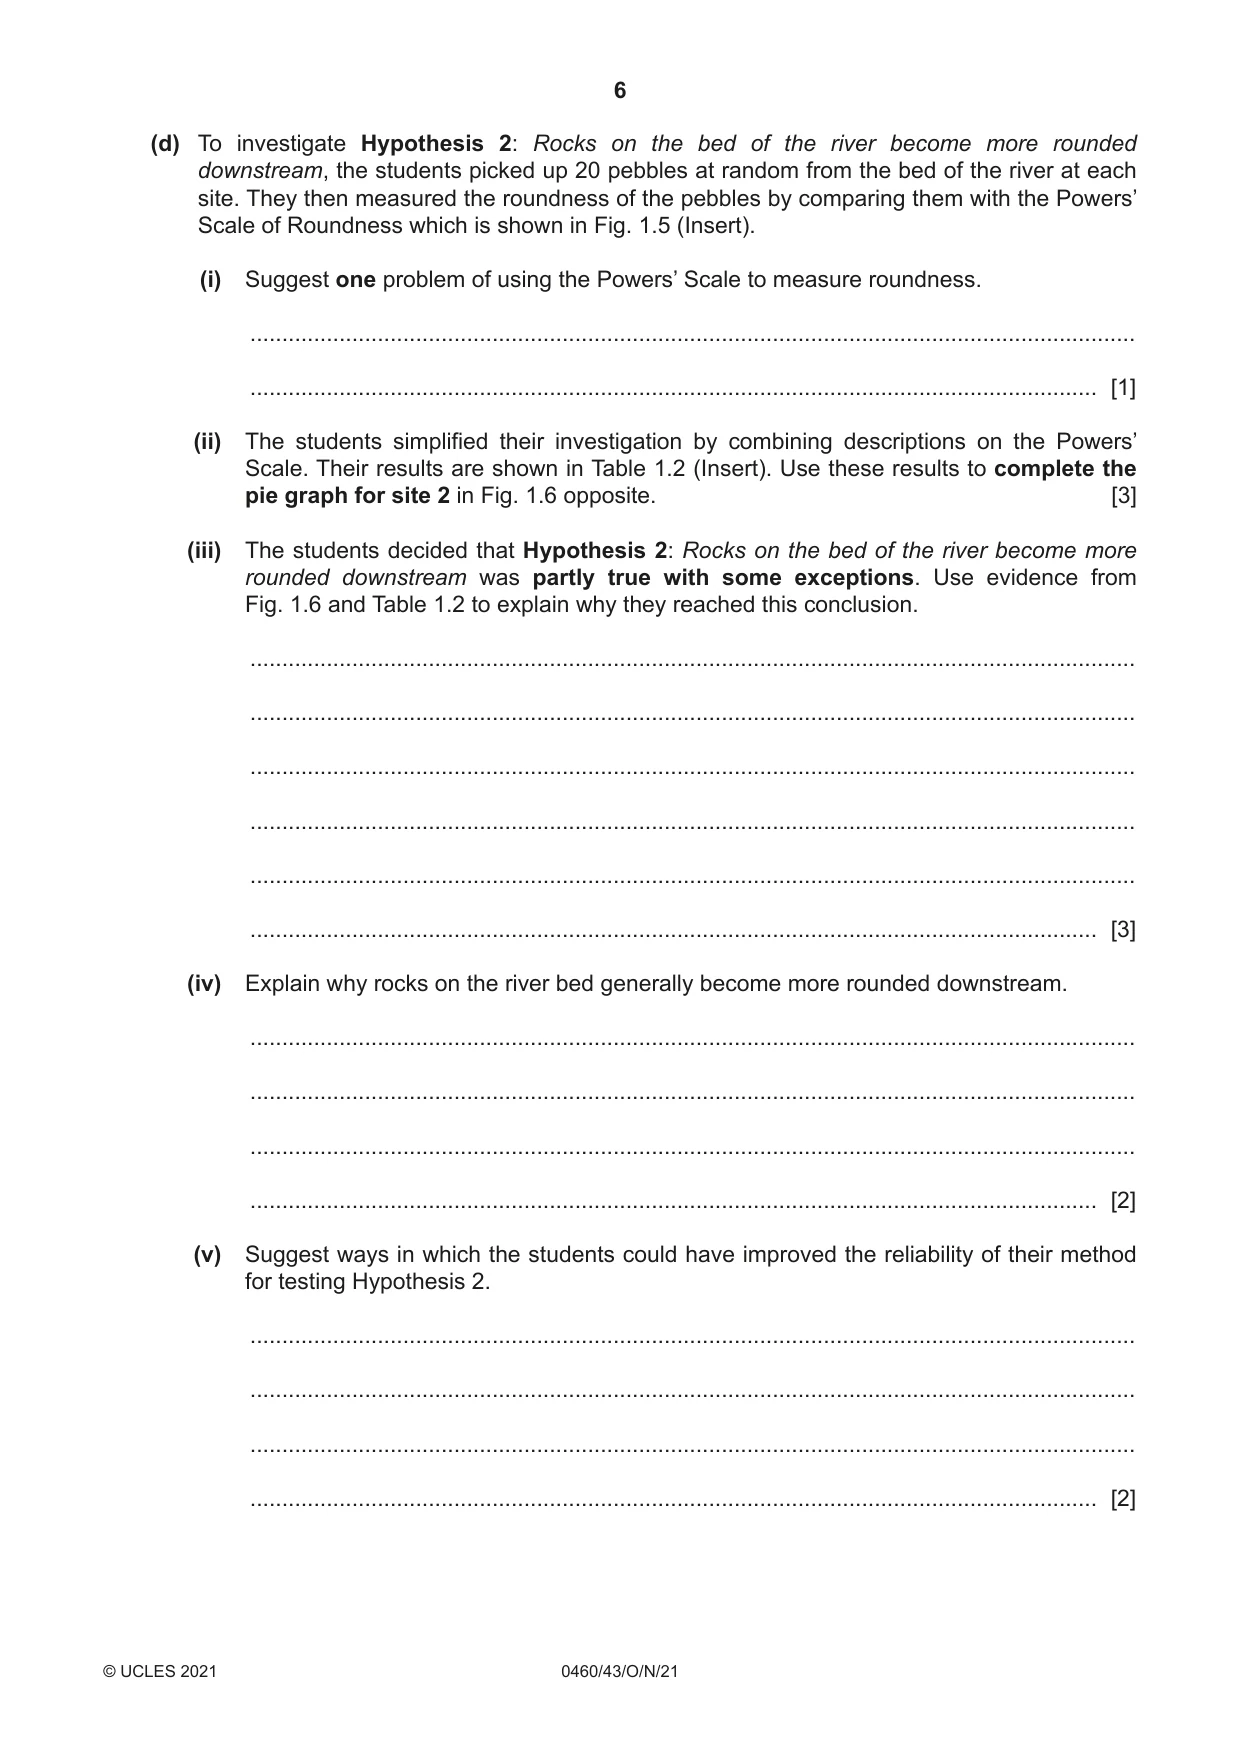
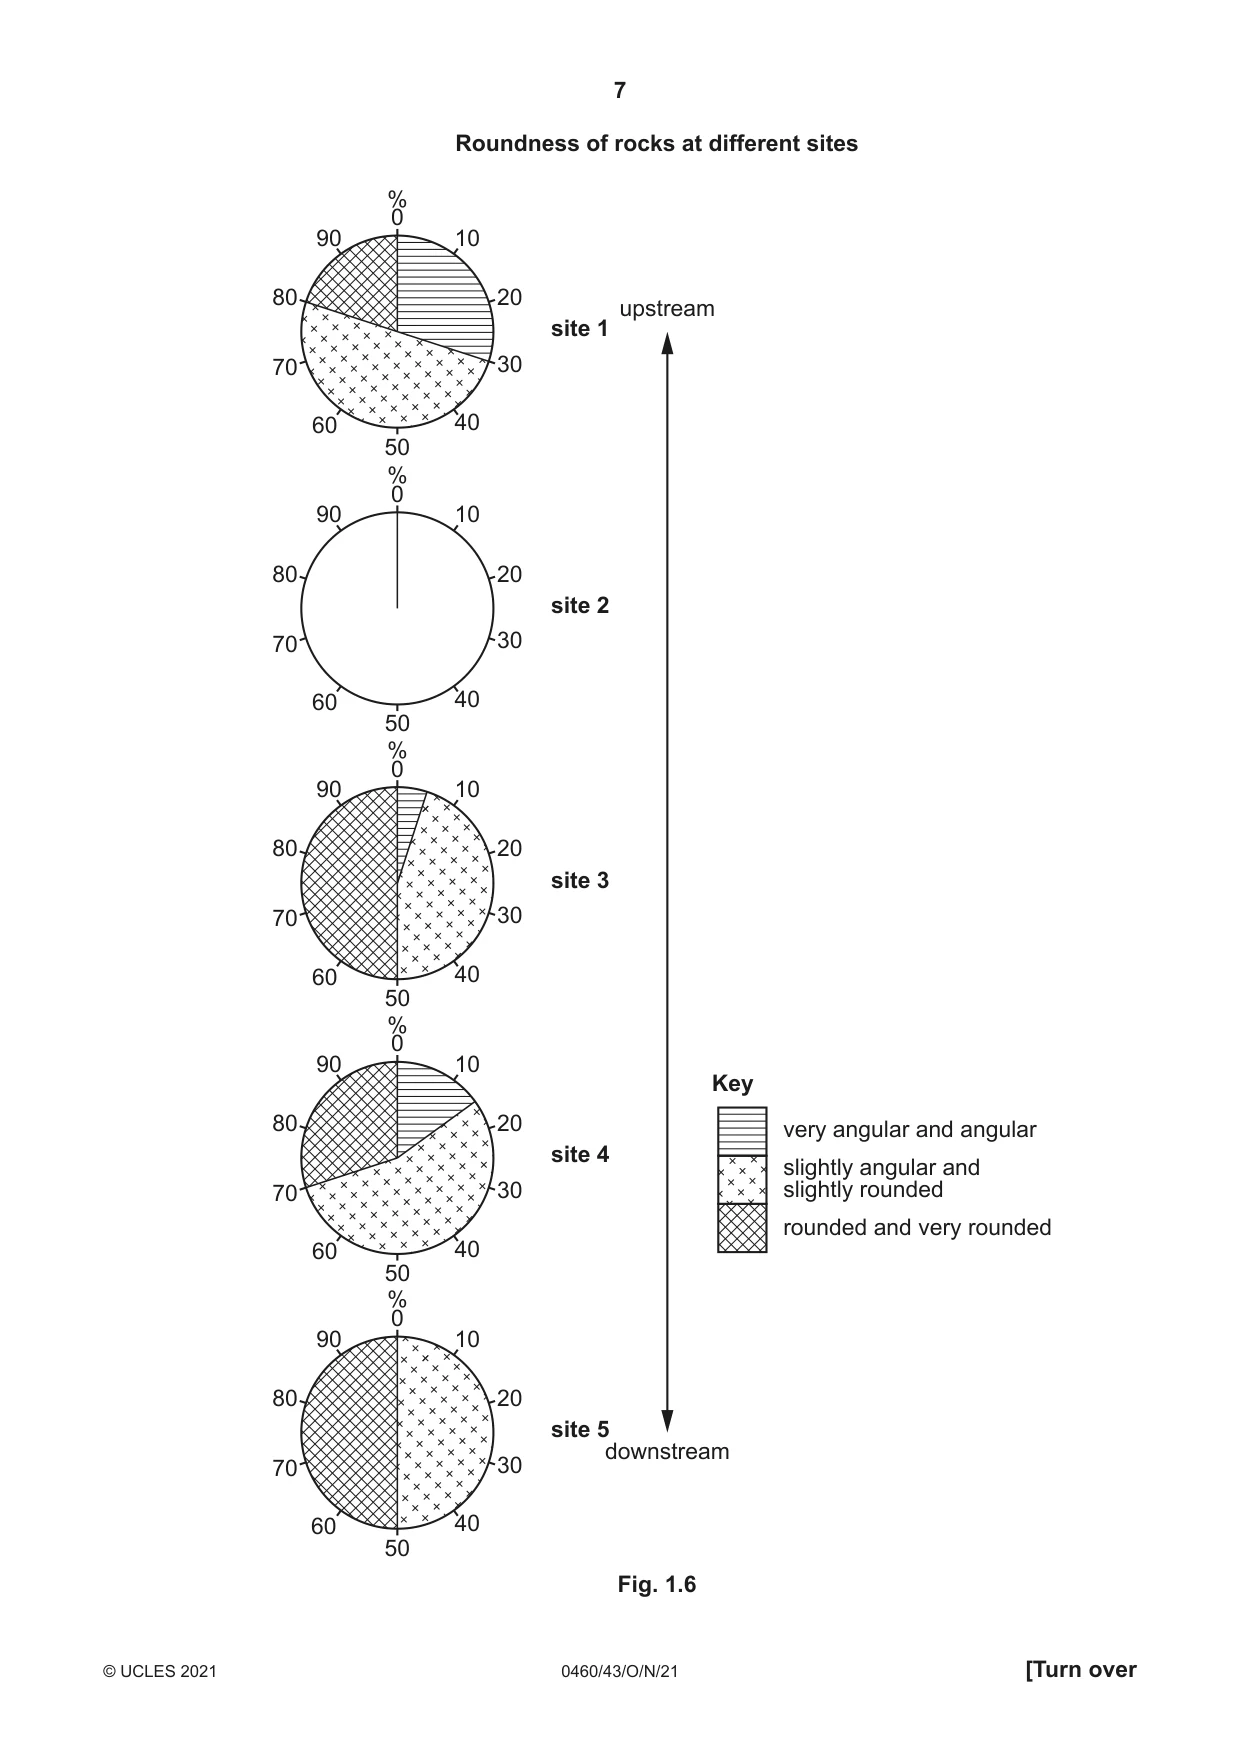
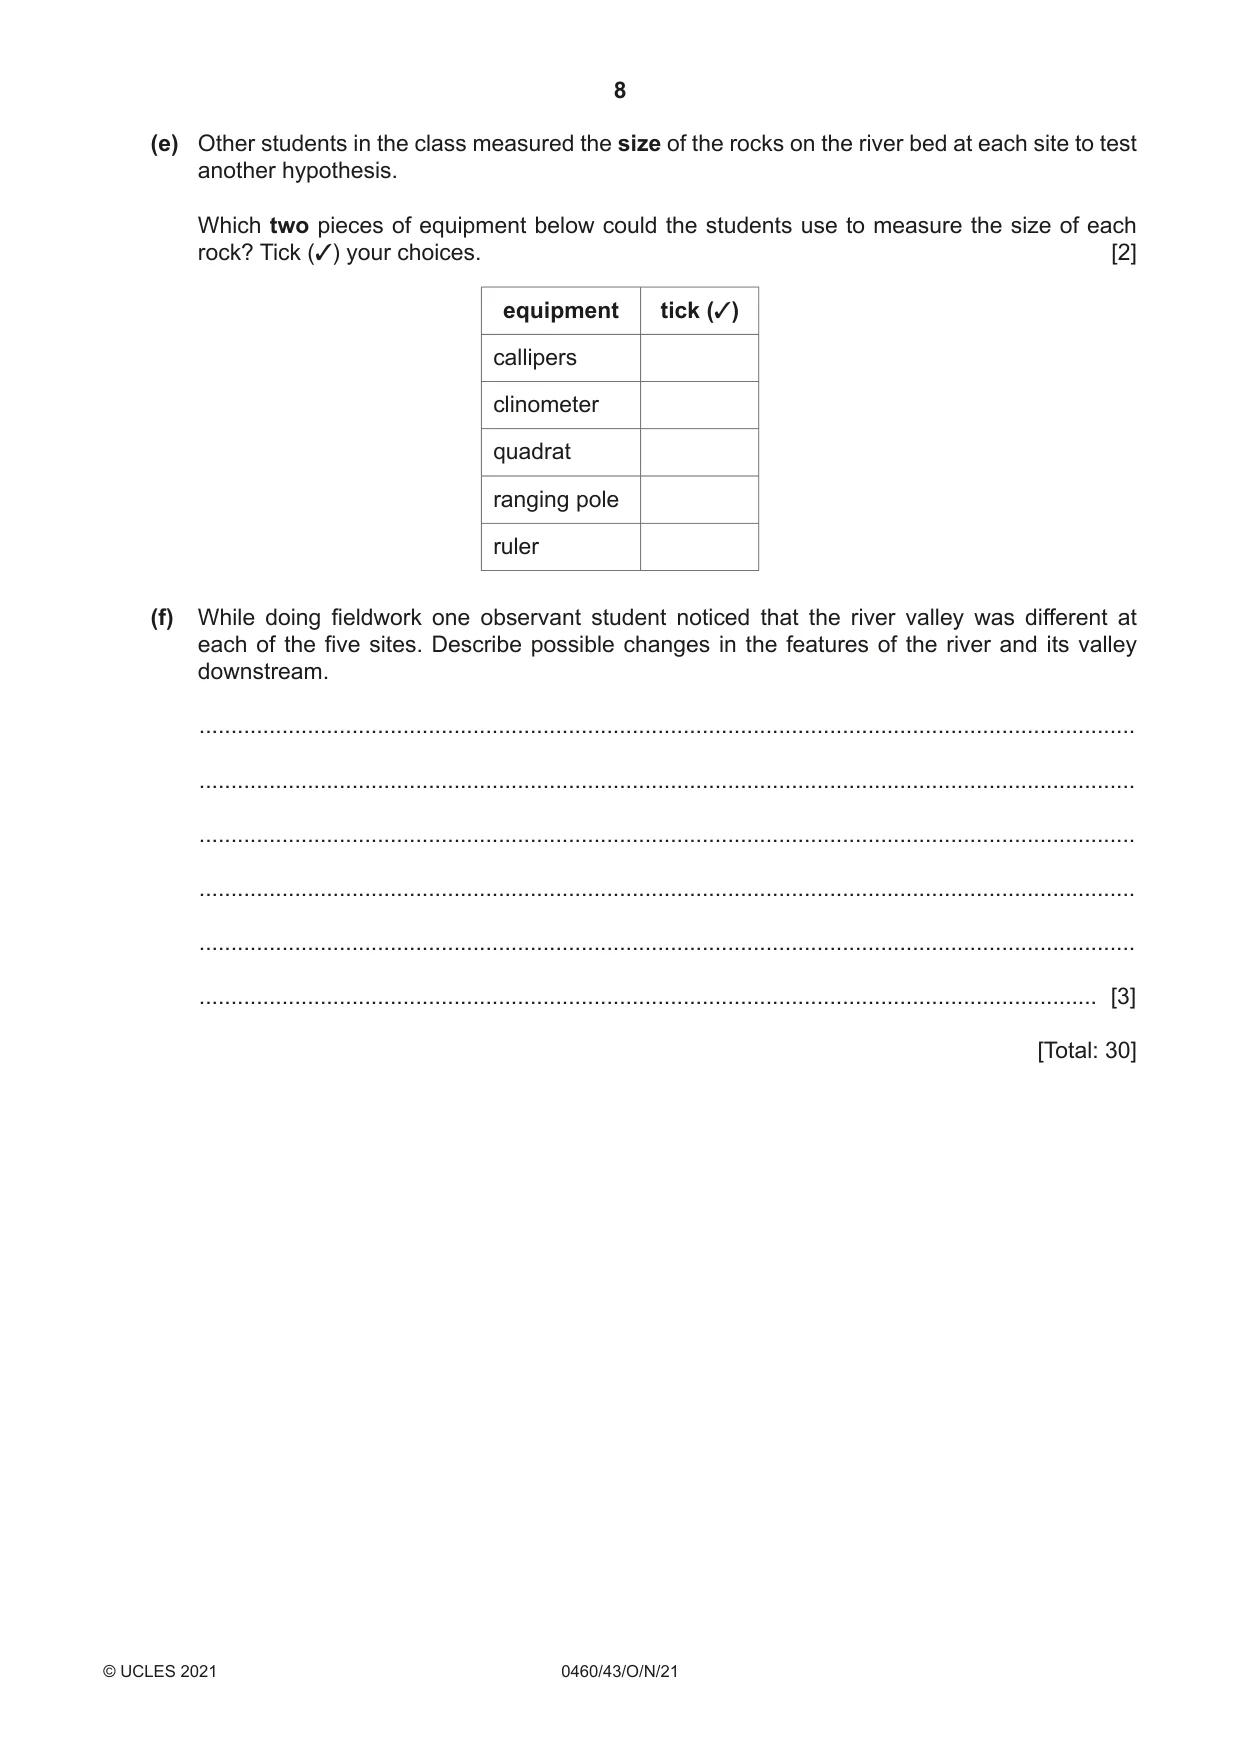
1 A class of students did fieldwork at five sites along a local river to see how it changed downstream. One group chose to investigate river velocity and the shape of rocks on the river bed (bedload). The two hypotheses which the students tested were: Hypothesis 1: There is a relationship between river velocity and the wetted perimeter of the river channel. The wetted perimeter is the part of the river channel cross-section which is in contact with the water. Hypothesis 2: Rocks on the bed of the river become more rounded downstream. (a) Before beginning their fieldwork, the class of students discussed safety in and around a river. They produced a risk assessment table to identify possible risks and ways to reduce them. This is shown in Fig. 1.1 below. Complete the table by suggesting different ways to reduce the three possible risks. [3] Risk assessment possible risk how to reduce the risk slipping on rocks on the river bed ............................................................................. ............................................................................ getting a disease or illness from the river water ............................................................................. ............................................................................ getting wet whilst making measurements in the wear waterproof clothing river falling into the river and getting injured ............................................................................. ............................................................................ getting hypothermia in cold temperatures wear warm clothing whilst outside in cold temperatures Fig. 1.1 (b) To investigate Hypothesis 1: There is a relationship between river velocity and the wetted perimeter of the river channel, the students measured the velocity once at each fieldwork site. (i) Describe one method to measure river velocity. ........................................................................................................................................... ........................................................................................................................................... ........................................................................................................................................... ........................................................................................................................................... ........................................................................................................................................... ........................................................................................................................................... ........................................................................................................................................... ..................................................................................................................................... [4] (ii) The students’ measurements of velocity are shown in Table 1.1 (Insert). Plot the result for site 5 on Fig. 1.2 below. [1] Velocity at different sites 2.0 1.8 1.6 1.4 1.2 velocity 1.0 (m / sec) 0.8 0.6 0.4 0.2 0 1 2 3 4 5 site upstream downstream Fig. 1.2 (c) The technique which the students used to measure the wetted perimeter of the river channel is shown in Fig. 1.3 (Insert) which is from a student’s notebook. (i) Suggest two difficulties of this method of measuring the wetted perimeter of the river channel. 1 ........................................................................................................................................ ........................................................................................................................................... 2 ........................................................................................................................................ ..................................................................................................................................... [2] (ii) The students’ results are shown in Table 1.1 (Insert). Complete Fig. 1.4 below by plotting the result for site 4. [1] Relationship between velocity and wetted perimeter 2.0 1.8 1.6 5 1.4 1.2 velocity 1.0(m / sec) 0.8 0.6 3 2 0.4 1 0.2 0 0 1 2 3 4 5 6 7 8 9 10 11 12 13 wetted perimeter (m) Fig. 1.4 (iii) What conclusion would the students make about Hypothesis 1: There is a relationship between river velocity and the wetted perimeter of the river channel? Support your decision with evidence from Fig. 1.4 and Table 1.1. ........................................................................................................................................... ........................................................................................................................................... ........................................................................................................................................... ........................................................................................................................................... ........................................................................................................................................... ..................................................................................................................................... [3] (d) To investigate Hypothesis 2: Rocks on the bed of the river become more rounded downstream, the students picked up 20 pebbles at random from the bed of the river at each site. They then measured the roundness of the pebbles by comparing them with the Powers’ Scale of Roundness which is shown in Fig. 1.5 (Insert). (i) Suggest one problem of using the Powers’ Scale to measure roundness. ........................................................................................................................................... ..................................................................................................................................... [1] (ii) The students simplified their investigation by combining descriptions on the Powers’ Scale. Their results are shown in Table 1.2 (Insert). Use these results to complete the pie graph for site 2 in Fig. 1.6 opposite. [3] (iii) The students decided that Hypothesis 2: Rocks on the bed of the river become more rounded downstream was partly true with some exceptions. Use evidence from Fig. 1.6 and Table 1.2 to explain why they reached this conclusion. ........................................................................................................................................... ........................................................................................................................................... ........................................................................................................................................... ........................................................................................................................................... ........................................................................................................................................... ..................................................................................................................................... [3] (iv) Explain why rocks on the river bed generally become more rounded downstream. ........................................................................................................................................... ........................................................................................................................................... ........................................................................................................................................... ..................................................................................................................................... [2] (v) Suggest ways in which the students could have improved the reliability of their method for testing Hypothesis 2. ........................................................................................................................................... ........................................................................................................................................... ........................................................................................................................................... ..................................................................................................................................... [2] Roundness of rock % 0 90 10 80 20 upst site 1 70 30 60 40 50 % 0 90 10 80 20 site 2 70 30 60 40 50 % 0 90 10 80 20 site 3 70 30 60 40 50 % 0 90 10 80 20 site 4 70 30 60 40 50 % 0 90 10 80 20 site 5 down70 30 60 40 50 Fig. (e) Other students in the class measured the size of the rocks on the river bed at each site to test another hypothesis. Which two pieces of equipment below could the students use to measure the size of each rock? Tick (3) your choices. [2] equipment tick (3) callipers clinometer quadrat ranging pole ruler (f) While doing fieldwork one observant student noticed that the river valley was different at each of the five sites. Describe possible changes in the features of the river and its valley downstream. ................................................................................................................................................... ................................................................................................................................................... ................................................................................................................................................... ................................................................................................................................................... ................................................................................................................................................... ............................................................................................................................................. [3] [Total: 30]
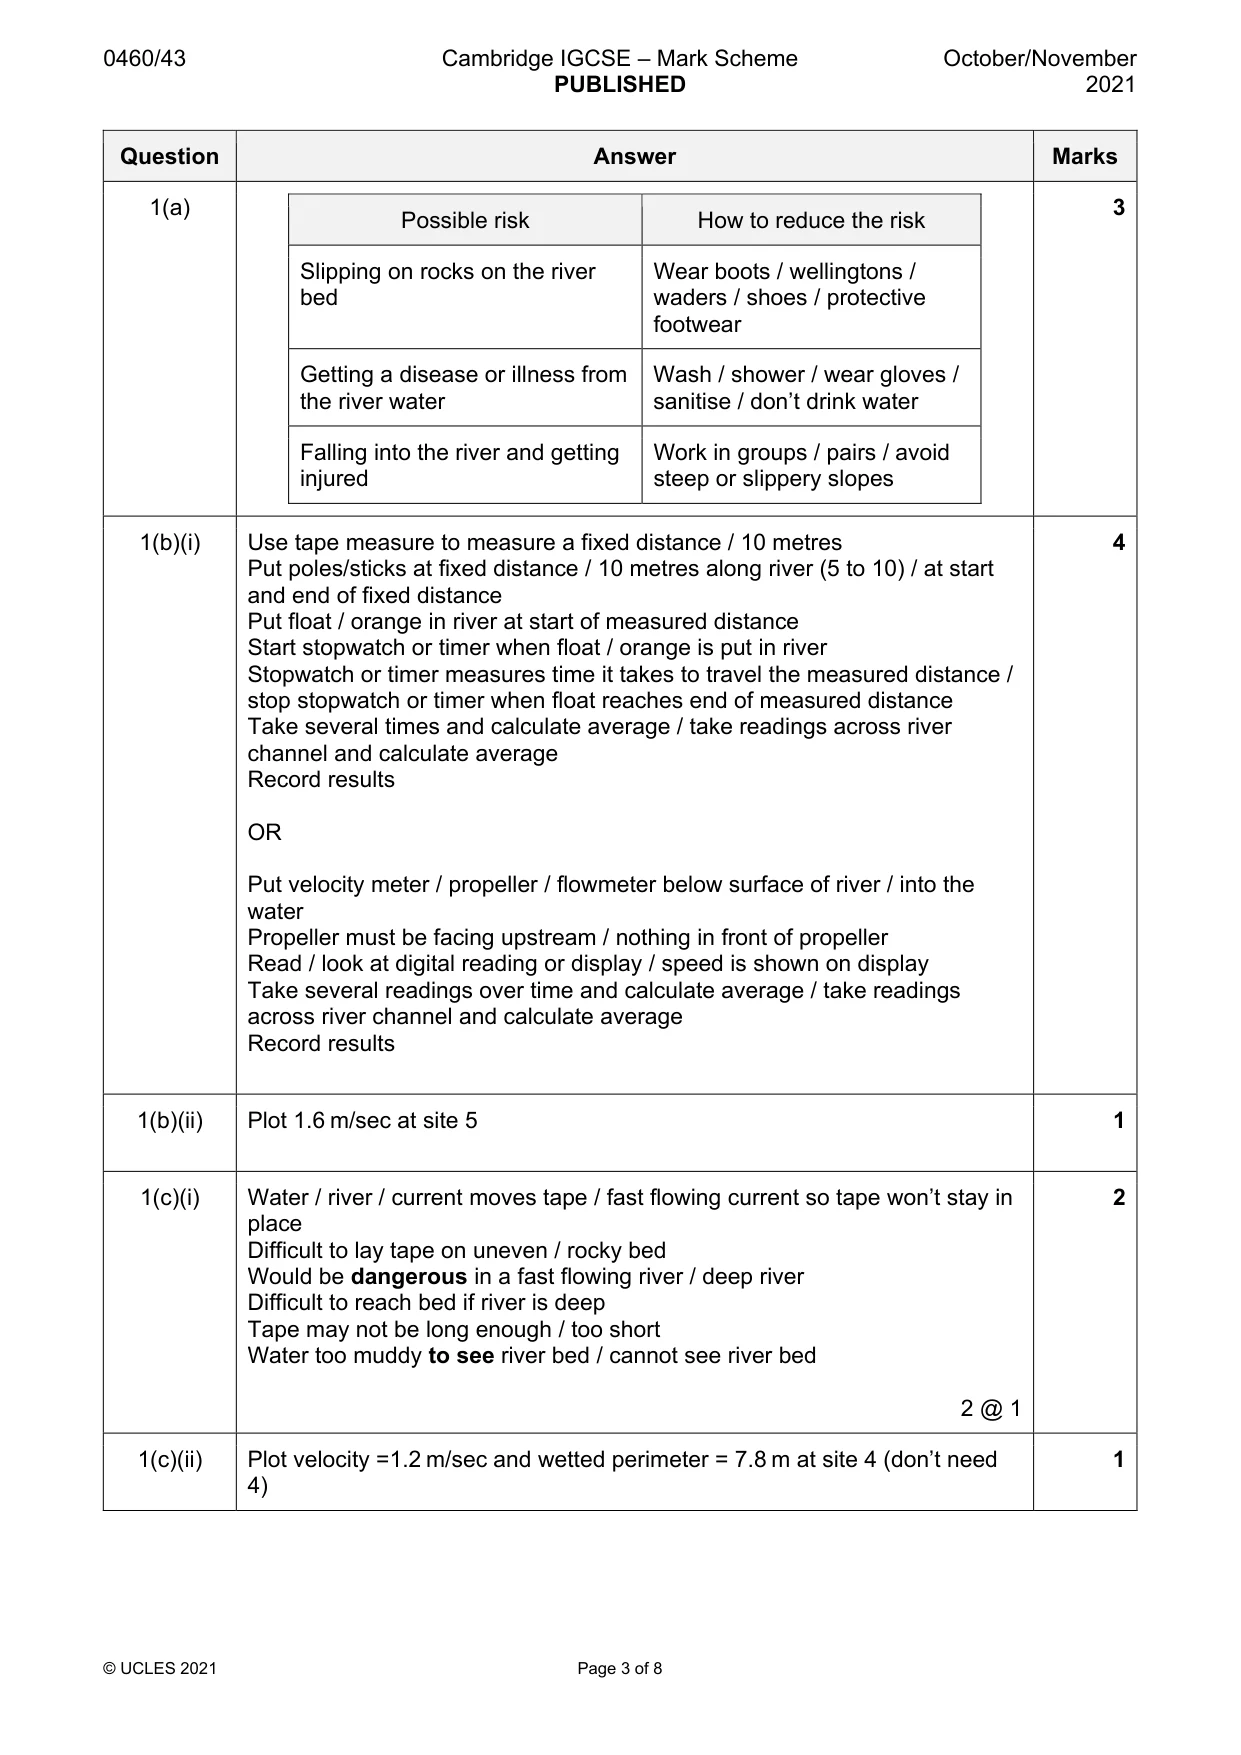
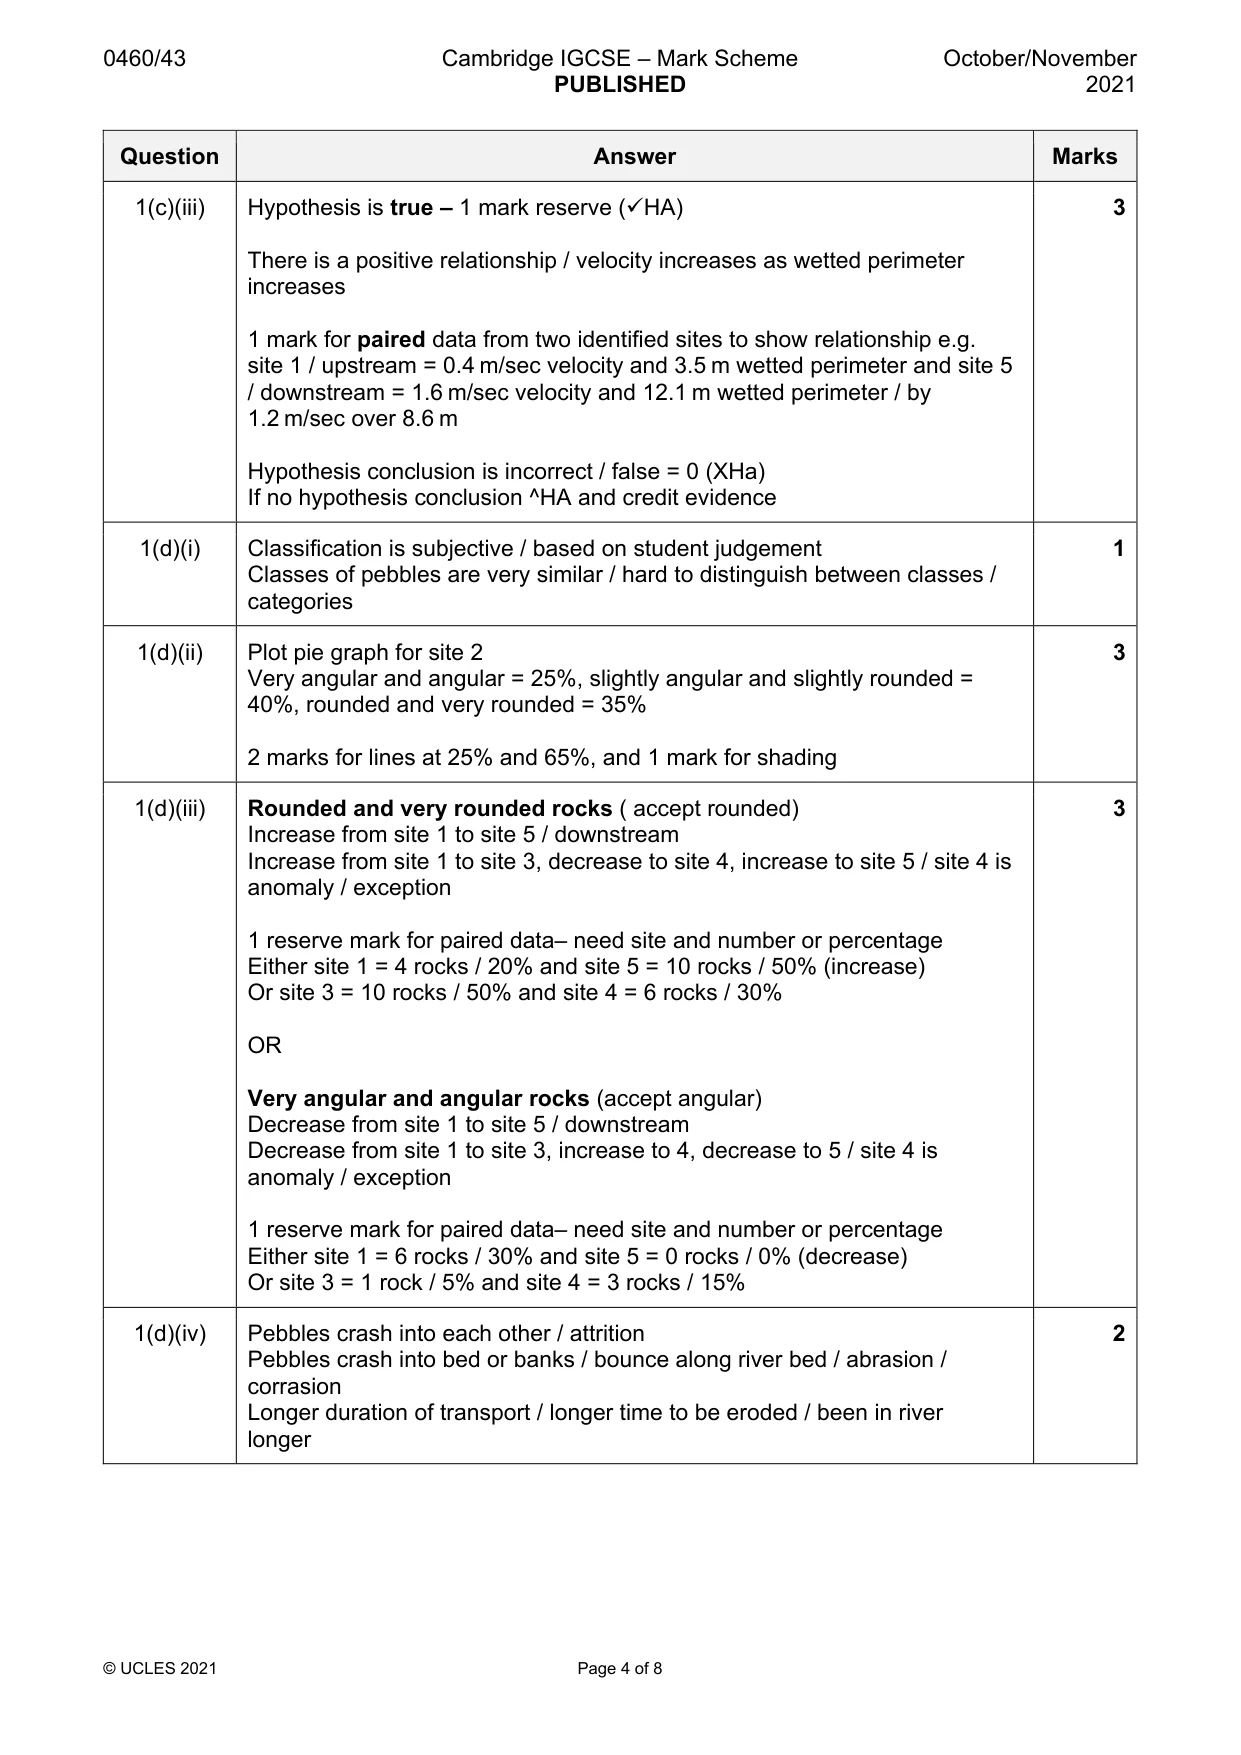
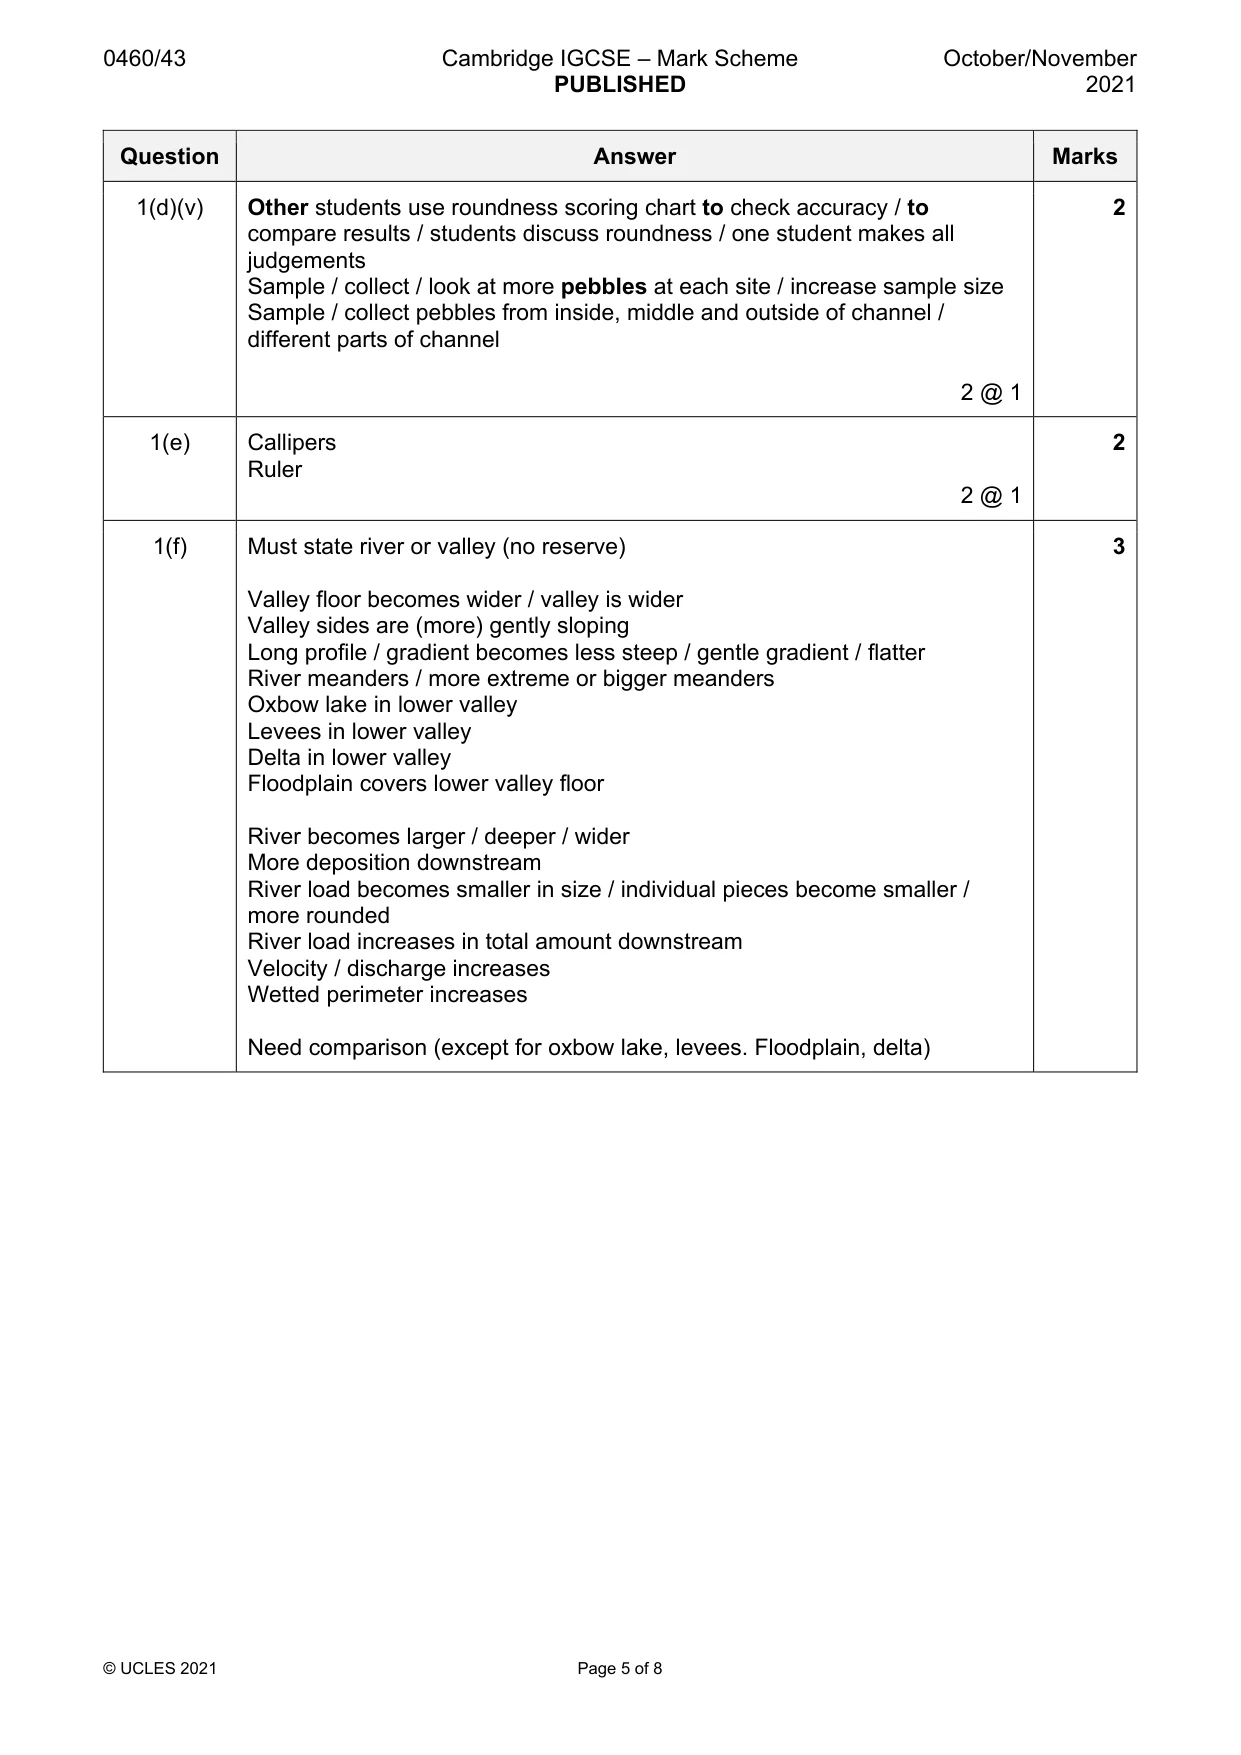
Mark scheme: Question Answer Marks 1(a) 3 Possible risk How to reduce the risk Slipping on rocks on the river Wear boots / wellingtons / bed waders / shoes / protective footwear Getting a disease or illness from Wash / shower / wear gloves / the river water sanitise / don’t drink water Falling into the river and getting Work in groups / pairs / avoid injured steep or slippery slopes 1(b)(i) Use tape measure to measure a fixed distance / 10 metres 4 Put poles/sticks at fixed distance / 10 metres along river (5 to 10) / at start and end of fixed distance Put float / orange in river at start of measured distance Start stopwatch or timer when float / orange is put in river Stopwatch or timer measures time it takes to travel the measured distance / stop stopwatch or timer when float reaches end of measured distance Take several times and calculate average / take readings across river channel and calculate average Record results OR Put velocity meter / propeller / flowmeter below surface of river / into the water Propeller must be facing upstream / nothing in front of propeller Read / look at digital reading or display / speed is shown on display Take several readings over time and calculate average / take readings across river channel and calculate average Record results 1(b)(ii) Plot 1.6 m/sec at site 5 1 1(c)(i) Water / river / current moves tape / fast flowing current so tape won’t stay in 2 place Difficult to lay tape on uneven / rocky bed Would be dangerous in a fast flowing river / deep river Difficult to reach bed if river is deep Tape may not be long enough / too short Water too muddy to see river bed / cannot see river bed 2 @ 1 1(c)(ii) Plot velocity =1.2 m/sec and wetted perimeter = 7.8 m at site 4 (don’t need 1 4) 1(c)(iii) Hypothesis is true – 1 mark reserve (HA) 3 There is a positive relationship / velocity increases as wetted perimeter increases 1 mark for paired data from two identified sites to show relationship e.g. site 1 / upstream = 0.4 m/sec velocity and 3.5 m wetted perimeter and site 5 / downstream = 1.6 m/sec velocity and 12.1 m wetted perimeter / by 1.2 m/sec over 8.6 m Hypothesis conclusion is incorrect / false = 0 (XHa) If no hypothesis conclusion ^HA and credit evidence 1(d)(i) Classification is subjective / based on student judgement 1 Classes of pebbles are very similar / hard to distinguish between classes / categories 1(d)(ii) Plot pie graph for site 2 3 Very angular and angular = 25%, slightly angular and slightly rounded = 40%, rounded and very rounded = 35% 2 marks for lines at 25% and 65%, and 1 mark for shading 1(d)(iii) Rounded and very rounded rocks ( accept rounded) 3 Increase from site 1 to site 5 / downstream Increase from site 1 to site 3, decrease to site 4, increase to site 5 / site 4 is anomaly / exception 1 reserve mark for paired data– need site and number or percentage Either site 1 = 4 rocks / 20% and site 5 = 10 rocks / 50% (increase) Or site 3 = 10 rocks / 50% and site 4 = 6 rocks / 30% OR Very angular and angular rocks (accept angular) Decrease from site 1 to site 5 / downstream Decrease from site 1 to site 3, increase to 4, decrease to 5 / site 4 is anomaly / exception 1 reserve mark for paired data– need site and number or percentage Either site 1 = 6 rocks / 30% and site 5 = 0 rocks / 0% (decrease) Or site 3 = 1 rock / 5% and site 4 = 3 rocks / 15% 1(d)(iv) Pebbles crash into each other / attrition 2 Pebbles crash into bed or banks / bounce along river bed / abrasion / corrasion Longer duration of transport / longer time to be eroded / been in river longer 1(d)(v) Other students use roundness scoring chart to check accuracy / to 2 compare results / students discuss roundness / one student makes all judgements Sample / collect / look at more pebbles at each site / increase sample size Sample / collect pebbles from inside, middle and outside of channel / different parts of channel 2 @ 1 1(e) Callipers 2 Ruler 2 @ 1 1(f) Must state river or valley (no reserve) 3 Valley floor becomes wider / valley is wider Valley sides are (more) gently sloping Long profile / gradient becomes less steep / gentle gradient / flatter River meanders / more extreme or bigger meanders Oxbow lake in lower valley Levees in lower valley Delta in lower valley Floodplain covers lower valley floor River becomes larger / deeper / wider More deposition downstream River load becomes smaller in size / individual pieces become smaller / more rounded River load increases in total amount downstream Velocity / discharge increases Wetted perimeter increases Need comparison (except for oxbow lake, levees. Floodplain, delta)
Q2 · Students lived in a village where a by-pass road had recently been completed
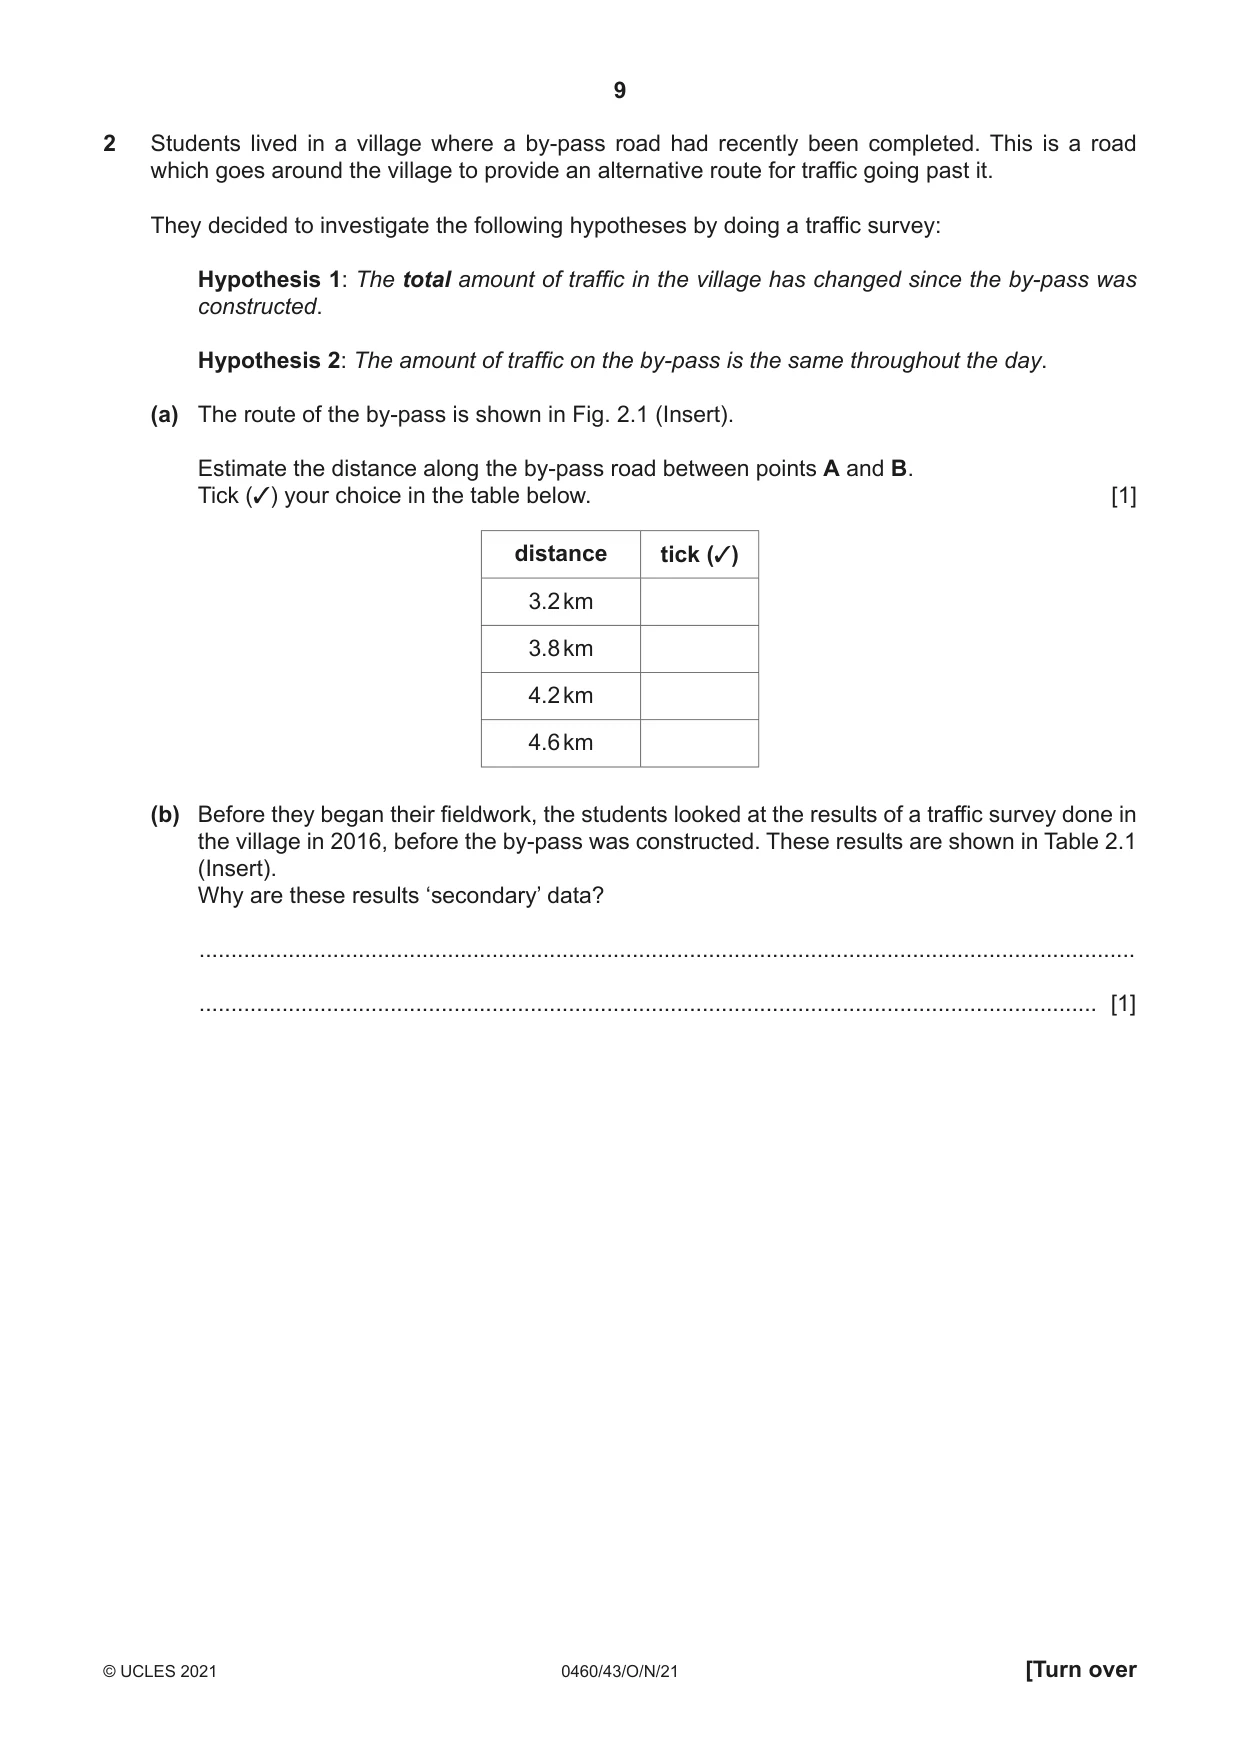
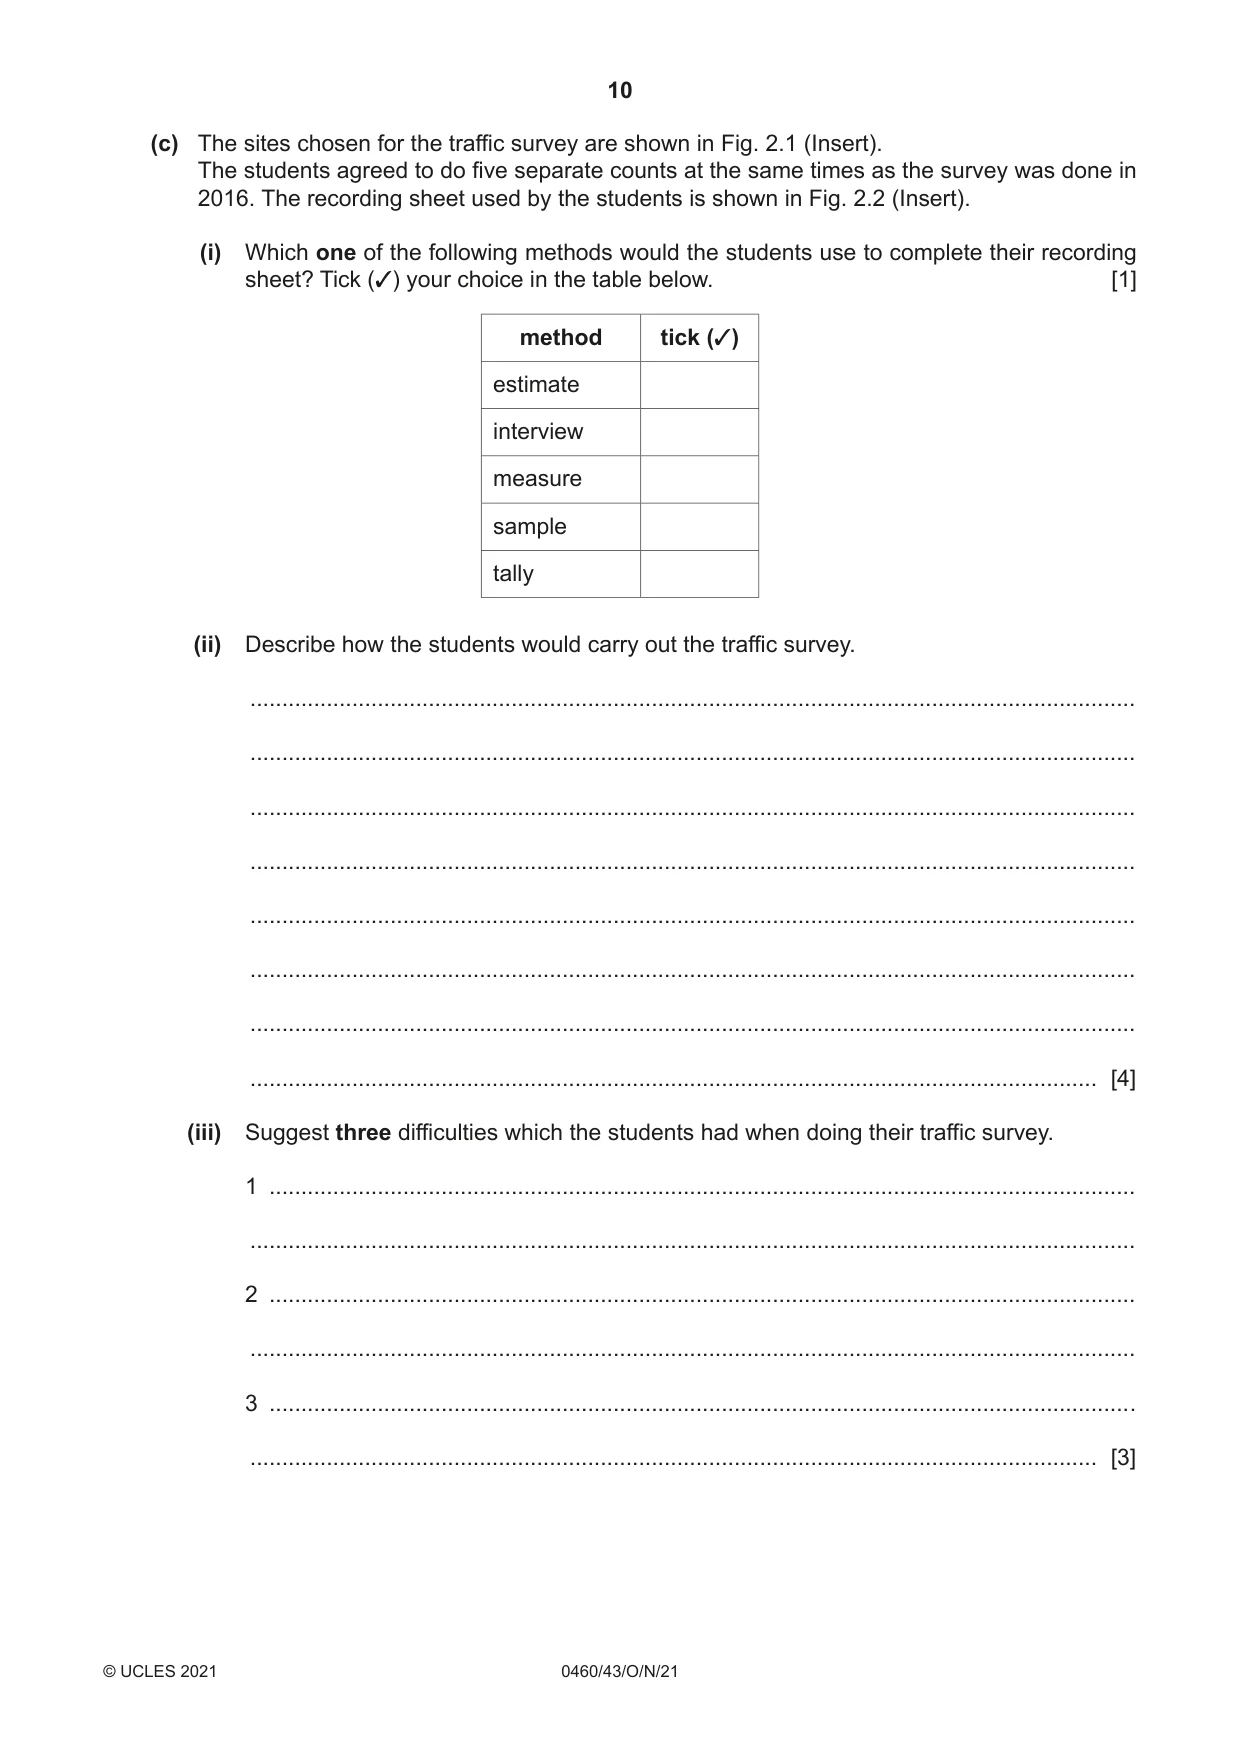
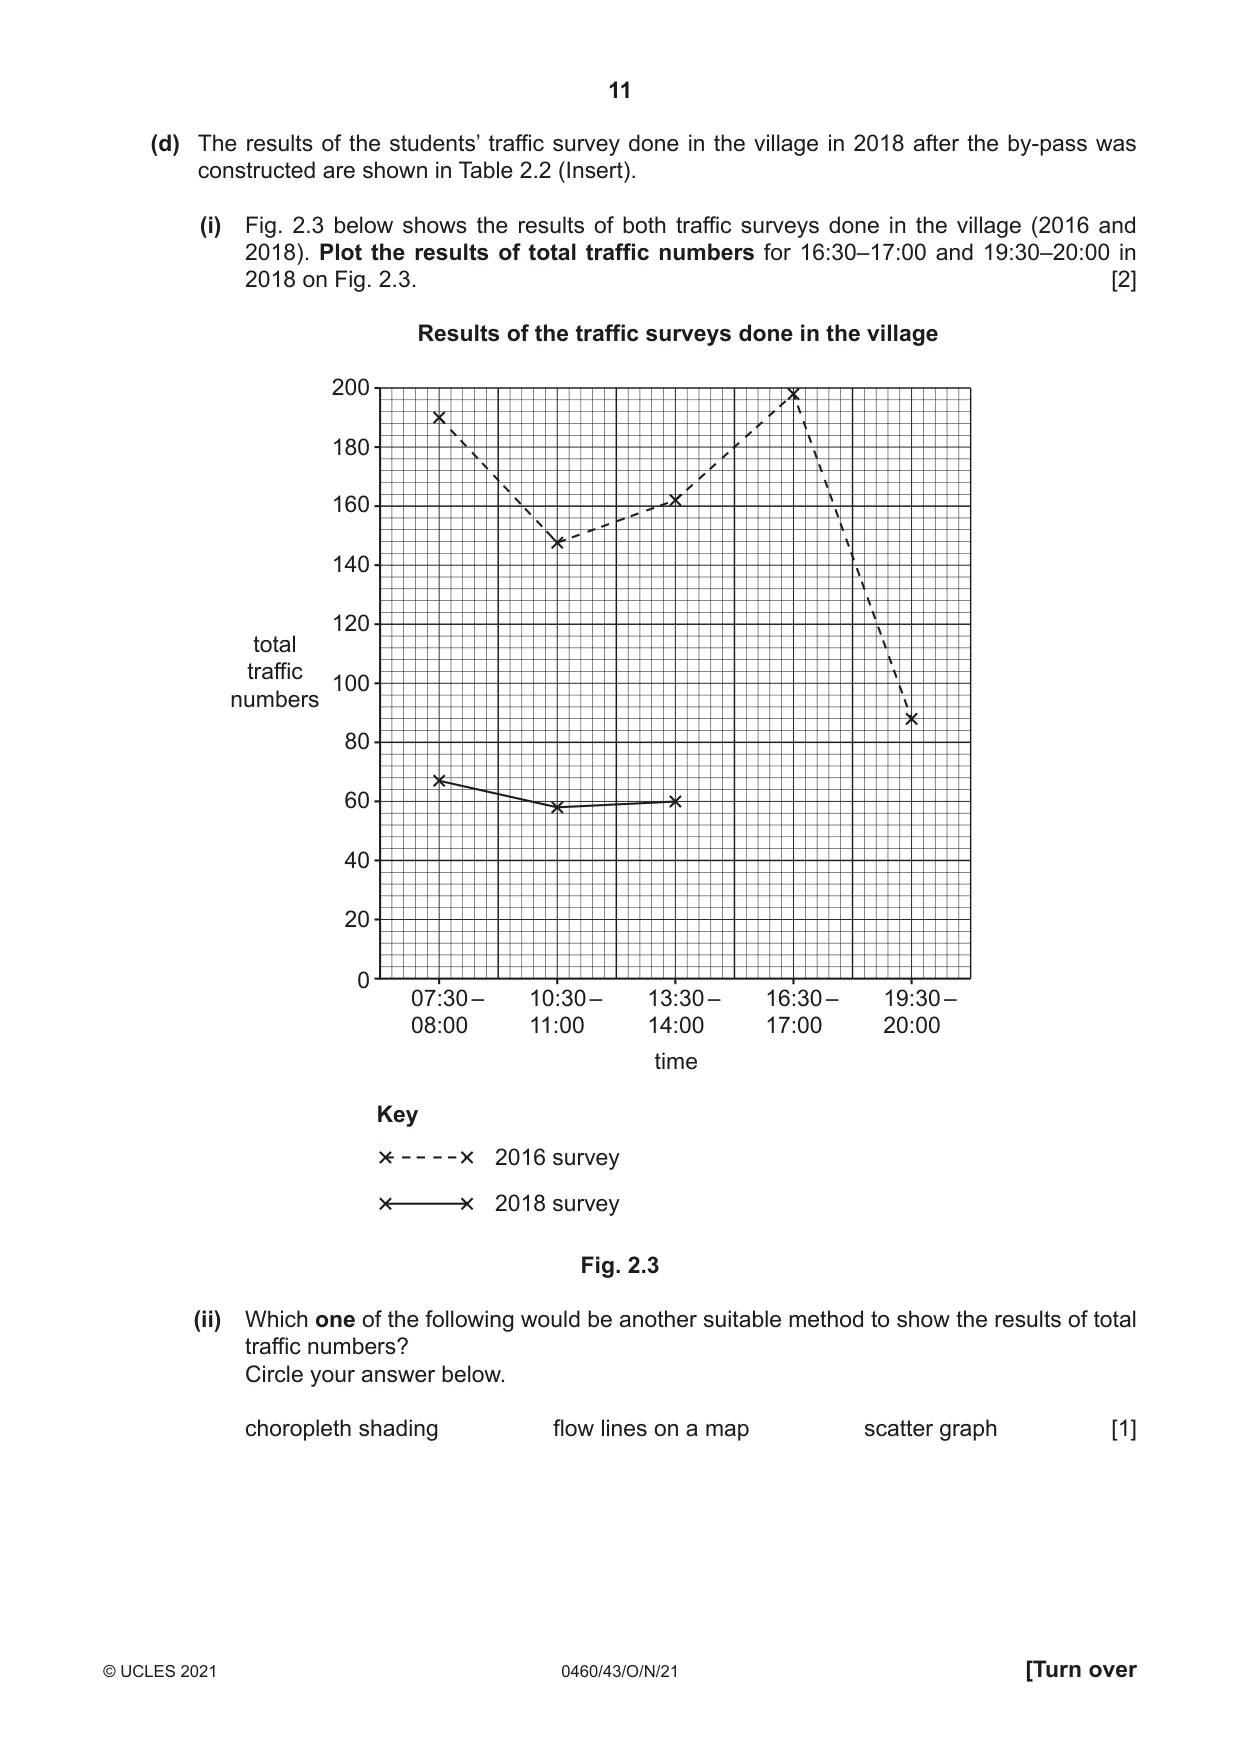
2 Students lived in a village where a by-pass road had recently been completed. This is a road which goes around the village to provide an alternative route for traffic going past it. They decided to investigate the following hypotheses by doing a traffic survey: Hypothesis 1: The total amount of traffic in the village has changed since the by-pass was constructed. Hypothesis 2: The amount of traffic on the by-pass is the same throughout the day. (a) The route of the by-pass is shown in Fig. 2.1 (Insert). Estimate the distance along the by-pass road between points A and B. Tick (3) your choice in the table below. [1] distance tick (3) 3.2 km 3.8 km 4.2 km 4.6 km (b) Before they began their fieldwork, the students looked at the results of a traffic survey done in the village in 2016, before the by-pass was constructed. These results are shown in Table 2.1 (Insert). Why are these results ‘secondary’ data? ................................................................................................................................................... ............................................................................................................................................. [1] (c) The sites chosen for the traffic survey are shown in Fig. 2.1 (Insert). The students agreed to do five separate counts at the same times as the survey was done in 2016. The recording sheet used by the students is shown in Fig. 2.2 (Insert). (i) Which one of the following methods would the students use to complete their recording sheet? Tick (3) your choice in the table below. [1] method tick (3) estimate interview measure sample tally (ii) Describe how the students would carry out the traffic survey. ........................................................................................................................................... ........................................................................................................................................... ........................................................................................................................................... ........................................................................................................................................... ........................................................................................................................................... ........................................................................................................................................... ........................................................................................................................................... ..................................................................................................................................... [4] (iii) Suggest three difficulties which the students had when doing their traffic survey. 1 ........................................................................................................................................ ........................................................................................................................................... 2 ........................................................................................................................................ ........................................................................................................................................... 3 ........................................................................................................................................ ..................................................................................................................................... [3] (d) The results of the students’ traffic survey done in the village in 2018 after the by-pass was constructed are shown in Table 2.2 (Insert). (i) Fig. 2.3 below shows the results of both traffic surveys done in the village (2016 and 2018). Plot the results of total traffic numbers for 16:30–17:00 and 19:30–20:00 in 2018 on Fig. 2.3. [2] Results of the traffic surveys done in the village 200 180 160 140 120 total traffic 100 numbers 80 60 40 20 0 07:30 – 10:30 – 13:30 – 16:30 – 19:30 – 08:00 11:00 14:00 17:00 20:00 time Key 2016 survey 2018 survey Fig. 2.3 (ii) Which one of the following would be another suitable method to show the results of total traffic numbers? Circle your answer below. choropleth shading flow lines on a map scatter graph [1]
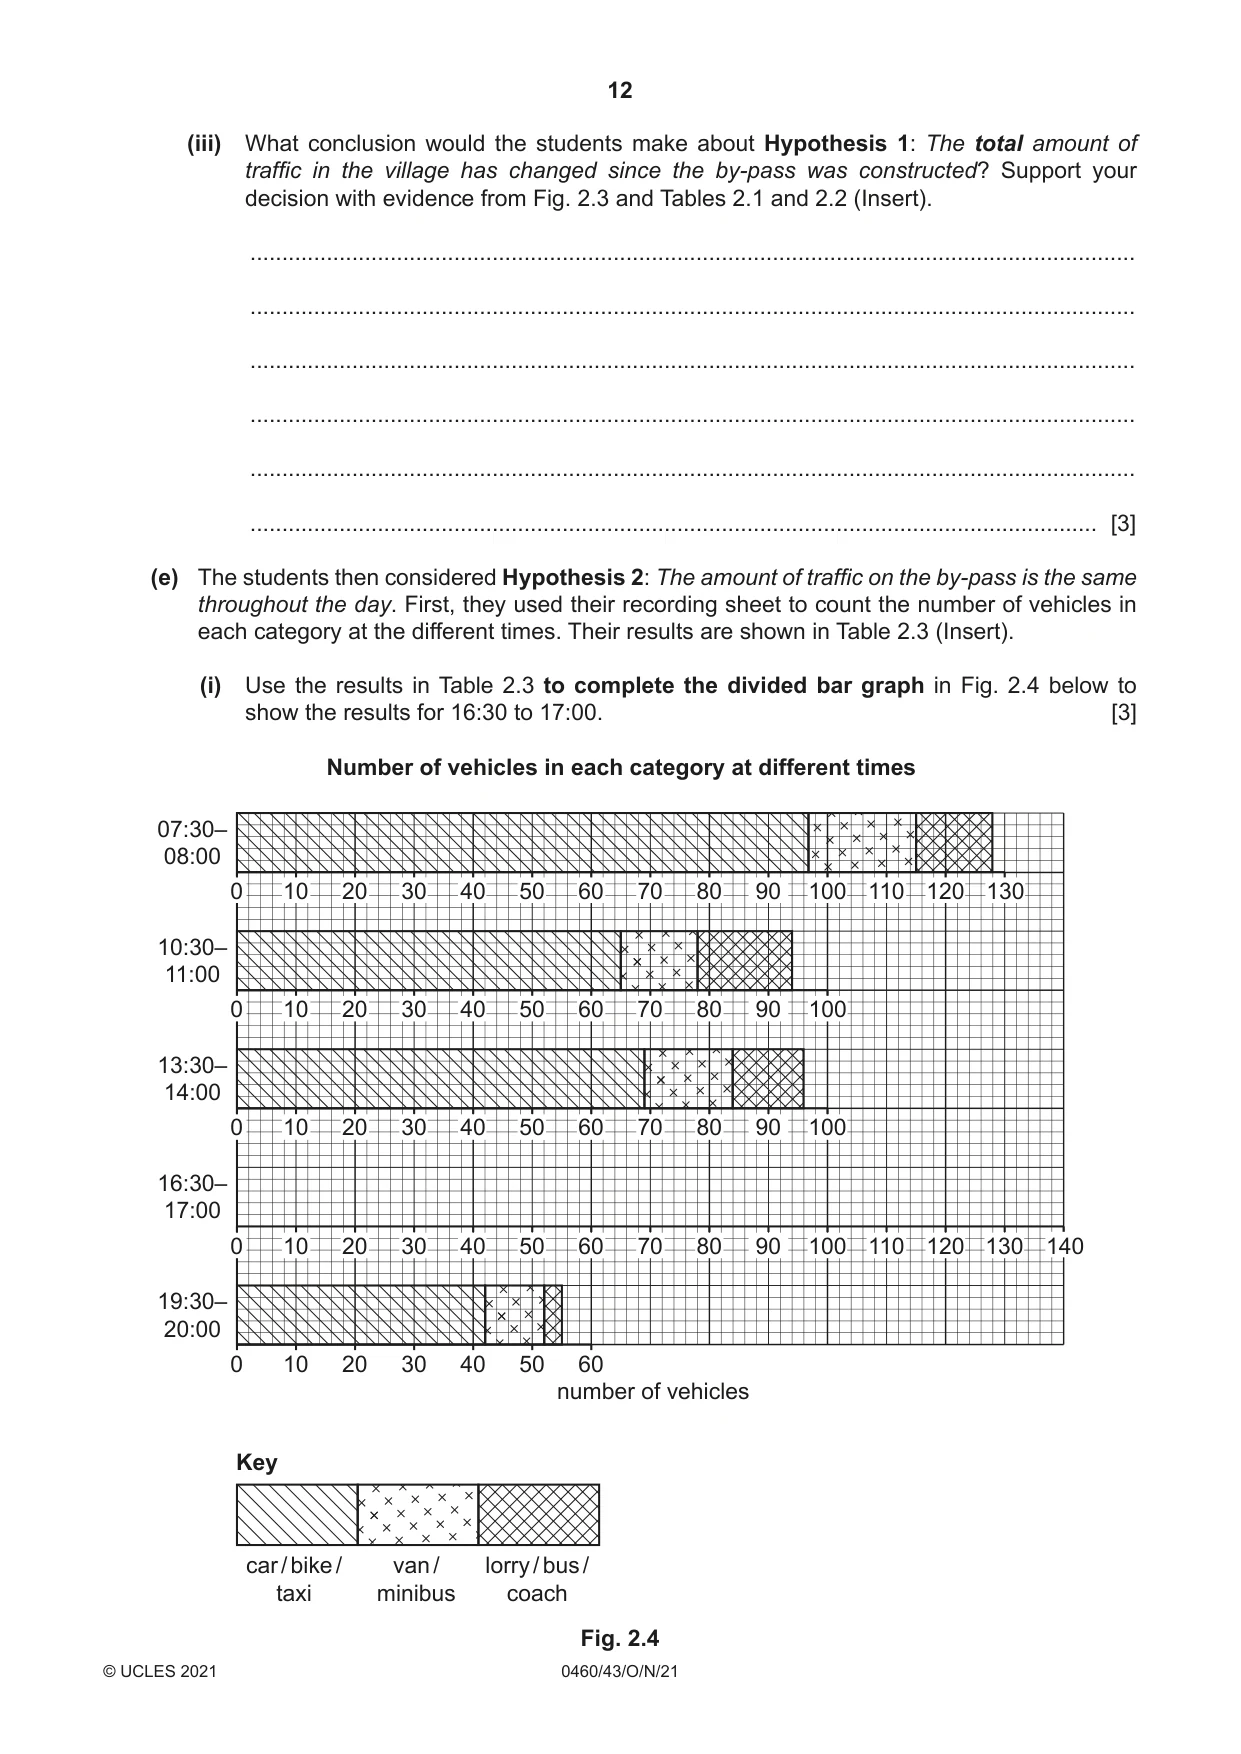
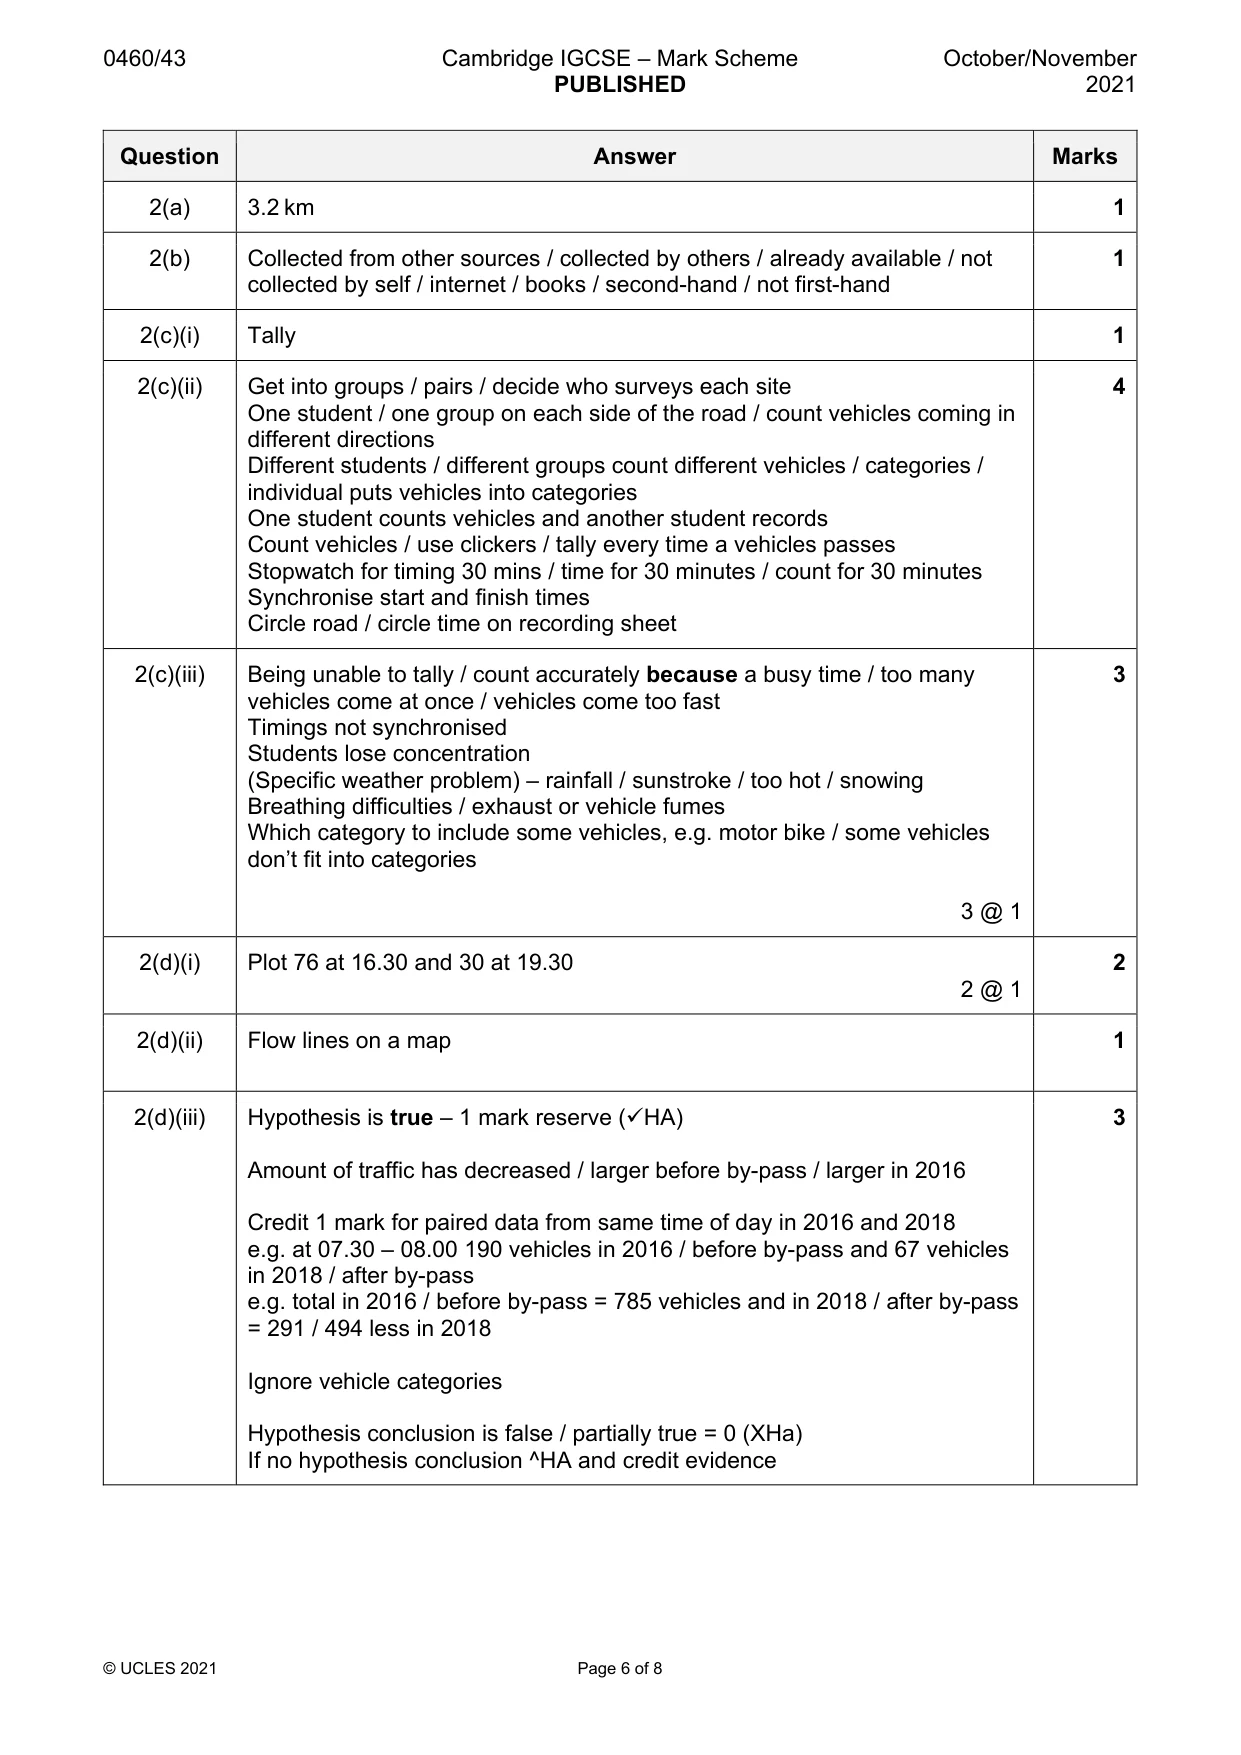
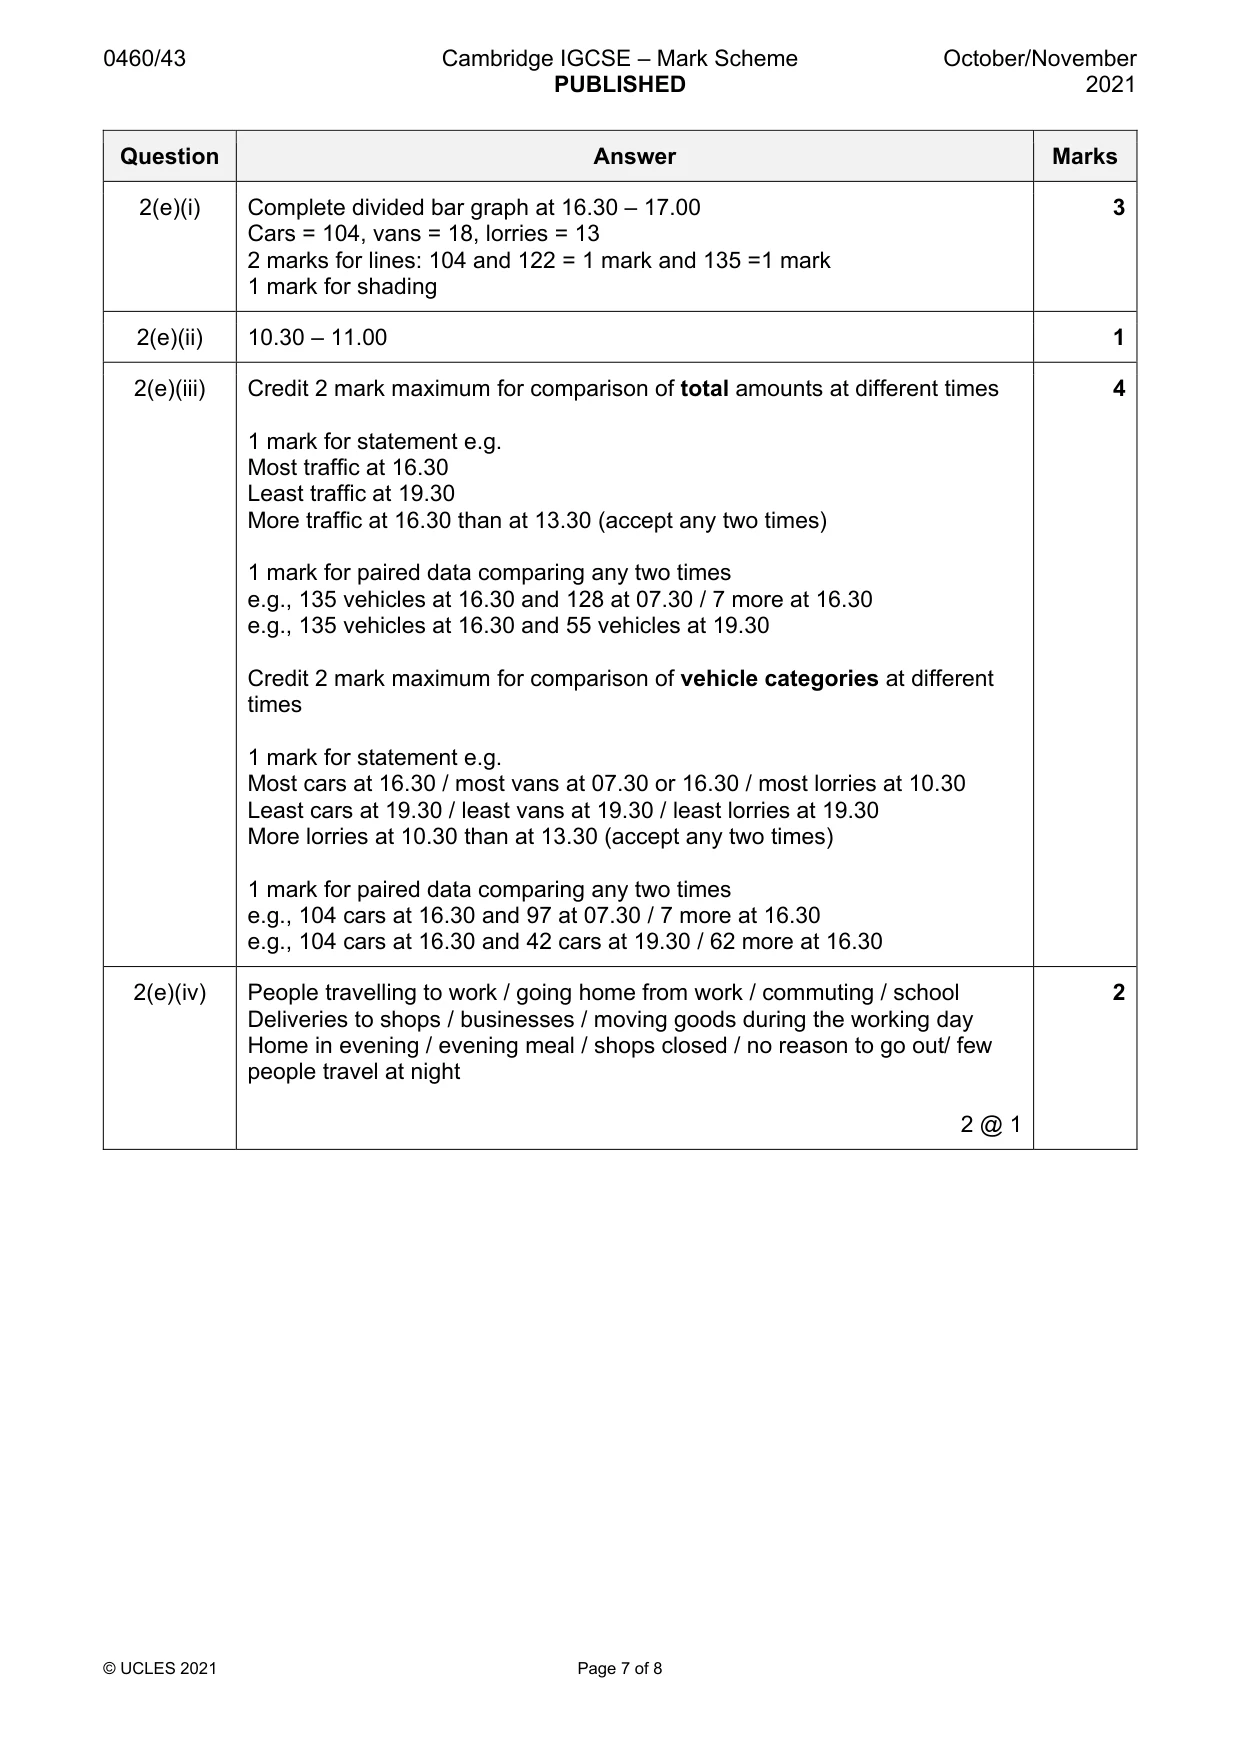
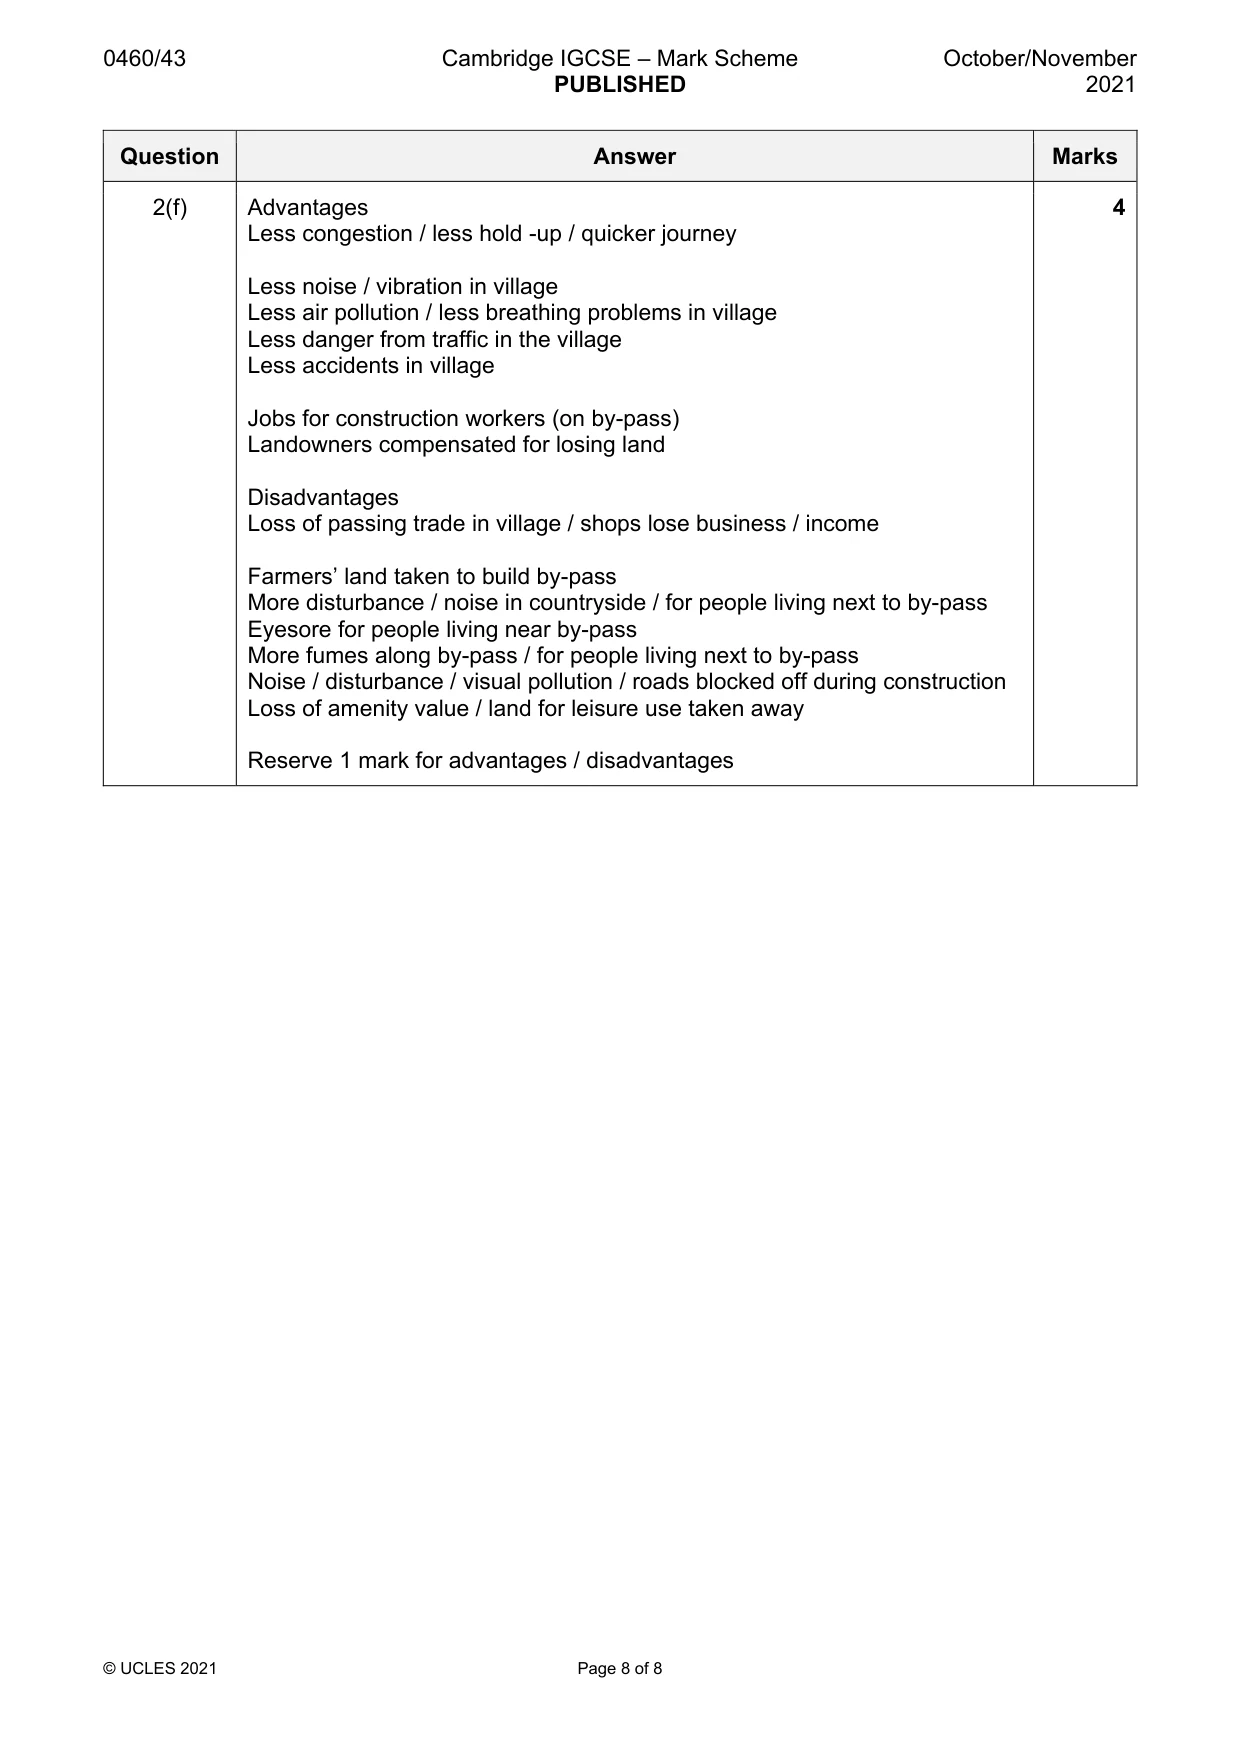
Mark scheme: 2(a) 3.2 km 1 2(b) Collected from other sources / collected by others / already available / not 1 collected by self / internet / books / second-hand / not first-hand 2(c)(i) Tally 1 2(c)(ii) Get into groups / pairs / decide who surveys each site 4 One student / one group on each side of the road / count vehicles coming in different directions Different students / different groups count different vehicles / categories / individual puts vehicles into categories One student counts vehicles and another student records Count vehicles / use clickers / tally every time a vehicles passes Stopwatch for timing 30 mins / time for 30 minutes / count for 30 minutes Synchronise start and finish times Circle road / circle time on recording sheet 2(c)(iii) Being unable to tally / count accurately because a busy time / too many 3 vehicles come at once / vehicles come too fast Timings not synchronised Students lose concentration (Specific weather problem) – rainfall / sunstroke / too hot / snowing Breathing difficulties / exhaust or vehicle fumes Which category to include some vehicles, e.g. motor bike / some vehicles don’t fit into categories 3 @ 1 2(d)(i) Plot 76 at 16.30 and 30 at 19.30 2 2 @ 1 2(d)(ii) Flow lines on a map 1 2(d)(iii) Hypothesis is true – 1 mark reserve (HA) 3 Amount of traffic has decreased / larger before by-pass / larger in 2016 Credit 1 mark for paired data from same time of day in 2016 and 2018 e.g. at 07.30 – 08.00 190 vehicles in 2016 / before by-pass and 67 vehicles in 2018 / after by-pass e.g. total in 2016 / before by-pass = 785 vehicles and in 2018 / after by-pass = 291 / 494 less in 2018 Ignore vehicle categories Hypothesis conclusion is false / partially true = 0 (XHa) If no hypothesis conclusion ^HA and credit evidence 2(e)(i) Complete divided bar graph at 16.30 – 17.00 3 Cars = 104, vans = 18, lorries = 13 2 marks for lines: 104 and 122 = 1 mark and 135 =1 mark 1 mark for shading 2(e)(ii) 10.30 – 11.00 1 2(e)(iii) Credit 2 mark maximum for comparison of total amounts at different times 4 1 mark for statement e.g. Most traffic at 16.30 Least traffic at 19.30 More traffic at 16.30 than at 13.30 (accept any two times) 1 mark for paired data comparing any two times e.g., 135 vehicles at 16.30 and 128 at 07.30 / 7 more at 16.30 e.g., 135 vehicles at 16.30 and 55 vehicles at 19.30 Credit 2 mark maximum for comparison of vehicle categories at different times 1 mark for statement e.g. Most cars at 16.30 / most vans at 07.30 or 16.30 / most lorries at 10.30 Least cars at 19.30 / least vans at 19.30 / least lorries at 19.30 More lorries at 10.30 than at 13.30 (accept any two times) 1 mark for paired data comparing any two times e.g., 104 cars at 16.30 and 97 at 07.30 / 7 more at 16.30 e.g., 104 cars at 16.30 and 42 cars at 19.30 / 62 more at 16.30 2(e)(iv) People travelling to work / going home from work / commuting / school 2 Deliveries to shops / businesses / moving goods during the working day Home in evening / evening meal / shops closed / no reason to go out/ few people travel at night 2 @ 1 2(f) Advantages 4 Less congestion / less hold -up / quicker journey Less noise / vibration in village Less air pollution / less breathing problems in village Less danger from traffic in the village Less accidents in village Jobs for construction workers (on by-pass) Landowners compensated for losing land Disadvantages Loss of passing trade in village / shops lose business / income Farmers’ land taken to build by-pass More disturbance / noise in countryside / for people living next to by-pass Eyesore for people living near by-pass More fumes along by-pass / for people living next to by-pass Noise / disturbance / visual pollution / roads blocked off during construction Loss of amenity value / land for leisure use taken away Reserve 1 mark for advantages / disadvantages
More questions on Settlements (rural and urban) and service provision
What was in this paper
The subtopics covered by these 2 questions, and how many questions each got. Open one in a new tab to see every Cambridge question on it.
What you needed in this session
Cambridge’s own grade thresholds for 2021 Oct/Nov, Paper 4 · Variant 3. A higher threshold means an easier paper — the bar moves with how the cohort did.