Cambridge IGCSE Geography 0460 — 2021 Oct/Nov Paper 4 · Variant 1
0460/41/O/N/21 · 2 questions · 60 marks · ≈68 min
The question paper and its mark scheme, free to read here and free to download. This is Cambridge’s own paper, exactly as it was sat.
Question paper20 pages





Mark scheme11 pages
Answers below. Sit the paper first if you are practising.


Questions as text
Q1 · Students from a school in Kenya wanted to find out more about two squatter settlements in…
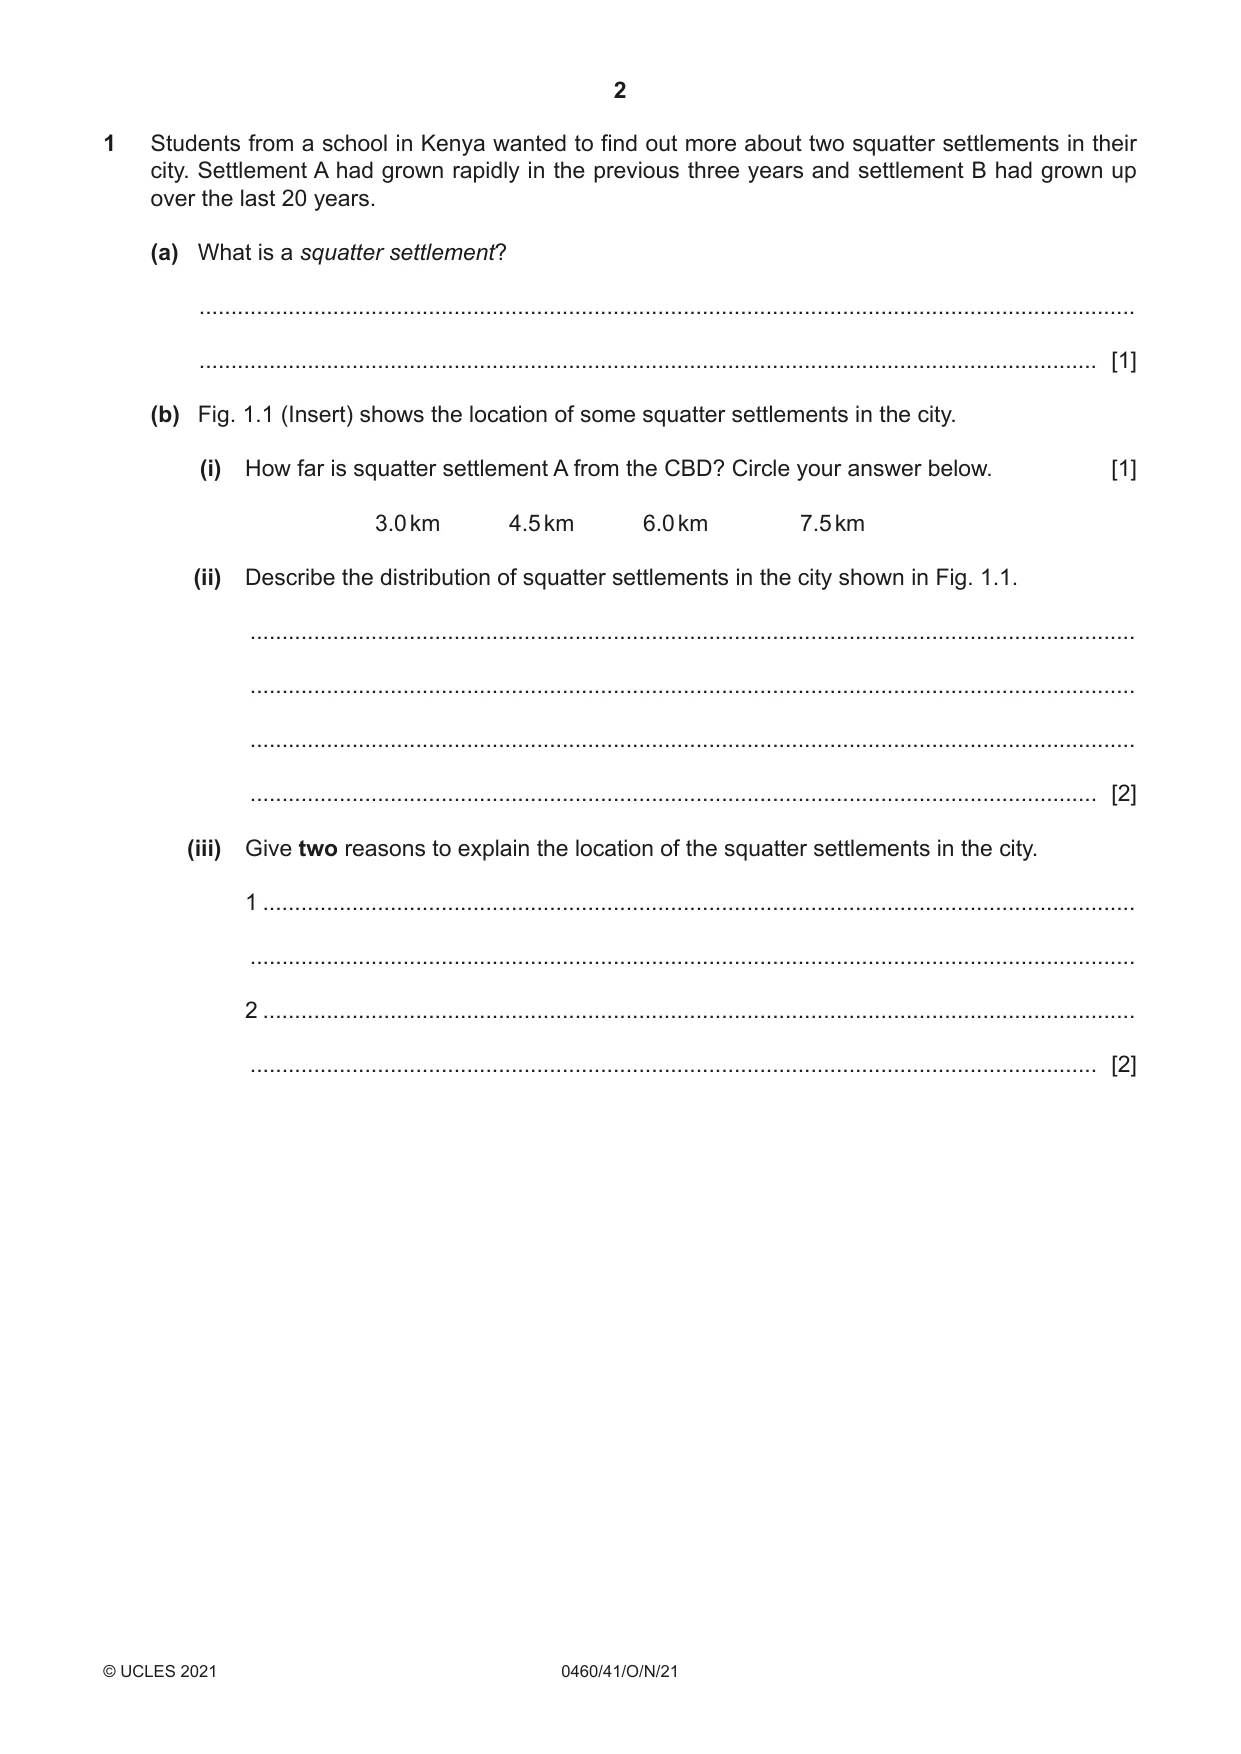
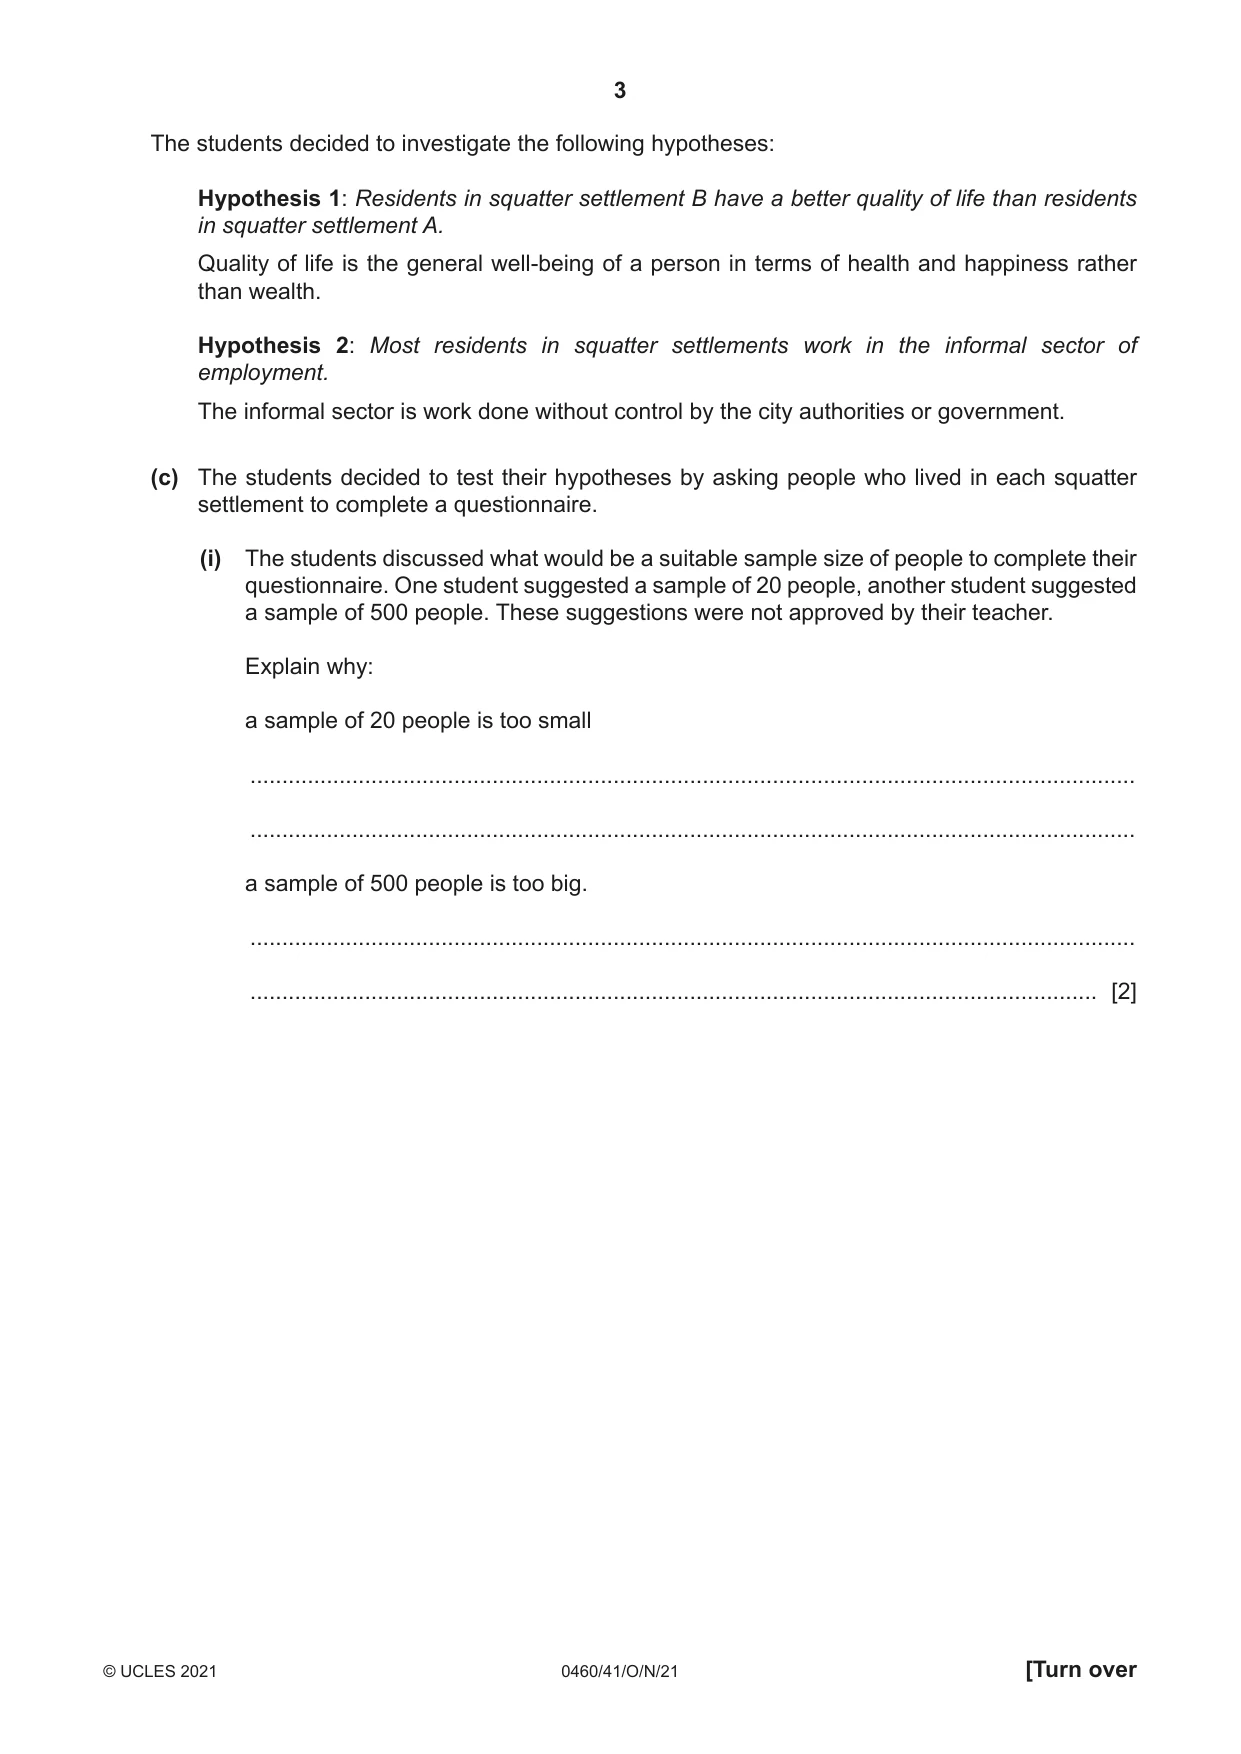
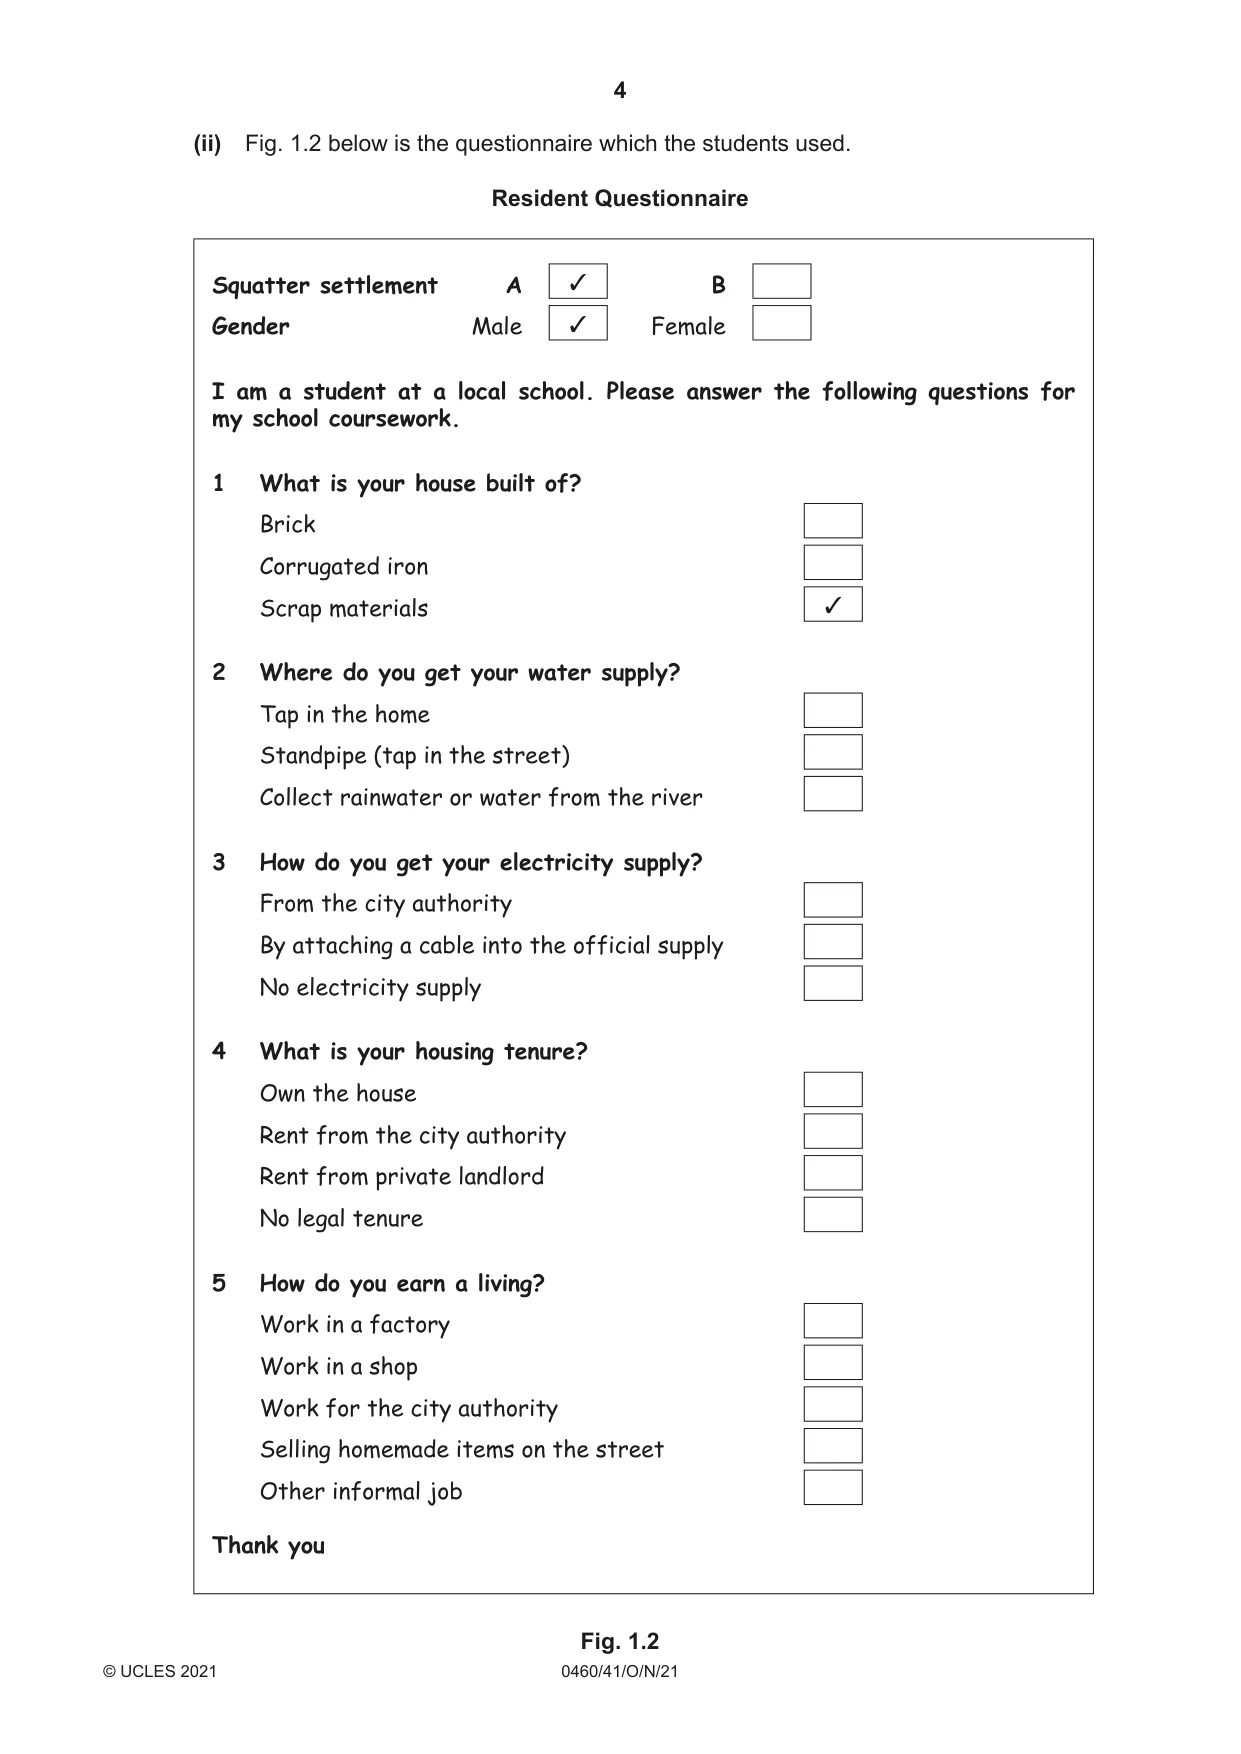
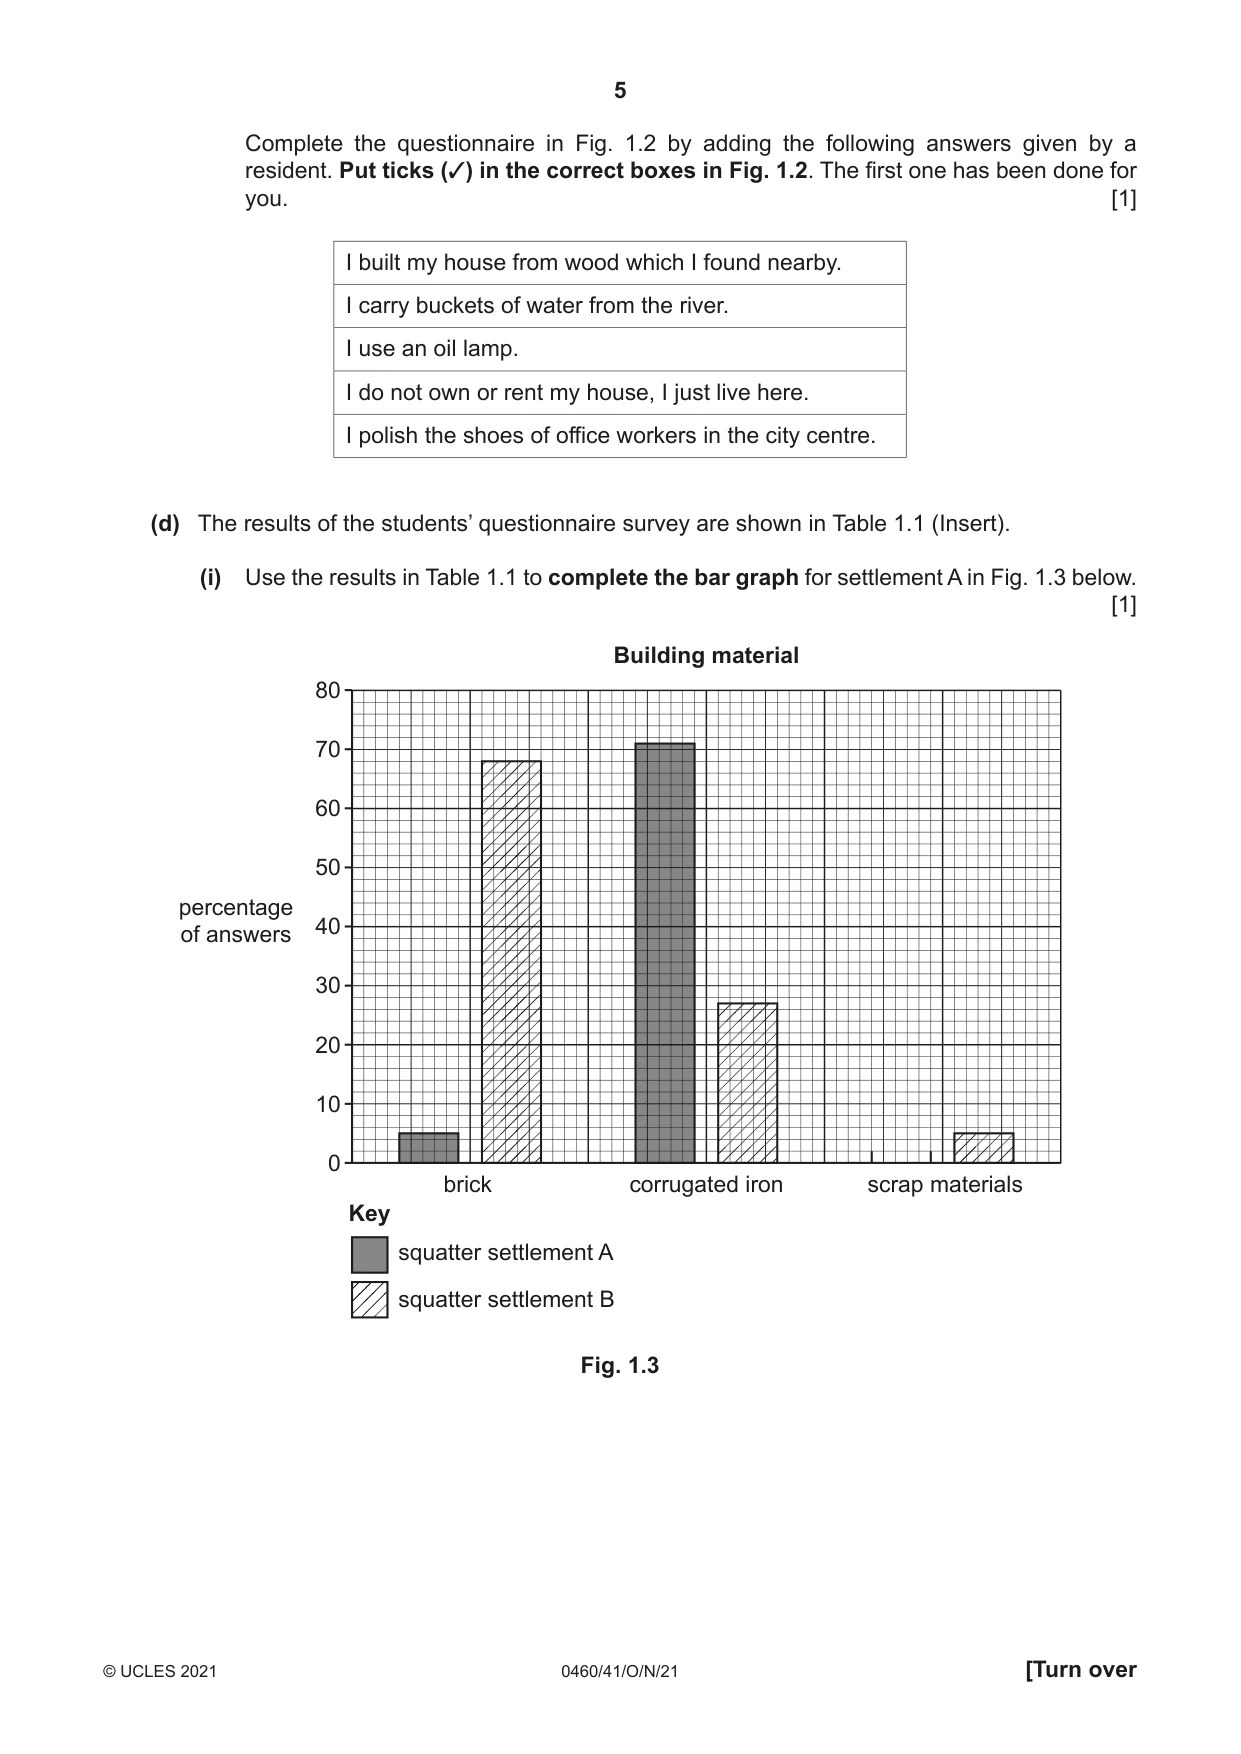
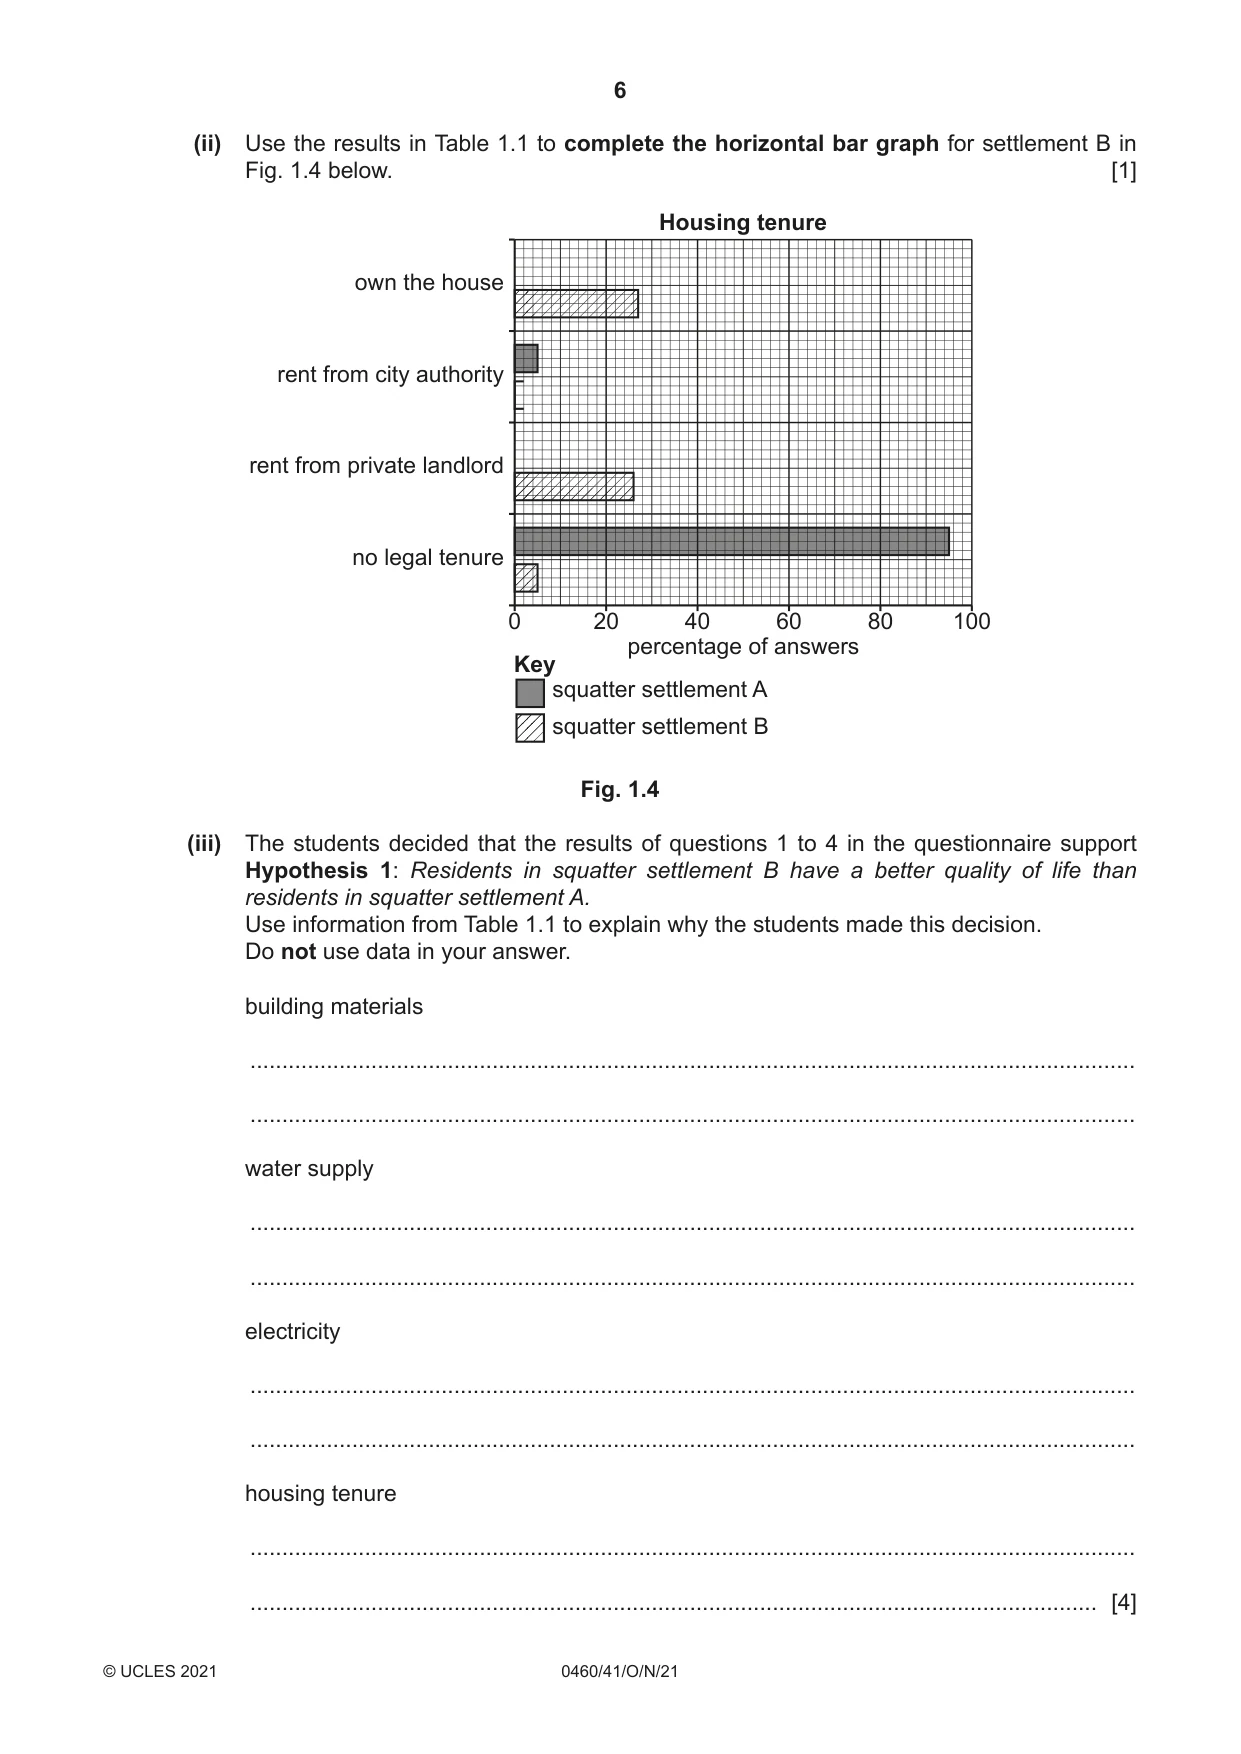
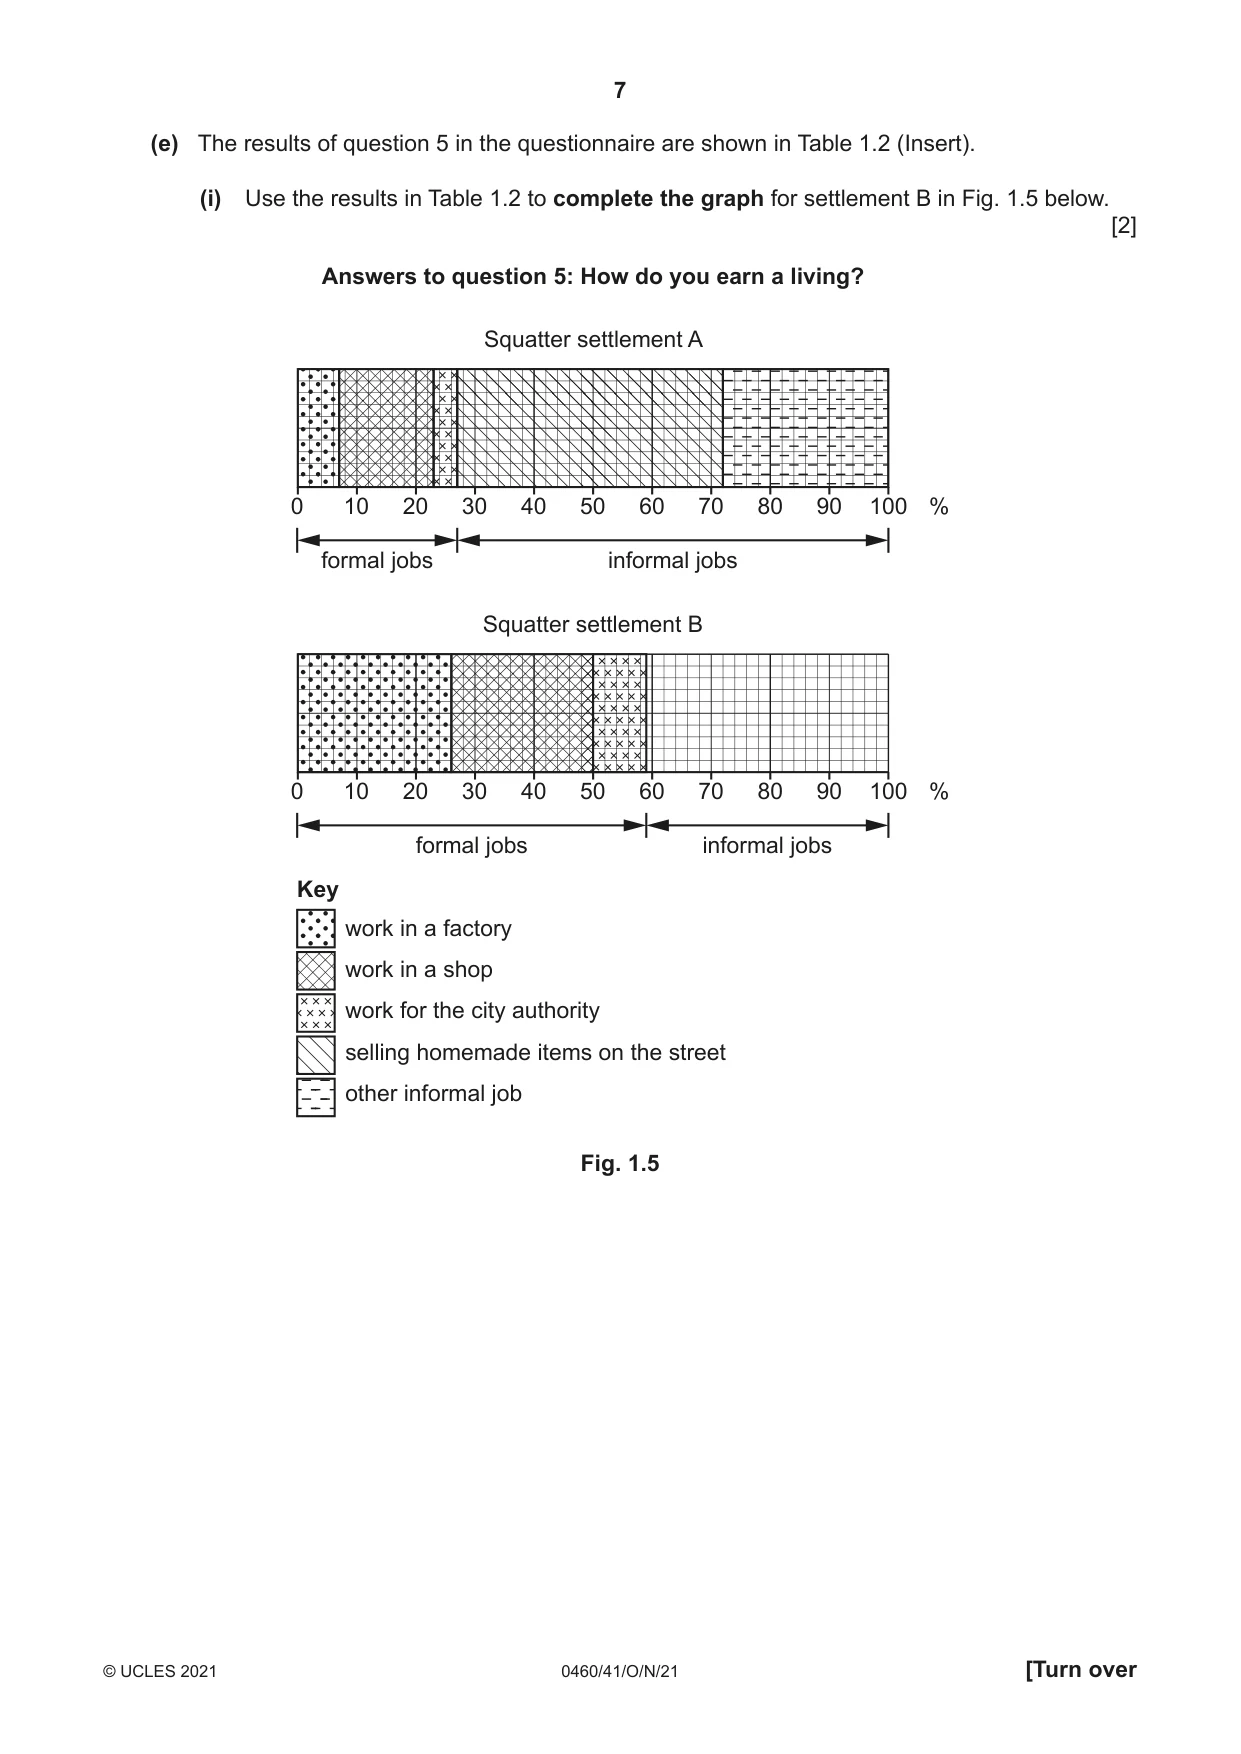
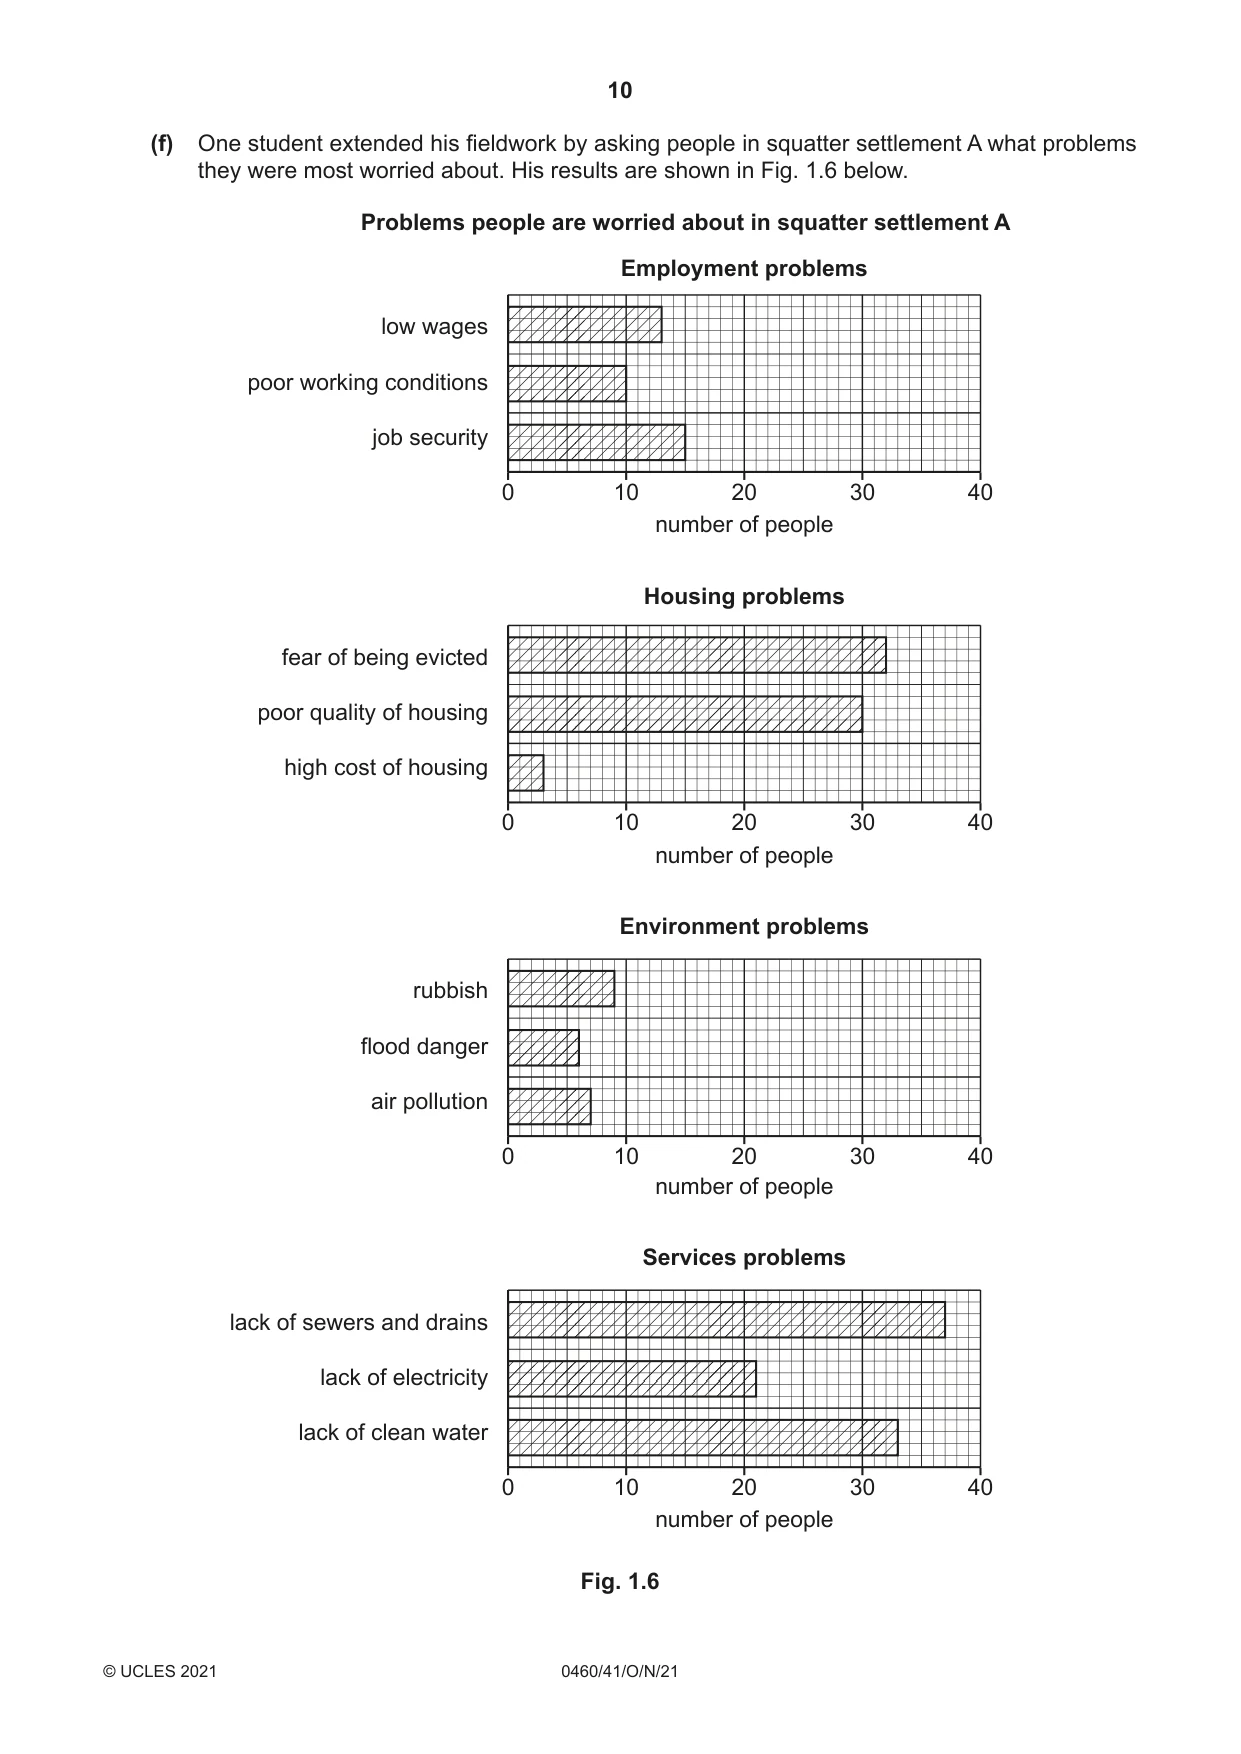
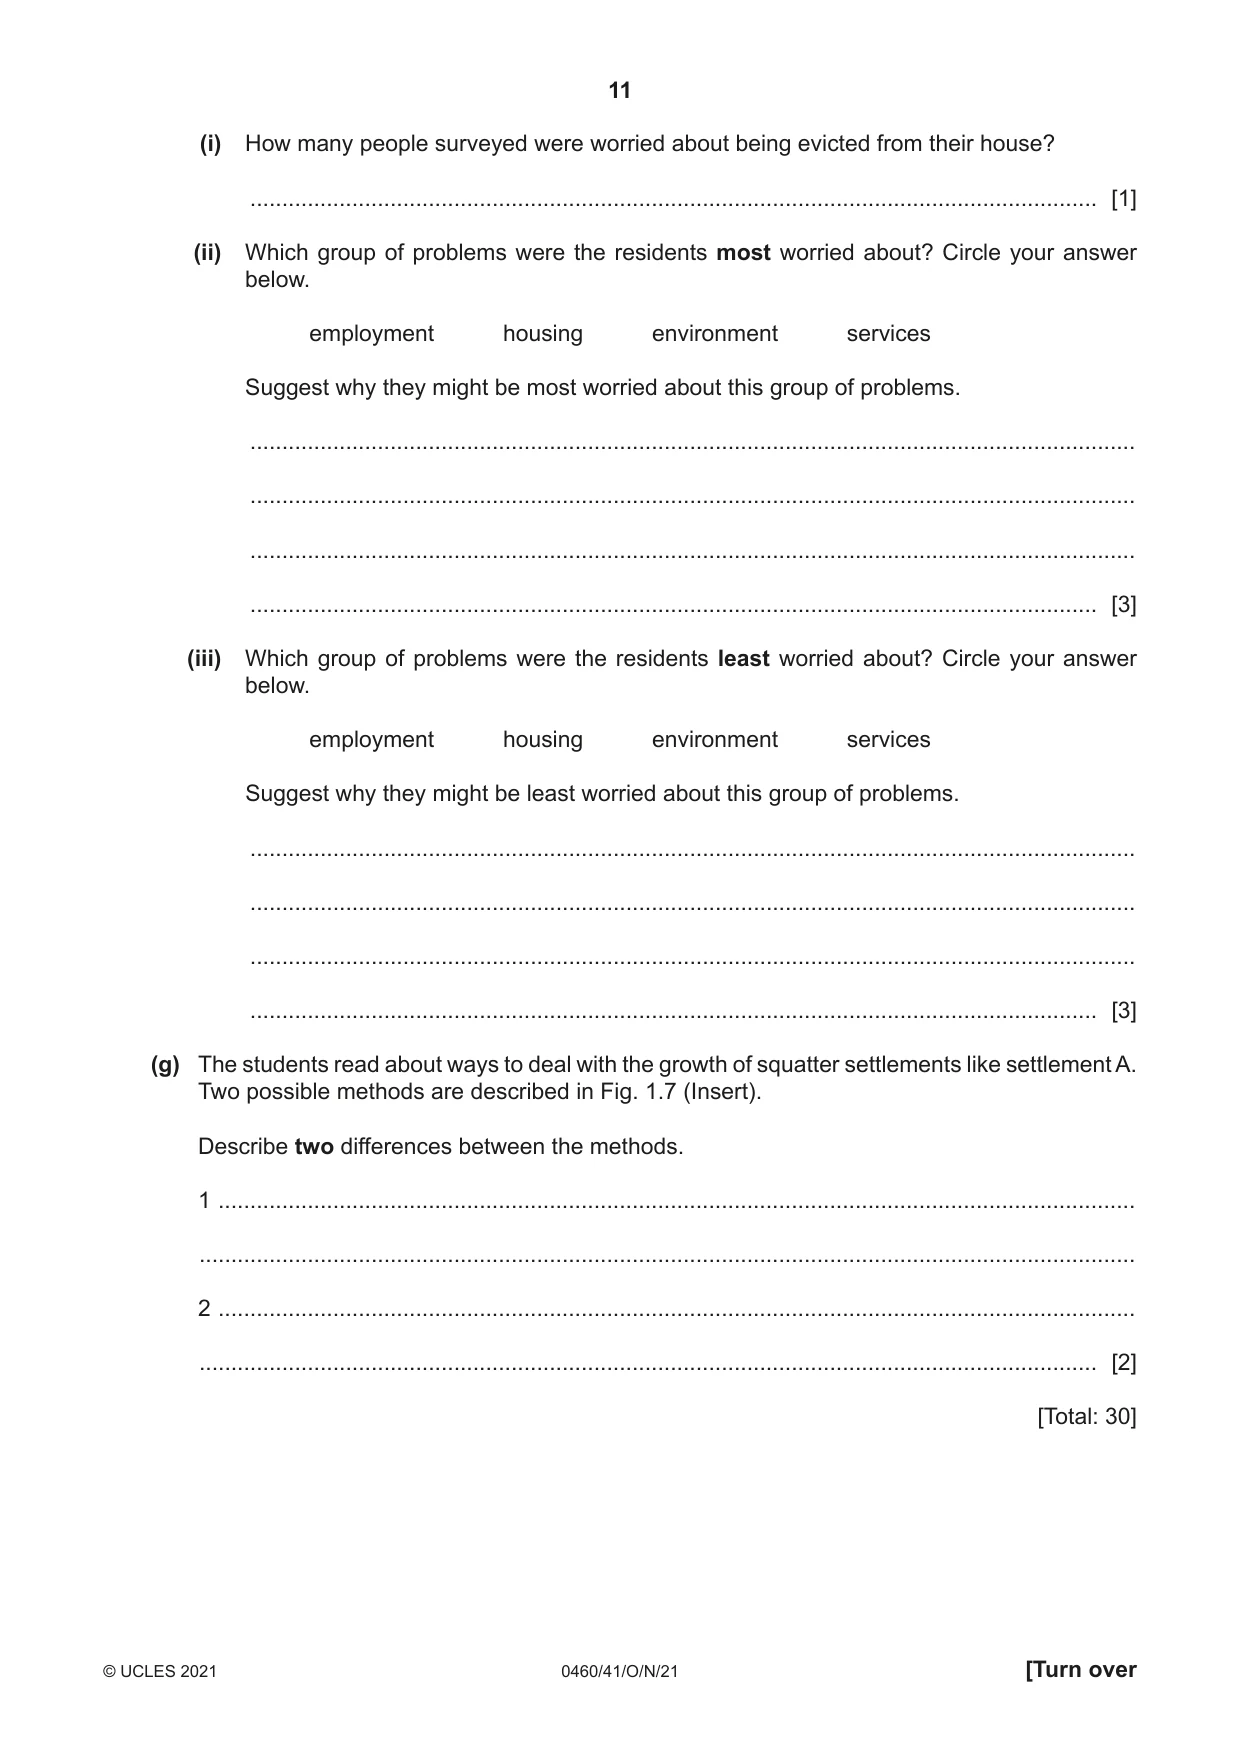
1 Students from a school in Kenya wanted to find out more about two squatter settlements in their city. Settlement A had grown rapidly in the previous three years and settlement B had grown up over the last 20 years. (a) What is a squatter settlement? ................................................................................................................................................... ............................................................................................................................................. [1] (b) Fig. 1.1 (Insert) shows the location of some squatter settlements in the city. (i) How far is squatter settlement A from the CBD? Circle your answer below. [1] 3.0 km 4.5 km 6.0 km 7.5 km (ii) Describe the distribution of squatter settlements in the city shown in Fig. 1.1. ........................................................................................................................................... ........................................................................................................................................... ........................................................................................................................................... ..................................................................................................................................... [2] (iii) Give two reasons to explain the location of the squatter settlements in the city. 1 ......................................................................................................................................... ........................................................................................................................................... 2 ......................................................................................................................................... ..................................................................................................................................... [2] The students decided to investigate the following hypotheses: Hypothesis 1: Residents in squatter settlement B have a better quality of life than residents in squatter settlement A. Quality of life is the general well-being of a person in terms of health and happiness rather than wealth. Hypothesis 2: Most residents in squatter settlements work in the informal sector of employment. The informal sector is work done without control by the city authorities or government. (c) The students decided to test their hypotheses by asking people who lived in each squatter settlement to complete a questionnaire. (i) The students discussed what would be a suitable sample size of people to complete their questionnaire. One student suggested a sample of 20 people, another student suggested a sample of 500 people. These suggestions were not approved by their teacher. Explain why: a sample of 20 people is too small ........................................................................................................................................... ........................................................................................................................................... a sample of 500 people is too big. ........................................................................................................................................... ..................................................................................................................................... [2] (ii) Fig. 1.2 below is the questionnaire which the students used. Resident Questionnaire Squatter settlement A 3 B Gender Male 3 Female I am a student at a local school. Please answer the following questions for my school coursework. 1 What is your house built of? Brick Corrugated iron Scrap materials 3 2 Where do you get your water supply? Tap in the home Standpipe (tap in the street) Collect rainwater or water from the river 3 How do you get your electricity supply? From the city authority By attaching a cable into the official supply No electricity supply 4 What is your housing tenure? Own the house Rent from the city authority Rent from private landlord No legal tenure 5 How do you earn a living? Work in a factory Work in a shop Work for the city authority Selling homemade items on the street Other informal job Thank you Fig. 1.2 Complete the questionnaire in Fig. 1.2 by adding the following answers given by a resident. Put ticks (3) in the correct boxes in Fig. 1.2. The first one has been done for you. [1] I built my house from wood which I found nearby. I carry buckets of water from the river. I use an oil lamp. I do not own or rent my house, I just live here. I polish the shoes of office workers in the city centre. (d) The results of the students’ questionnaire survey are shown in Table 1.1 (Insert). (i) Use the results in Table 1.1 to complete the bar graph for settlement A in Fig. 1.3 below. [1] Building material 80 70 60 50 percentage 40 of answers 30 20 10 0 brick corrugated iron scrap materials Key squatter settlement A squatter settlement B Fig. 1.3 (ii) Use the results in Table 1.1 to complete the horizontal bar graph for settlement B in Fig. 1.4 below. [1] Housing tenure own the house rent from city authority rent from private landlord no legal tenure 0 20 40 60 80 100 percentage of answers Key squatter settlement A squatter settlement B Fig. 1.4 (iii) The students decided that the results of questions 1 to 4 in the questionnaire support Hypothesis 1: Residents in squatter settlement B have a better quality of life than residents in squatter settlement A. Use information from Table 1.1 to explain why the students made this decision. Do not use data in your answer. building materials ........................................................................................................................................... ........................................................................................................................................... water supply ........................................................................................................................................... ........................................................................................................................................... electricity ........................................................................................................................................... ........................................................................................................................................... housing tenure ........................................................................................................................................... ..................................................................................................................................... [4] (e) The results of question 5 in the questionnaire are shown in Table 1.2 (Insert). (i) Use the results in Table 1.2 to complete the graph for settlement B in Fig. 1.5 below. [2] Answers to question 5: How do you earn a living? Squatter settlement A 0 10 20 30 40 50 60 70 80 90 100 % formal jobs informal jobs Squatter settlement B 0 10 20 30 40 50 60 70 80 90 100 % formal jobs informal jobs Key work in a factory work in a shop work for the city authority selling homemade items on the street other informal job Fig. 1.5 (ii) What conclusions can you make about Hypothesis 2: Most residents in squatter settlements work in the informal sector of employment ? Refer to both squatter settlements A and B in your conclusion. Support your decisions with evidence from Fig. 1.5 and Table 1.2. Settlement A Conclusion ........................................................................................................................ ........................................................................................................................................... ........................................................................................................................................... ........................................................................................................................................... ........................................................................................................................................... Settlement B Conclusion ........................................................................................................................ ........................................................................................................................................... ........................................................................................................................................... ........................................................................................................................................... ..................................................................................................................................... [4] TURN PAGE FOR QUESTION 1 (f) (f) One student extended his fieldwork by asking people in squatter settlement A what problems they were most worried about. His results are shown in Fig. 1.6 below. Problems people are worried about in squatter settlement A Employment problems low wages poor working conditions job security 0 10 20 30 40 number of people Housing problems fear of being evicted poor quality of housing high cost of housing 0 10 20 30 40 number of people Environment problems rubbish flood danger air pollution 0 10 20 30 40 number of people Services problems lack of sewers and drains lack of electricity lack of clean water 0 10 20 30 40 number of people Fig. 1.6 (i) How many people surveyed were worried about being evicted from their house? ..................................................................................................................................... [1] (ii) Which group of problems were the residents most worried about? Circle your answer below. employment housing environment services Suggest why they might be most worried about this group of problems. ........................................................................................................................................... ........................................................................................................................................... ........................................................................................................................................... ..................................................................................................................................... [3] (iii) Which group of problems were the residents least worried about? Circle your answer below. employment housing environment services Suggest why they might be least worried about this group of problems. ........................................................................................................................................... ........................................................................................................................................... ........................................................................................................................................... ..................................................................................................................................... [3] (g) The students read about ways to deal with the growth of squatter settlements like settlement A. Two possible methods are described in Fig. 1.7 (Insert). Describe two differences between the methods. 1 ................................................................................................................................................ ................................................................................................................................................... 2 ................................................................................................................................................ ............................................................................................................................................. [2] [Total: 30]
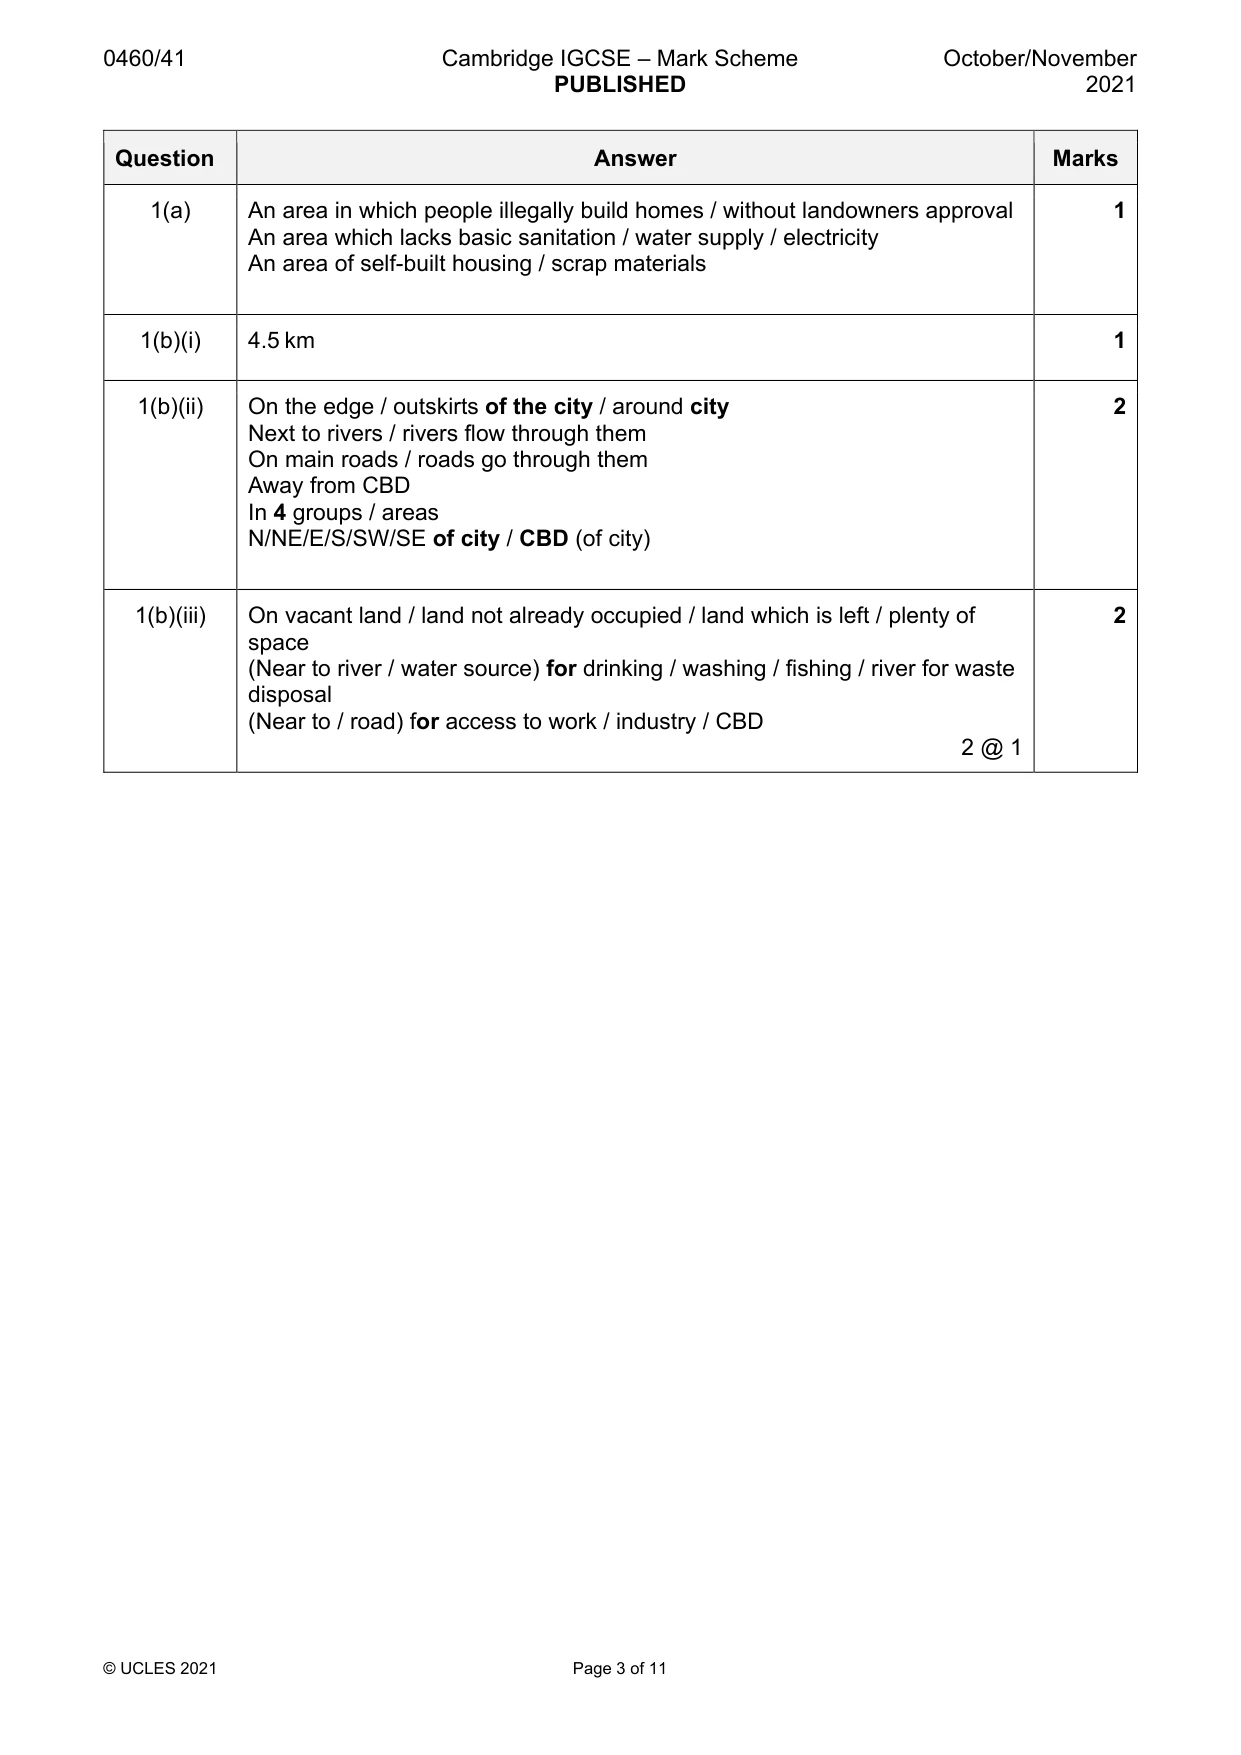
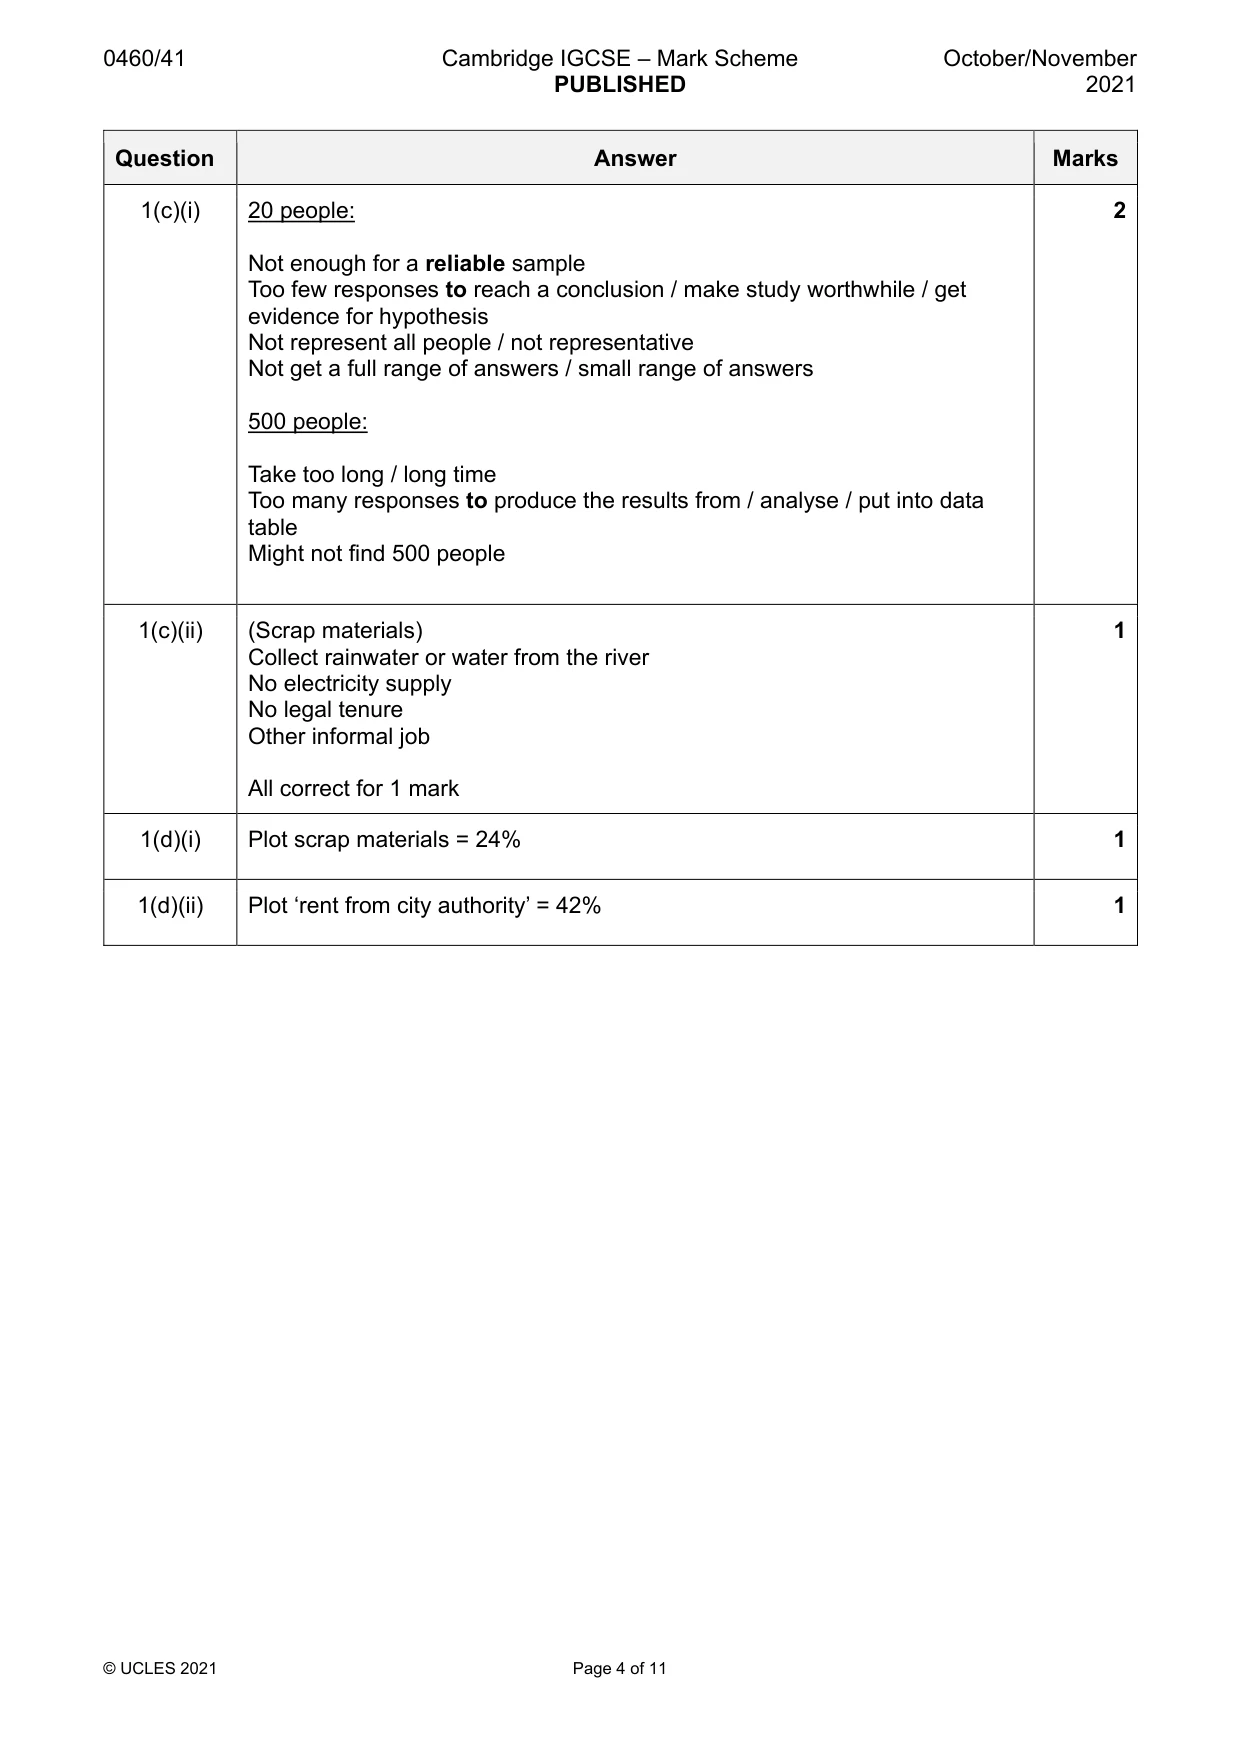
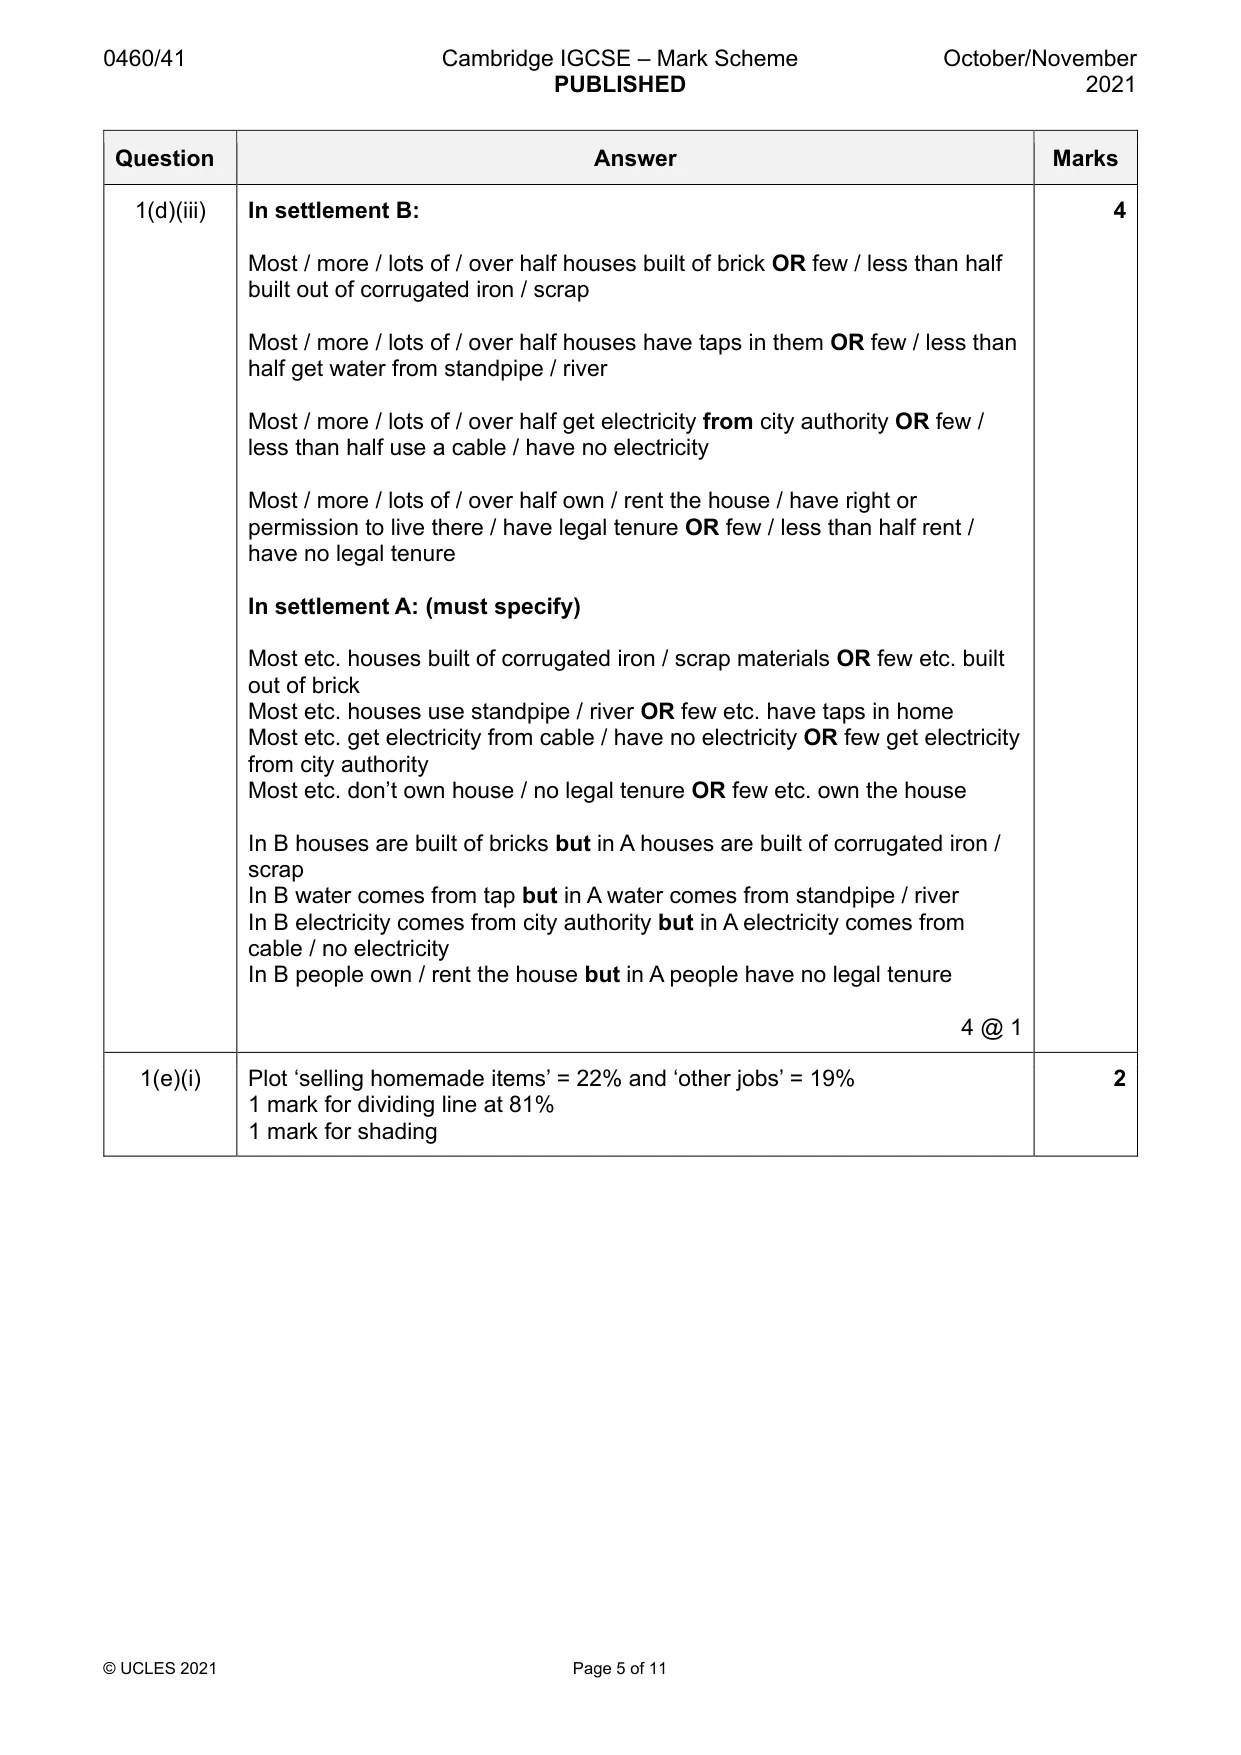
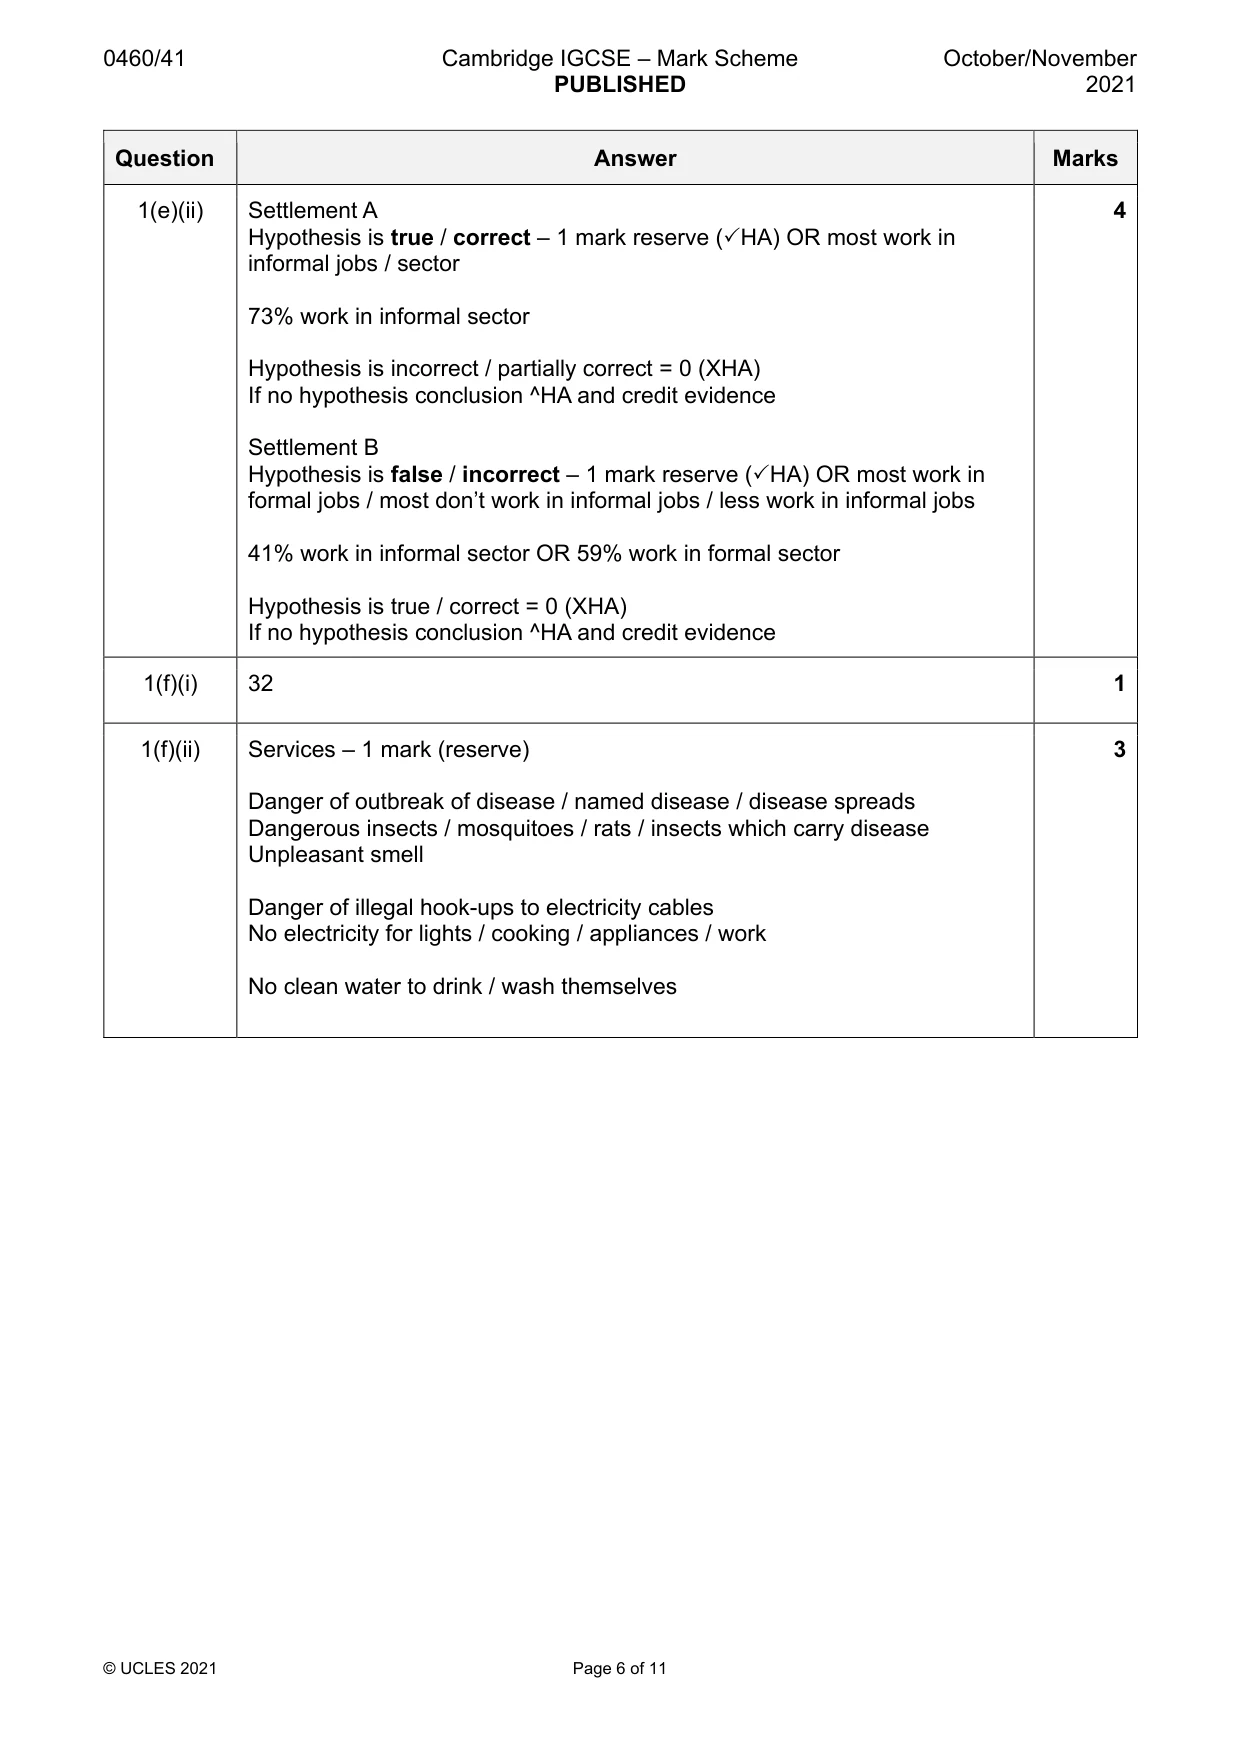
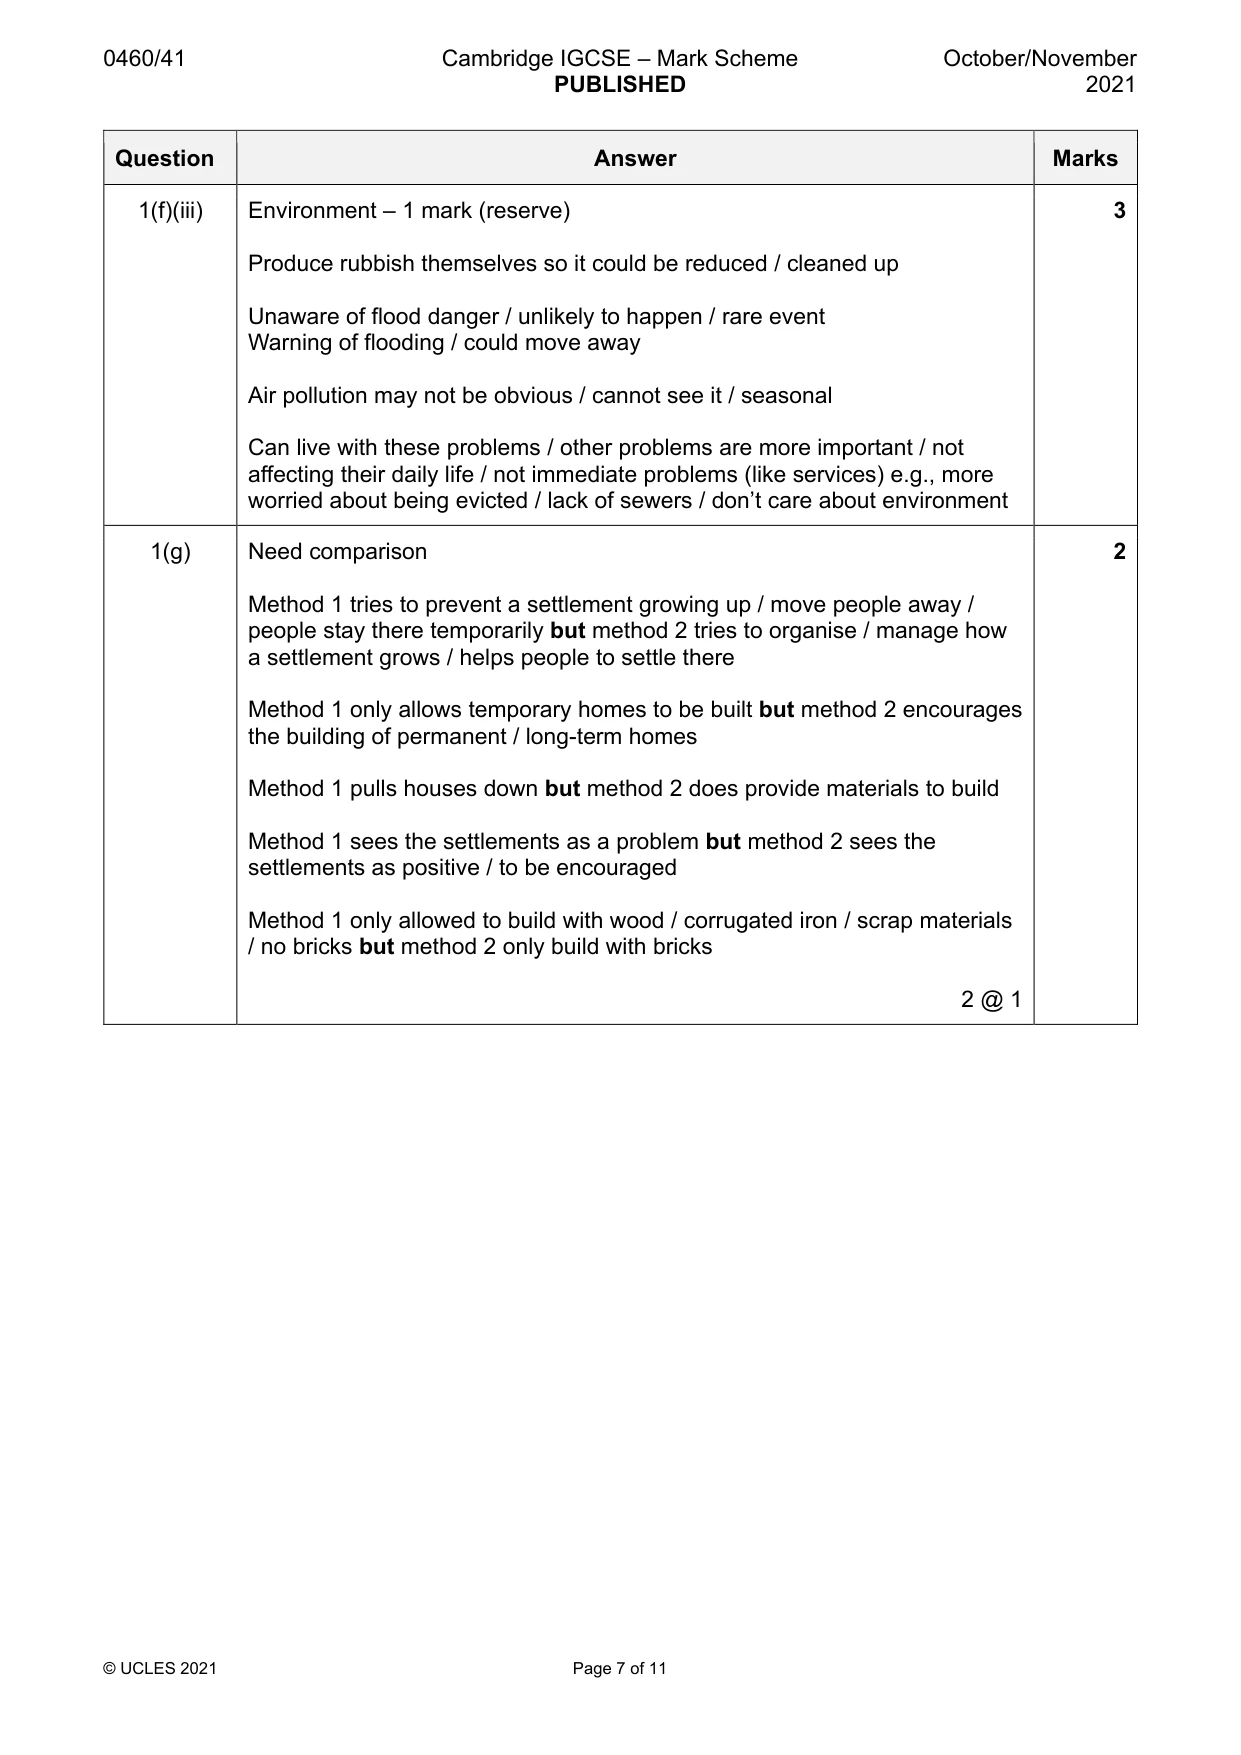
Mark scheme: Question Answer Marks 1(a) An area in which people illegally build homes / without landowners approval 1 An area which lacks basic sanitation / water supply / electricity An area of self-built housing / scrap materials 1(b)(i) 4.5 km 1 1(b)(ii) On the edge / outskirts of the city / around city 2 Next to rivers / rivers flow through them On main roads / roads go through them Away from CBD In 4 groups / areas N/NE/E/S/SW/SE of city / CBD (of city) 1(b)(iii) On vacant land / land not already occupied / land which is left / plenty of 2 space (Near to river / water source) for drinking / washing / fishing / river for waste disposal (Near to / road) for access to work / industry / CBD 2 @ 1 1(c)(i) 20 people: 2 Not enough for a reliable sample Too few responses to reach a conclusion / make study worthwhile / get evidence for hypothesis Not represent all people / not representative Not get a full range of answers / small range of answers 500 people: Take too long / long time Too many responses to produce the results from / analyse / put into data table Might not find 500 people 1(c)(ii) (Scrap materials) 1 Collect rainwater or water from the river No electricity supply No legal tenure Other informal job All correct for 1 mark 1(d)(i) Plot scrap materials = 24% 1 1(d)(ii) Plot ‘rent from city authority’ = 42% 1 1(d)(iii) In settlement B: 4 Most / more / lots of / over half houses built of brick OR few / less than half built out of corrugated iron / scrap Most / more / lots of / over half houses have taps in them OR few / less than half get water from standpipe / river Most / more / lots of / over half get electricity from city authority OR few / less than half use a cable / have no electricity Most / more / lots of / over half own / rent the house / have right or permission to live there / have legal tenure OR few / less than half rent / have no legal tenure In settlement A: (must specify) Most etc. houses built of corrugated iron / scrap materials OR few etc. built out of brick Most etc. houses use standpipe / river OR few etc. have taps in home Most etc. get electricity from cable / have no electricity OR few get electricity from city authority Most etc. don’t own house / no legal tenure OR few etc. own the house In B houses are built of bricks but in A houses are built of corrugated iron / scrap In B water comes from tap but in A water comes from standpipe / river In B electricity comes from city authority but in A electricity comes from cable / no electricity In B people own / rent the house but in A people have no legal tenure 4 @ 1 1(e)(i) Plot ‘selling homemade items’ = 22% and ‘other jobs’ = 19% 2 1 mark for dividing line at 81% 1 mark for shading 1(e)(ii) Settlement A 4 Hypothesis is true / correct – 1 mark reserve (HA) OR most work in informal jobs / sector 73% work in informal sector Hypothesis is incorrect / partially correct = 0 (XHA) If no hypothesis conclusion ^HA and credit evidence Settlement B Hypothesis is false / incorrect – 1 mark reserve (HA) OR most work in formal jobs / most don’t work in informal jobs / less work in informal jobs 41% work in informal sector OR 59% work in formal sector Hypothesis is true / correct = 0 (XHA) If no hypothesis conclusion ^HA and credit evidence 1(f)(i) 32 1 1(f)(ii) Services – 1 mark (reserve) 3 Danger of outbreak of disease / named disease / disease spreads Dangerous insects / mosquitoes / rats / insects which carry disease Unpleasant smell Danger of illegal hook-ups to electricity cables No electricity for lights / cooking / appliances / work No clean water to drink / wash themselves 1(f)(iii) Environment – 1 mark (reserve) 3 Produce rubbish themselves so it could be reduced / cleaned up Unaware of flood danger / unlikely to happen / rare event Warning of flooding / could move away Air pollution may not be obvious / cannot see it / seasonal Can live with these problems / other problems are more important / not affecting their daily life / not immediate problems (like services) e.g., more worried about being evicted / lack of sewers / don’t care about environment 1(g) Need comparison 2 Method 1 tries to prevent a settlement growing up / move people away / people stay there temporarily but method 2 tries to organise / manage how a settlement grows / helps people to settle there Method 1 only allows temporary homes to be built but method 2 encourages the building of permanent / long-term homes Method 1 pulls houses down but method 2 does provide materials to build Method 1 sees the settlements as a problem but method 2 sees the settlements as positive / to be encouraged Method 1 only allowed to build with wood / corrugated iron / scrap materials / no bricks but method 2 only build with bricks 2 @ 1
Q2 · Some students did fieldwork at two beaches (X and Y) on the east coast of the UK
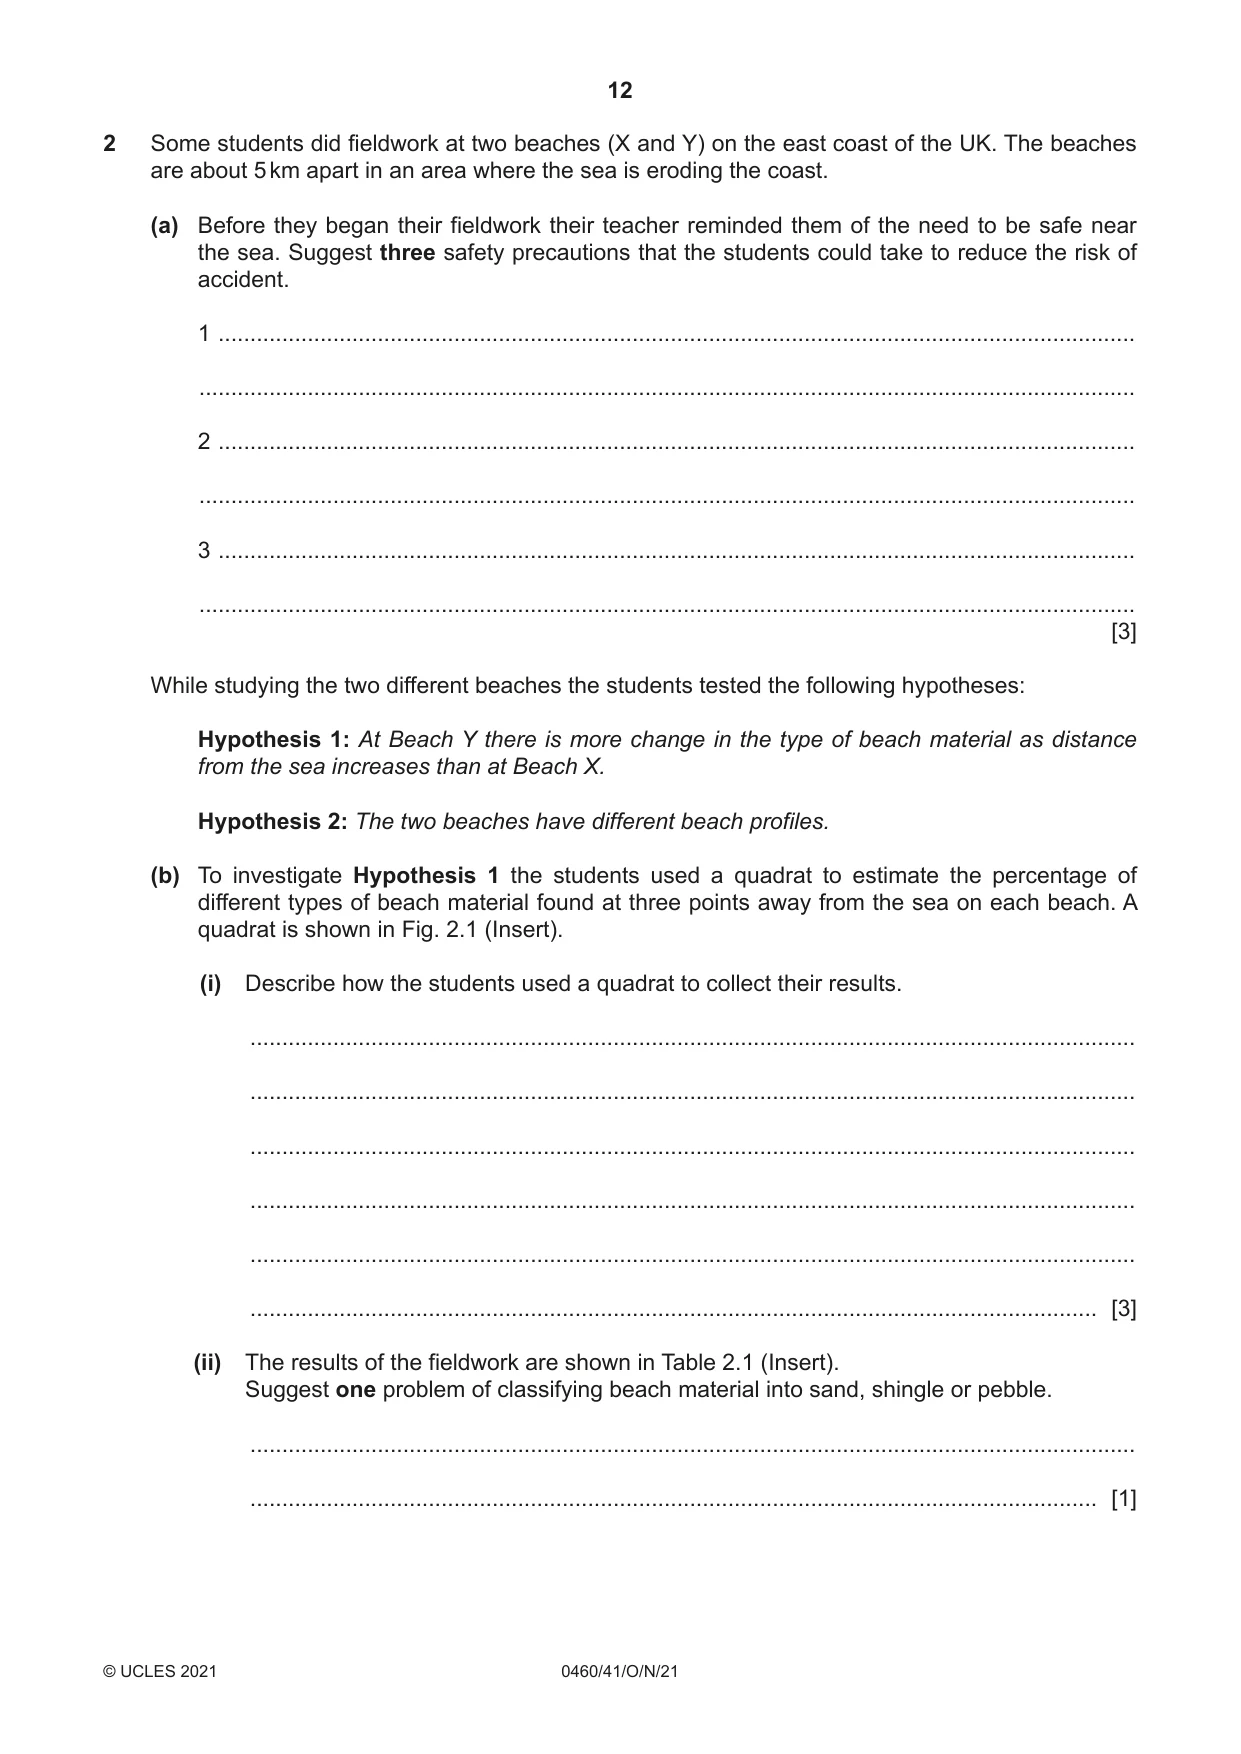
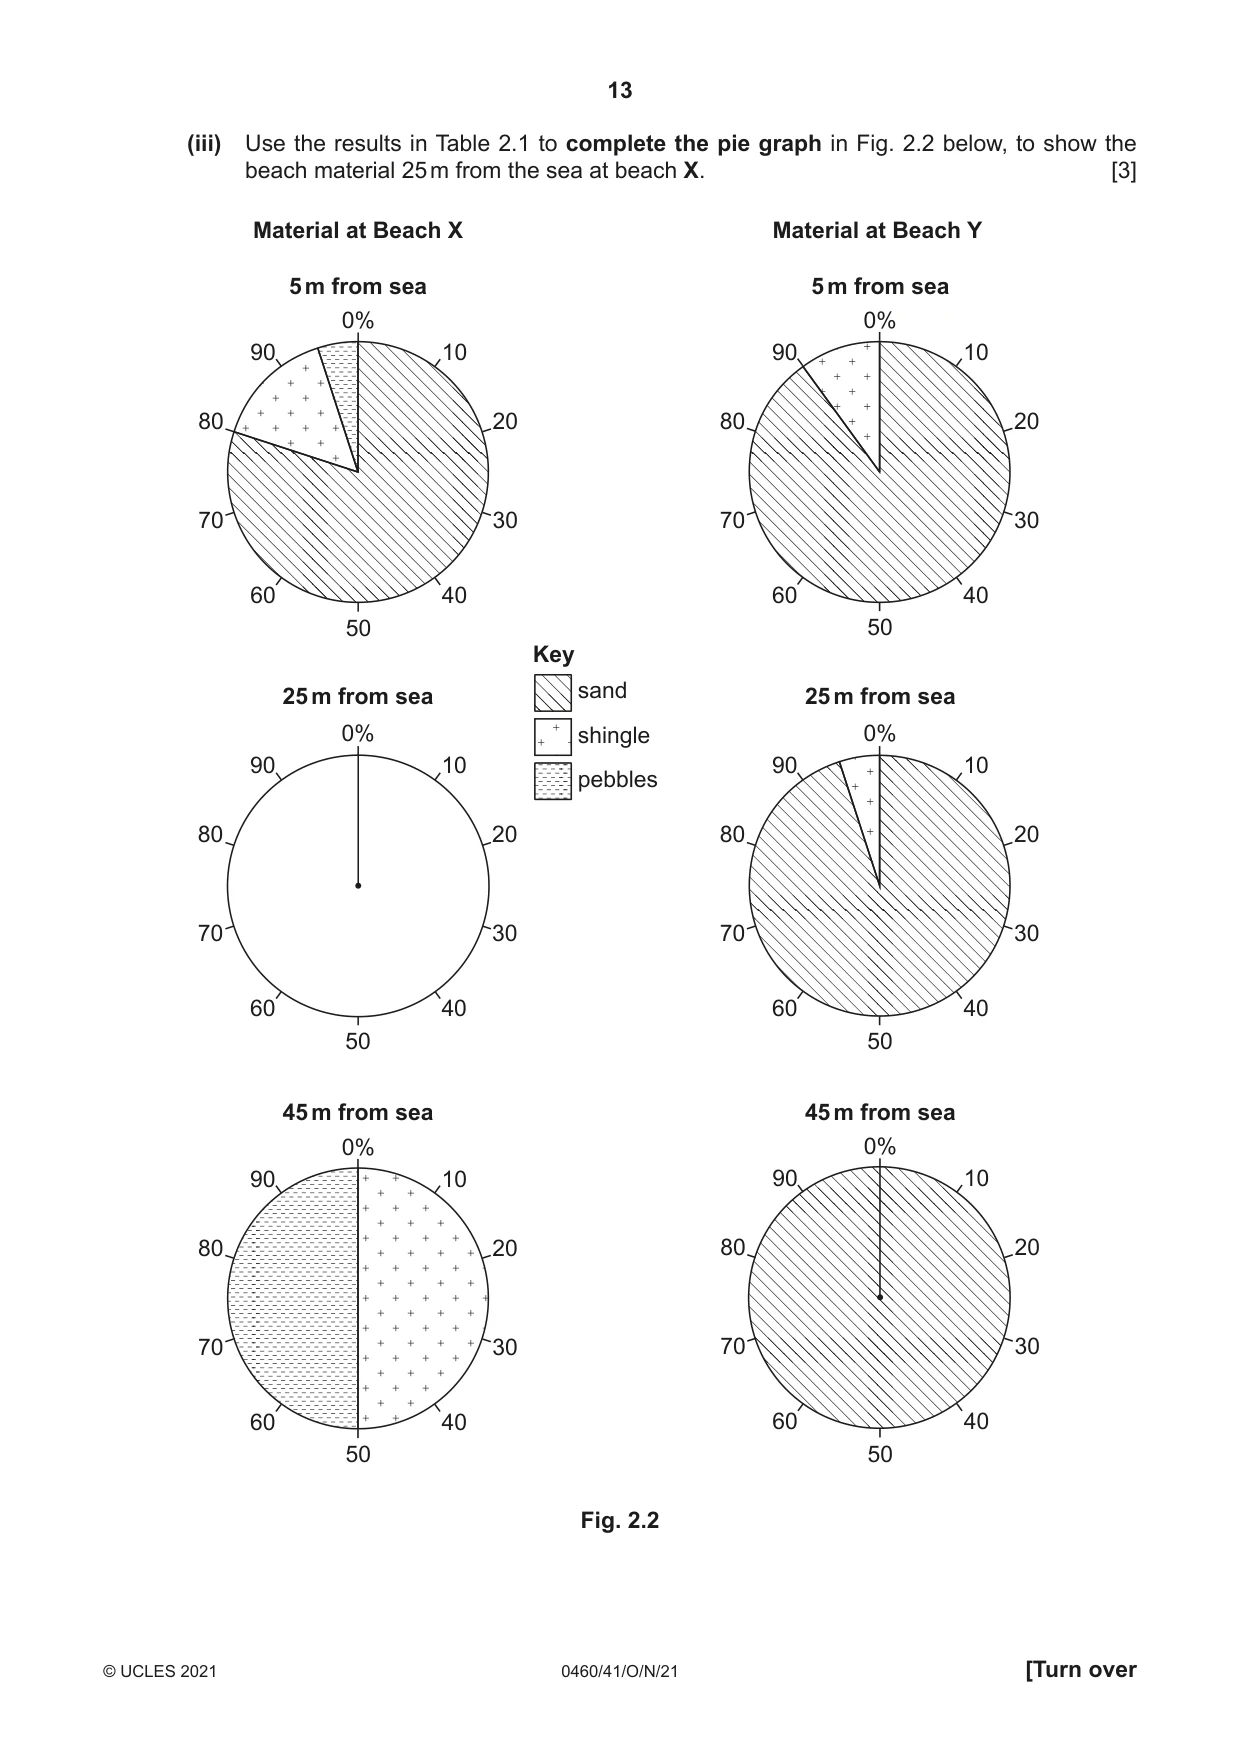
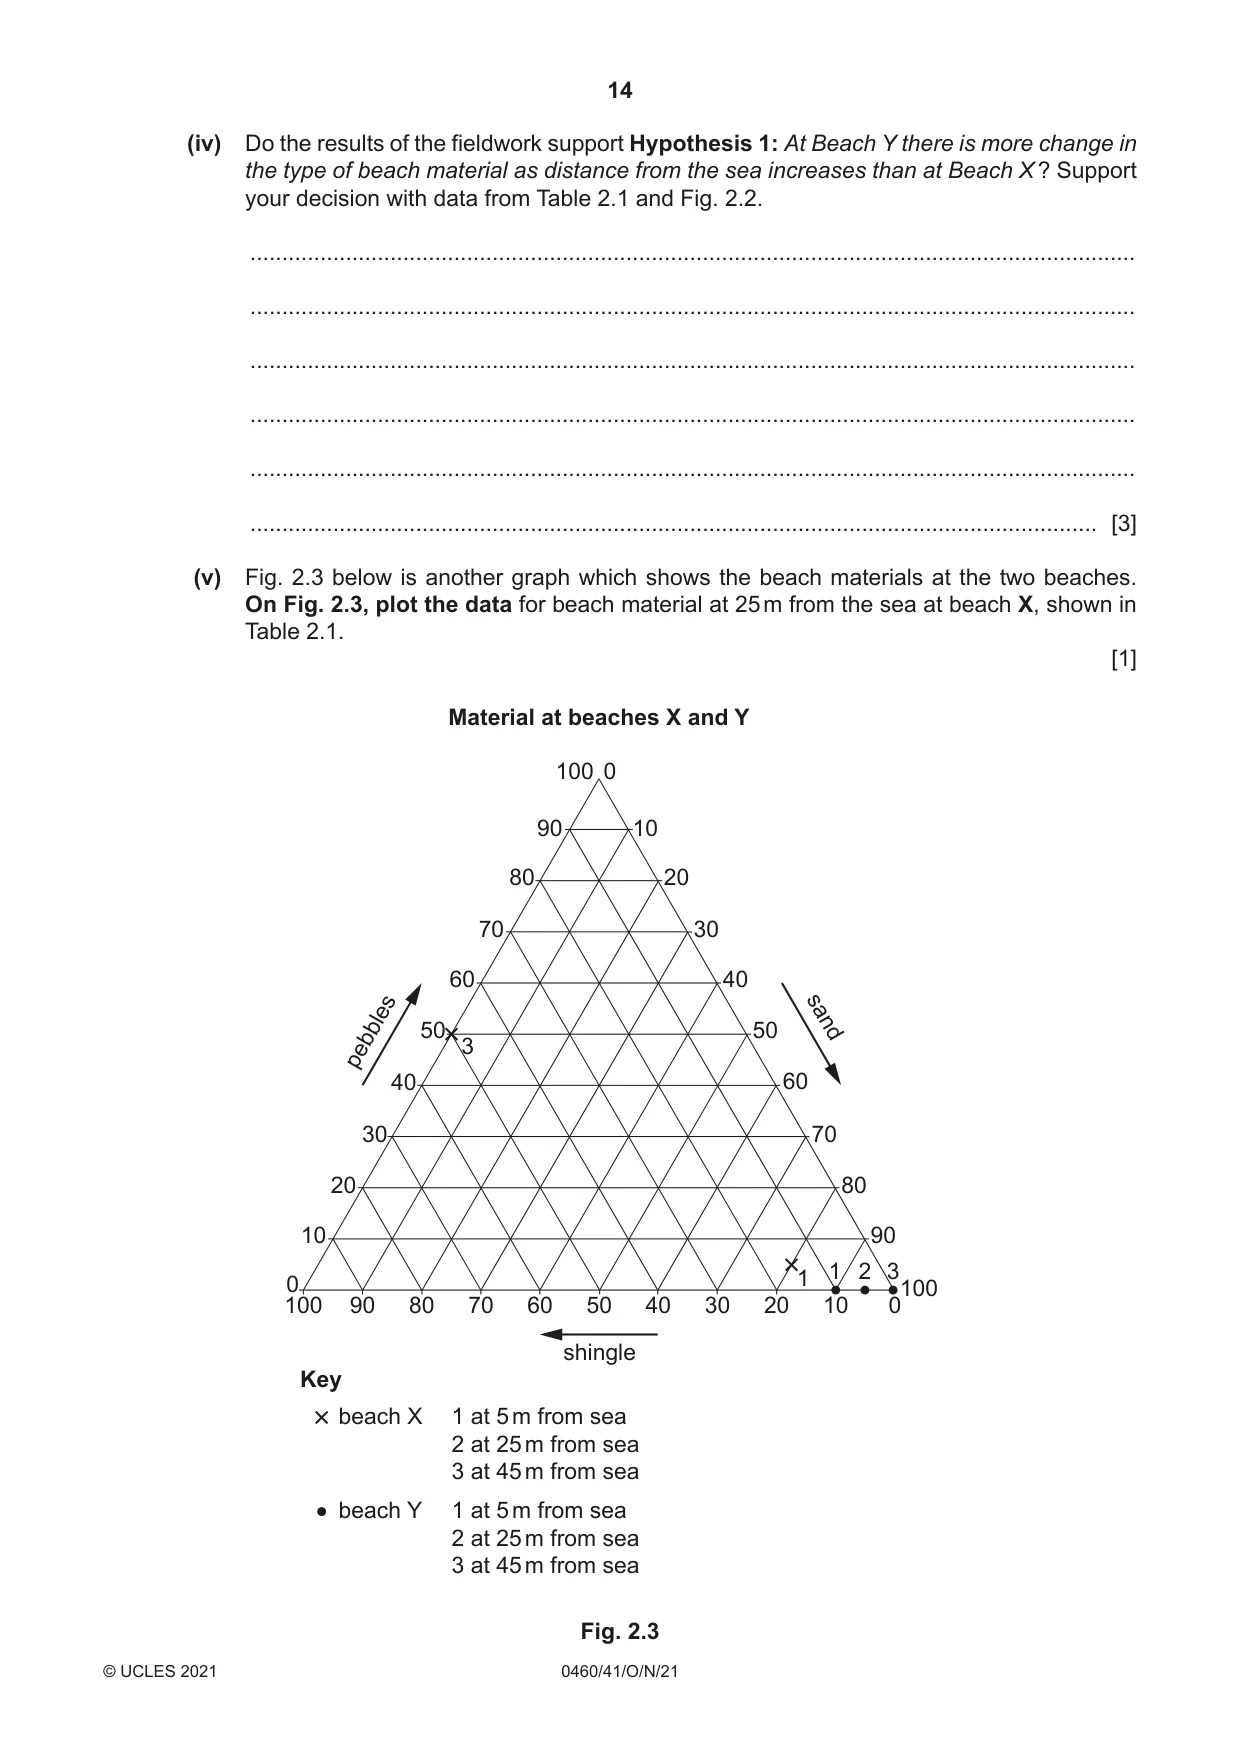
2 Some students did fieldwork at two beaches (X and Y) on the east coast of the UK. The beaches are about 5 km apart in an area where the sea is eroding the coast. (a) Before they began their fieldwork their teacher reminded them of the need to be safe near the sea. Suggest three safety precautions that the students could take to reduce the risk of accident. 1 ................................................................................................................................................ ................................................................................................................................................... 2 ................................................................................................................................................ ................................................................................................................................................... 3 ................................................................................................................................................ ................................................................................................................................................... [3] While studying the two different beaches the students tested the following hypotheses: Hypothesis 1: At Beach Y there is more change in the type of beach material as distance from the sea increases than at Beach X. Hypothesis 2: The two beaches have different beach profiles. (b) To investigate Hypothesis 1 the students used a quadrat to estimate the percentage of different types of beach material found at three points away from the sea on each beach. A quadrat is shown in Fig. 2.1 (Insert). (i) Describe how the students used a quadrat to collect their results. ........................................................................................................................................... ........................................................................................................................................... ........................................................................................................................................... ........................................................................................................................................... ........................................................................................................................................... ..................................................................................................................................... [3] (ii) The results of the fieldwork are shown in Table 2.1 (Insert). Suggest one problem of classifying beach material into sand, shingle or pebble. ........................................................................................................................................... ..................................................................................................................................... [1] (iii) Use the results in Table 2.1 to complete the pie graph in Fig. 2.2 below, to show the beach material 25 m from the sea at beach X. [3] Material at Beach X Material at Beach Y 5 m from sea 5 m from sea 0% 0% 90 10 90 10 80 20 80 20 70 30 70 30 60 40 60 40 50 50 Key 25 m from sea sand 25 m from sea 0% shingle 0% 90 10 90 10 pebbles 80 20 80 20 70 30 70 30 60 40 60 40 50 50 45 m from sea 45 m from sea 0% 0% 90 10 90 10 80 20 80 20 70 30 70 30 60 40 60 40 50 50 Fig. 2.2 (iv) Do the results of the fieldwork support Hypothesis 1: At Beach Y there is more change in the type of beach material as distance from the sea increases than at Beach X ? Support your decision with data from Table 2.1 and Fig. 2.2. ........................................................................................................................................... ........................................................................................................................................... ........................................................................................................................................... ........................................................................................................................................... ........................................................................................................................................... ..................................................................................................................................... [3] (v) Fig. 2.3 below is another graph which shows the beach materials at the two beaches. On Fig. 2.3, plot the data for beach material at 25 m from the sea at beach X, shown in Table 2.1. [1] Material at beaches X and Y 100 0 90 10 80 20 70 30 60 40 50 50 sand 3 pebbles 40 60 30 70 20 80 10 90 1 2 3 1 0 100 100 90 80 70 60 50 40 30 20 10 0 shingle Key beach X 1 at 5 m from sea 2 at 25 m from sea 3 at 45 m from sea beach Y 1 at 5 m from sea 2 at 25 m from sea 3 at 45 m from sea
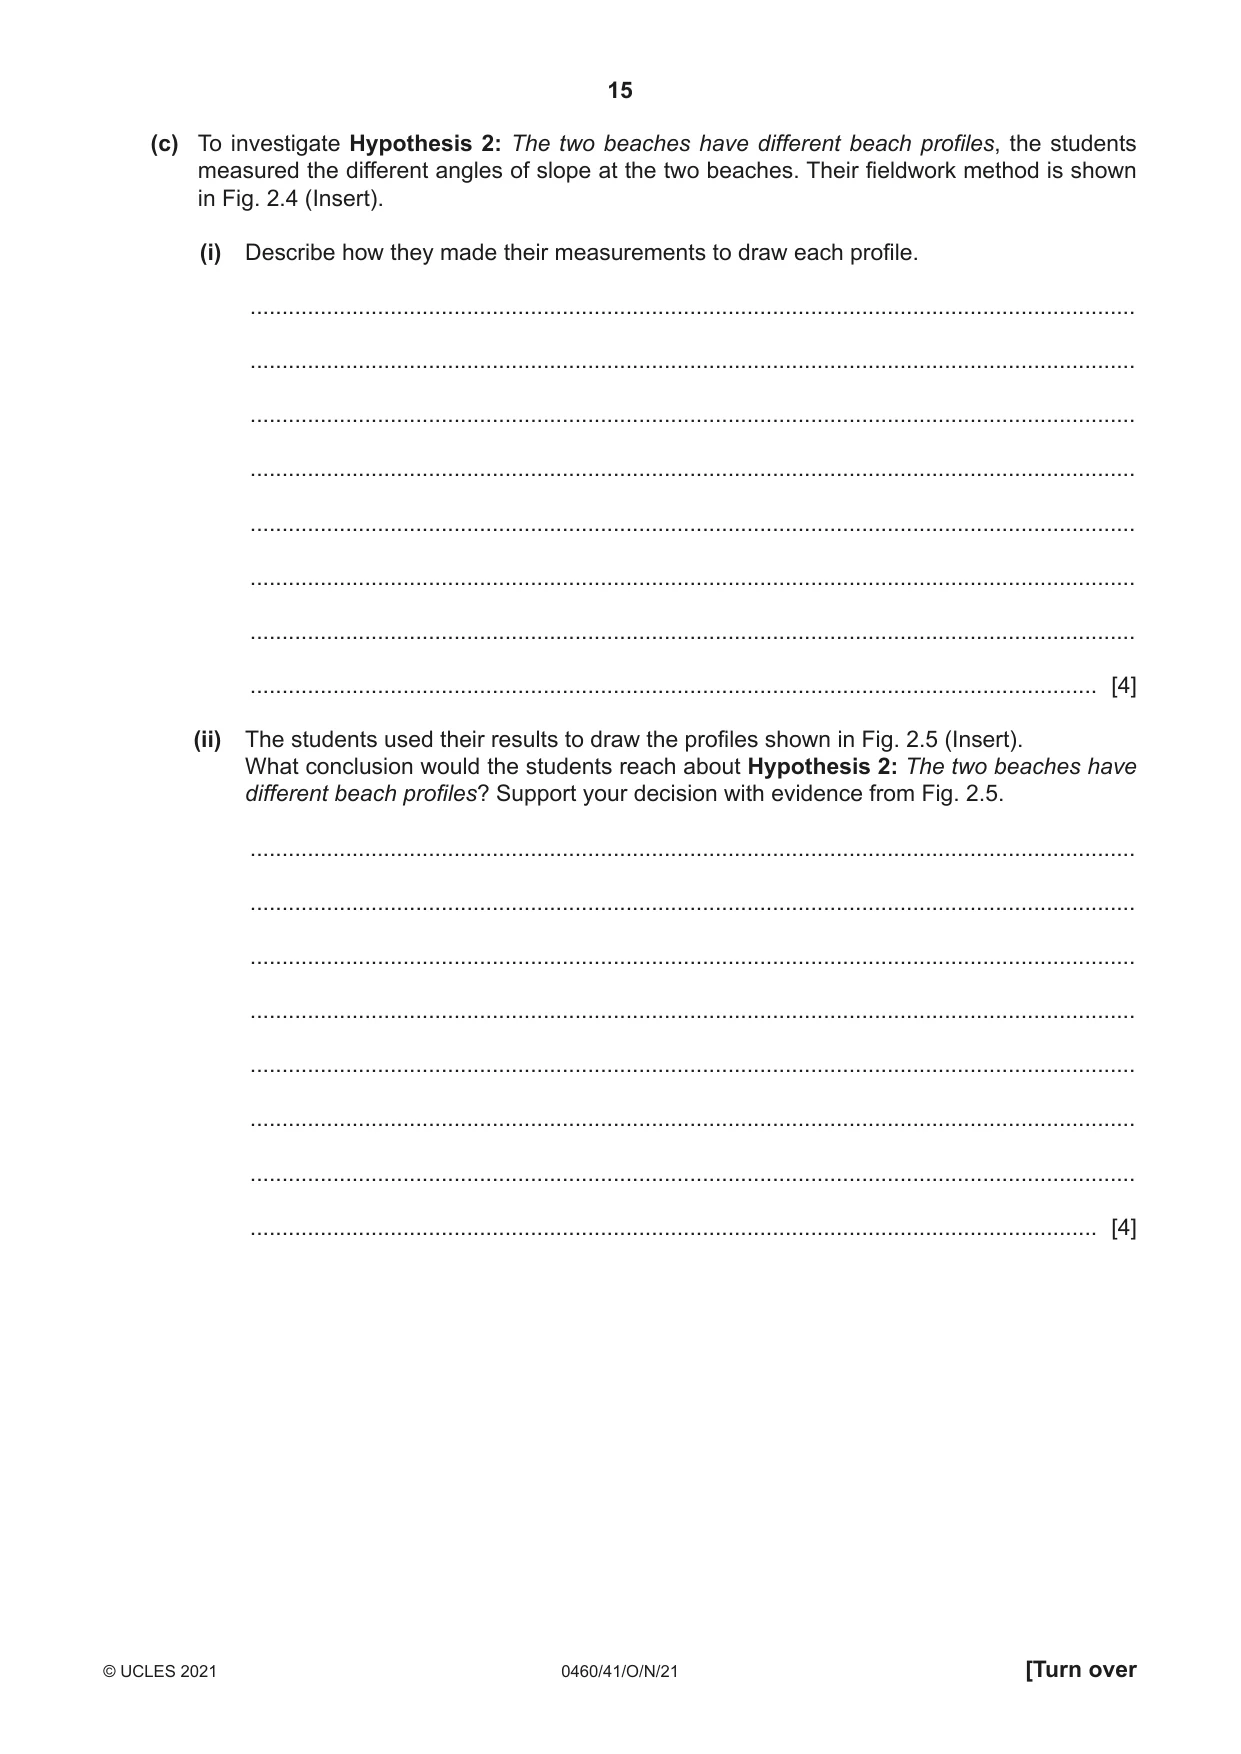
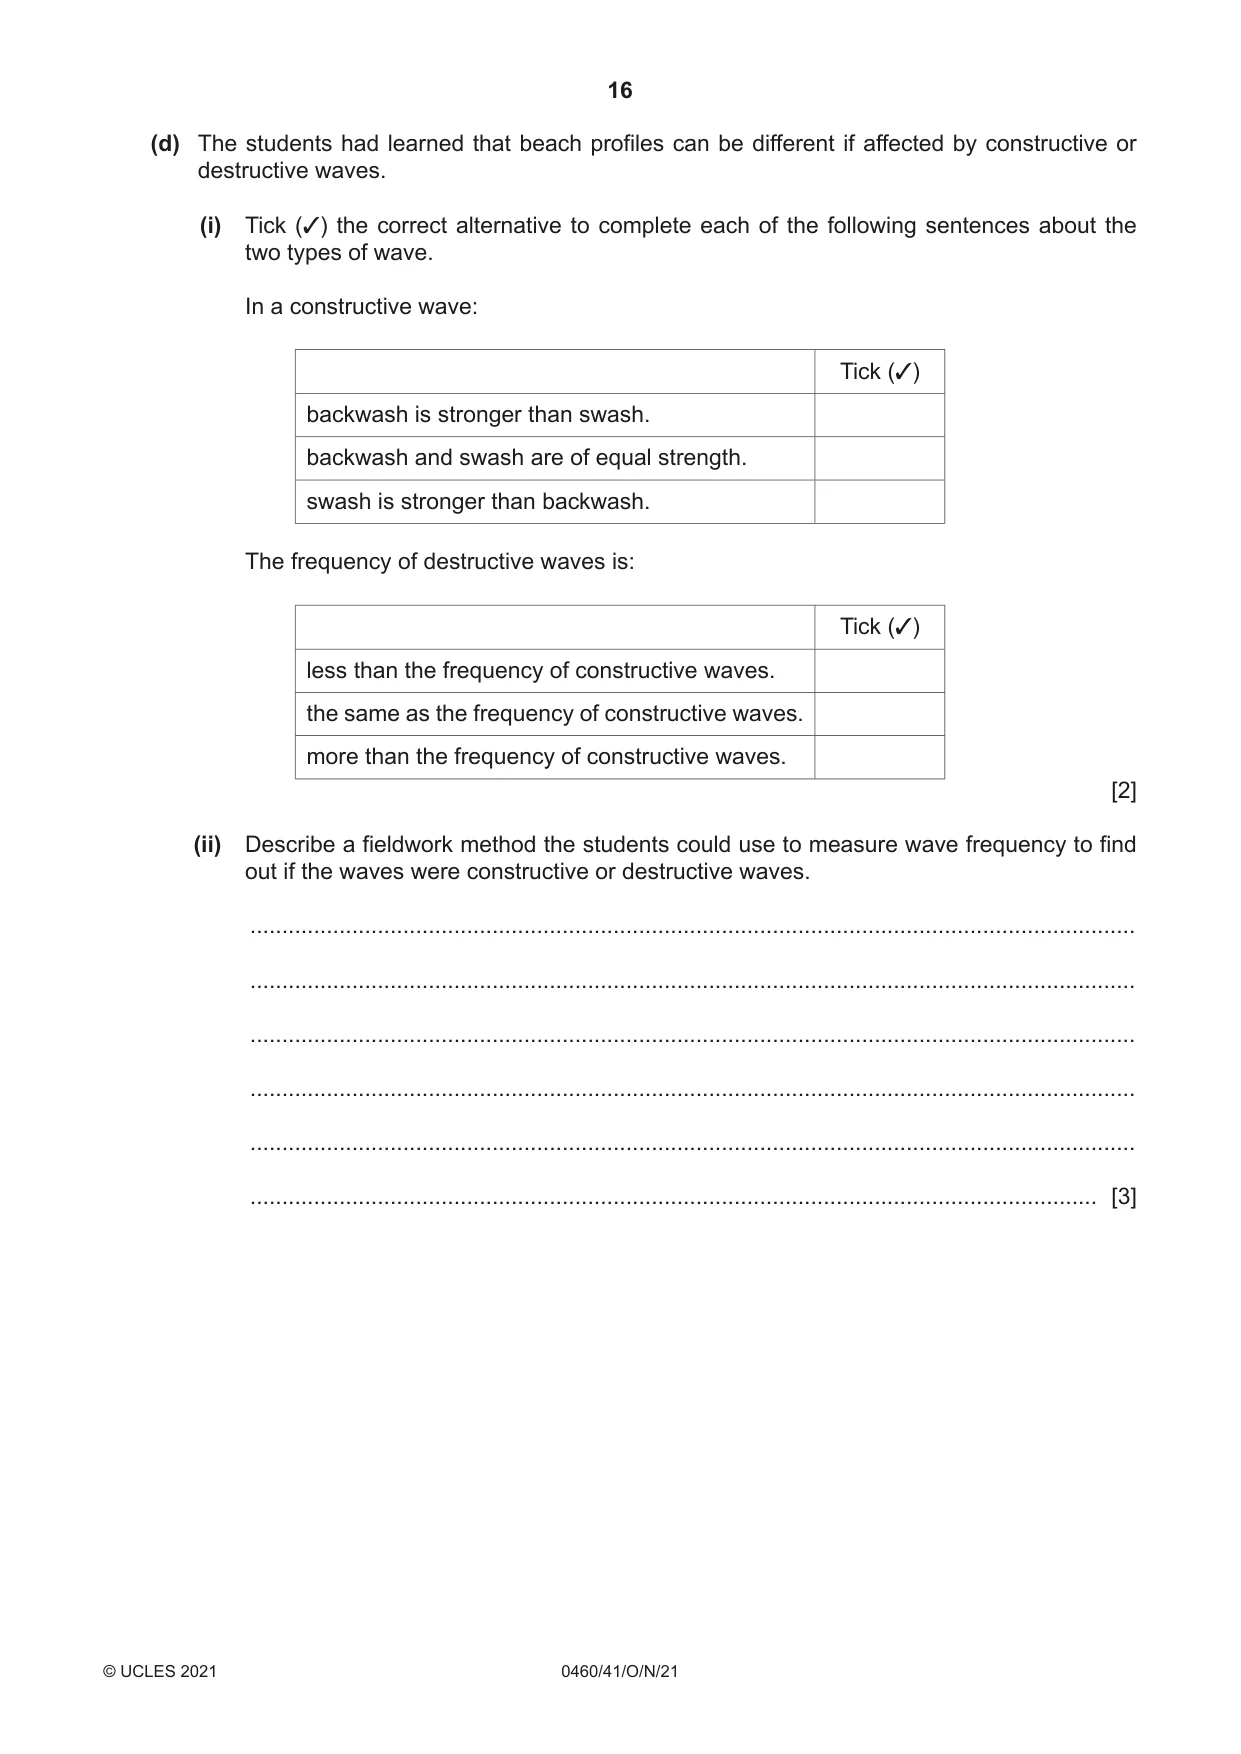
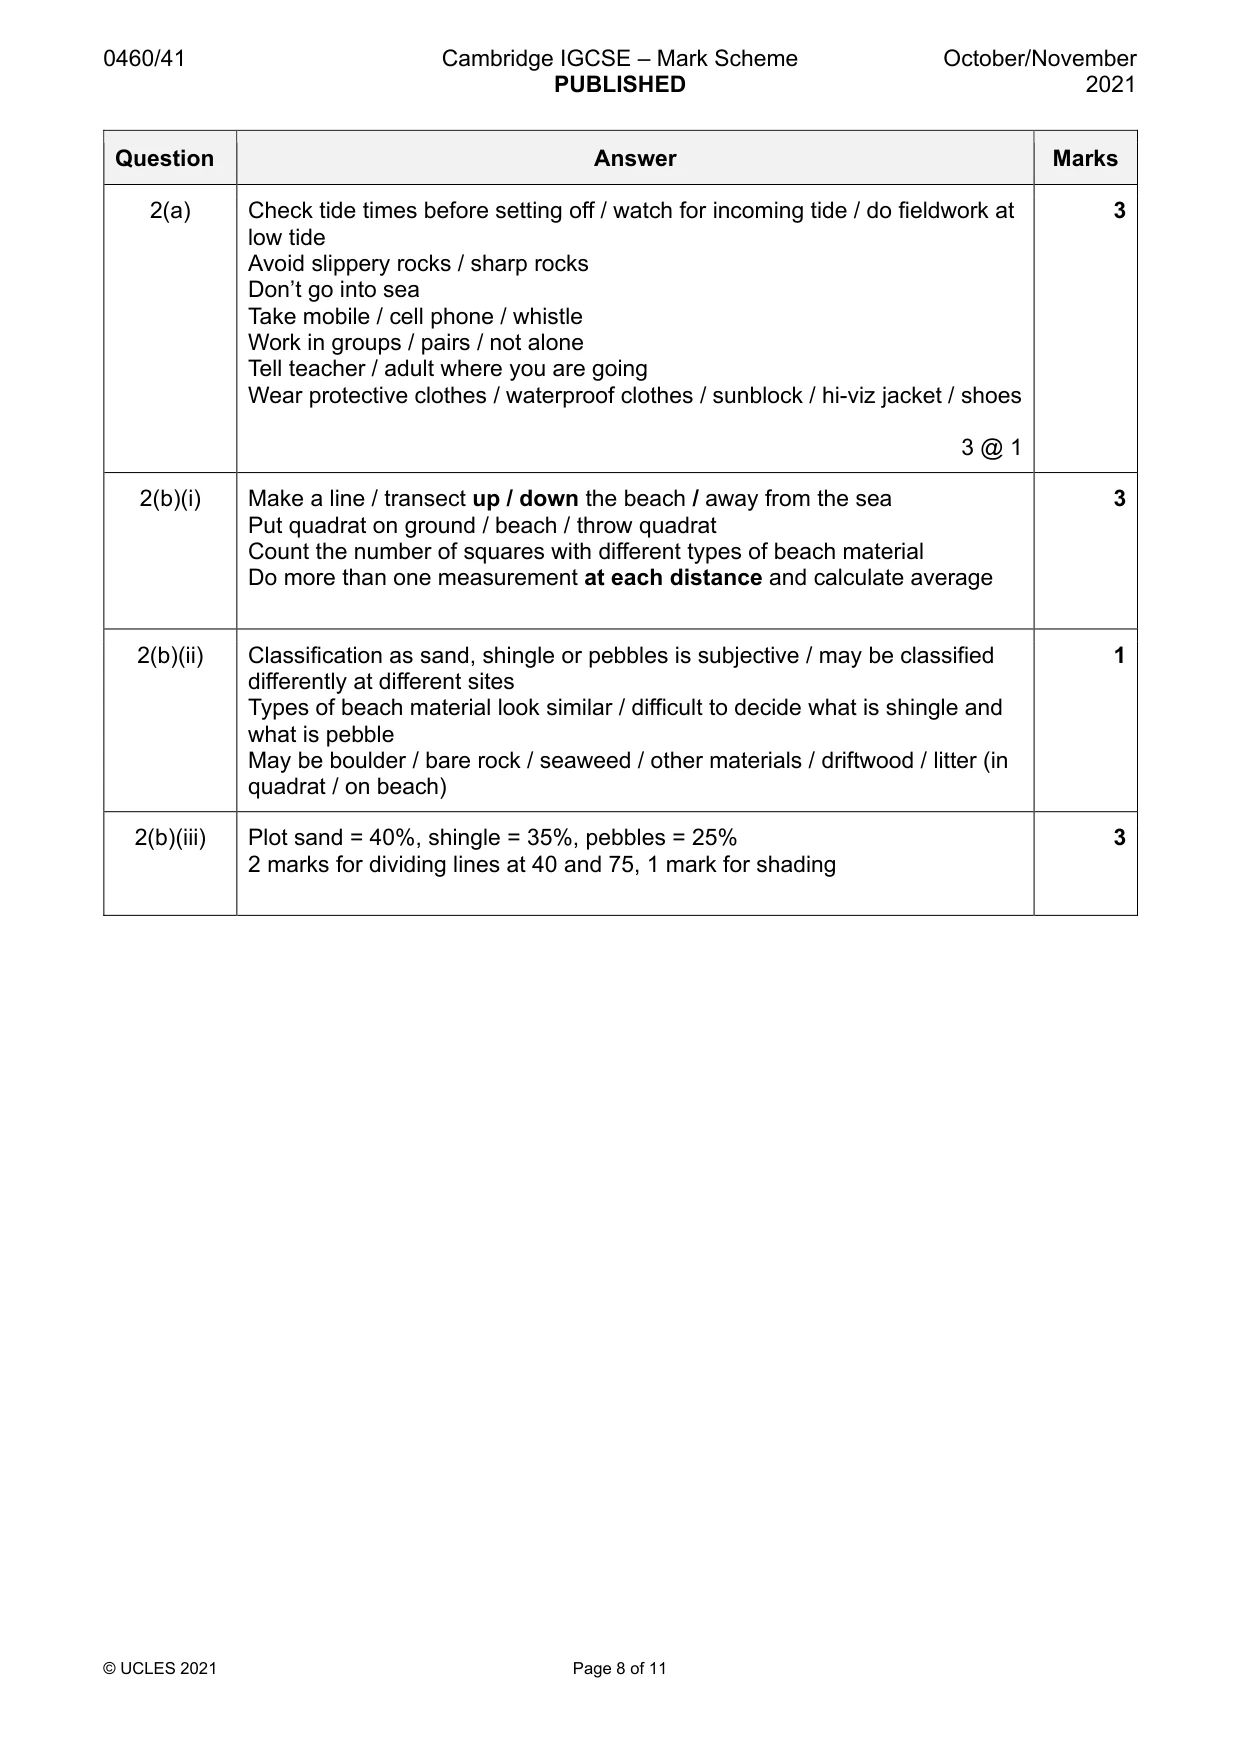
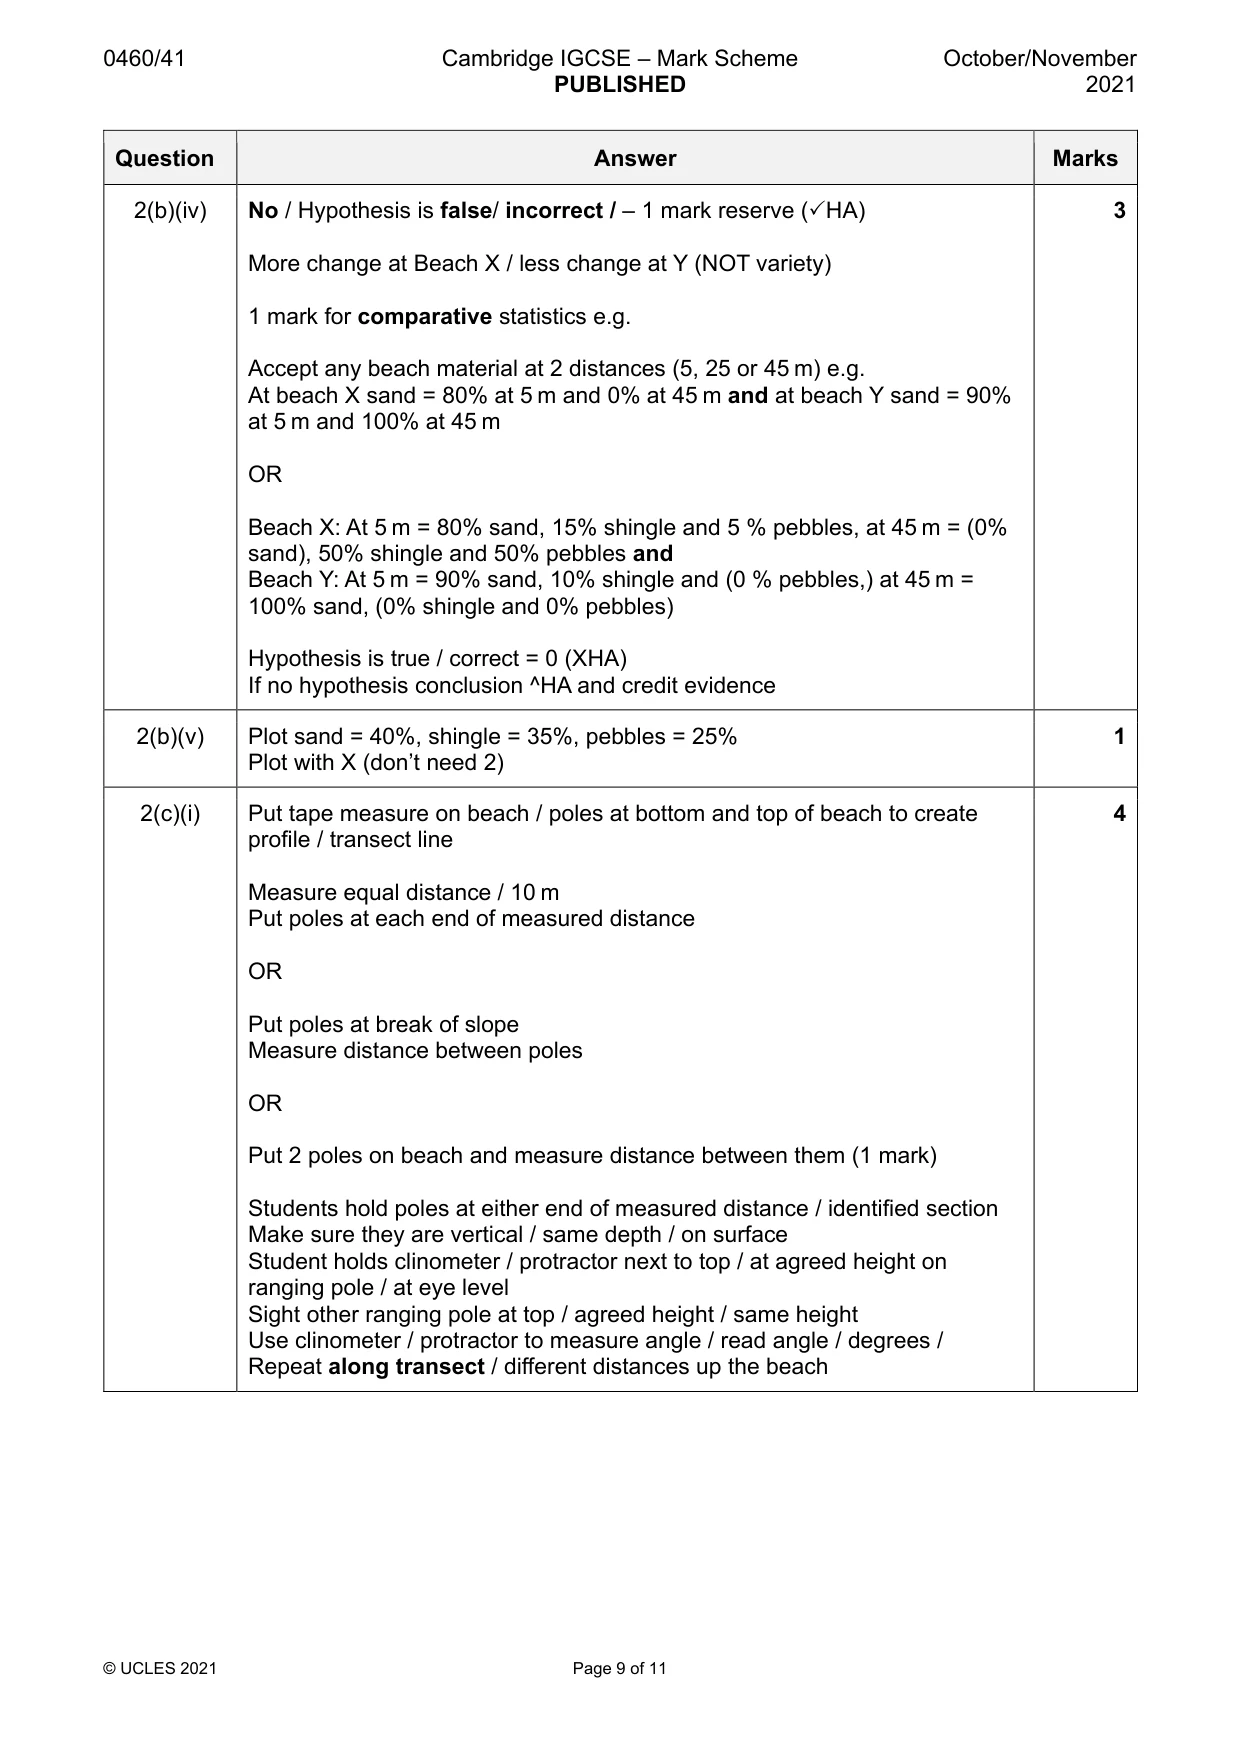
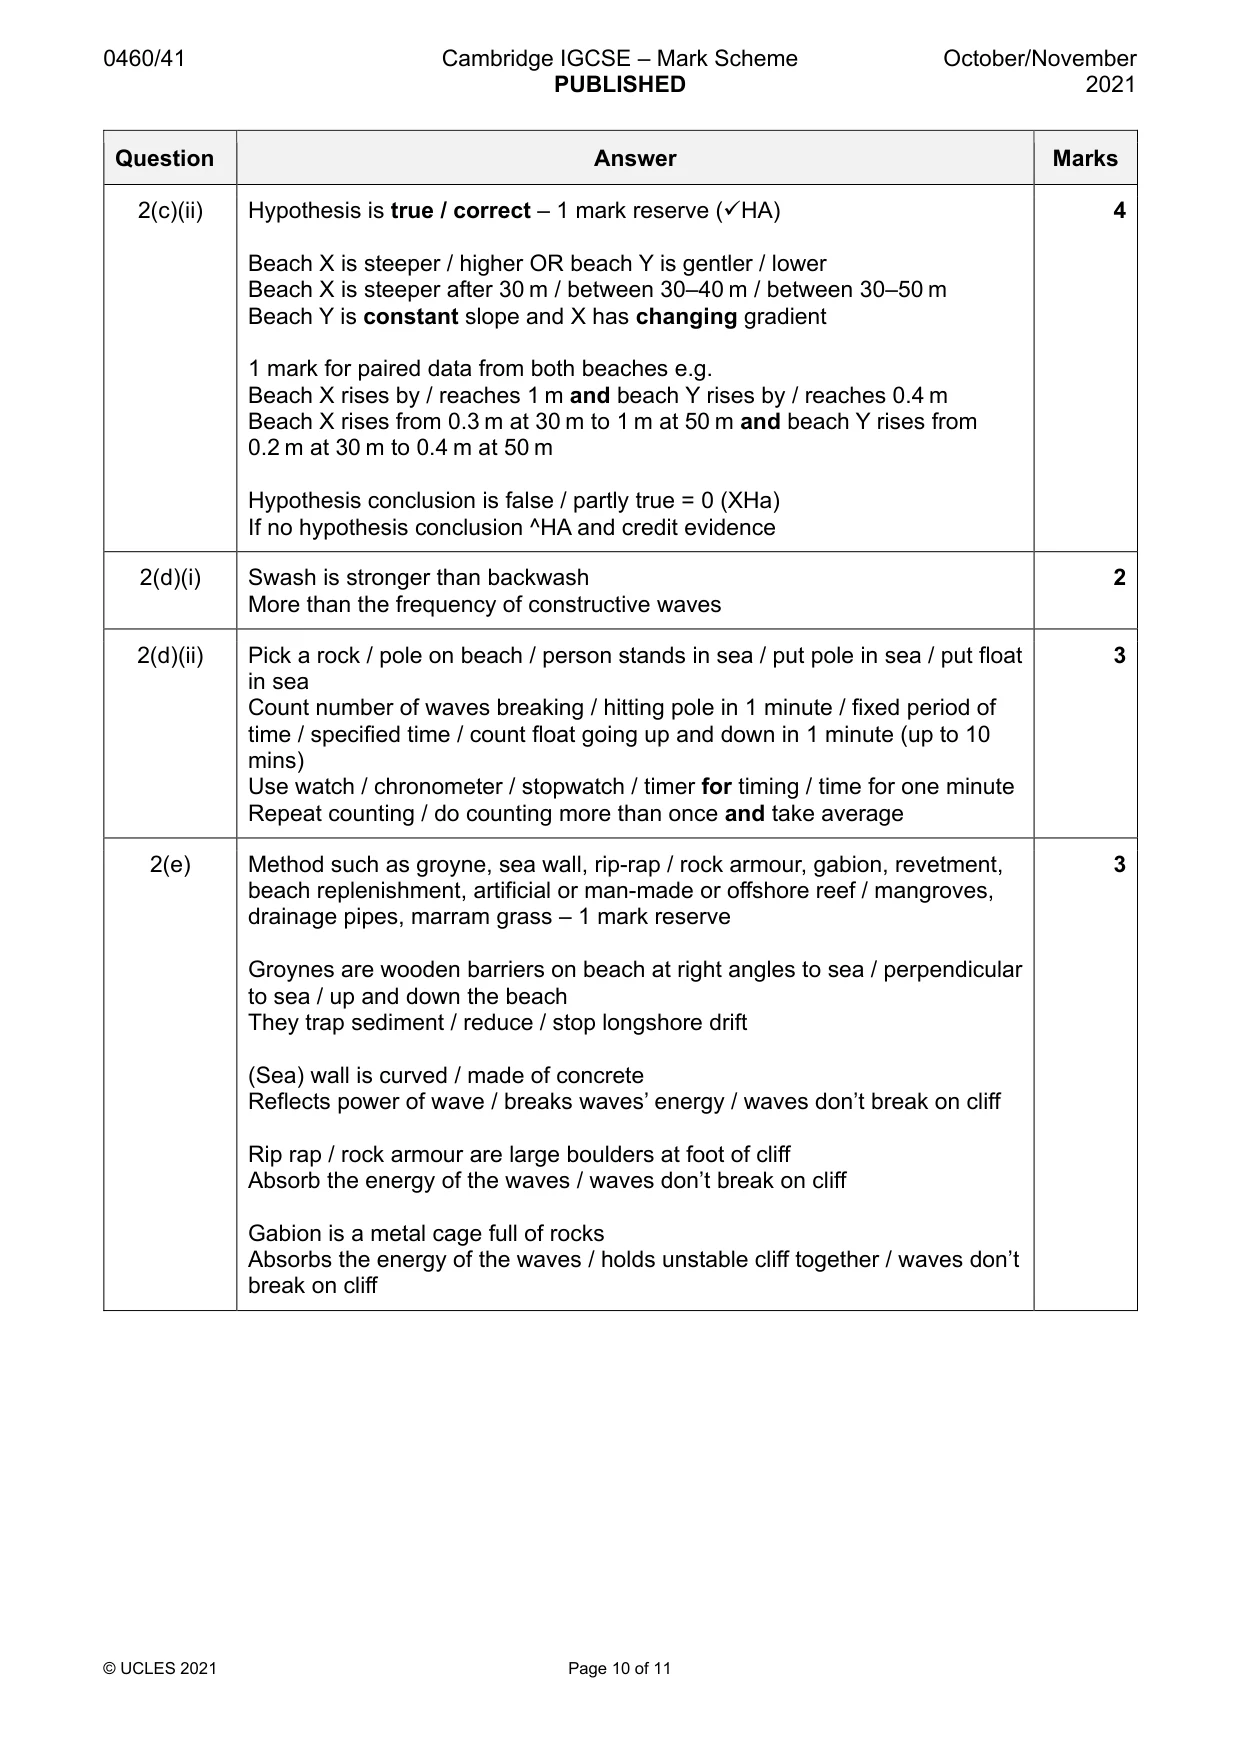
Mark scheme: 2(a) Check tide times before setting off / watch for incoming tide / do fieldwork at 3 low tide Avoid slippery rocks / sharp rocks Don’t go into sea Take mobile / cell phone / whistle Work in groups / pairs / not alone Tell teacher / adult where you are going Wear protective clothes / waterproof clothes / sunblock / hi-viz jacket / shoes 3 @ 1 2(b)(i) Make a line / transect up / down the beach / away from the sea 3 Put quadrat on ground / beach / throw quadrat Count the number of squares with different types of beach material Do more than one measurement at each distance and calculate average 2(b)(ii) Classification as sand, shingle or pebbles is subjective / may be classified 1 differently at different sites Types of beach material look similar / difficult to decide what is shingle and what is pebble May be boulder / bare rock / seaweed / other materials / driftwood / litter (in quadrat / on beach) 2(b)(iii) Plot sand = 40%, shingle = 35%, pebbles = 25% 3 2 marks for dividing lines at 40 and 75, 1 mark for shading 2(b)(iv) No / Hypothesis is false/ incorrect / – 1 mark reserve (HA) 3 More change at Beach X / less change at Y (NOT variety) 1 mark for comparative statistics e.g. Accept any beach material at 2 distances (5, 25 or 45 m) e.g. At beach X sand = 80% at 5 m and 0% at 45 m and at beach Y sand = 90% at 5 m and 100% at 45 m OR Beach X: At 5 m = 80% sand, 15% shingle and 5 % pebbles, at 45 m = (0% sand), 50% shingle and 50% pebbles and Beach Y: At 5 m = 90% sand, 10% shingle and (0 % pebbles,) at 45 m = 100% sand, (0% shingle and 0% pebbles) Hypothesis is true / correct = 0 (XHA) If no hypothesis conclusion ^HA and credit evidence 2(b)(v) Plot sand = 40%, shingle = 35%, pebbles = 25% 1 Plot with X (don’t need 2) 2(c)(i) Put tape measure on beach / poles at bottom and top of beach to create 4 profile / transect line Measure equal distance / 10 m Put poles at each end of measured distance OR Put poles at break of slope Measure distance between poles OR Put 2 poles on beach and measure distance between them (1 mark) Students hold poles at either end of measured distance / identified section Make sure they are vertical / same depth / on surface Student holds clinometer / protractor next to top / at agreed height on ranging pole / at eye level Sight other ranging pole at top / agreed height / same height Use clinometer / protractor to measure angle / read angle / degrees / Repeat along transect / different distances up the beach 2(c)(ii) Hypothesis is true / correct – 1 mark reserve (HA) 4 Beach X is steeper / higher OR beach Y is gentler / lower Beach X is steeper after 30 m / between 30–40 m / between 30–50 m Beach Y is constant slope and X has changing gradient 1 mark for paired data from both beaches e.g. Beach X rises by / reaches 1 m and beach Y rises by / reaches 0.4 m Beach X rises from 0.3 m at 30 m to 1 m at 50 m and beach Y rises from 0.2 m at 30 m to 0.4 m at 50 m Hypothesis conclusion is false / partly true = 0 (XHa) If no hypothesis conclusion ^HA and credit evidence 2(d)(i) Swash is stronger than backwash 2 More than the frequency of constructive waves 2(d)(ii) Pick a rock / pole on beach / person stands in sea / put pole in sea / put float 3 in sea Count number of waves breaking / hitting pole in 1 minute / fixed period of time / specified time / count float going up and down in 1 minute (up to 10 mins) Use watch / chronometer / stopwatch / timer for timing / time for one minute Repeat counting / do counting more than once and take average 2(e) Method such as groyne, sea wall, rip-rap / rock armour, gabion, revetment, 3 beach replenishment, artificial or man-made or offshore reef / mangroves, drainage pipes, marram grass – 1 mark reserve Groynes are wooden barriers on beach at right angles to sea / perpendicular to sea / up and down the beach They trap sediment / reduce / stop longshore drift (Sea) wall is curved / made of concrete Reflects power of wave / breaks waves’ energy / waves don’t break on cliff Rip rap / rock armour are large boulders at foot of cliff Absorb the energy of the waves / waves don’t break on cliff Gabion is a metal cage full of rocks Absorbs the energy of the waves / holds unstable cliff together / waves don’t break on cliff 2(e) Revetment is wooden or concrete barrier Waves break against them / absorb waves’ energy / waves don’t break on cliff Reef is barrier built out at sea Breaks waves / stop waves reaching land 1 mark for description and 1 mark for explanation
What was in this paper
The subtopics covered by these 2 questions, and how many questions each got. Open one in a new tab to see every Cambridge question on it.
What you needed in this session
Cambridge’s own grade thresholds for 2021 Oct/Nov, Paper 4 · Variant 1. A higher threshold means an easier paper — the bar moves with how the cohort did.