Cambridge IGCSE Geography 0460 — 2021 May/June Paper 4 · Variant 1
0460/41/M/J/21 · 2 questions · 60 marks · ≈68 min
The question paper and its mark scheme, free to read here and free to download. This is Cambridge’s own paper, exactly as it was sat.
Question paper16 pages





Mark scheme8 pages
Answers below. Sit the paper first if you are practising.

Questions as text
Q1 · Students went to do fieldwork at Porlock Bay in south west England
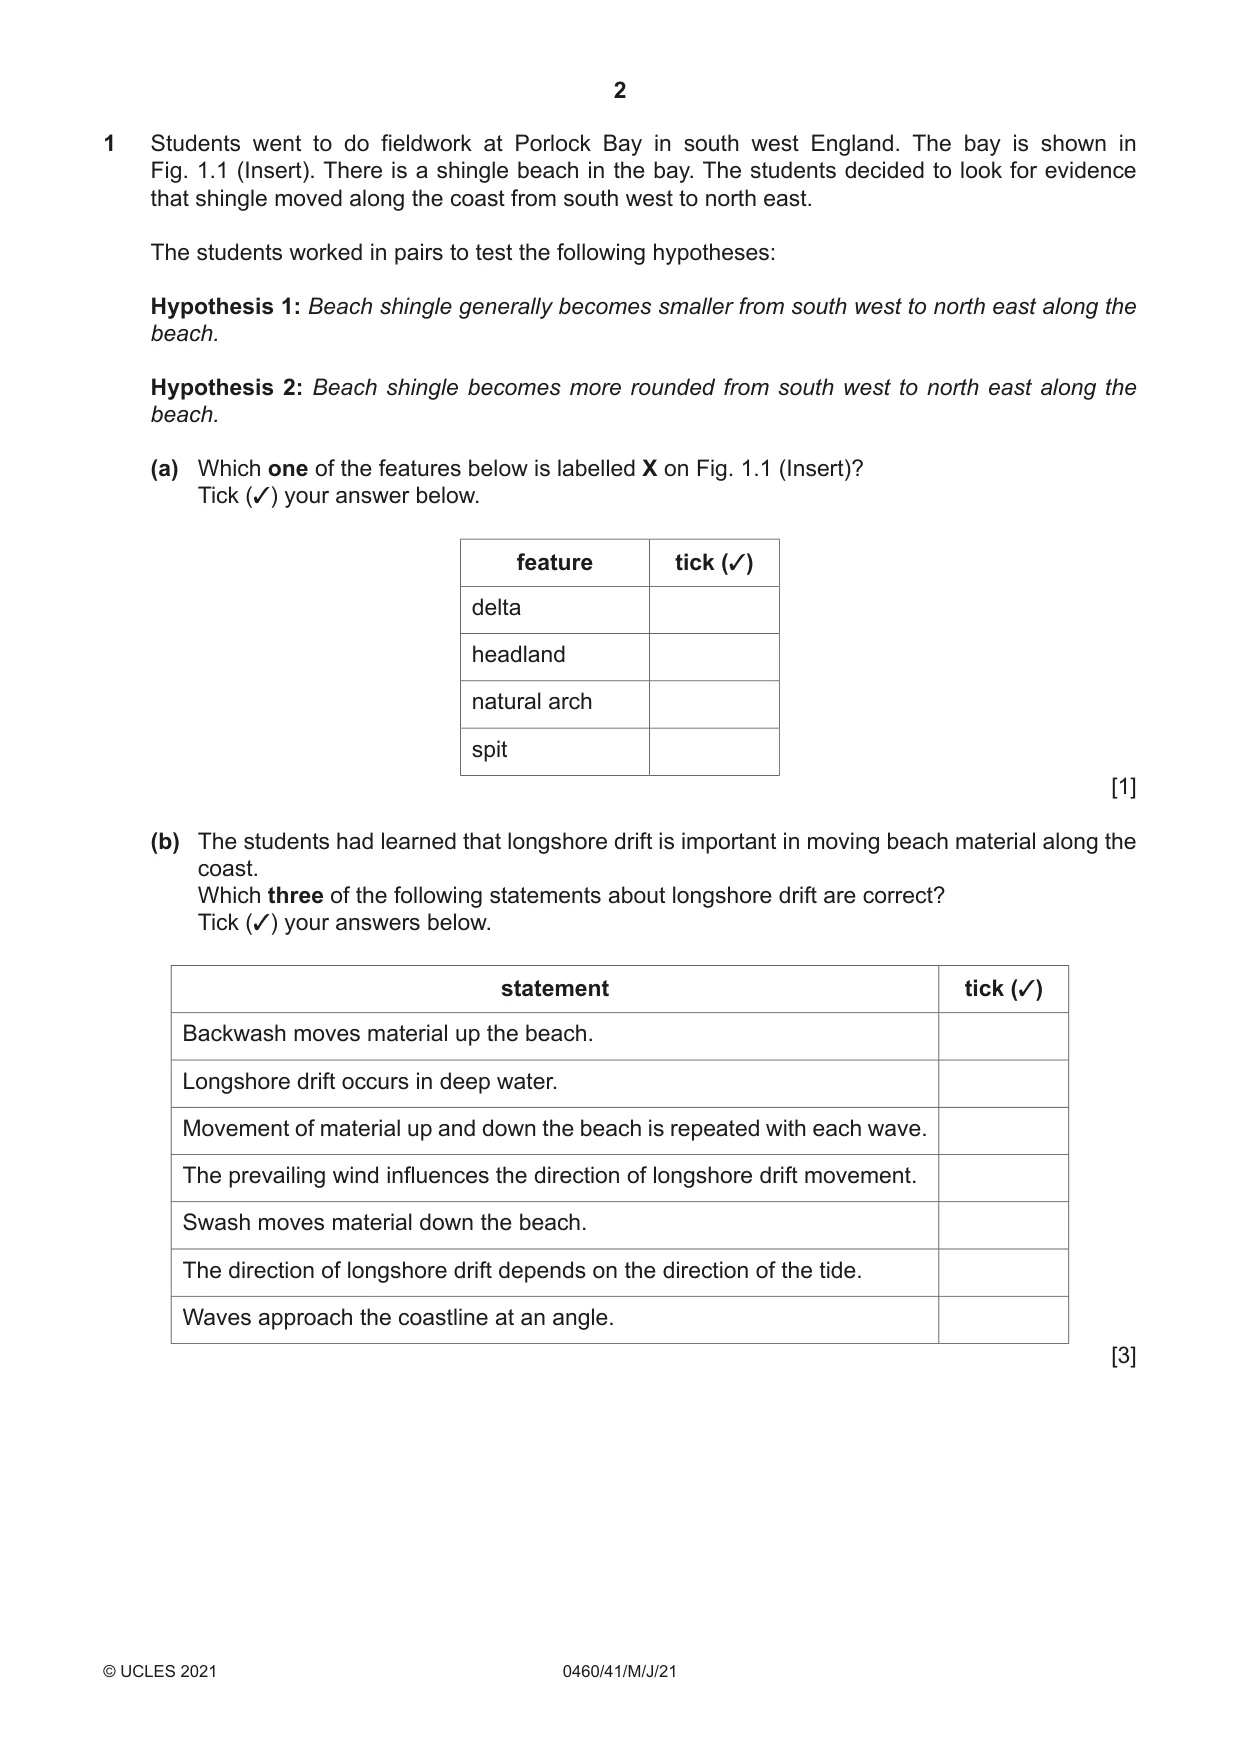
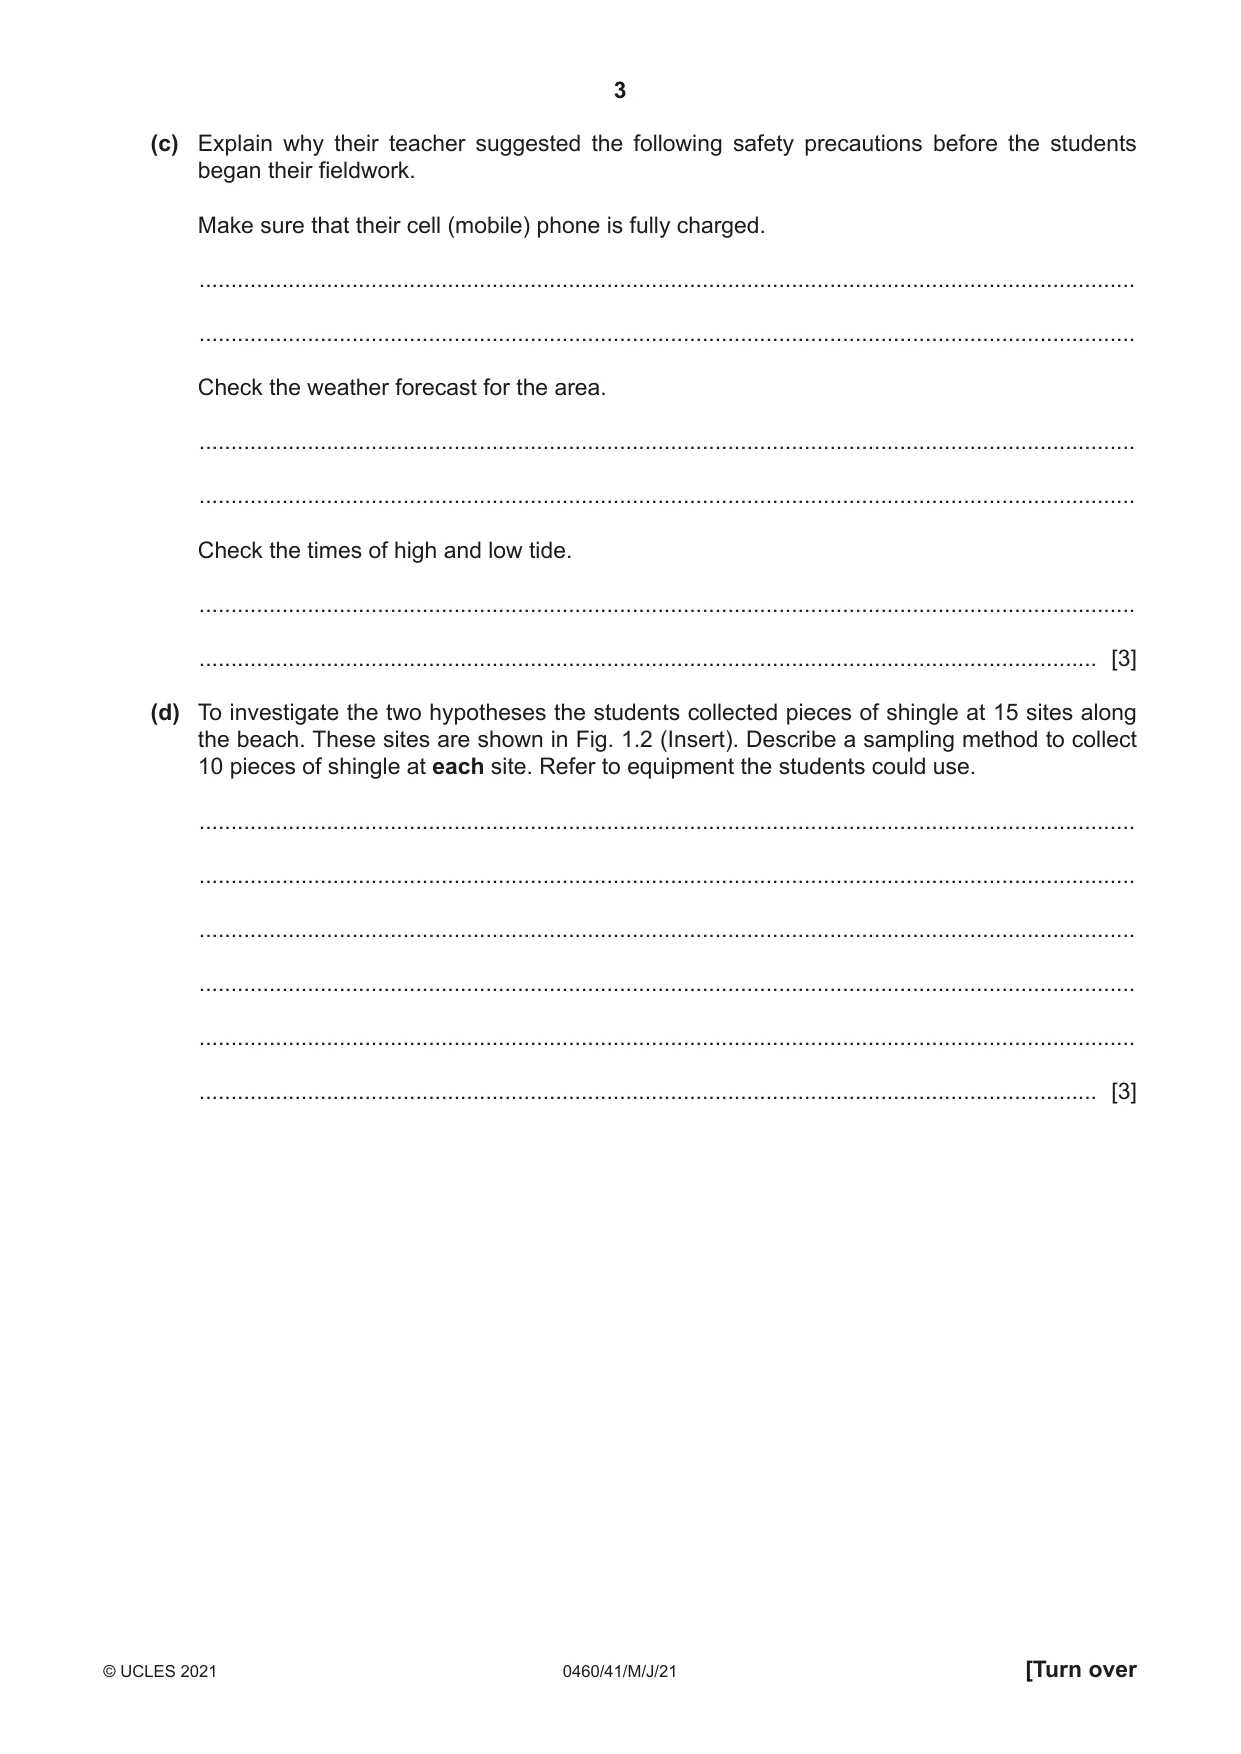
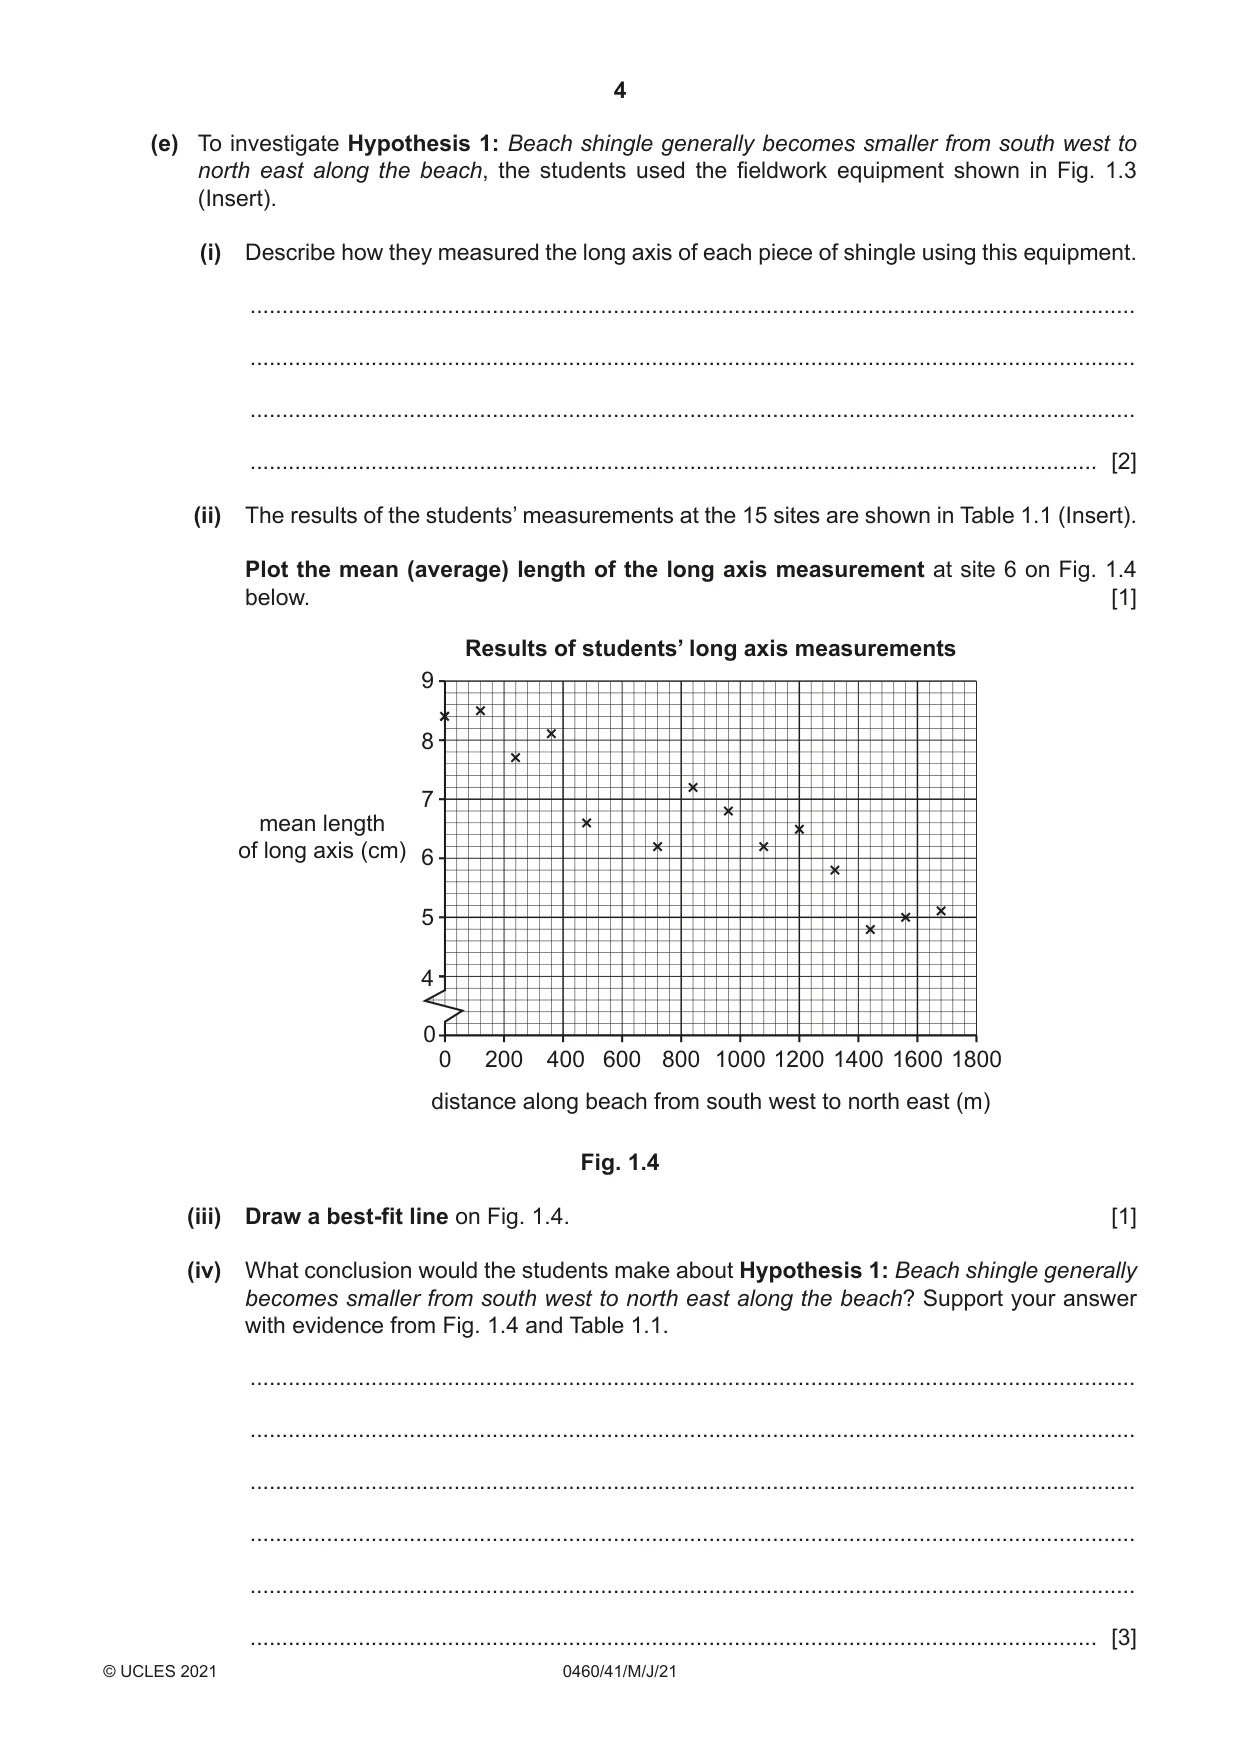
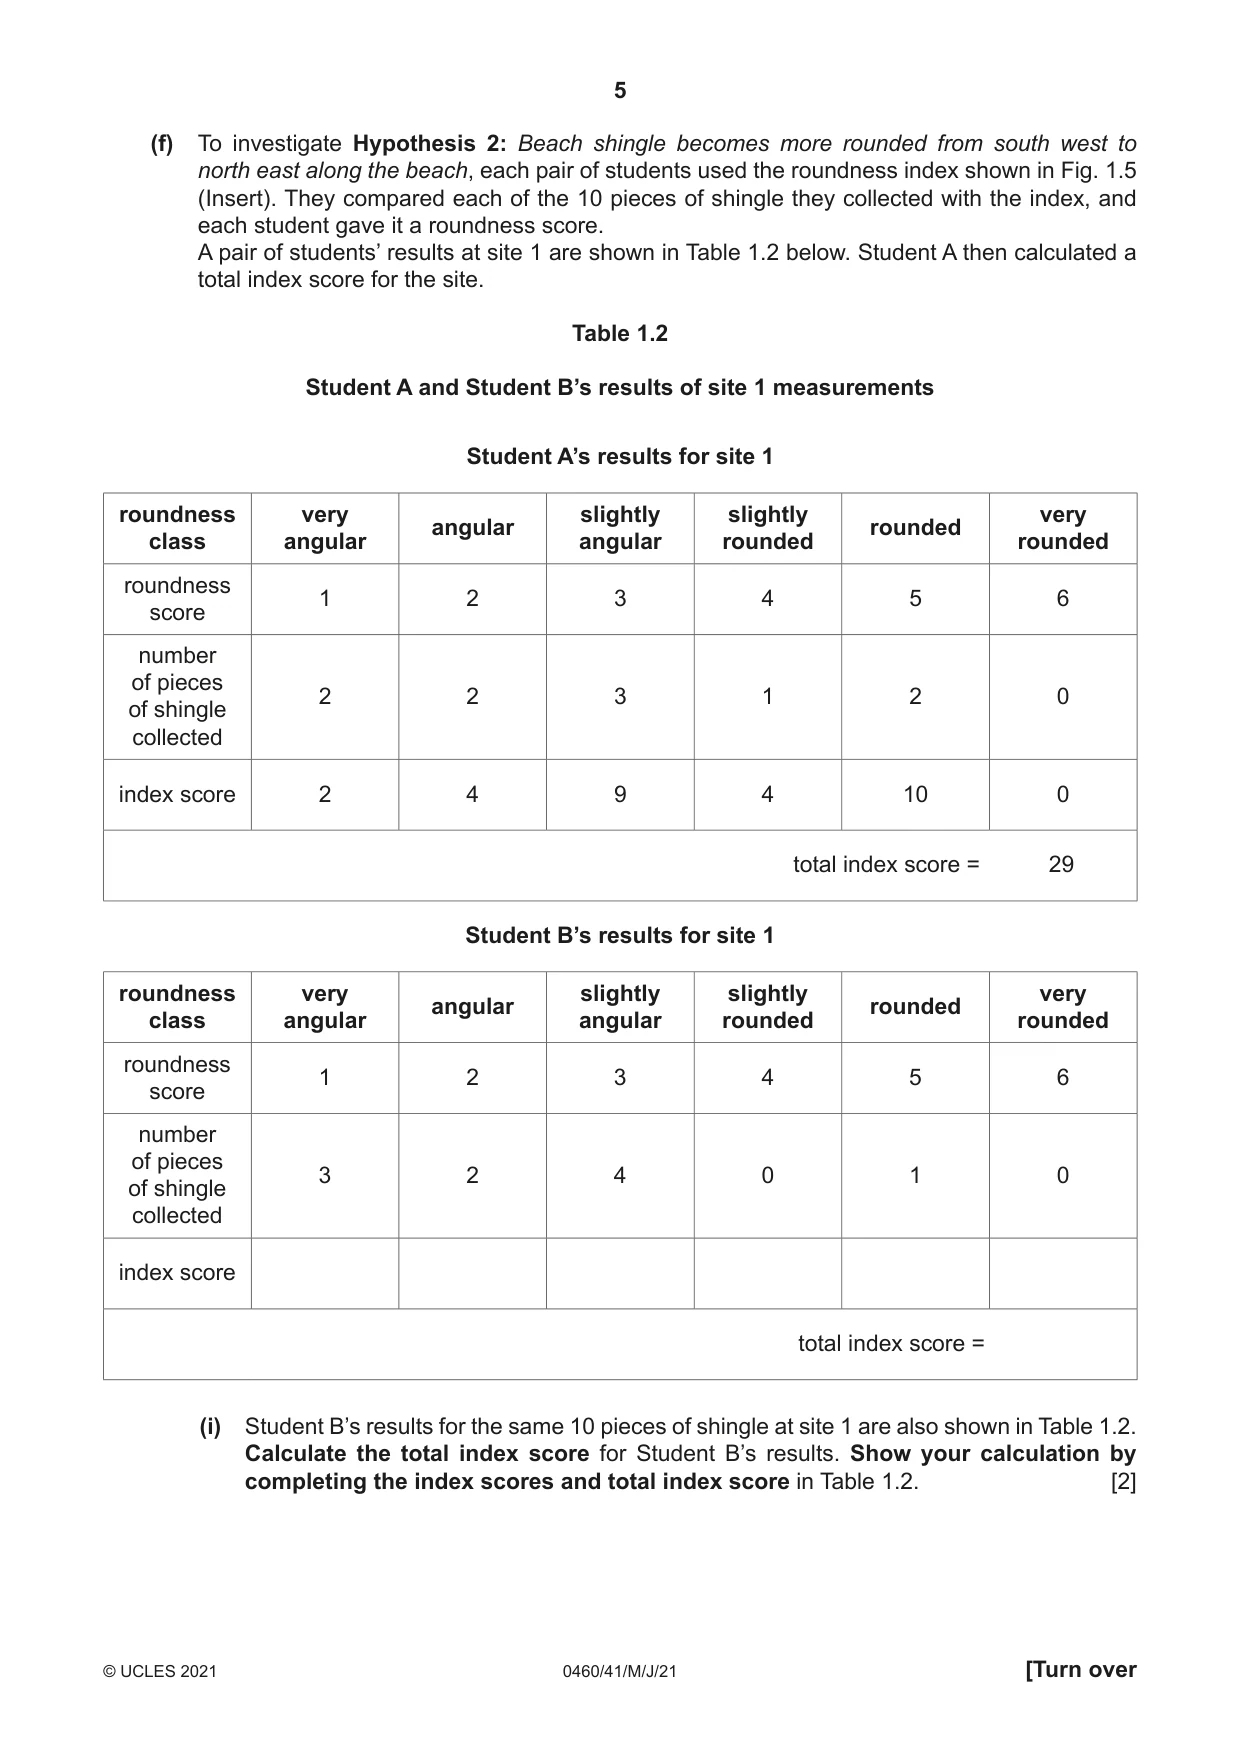
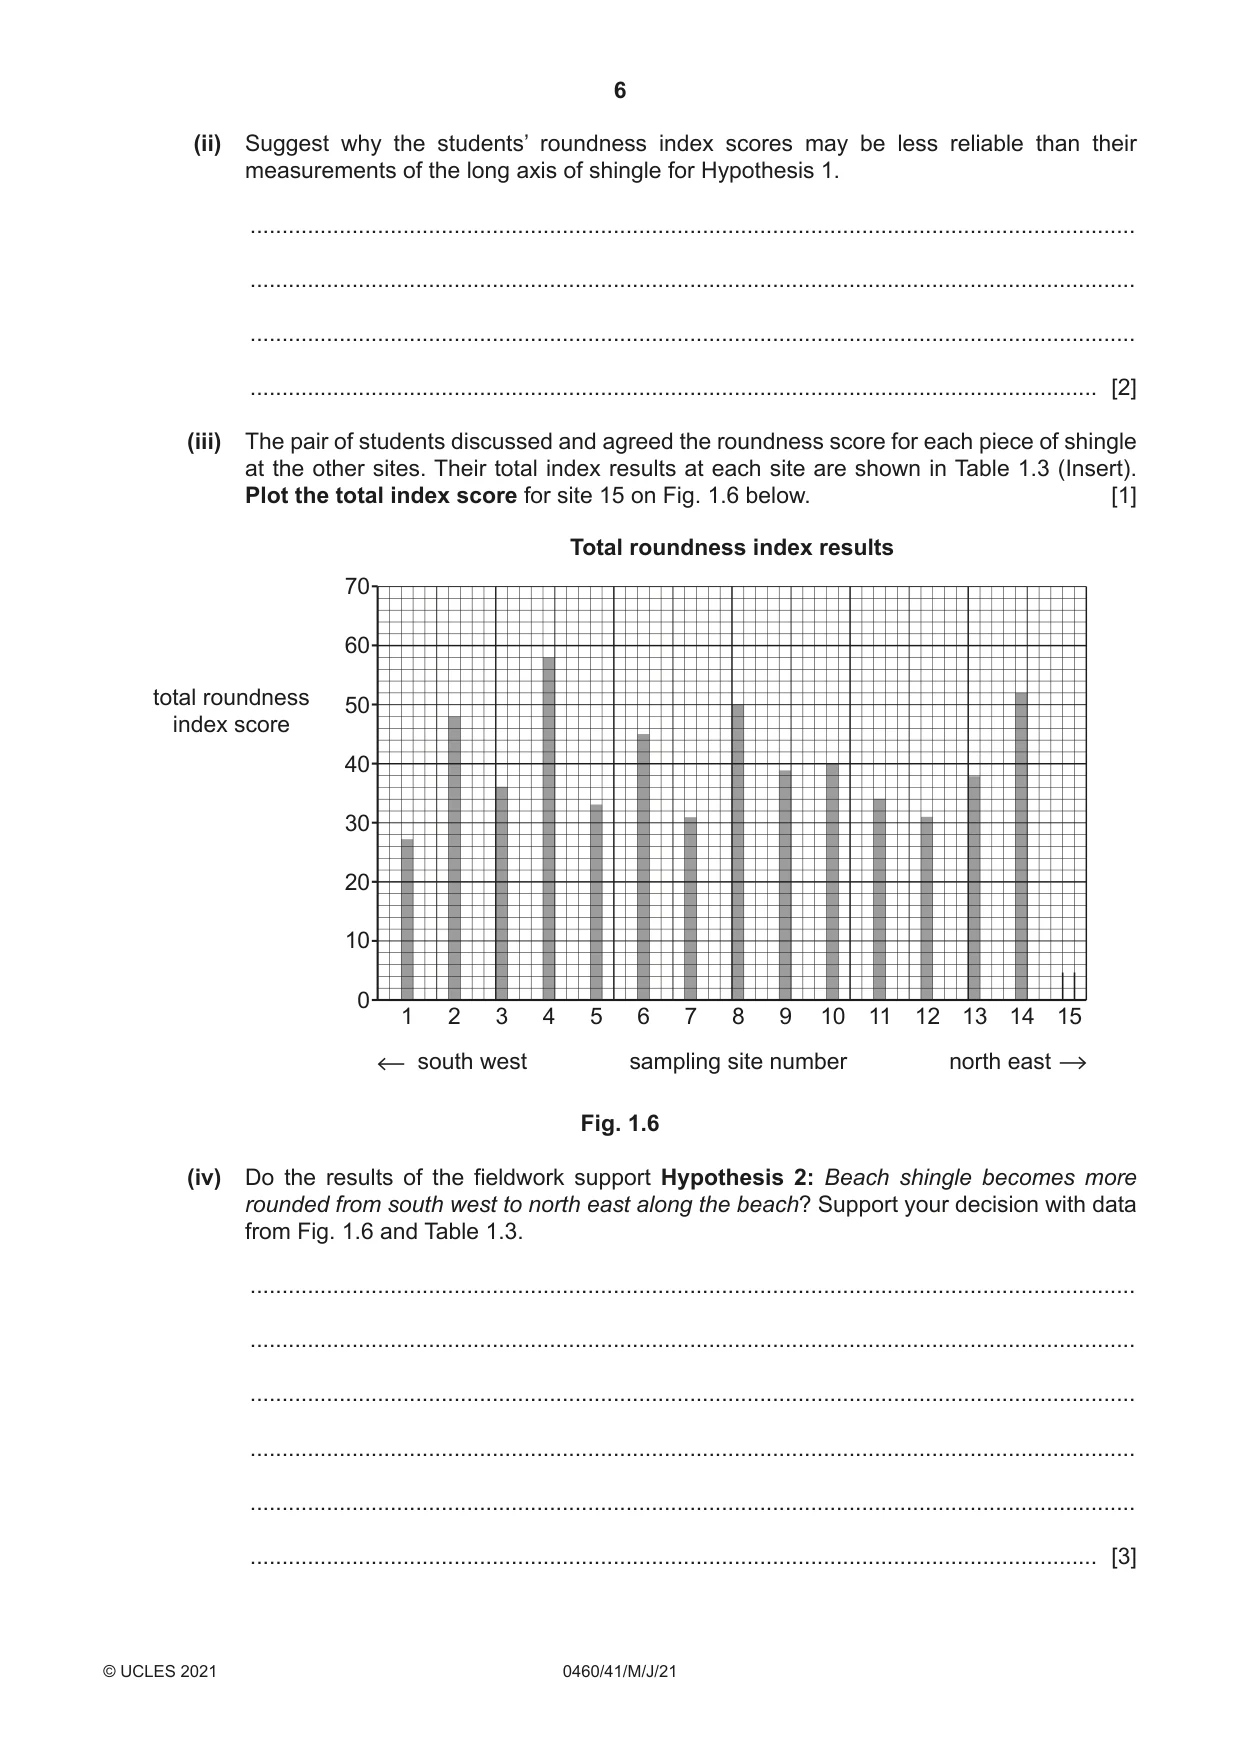
1 Students went to do fieldwork at Porlock Bay in south west England. The bay is shown in Fig. 1.1 (Insert). There is a shingle beach in the bay. The students decided to look for evidence that shingle moved along the coast from south west to north east. The students worked in pairs to test the following hypotheses: Hypothesis 1: Beach shingle generally becomes smaller from south west to north east along the beach. Hypothesis 2: Beach shingle becomes more rounded from south west to north east along the beach. (a) Which one of the features below is labelled X on Fig. 1.1 (Insert)? Tick (3) your answer below. feature tick (3) delta headland natural arch spit [1] (b) The students had learned that longshore drift is important in moving beach material along the coast. Which three of the following statements about longshore drift are correct? Tick (3) your answers below. statement tick (3) Backwash moves material up the beach. Longshore drift occurs in deep water. Movement of material up and down the beach is repeated with each wave. The prevailing wind influences the direction of longshore drift movement. Swash moves material down the beach. The direction of longshore drift depends on the direction of the tide. Waves approach the coastline at an angle. [3] (c) Explain why their teacher suggested the following safety precautions before the students began their fieldwork. Make sure that their cell (mobile) phone is fully charged. ................................................................................................................................................... ................................................................................................................................................... Check the weather forecast for the area. ................................................................................................................................................... ................................................................................................................................................... Check the times of high and low tide. ................................................................................................................................................... ............................................................................................................................................. [3] (d) To investigate the two hypotheses the students collected pieces of shingle at 15 sites along the beach. These sites are shown in Fig. 1.2 (Insert). Describe a sampling method to collect 10 pieces of shingle at each site. Refer to equipment the students could use. ................................................................................................................................................... ................................................................................................................................................... ................................................................................................................................................... ................................................................................................................................................... ................................................................................................................................................... ............................................................................................................................................. [3] (e) To investigate Hypothesis 1: Beach shingle generally becomes smaller from south west to north east along the beach, the students used the fieldwork equipment shown in Fig. 1.3 (Insert). (i) Describe how they measured the long axis of each piece of shingle using this equipment. ........................................................................................................................................... ........................................................................................................................................... ........................................................................................................................................... ..................................................................................................................................... [2] (ii) The results of the students’ measurements at the 15 sites are shown in Table 1.1 (Insert). Plot the mean (average) length of the long axis measurement at site 6 on Fig. 1.4 below. [1] Results of students’ long axis measurements 9 8 7 mean length of long axis (cm) 6 5 4 0 0 200 400 600 800 1000 1200 1400 1600 1800 distance along beach from south west to north east (m) Fig. 1.4 (iii) Draw a best-fit line on Fig. 1.4. [1] (iv) What conclusion would the students make about Hypothesis 1: Beach shingle generally becomes smaller from south west to north east along the beach? Support your answer with evidence from Fig. 1.4 and Table 1.1. ........................................................................................................................................... ........................................................................................................................................... ........................................................................................................................................... ........................................................................................................................................... ........................................................................................................................................... ..................................................................................................................................... [3] (f) To investigate Hypothesis 2: Beach shingle becomes more rounded from south west to north east along the beach, each pair of students used the roundness index shown in Fig. 1.5 (Insert). They compared each of the 10 pieces of shingle they collected with the index, and each student gave it a roundness score. A pair of students’ results at site 1 are shown in Table 1.2 below. Student A then calculated a total index score for the site. Table 1.2 Student A and Student B’s results of site 1 measurements Student A’s results for site 1 roundness very slightly slightly very angular rounded class angular angular rounded rounded roundness 1 2 3 4 5 6 score number of pieces 2 2 3 1 2 0 of shingle collected index score 2 4 9 4 10 0 total index score = 29 Student B’s results for site 1 roundness very slightly slightly very angular rounded class angular angular rounded rounded roundness 1 2 3 4 5 6 score number of pieces 3 2 4 0 1 0 of shingle collected index score total index score = (i) Student B’s results for the same 10 pieces of shingle at site 1 are also shown in Table 1.2. Calculate the total index score for Student B’s results. Show your calculation by completing the index scores and total index score in Table 1.2. [2] (ii) Suggest why the students’ roundness index scores may be less reliable than their measurements of the long axis of shingle for Hypothesis 1. ........................................................................................................................................... ........................................................................................................................................... ........................................................................................................................................... ..................................................................................................................................... [2] (iii) The pair of students discussed and agreed the roundness score for each piece of shingle at the other sites. Their total index results at each site are shown in Table 1.3 (Insert). Plot the total index score for site 15 on Fig. 1.6 below. [1] Total roundness index results 70 60 total roundness 50 index score 40 30 20 10 0 1 2 3 4 5 6 7 8 9 10 11 12 13 14 15 south west sampling site number north east Fig. 1.6 (iv) Do the results of the fieldwork support Hypothesis 2: Beach shingle becomes more rounded from south west to north east along the beach? Support your decision with data from Fig. 1.6 and Table 1.3. ........................................................................................................................................... ........................................................................................................................................... ........................................................................................................................................... ........................................................................................................................................... ........................................................................................................................................... ..................................................................................................................................... [3] (g) In the west of Porlock Bay the students saw some groynes like the one shown in Fig. 1.7 (Insert). Explain why groynes are built on a beach. ................................................................................................................................................... ................................................................................................................................................... ................................................................................................................................................... ............................................................................................................................................. [2] (h) To extend their fieldwork the students measured wave frequency in Porlock Bay. Describe a method the students could use to measure wave frequency. ................................................................................................................................................... ................................................................................................................................................... ................................................................................................................................................... ................................................................................................................................................... ................................................................................................................................................... ............................................................................................................................................. [3] [Total: 30]
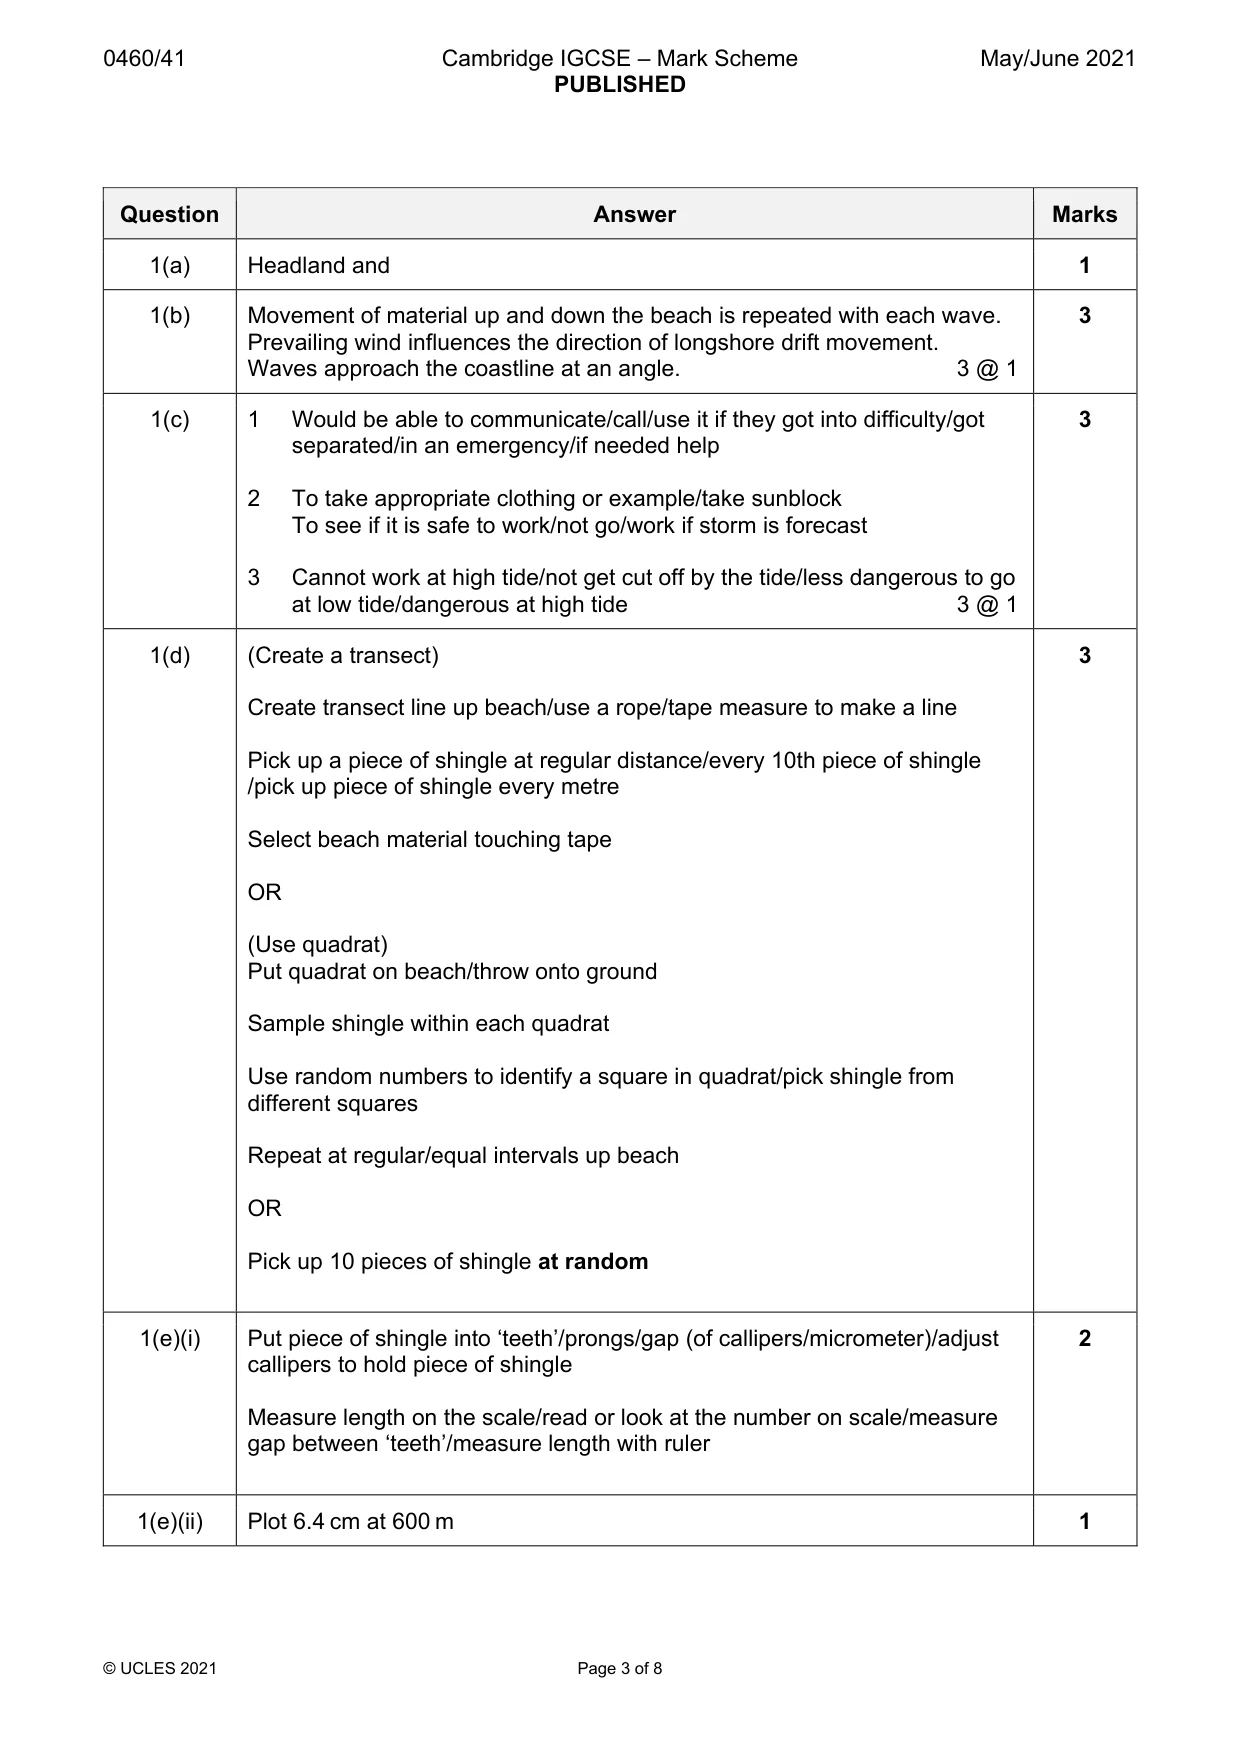
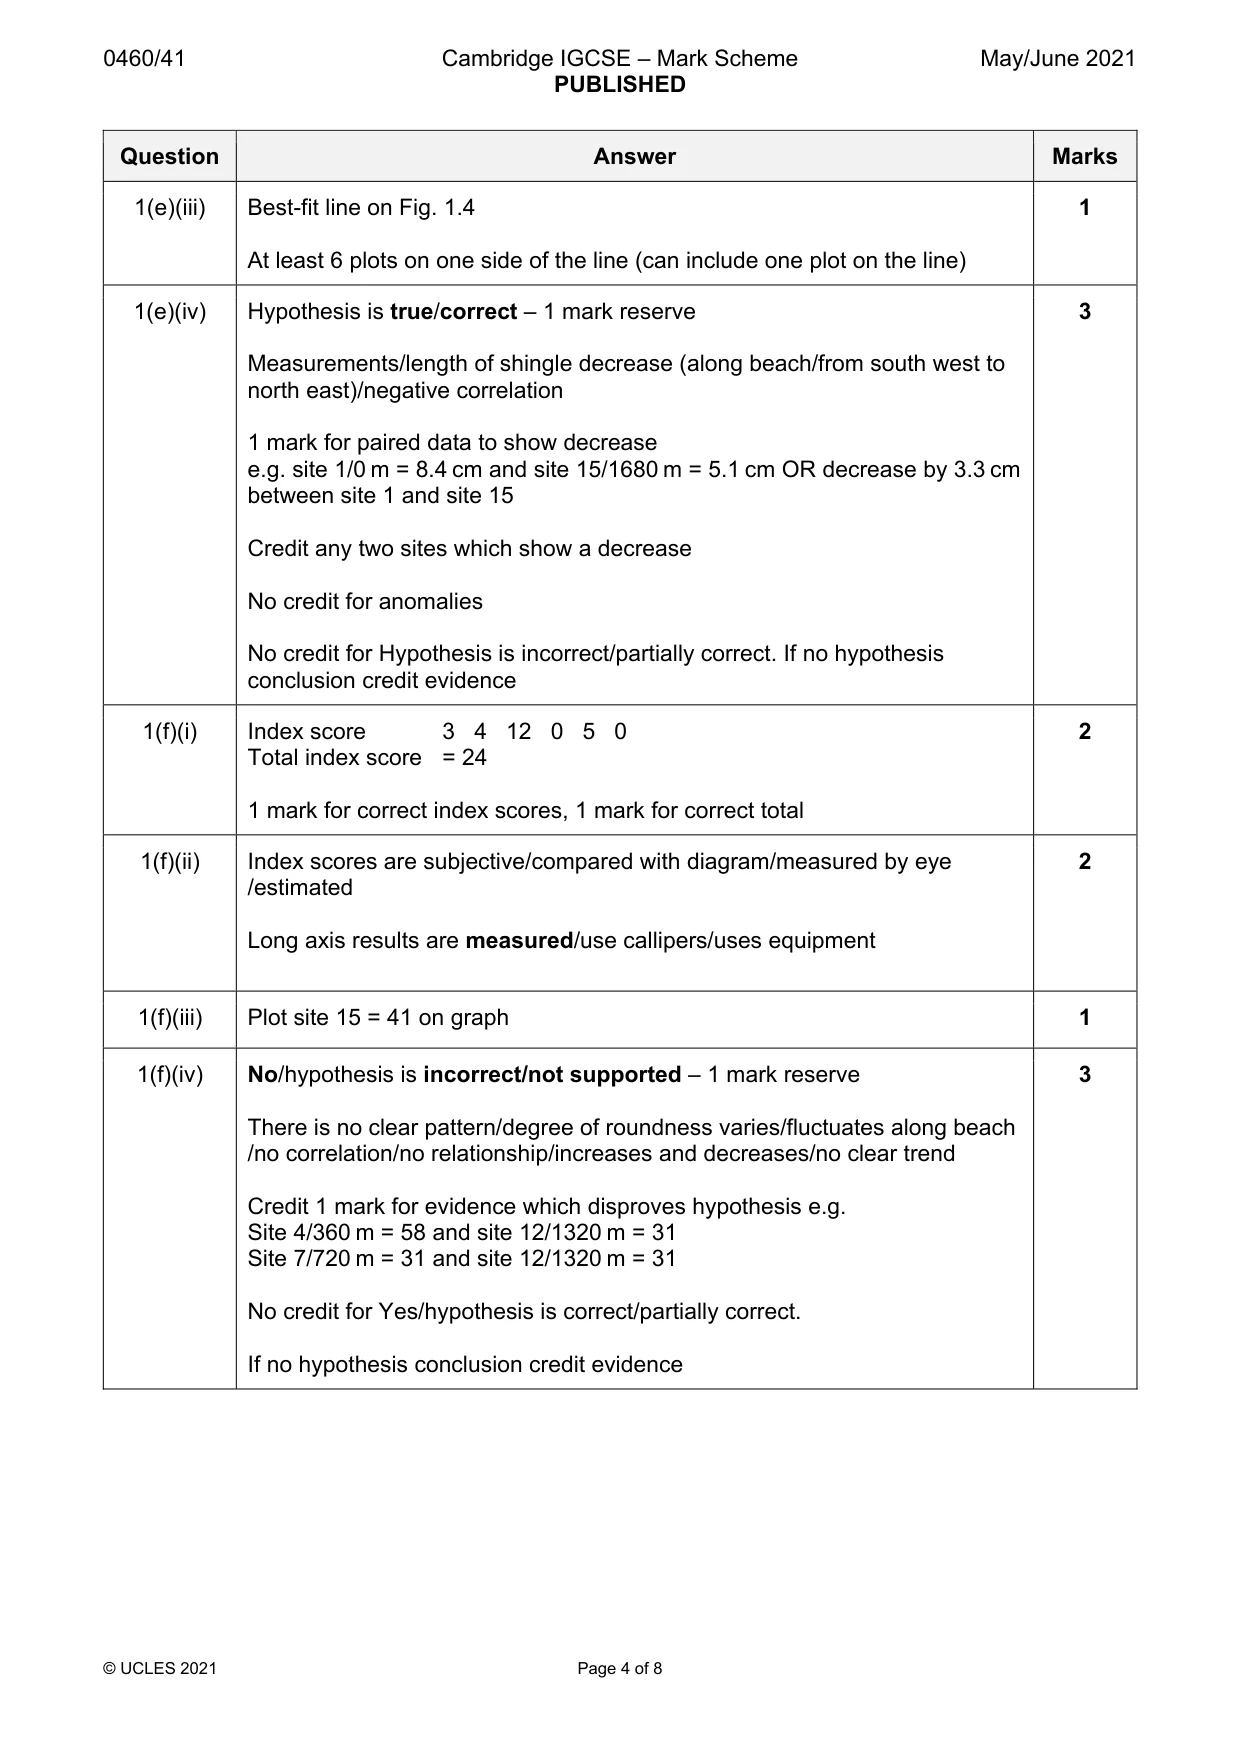
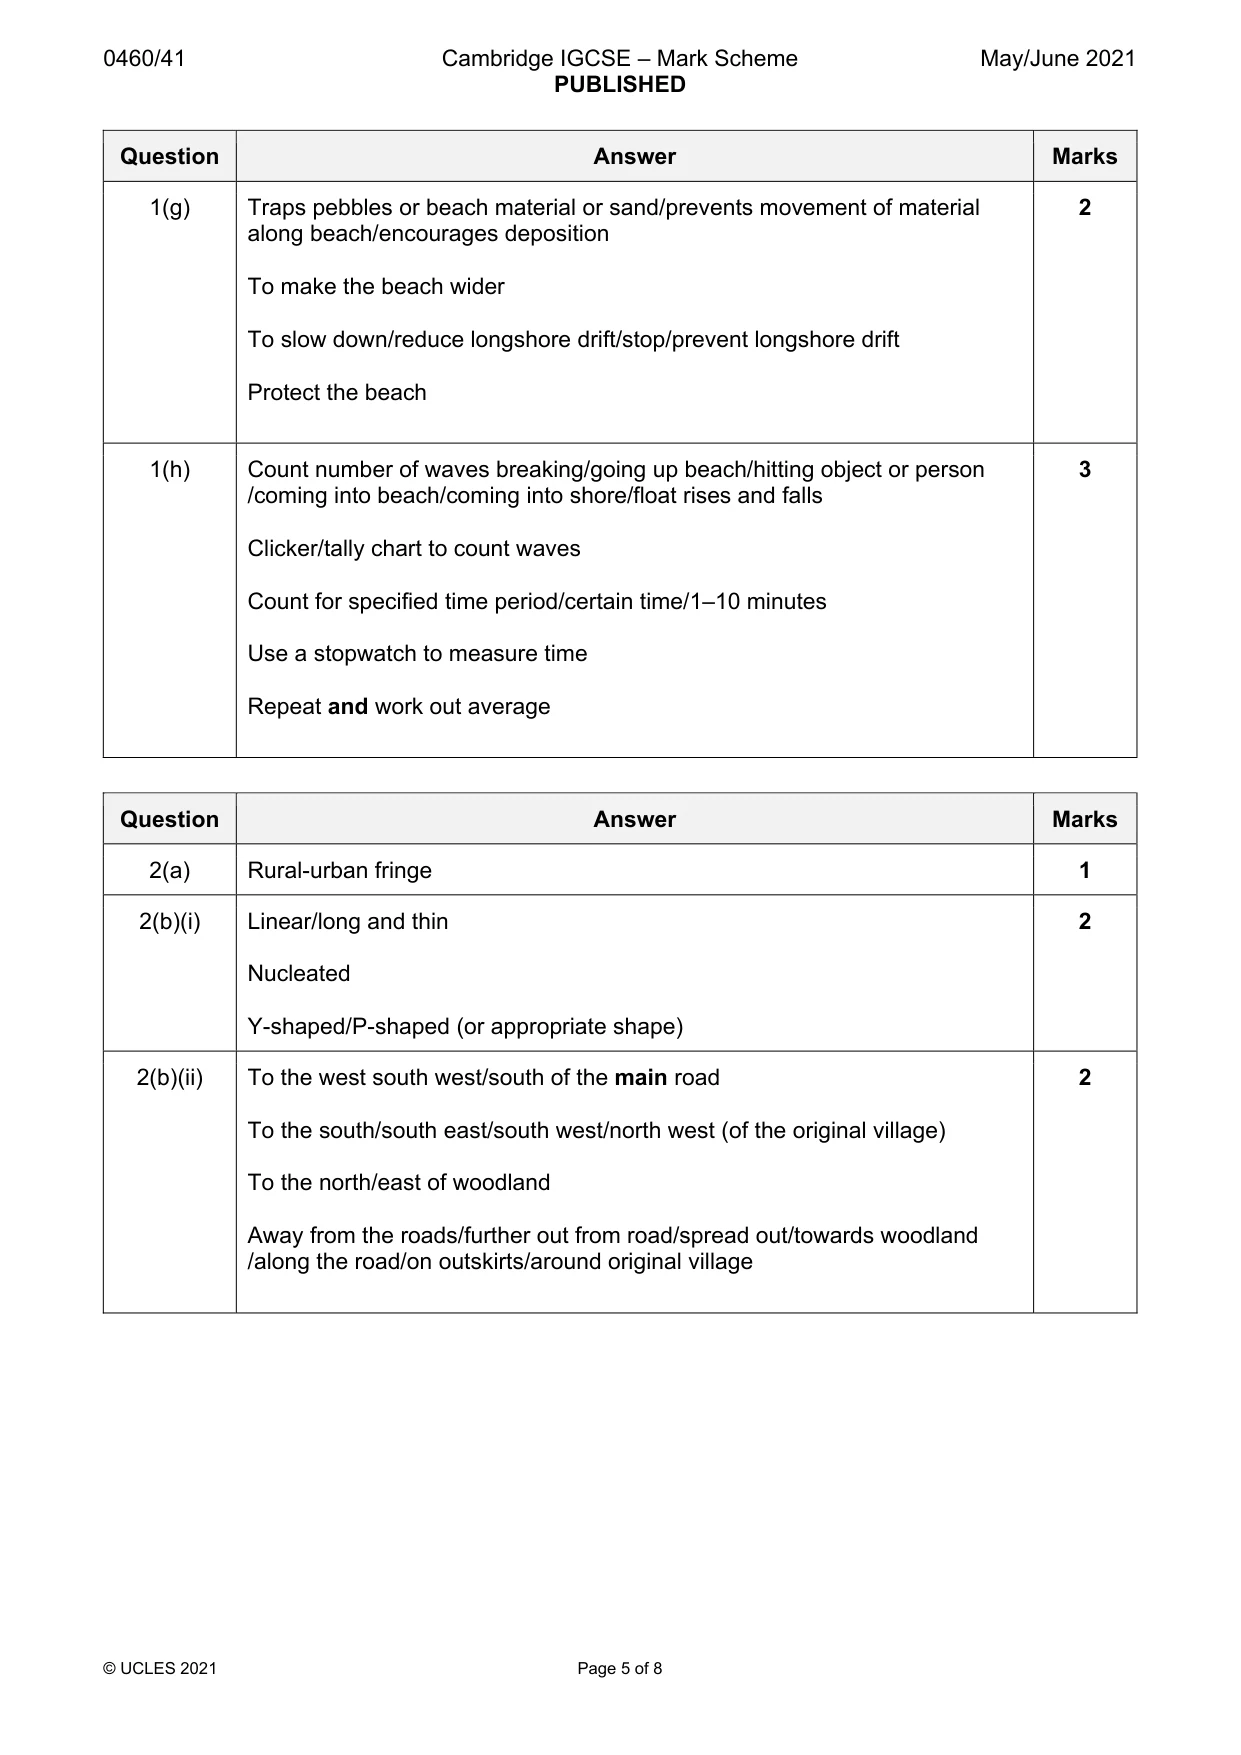
Mark scheme: Question Answer Marks 1(a) Headland and 1 1(b) Movement of material up and down the beach is repeated with each wave. 3 Prevailing wind influences the direction of longshore drift movement. Waves approach the coastline at an angle. 3 @ 1 1(c) 1 Would be able to communicate/call/use it if they got into difficulty/got 3 separated/in an emergency/if needed help 2 To take appropriate clothing or example/take sunblock To see if it is safe to work/not go/work if storm is forecast 3 Cannot work at high tide/not get cut off by the tide/less dangerous to go at low tide/dangerous at high tide 3 @ 1 1(d) (Create a transect) 3 Create transect line up beach/use a rope/tape measure to make a line Pick up a piece of shingle at regular distance/every 10th piece of shingle /pick up piece of shingle every metre Select beach material touching tape OR (Use quadrat) Put quadrat on beach/throw onto ground Sample shingle within each quadrat Use random numbers to identify a square in quadrat/pick shingle from different squares Repeat at regular/equal intervals up beach OR Pick up 10 pieces of shingle at random 1(e)(i) Put piece of shingle into ‘teeth’/prongs/gap (of callipers/micrometer)/adjust 2 callipers to hold piece of shingle Measure length on the scale/read or look at the number on scale/measure gap between ‘teeth’/measure length with ruler 1(e)(ii) Plot 6.4 cm at 600 m 1 1(e)(iii) Best-fit line on Fig. 1.4 1 At least 6 plots on one side of the line (can include one plot on the line) 1(e)(iv) Hypothesis is true/correct – 1 mark reserve 3 Measurements/length of shingle decrease (along beach/from south west to north east)/negative correlation 1 mark for paired data to show decrease e.g. site 1/0 m = 8.4 cm and site 15/1680 m = 5.1 cm OR decrease by 3.3 cm between site 1 and site 15 Credit any two sites which show a decrease No credit for anomalies No credit for Hypothesis is incorrect/partially correct. If no hypothesis conclusion credit evidence 1(f)(i) Index score 3 4 12 0 5 0 2 Total index score = 24 1 mark for correct index scores, 1 mark for correct total 1(f)(ii) Index scores are subjective/compared with diagram/measured by eye 2 /estimated Long axis results are measured/use callipers/uses equipment 1(f)(iii) Plot site 15 = 41 on graph 1 1(f)(iv) No/hypothesis is incorrect/not supported – 1 mark reserve 3 There is no clear pattern/degree of roundness varies/fluctuates along beach /no correlation/no relationship/increases and decreases/no clear trend Credit 1 mark for evidence which disproves hypothesis e.g. Site 4/360 m = 58 and site 12/1320 m = 31 Site 7/720 m = 31 and site 12/1320 m = 31 No credit for Yes/hypothesis is correct/partially correct. If no hypothesis conclusion credit evidence 1(g) Traps pebbles or beach material or sand/prevents movement of material 2 along beach/encourages deposition To make the beach wider To slow down/reduce longshore drift/stop/prevent longshore drift Protect the beach 1(h) Count number of waves breaking/going up beach/hitting object or person 3 /coming into beach/coming into shore/float rises and falls Clicker/tally chart to count waves Count for specified time period/certain time/1–10 minutes Use a stopwatch to measure time Repeat and work out average
Q2 · Students who lived in a settlement near the edge of a large city in the UK were studying…
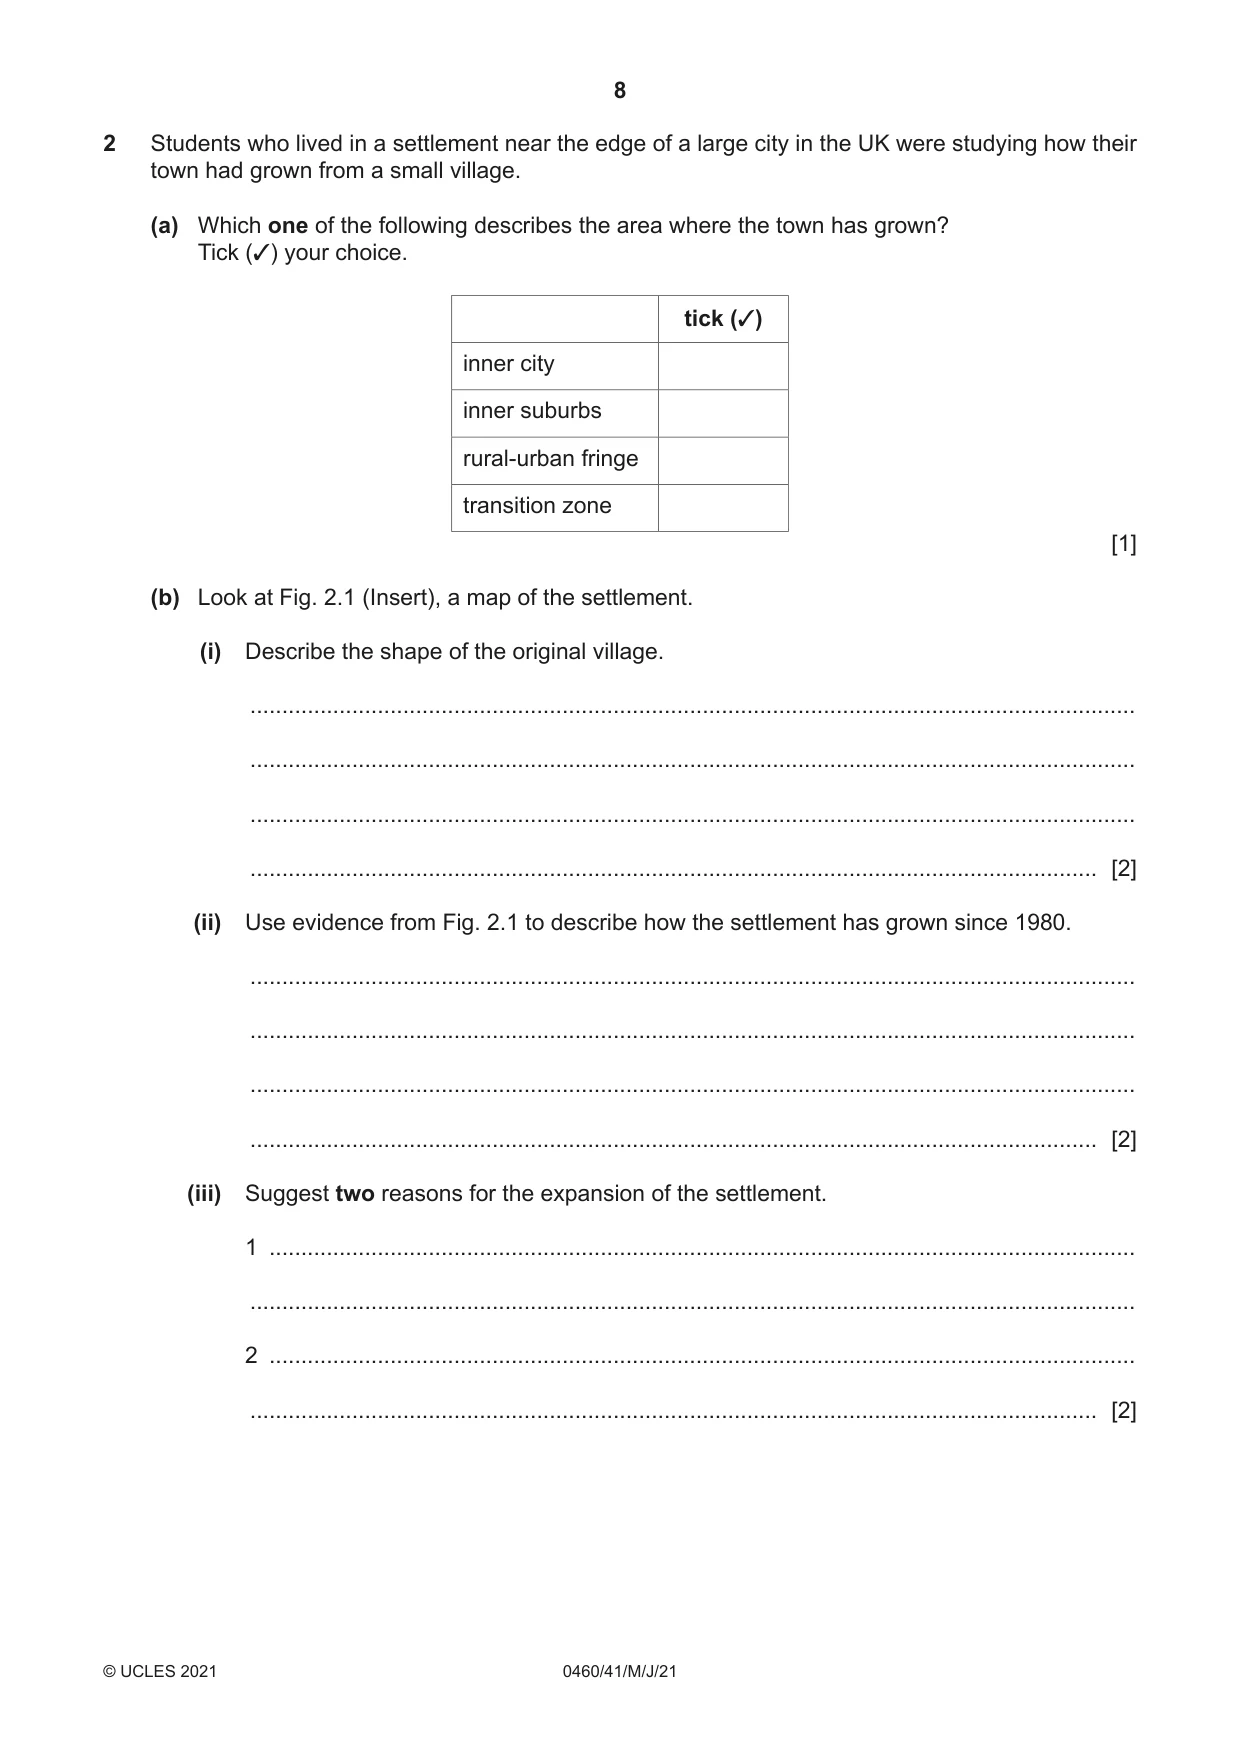
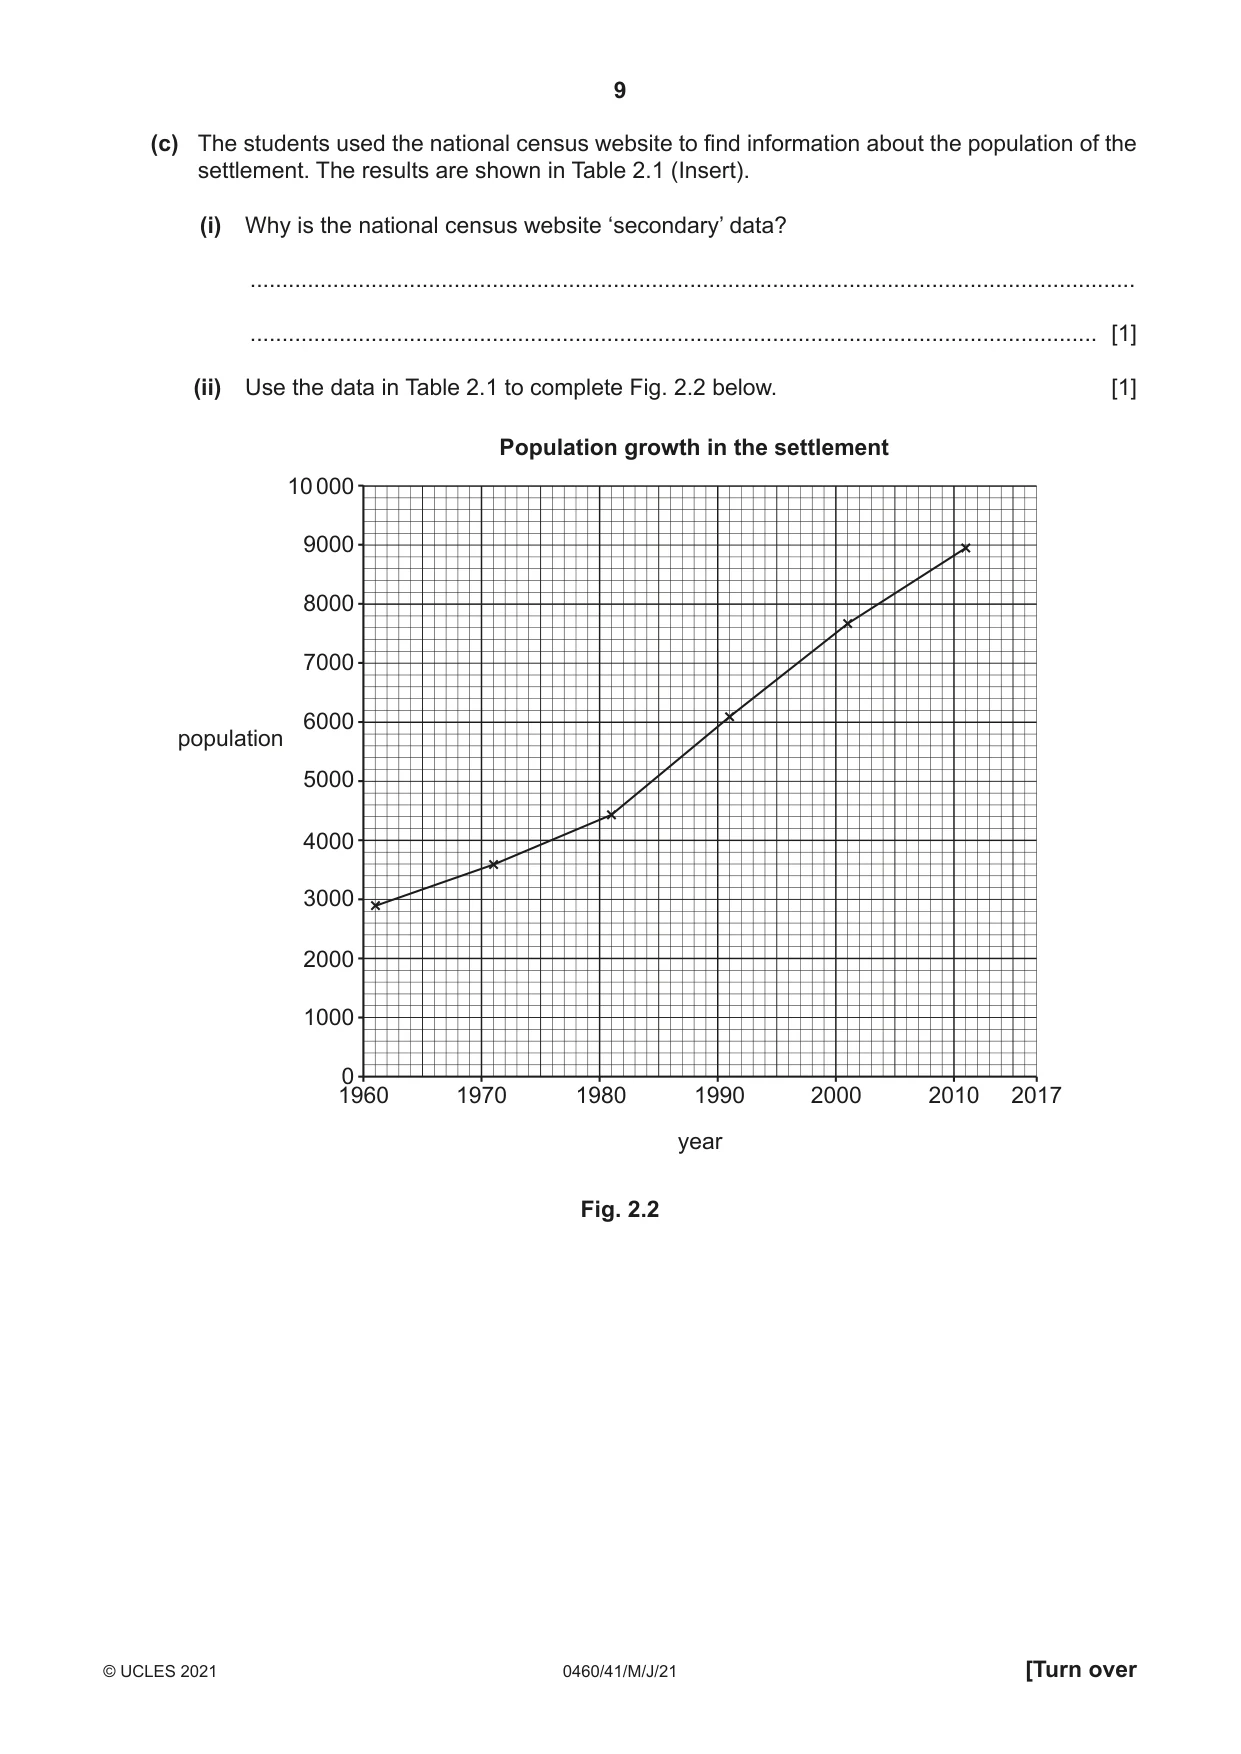
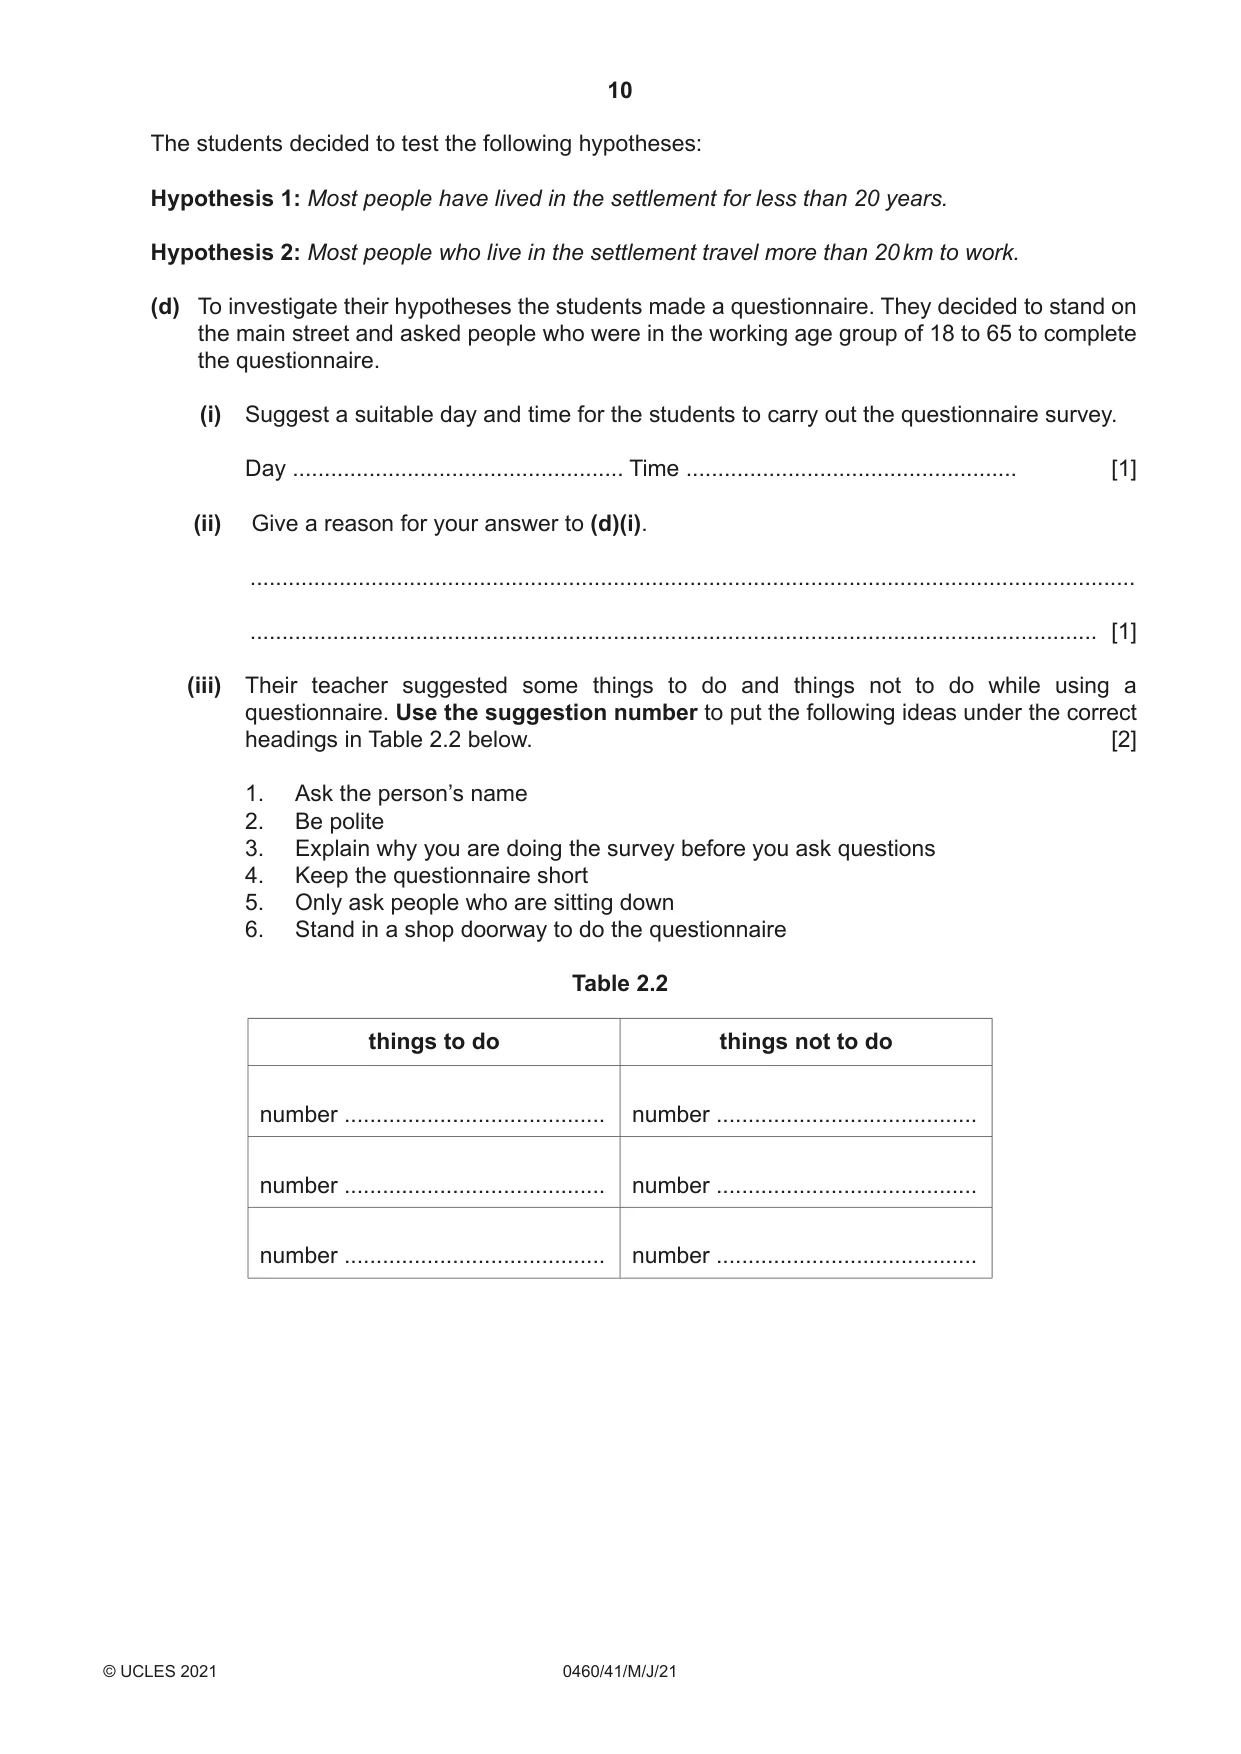
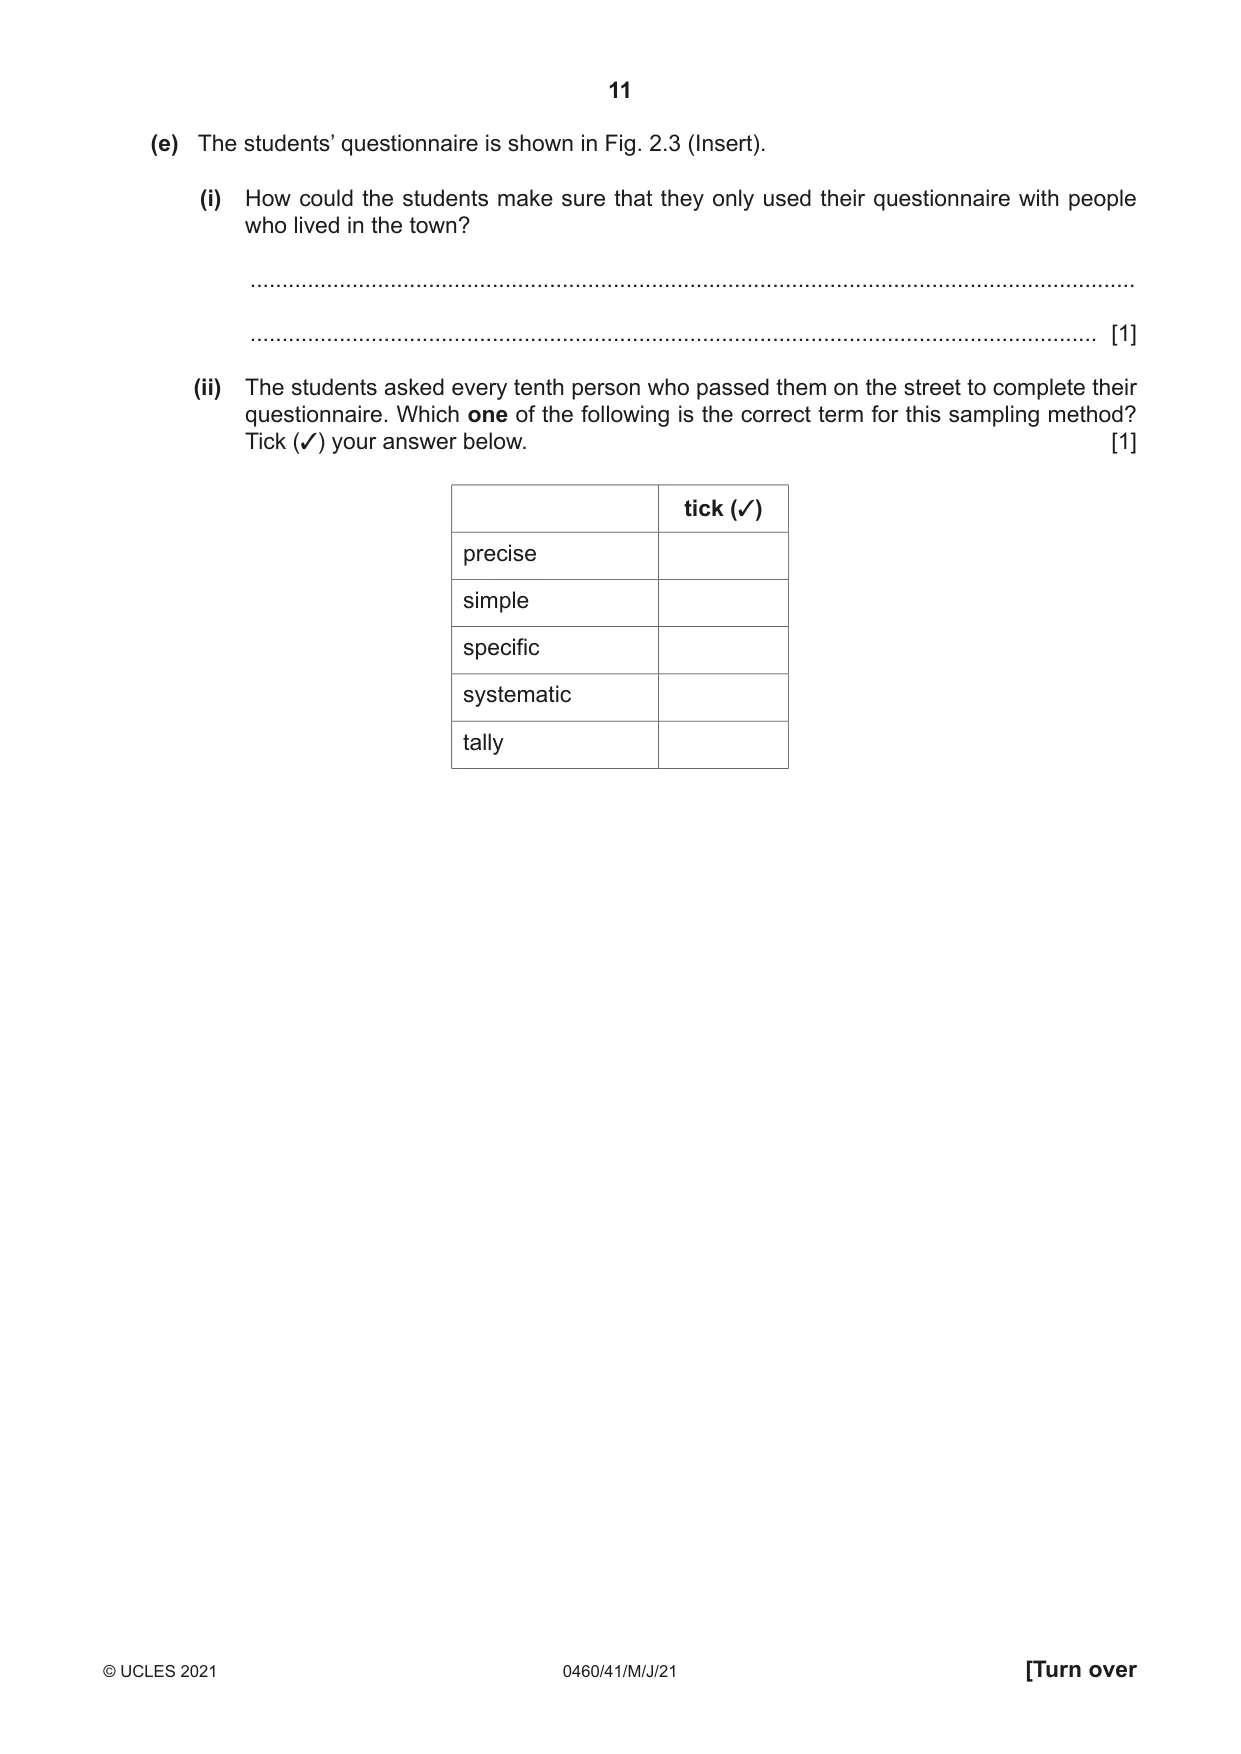
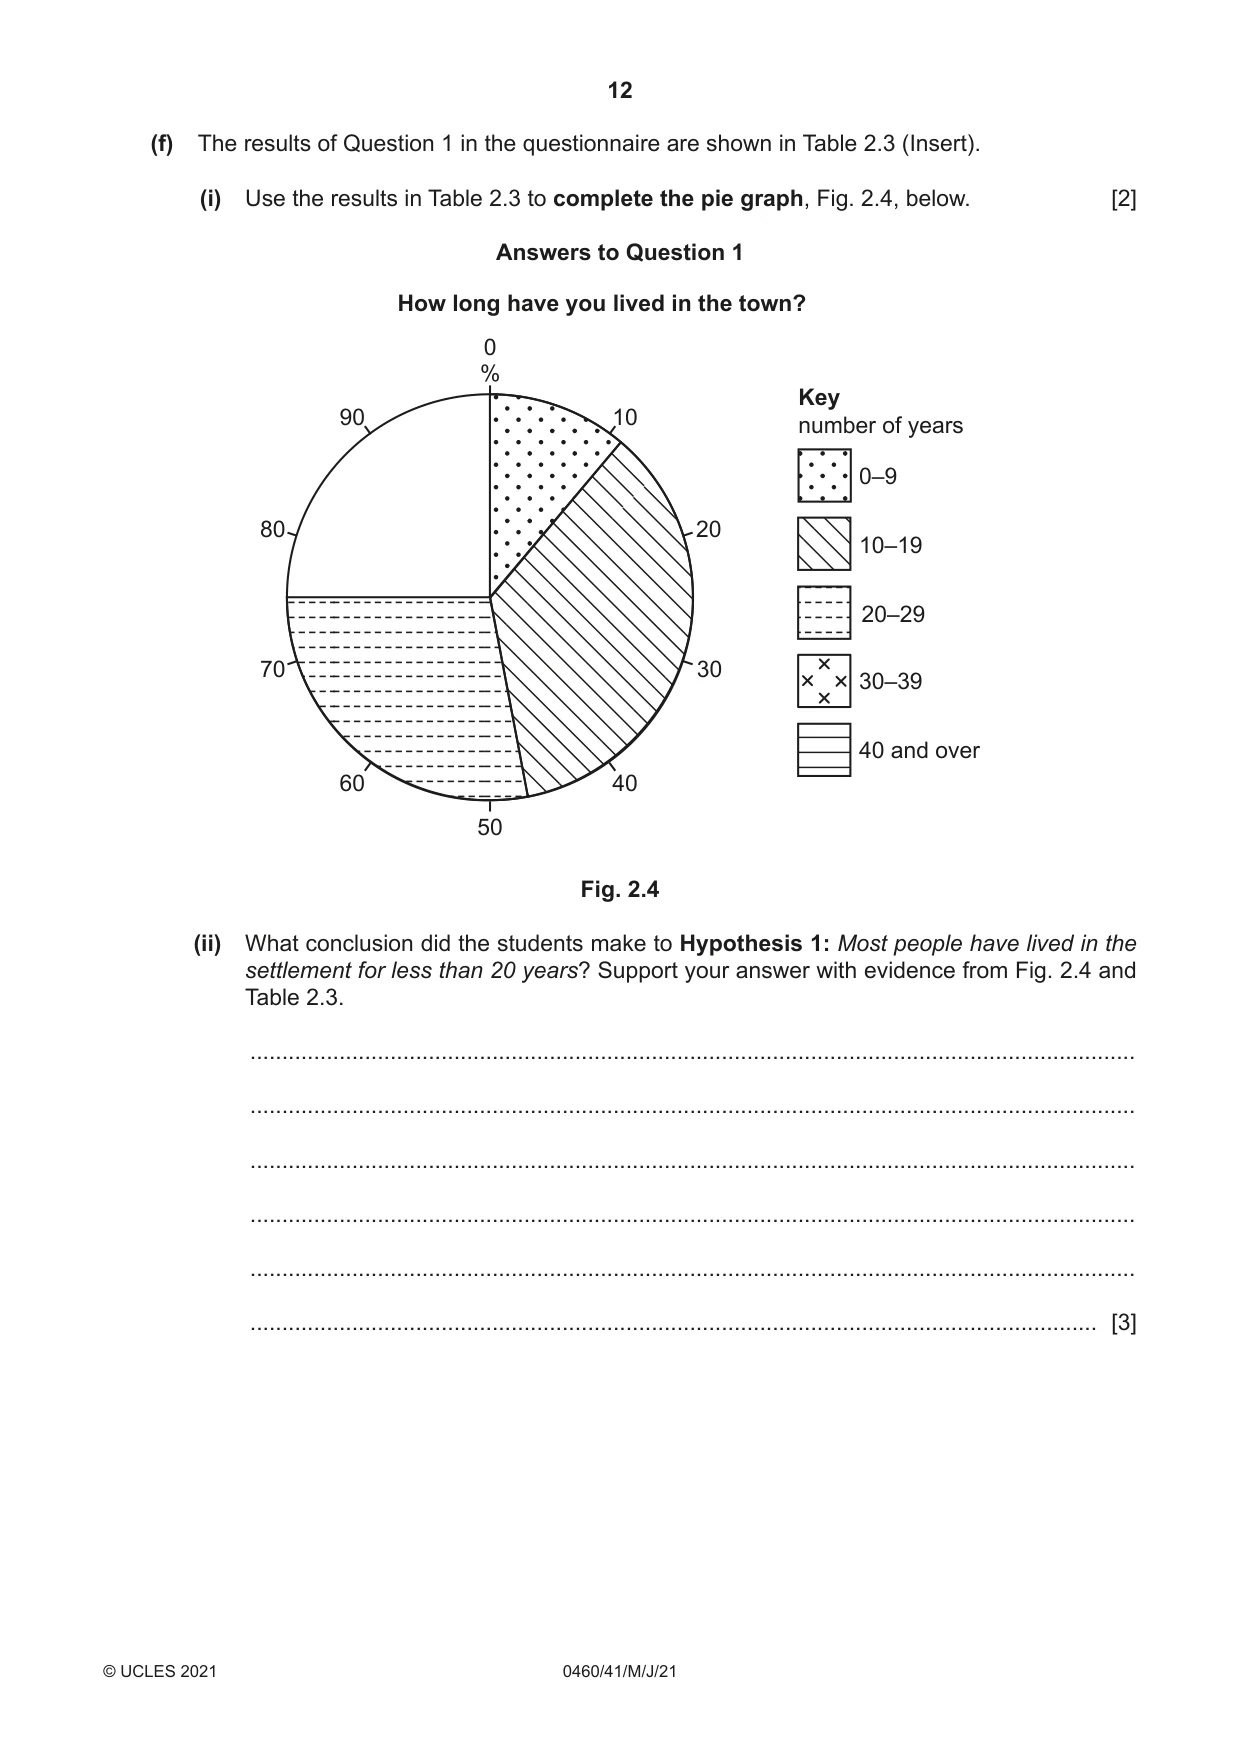
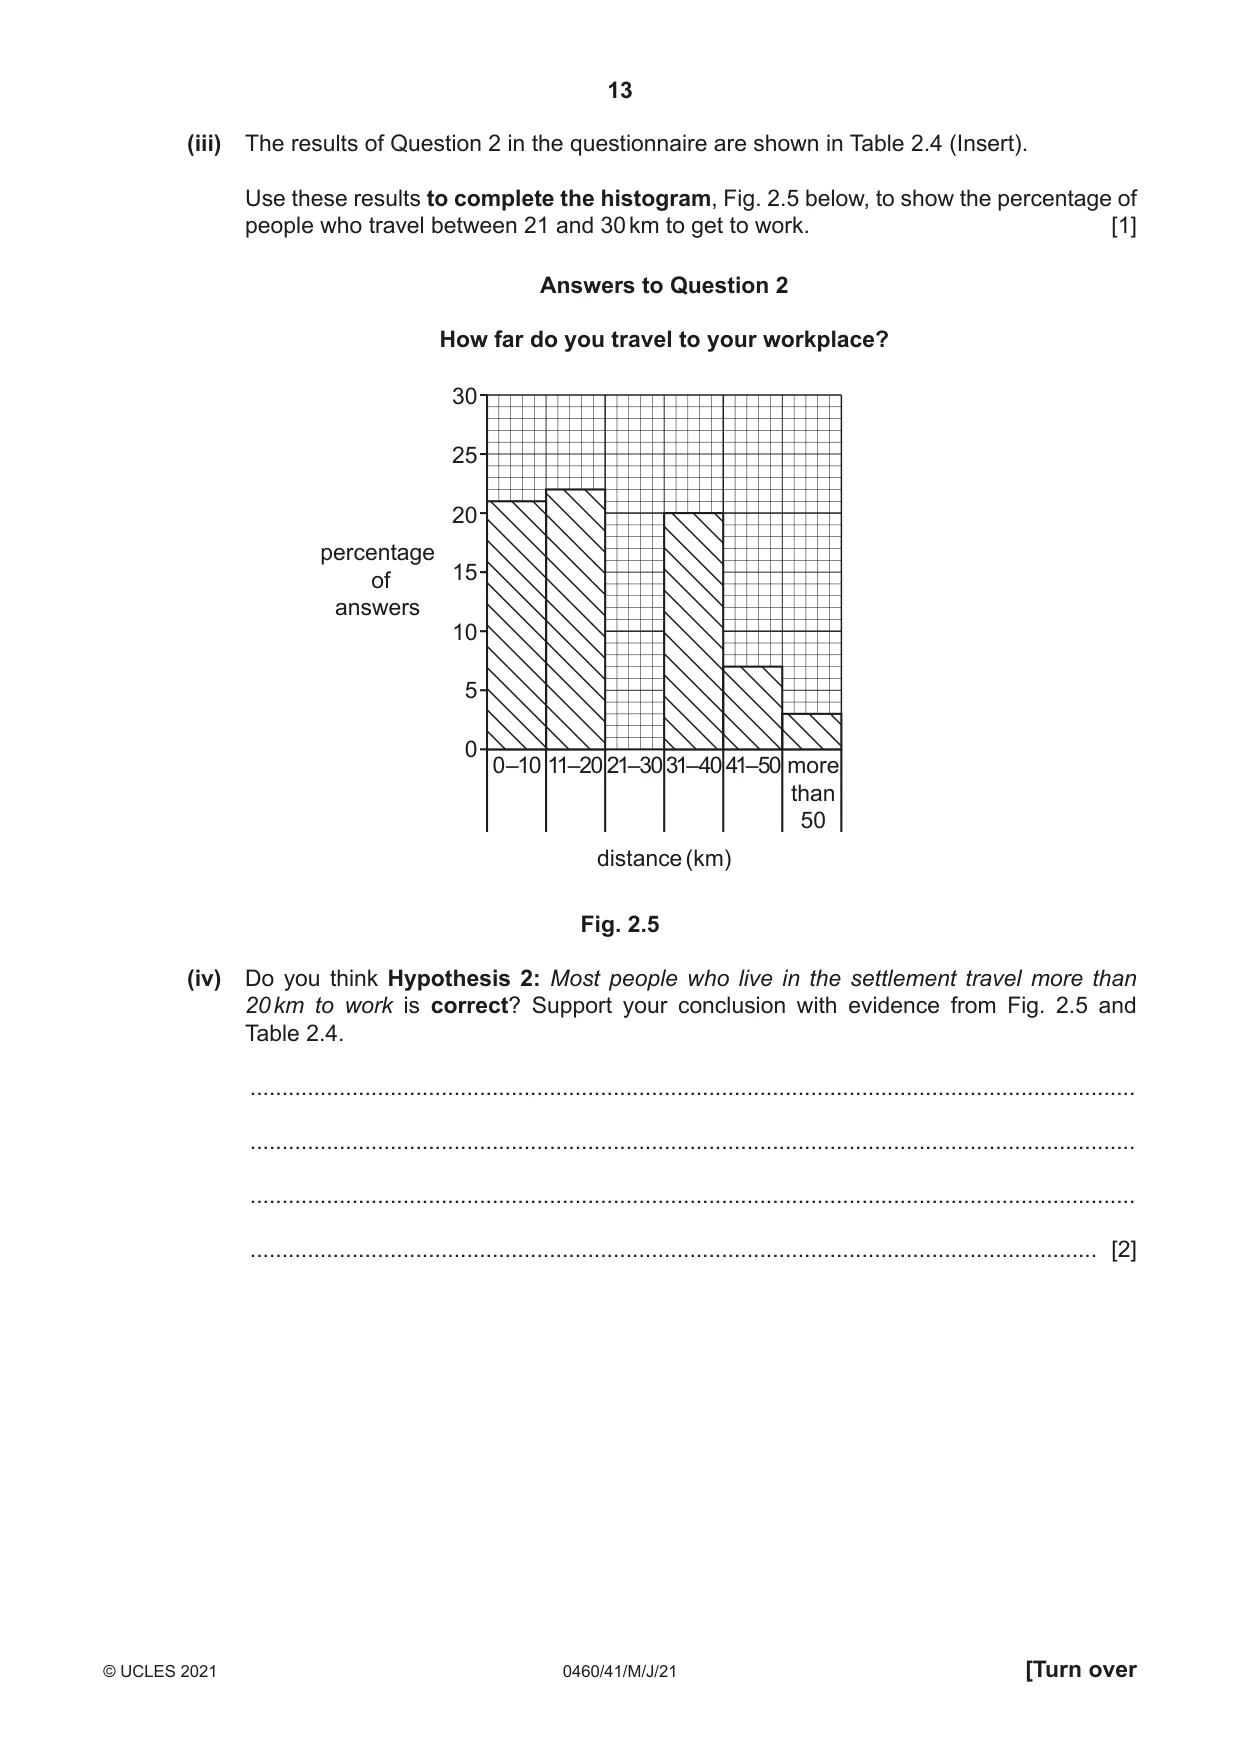
2 Students who lived in a settlement near the edge of a large city in the UK were studying how their town had grown from a small village. (a) Which one of the following describes the area where the town has grown? Tick (3) your choice. tick (3) inner city inner suburbs rural-urban fringe transition zone [1] (b) Look at Fig. 2.1 (Insert), a map of the settlement. (i) Describe the shape of the original village. ........................................................................................................................................... ........................................................................................................................................... ........................................................................................................................................... ..................................................................................................................................... [2] (ii) Use evidence from Fig. 2.1 to describe how the settlement has grown since 1980. ........................................................................................................................................... ........................................................................................................................................... ........................................................................................................................................... ..................................................................................................................................... [2] (iii) Suggest two reasons for the expansion of the settlement. 1 ........................................................................................................................................ ........................................................................................................................................... 2 ........................................................................................................................................ ..................................................................................................................................... [2] (c) The students used the national census website to find information about the population of the settlement. The results are shown in Table 2.1 (Insert). (i) Why is the national census website ‘secondary’ data? ........................................................................................................................................... ..................................................................................................................................... [1] (ii) Use the data in Table 2.1 to complete Fig. 2.2 below. [1] Population growth in the settlement 10 000 9000 8000 7000 6000 population 5000 4000 3000 2000 1000 0 1960 1970 1980 1990 2000 2010 2017 year Fig. 2.2 The students decided to test the following hypotheses: Hypothesis 1: Most people have lived in the settlement for less than 20 years. Hypothesis 2: Most people who live in the settlement travel more than 20 km to work. (d) To investigate their hypotheses the students made a questionnaire. They decided to stand on the main street and asked people who were in the working age group of 18 to 65 to complete the questionnaire. (i) Suggest a suitable day and time for the students to carry out the questionnaire survey. Day .................................................... Time .................................................... [1] (ii) Give a reason for your answer to (d)(i). ........................................................................................................................................... ..................................................................................................................................... [1] (iii) Their teacher suggested some things to do and things not to do while using a questionnaire. Use the suggestion number to put the following ideas under the correct headings in Table 2.2 below. [2] 1. Ask the person’s name 2. Be polite 3. Explain why you are doing the survey before you ask questions 4. Keep the questionnaire short 5. Only ask people who are sitting down 6. Stand in a shop doorway to do the questionnaire Table 2.2 things to do things not to do number ......................................... number ......................................... number ......................................... number ......................................... number ......................................... number .........................................
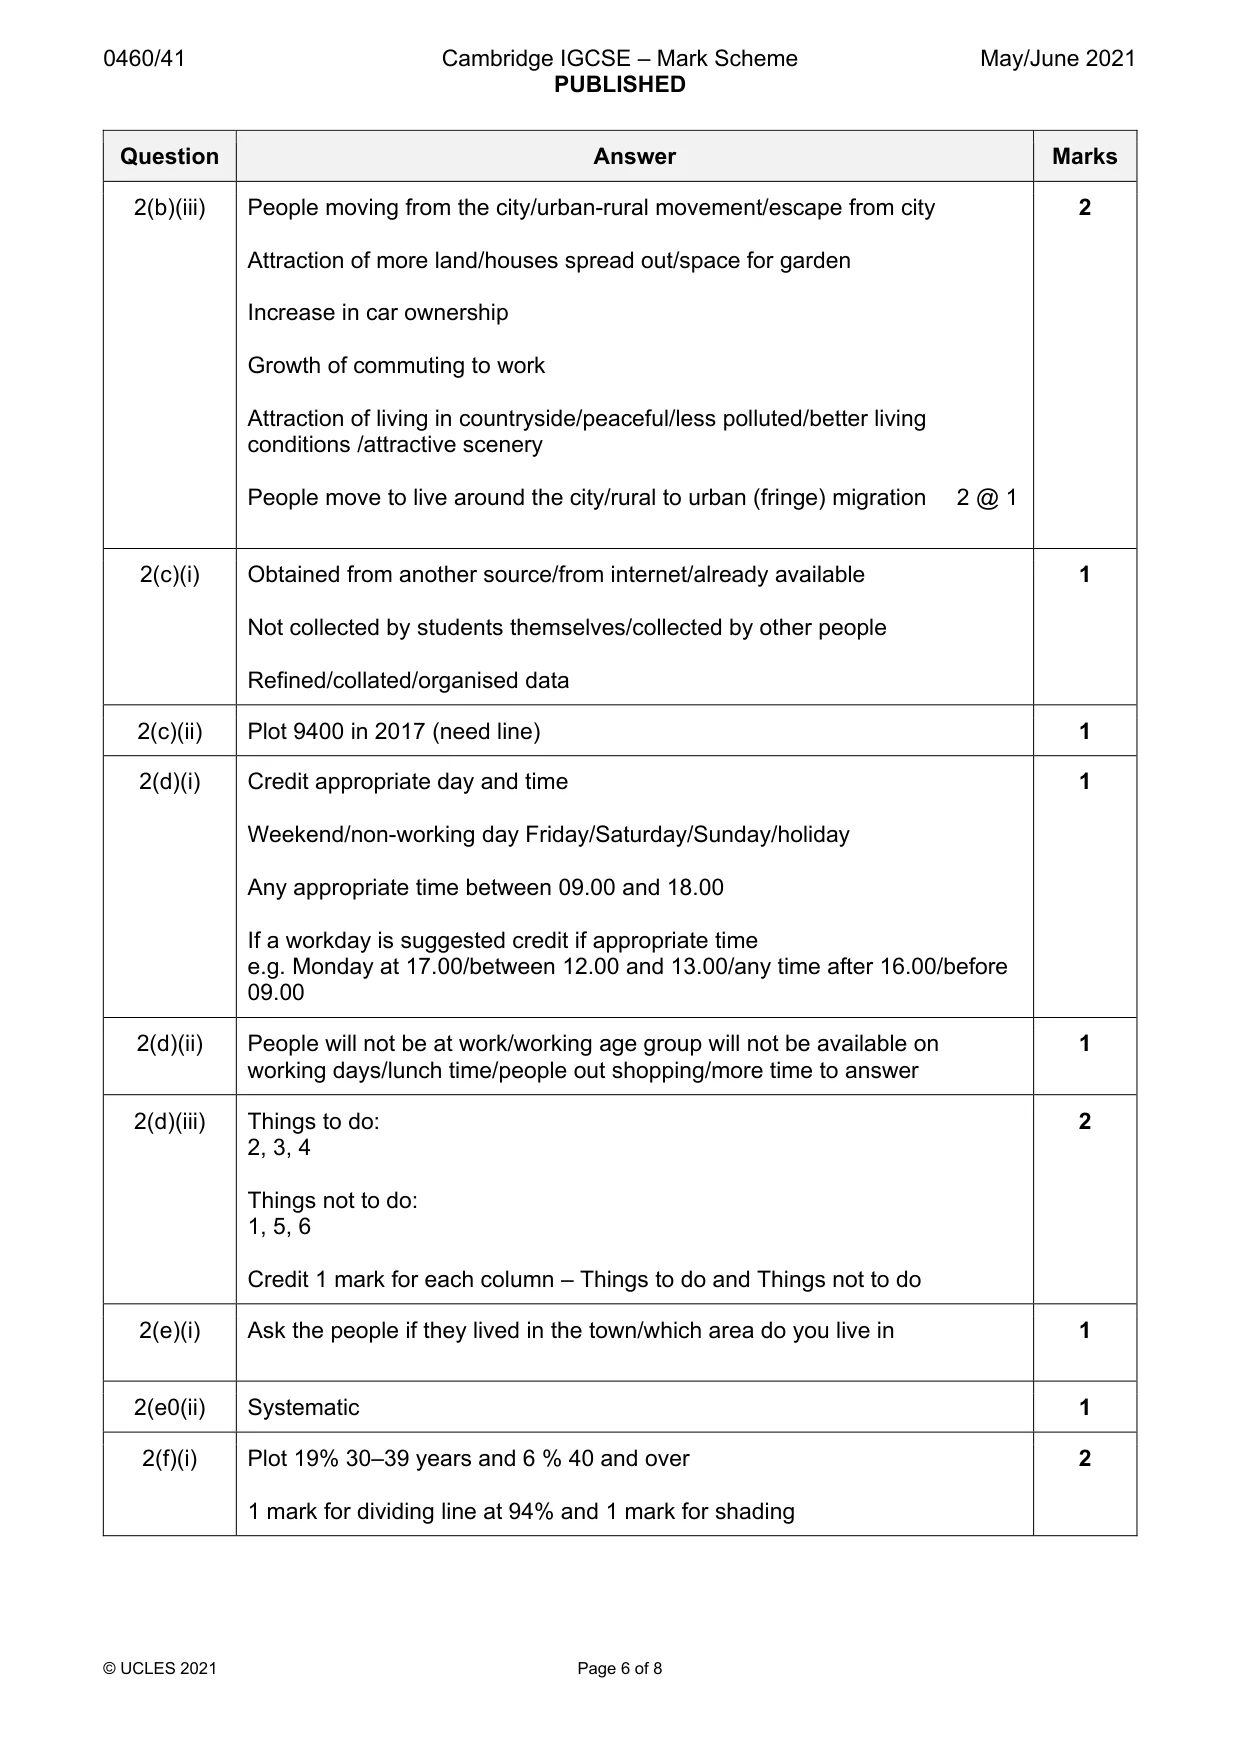
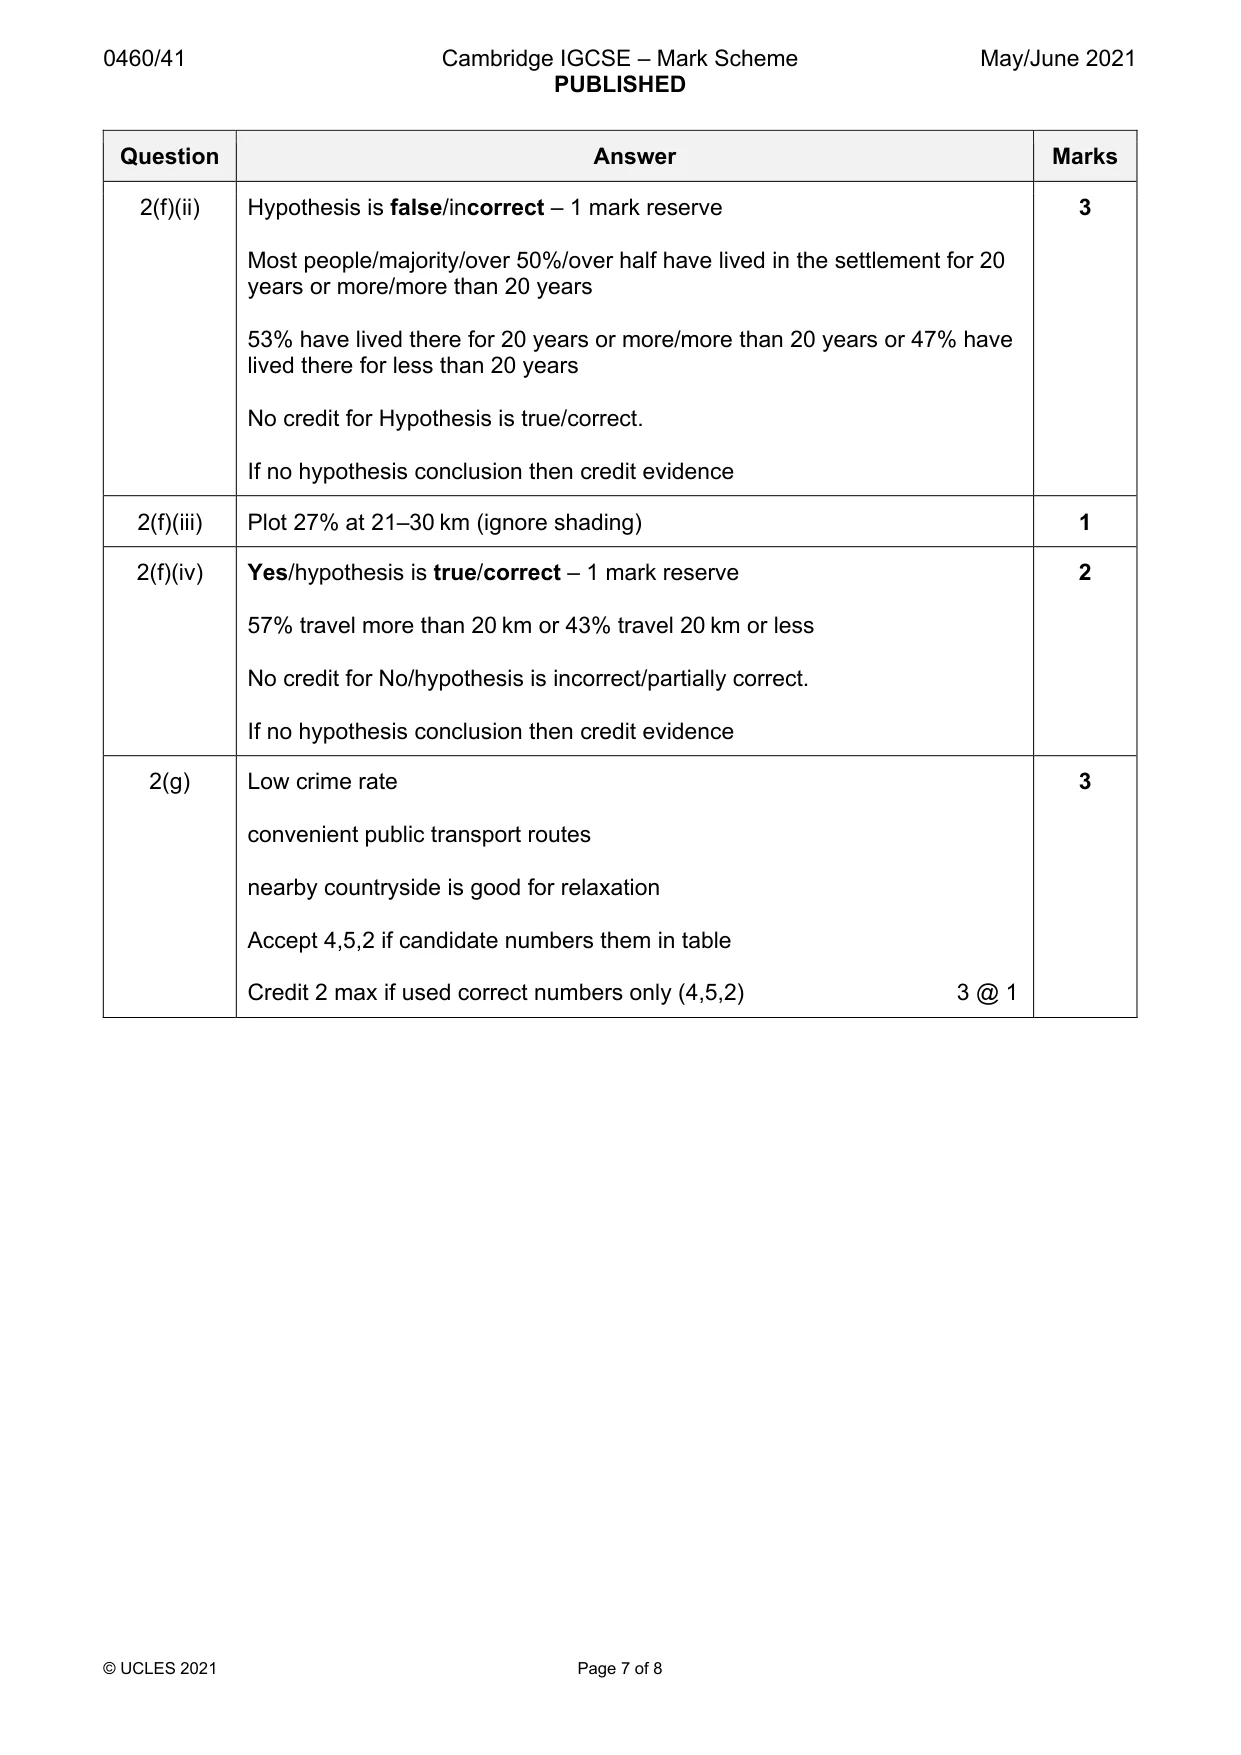
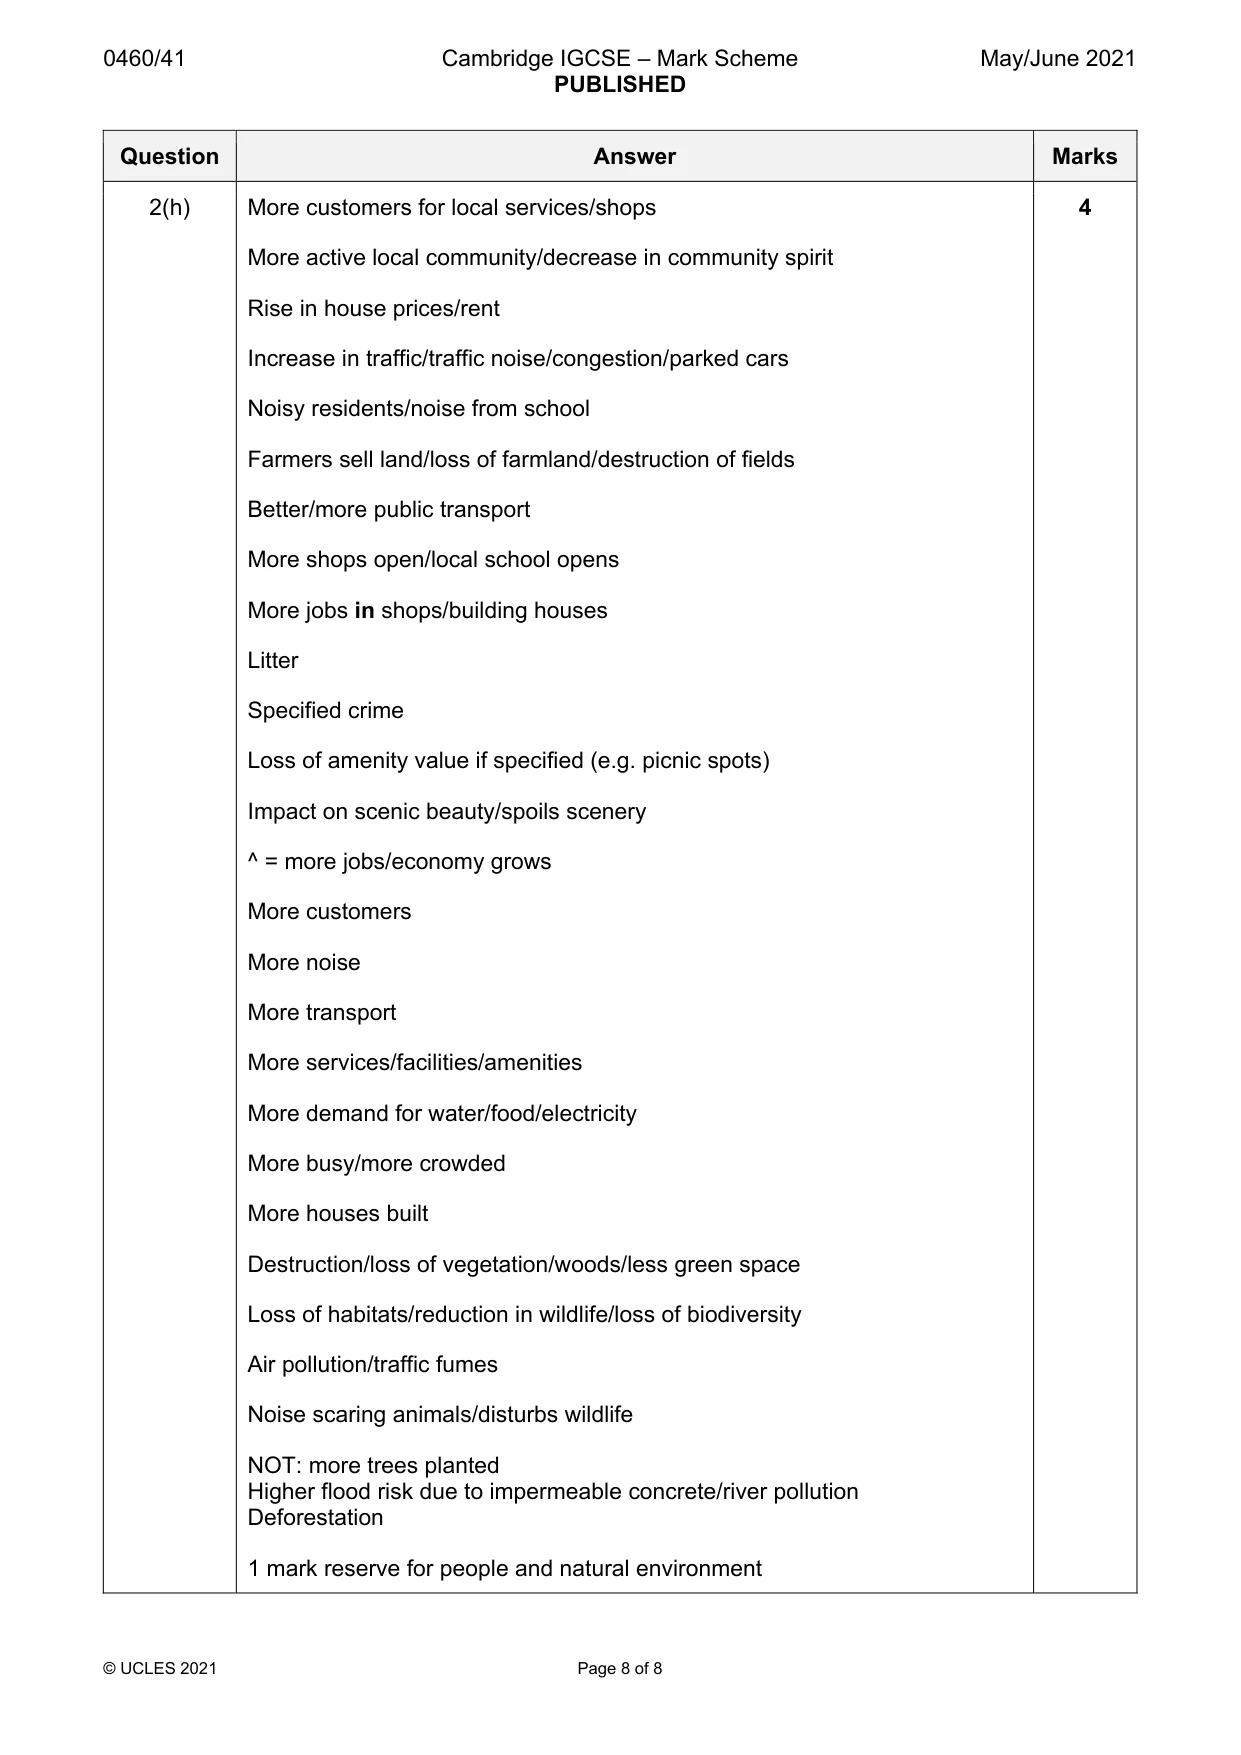
Mark scheme: 2(a) Rural-urban fringe 1 2(b)(i) Linear/long and thin 2 Nucleated Y-shaped/P-shaped (or appropriate shape) 2(b)(ii) To the west south west/south of the main road 2 To the south/south east/south west/north west (of the original village) To the north/east of woodland Away from the roads/further out from road/spread out/towards woodland /along the road/on outskirts/around original village 2(b)(iii) People moving from the city/urban-rural movement/escape from city 2 Attraction of more land/houses spread out/space for garden Increase in car ownership Growth of commuting to work Attraction of living in countryside/peaceful/less polluted/better living conditions /attractive scenery People move to live around the city/rural to urban (fringe) migration 2 @ 1 2(c)(i) Obtained from another source/from internet/already available 1 Not collected by students themselves/collected by other people Refined/collated/organised data 2(c)(ii) Plot 9400 in 2017 (need line) 1 2(d)(i) Credit appropriate day and time 1 Weekend/non-working day Friday/Saturday/Sunday/holiday Any appropriate time between 09.00 and 18.00 If a workday is suggested credit if appropriate time e.g. Monday at 17.00/between 12.00 and 13.00/any time after 16.00/before 09.00 2(d)(ii) People will not be at work/working age group will not be available on 1 working days/lunch time/people out shopping/more time to answer 2(d)(iii) Things to do: 2 2, 3, 4 Things not to do: 1, 5, 6 Credit 1 mark for each column – Things to do and Things not to do 2(e)(i) Ask the people if they lived in the town/which area do you live in 1 2(e0(ii) Systematic 1 2(f)(i) Plot 19% 30–39 years and 6 % 40 and over 2 1 mark for dividing line at 94% and 1 mark for shading 2(f)(ii) Hypothesis is false/incorrect – 1 mark reserve 3 Most people/majority/over 50%/over half have lived in the settlement for 20 years or more/more than 20 years 53% have lived there for 20 years or more/more than 20 years or 47% have lived there for less than 20 years No credit for Hypothesis is true/correct. If no hypothesis conclusion then credit evidence 2(f)(iii) Plot 27% at 21–30 km (ignore shading) 1 2(f)(iv) Yes/hypothesis is true/correct – 1 mark reserve 2 57% travel more than 20 km or 43% travel 20 km or less No credit for No/hypothesis is incorrect/partially correct. If no hypothesis conclusion then credit evidence 2(g) Low crime rate 3 convenient public transport routes nearby countryside is good for relaxation Accept 4,5,2 if candidate numbers them in table Credit 2 max if used correct numbers only (4,5,2) 3 @ 1 2(h) More customers for local services/shops 4 More active local community/decrease in community spirit Rise in house prices/rent Increase in traffic/traffic noise/congestion/parked cars Noisy residents/noise from school Farmers sell land/loss of farmland/destruction of fields Better/more public transport More shops open/local school opens More jobs in shops/building houses Litter Specified crime Loss of amenity value if specified (e.g. picnic spots) Impact on scenic beauty/spoils scenery ^ = more jobs/economy grows More customers More noise More transport More services/facilities/amenities More demand for water/food/electricity More busy/more crowded More houses built Destruction/loss of vegetation/woods/less green space Loss of habitats/reduction in wildlife/loss of biodiversity Air pollution/traffic fumes Noise scaring animals/disturbs wildlife NOT: more trees planted Higher flood risk due to impermeable concrete/river pollution Deforestation 1 mark reserve for people and natural environment
What was in this paper
The subtopics covered by these 2 questions, and how many questions each got. Open one in a new tab to see every Cambridge question on it.
What you needed in this session
Cambridge’s own grade thresholds for 2021 May/June, Paper 4 · Variant 1. A higher threshold means an easier paper — the bar moves with how the cohort did.