Cambridge IGCSE Geography 0460 — 2020 May/June Paper 4 · Variant 3
0460/43/M/J/20 · 2 questions · 46 marks · ≈52 min
The question paper and its mark scheme, free to read here and free to download. This is Cambridge’s own paper, exactly as it was sat.
Question paper20 pages












Mark scheme5 pages
Answers below. Sit the paper first if you are practising.


Questions as text
Q1 · Students in the UK visited a local company which made electronic products
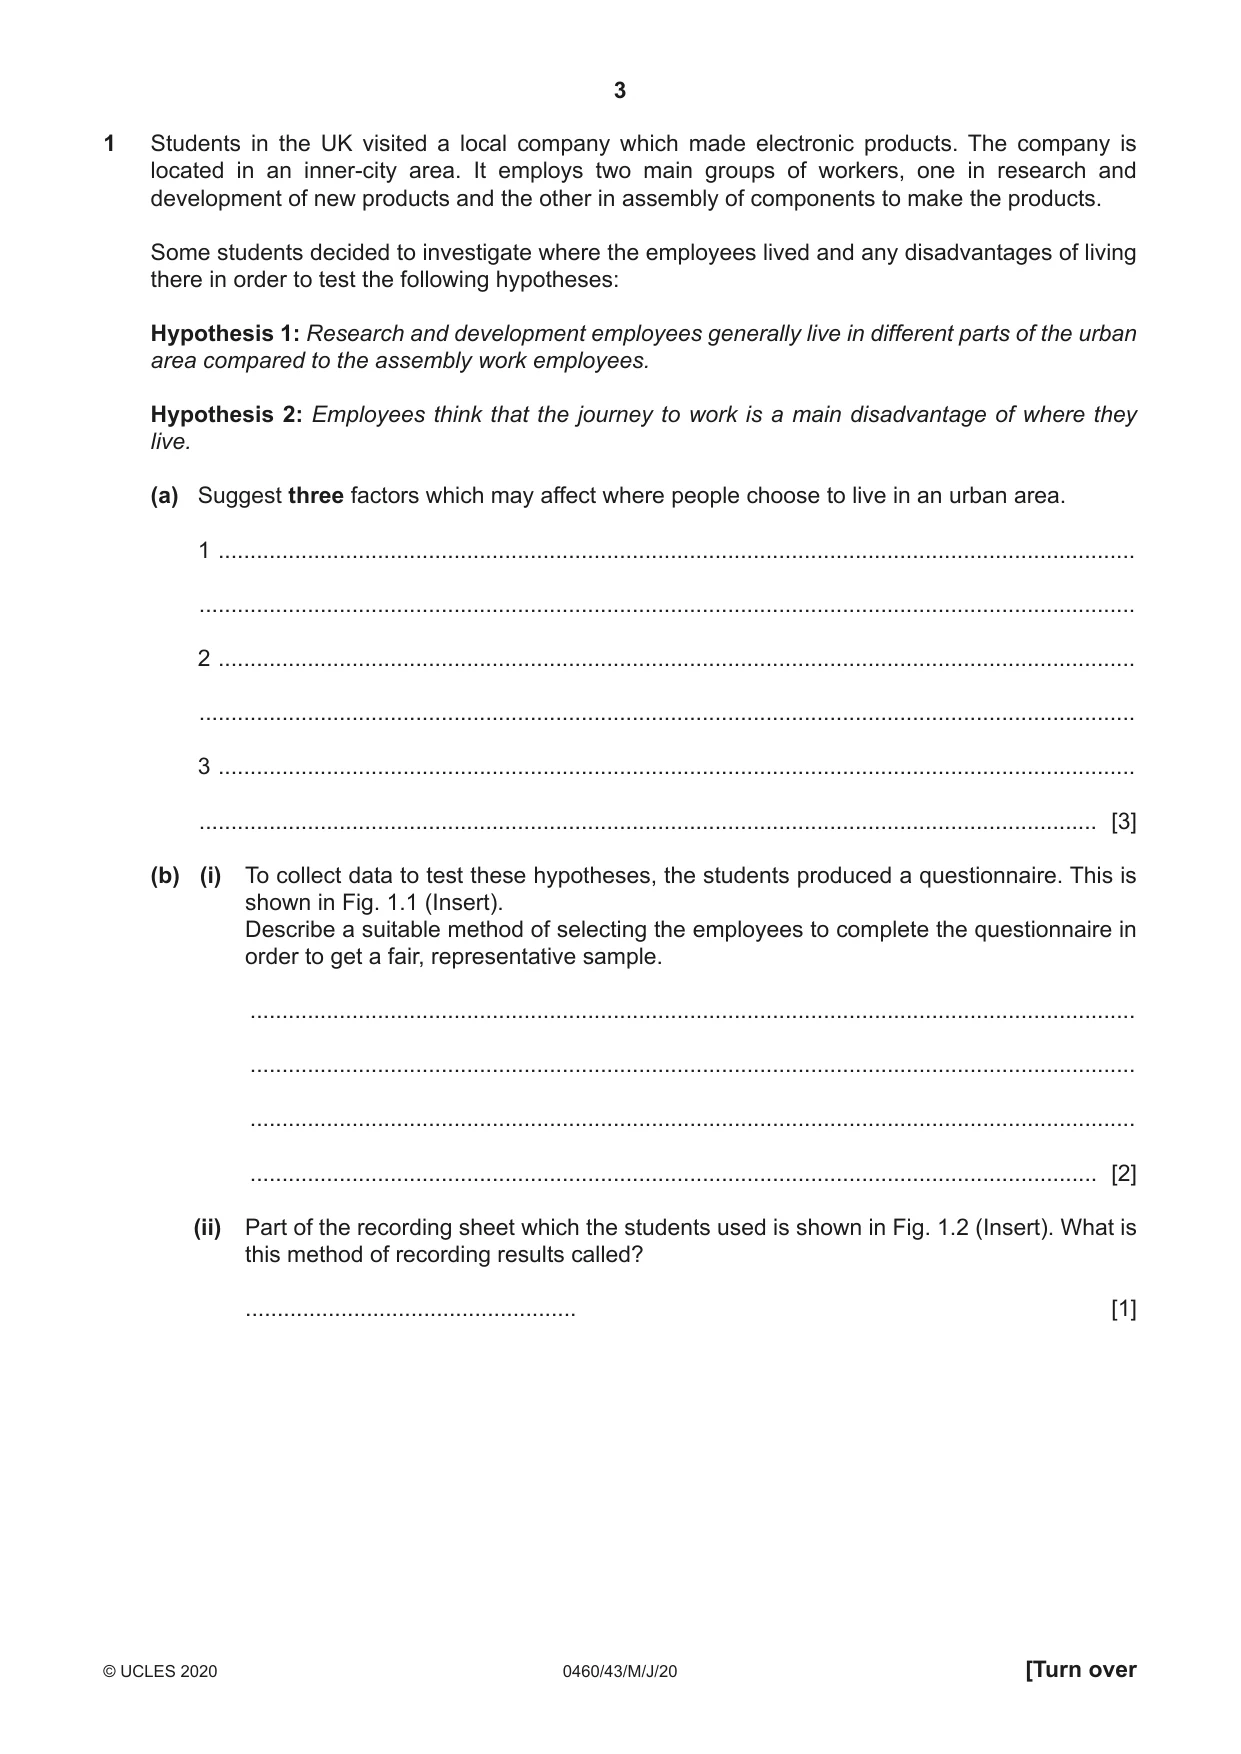
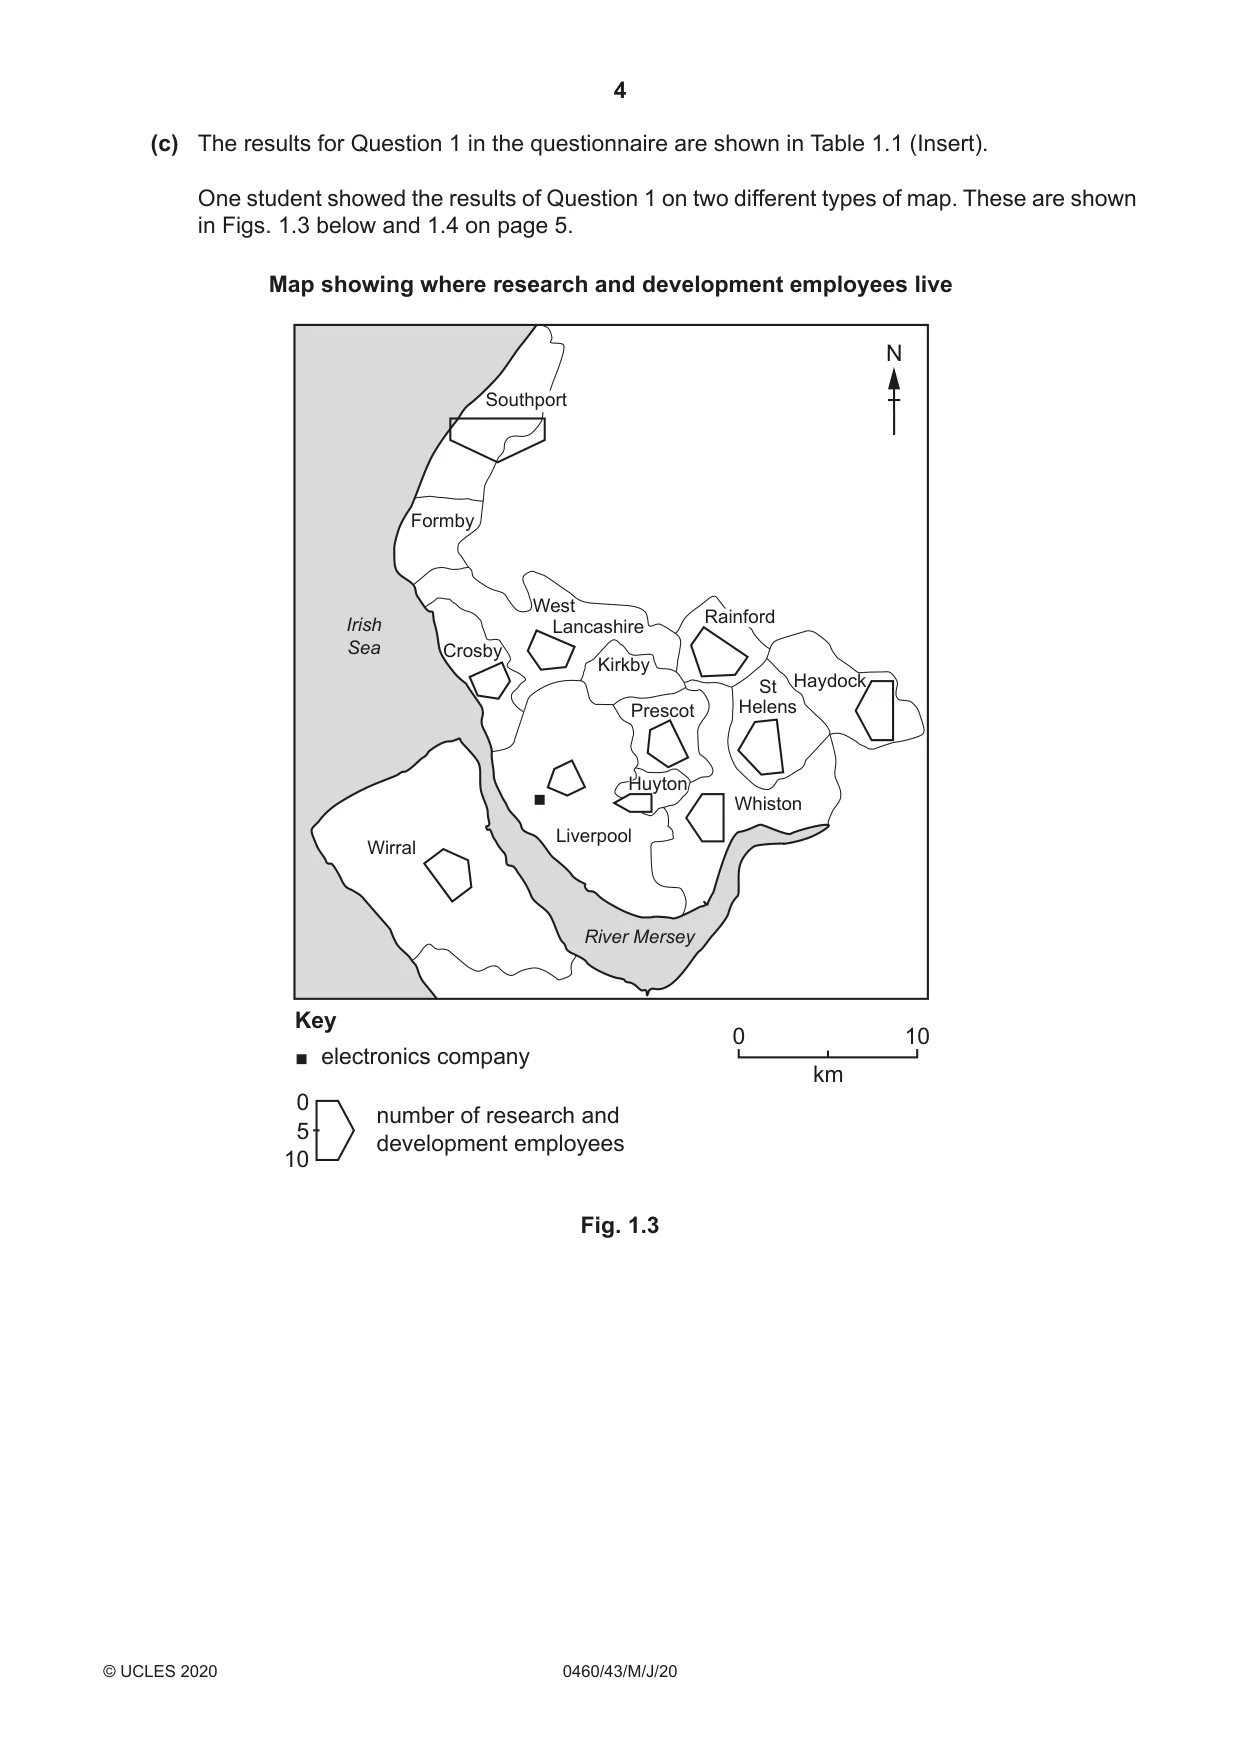
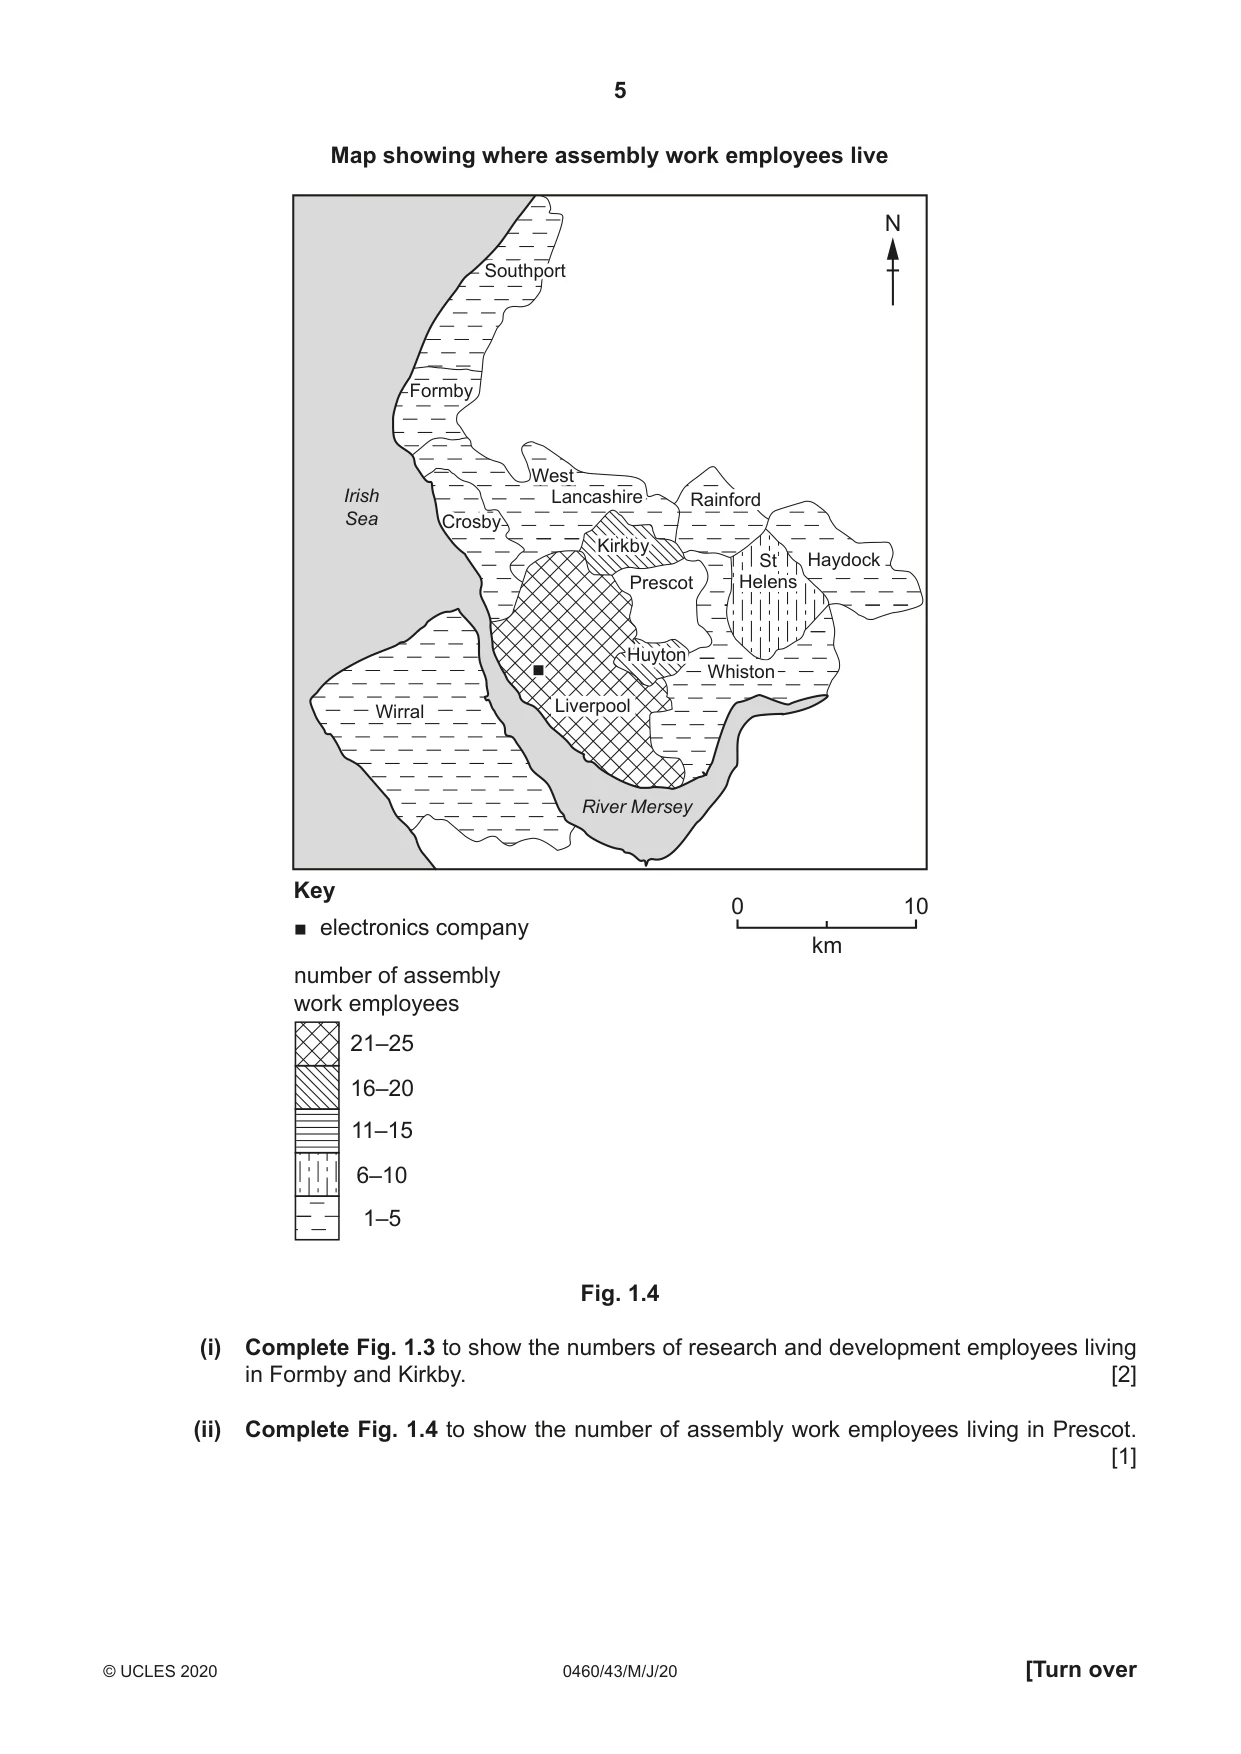
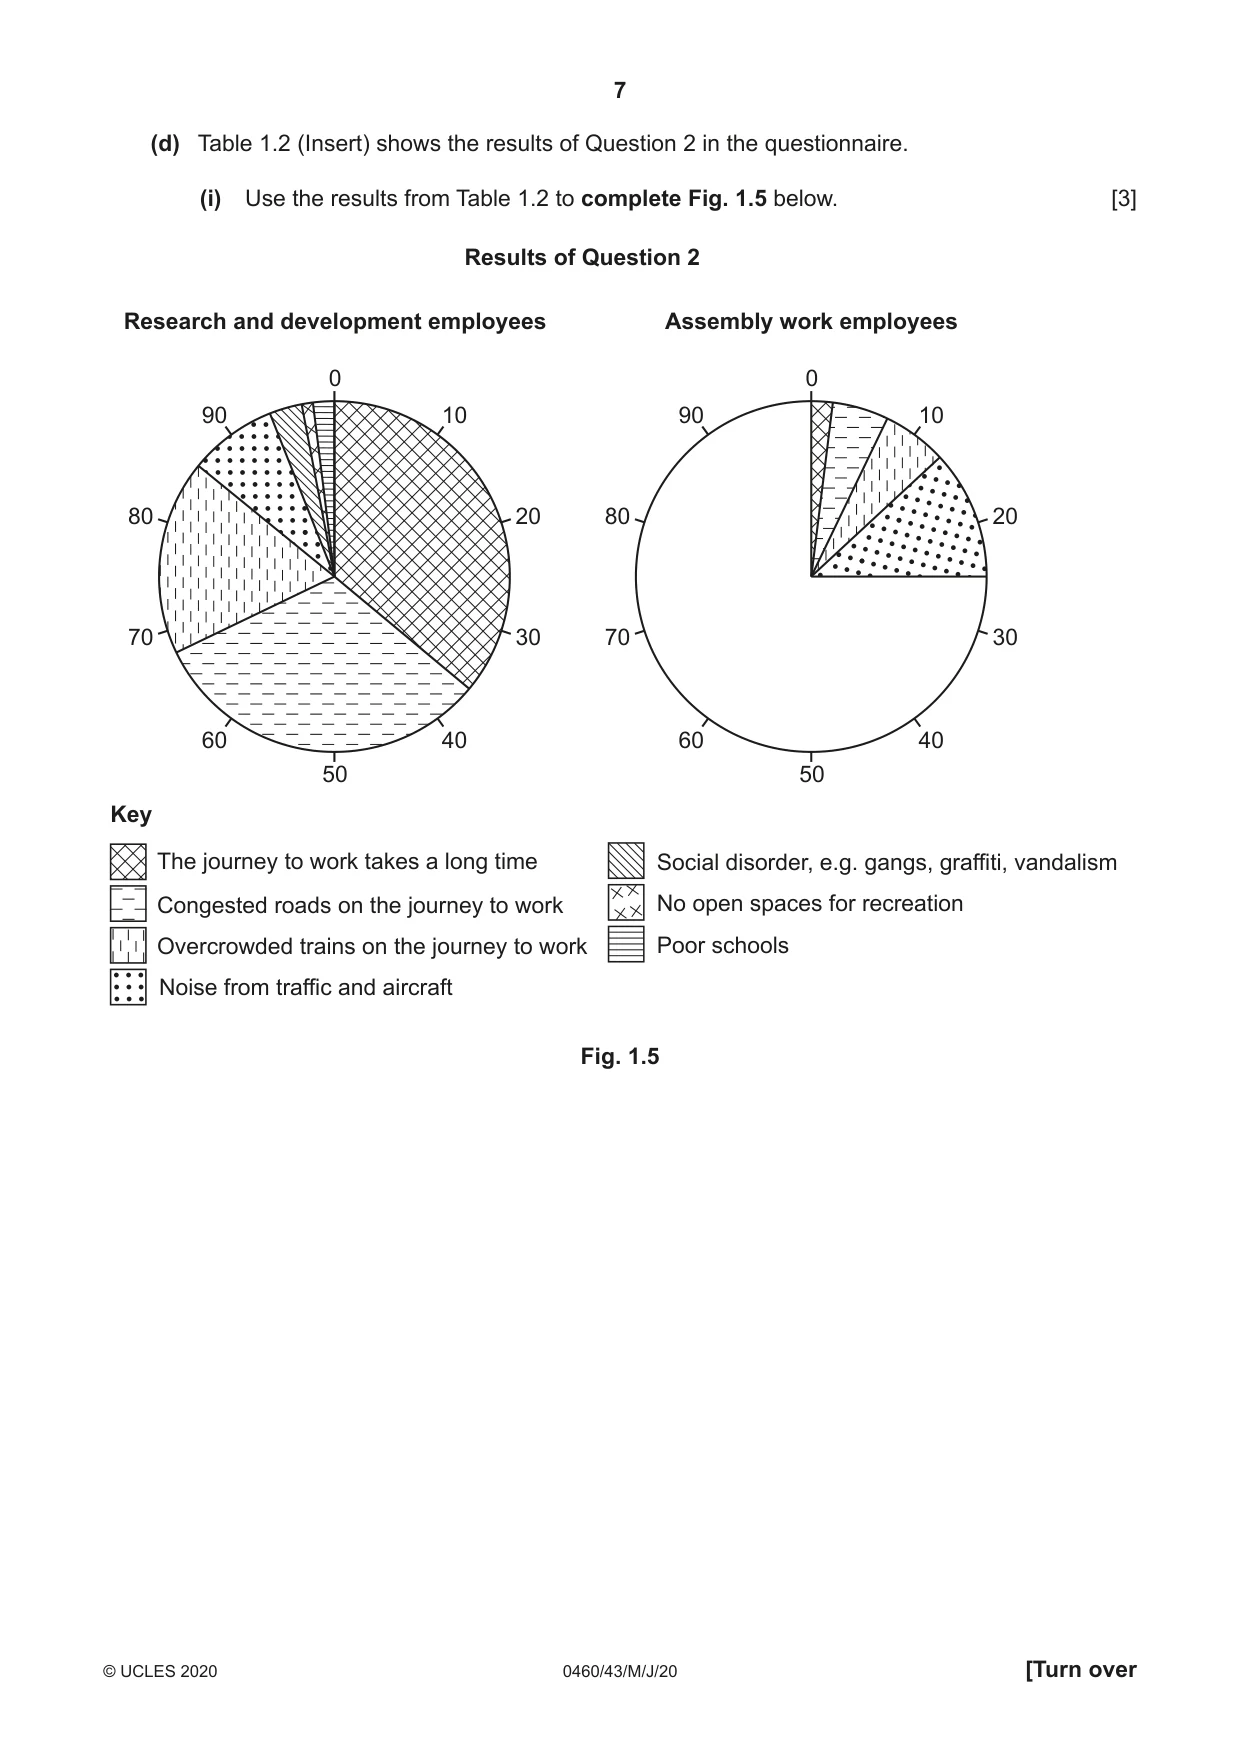
1 Students in the UK visited a local company which made electronic products. The company is located in an inner-city area. It employs two main groups of workers, one in research and development of new products and the other in assembly of components to make the products. Some students decided to investigate where the employees lived and any disadvantages of living there in order to test the following hypotheses: Hypothesis 1: Research and development employees generally live in different parts of the urban area compared to the assembly work employees. Hypothesis 2: Employees think that the journey to work is a main disadvantage of where they live. (a) Suggest three factors which may affect where people choose to live in an urban area. 1 ................................................................................................................................................ ................................................................................................................................................... 2 ................................................................................................................................................ ................................................................................................................................................... 3 ................................................................................................................................................ ............................................................................................................................................. [3] (b) (i) To collect data to test these hypotheses, the students produced a questionnaire. This is shown in Fig. 1.1 (Insert). Describe a suitable method of selecting the employees to complete the questionnaire in order to get a fair, representative sample. ........................................................................................................................................... ........................................................................................................................................... ........................................................................................................................................... ..................................................................................................................................... [2] (ii) Part of the recording sheet which the students used is shown in Fig. 1.2 (Insert). What is this method of recording results called? .................................................... [1] (c) The results for Question 1 in the questionnaire are shown in Table 1.1 (Insert). One student showed the results of Question 1 on two different types of map. These are shown in Figs. 1.3 below and 1.4 on page 5. Map showing where research and development employees live N Southport Formby West Rainford Irish Lancashire Sea Crosby Kirkby St Haydock Prescot Helens HuytonHuyton Whiston Liverpool Wirral River Mersey Key 0 10 electronics company km 0 number of research and 5 development employees 10 Fig. 1.3 Map showing where assembly work employees live N SouthportSouthport FormbyFormby WestWest Irish LancashireLancashire RainfordRainford Sea CrosbyCrosby KirkbyKirkbyKirkby St.St HaydockHaydock Prescot HelensHelens HuytonHuyton Whiston Wirral LiverpoolLiverpool River Mersey Key 0 10 electronics company km number of assembly work employees 21–25 16–20 11–15 6–10 1–5 Fig. 1.4 (i) Complete Fig. 1.3 to show the numbers of research and development employees living in Formby and Kirkby. [2] (ii) Complete Fig. 1.4 to show the number of assembly work employees living in Prescot. [1] (iii) Choose either Fig. 1.3 or Fig. 1.4 and circle your choice below. Name the type of map and give two advantages of this type of map for showing data. Fig. 1.3 Fig. 1.4 Name of type of map .................................................... Advantage 1 ........................................................................................................................................... ........................................................................................................................................... Advantage 2 ........................................................................................................................................... ........................................................................................................................................... [3] (iv) Which one of the following would be another suitable method to display the results of Question 1 on a map of the urban area? Tick (✓) your choice. Tick (✓) histogram kite diagram pictogram [1] (v) Do you agree with Hypothesis 1: Research and development employees generally live in different parts of the urban area compared to the assembly work employees? Support your conclusion with data from Figs. 1.3 and 1.4 and Table 1.1. ........................................................................................................................................... ........................................................................................................................................... ........................................................................................................................................... ........................................................................................................................................... ........................................................................................................................................... ........................................................................................................................................... ........................................................................................................................................... ........................................................................................................................................... ........................................................................................................................................... ..................................................................................................................................... [4] (d) Table 1.2 (Insert) shows the results of Question 2 in the questionnaire. (i) Use the results from Table 1.2 to complete Fig. 1.5 below. [3] Results of Question 2 Research and development employees Assembly work employees 0 0 90 10 90 10 80 20 80 20 70 30 70 30 60 40 60 40 50 50 Key The journey to work takes a long time Social disorder, e.g. gangs, graffiti, vandalism Congested roads on the journey to work No open spaces for recreation Overcrowded trains on the journey to work Poor schools Noise from traffic and aircraft Fig. 1.5 (ii) Which one of the conclusions below would the students make about Hypothesis 2: Employees think that the journey to work is a main disadvantage of where they live? Tick (✓) your choice and support your conclusion with evidence from Fig. 1.5 and Table 1.2. Tick (✓) The hypothesis is true for both groups of employees. The hypothesis is true for one group of employees. The hypothesis is true for neither group of employees. ........................................................................................................................................... ........................................................................................................................................... ........................................................................................................................................... ........................................................................................................................................... ........................................................................................................................................... ........................................................................................................................................... ........................................................................................................................................... ..................................................................................................................................... [4] (e) Traffic congestion may affect people’s journey to work. (i) Suggest two other problems which traffic congestion may cause. 1 ........................................................................................................................................ ........................................................................................................................................... 2 ........................................................................................................................................ ..................................................................................................................................... [2] (ii) Explain why traffic congestion occurs in urban areas. ........................................................................................................................................... ........................................................................................................................................... ........................................................................................................................................... ........................................................................................................................................... ........................................................................................................................................... ........................................................................................................................................... ........................................................................................................................................... ..................................................................................................................................... [4] [Total: 30]
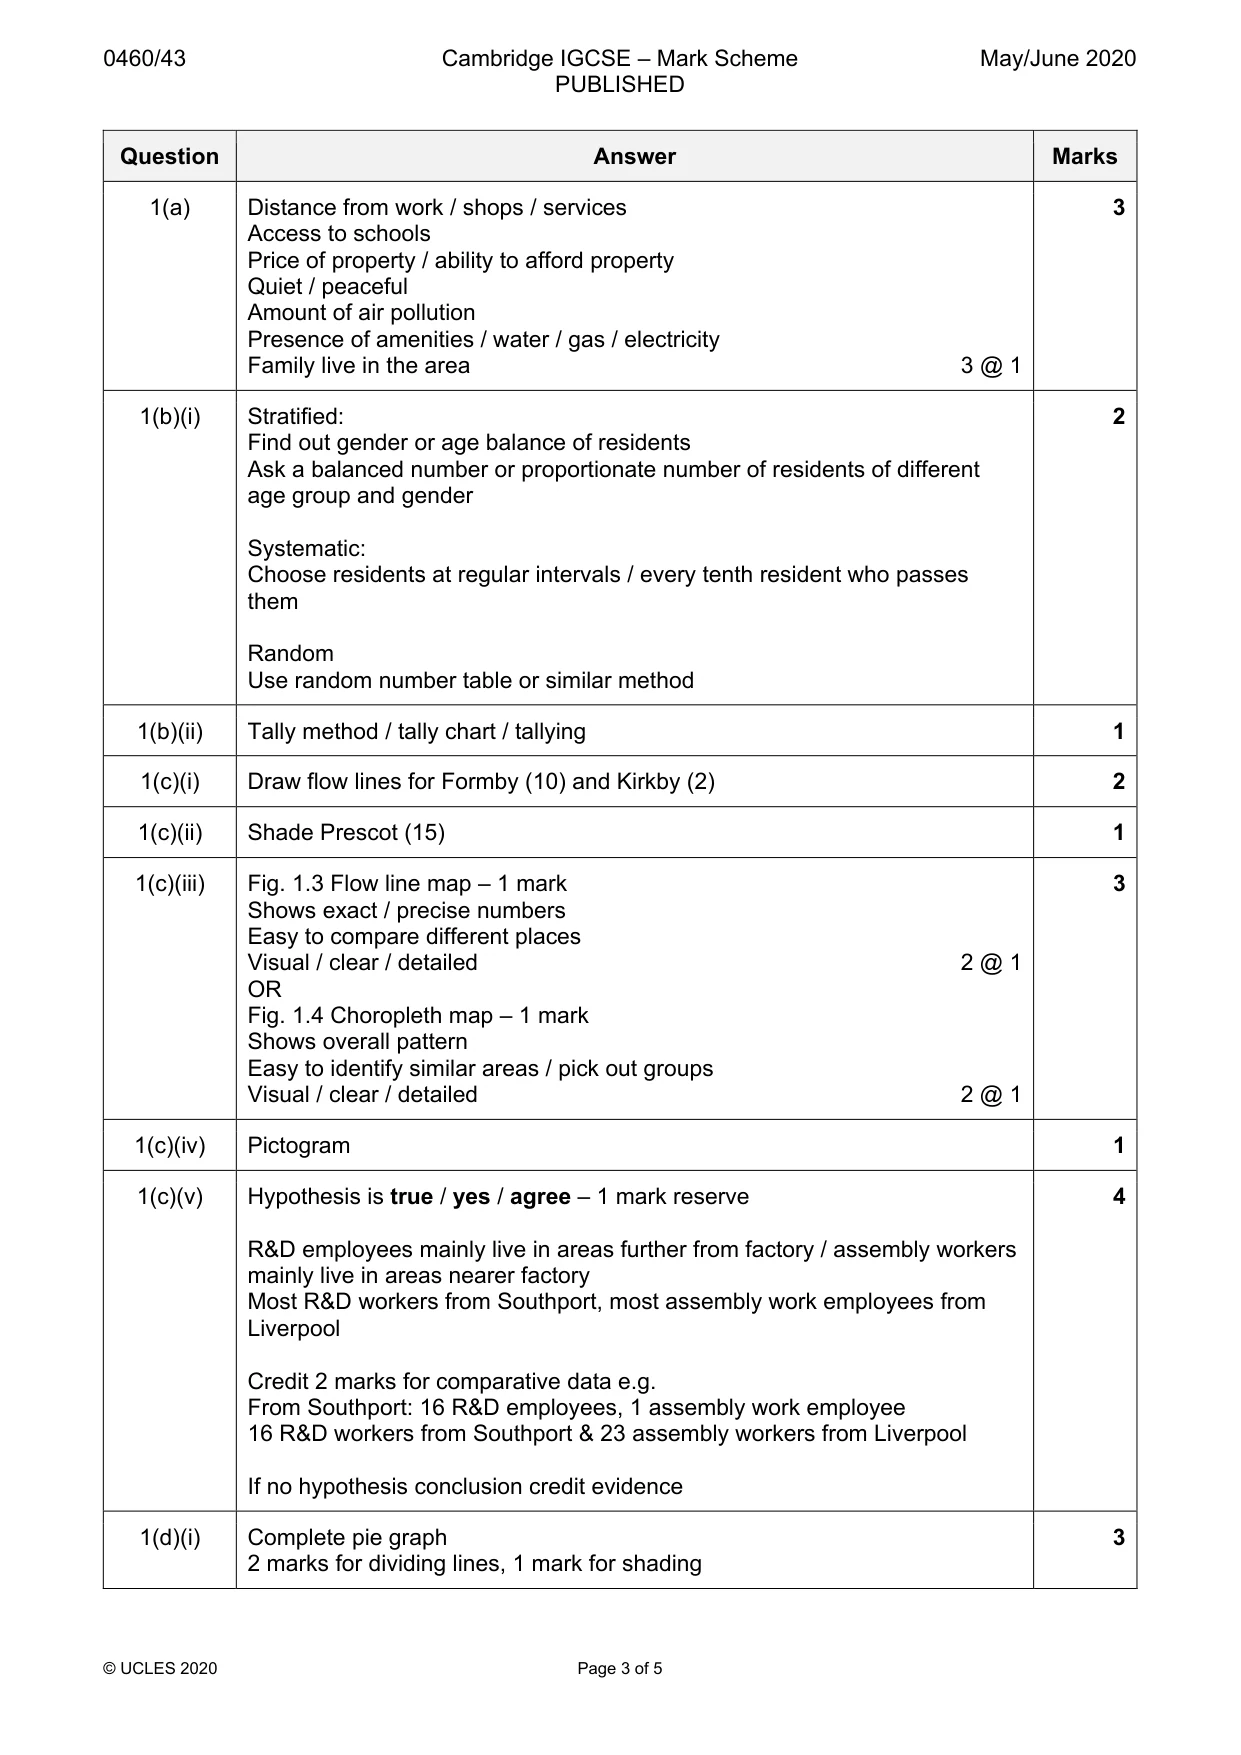
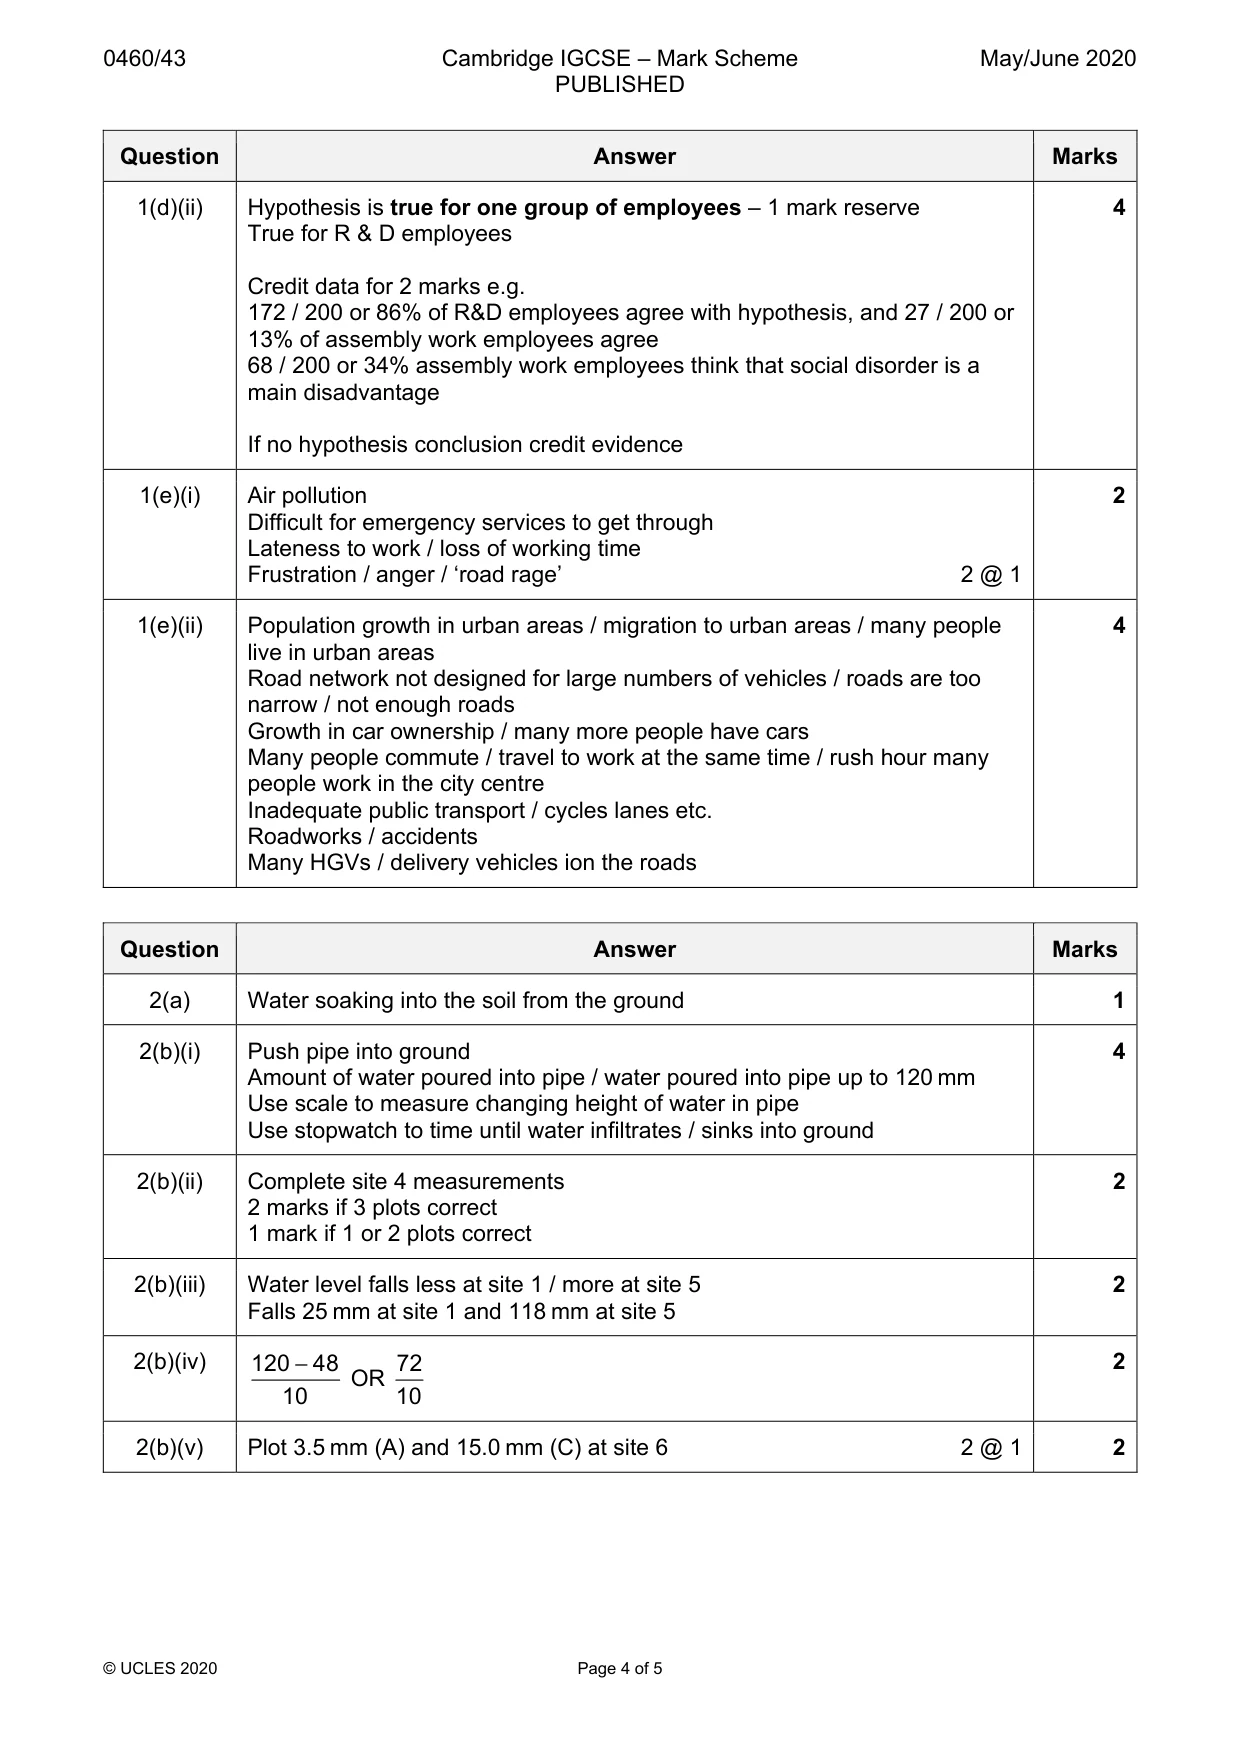
Mark scheme: Question Answer Marks 1(a) Distance from work / shops / services 3 Access to schools Price of property / ability to afford property Quiet / peaceful Amount of air pollution Presence of amenities / water / gas / electricity Family live in the area 3 @ 1 1(b)(i) Stratified: 2 Find out gender or age balance of residents Ask a balanced number or proportionate number of residents of different age group and gender Systematic: Choose residents at regular intervals / every tenth resident who passes them Random Use random number table or similar method 1(b)(ii) Tally method / tally chart / tallying 1 1(c)(i) Draw flow lines for Formby (10) and Kirkby (2) 2 1(c)(ii) Shade Prescot (15) 1 1(c)(iii) Fig. 1.3 Flow line map – 1 mark 3 Shows exact / precise numbers Easy to compare different places Visual / clear / detailed 2 @ 1 OR Fig. 1.4 Choropleth map – 1 mark Shows overall pattern Easy to identify similar areas / pick out groups Visual / clear / detailed 2 @ 1 1(c)(iv) Pictogram 1 1(c)(v) Hypothesis is true / yes / agree – 1 mark reserve 4 R&D employees mainly live in areas further from factory / assembly workers mainly live in areas nearer factory Most R&D workers from Southport, most assembly work employees from Liverpool Credit 2 marks for comparative data e.g. From Southport: 16 R&D employees, 1 assembly work employee 16 R&D workers from Southport & 23 assembly workers from Liverpool If no hypothesis conclusion credit evidence 1(d)(i) Complete pie graph 3 2 marks for dividing lines, 1 mark for shading 1(d)(ii) Hypothesis is true for one group of employees – 1 mark reserve 4 True for R & D employees Credit data for 2 marks e.g. 172 / 200 or 86% of R&D employees agree with hypothesis, and 27 / 200 or 13% of assembly work employees agree 68 / 200 or 34% assembly work employees think that social disorder is a main disadvantage If no hypothesis conclusion credit evidence 1(e)(i) Air pollution 2 Difficult for emergency services to get through Lateness to work / loss of working time Frustration / anger / ‘road rage’ 2 @ 1 1(e)(ii) Population growth in urban areas / migration to urban areas / many people 4 live in urban areas Road network not designed for large numbers of vehicles / roads are too narrow / not enough roads Growth in car ownership / many more people have cars Many people commute / travel to work at the same time / rush hour many people work in the city centre Inadequate public transport / cycles lanes etc. Roadworks / accidents Many HGVs / delivery vehicles ion the roads
Q2 · A class of students in Nairobi was studying the processes which operate in a drainage…
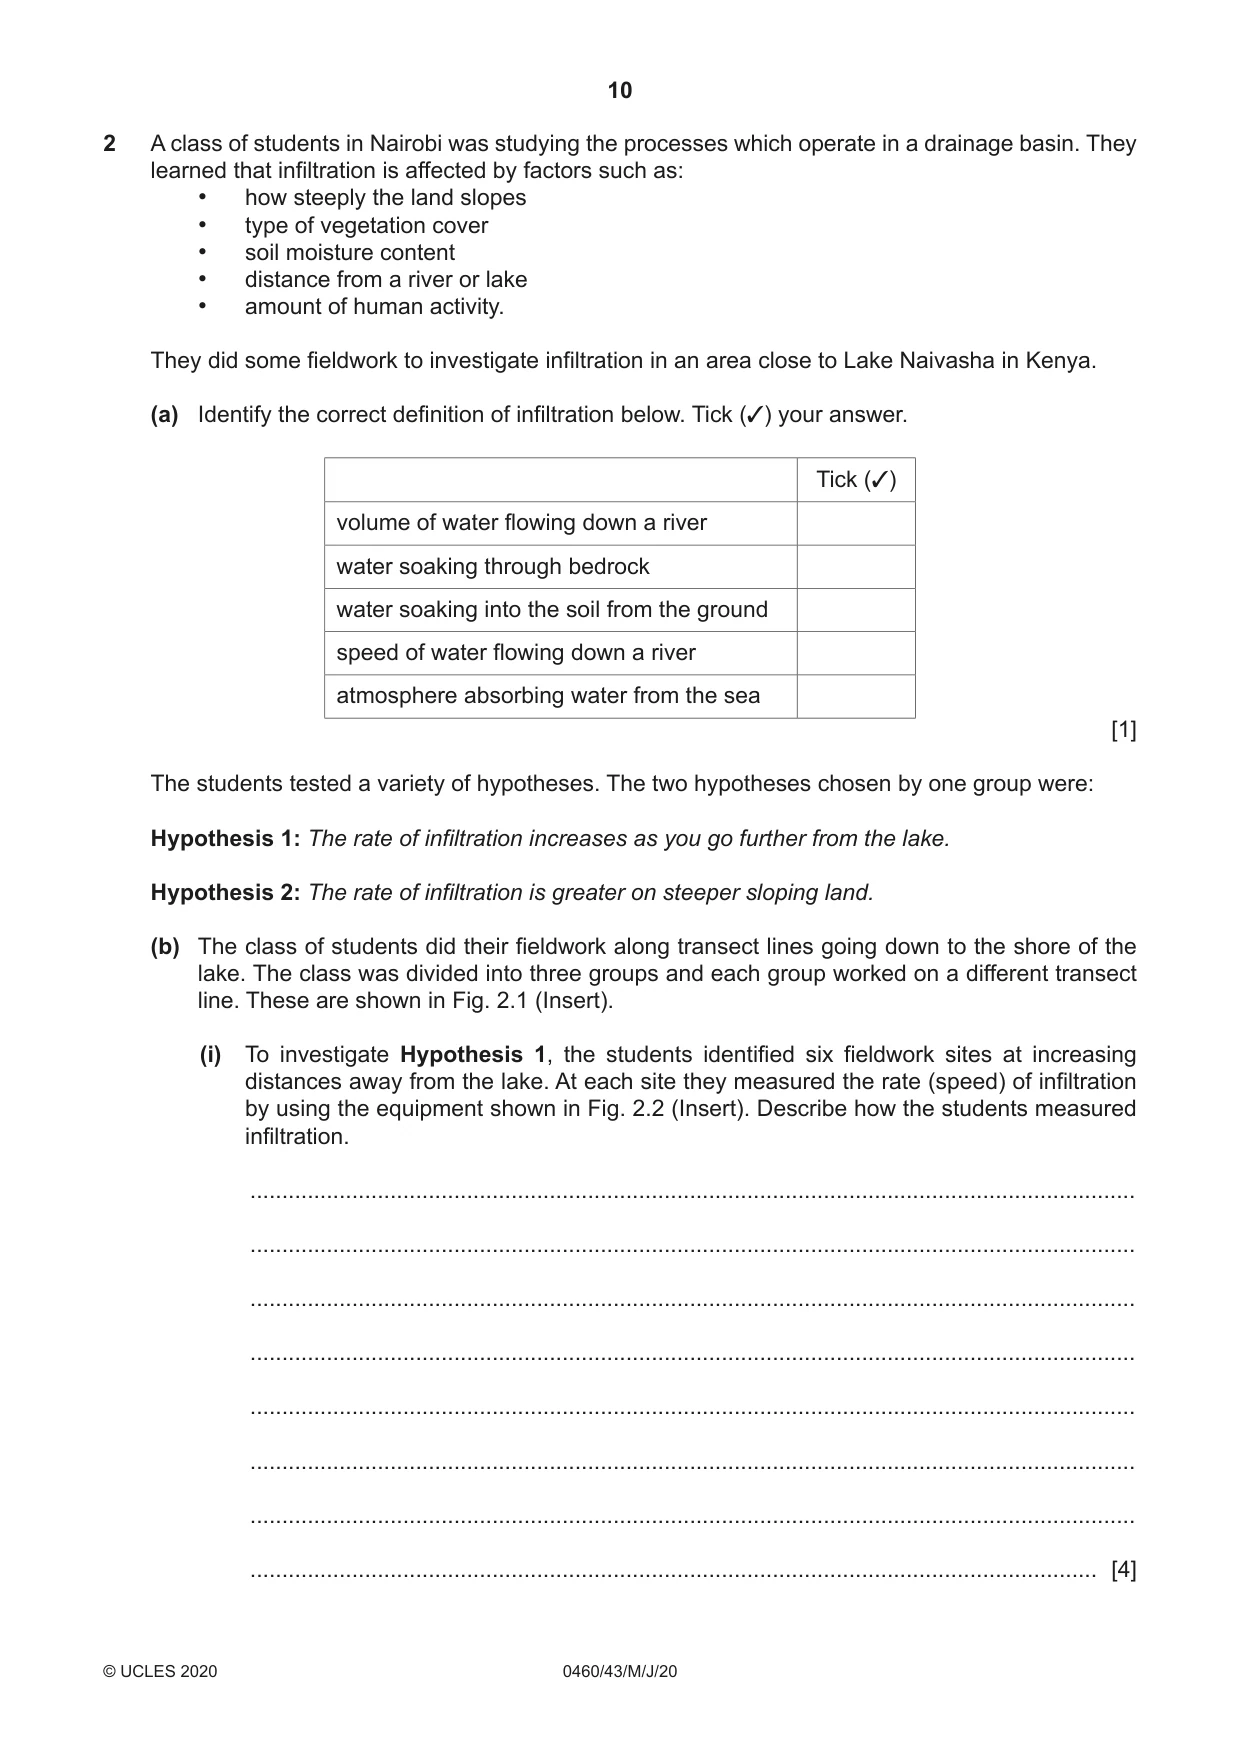
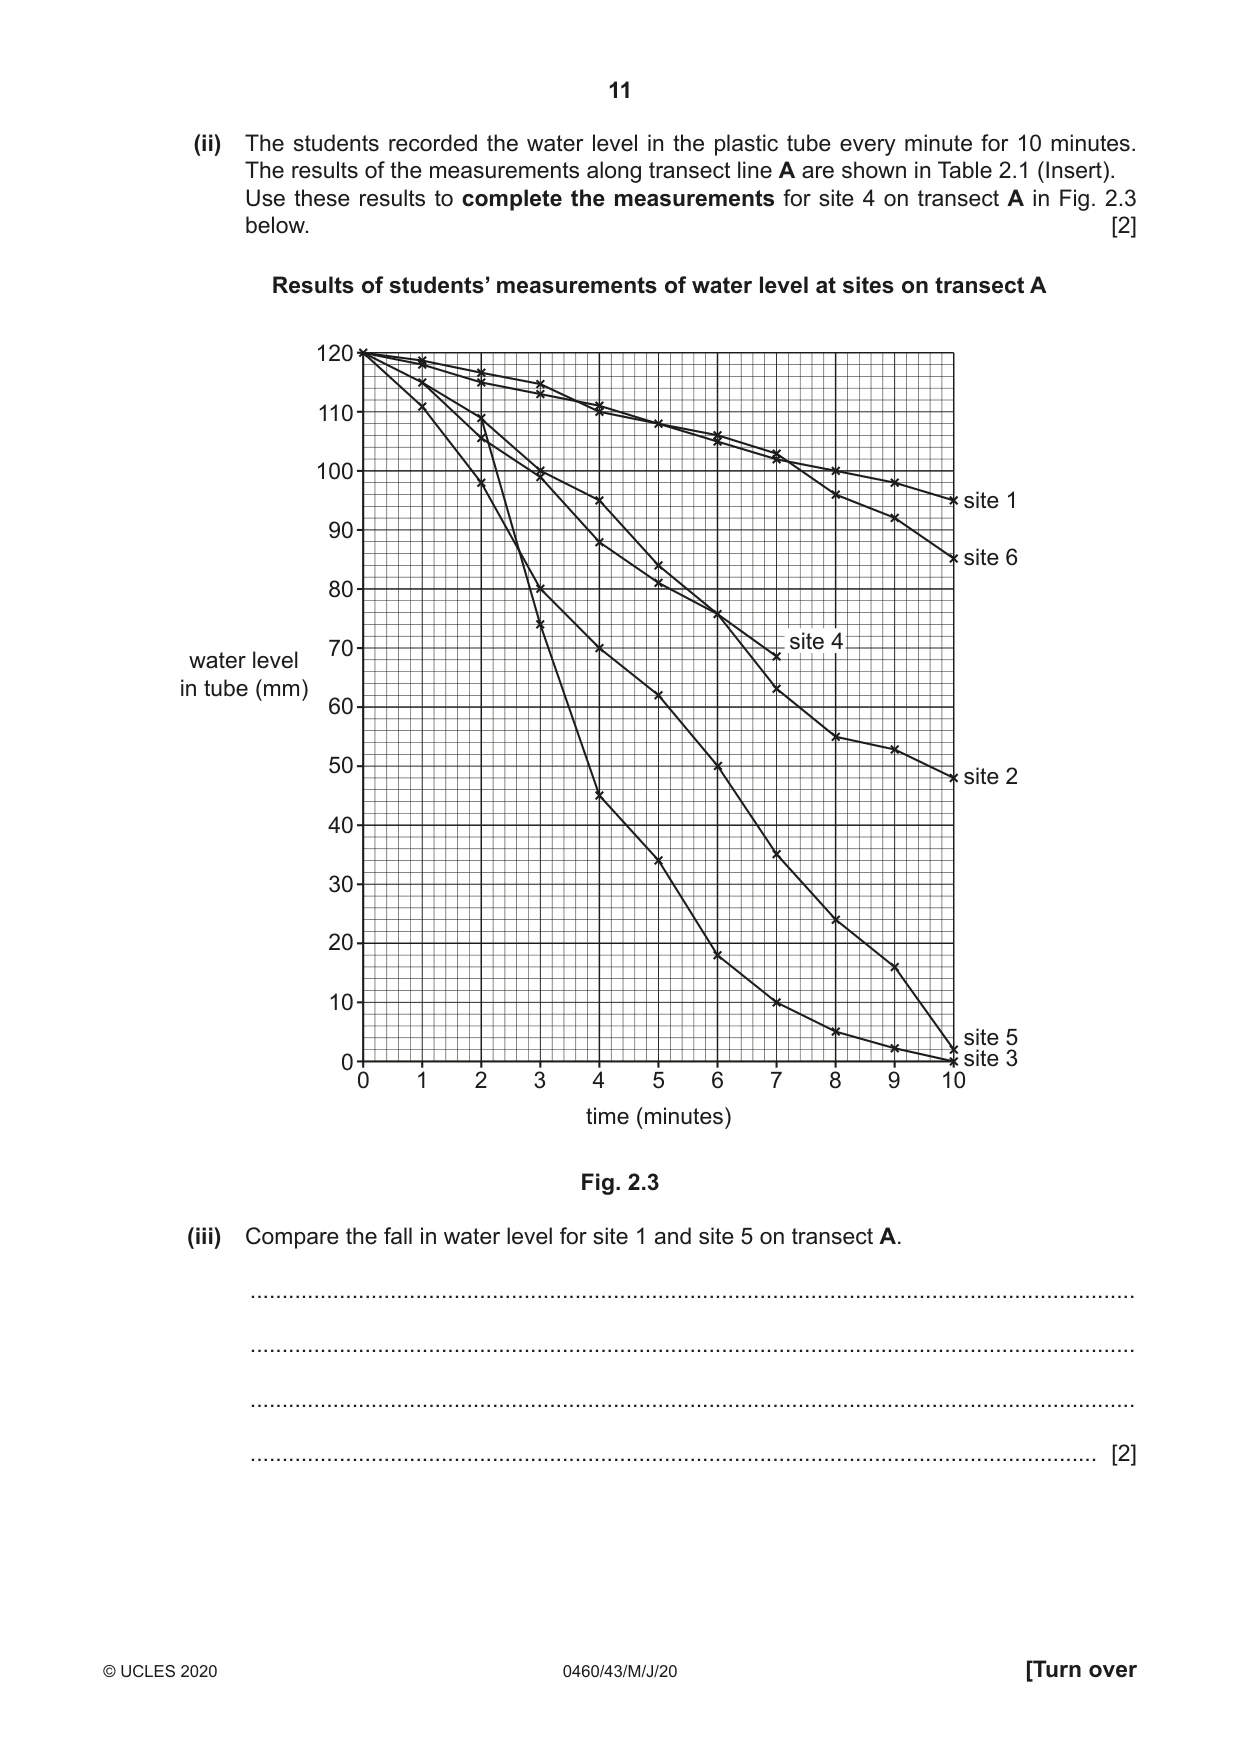
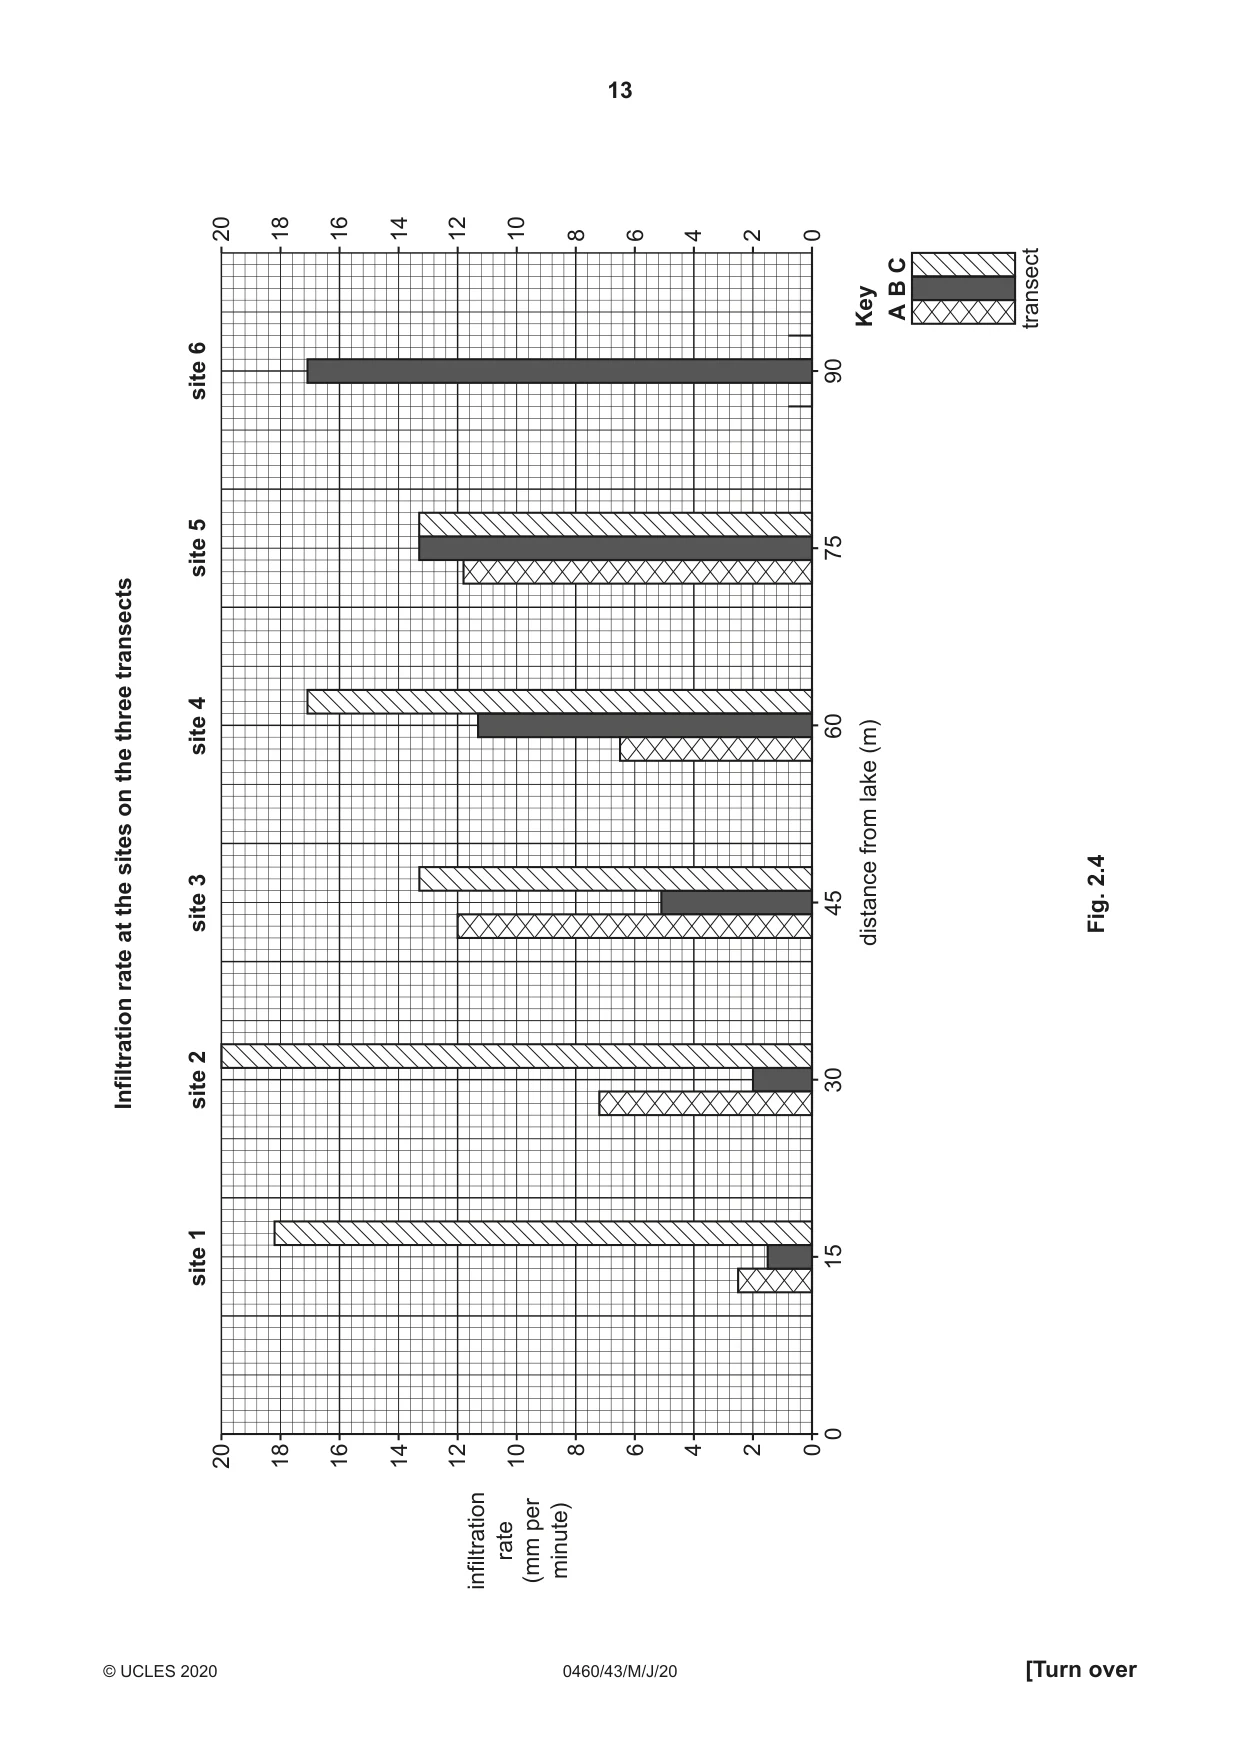
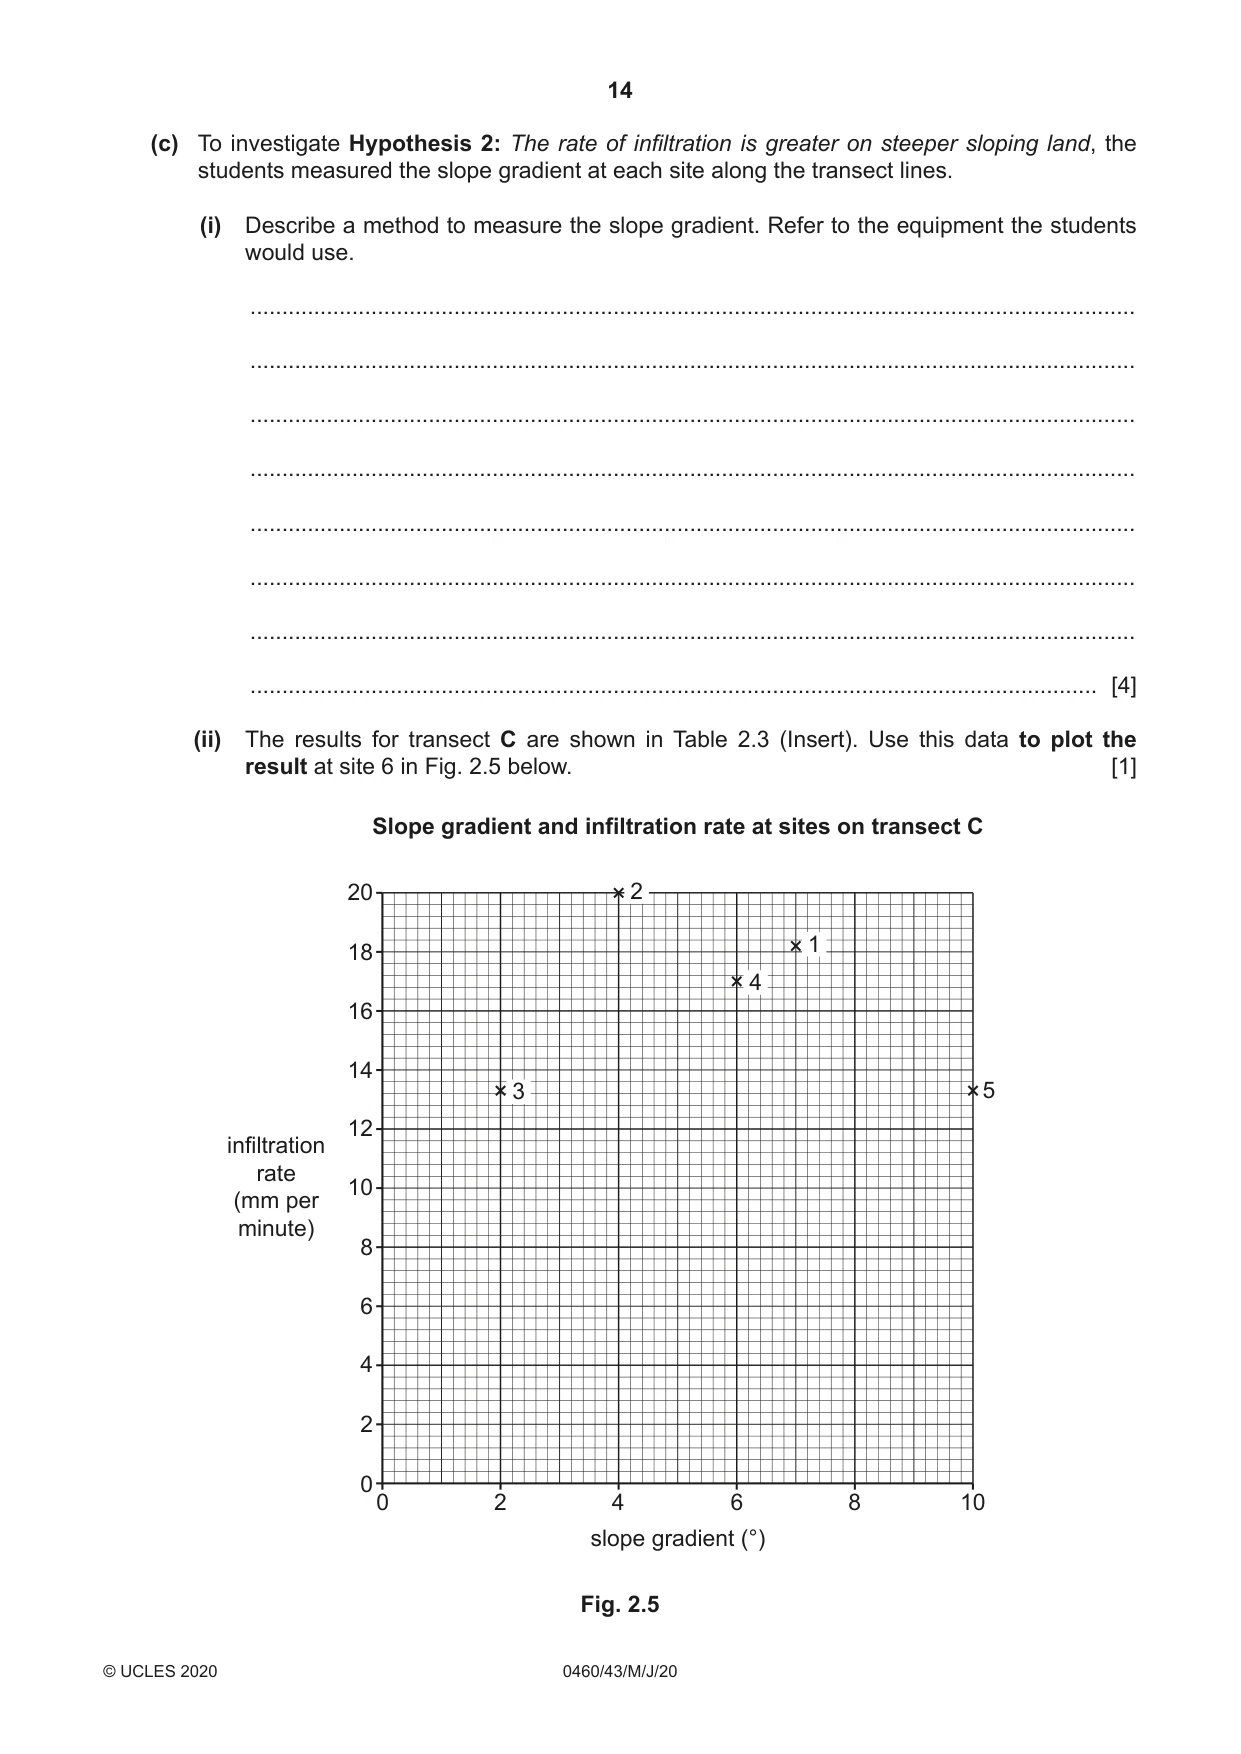
2 A class of students in Nairobi was studying the processes which operate in a drainage basin. They learned that infiltration is affected by factors such as: • how steeply the land slopes • type of vegetation cover • soil moisture content • distance from a river or lake • amount of human activity. They did some fieldwork to investigate infiltration in an area close to Lake Naivasha in Kenya. (a) Identify the correct definition of infiltration below. Tick (✓) your answer. Tick (✓) volume of water flowing down a river water soaking through bedrock water soaking into the soil from the ground speed of water flowing down a river atmosphere absorbing water from the sea [1] The students tested a variety of hypotheses. The two hypotheses chosen by one group were: Hypothesis 1: The rate of infiltration increases as you go further from the lake. Hypothesis 2: The rate of infiltration is greater on steeper sloping land. (b) The class of students did their fieldwork along transect lines going down to the shore of the lake. The class was divided into three groups and each group worked on a different transect line. These are shown in Fig. 2.1 (Insert). (i) To investigate Hypothesis 1, the students identified six fieldwork sites at increasing distances away from the lake. At each site they measured the rate (speed) of infiltration by using the equipment shown in Fig. 2.2 (Insert). Describe how the students measured infiltration. ........................................................................................................................................... ........................................................................................................................................... ........................................................................................................................................... ........................................................................................................................................... ........................................................................................................................................... ........................................................................................................................................... ........................................................................................................................................... ..................................................................................................................................... [4] (ii) The students recorded the water level in the plastic tube every minute for 10 minutes. The results of the measurements along transect line A are shown in Table 2.1 (Insert). Use these results to complete the measurements for site 4 on transect A in Fig. 2.3 below. [2] Results of students’ measurements of water level at sites on transect A 120 110 100 site 1 90 site 6 80 site 4 70 water level in tube (mm) 60 50 site 2 40 30 20 10 site 5 00 1 2 3 4 5 6 7 8 9 10site 3 time (minutes) Fig. 2.3 (iii) Compare the fall in water level for site 1 and site 5 on transect A. ........................................................................................................................................... ........................................................................................................................................... ........................................................................................................................................... ..................................................................................................................................... [2] (iv) The students calculated the infiltration rate at each site. Use the data in Table 2.1 to show the calculation which produced the result for site 2 on transect A in the space below. fall in water level (mm) Infiltration rate = time = = 7.2 mm per min [2] (v) The measurements of distance from the lake and infiltration rate at the different fieldwork sites on the three transect lines are shown in Table 2.2 (Insert). The students plotted these results on a graph, Fig. 2.4 on page 13. Plot the results at site 6 on transects A and C. [2] (vi) Which transect line agrees with Hypothesis 1: The rate of infiltration increases as you go further from the lake? Tick (✓) your choice below and support your answer with evidence from Fig. 2.4 and Table 2.2. transect line Tick (✓) A B C ........................................................................................................................................... ........................................................................................................................................... ........................................................................................................................................... ........................................................................................................................................... ........................................................................................................................................... ..................................................................................................................................... [3]
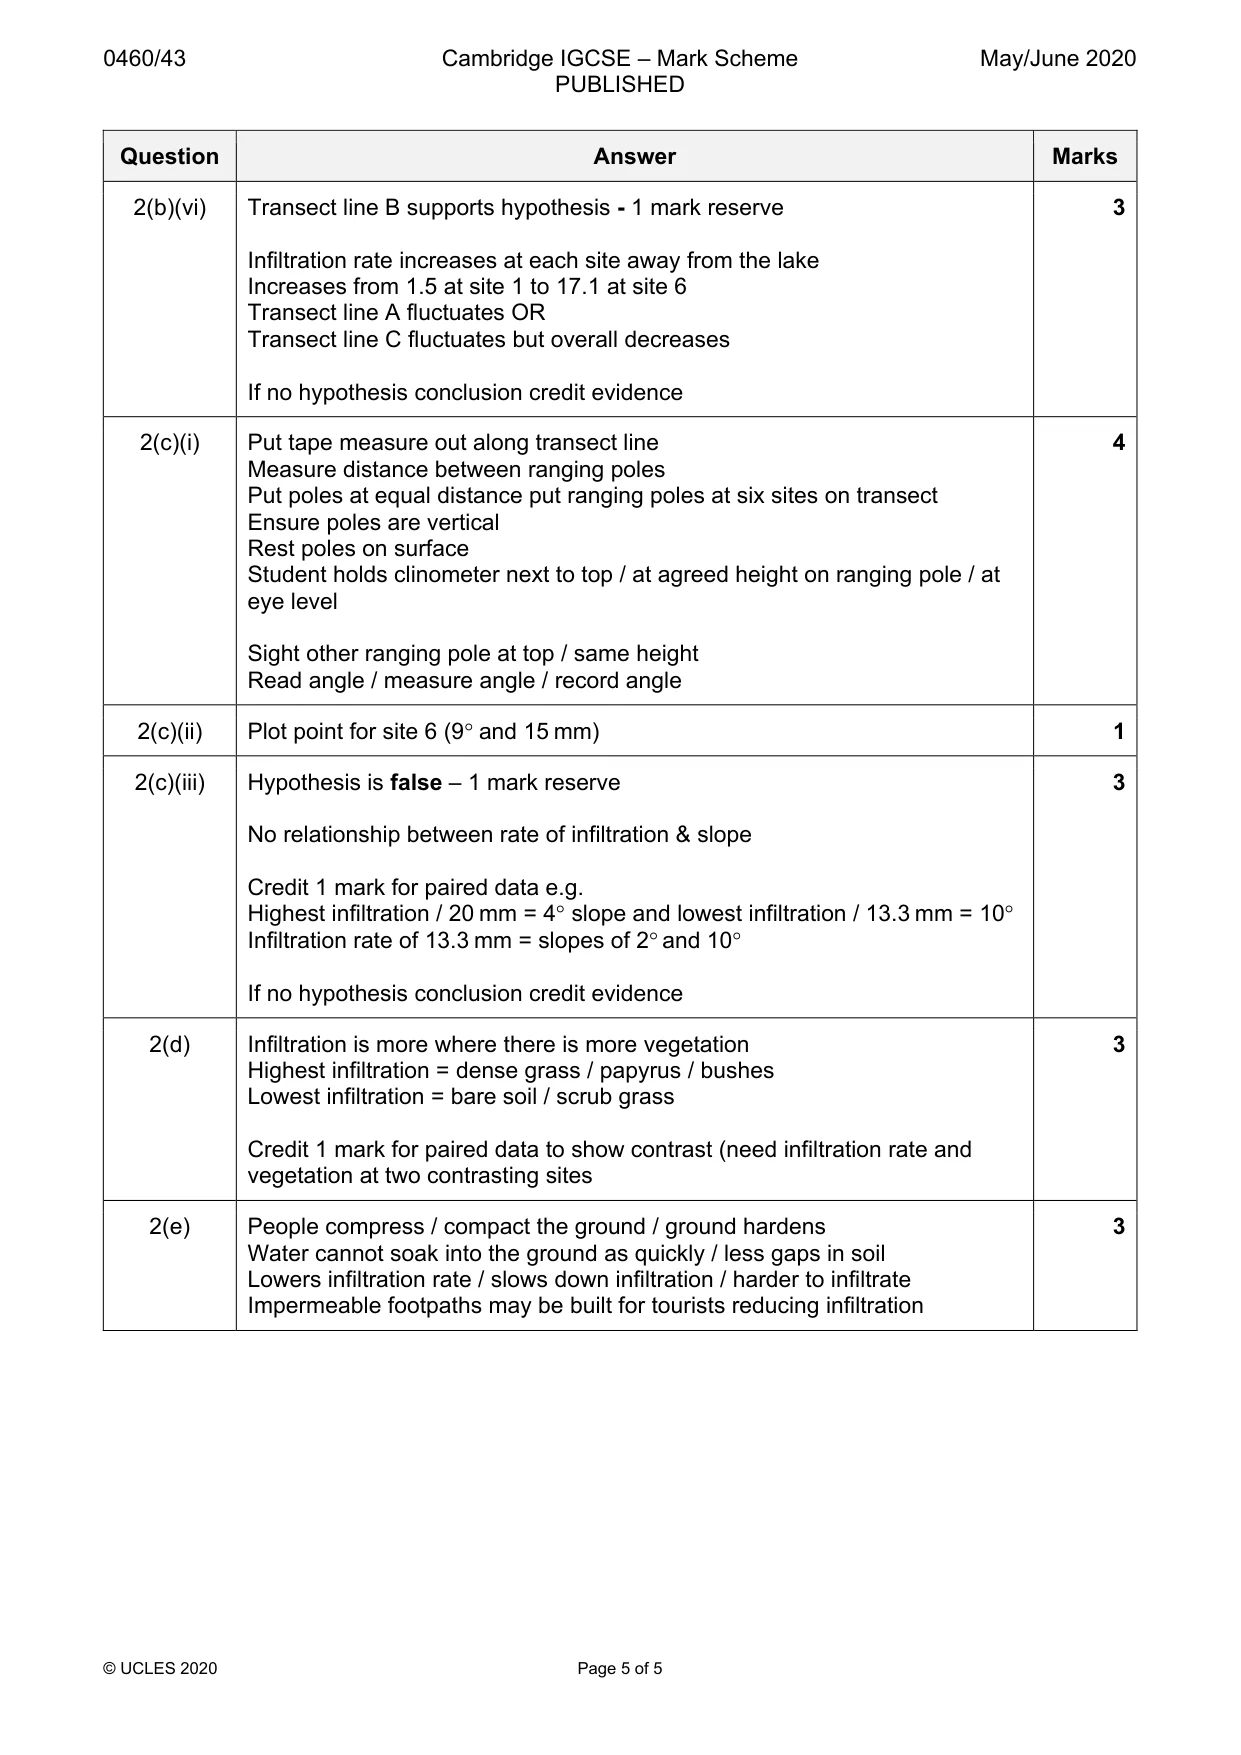
Mark scheme: 2(a) Water soaking into the soil from the ground 1 2(b)(i) Push pipe into ground 4 Amount of water poured into pipe / water poured into pipe up to 120 mm Use scale to measure changing height of water in pipe Use stopwatch to time until water infiltrates / sinks into ground 2(b)(ii) Complete site 4 measurements 2 2 marks if 3 plots correct 1 mark if 1 or 2 plots correct 2(b)(iii) Water level falls less at site 1 / more at site 5 2 Falls 25 mm at site 1 and 118 mm at site 5 2(b)(iv) 120 − 48 72 2 OR 10 10 2(b)(v) Plot 3.5 mm (A) and 15.0 mm (C) at site 6 2 @ 1 2 2(b)(vi) Transect line B supports hypothesis - 1 mark reserve 3 Infiltration rate increases at each site away from the lake Increases from 1.5 at site 1 to 17.1 at site 6 Transect line A fluctuates OR Transect line C fluctuates but overall decreases If no hypothesis conclusion credit evidence 2(c)(i) Put tape measure out along transect line 4 Measure distance between ranging poles Put poles at equal distance put ranging poles at six sites on transect Ensure poles are vertical Rest poles on surface Student holds clinometer next to top / at agreed height on ranging pole / at eye level Sight other ranging pole at top / same height Read angle / measure angle / record angle 2(c)(ii) Plot point for site 6 (9° and 15 mm) 1 2(c)(iii) Hypothesis is false – 1 mark reserve 3 No relationship between rate of infiltration & slope Credit 1 mark for paired data e.g. Highest infiltration / 20 mm = 4° slope and lowest infiltration / 13.3 mm = 10° Infiltration rate of 13.3 mm = slopes of 2° and 10° If no hypothesis conclusion credit evidence 2(d) Infiltration is more where there is more vegetation 3 Highest infiltration = dense grass / papyrus / bushes Lowest infiltration = bare soil / scrub grass Credit 1 mark for paired data to show contrast (need infiltration rate and vegetation at two contrasting sites 2(e) People compress / compact the ground / ground hardens 3 Water cannot soak into the ground as quickly / less gaps in soil Lowers infiltration rate / slows down infiltration / harder to infiltrate Impermeable footpaths may be built for tourists reducing infiltration
What was in this paper
The subtopics covered by these 2 questions, and how many questions each got. Open one in a new tab to see every Cambridge question on it.