Cambridge IGCSE Geography 0460 — 2020 May/June Paper 4 · Variant 1
0460/41/M/J/20 · 2 questions · 45 marks · ≈51 min
The question paper and its mark scheme, free to read here and free to download. This is Cambridge’s own paper, exactly as it was sat.
Question paper16 pages



Mark scheme6 pages
Answers below. Sit the paper first if you are practising.
Questions as text
Q1 · Students in Northern Ireland were studying the topic of weather and how to measure and…
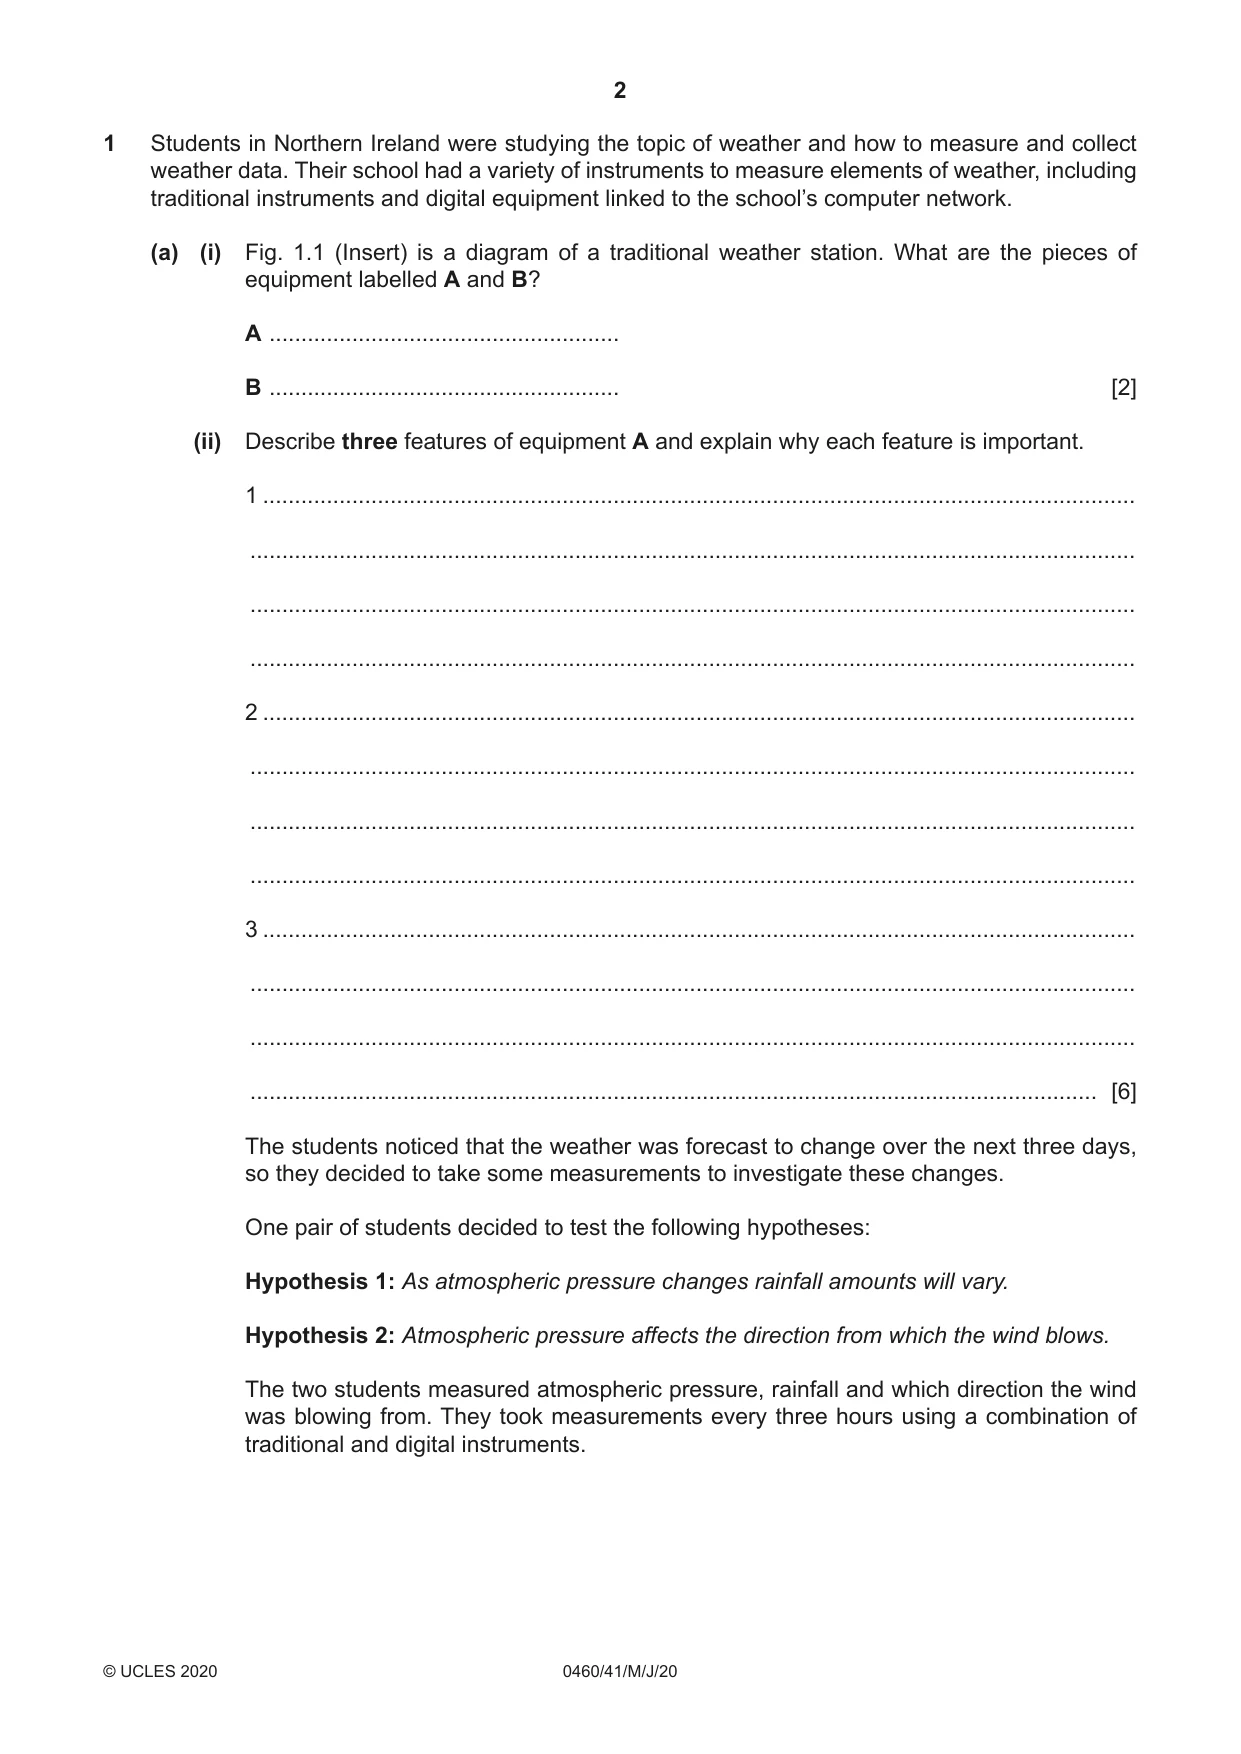
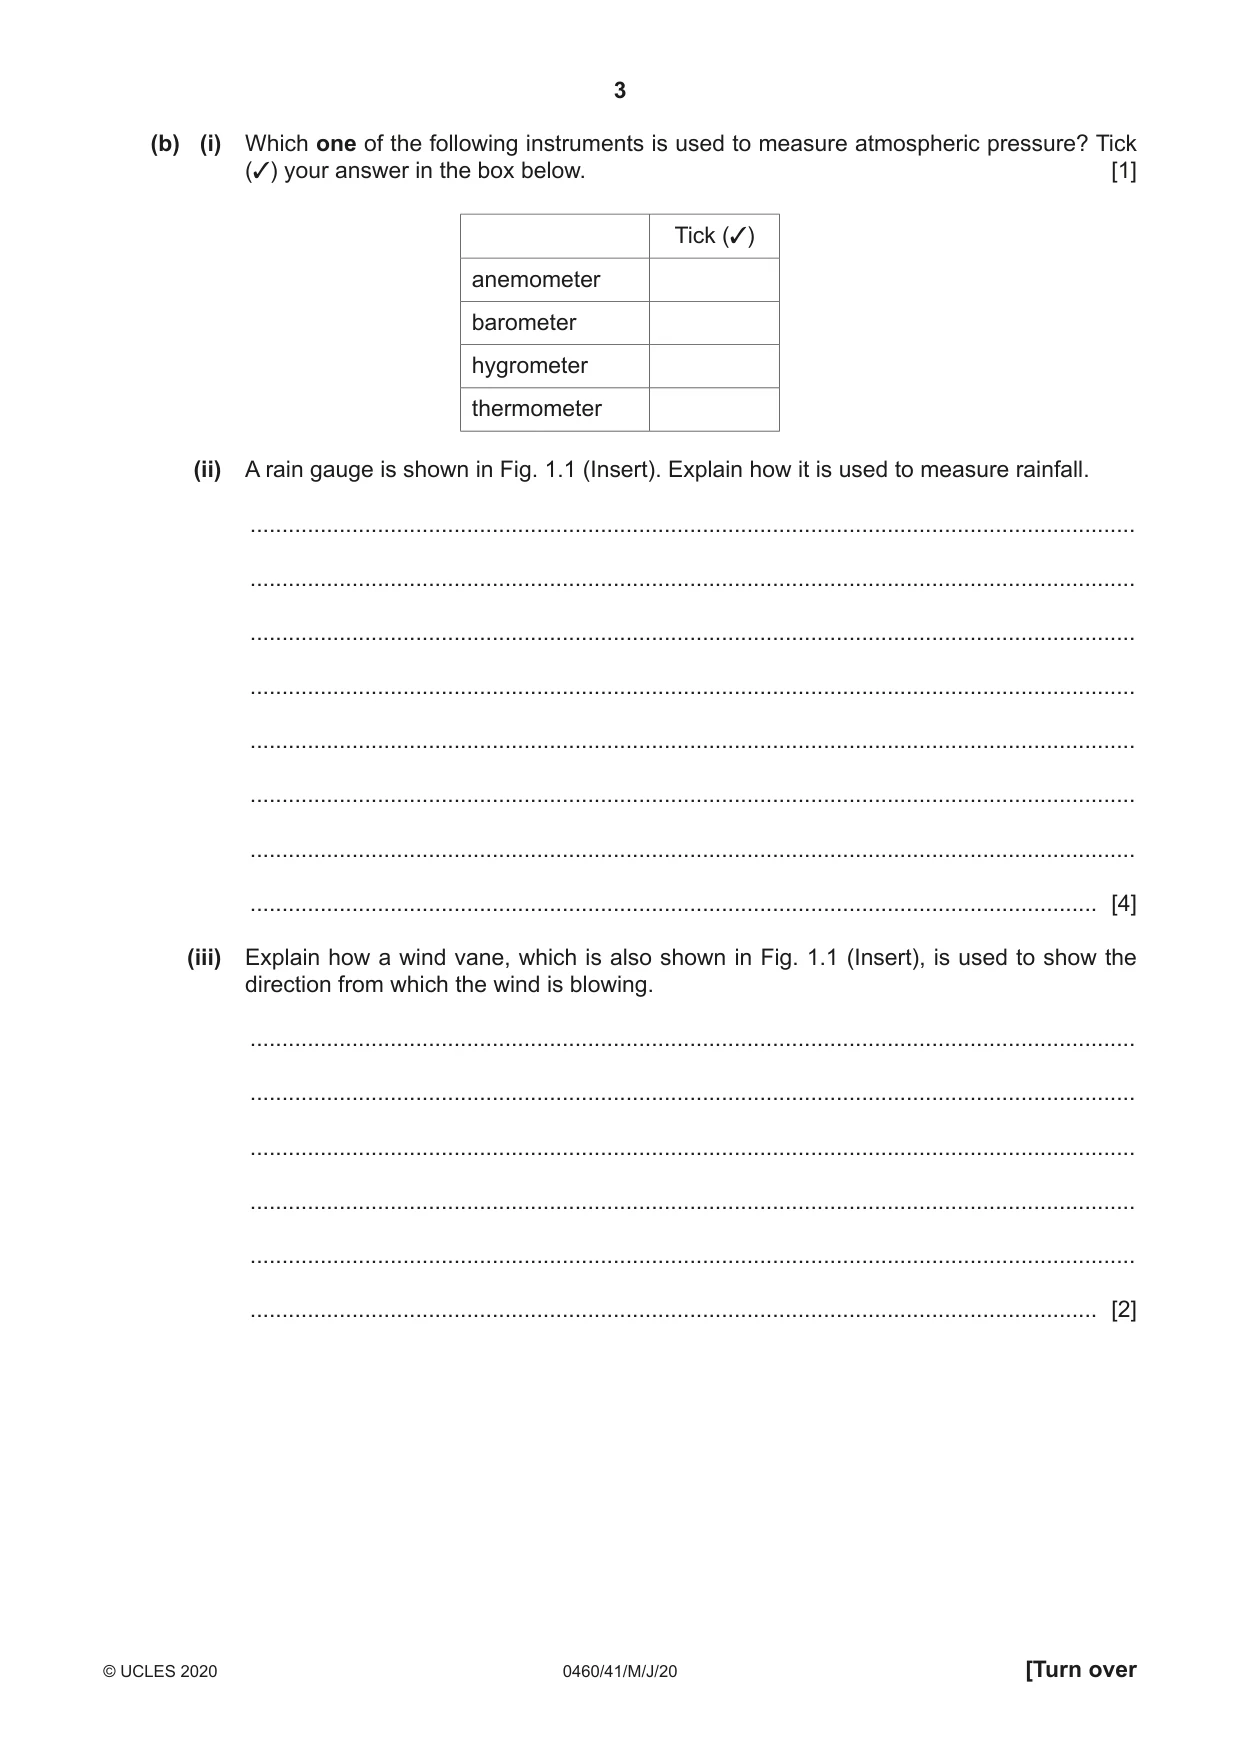
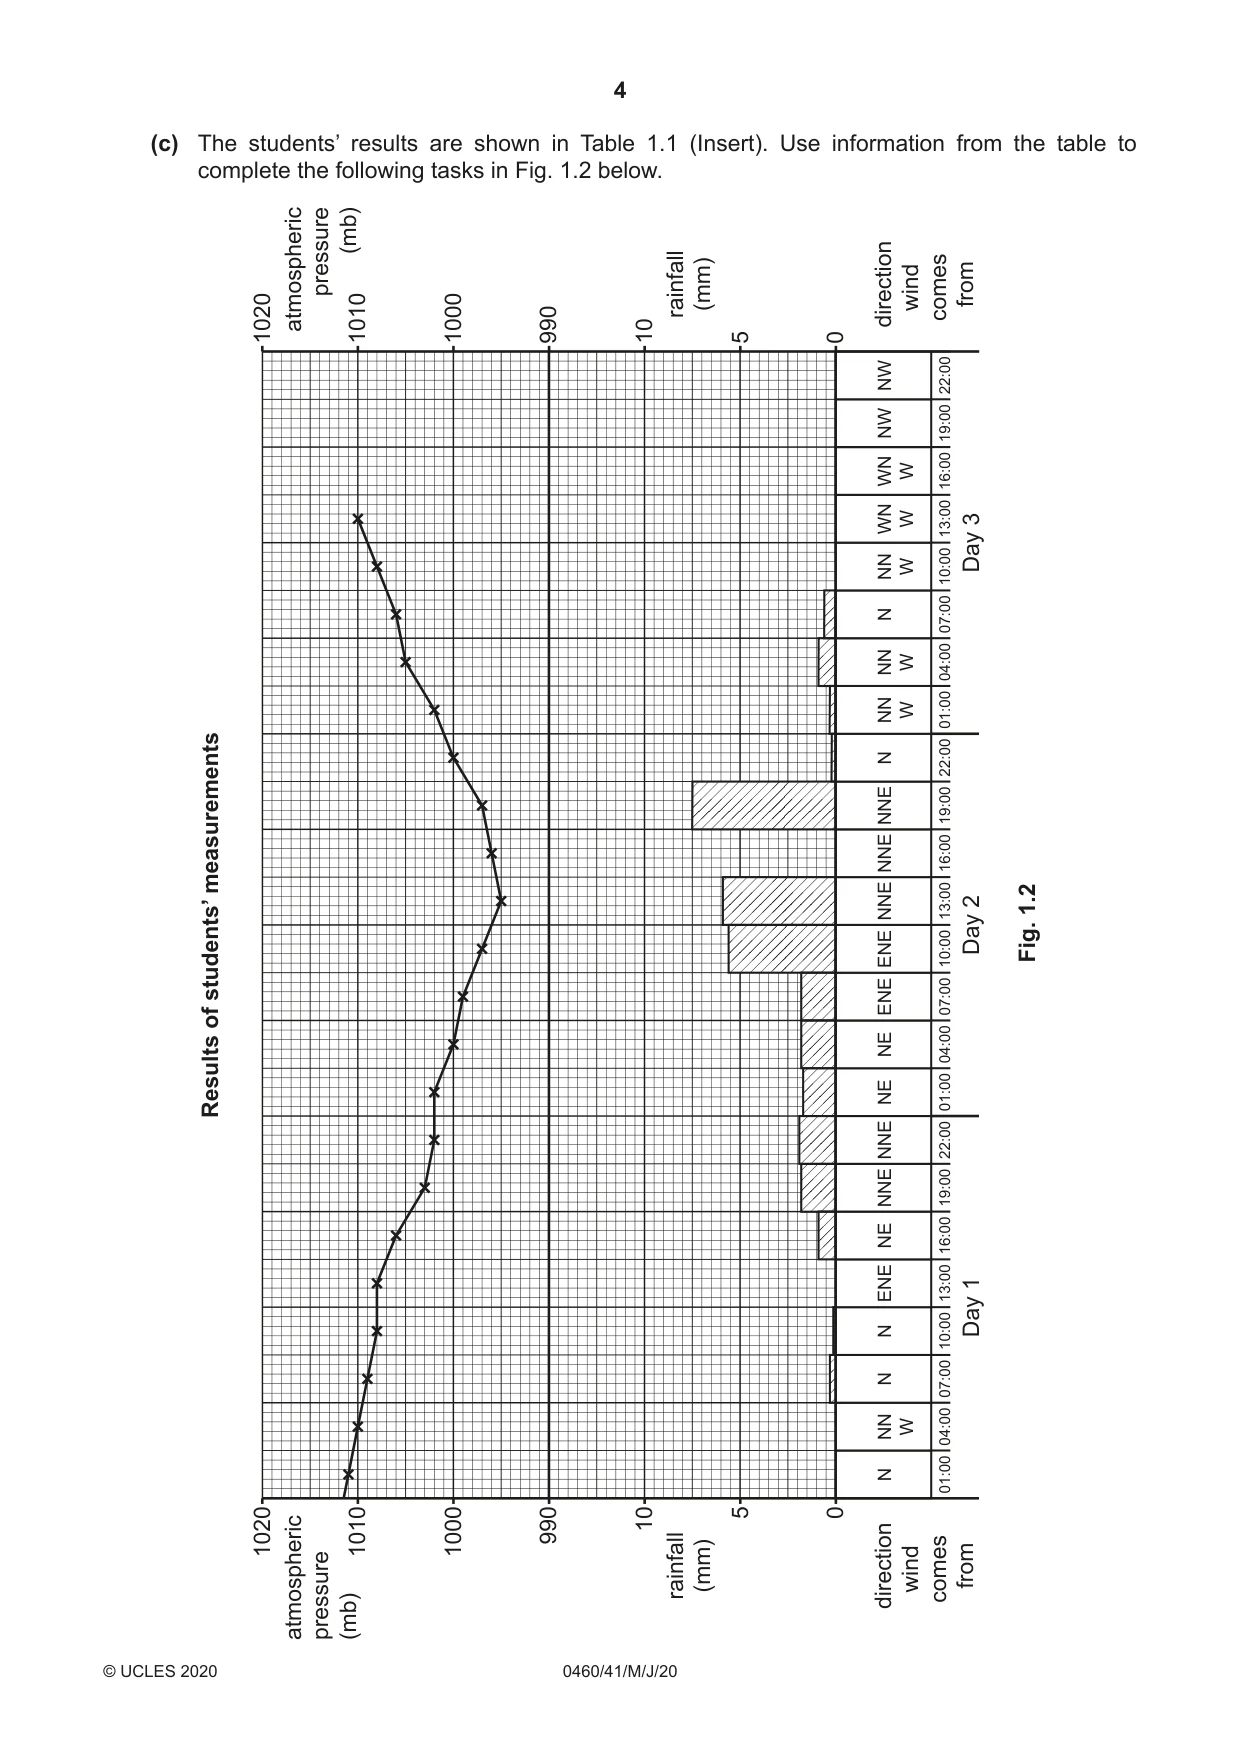
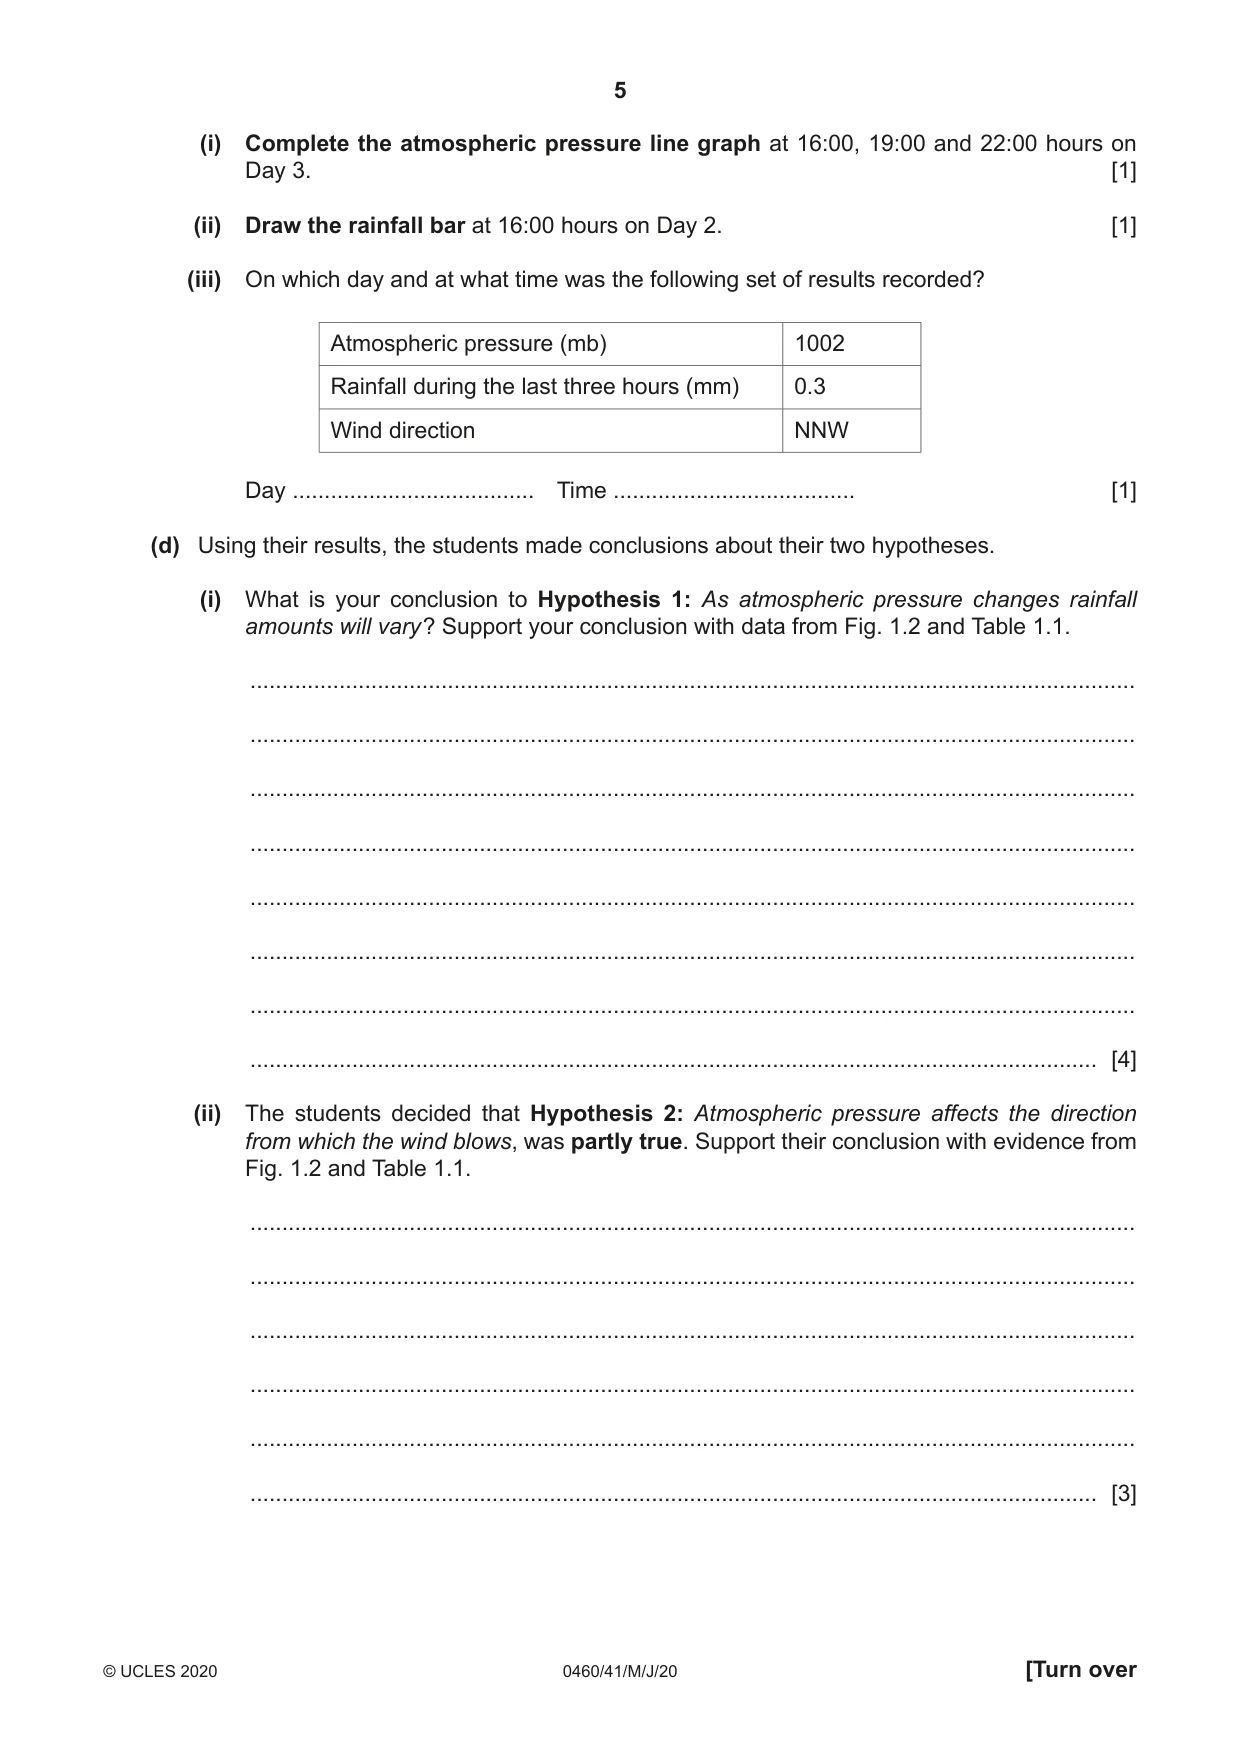
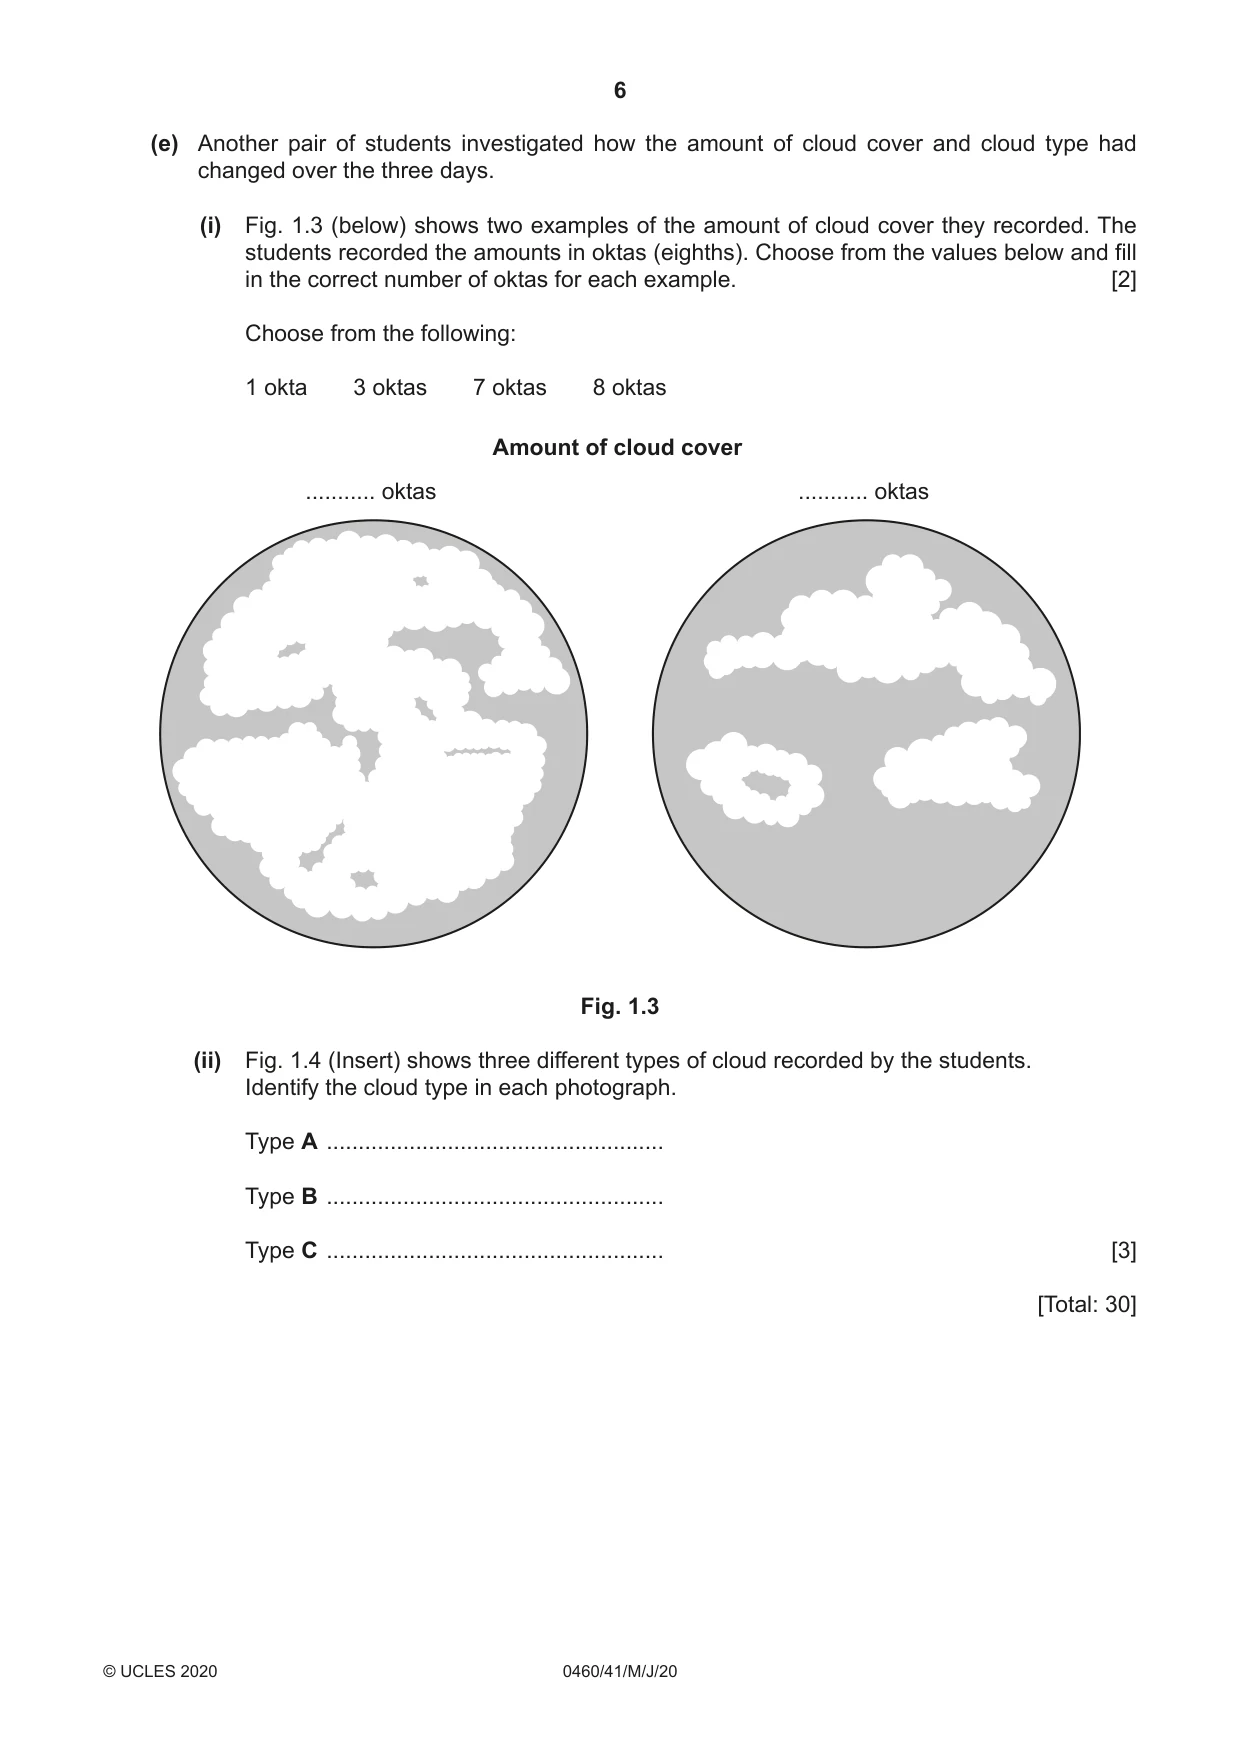
1 Students in Northern Ireland were studying the topic of weather and how to measure and collect weather data. Their school had a variety of instruments to measure elements of weather, including traditional instruments and digital equipment linked to the school’s computer network. (a) (i) Fig. 1.1 (Insert) is a diagram of a traditional weather station. What are the pieces of equipment labelled A and B? A ....................................................... B ....................................................... [2] (ii) Describe three features of equipment A and explain why each feature is important. 1 ......................................................................................................................................... ........................................................................................................................................... ........................................................................................................................................... ........................................................................................................................................... 2 ......................................................................................................................................... ........................................................................................................................................... ........................................................................................................................................... ........................................................................................................................................... 3 ......................................................................................................................................... ........................................................................................................................................... ........................................................................................................................................... ..................................................................................................................................... [6] The students noticed that the weather was forecast to change over the next three days, so they decided to take some measurements to investigate these changes. One pair of students decided to test the following hypotheses: Hypothesis 1: As atmospheric pressure changes rainfall amounts will vary. Hypothesis 2: Atmospheric pressure affects the direction from which the wind blows. The two students measured atmospheric pressure, rainfall and which direction the wind was blowing from. They took measurements every three hours using a combination of traditional and digital instruments. (b) (i) Which one of the following instruments is used to measure atmospheric pressure? Tick (3) your answer in the box below. [1] Tick (3) anemometer barometer hygrometer thermometer (ii) A rain gauge is shown in Fig. 1.1 (Insert). Explain how it is used to measure rainfall. ........................................................................................................................................... ........................................................................................................................................... ........................................................................................................................................... ........................................................................................................................................... ........................................................................................................................................... ........................................................................................................................................... ........................................................................................................................................... ..................................................................................................................................... [4] (iii) Explain how a wind vane, which is also shown in Fig. 1.1 (Insert), is used to show the direction from which the wind is blowing. ........................................................................................................................................... ........................................................................................................................................... ........................................................................................................................................... ........................................................................................................................................... ........................................................................................................................................... ..................................................................................................................................... [2] (i) Complete the atmospheric pressure line graph at 16:00, 19:00 and 22:00 hours on Day 3. [1] (ii) Draw the rainfall bar at 16:00 hours on Day 2. [1] (iii) On which day and at what time was the following set of results recorded? Atmospheric pressure (mb) 1002 Rainfall during the last three hours (mm) 0.3 Wind direction NNW Day ...................................... Time ...................................... [1] (d) Using their results, the students made conclusions about their two hypotheses. (i) What is your conclusion to Hypothesis 1: As atmospheric pressure changes rainfall amounts will vary ? Support your conclusion with data from Fig. 1.2 and Table 1.1. ........................................................................................................................................... ........................................................................................................................................... ........................................................................................................................................... ........................................................................................................................................... ........................................................................................................................................... ........................................................................................................................................... ........................................................................................................................................... ..................................................................................................................................... [4] (ii) The students decided that Hypothesis 2: Atmospheric pressure affects the direction from which the wind blows, was partly true. Support their conclusion with evidence from Fig. 1.2 and Table 1.1. ........................................................................................................................................... ........................................................................................................................................... ........................................................................................................................................... ........................................................................................................................................... ........................................................................................................................................... ..................................................................................................................................... [3] (e) Another pair of students investigated how the amount of cloud cover and cloud type had changed over the three days. (i) Fig. 1.3 (below) shows two examples of the amount of cloud cover they recorded. The students recorded the amounts in oktas (eighths). Choose from the values below and fill in the correct number of oktas for each example. [2] Choose from the following: 1 okta 3 oktas 7 oktas 8 oktas Amount of cloud cover ........... oktas ........... oktas Fig. 1.3 (ii) Fig. 1.4 (Insert) shows three different types of cloud recorded by the students. Identify the cloud type in each photograph. Type A ..................................................... Type B ..................................................... Type C ..................................................... [3] [Total: 30]
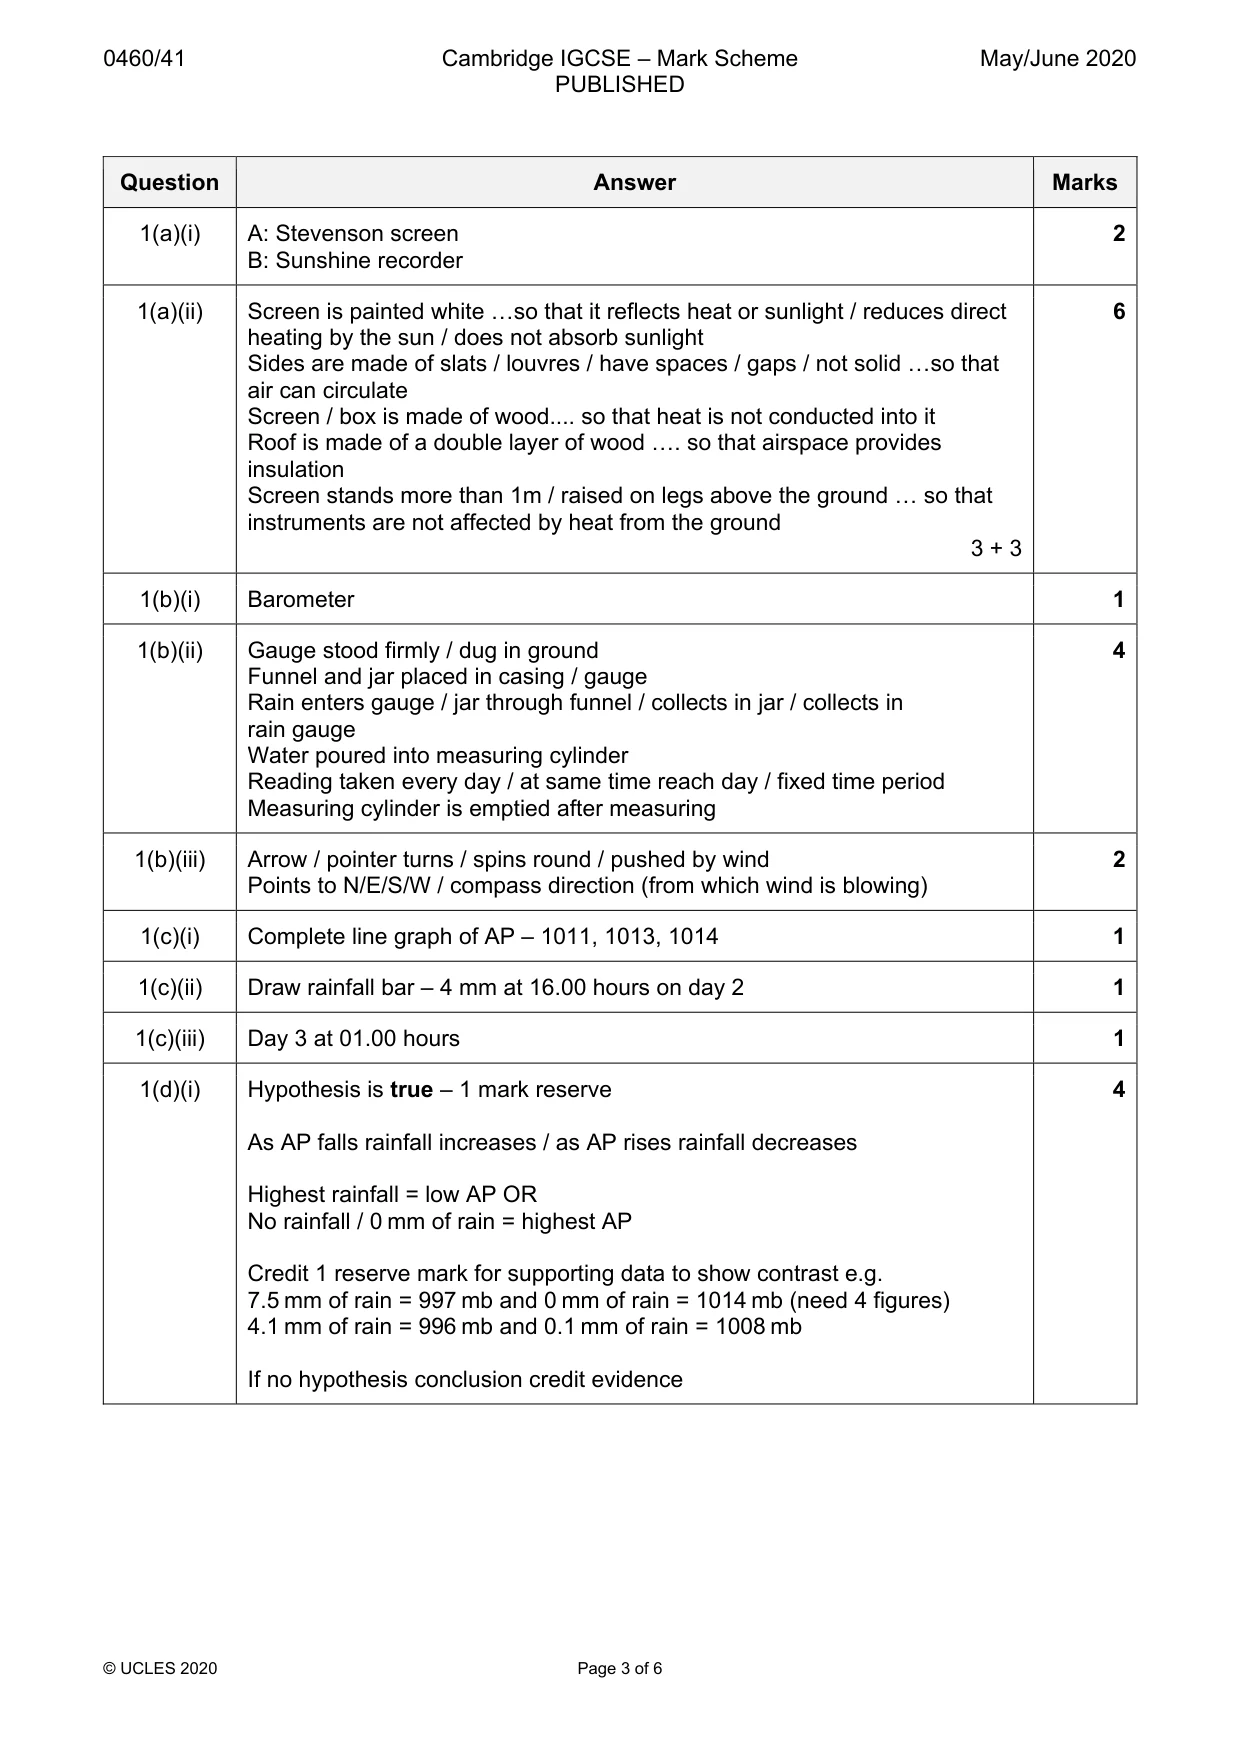
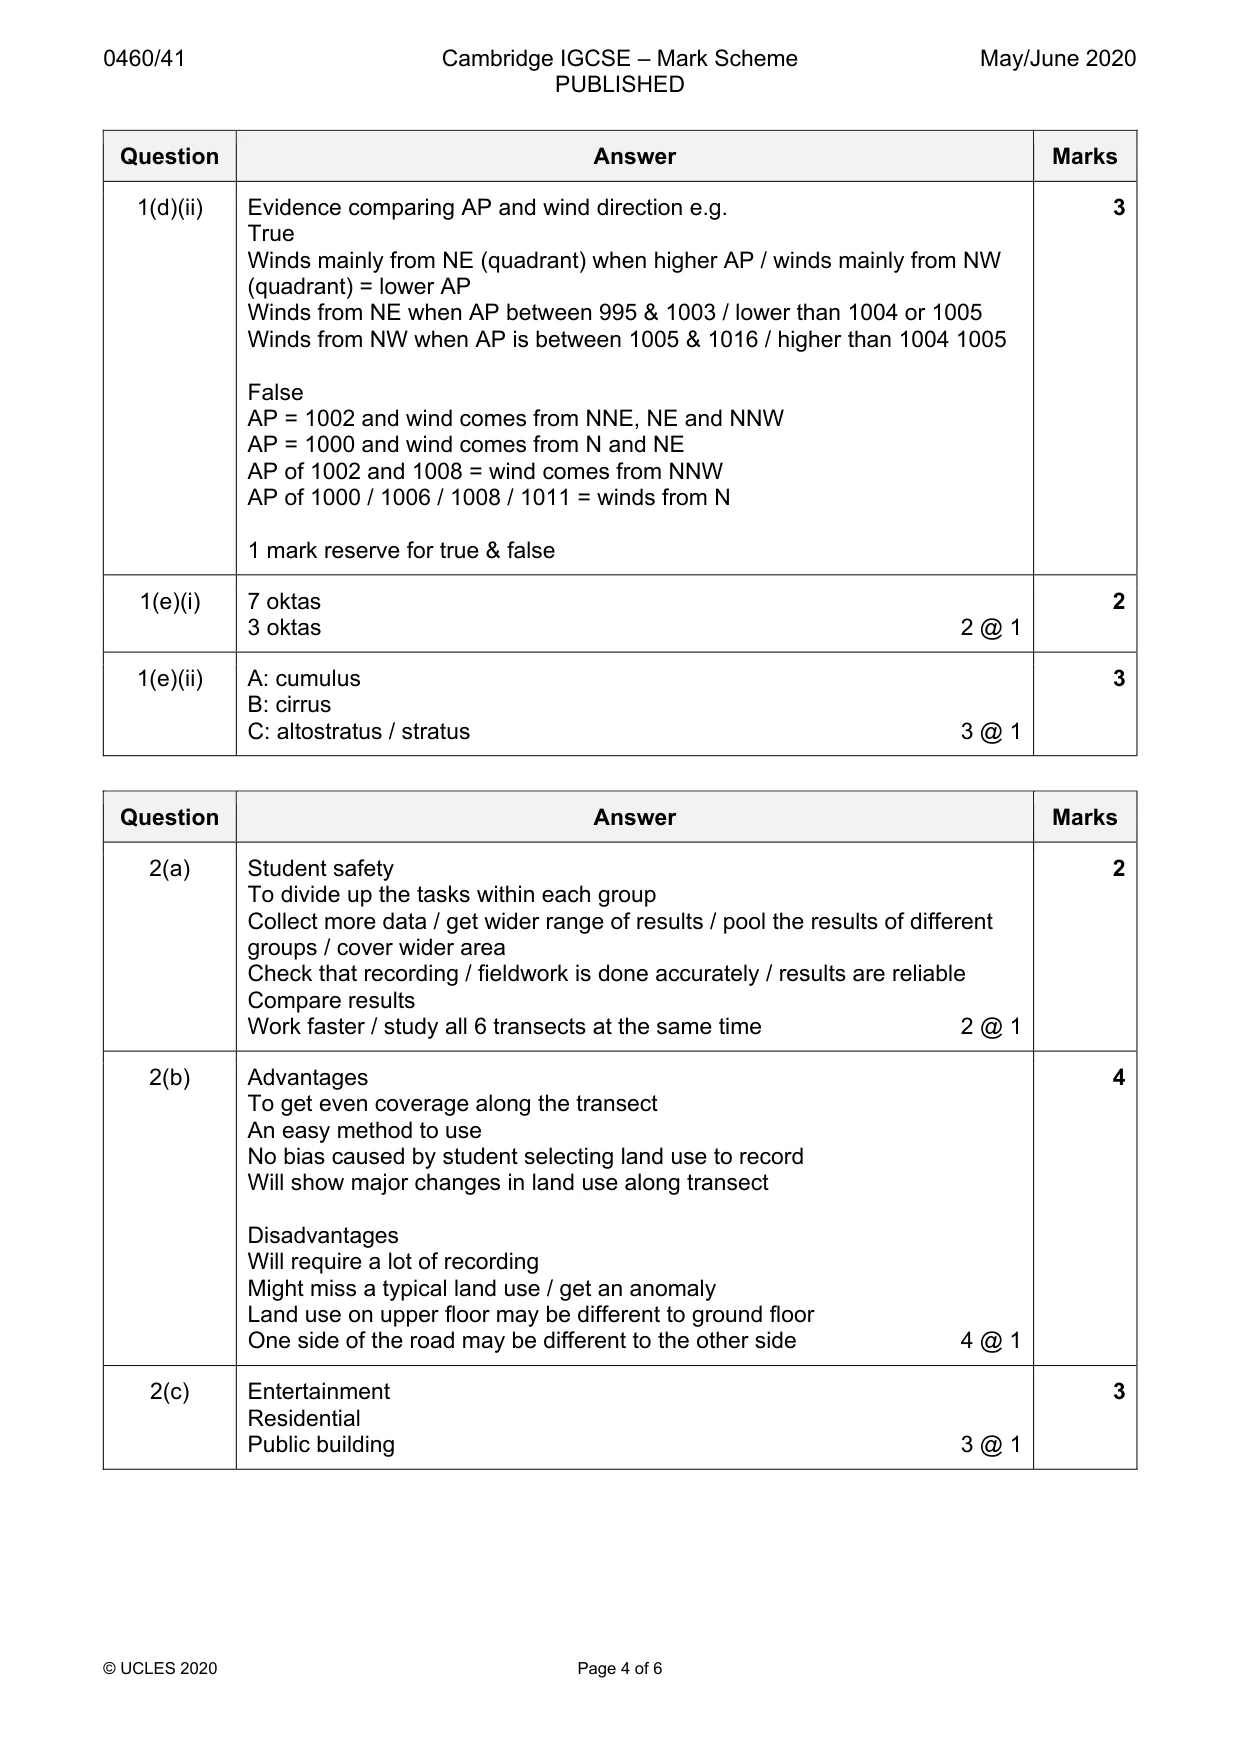
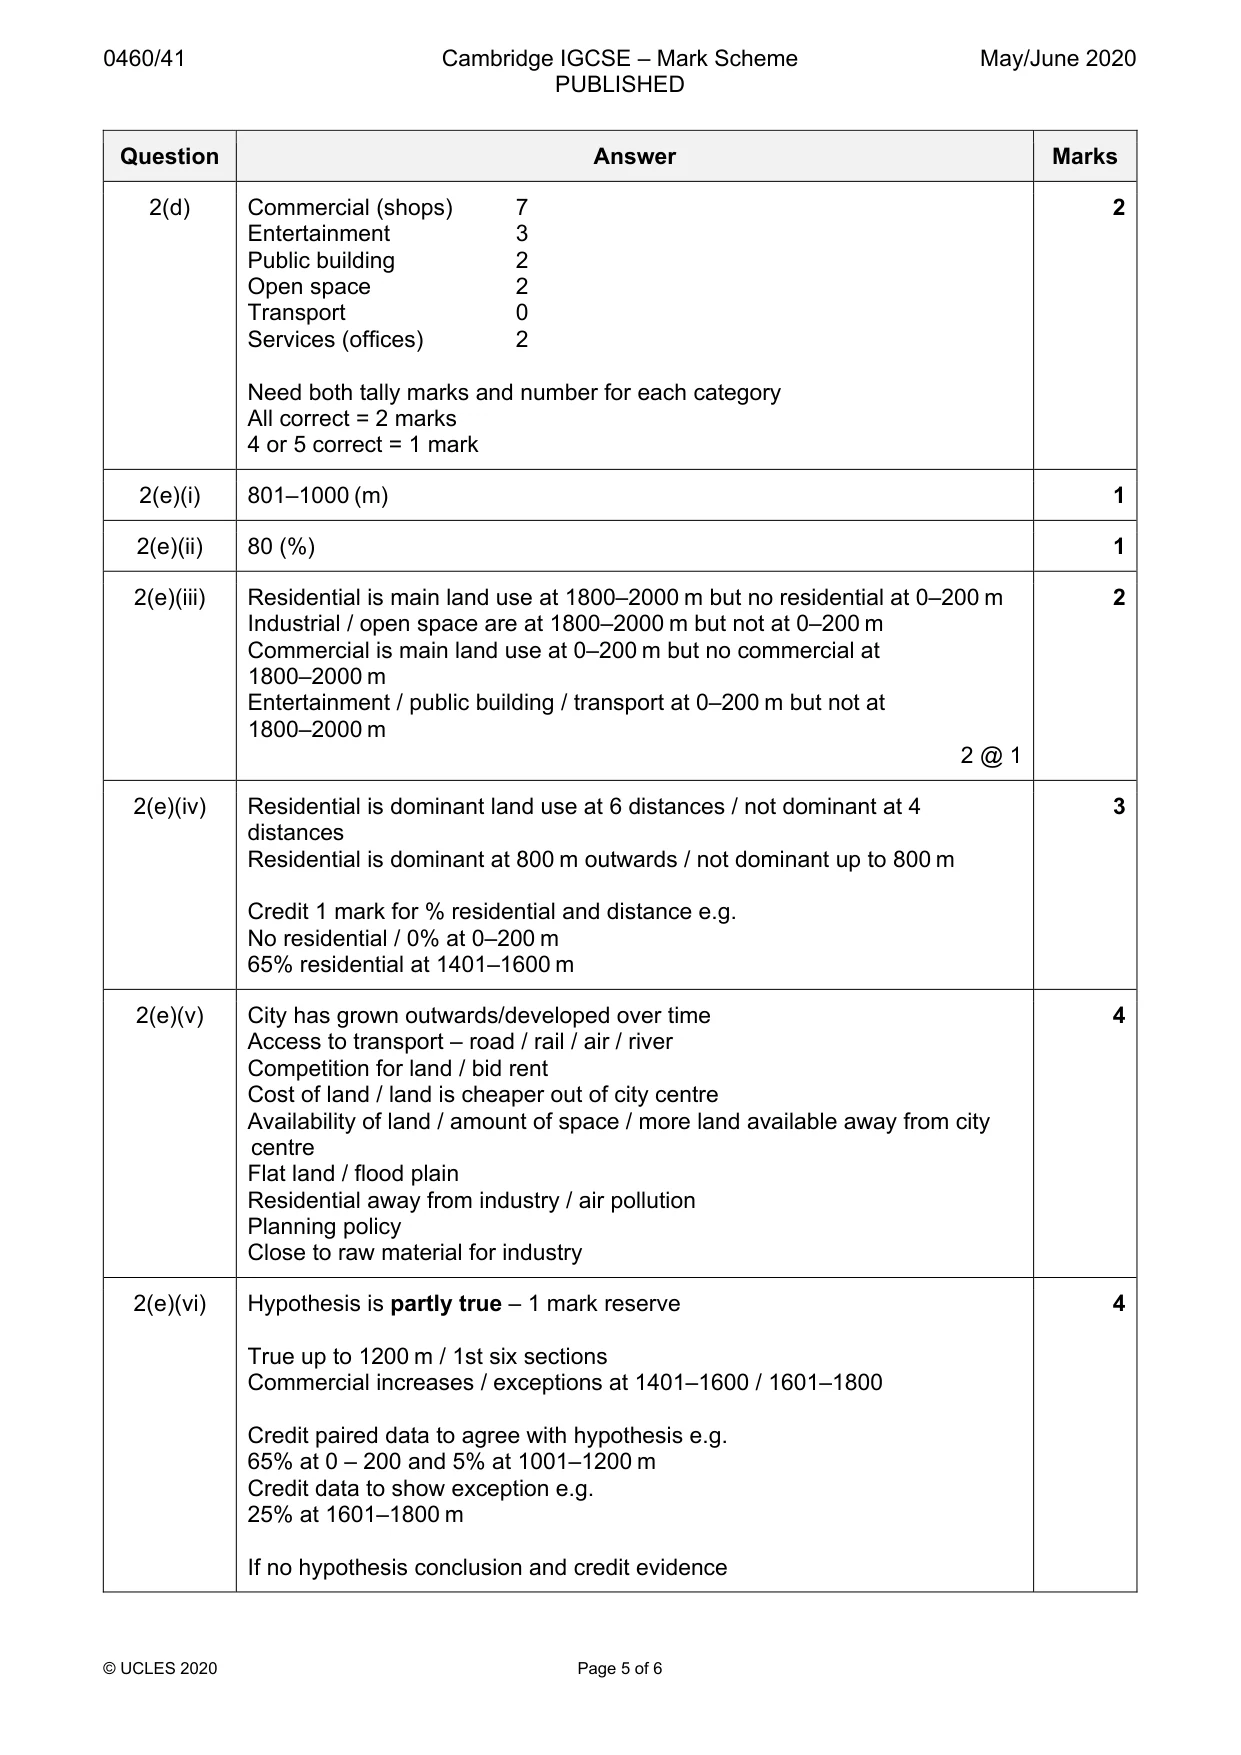
Mark scheme: Question Answer Marks 1(a)(i) A: Stevenson screen 2 B: Sunshine recorder 1(a)(ii) Screen is painted white …so that it reflects heat or sunlight / reduces direct 6 heating by the sun / does not absorb sunlight Sides are made of slats / louvres / have spaces / gaps / not solid …so that air can circulate Screen / box is made of wood.... so that heat is not conducted into it Roof is made of a double layer of wood …. so that airspace provides insulation Screen stands more than 1m / raised on legs above the ground … so that instruments are not affected by heat from the ground 3 + 3 1(b)(i) Barometer 1 1(b)(ii) Gauge stood firmly / dug in ground 4 Funnel and jar placed in casing / gauge Rain enters gauge / jar through funnel / collects in jar / collects in rain gauge Water poured into measuring cylinder Reading taken every day / at same time reach day / fixed time period Measuring cylinder is emptied after measuring 1(b)(iii) Arrow / pointer turns / spins round / pushed by wind 2 Points to N/E/S/W / compass direction (from which wind is blowing) 1(c)(i) Complete line graph of AP – 1011, 1013, 1014 1 1(c)(ii) Draw rainfall bar – 4 mm at 16.00 hours on day 2 1 1(c)(iii) Day 3 at 01.00 hours 1 1(d)(i) Hypothesis is true – 1 mark reserve 4 As AP falls rainfall increases / as AP rises rainfall decreases Highest rainfall = low AP OR No rainfall / 0 mm of rain = highest AP Credit 1 reserve mark for supporting data to show contrast e.g. 7.5 mm of rain = 997 mb and 0 mm of rain = 1014 mb (need 4 figures) 4.1 mm of rain = 996 mb and 0.1 mm of rain = 1008 mb If no hypothesis conclusion credit evidence 1(d)(ii) Evidence comparing AP and wind direction e.g. 3 True Winds mainly from NE (quadrant) when higher AP / winds mainly from NW (quadrant) = lower AP Winds from NE when AP between 995 & 1003 / lower than 1004 or 1005 Winds from NW when AP is between 1005 & 1016 / higher than 1004 1005 False AP = 1002 and wind comes from NNE, NE and NNW AP = 1000 and wind comes from N and NE AP of 1002 and 1008 = wind comes from NNW AP of 1000 / 1006 / 1008 / 1011 = winds from N 1 mark reserve for true & false 1(e)(i) 7 oktas 2 3 oktas 2 @ 1 1(e)(ii) A: cumulus 3 B: cirrus C: altostratus / stratus 3 @ 1
Q2 · Students were studying land use in cities
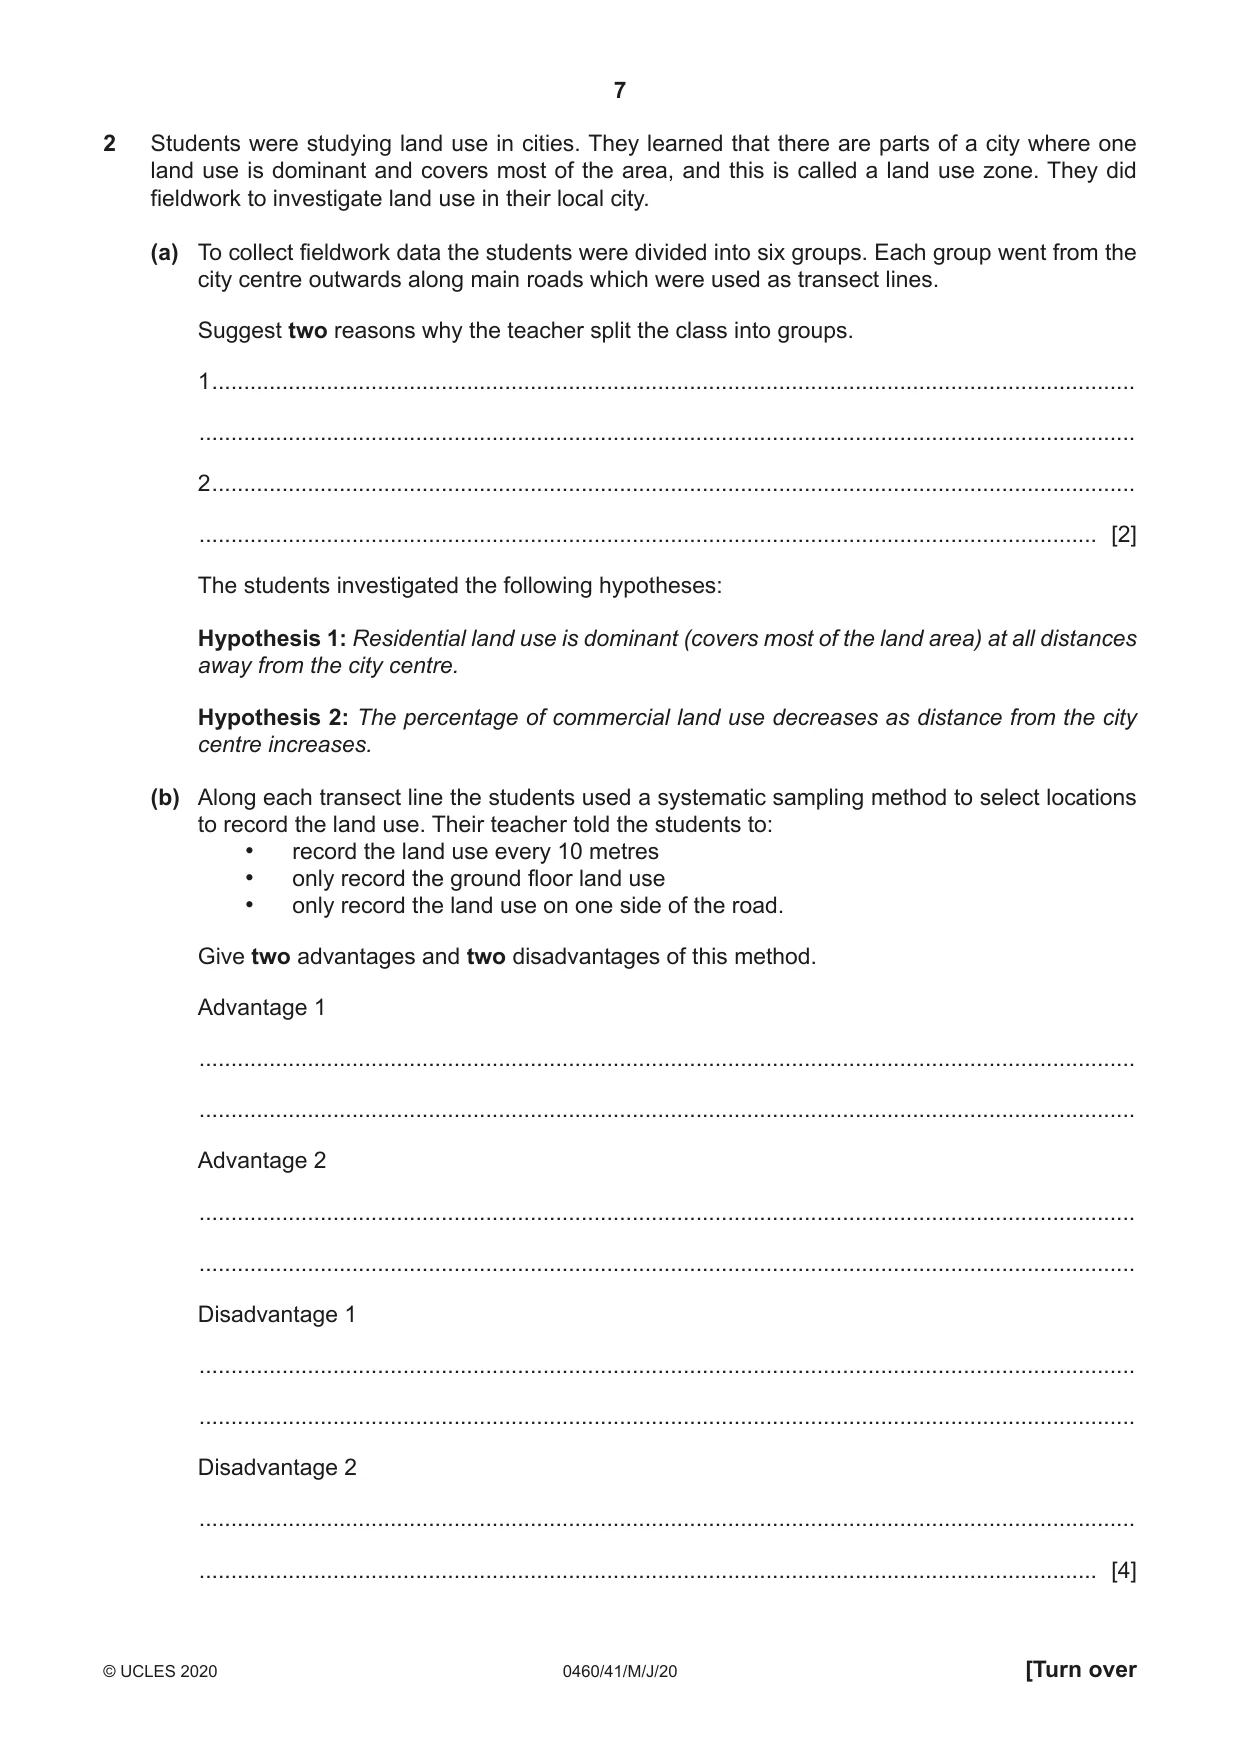
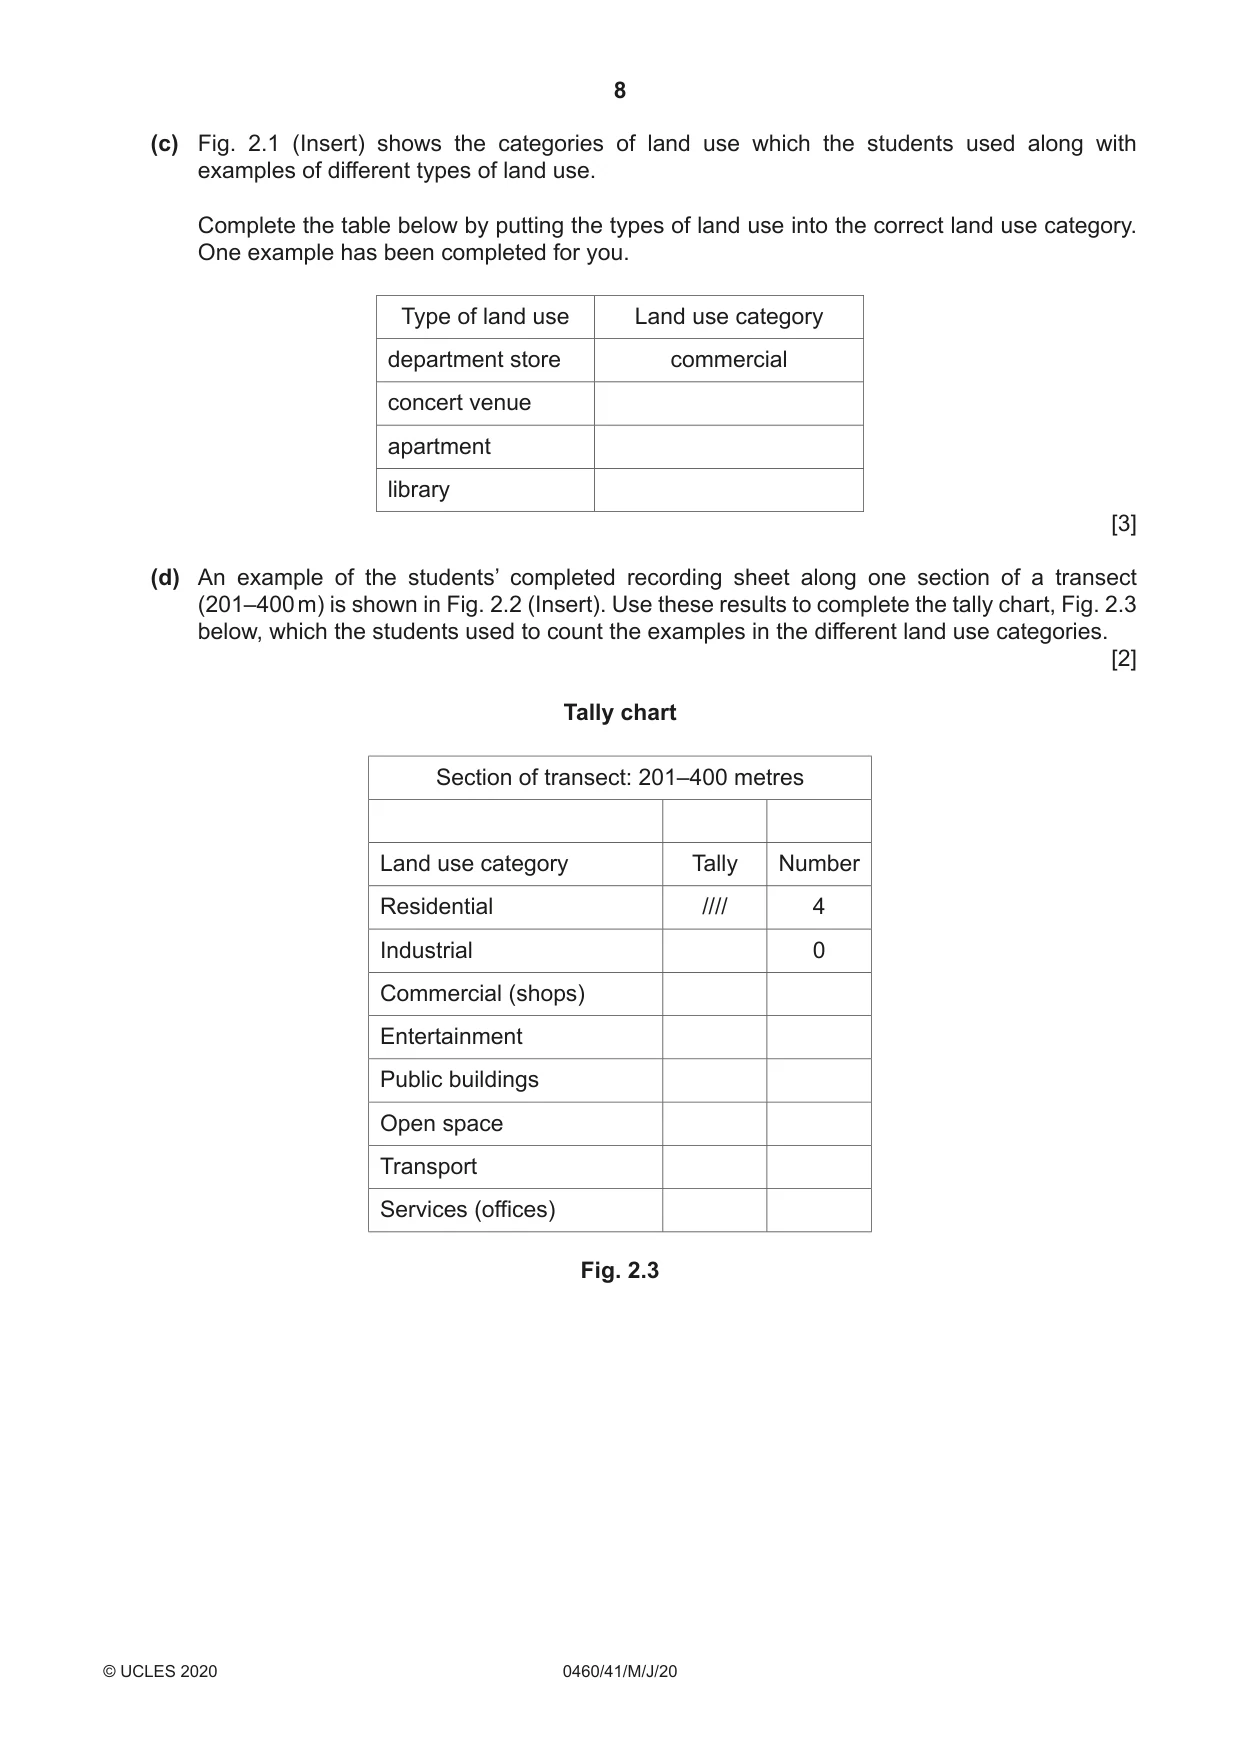
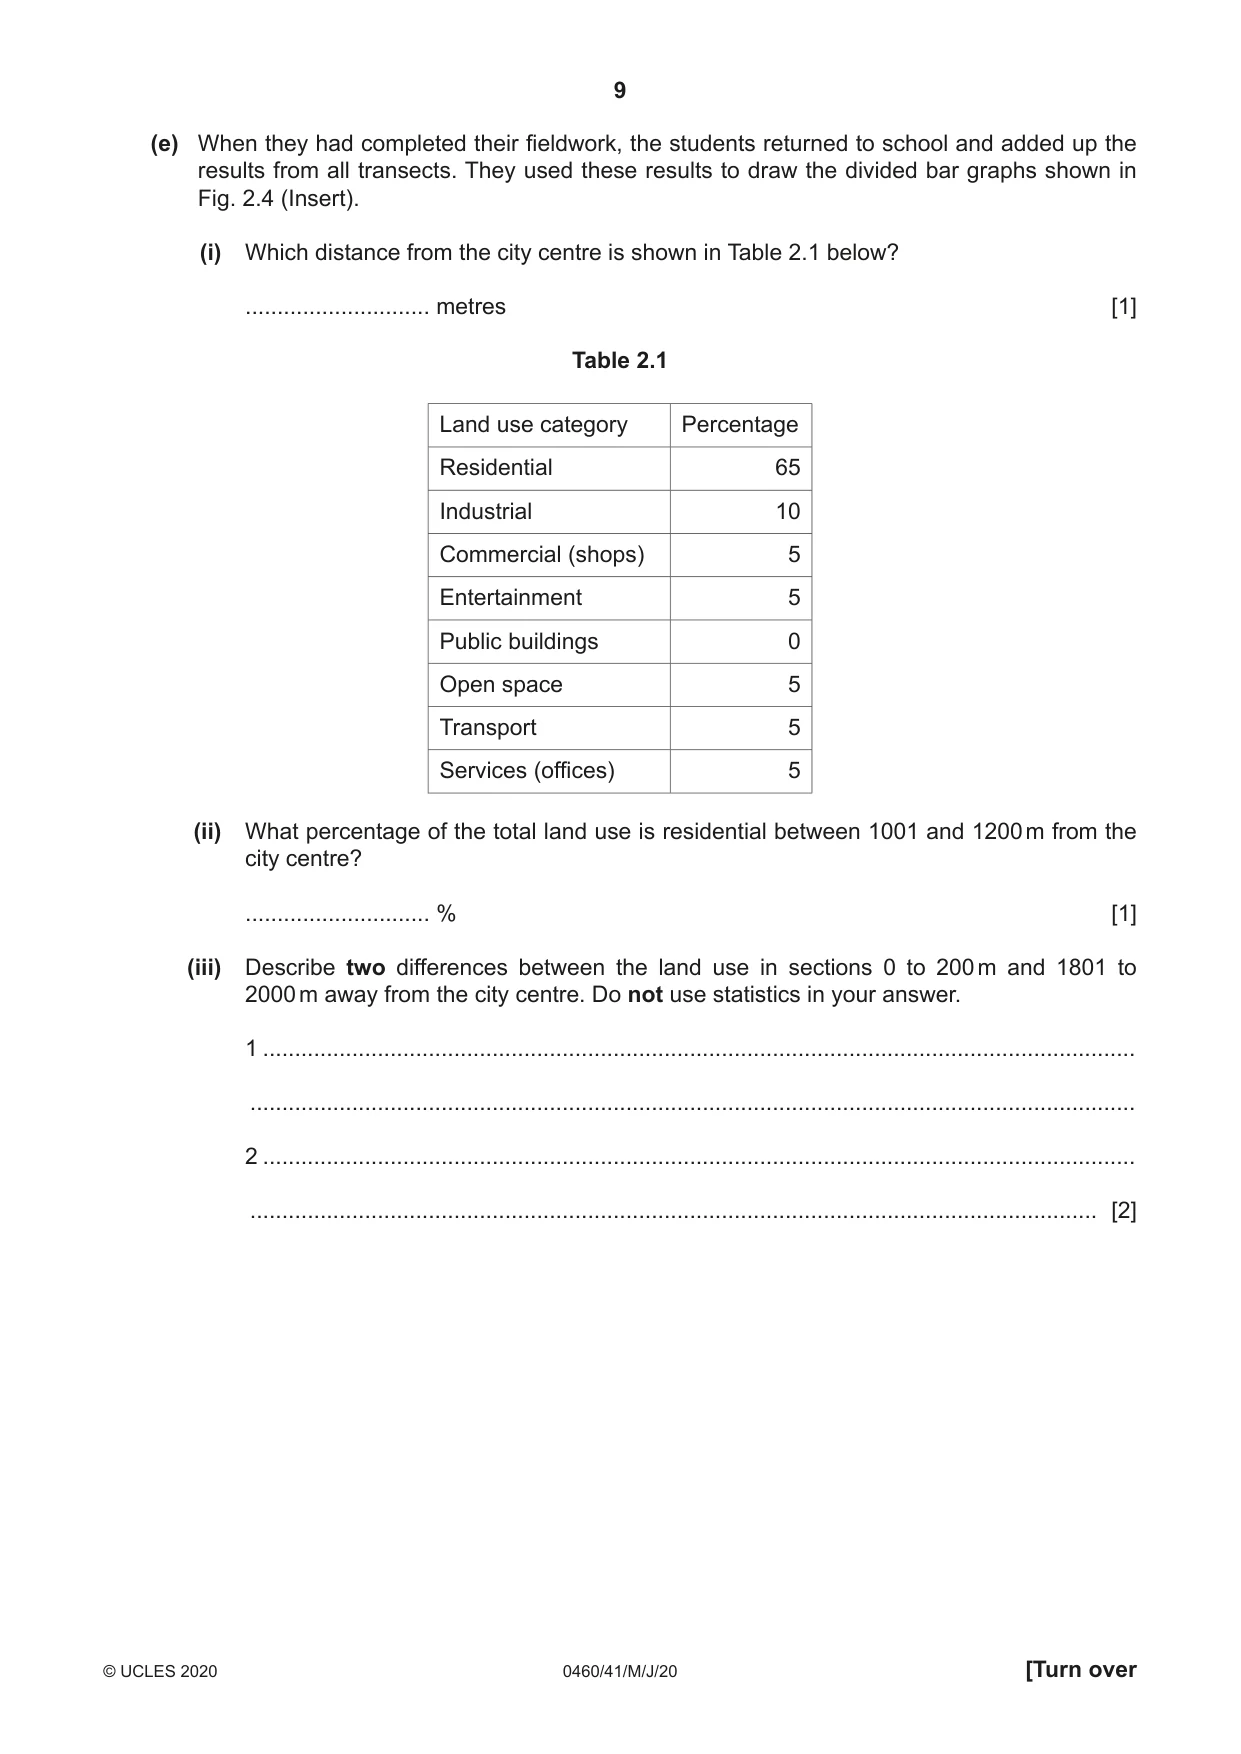
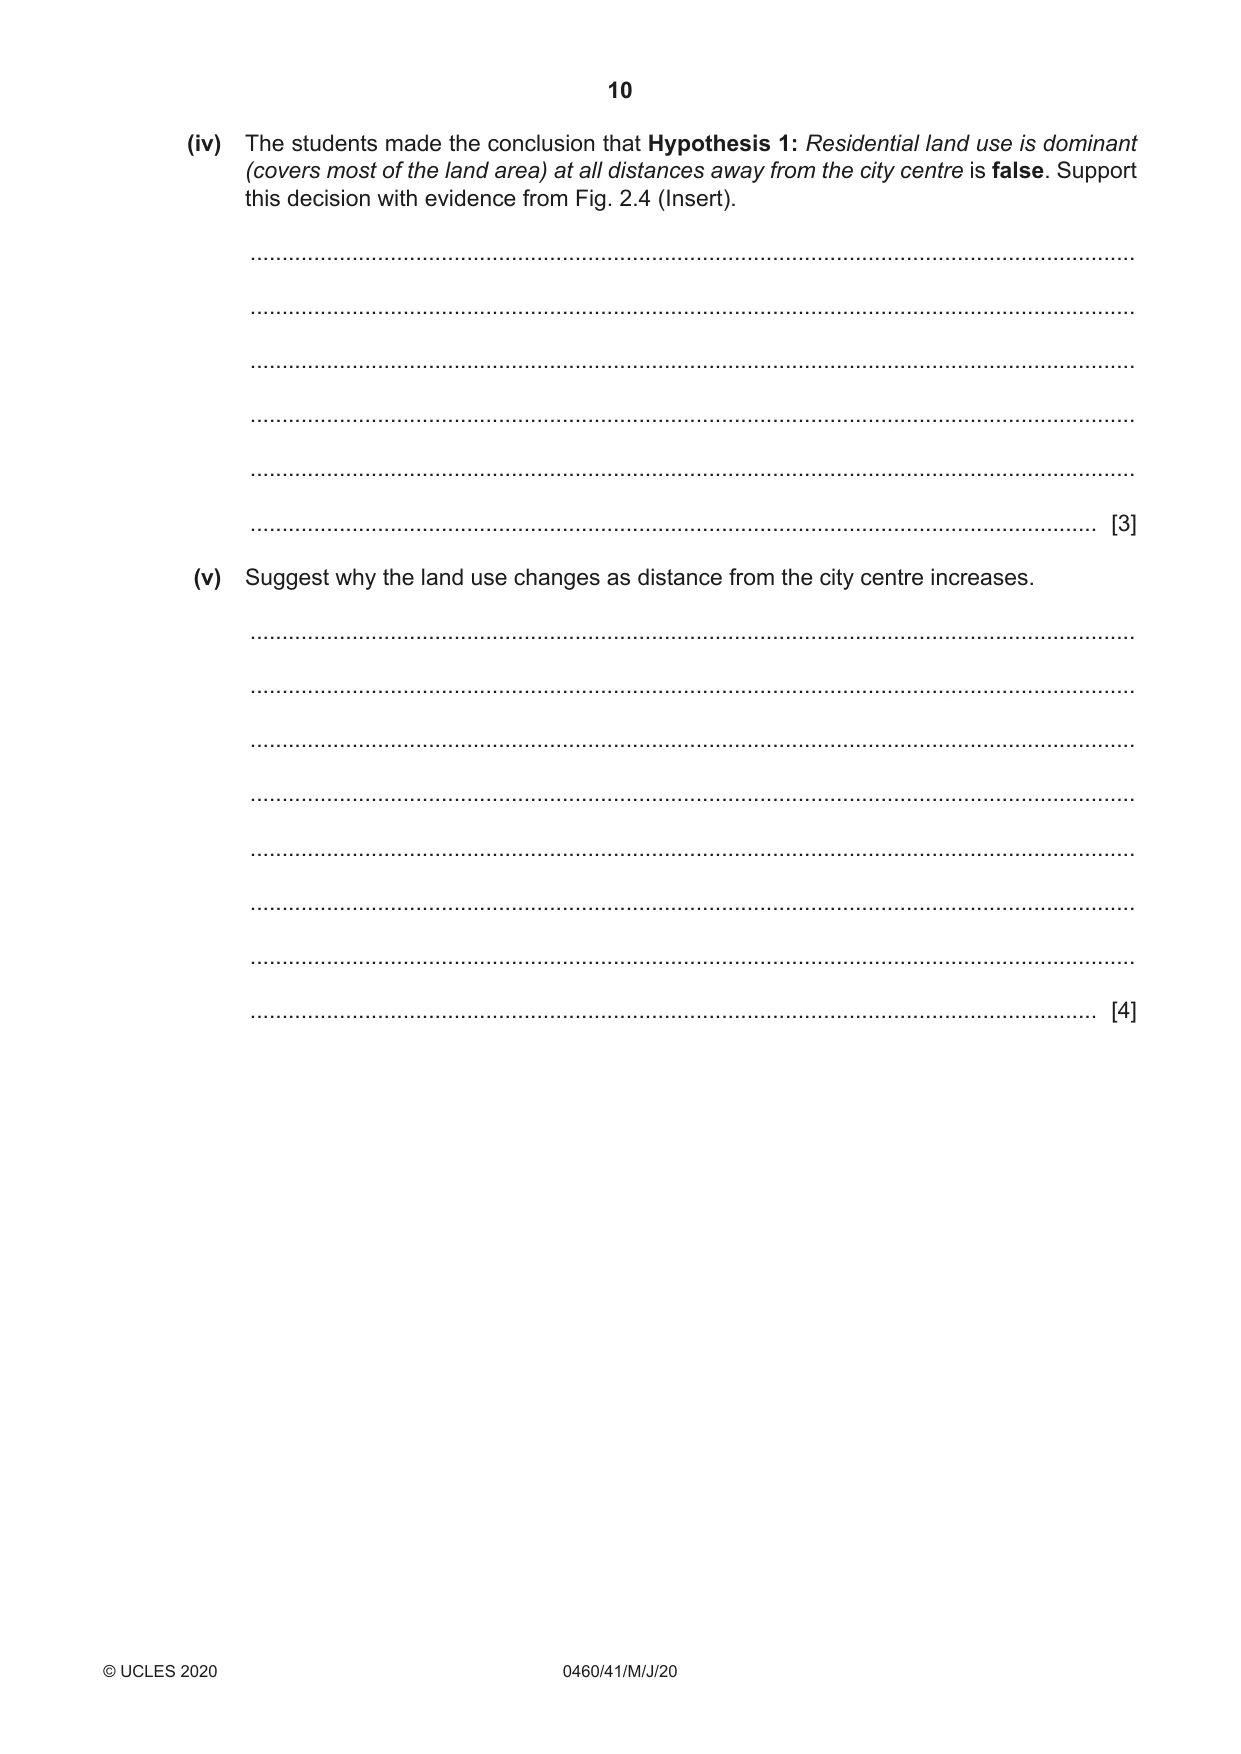
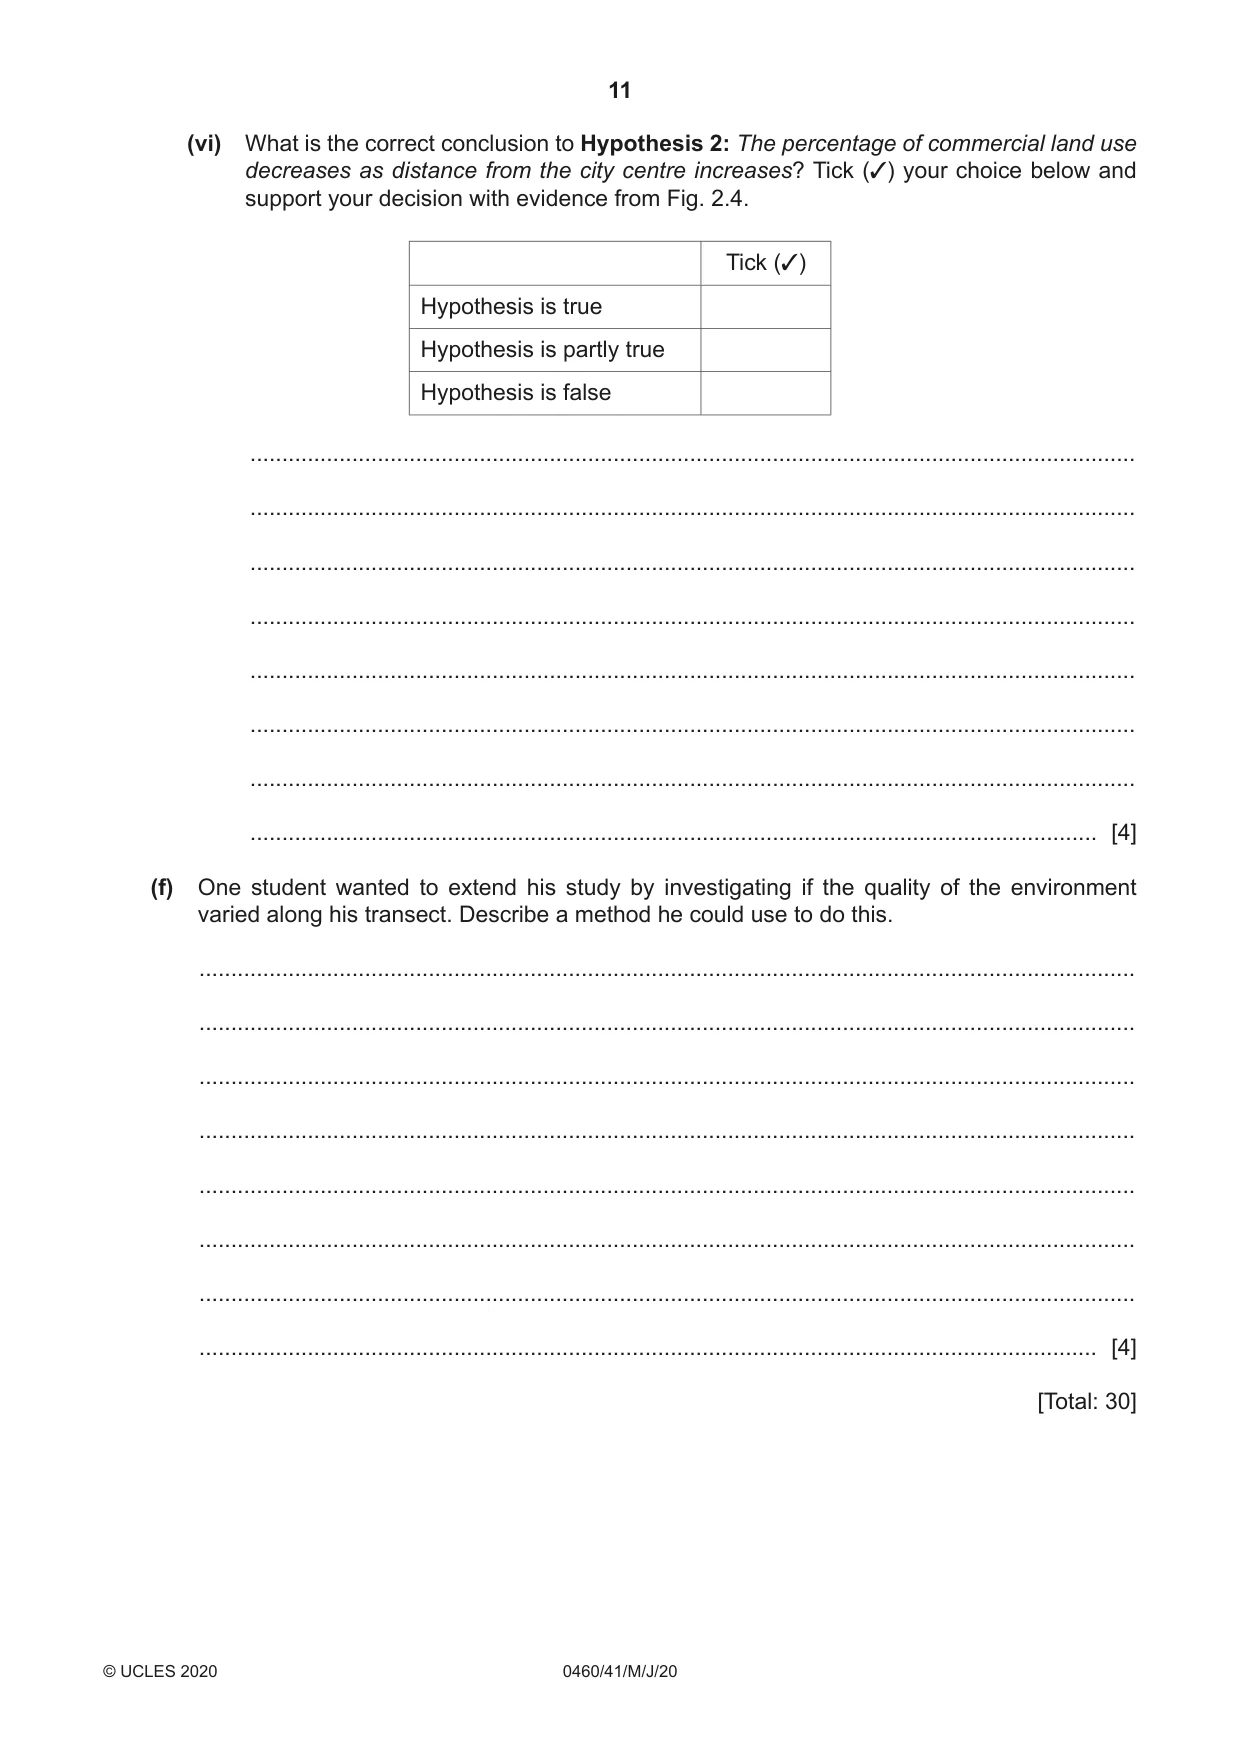
2 Students were studying land use in cities. They learned that there are parts of a city where one land use is dominant and covers most of the area, and this is called a land use zone. They did fieldwork to investigate land use in their local city. (a) To collect fieldwork data the students were divided into six groups. Each group went from the city centre outwards along main roads which were used as transect lines. Suggest two reasons why the teacher split the class into groups. 1 ................................................................................................................................................. ................................................................................................................................................... 2 ................................................................................................................................................. ............................................................................................................................................. [2] The students investigated the following hypotheses: Hypothesis 1: Residential land use is dominant (covers most of the land area) at all distances away from the city centre. Hypothesis 2: The percentage of commercial land use decreases as distance from the city centre increases. (b) Along each transect line the students used a systematic sampling method to select locations to record the land use. Their teacher told the students to: • record the land use every 10 metres • only record the ground floor land use • only record the land use on one side of the road. Give two advantages and two disadvantages of this method. Advantage 1 ................................................................................................................................................... ................................................................................................................................................... Advantage 2 ................................................................................................................................................... ................................................................................................................................................... Disadvantage 1 ................................................................................................................................................... ................................................................................................................................................... Disadvantage 2 ................................................................................................................................................... ............................................................................................................................................. [4] (c) Fig. 2.1 (Insert) shows the categories of land use which the students used along with examples of different types of land use. Complete the table below by putting the types of land use into the correct land use category. One example has been completed for you. Type of land use Land use category department store commercial concert venue apartment library [3] (d) An example of the students’ completed recording sheet along one section of a transect (201–400 m) is shown in Fig. 2.2 (Insert). Use these results to complete the tally chart, Fig. 2.3 below, which the students used to count the examples in the different land use categories. [2] Tally chart Section of transect: 201–400 metres Land use category Tally Number Residential //// 4 Industrial 0 Commercial (shops) Entertainment Public buildings Open space Transport Services (offices) Fig. 2.3 (e) When they had completed their fieldwork, the students returned to school and added up the results from all transects. They used these results to draw the divided bar graphs shown in Fig. 2.4 (Insert). (i) Which distance from the city centre is shown in Table 2.1 below? ............................. metres [1] Table 2.1 Land use category Percentage Residential 65 Industrial 10 Commercial (shops) 5 Entertainment 5 Public buildings 0 Open space 5 Transport 5 Services (offices) 5 (ii) What percentage of the total land use is residential between 1001 and 1200 m from the city centre? ............................. % [1] (iii) Describe two differences between the land use in sections 0 to 200 m and 1801 to 2000 m away from the city centre. Do not use statistics in your answer. 1 ......................................................................................................................................... ........................................................................................................................................... 2 ......................................................................................................................................... ..................................................................................................................................... [2]
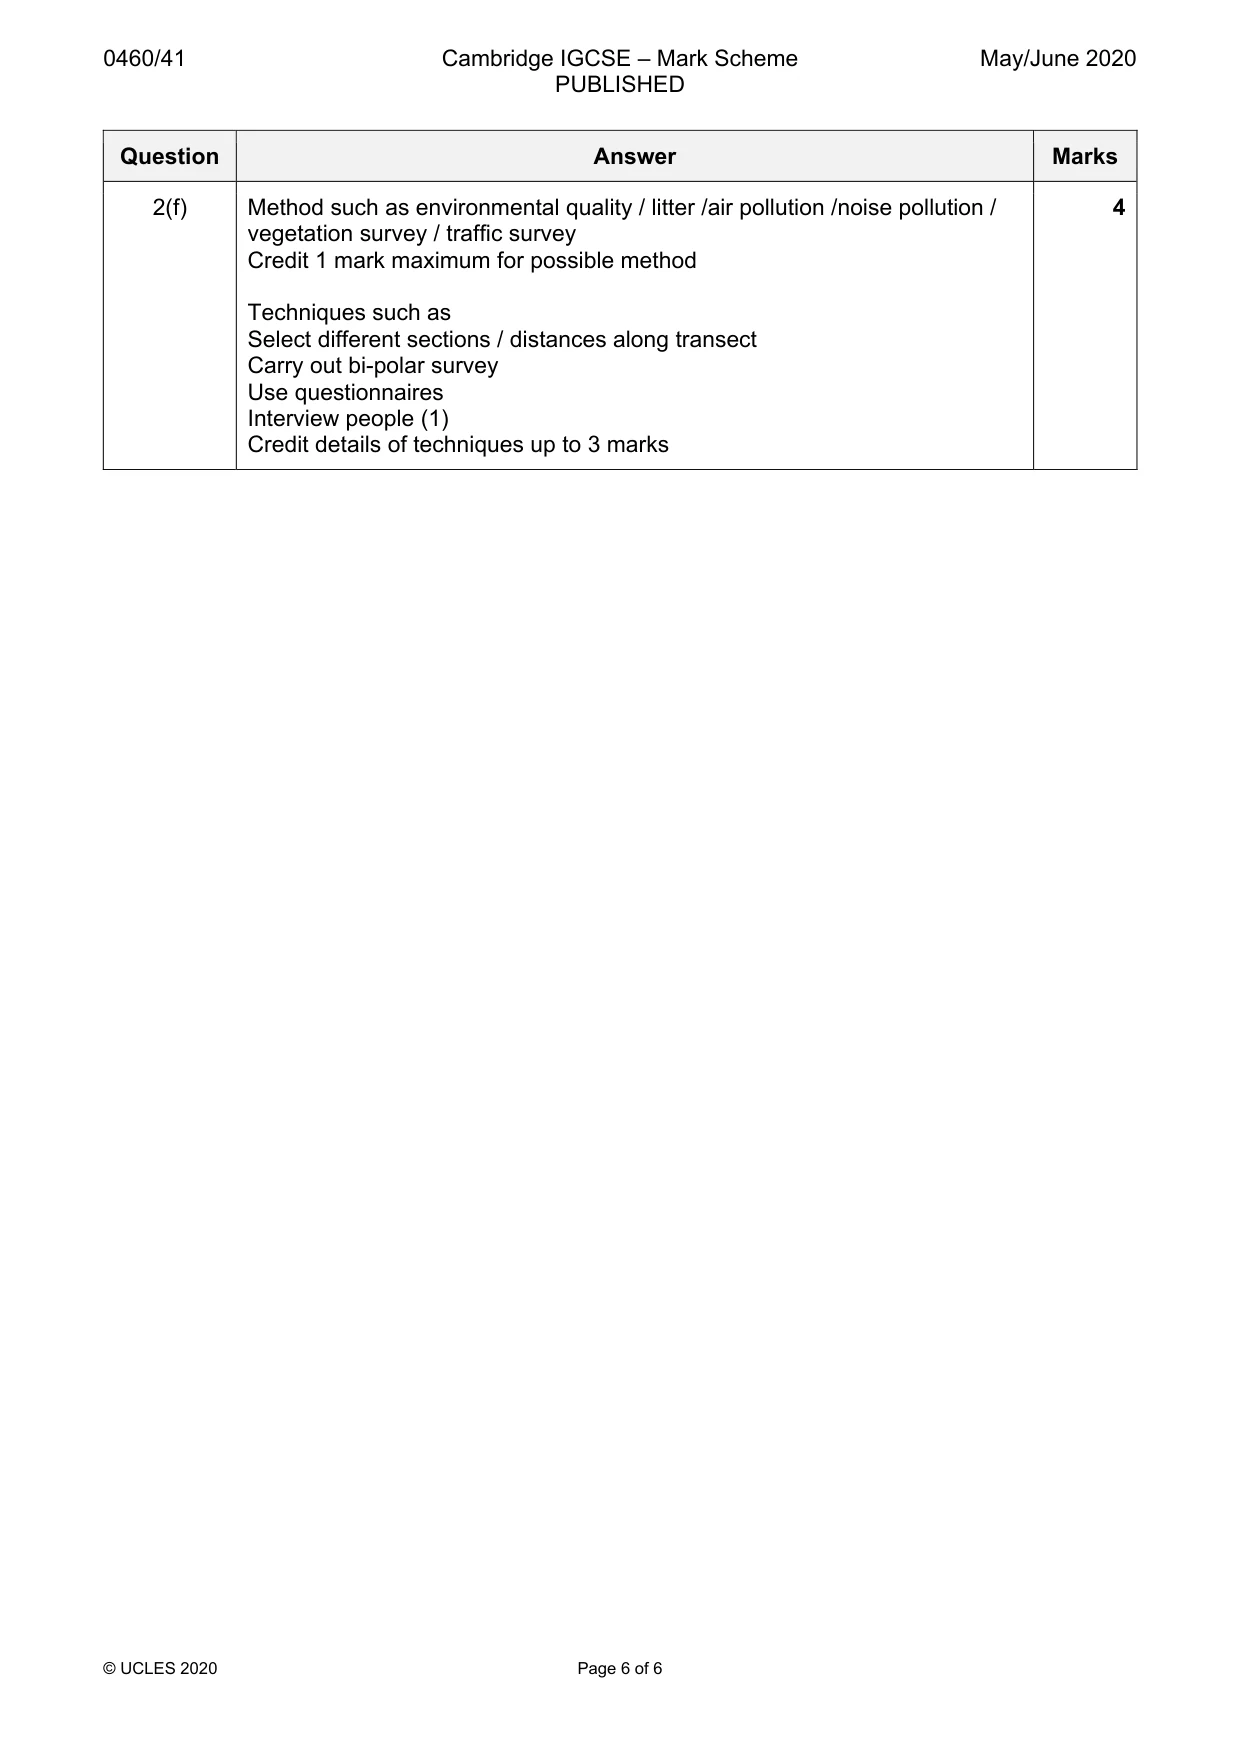
Mark scheme: 2(a) Student safety 2 To divide up the tasks within each group Collect more data / get wider range of results / pool the results of different groups / cover wider area Check that recording / fieldwork is done accurately / results are reliable Compare results Work faster / study all 6 transects at the same time 2 @ 1 2(b) Advantages 4 To get even coverage along the transect An easy method to use No bias caused by student selecting land use to record Will show major changes in land use along transect Disadvantages Will require a lot of recording Might miss a typical land use / get an anomaly Land use on upper floor may be different to ground floor One side of the road may be different to the other side 4 @ 1 2(c) Entertainment 3 Residential Public building 3 @ 1 2(d) Commercial (shops) 7 2 Entertainment 3 Public building 2 Open space 2 Transport 0 Services (offices) 2 Need both tally marks and number for each category All correct = 2 marks 4 or 5 correct = 1 mark 2(e)(i) 801–1000 (m) 1 2(e)(ii) 80 (%) 1 2(e)(iii) Residential is main land use at 1800–2000 m but no residential at 0–200 m 2 Industrial / open space are at 1800–2000 m but not at 0–200 m Commercial is main land use at 0–200 m but no commercial at 1800–2000 m Entertainment / public building / transport at 0–200 m but not at 1800–2000 m 2 @ 1 2(e)(iv) Residential is dominant land use at 6 distances / not dominant at 4 3 distances Residential is dominant at 800 m outwards / not dominant up to 800 m Credit 1 mark for % residential and distance e.g. No residential / 0% at 0–200 m 65% residential at 1401–1600 m 2(e)(v) City has grown outwards/developed over time 4 Access to transport – road / rail / air / river Competition for land / bid rent Cost of land / land is cheaper out of city centre Availability of land / amount of space / more land available away from city centre Flat land / flood plain Residential away from industry / air pollution Planning policy Close to raw material for industry 2(e)(vi) Hypothesis is partly true – 1 mark reserve 4 True up to 1200 m / 1st six sections Commercial increases / exceptions at 1401–1600 / 1601–1800 Credit paired data to agree with hypothesis e.g. 65% at 0 – 200 and 5% at 1001–1200 m Credit data to show exception e.g. 25% at 1601–1800 m If no hypothesis conclusion and credit evidence 2(f) Method such as environmental quality / litter /air pollution /noise pollution / 4 vegetation survey / traffic survey Credit 1 mark maximum for possible method Techniques such as Select different sections / distances along transect Carry out bi-polar survey Use questionnaires Interview people (1) Credit details of techniques up to 3 marks
What was in this paper
The subtopics covered by these 2 questions, and how many questions each got. Open one in a new tab to see every Cambridge question on it.