Cambridge IGCSE Geography 0460 — 2016 Oct/Nov Paper 4 · Variant 3
0460/43/O/N/16 · 60 marks · ≈68 min
The question paper and its mark scheme, free to read here and free to download. This is Cambridge’s own paper, exactly as it was sat.
Question paper16 pages


Mark scheme5 pages
Answers below. Sit the paper first if you are practising.
Paper as text
Question paper, page 1
This document consists of 15 printed pages, 1 blank page and 1 Insert. DC (CW/FD) 115396/3 © UCLES 2016 [Turn over Cambridge International Examinations Cambridge International General Certificate of Secondary Education * 4 4 7 8 5 4 6 4 7 0 * GEOGRAPHY 0460/43 Paper 4 Alternative to Coursework October/November 2016 1 hour 30 minutes Candidates answer on the Question Paper. Additional Materials: Calculator Protractor Ruler READ THESE INSTRUCTIONS FIRST Write your Centre number, candidate number and name in the spaces provided. Write in dark blue or black pen. You may use an HB pencil for any diagrams or graphs. Do not use staples, paper clips, glue or correction fluid. DO NOT WRITE IN ANY BARCODES. Write your answer to each question in the space provided. If additional space is required, you should use the lined pages at the end of the booklet. The question number(s) must be clearly shown. Answer all questions. The Insert contains Fig. 1, Table 1 and Photograph A for Question 1, and Figs. 5 and 6 for Question 2. The Insert is not required by the Examiner. Sketch maps and diagrams should be drawn whenever they serve to illustrate an answer. At the end of the examination, fasten all your work securely together. The number of marks is given in brackets [ ] at the end of each question or part question. The syllabus is approved for use in England, Wales and Northern Ireland as a Cambridge International Level 1/Level 2 Certificate.
Question paper, page 2
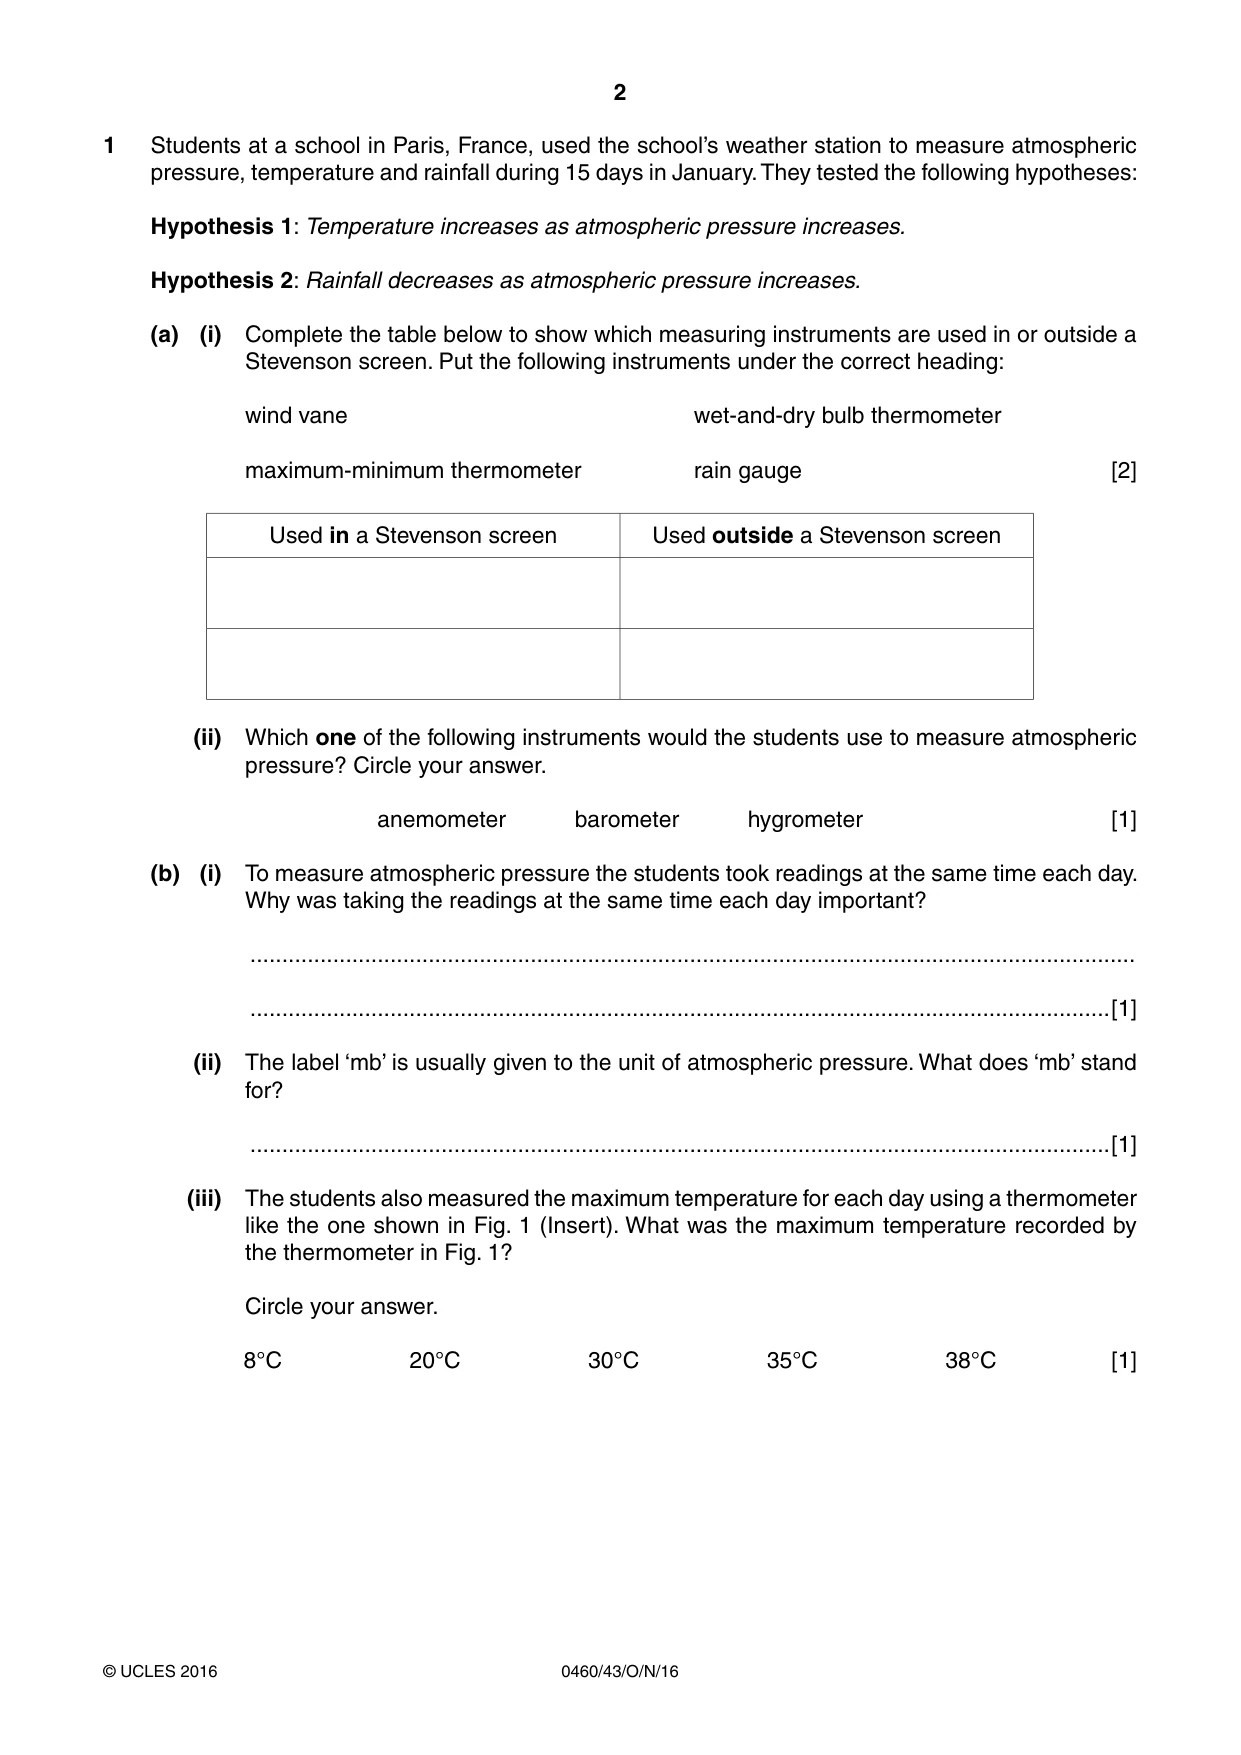
2 0460/43/O/N/16 © UCLES 2016 1 Students at a school in Paris, France, used the school’s weather station to measure atmospheric pressure, temperature and rainfall during 15 days in January. They tested the following hypotheses: Hypothesis 1: Temperature increases as atmospheric pressure increases. Hypothesis 2: Rainfall decreases as atmospheric pressure increases. (a) (i) Complete the table below to show which measuring instruments are used in or outside a Stevenson screen. Put the following instruments under the correct heading: wind vane wet-and-dry bulb thermometer maximum-minimum thermometer rain gauge [2] Used in a Stevenson screen Used outside a Stevenson screen (ii) Which one of the following instruments would the students use to measure atmospheric pressure? Circle your answer. anemometer barometer hygrometer [1] (b) (i) To measure atmospheric pressure the students took readings at the same time each day. Why was taking the readings at the same time each day important? … …[1] (ii) The label ‘mb’ is usually given to the unit of atmospheric pressure. What does ‘mb’ stand for? …[1] (iii) The students also measured the maximum temperature for each day using a thermometer like the one shown in Fig. 1 (Insert). What was the maximum temperature recorded by the thermometer in Fig. 1? Circle your answer. 8°C 20°C 30°C 35°C 38°C [1]
Question paper, page 3
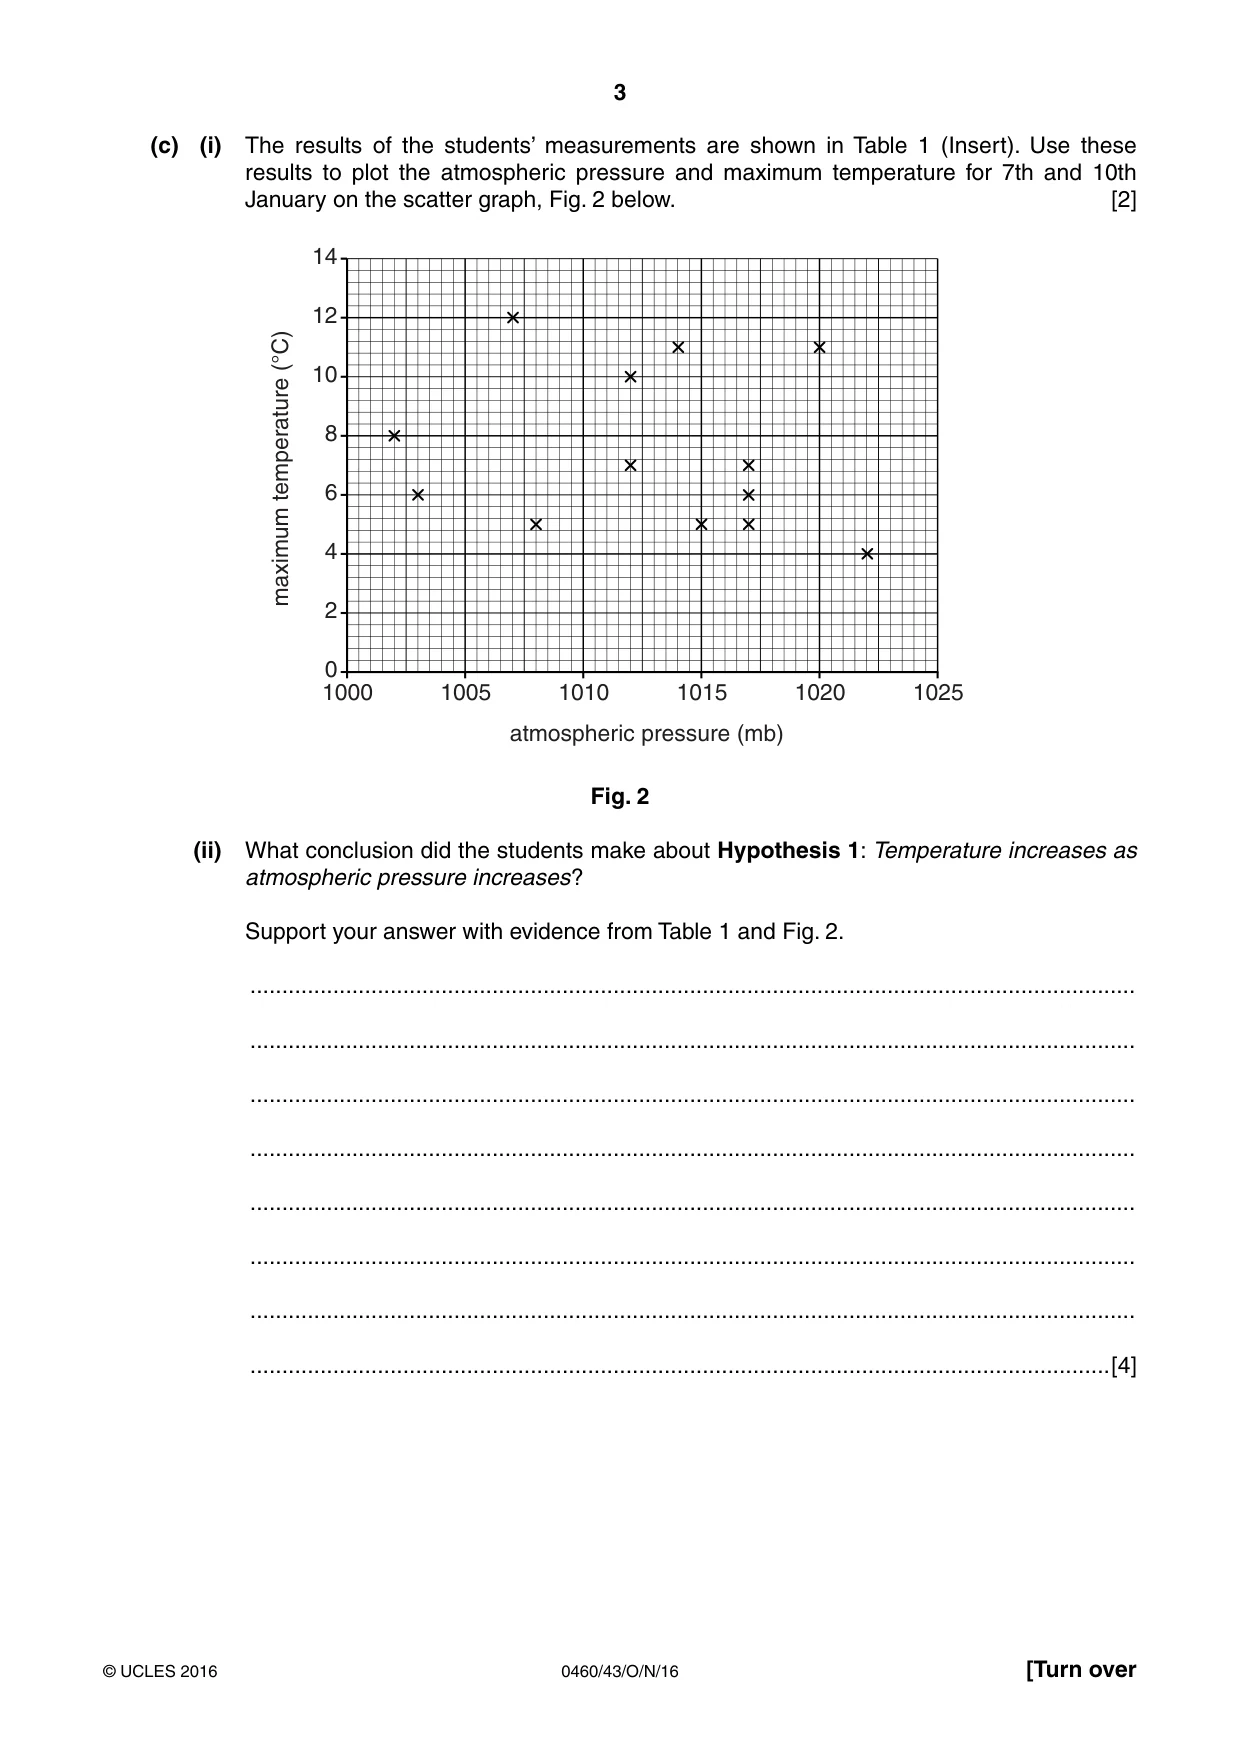
3 0460/43/O/N/16 © UCLES 2016 [Turn over (c) (i) The results of the students’ measurements are shown in Table 1 (Insert). Use these results to plot the atmospheric pressure and maximum temperature for 7th and 10th January on the scatter graph, Fig. 2 below. [2] 1000 0 2 4 6 8 10 maximum temperature (°C) 12 14 1005 1010 1015 atmospheric pressure (mb) 1020 1025 Fig. 2 (ii) What conclusion did the students make about Hypothesis 1: Temperature increases as atmospheric pressure increases ? Support your answer with evidence from Table 1 and Fig. 2. … … … … … … … …[4]
Question paper, page 4
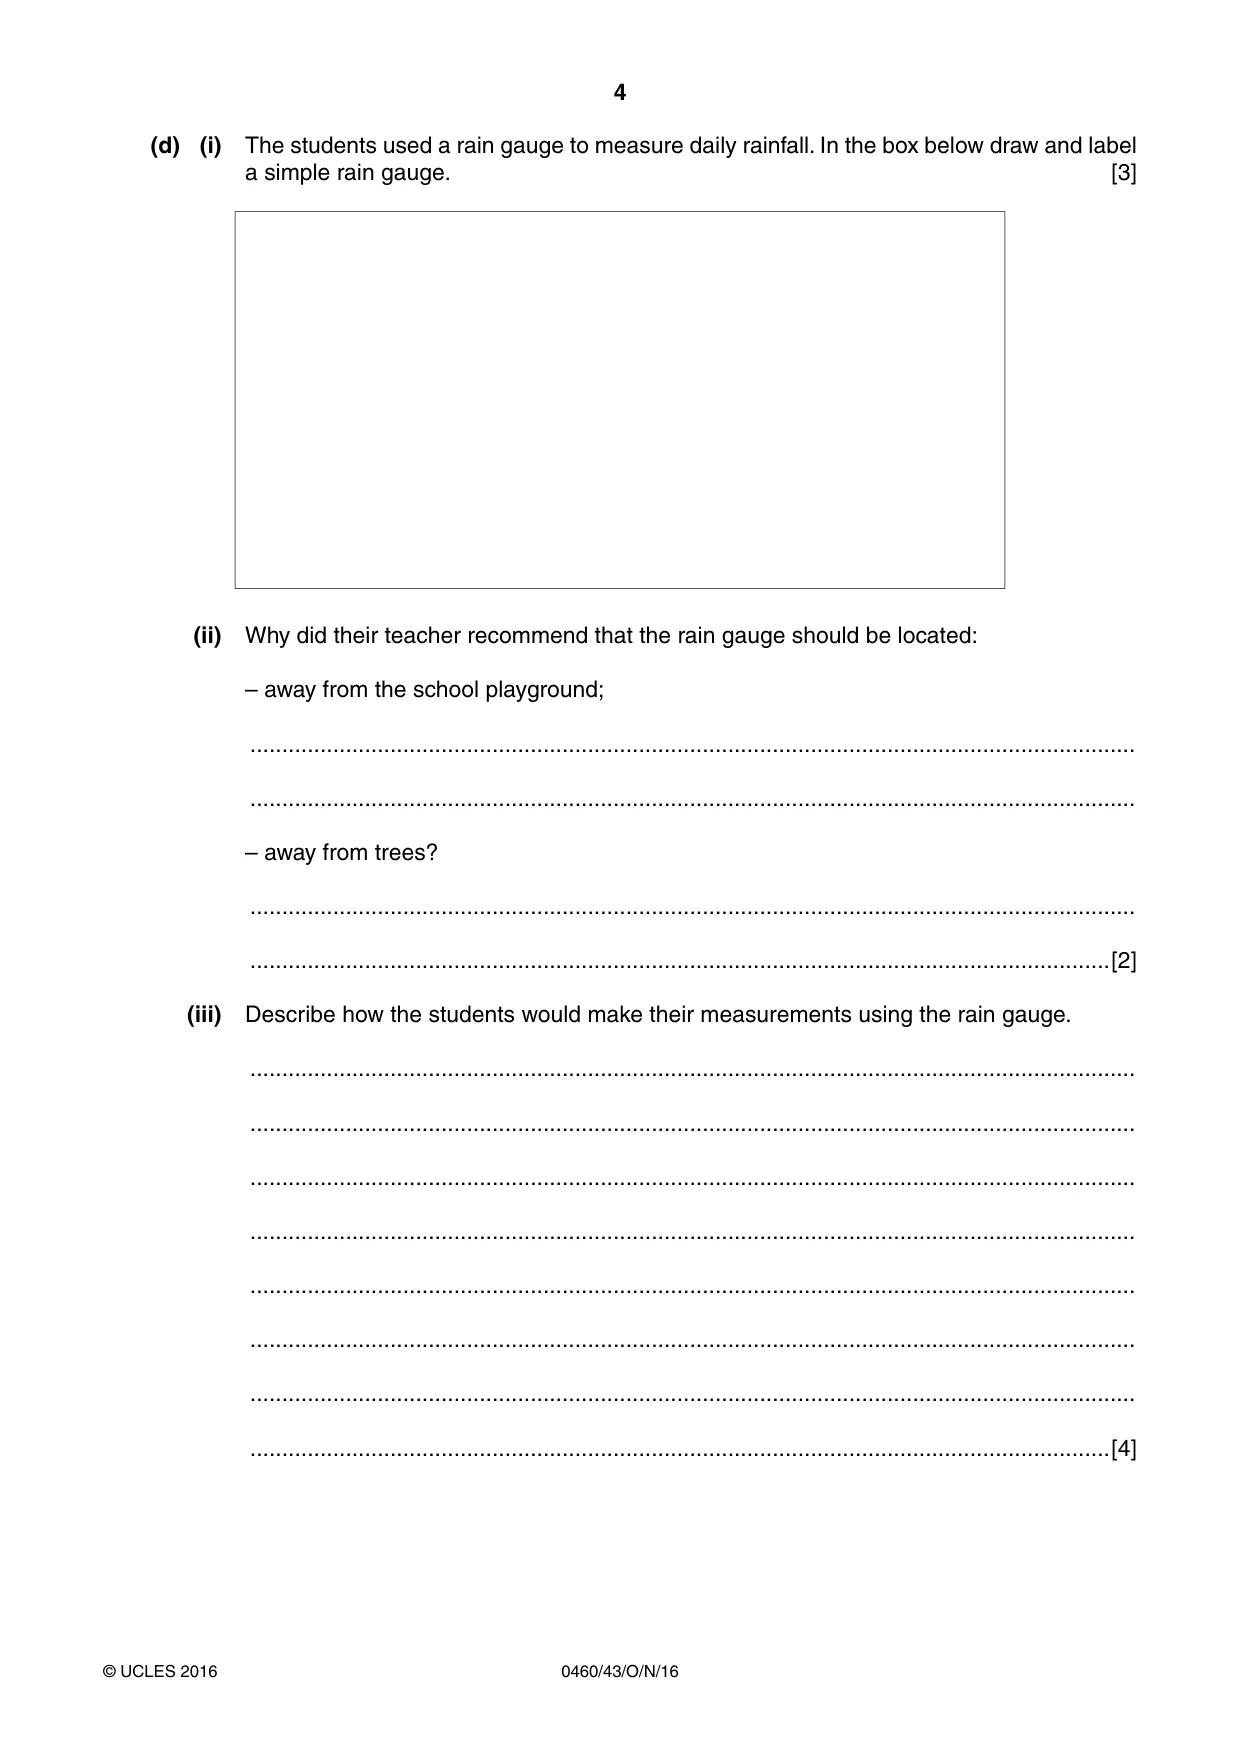
4 0460/43/O/N/16 © UCLES 2016 (d) (i) The students used a rain gauge to measure daily rainfall. In the box below draw and label a simple rain gauge. [3] (ii) Why did their teacher recommend that the rain gauge should be located: – away from the school playground; … … – away from trees? … …[2] (iii) Describe how the students would make their measurements using the rain gauge. … … … … … … … …[4]
Question paper, page 5
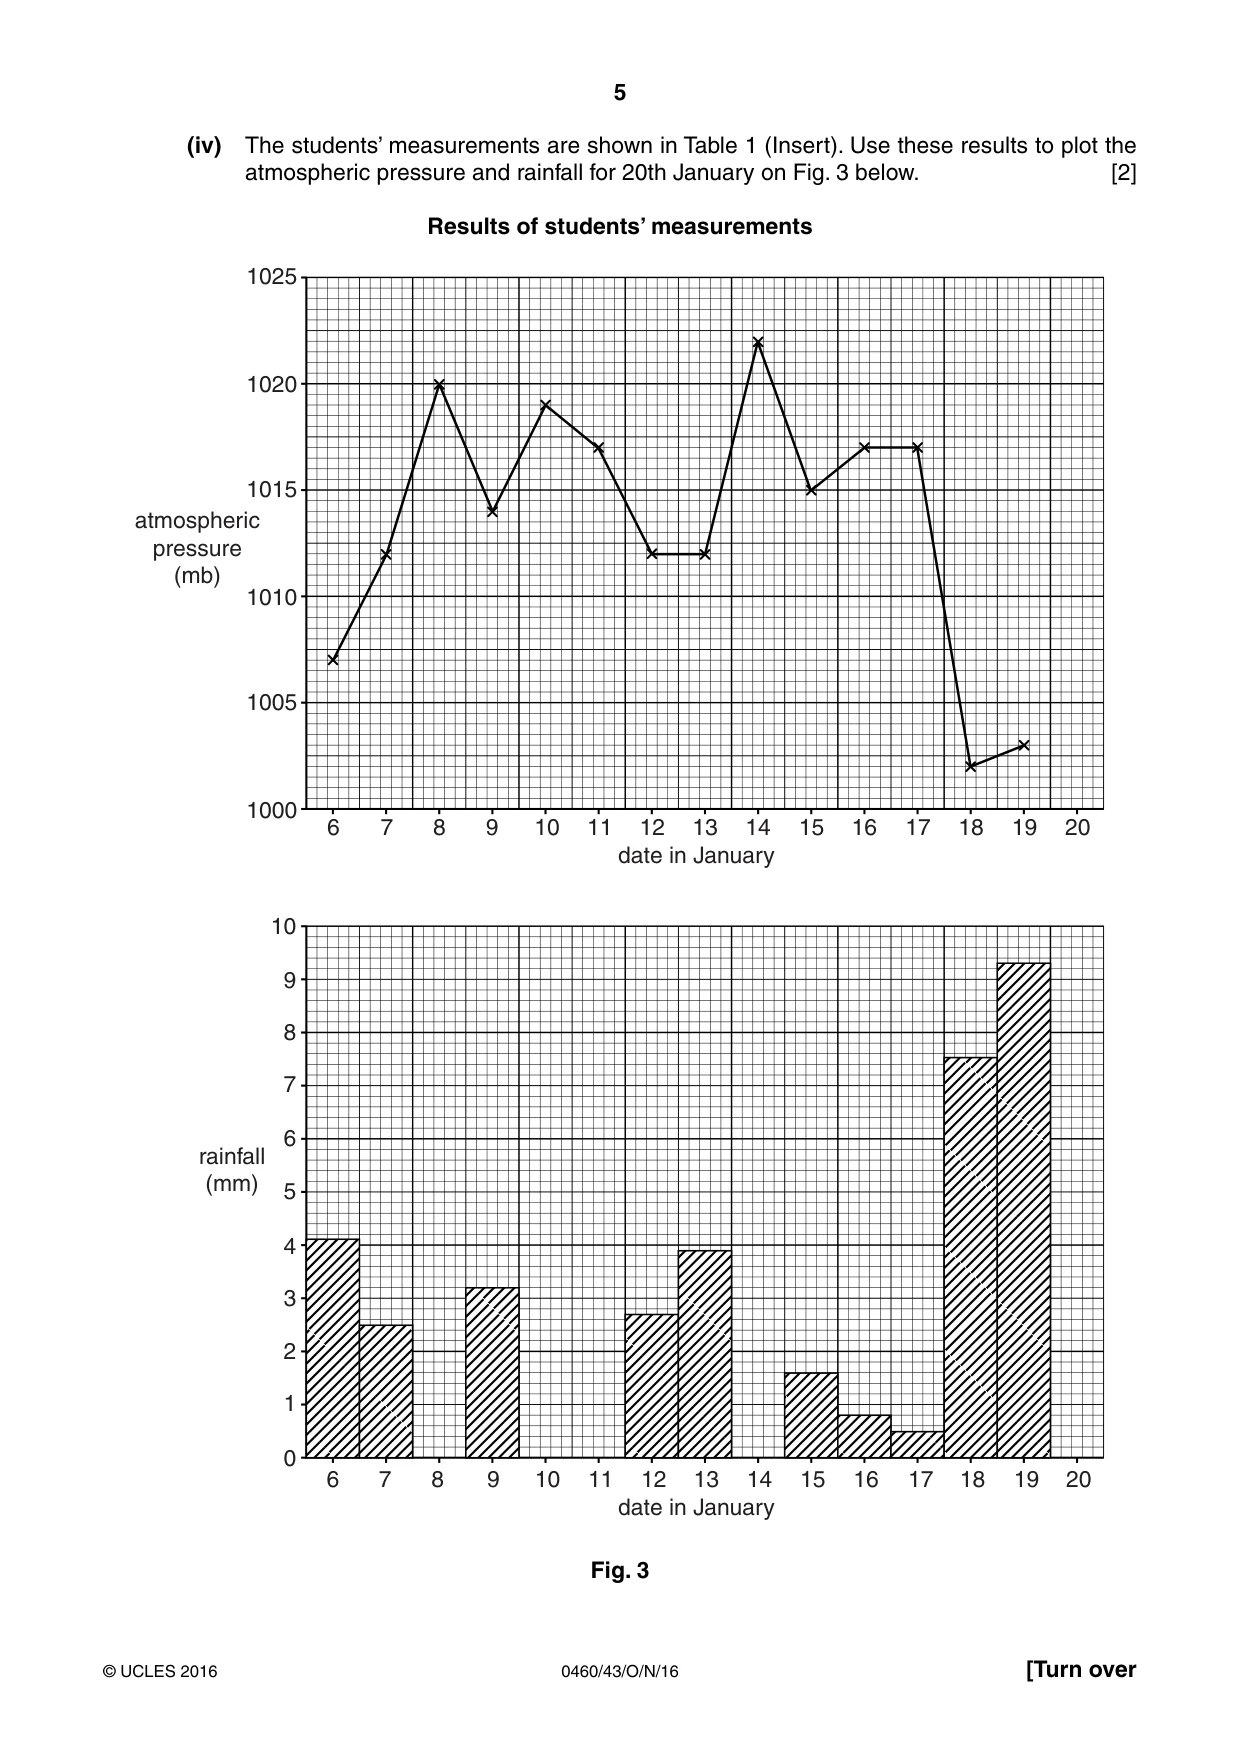
5 0460/43/O/N/16 © UCLES 2016 [Turn over (iv) The students’ measurements are shown in Table 1 (Insert). Use these results to plot the atmospheric pressure and rainfall for 20th January on Fig. 3 below. [2] Results of students’ measurements 6 1000 1005 1010 1015 1020 1025 atmospheric pressure (mb) 7 8 9 10 11 12 13 date in January 14 15 16 17 18 19 20 6 0 2 4 6 8 10 1 3 5 7 9 rainfall (mm) 7 8 9 10 11 12 13 date in January 14 15 16 17 18 19 20 Fig. 3
Question paper, page 6
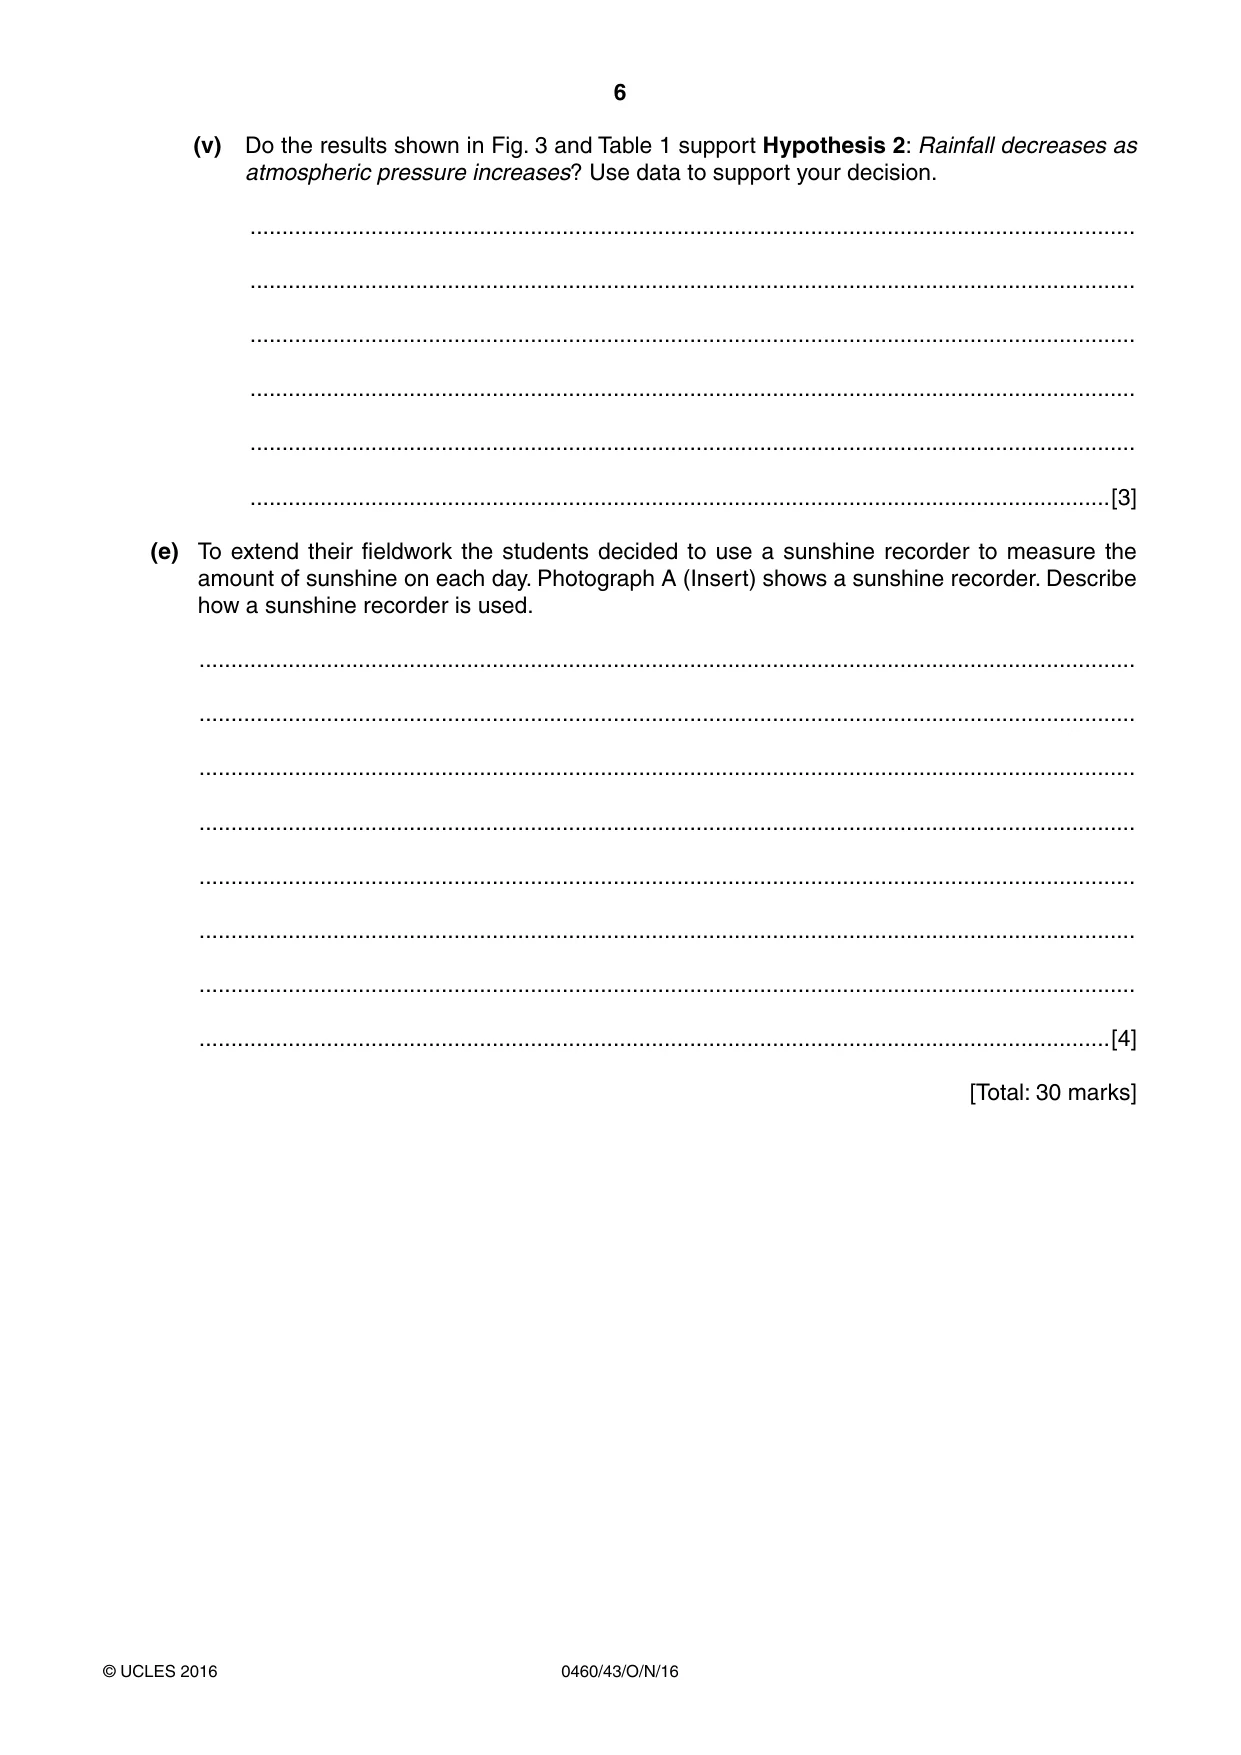
6 0460/43/O/N/16 © UCLES 2016 (v) Do the results shown in Fig. 3 and Table 1 support Hypothesis 2: Rainfall decreases as atmospheric pressure increases? Use data to support your decision. … … … … … …[3] (e) To extend their fieldwork the students decided to use a sunshine recorder to measure the amount of sunshine on each day. Photograph A (Insert) shows a sunshine recorder. Describe how a sunshine recorder is used. … … … … … … … …[4] [Total: 30 marks]
Question paper, page 7
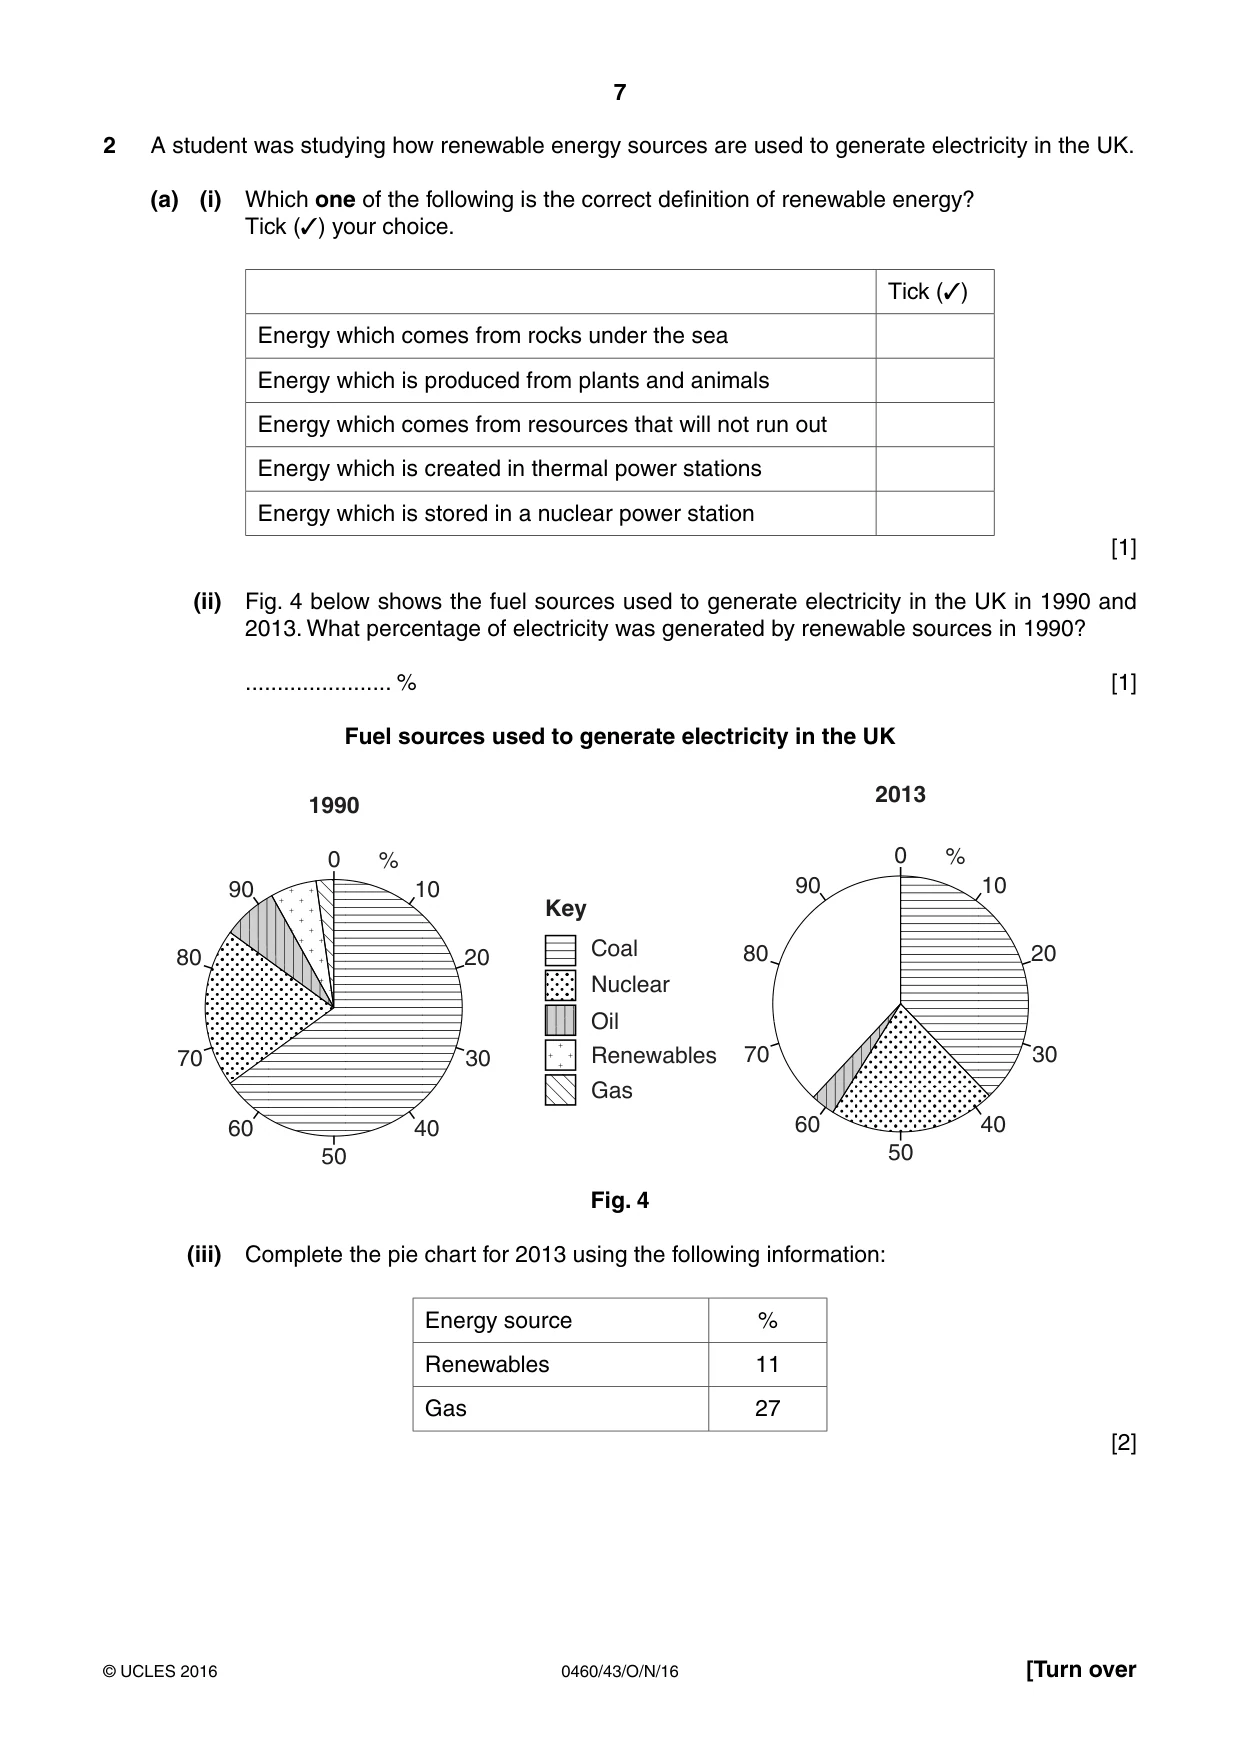
7 0460/43/O/N/16 © UCLES 2016 [Turn over 2 A student was studying how renewable energy sources are used to generate electricity in the UK. (a) (i) Which one of the following is the correct definition of renewable energy? Tick (✓) your choice. Tick (✓) Energy which comes from rocks under the sea Energy which is produced from plants and animals Energy which comes from resources that will not run out Energy which is created in thermal power stations Energy which is stored in a nuclear power station [1] (ii) Fig. 4 below shows the fuel sources used to generate electricity in the UK in 1990 and 2013. What percentage of electricity was generated by renewable sources in 1990? … % [1] Fuel sources used to generate electricity in the UK 0 1990 .H\ &RDO 1XFOHDU 2LO 5HQHZDEOHV *DV % 10 20 30 40 90 80 70 60 50 0 2013 % 10 20 30 40 90 80 70 60 50 Fig. 4 (iii) Complete the pie chart for 2013 using the following information: Energy source % Renewables 11 Gas 27 [2]
Question paper, page 8
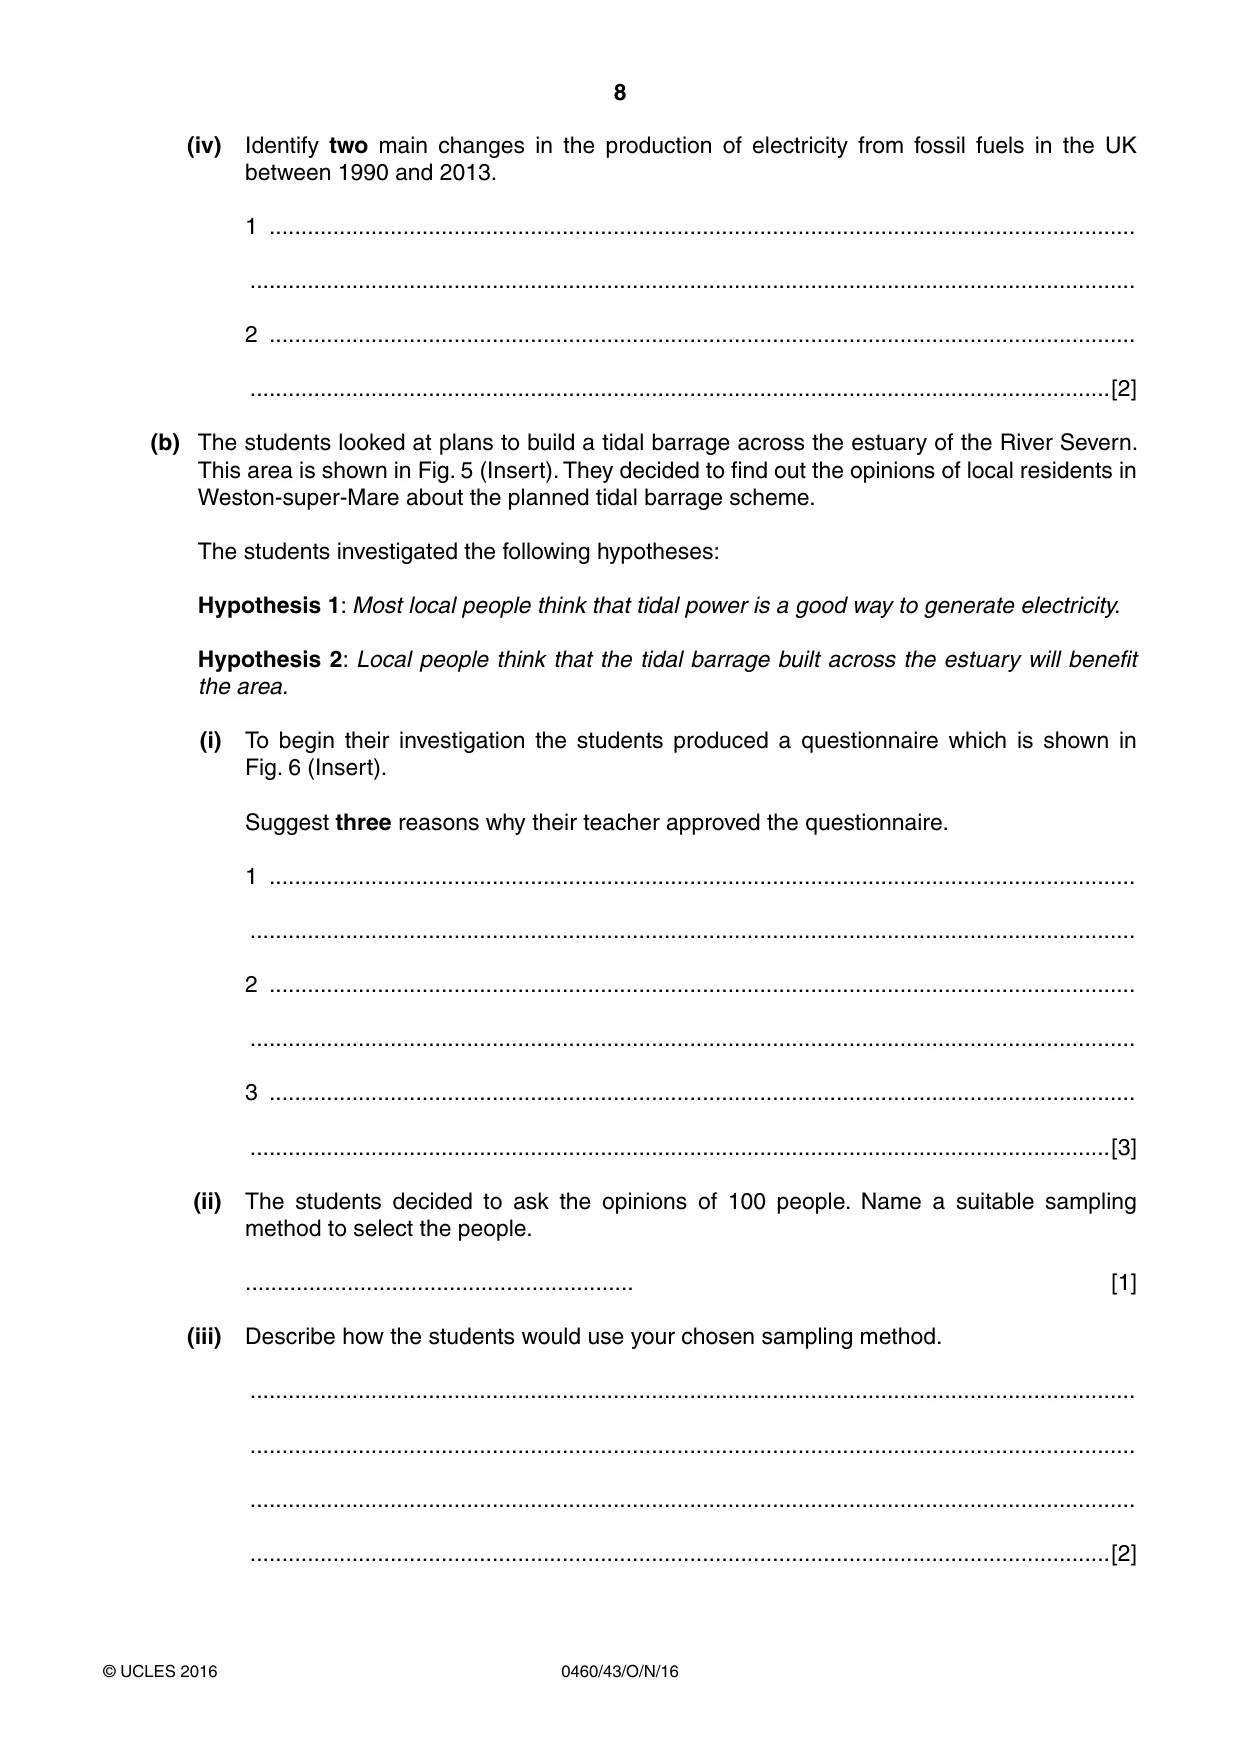
8 0460/43/O/N/16 © UCLES 2016 (iv) Identify two main changes in the production of electricity from fossil fuels in the UK between 1990 and 2013. 1 … … 2 … …[2] (b) The students looked at plans to build a tidal barrage across the estuary of the River Severn. This area is shown in Fig. 5 (Insert). They decided to find out the opinions of local residents in Weston-super-Mare about the planned tidal barrage scheme. The students investigated the following hypotheses: Hypothesis 1: Most local people think that tidal power is a good way to generate electricity. Hypothesis 2: Local people think that the tidal barrage built across the estuary will benefit the area. (i) To begin their investigation the students produced a questionnaire which is shown in Fig. 6 (Insert). Suggest three reasons why their teacher approved the questionnaire. 1 … … 2 … … 3 … …[3] (ii) The students decided to ask the opinions of 100 people. Name a suitable sampling method to select the people. … [1] (iii) Describe how the students would use your chosen sampling method. … … … …[2]
Question paper, page 9
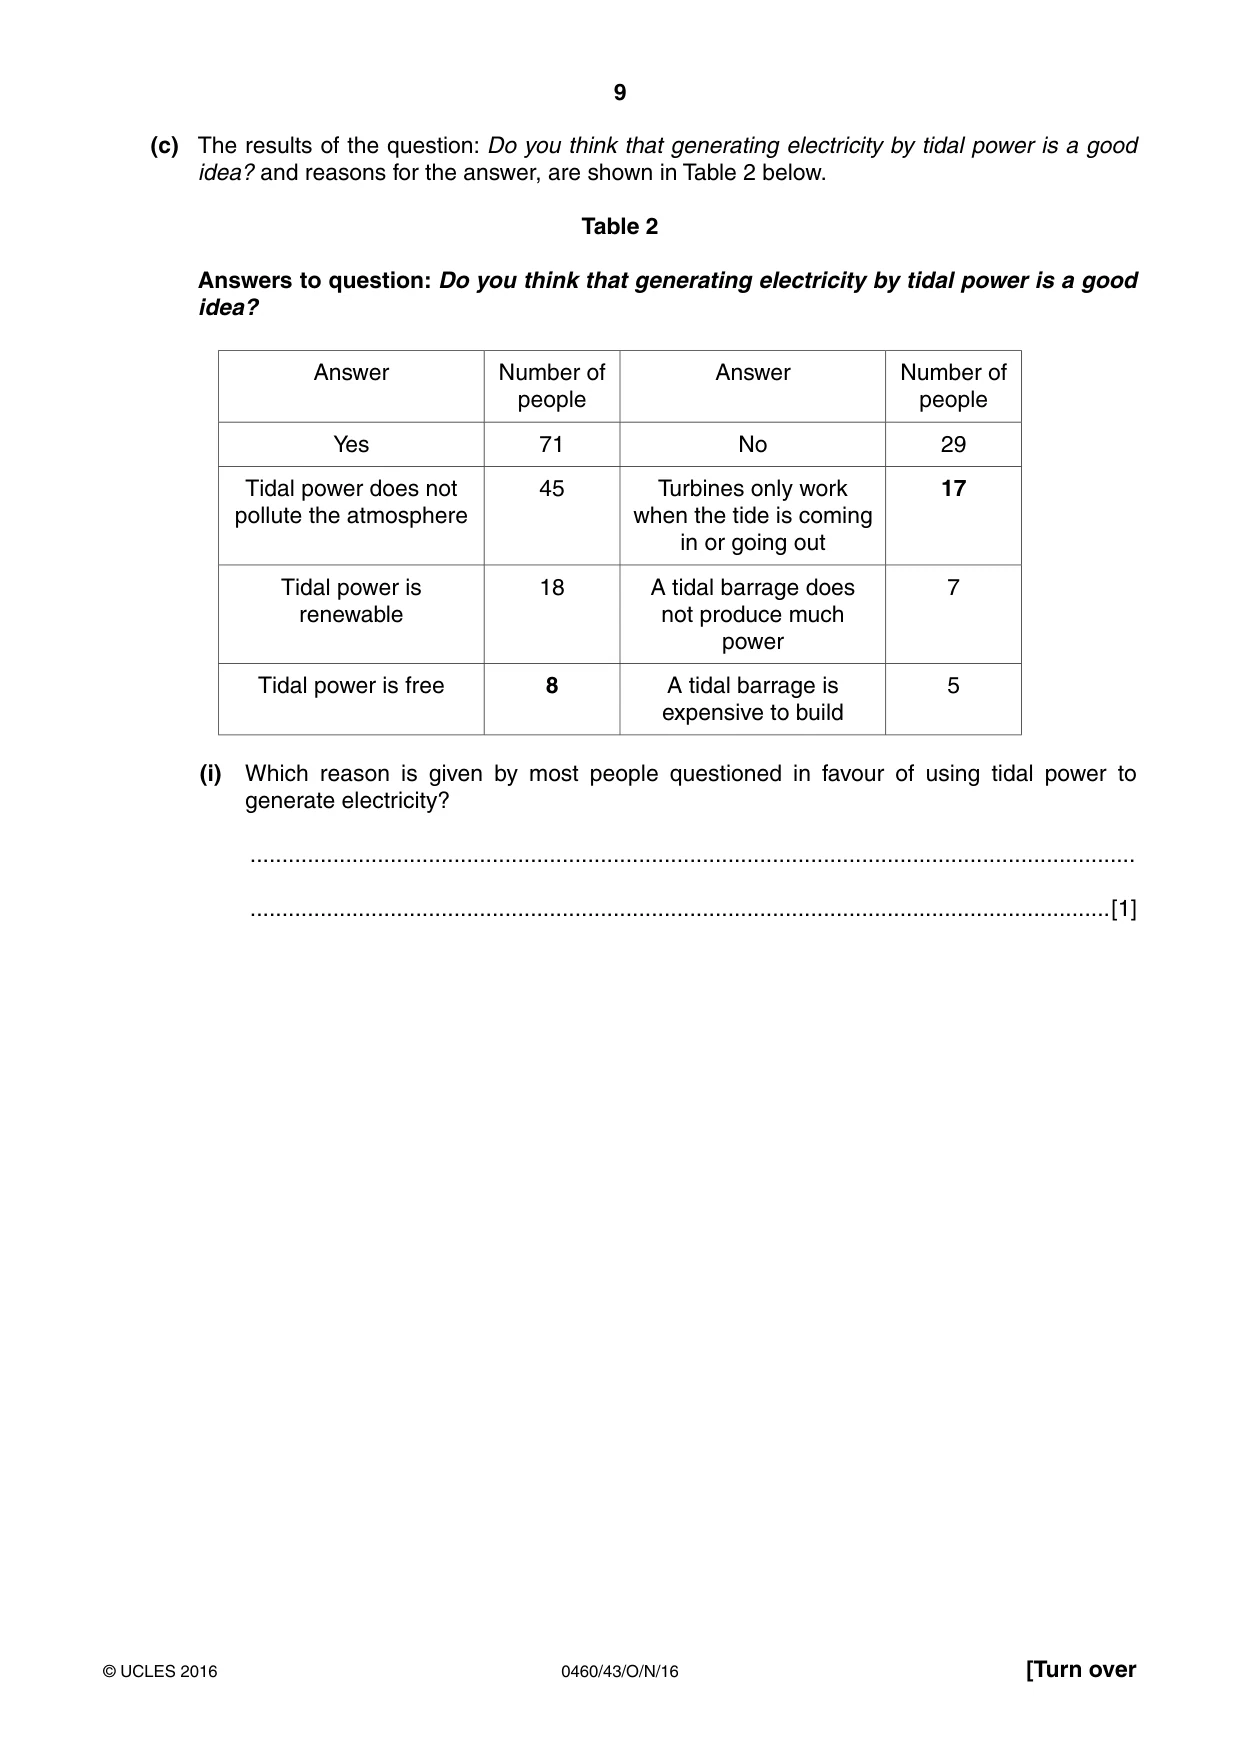
9 0460/43/O/N/16 © UCLES 2016 [Turn over (c) The results of the question: Do you think that generating electricity by tidal power is a good idea? and reasons for the answer, are shown in Table 2 below. Table 2 Answers to question: Do you think that generating electricity by tidal power is a good idea? Answer Number of people Answer Number of people Yes 71 No 29 Tidal power does not pollute the atmosphere 45 Turbines only work when the tide is coming in or going out 17 Tidal power is renewable 18 A tidal barrage does not produce much power 7 Tidal power is free 8 A tidal barrage is expensive to build 5 (i) Which reason is given by most people questioned in favour of using tidal power to generate electricity? … …[1]
Question paper, page 10
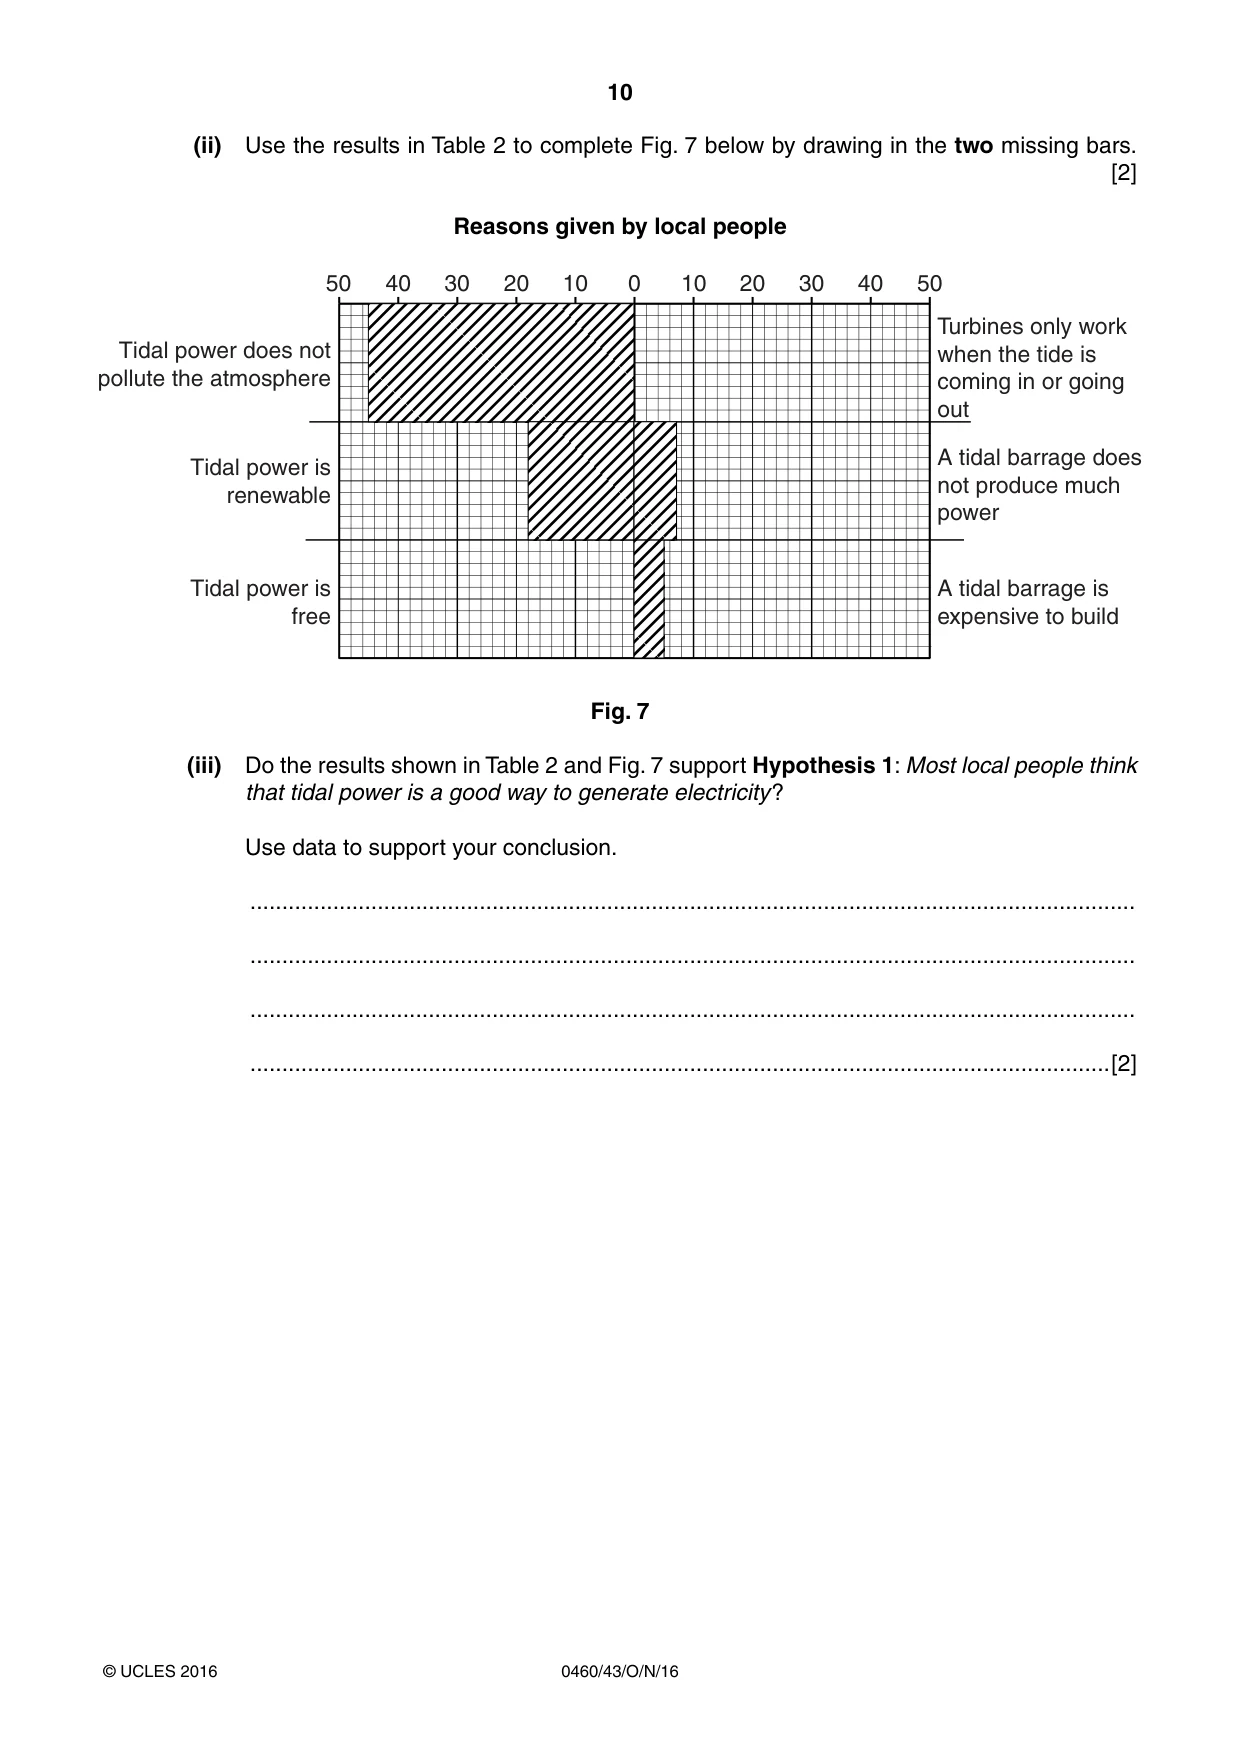
10 0460/43/O/N/16 © UCLES 2016 (ii) Use the results in Table 2 to complete Fig. 7 below by drawing in the two missing bars. [2] Reasons given by local people 50 40 30 20 10 0 10 20 30 40 50 Tidal power does not pollute the atmosphere Tidal power is renewable Tidal power is free Turbines only work when the tide is coming in or going out A tidal barrage does not produce much power A tidal barrage is expensive to build Fig. 7 (iii) Do the results shown in Table 2 and Fig. 7 support Hypothesis 1: Most local people think that tidal power is a good way to generate electricity ? Use data to support your conclusion. … … … …[2]
Question paper, page 11
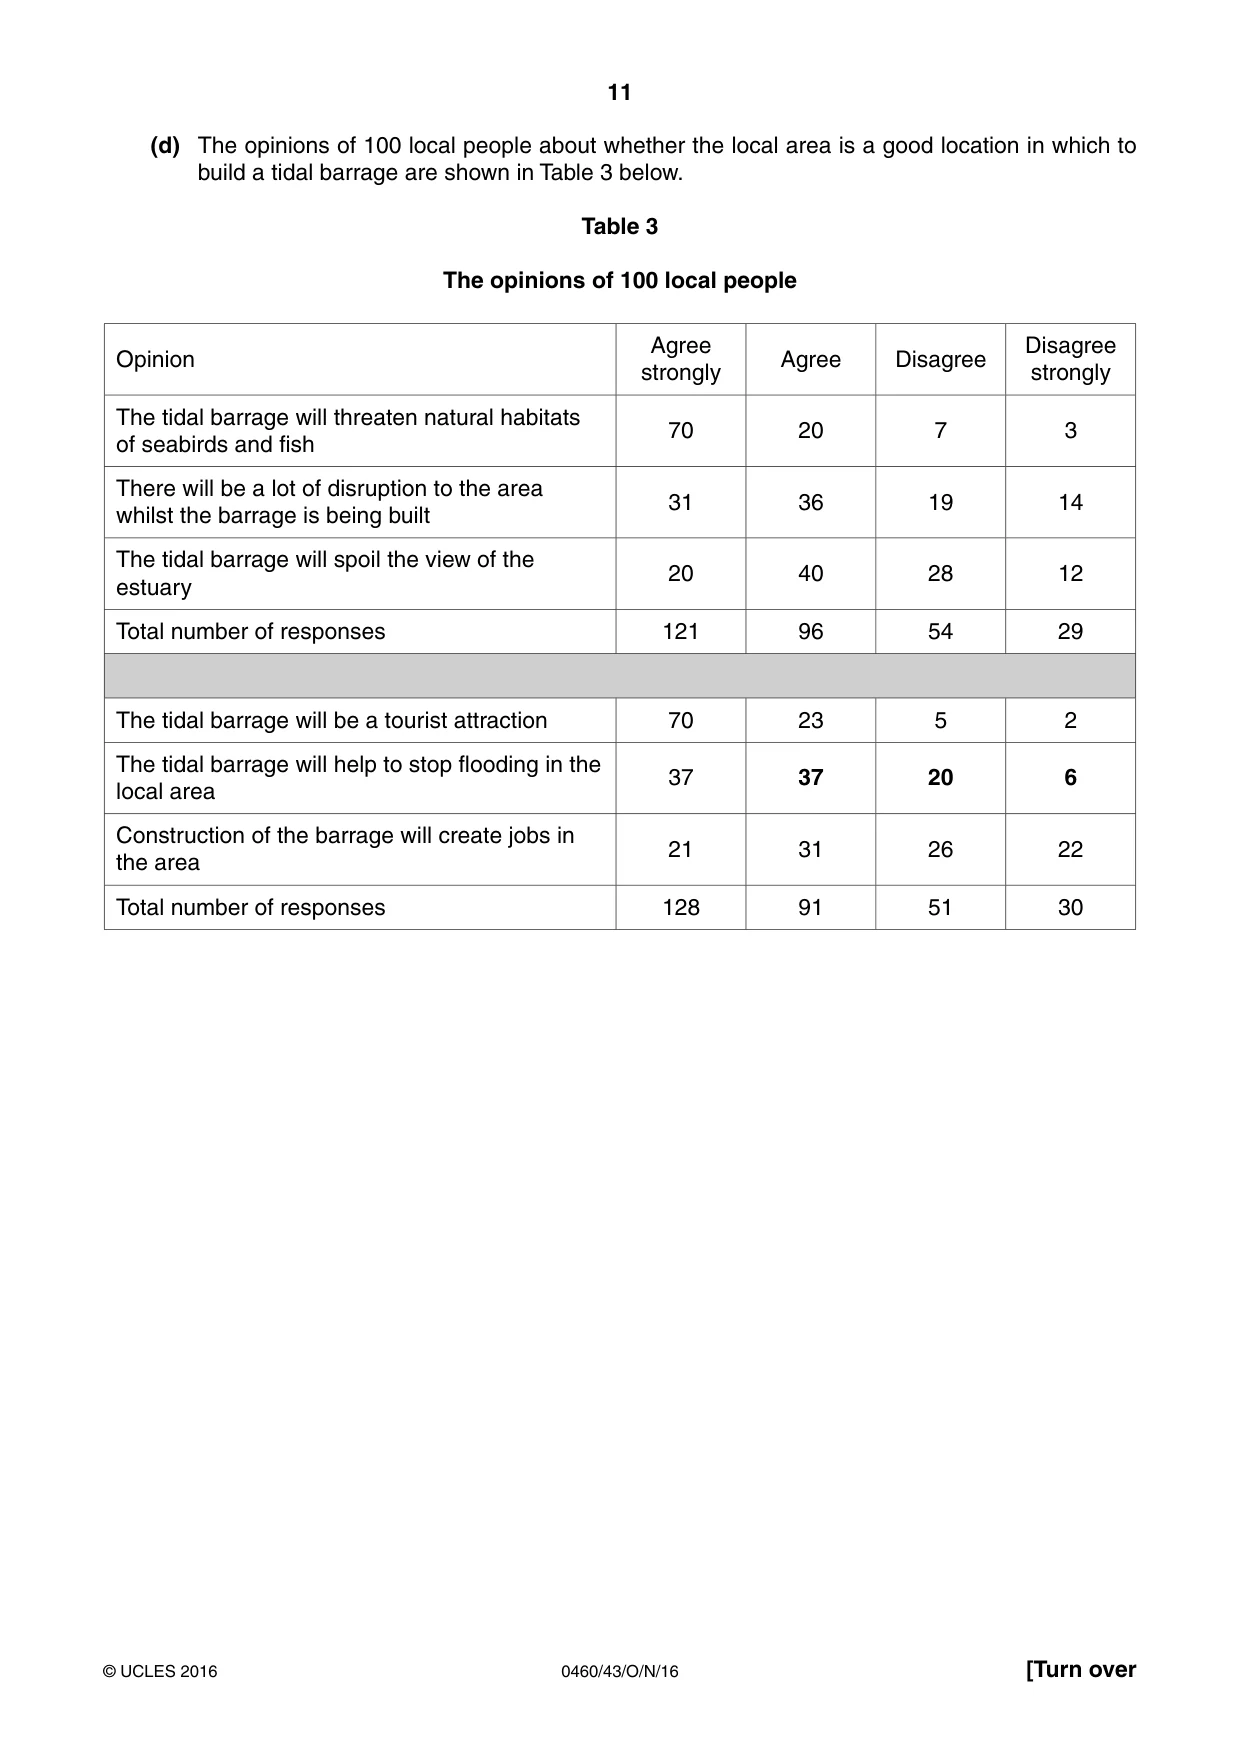
11 0460/43/O/N/16 © UCLES 2016 [Turn over (d) The opinions of 100 local people about whether the local area is a good location in which to build a tidal barrage are shown in Table 3 below. Table 3 The opinions of 100 local people Opinion Agree strongly Agree Disagree Disagree strongly The tidal barrage will threaten natural habitats of seabirds and fish 70 20 7 3 There will be a lot of disruption to the area whilst the barrage is being built 31 36 19 14 The tidal barrage will spoil the view of the estuary 20 40 28 12 Total number of responses 121 96 54 29 The tidal barrage will be a tourist attraction 70 23 5 2 The tidal barrage will help to stop flooding in the local area 37 37 20 6 Construction of the barrage will create jobs in the area 21 31 26 22 Total number of responses 128 91 51 30
Question paper, page 12
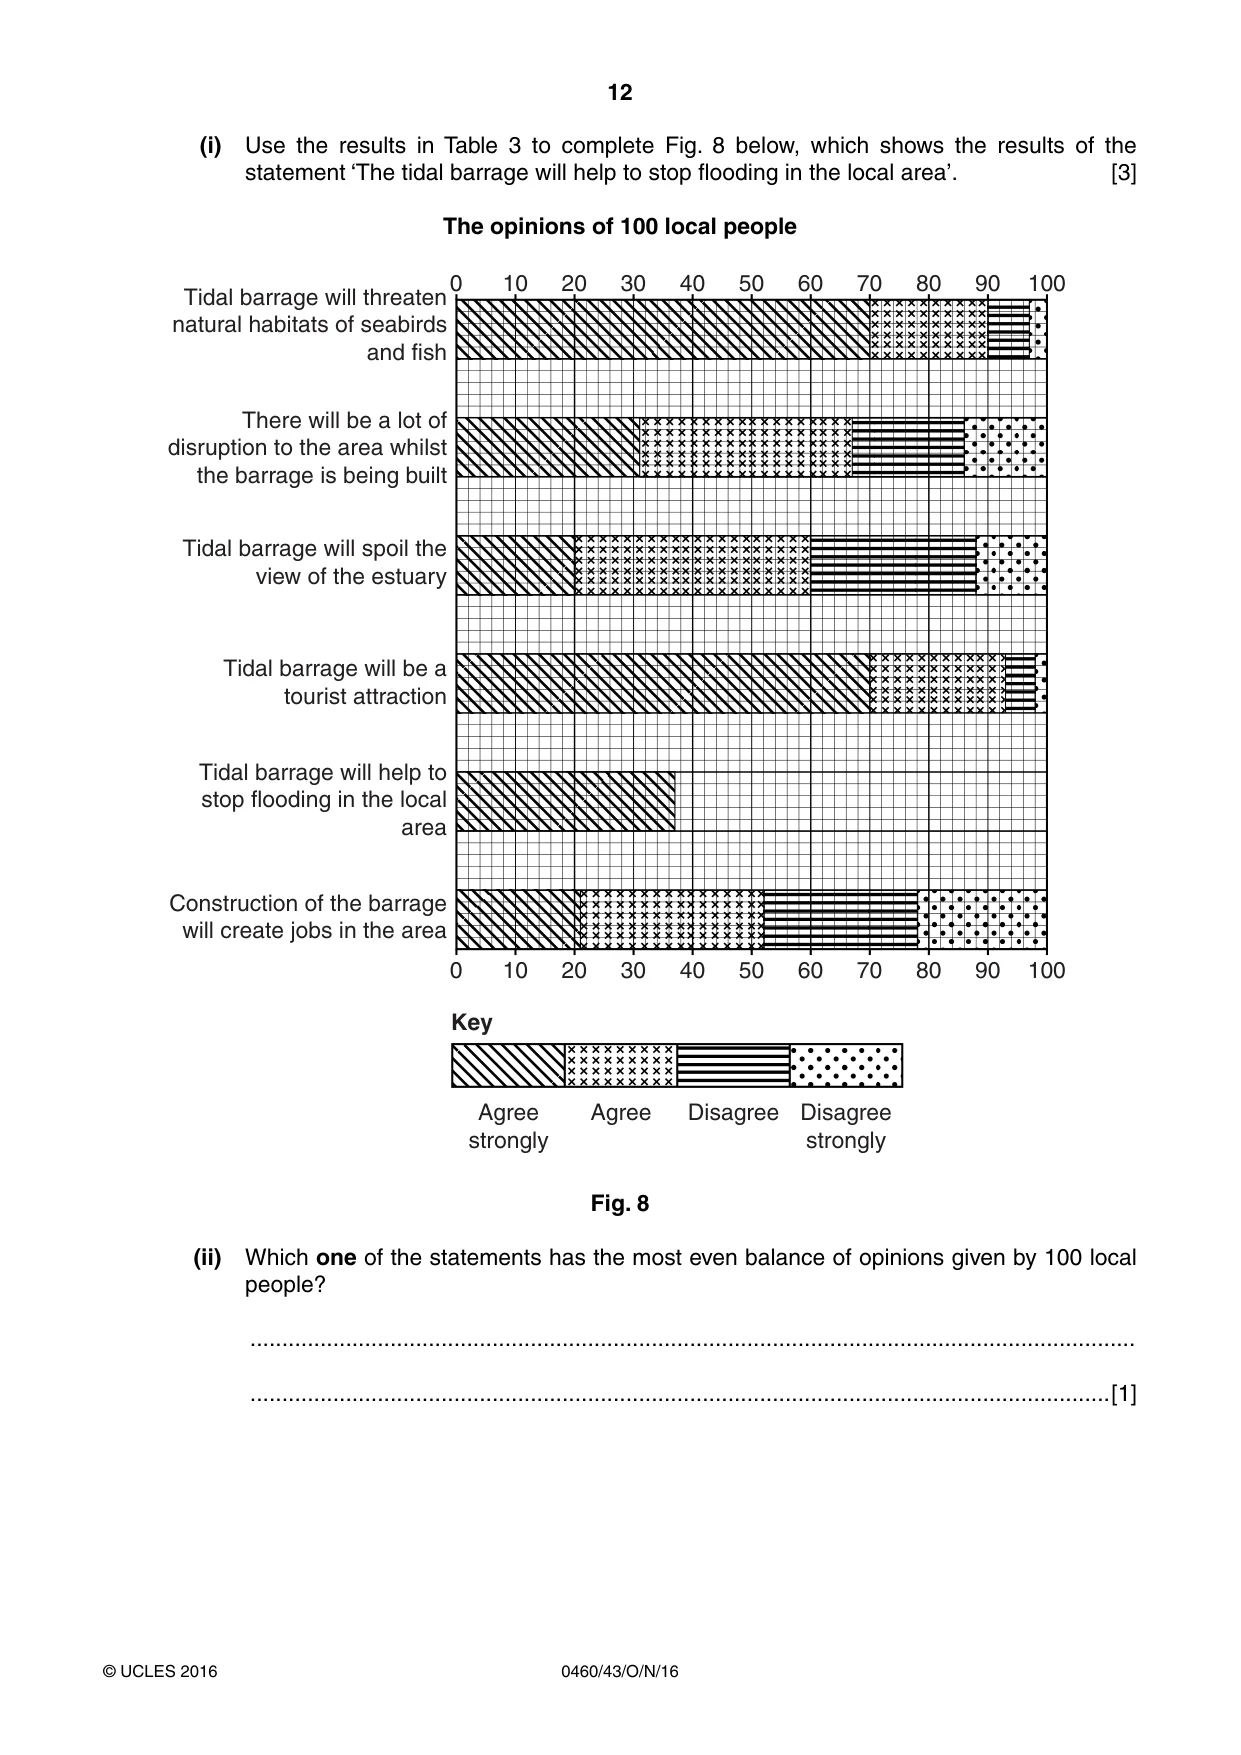
12 0460/43/O/N/16 © UCLES 2016 (i) Use the results in Table 3 to complete Fig. 8 below, which shows the results of the statement ‘The tidal barrage will help to stop flooding in the local area’. [3] The opinions of 100 local people 0 10 20 30 40 50 60 70 80 90 100 0 10 20 30 40 50 60 70 80 90 100 Tidal barrage will threaten natural habitats of seabirds and fish There will be a lot of disruption to the area whilst the barrage is being built Tidal barrage will spoil the view of the estuary Tidal barrage will be a tourist attraction Tidal barrage will help to stop flooding in the local area Construction of the barrage will create jobs in the area Agree strongly .H\ Agree Disagree Disagree strongly Fig. 8 (ii) Which one of the statements has the most even balance of opinions given by 100 local people? … …[1]
Question paper, page 13
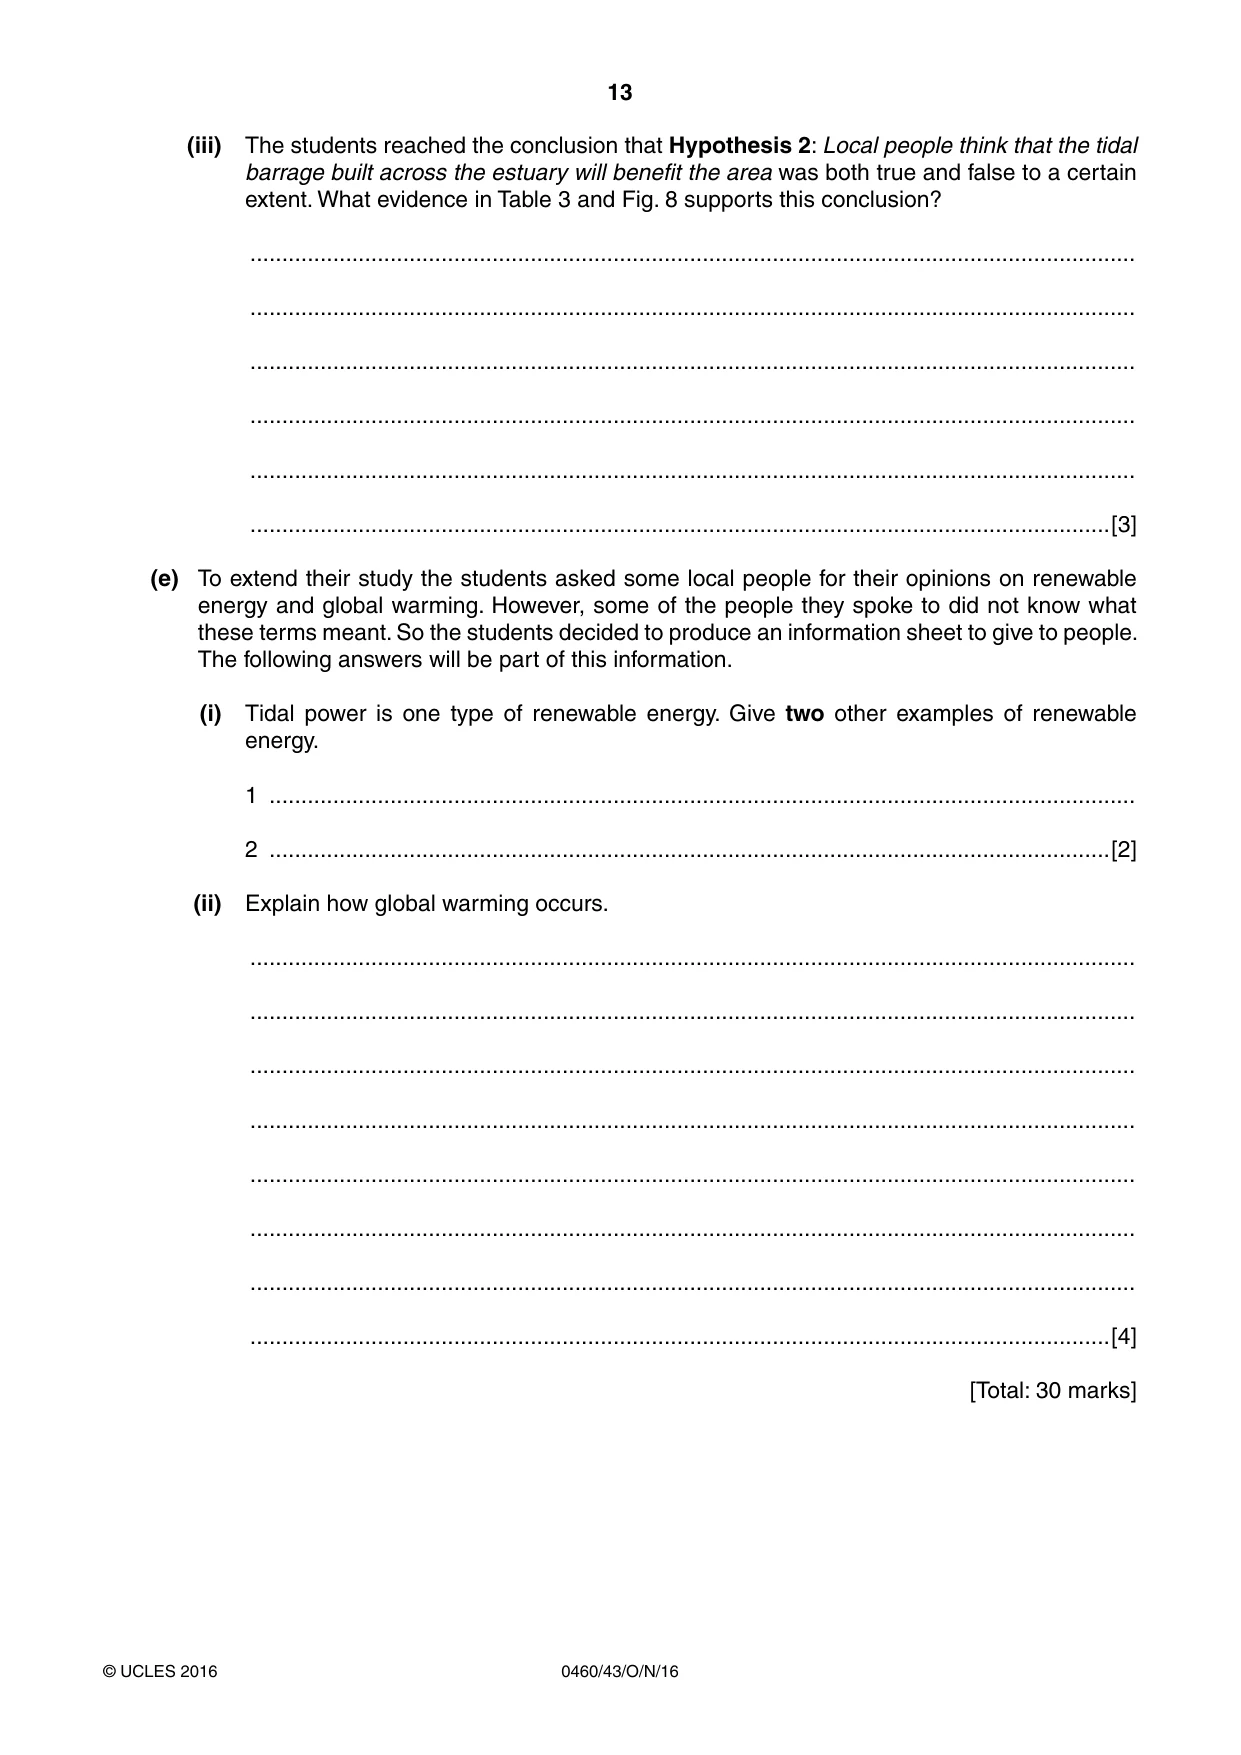
13 0460/43/O/N/16 © UCLES 2016 (iii) The students reached the conclusion that Hypothesis 2: Local people think that the tidal barrage built across the estuary will benefit the area was both true and false to a certain extent. What evidence in Table 3 and Fig. 8 supports this conclusion? … … … … … …[3] (e) To extend their study the students asked some local people for their opinions on renewable energy and global warming. However, some of the people they spoke to did not know what these terms meant. So the students decided to produce an information sheet to give to people. The following answers will be part of this information. (i) Tidal power is one type of renewable energy. Give two other examples of renewable energy. 1 … 2 …[2] (ii) Explain how global warming occurs. … … … … … … … …[4] [Total: 30 marks]
Question paper, page 14
14 0460/43/O/N/16 © UCLES 2016 Additional Pages If you use the following lined pages to complete the answer(s) to any question(s), the question number(s) must be clearly shown. … … … … … … … … … … … … … … … … … … … … … … … … … …
Question paper, page 15
15 0460/43/O/N/16 © UCLES 2016 … … … … … … … … … … … … … … … … … … … … … … … … … … … …
Question paper, page 16
16 0460/43/O/N/16 © UCLES 2016 BLANK PAGE Permission to reproduce items where third-party owned material protected by copyright is included has been sought and cleared where possible. Every reasonable effort has been made by the publisher (UCLES) to trace copyright holders, but if any items requiring clearance have unwittingly been included, the publisher will be pleased to make amends at the earliest possible opportunity. To avoid the issue of disclosure of answer-related information to candidates, all copyright acknowledgements are reproduced online in the Cambridge International Examinations Copyright Acknowledgements Booklet. This is produced for each series of examinations and is freely available to download at www.cie.org.uk after the live examination series. Cambridge International Examinations is part of the Cambridge Assessment Group. Cambridge Assessment is the brand name of University of Cambridge Local Examinations Syndicate (UCLES), which is itself a department of the University of Cambridge.
Mark scheme, page 1
® IGCSE is the registered trademark of Cambridge International Examinations. This syllabus is approved for use in England, Wales and Northern Ireland as a Cambridge International Level 1/Level 2 Certificate. This document consists of 5 printed pages. © UCLES 2016 [Turn over Cambridge International Examinations Cambridge International General Certificate of Secondary Education GEOGRAPHY 0460/43 Paper 4 Alternative to Coursework October/November 2016 MARK SCHEME Maximum Mark: 60 Published This mark scheme is published as an aid to teachers and candidates, to indicate the requirements of the examination. It shows the basis on which Examiners were instructed to award marks. It does not indicate the details of the discussions that took place at an Examiners’ meeting before marking began, which would have considered the acceptability of alternative answers. Mark schemes should be read in conjunction with the question paper and the Principal Examiner Report for Teachers. Cambridge will not enter into discussions about these mark schemes. Cambridge is publishing the mark schemes for the October/November 2016 series for most Cambridge IGCSE®, Cambridge International A and AS Level components and some Cambridge O Level components.
Mark scheme, page 2
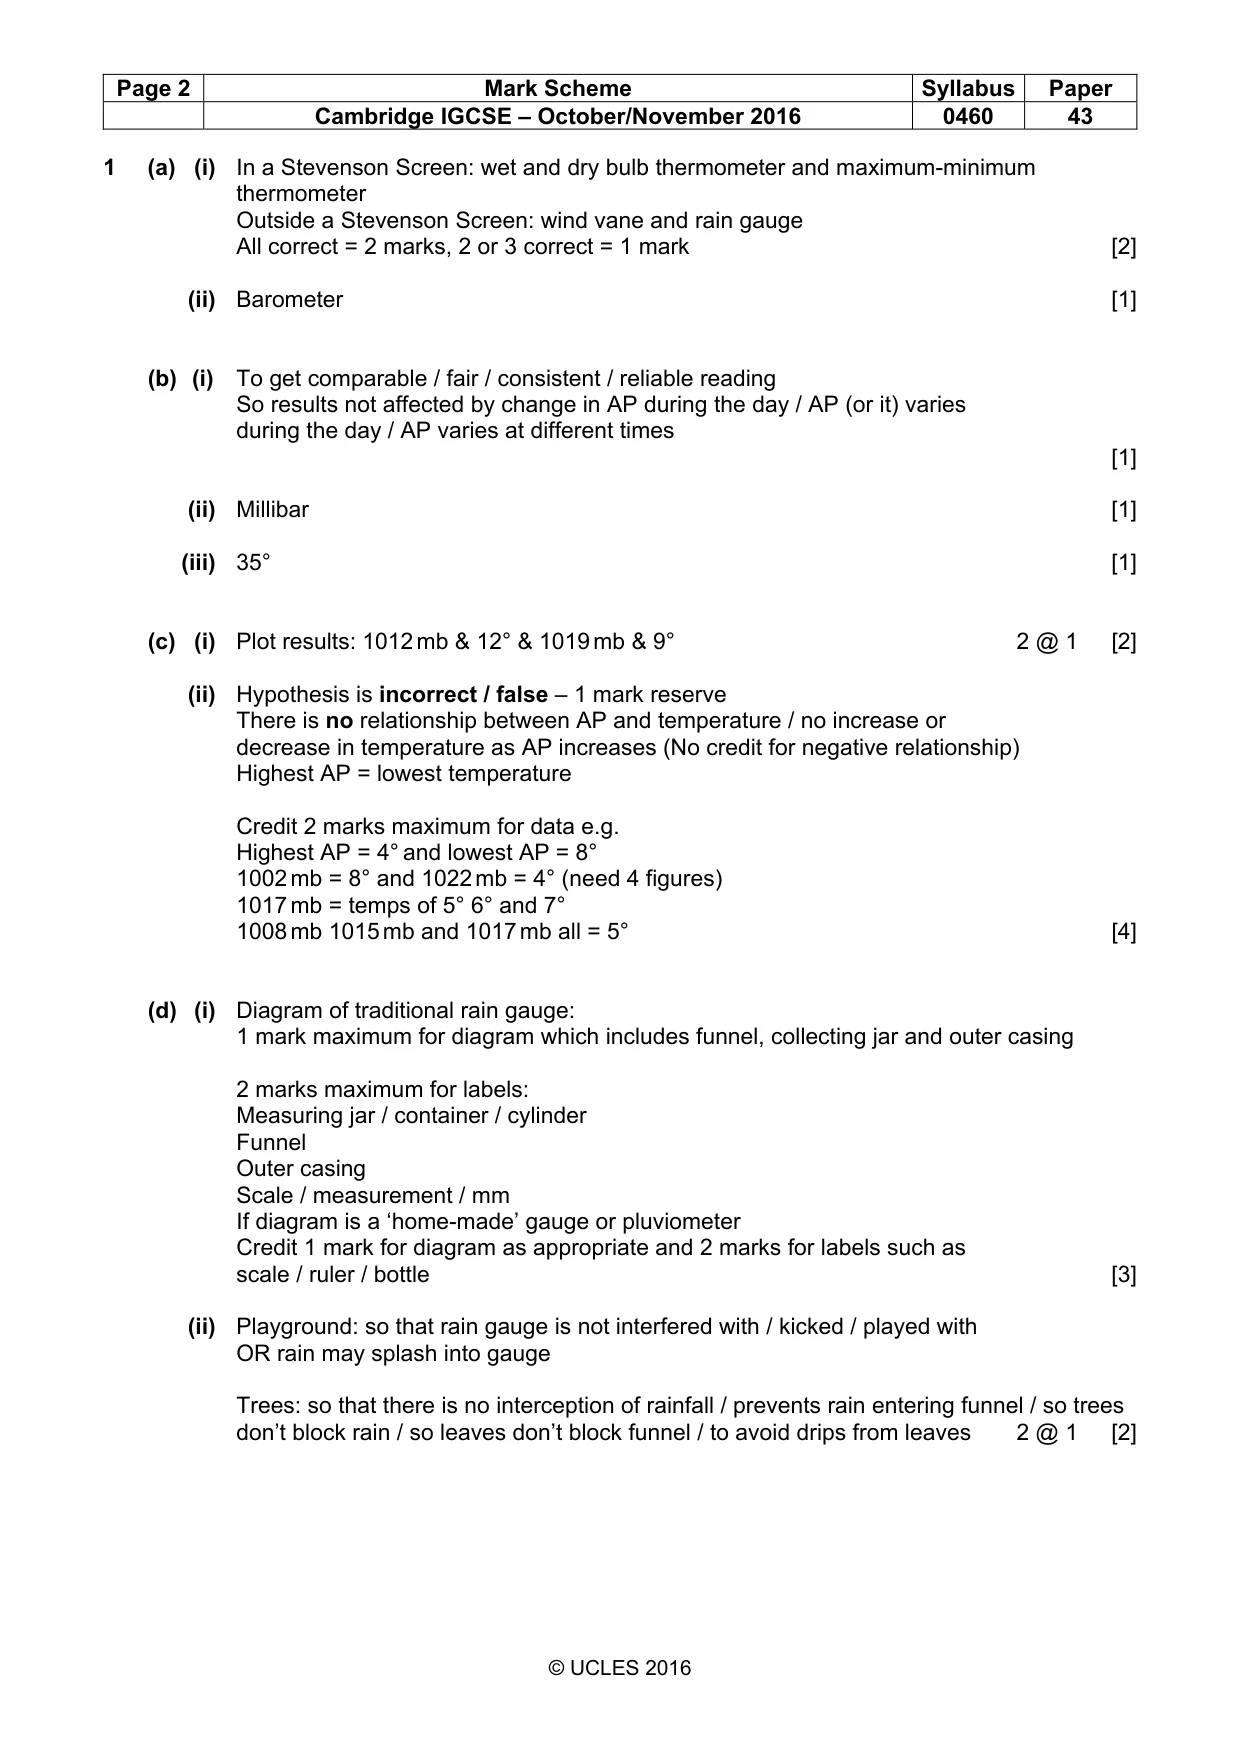
Page 2 Mark Scheme Syllabus Paper Cambridge IGCSE – October/November 2016 0460 43 © UCLES 2016 1 (a) (i) In a Stevenson Screen: wet and dry bulb thermometer and maximum-minimum thermometer Outside a Stevenson Screen: wind vane and rain gauge All correct = 2 marks, 2 or 3 correct = 1 mark [2] (ii) Barometer [1] (b) (i) To get comparable / fair / consistent / reliable reading So results not affected by change in AP during the day / AP (or it) varies during the day / AP varies at different times [1] (ii) Millibar [1] (iii) 35° [1] (c) (i) Plot results: 1012 mb & 12° & 1019 mb & 9° 2 @ 1 [2] (ii) Hypothesis is incorrect / false – 1 mark reserve There is no relationship between AP and temperature / no increase or decrease in temperature as AP increases (No credit for negative relationship) Highest AP = lowest temperature Credit 2 marks maximum for data e.g. Highest AP = 4° and lowest AP = 8° 1002 mb = 8° and 1022 mb = 4° (need 4 figures) 1017 mb = temps of 5° 6° and 7° 1008 mb 1015 mb and 1017 mb all = 5° [4] (d) (i) Diagram of traditional rain gauge: 1 mark maximum for diagram which includes funnel, collecting jar and outer casing 2 marks maximum for labels: Measuring jar / container / cylinder Funnel Outer casing Scale / measurement / mm If diagram is a ‘home-made’ gauge or pluviometer Credit 1 mark for diagram as appropriate and 2 marks for labels such as scale / ruler / bottle [3] (ii) Playground: so that rain gauge is not interfered with / kicked / played with OR rain may splash into gauge Trees: so that there is no interception of rainfall / prevents rain entering funnel / so trees don’t block rain / so leaves don’t block funnel / to avoid drips from leaves 2 @ 1 [2]
Mark scheme, page 3
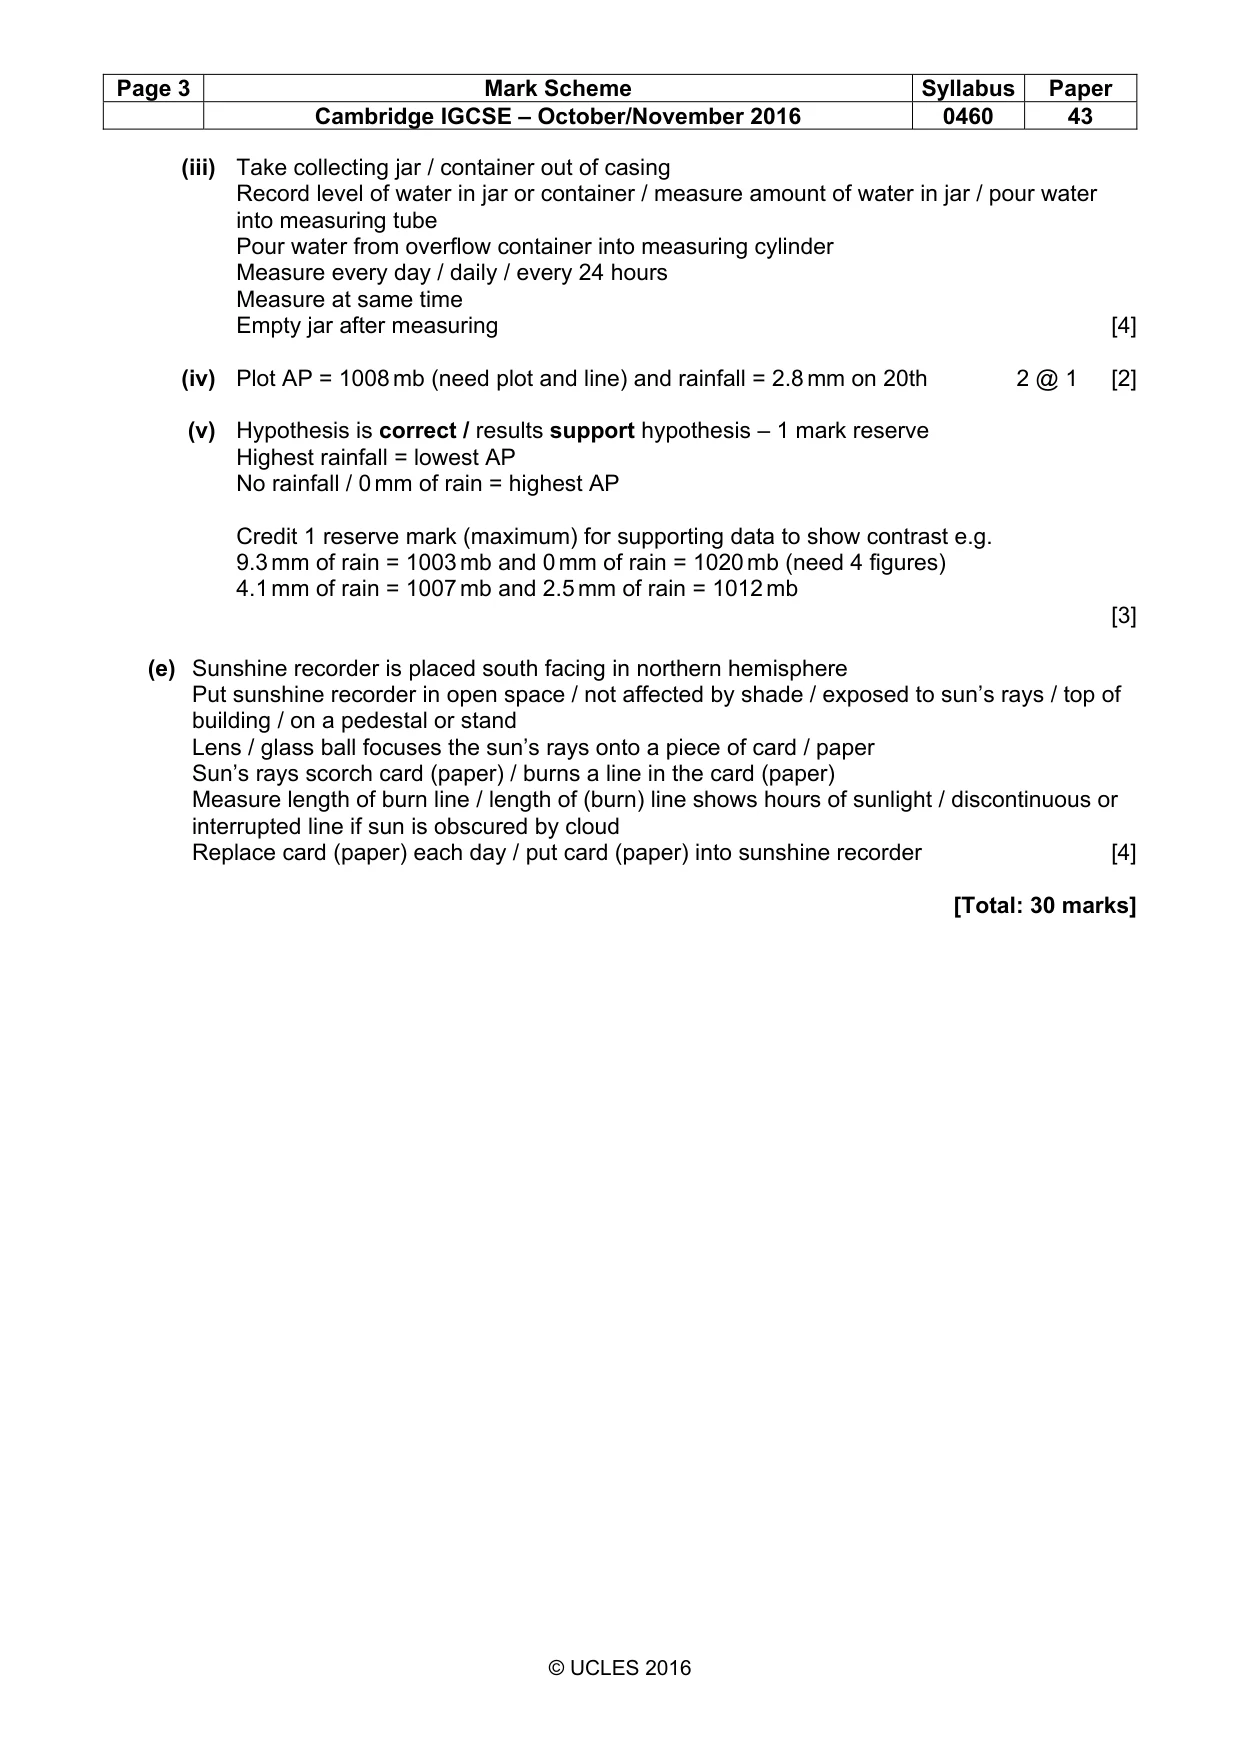
Page 3 Mark Scheme Syllabus Paper Cambridge IGCSE – October/November 2016 0460 43 © UCLES 2016 (iii) Take collecting jar / container out of casing Record level of water in jar or container / measure amount of water in jar / pour water into measuring tube Pour water from overflow container into measuring cylinder Measure every day / daily / every 24 hours Measure at same time Empty jar after measuring [4] (iv) Plot AP = 1008 mb (need plot and line) and rainfall = 2.8 mm on 20th 2 @ 1 [2] (v) Hypothesis is correct / results support hypothesis – 1 mark reserve Highest rainfall = lowest AP No rainfall / 0 mm of rain = highest AP Credit 1 reserve mark (maximum) for supporting data to show contrast e.g. 9.3 mm of rain = 1003 mb and 0 mm of rain = 1020 mb (need 4 figures) 4.1 mm of rain = 1007 mb and 2.5 mm of rain = 1012 mb [3] (e) Sunshine recorder is placed south facing in northern hemisphere Put sunshine recorder in open space / not affected by shade / exposed to sun’s rays / top of building / on a pedestal or stand Lens / glass ball focuses the sun’s rays onto a piece of card / paper Sun’s rays scorch card (paper) / burns a line in the card (paper) Measure length of burn line / length of (burn) line shows hours of sunlight / discontinuous or interrupted line if sun is obscured by cloud Replace card (paper) each day / put card (paper) into sunshine recorder [4] [Total: 30 marks]
Mark scheme, page 4
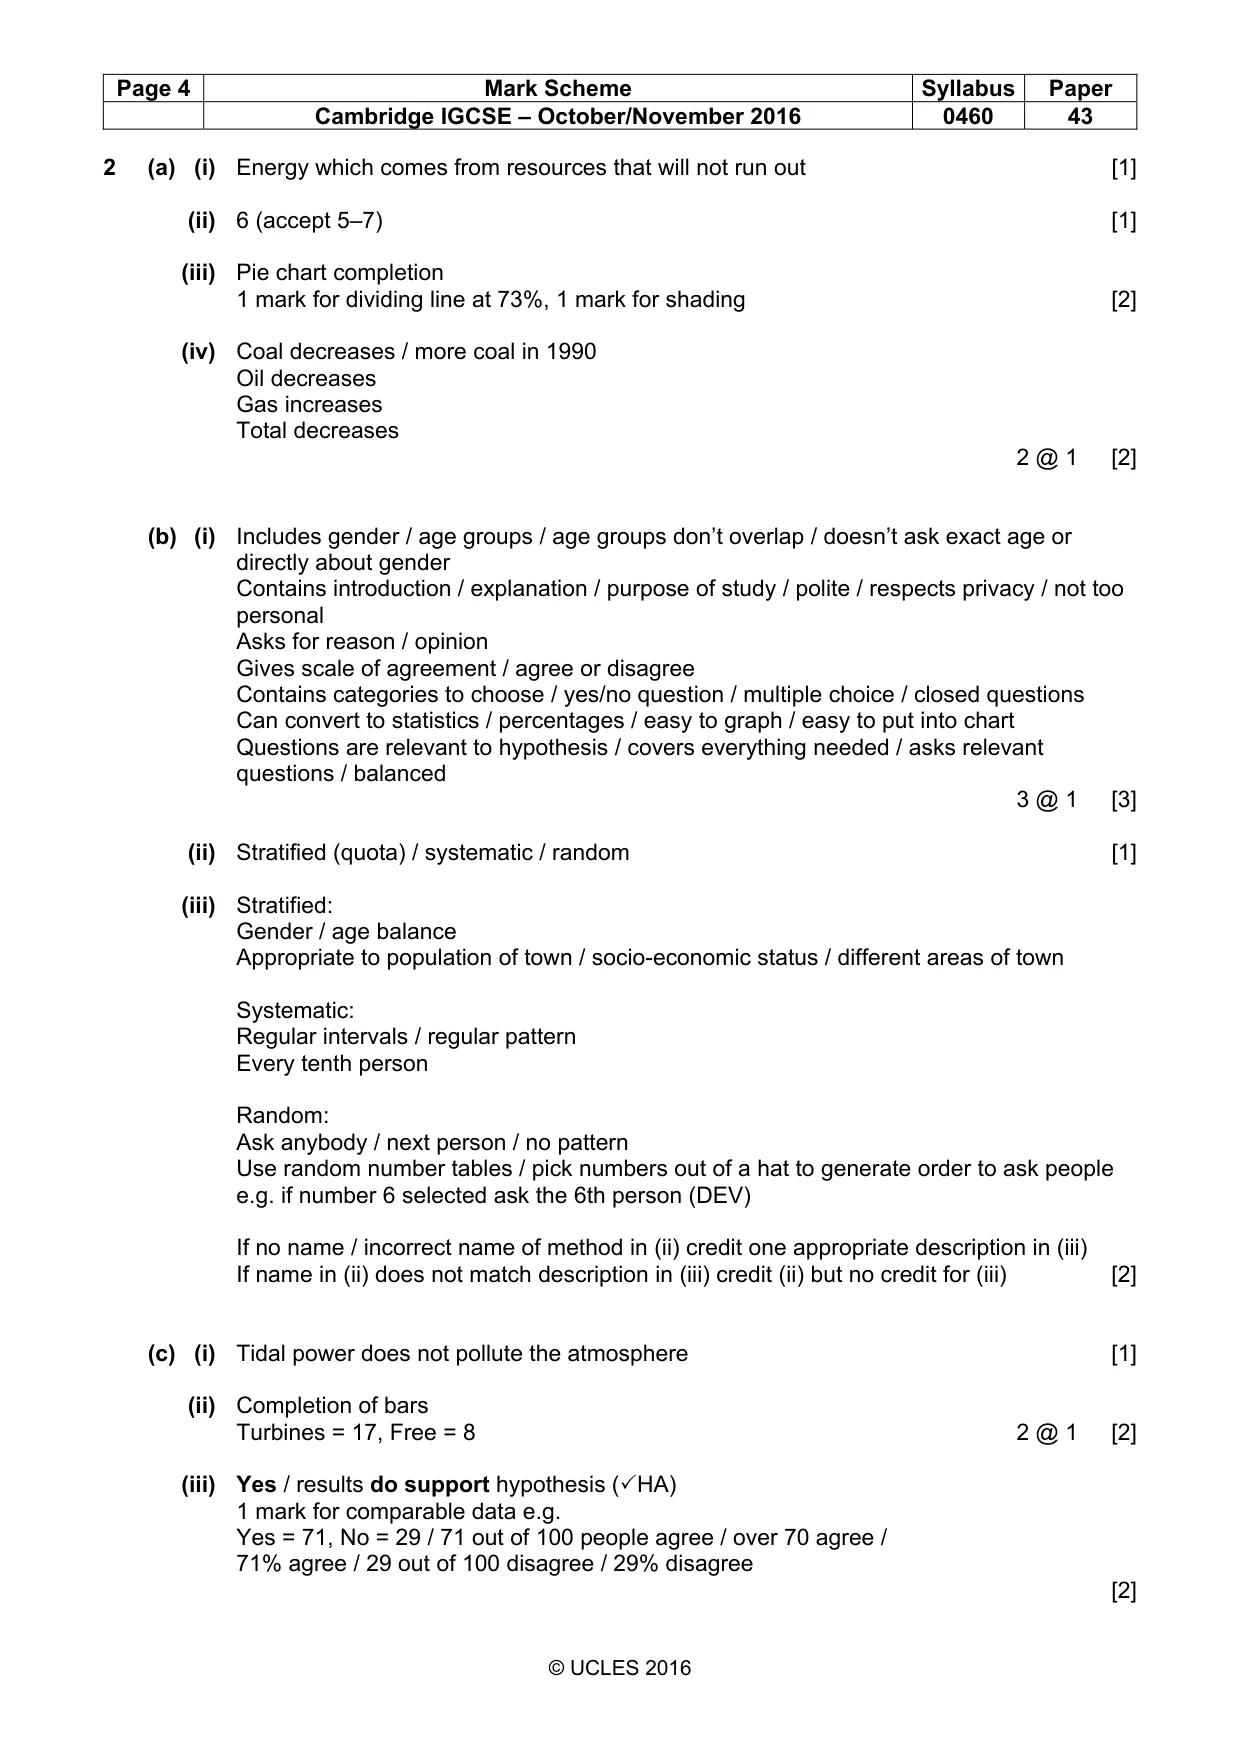
Page 4 Mark Scheme Syllabus Paper Cambridge IGCSE – October/November 2016 0460 43 © UCLES 2016 2 (a) (i) Energy which comes from resources that will not run out [1] (ii) 6 (accept 5–7) [1] (iii) Pie chart completion 1 mark for dividing line at 73%, 1 mark for shading [2] (iv) Coal decreases / more coal in 1990 Oil decreases Gas increases Total decreases 2 @ 1 [2] (b) (i) Includes gender / age groups / age groups don’t overlap / doesn’t ask exact age or directly about gender Contains introduction / explanation / purpose of study / polite / respects privacy / not too personal Asks for reason / opinion Gives scale of agreement / agree or disagree Contains categories to choose / yes/no question / multiple choice / closed questions Can convert to statistics / percentages / easy to graph / easy to put into chart Questions are relevant to hypothesis / covers everything needed / asks relevant questions / balanced 3 @ 1 [3] (ii) Stratified (quota) / systematic / random [1] (iii) Stratified: Gender / age balance Appropriate to population of town / socio-economic status / different areas of town Systematic: Regular intervals / regular pattern Every tenth person Random: Ask anybody / next person / no pattern Use random number tables / pick numbers out of a hat to generate order to ask people e.g. if number 6 selected ask the 6th person (DEV) If no name / incorrect name of method in (ii) credit one appropriate description in (iii) If name in (ii) does not match description in (iii) credit (ii) but no credit for (iii) [2] (c) (i) Tidal power does not pollute the atmosphere [1] (ii) Completion of bars Turbines = 17, Free = 8 2 @ 1 [2] (iii) Yes / results do support hypothesis (3HA) 1 mark for comparable data e.g. Yes = 71, No = 29 / 71 out of 100 people agree / over 70 agree / 71% agree / 29 out of 100 disagree / 29% disagree [2]
Mark scheme, page 5
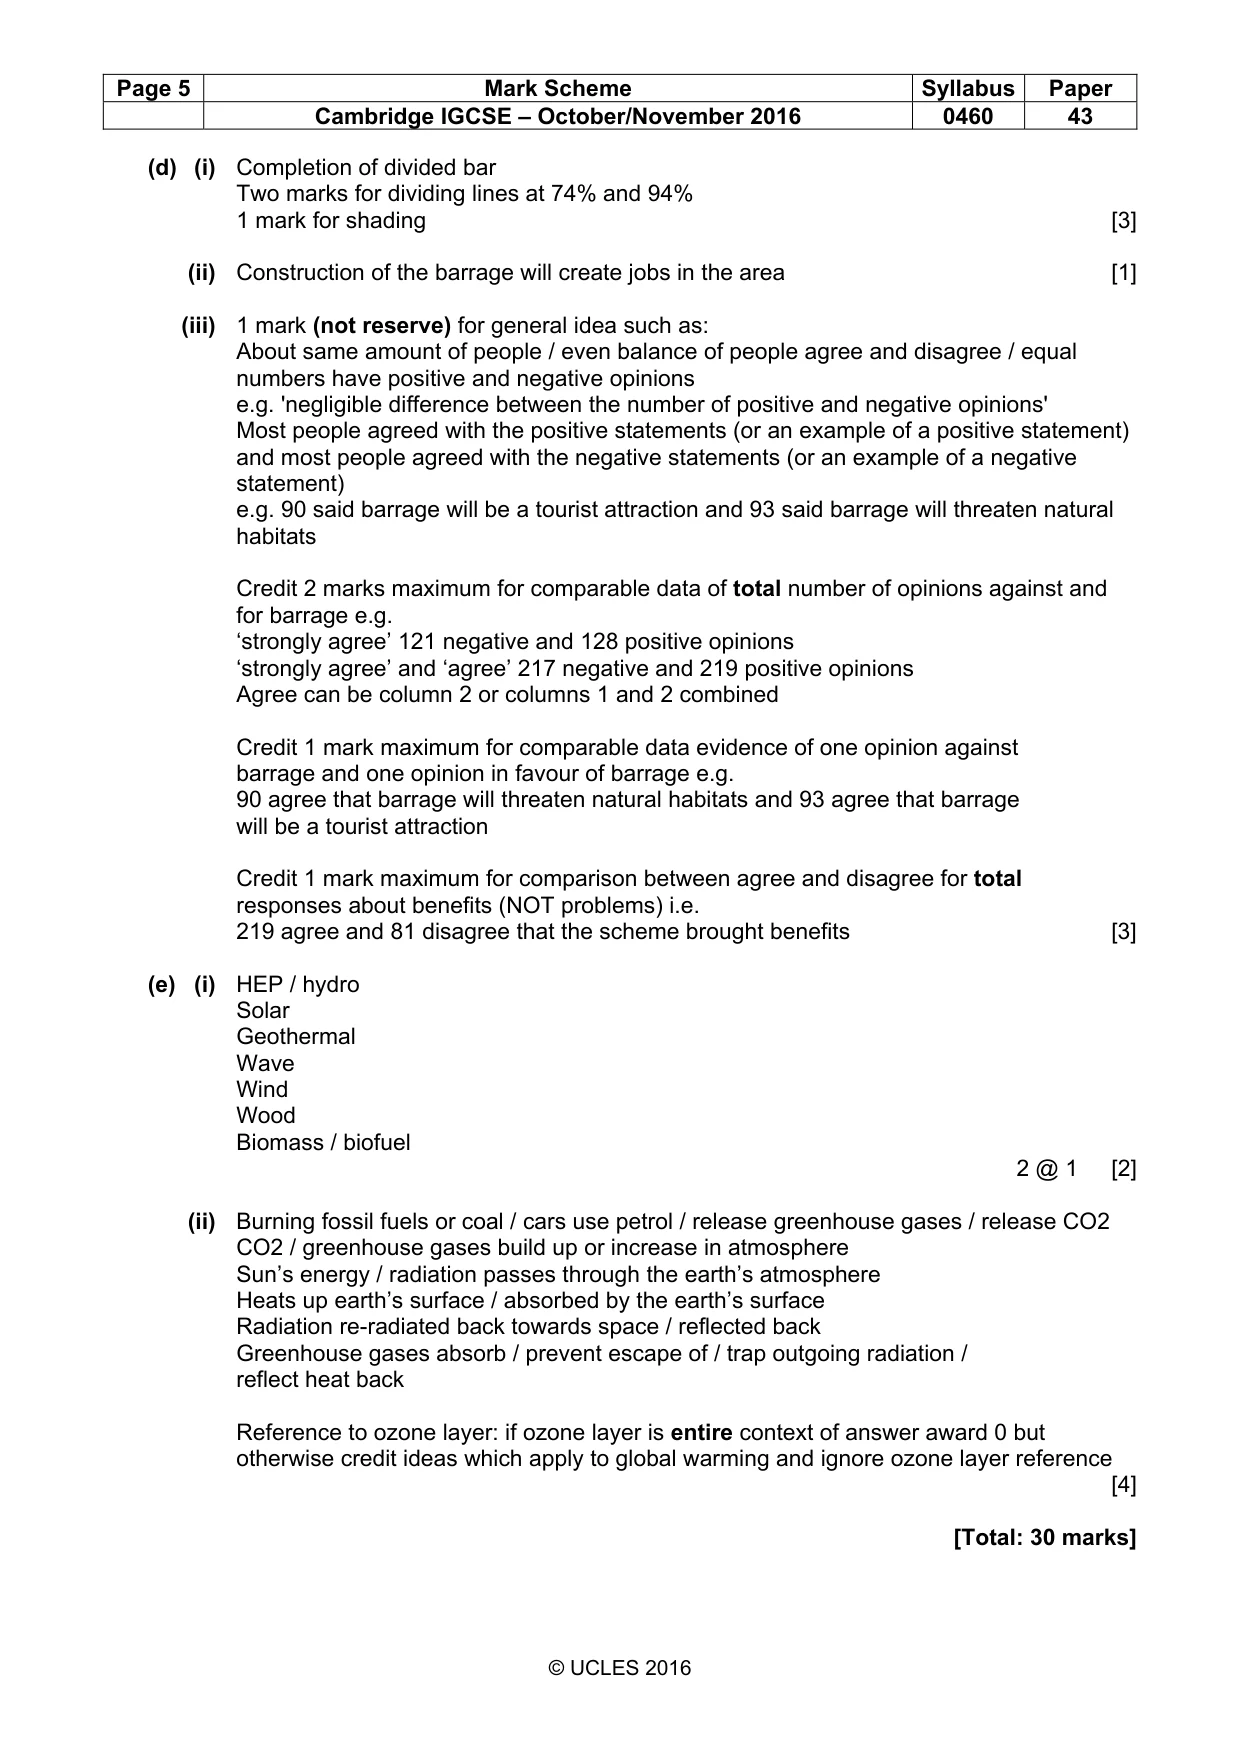
Page 5 Mark Scheme Syllabus Paper Cambridge IGCSE – October/November 2016 0460 43 © UCLES 2016 (d) (i) Completion of divided bar Two marks for dividing lines at 74% and 94% 1 mark for shading [3] (ii) Construction of the barrage will create jobs in the area [1] (iii) 1 mark (not reserve) for general idea such as: About same amount of people / even balance of people agree and disagree / equal numbers have positive and negative opinions e.g. 'negligible difference between the number of positive and negative opinions' Most people agreed with the positive statements (or an example of a positive statement) and most people agreed with the negative statements (or an example of a negative statement) e.g. 90 said barrage will be a tourist attraction and 93 said barrage will threaten natural habitats Credit 2 marks maximum for comparable data of total number of opinions against and for barrage e.g. ‘strongly agree’ 121 negative and 128 positive opinions ‘strongly agree’ and ‘agree’ 217 negative and 219 positive opinions Agree can be column 2 or columns 1 and 2 combined Credit 1 mark maximum for comparable data evidence of one opinion against barrage and one opinion in favour of barrage e.g. 90 agree that barrage will threaten natural habitats and 93 agree that barrage will be a tourist attraction Credit 1 mark maximum for comparison between agree and disagree for total responses about benefits (NOT problems) i.e. 219 agree and 81 disagree that the scheme brought benefits [3] (e) (i) HEP / hydro Solar Geothermal Wave Wind Wood Biomass / biofuel 2 @ 1 [2] (ii) Burning fossil fuels or coal / cars use petrol / release greenhouse gases / release CO2 CO2 / greenhouse gases build up or increase in atmosphere Sun’s energy / radiation passes through the earth’s atmosphere Heats up earth’s surface / absorbed by the earth’s surface Radiation re-radiated back towards space / reflected back Greenhouse gases absorb / prevent escape of / trap outgoing radiation / reflect heat back Reference to ozone layer: if ozone layer is entire context of answer award 0 but otherwise credit ideas which apply to global warming and ignore ozone layer reference [4] [Total: 30 marks]
What you needed in this session
Cambridge’s own grade thresholds for 2016 Oct/Nov, Paper 4 · Variant 3. A higher threshold means an easier paper — the bar moves with how the cohort did.