Cambridge IGCSE Geography 0460 — 2016 Oct/Nov Paper 4 · Variant 2
0460/42/O/N/16 · 60 marks · ≈68 min
The question paper and its mark scheme, free to read here and free to download. This is Cambridge’s own paper, exactly as it was sat.
Question paper20 pages




Mark scheme6 pages
Answers below. Sit the paper first if you are practising.
Paper as text
Question paper, page 1
This document consists of 17 printed pages, 3 blank pages and 1 Insert. DC (CW/JG) 115399/3 © UCLES 2016 [Turn over Cambridge International Examinations Cambridge International General Certificate of Secondary Education * 3 3 4 9 4 0 3 0 3 2 * GEOGRAPHY 0460/42 Paper 4 Alternative to Coursework October/November 2016 1 hour 30 minutes Candidates answer on the Question Paper. Additional Materials: Calculator Protractor Ruler READ THESE INSTRUCTIONS FIRST Write your Centre number, candidate number and name in the spaces provided. Write in dark blue or black pen. You may use an HB pencil for any diagrams or graphs. Do not use staples, paper clips, glue or correction fluid. DO NOT WRITE IN ANY BARCODES. Write your answer to each question in the space provided. If additional space is required, you should use the lined pages at the end of the booklet. The question number(s) must be clearly shown. Answer all questions. The Insert contains Figs. 1 and 5 and Table 2 for Question 1, Figs. 6 and 10 and Tables 4 and 6 for Question 2. The Insert is not required by the Examiner. Sketch maps and diagrams should be drawn whenever they serve to illustrate an answer. At the end of the examination, fasten all your work securely together. The number of marks is given in brackets [ ] at the end of each question or part question. The syllabus is approved for use in England, Wales and Northern Ireland as a Cambridge International Level 1/Level 2 Certificate.
Question paper, page 2
2 0460/42/O/N/16 © UCLES 2016 1 Some students did fieldwork in a small river drainage basin in south west England. The students chose four sites which are shown on Fig. 1 (Insert). (a) Which two features of the drainage basin are labelled A and B on Fig. 1? Choose from the following: confluence meander source tributary watershed Feature A … Feature B … [2] The students decided to investigate the following hypotheses: Hypothesis 1: River discharge increases downstream. Hypothesis 2: River pollution increases downstream. (b) In order to calculate river discharge the students had to measure river velocity and channel width and depth. (i) First they measured velocity once at each site using floats, a tape measure and a stopwatch. Describe how they measured velocity. … … … … … … … …[4] (ii) When the students returned to school they discussed with their teacher possible weaknesses of their method for measuring velocity. Give two weaknesses of the method. 1 … … 2 … …[2]
Question paper, page 3
3 0460/42/O/N/16 © UCLES 2016 [Turn over (iii) Next the students measured the width of the river channel and the depth of the river at points across the channel. Describe how the students would make these measurements and what equipment they would use. … … … … … … … …[4]
Question paper, page 4
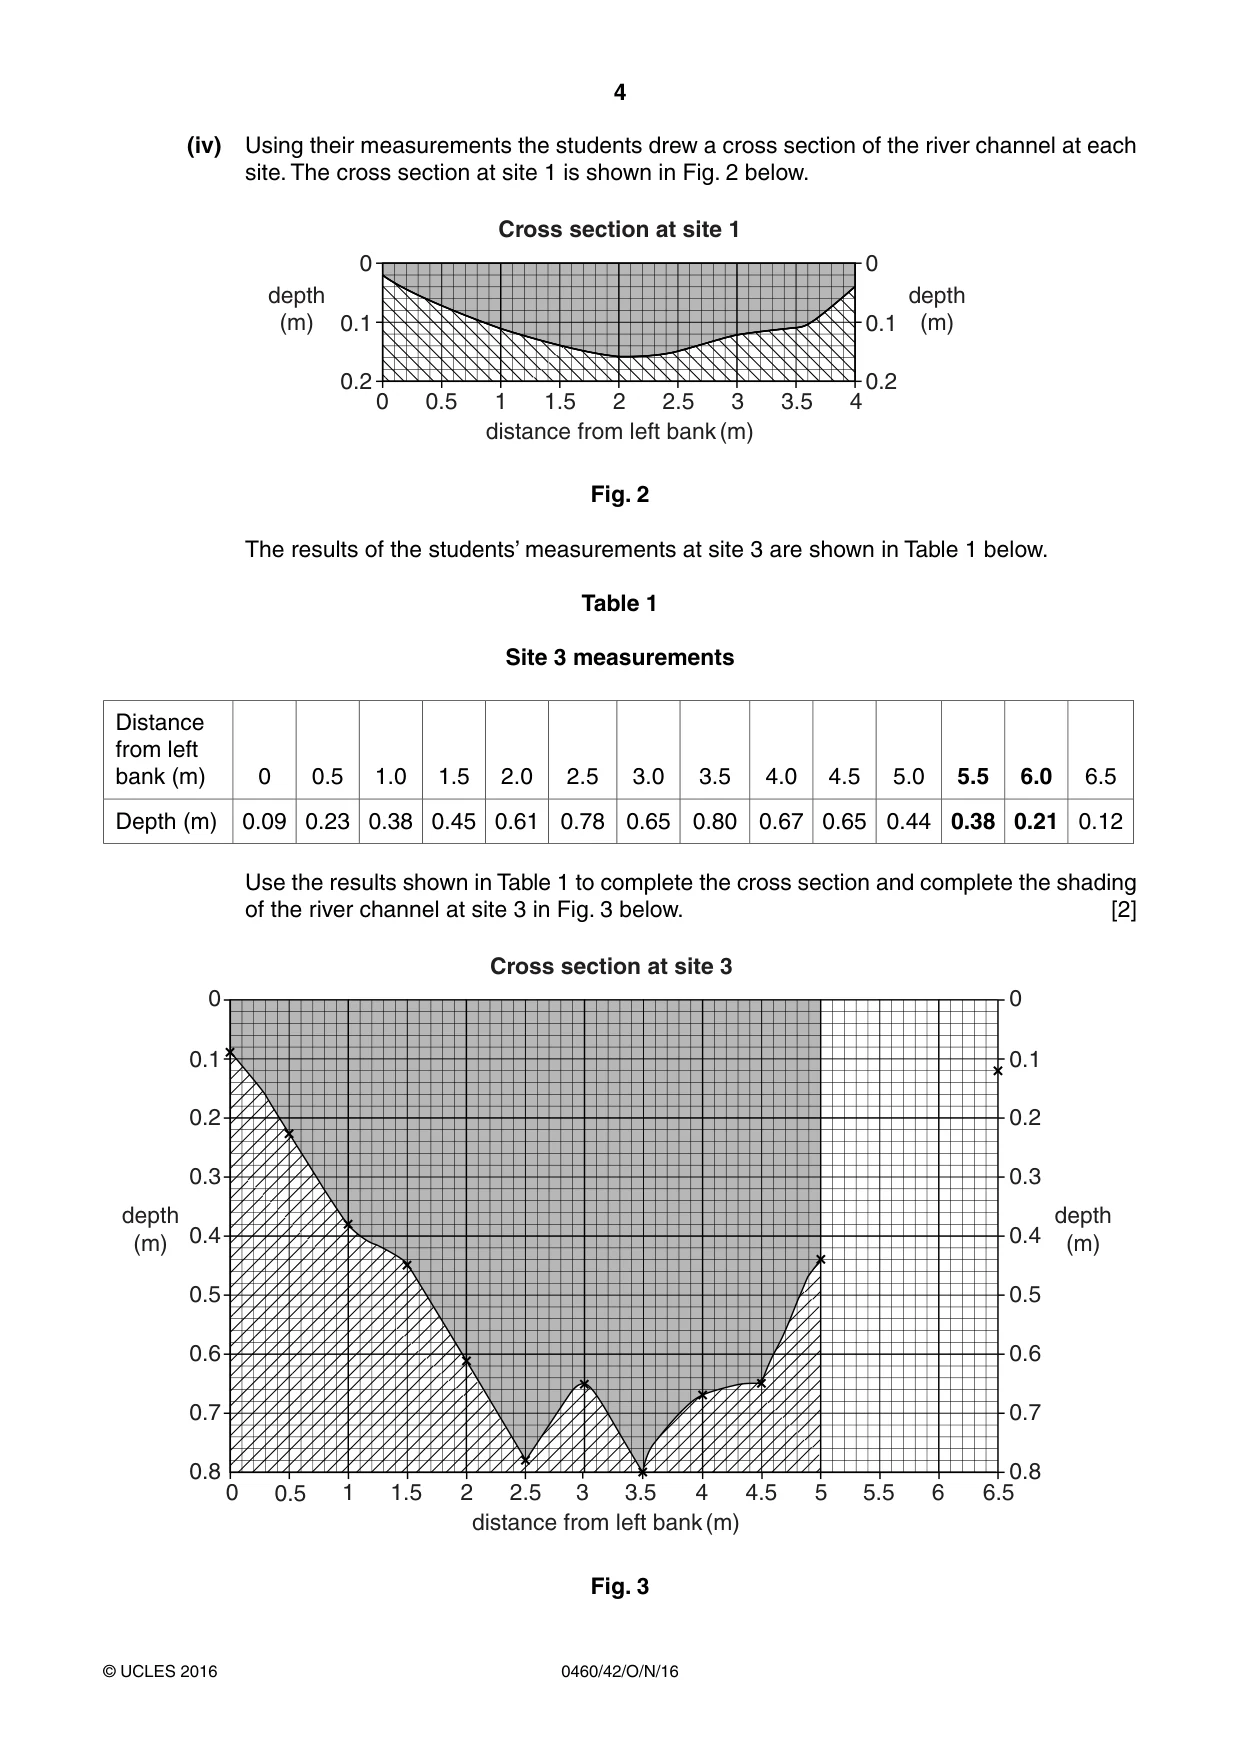
4 0460/42/O/N/16 © UCLES 2016 (iv) Using their measurements the students drew a cross section of the river channel at each site. The cross section at site 1 is shown in Fig. 2 below. 0 0.5 0.2 0.1 0 0.2 0.1 0 1 1.5 2 2.5 3 3.5 4 distance from left bank (m) Cross section at site 1 depth (m) depth (m) Fig. 2 The results of the students’ measurements at site 3 are shown in Table 1 below. Table 1 Site 3 measurements Distance from left bank (m) 0 0.5 1.0 1.5 2.0 2.5 3.0 3.5 4.0 4.5 5.0 5.5 6.0 6.5 Depth (m) 0.09 0.23 0.38 0.45 0.61 0.78 0.65 0.80 0.67 0.65 0.44 0.38 0.21 0.12 Use the results shown in Table 1 to complete the cross section and complete the shading of the river channel at site 3 in Fig. 3 below. [2] 0 0.5 0.2 0.3 0.4 0.5 0.6 0.7 0.8 0.1 0 0.2 0.3 0.4 0.5 0.6 0.7 0.8 0.1 0 1 1.5 2 2.5 3 3.5 4 5 6 4.5 5.5 6.5 distance from left bank (m) Cross section at site 3 depth (m) depth (m) Fig. 3
Question paper, page 5
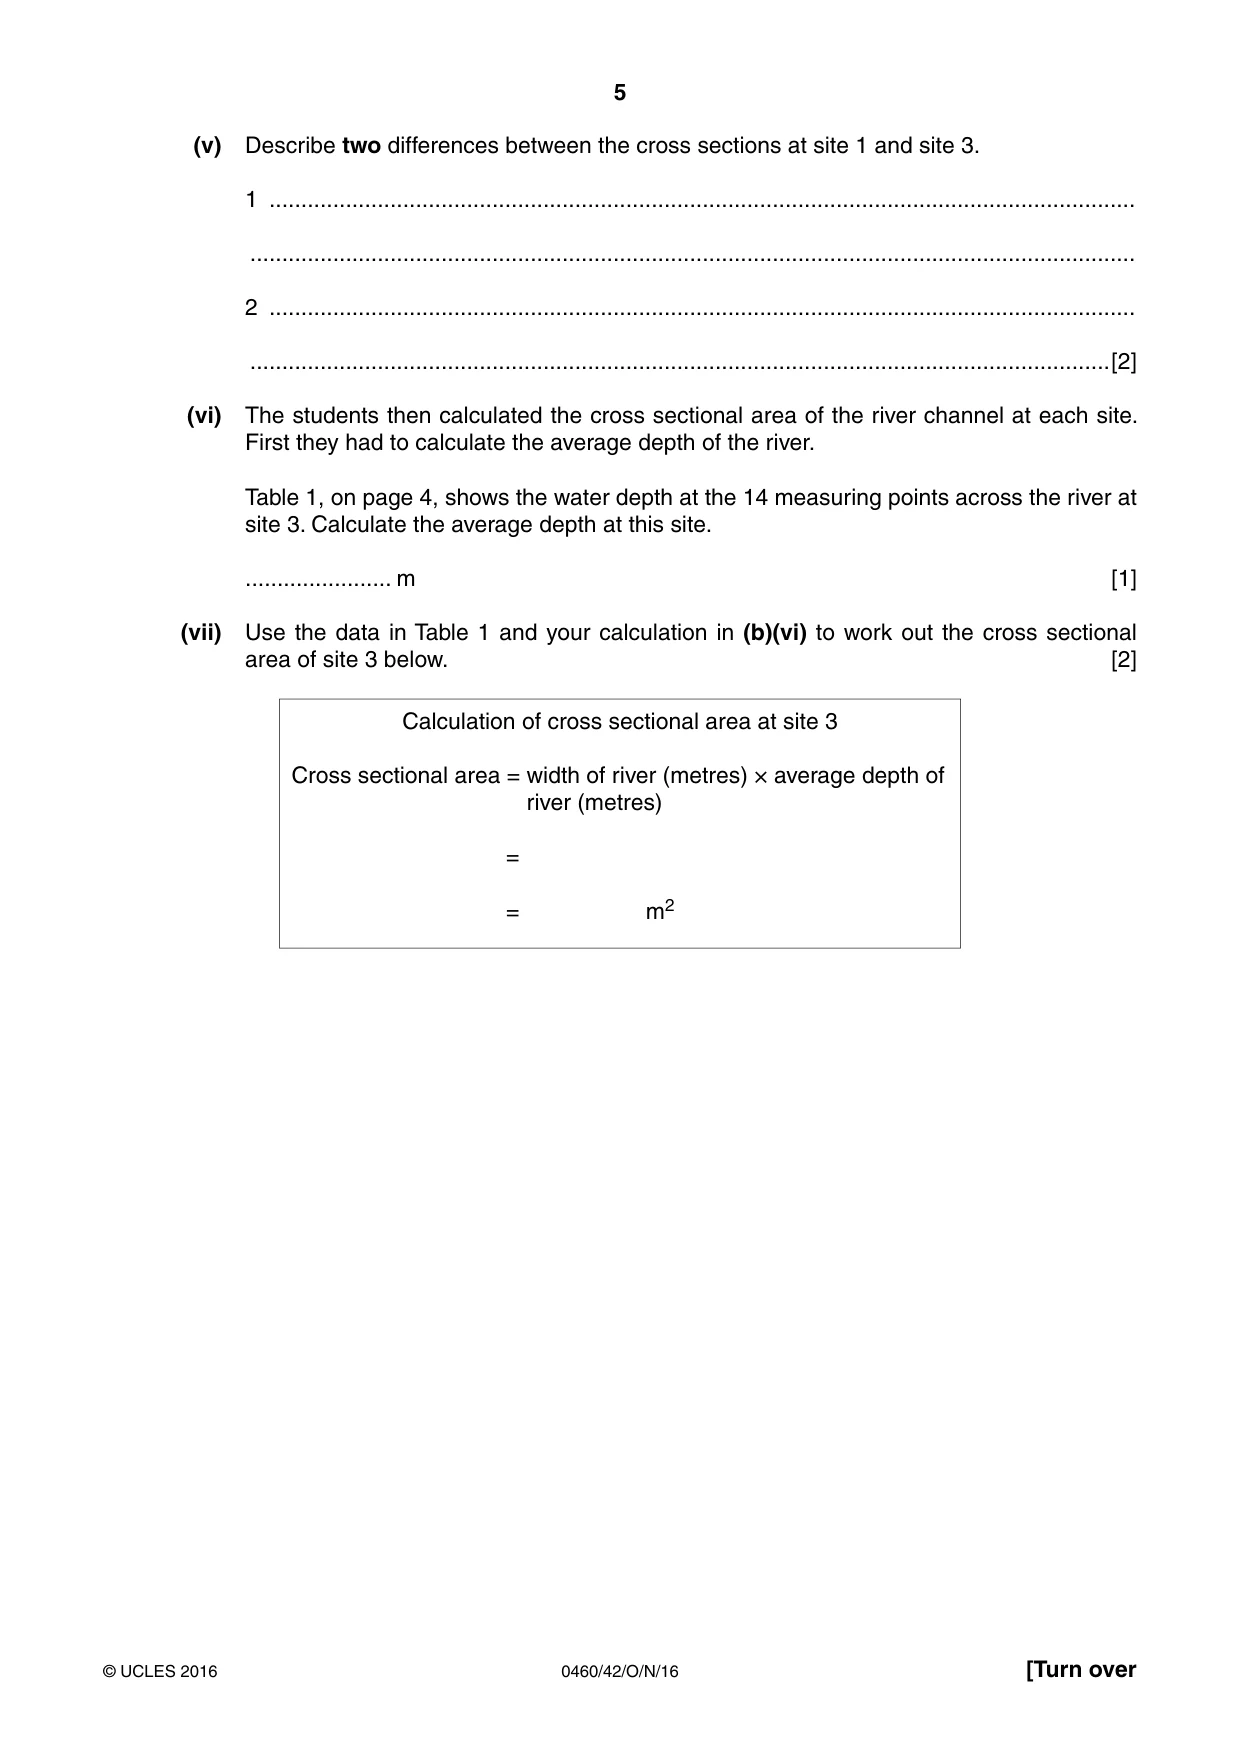
5 0460/42/O/N/16 © UCLES 2016 [Turn over (v) Describe two differences between the cross sections at site 1 and site 3. 1 … … 2 … …[2] (vi) The students then calculated the cross sectional area of the river channel at each site. First they had to calculate the average depth of the river. Table 1, on page 4, shows the water depth at the 14 measuring points across the river at site 3. Calculate the average depth at this site. … m [1] (vii) Use the data in Table 1 and your calculation in (b)(vi) to work out the cross sectional area of site 3 below. [2] Calculation of cross sectional area at site 3 Cross sectional area = width of river (metres) × average depth of river (metres) = = m2
Question paper, page 6
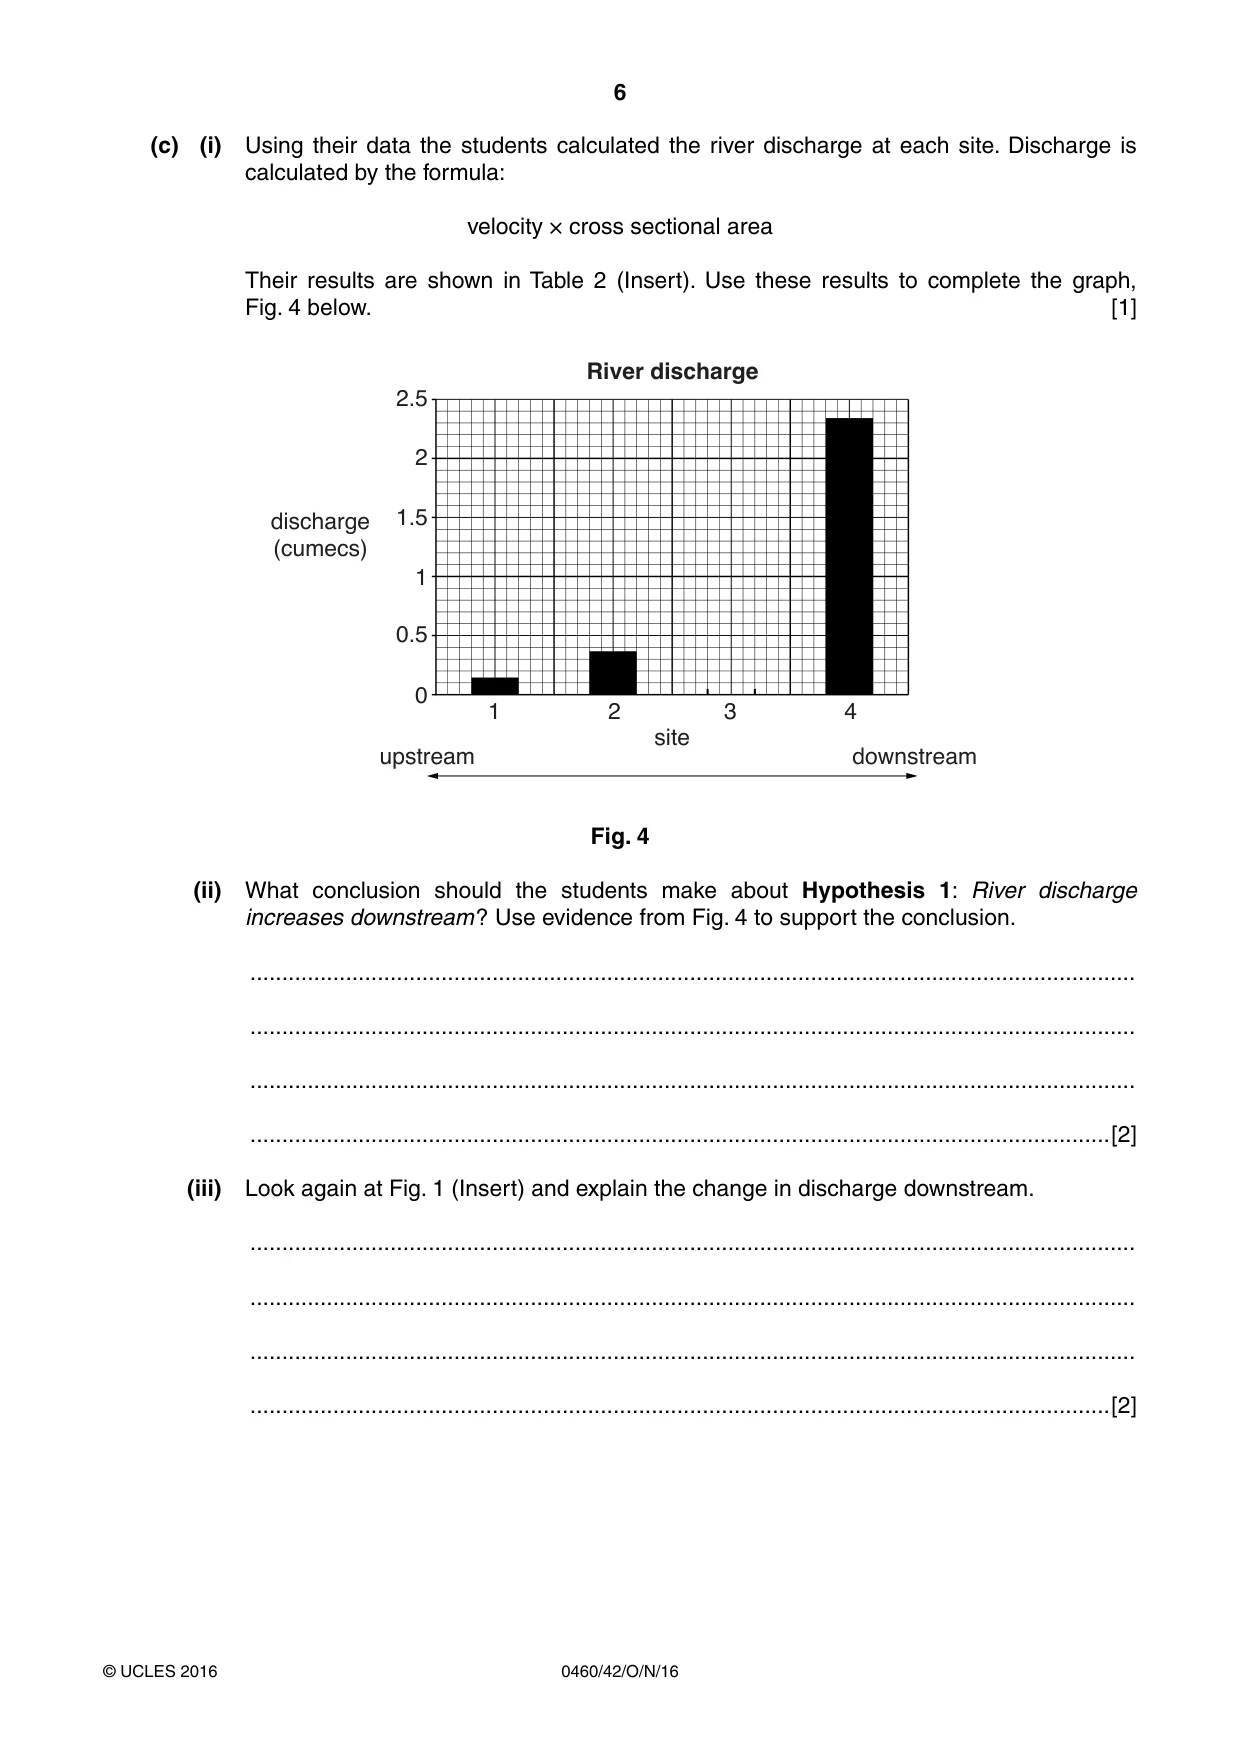
6 0460/42/O/N/16 © UCLES 2016 (c) (i) Using their data the students calculated the river discharge at each site. Discharge is calculated by the formula: velocity × cross sectional area Their results are shown in Table 2 (Insert). Use these results to complete the graph, Fig. 4 below. [1] River discharge 1 0 0.5 1 1.5 2 2.5 2 3 4 discharge (cumecs) upstream downstream site Fig. 4 (ii) What conclusion should the students make about Hypothesis 1: River discharge increases downstream ? Use evidence from Fig. 4 to support the conclusion. … … … …[2] (iii) Look again at Fig. 1 (Insert) and explain the change in discharge downstream. … … … …[2]
Question paper, page 7
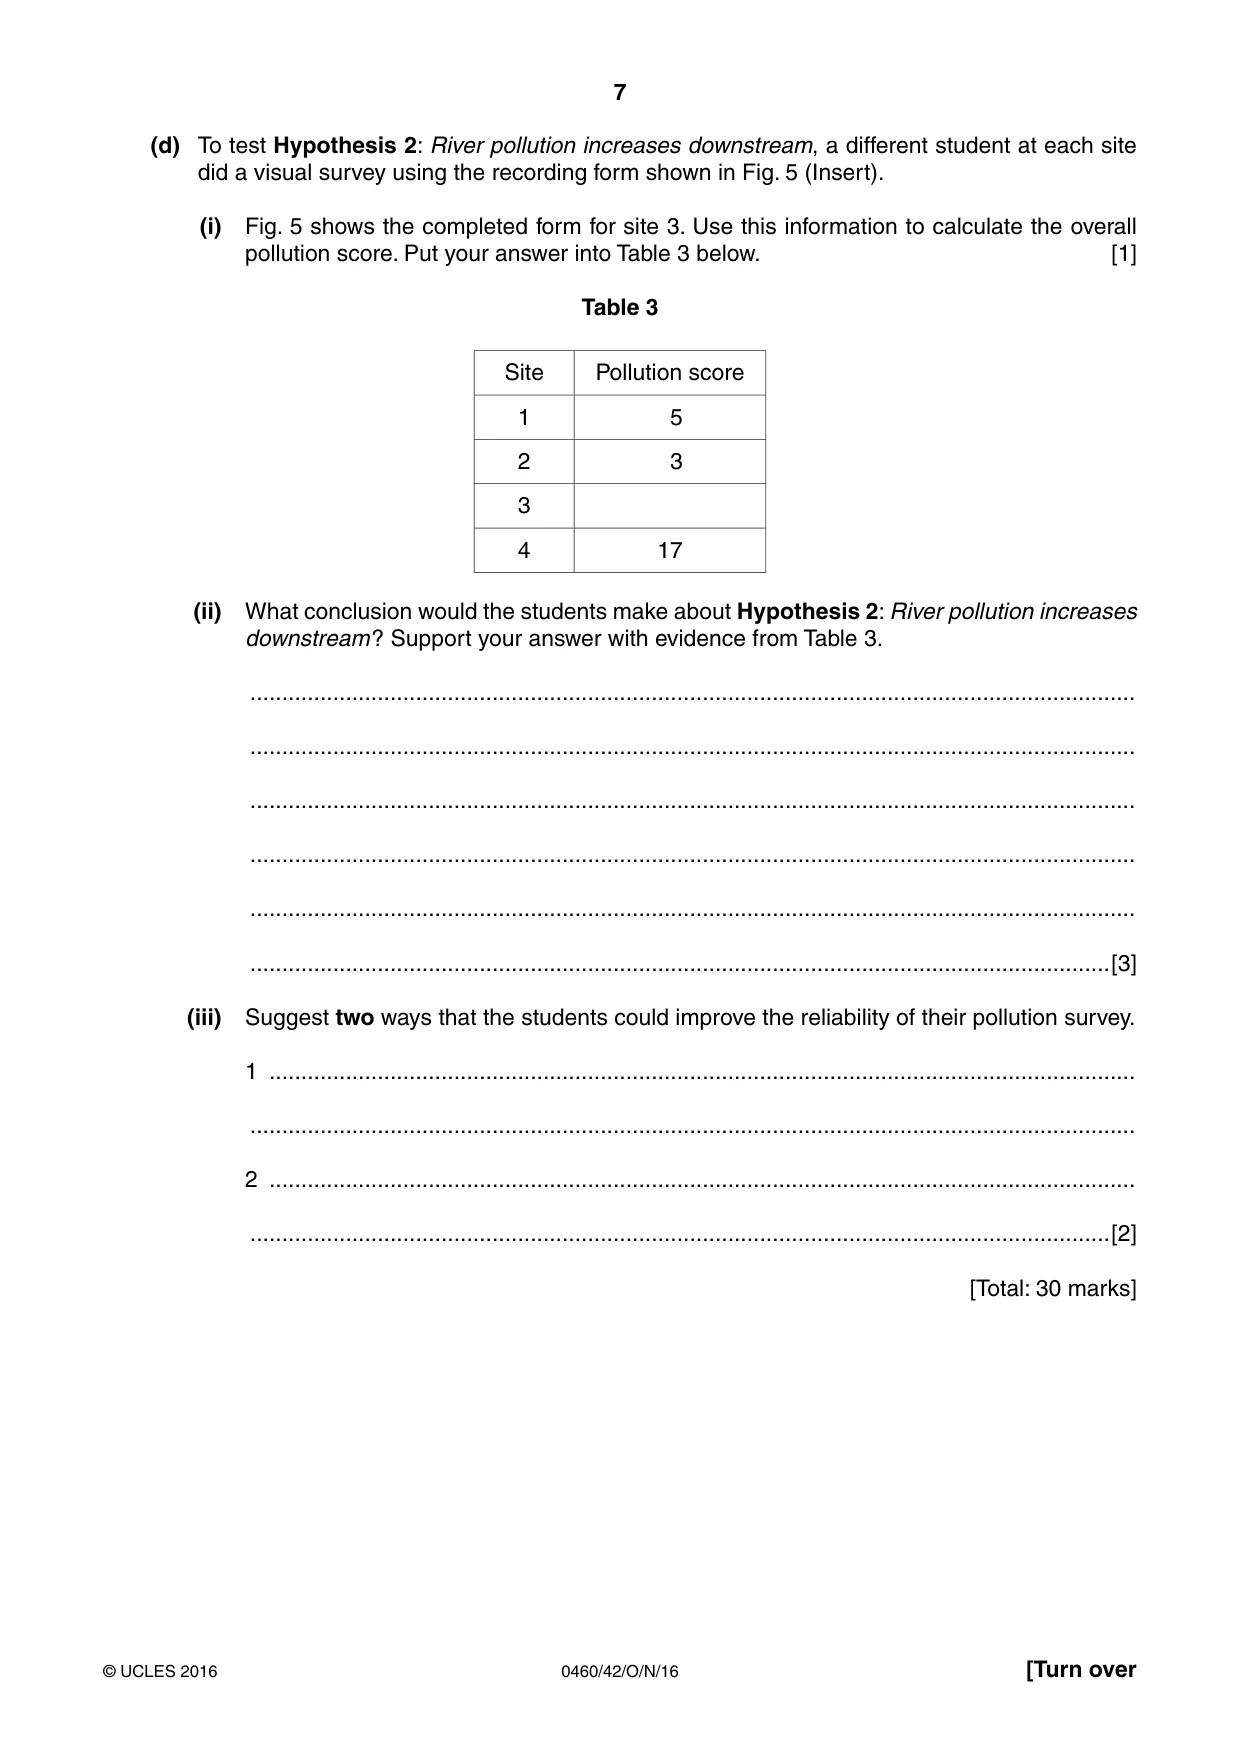
7 0460/42/O/N/16 © UCLES 2016 [Turn over (d) To test Hypothesis 2: River pollution increases downstream, a different student at each site did a visual survey using the recording form shown in Fig. 5 (Insert). (i) Fig. 5 shows the completed form for site 3. Use this information to calculate the overall pollution score. Put your answer into Table 3 below. [1] Table 3 Site Pollution score 1 5 2 3 3 4 17 (ii) What conclusion would the students make about Hypothesis 2: River pollution increases downstream ? Support your answer with evidence from Table 3. … … … … … …[3] (iii) Suggest two ways that the students could improve the reliability of their pollution survey. 1 … … 2 … …[2] [Total: 30 marks]
Question paper, page 8
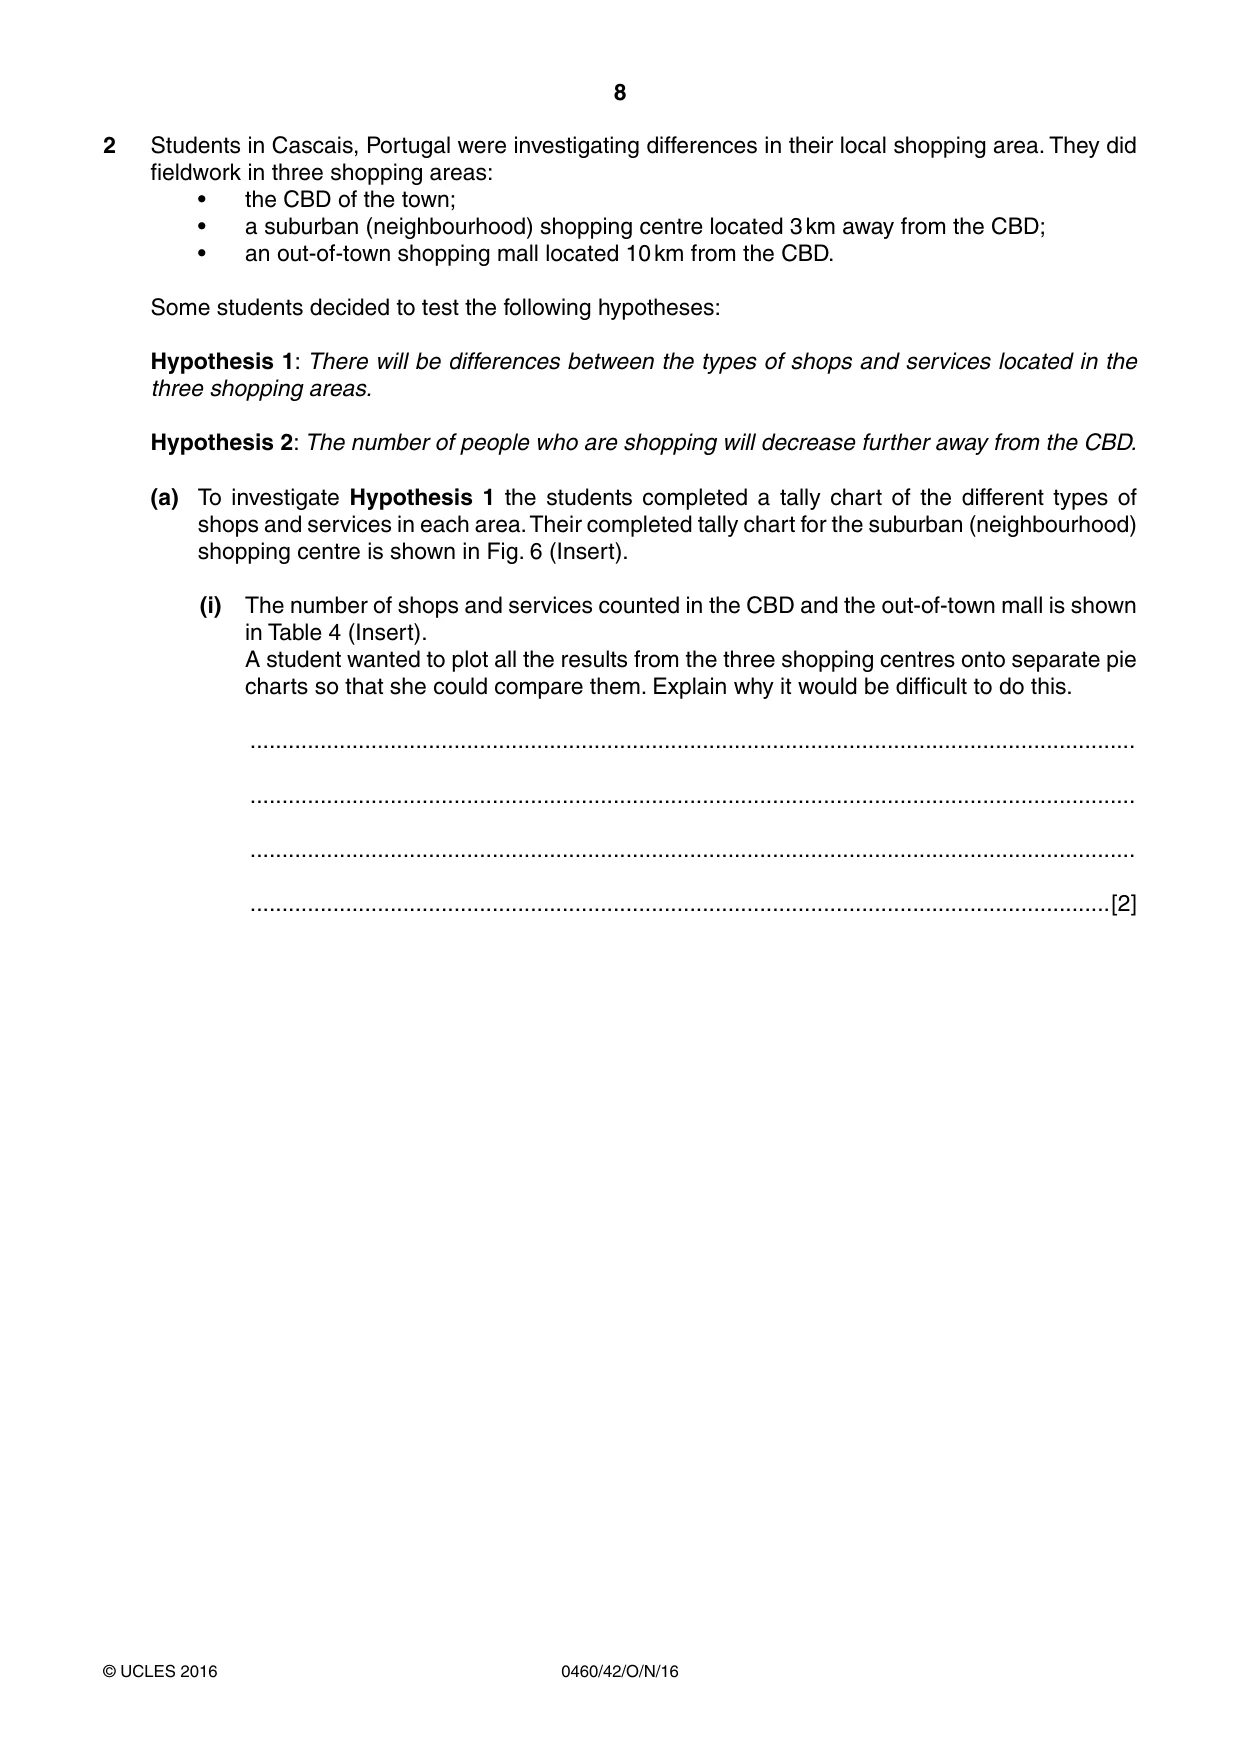
8 0460/42/O/N/16 © UCLES 2016 2 Students in Cascais, Portugal were investigating differences in their local shopping area. They did fieldwork in three shopping areas: • the CBD of the town; • a suburban (neighbourhood) shopping centre located 3 km away from the CBD; • an out-of-town shopping mall located 10 km from the CBD. Some students decided to test the following hypotheses: Hypothesis 1: There will be differences between the types of shops and services located in the three shopping areas. Hypothesis 2: The number of people who are shopping will decrease further away from the CBD. (a) To investigate Hypothesis 1 the students completed a tally chart of the different types of shops and services in each area. Their completed tally chart for the suburban (neighbourhood) shopping centre is shown in Fig. 6 (Insert). (i) The number of shops and services counted in the CBD and the out-of-town mall is shown in Table 4 (Insert). A student wanted to plot all the results from the three shopping centres onto separate pie charts so that she could compare them. Explain why it would be difficult to do this. … … … …[2]
Question paper, page 9
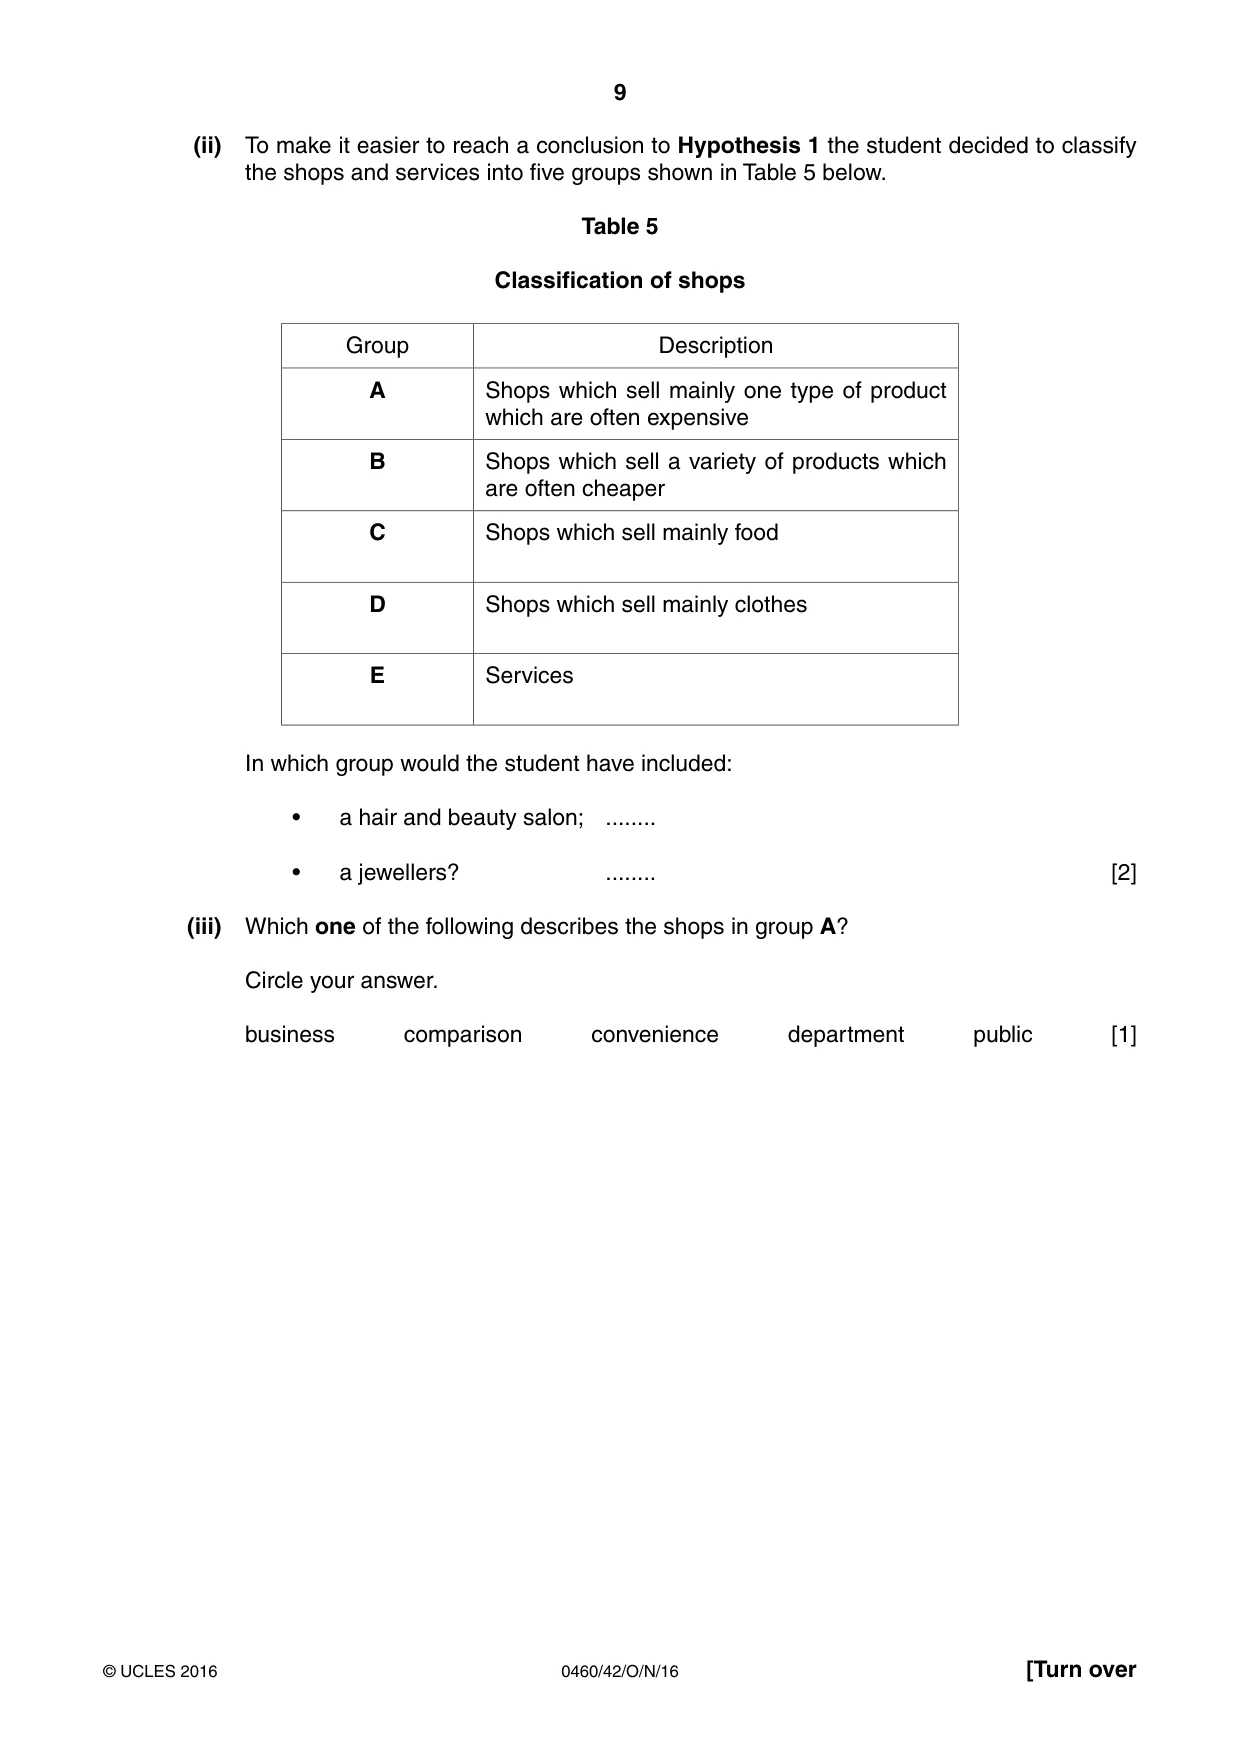
9 0460/42/O/N/16 © UCLES 2016 [Turn over (ii) To make it easier to reach a conclusion to Hypothesis 1 the student decided to classify the shops and services into five groups shown in Table 5 below. Table 5 Classification of shops Group Description A Shops which sell mainly one type of product which are often expensive B Shops which sell a variety of products which are often cheaper C Shops which sell mainly food D Shops which sell mainly clothes E Services In which group would the student have included: • a hair and beauty salon; … • a jewellers? … [2] (iii) Which one of the following describes the shops in group A? Circle your answer. business comparison convenience department public [1]
Question paper, page 10
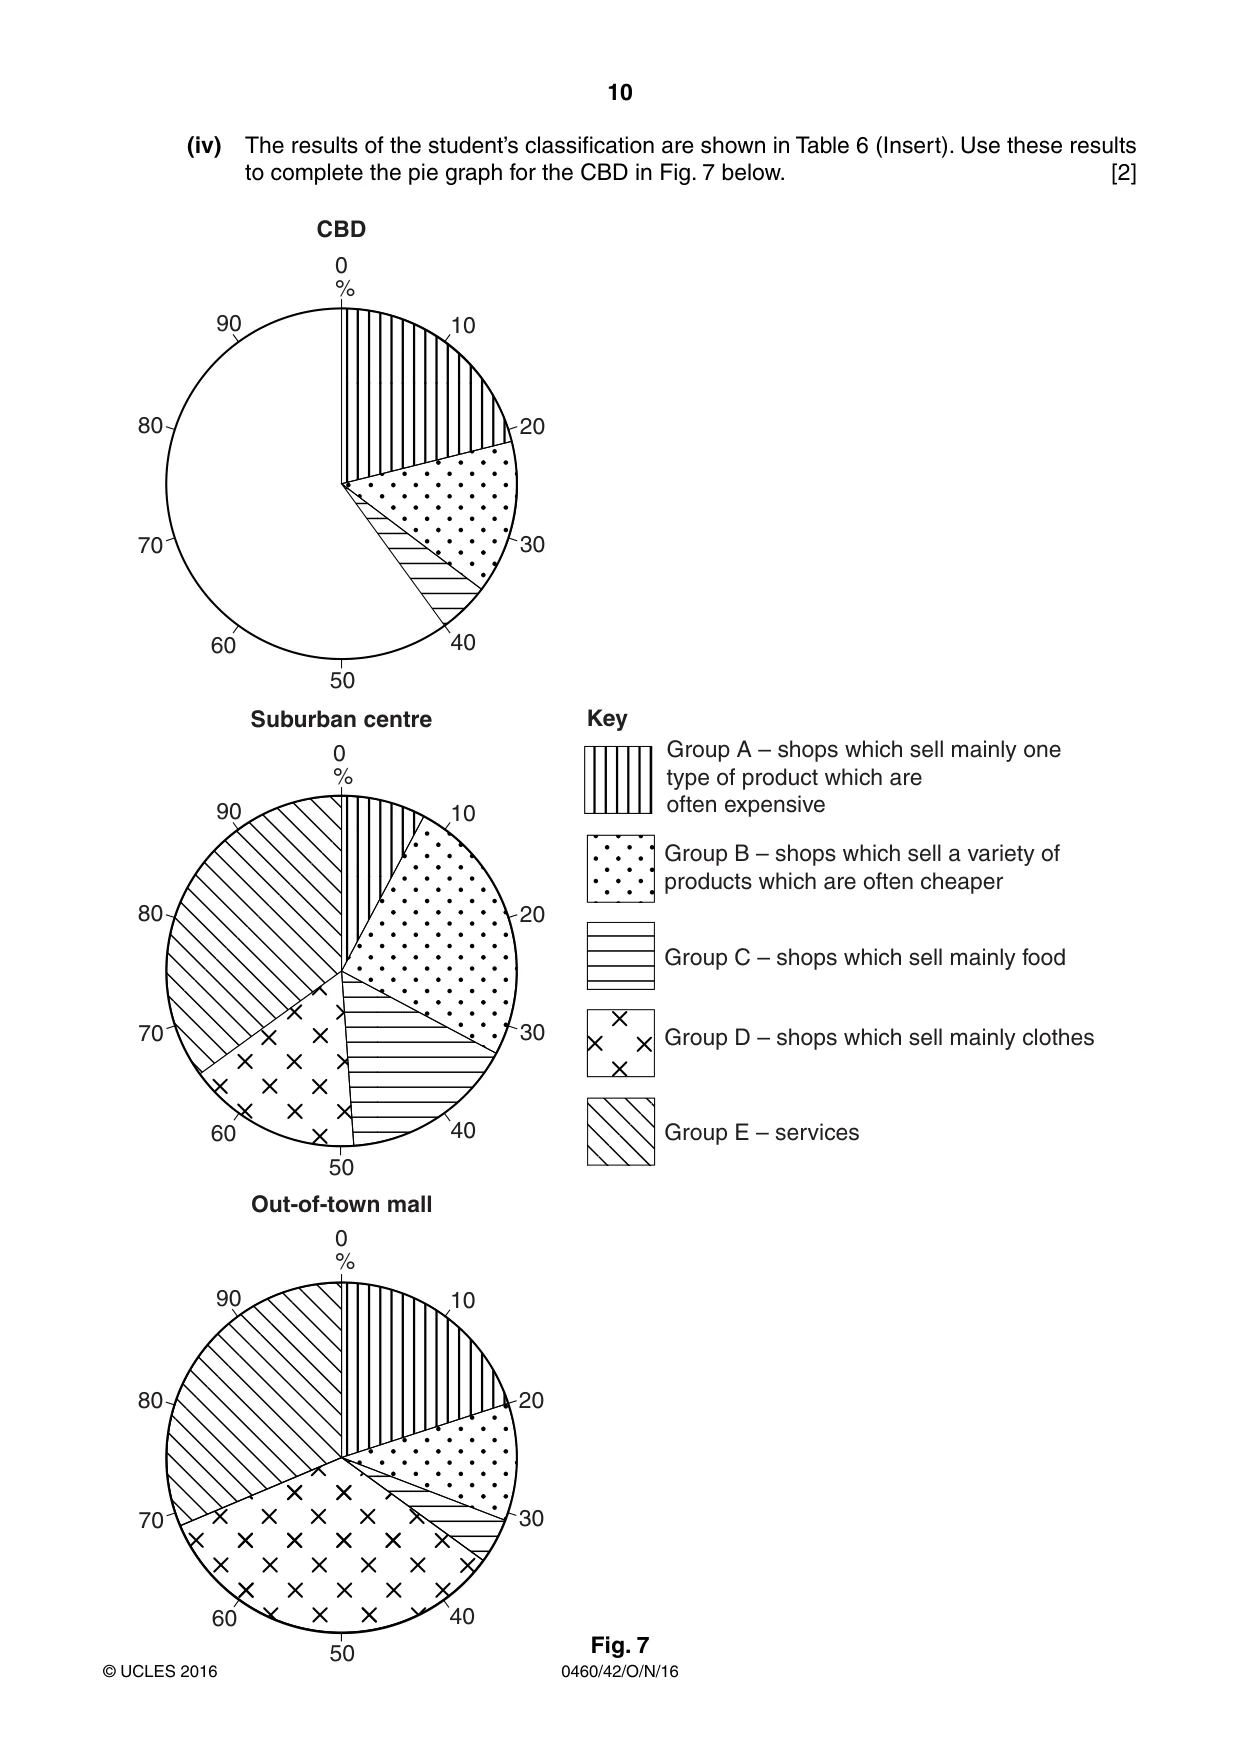
10 0460/42/O/N/16 © UCLES 2016 (iv) The results of the student’s classification are shown in Table 6 (Insert). Use these results to complete the pie graph for the CBD in Fig. 7 below. [2] 0 % 10 30 20 40 50 60 70 80 90 0 % 10 30 20 40 50 60 70 80 90 0 % 10 30 20 40 50 60 70 80 90 Group A – shops which sell mainly one type of product which are often expensive Group B – shops which sell a variety of products which are often cheaper Group C – shops which sell mainly food Group D – shops which sell mainly clothes Group E – services CBD Suburban centre Out-of-town mall Key Fig. 7
Question paper, page 11
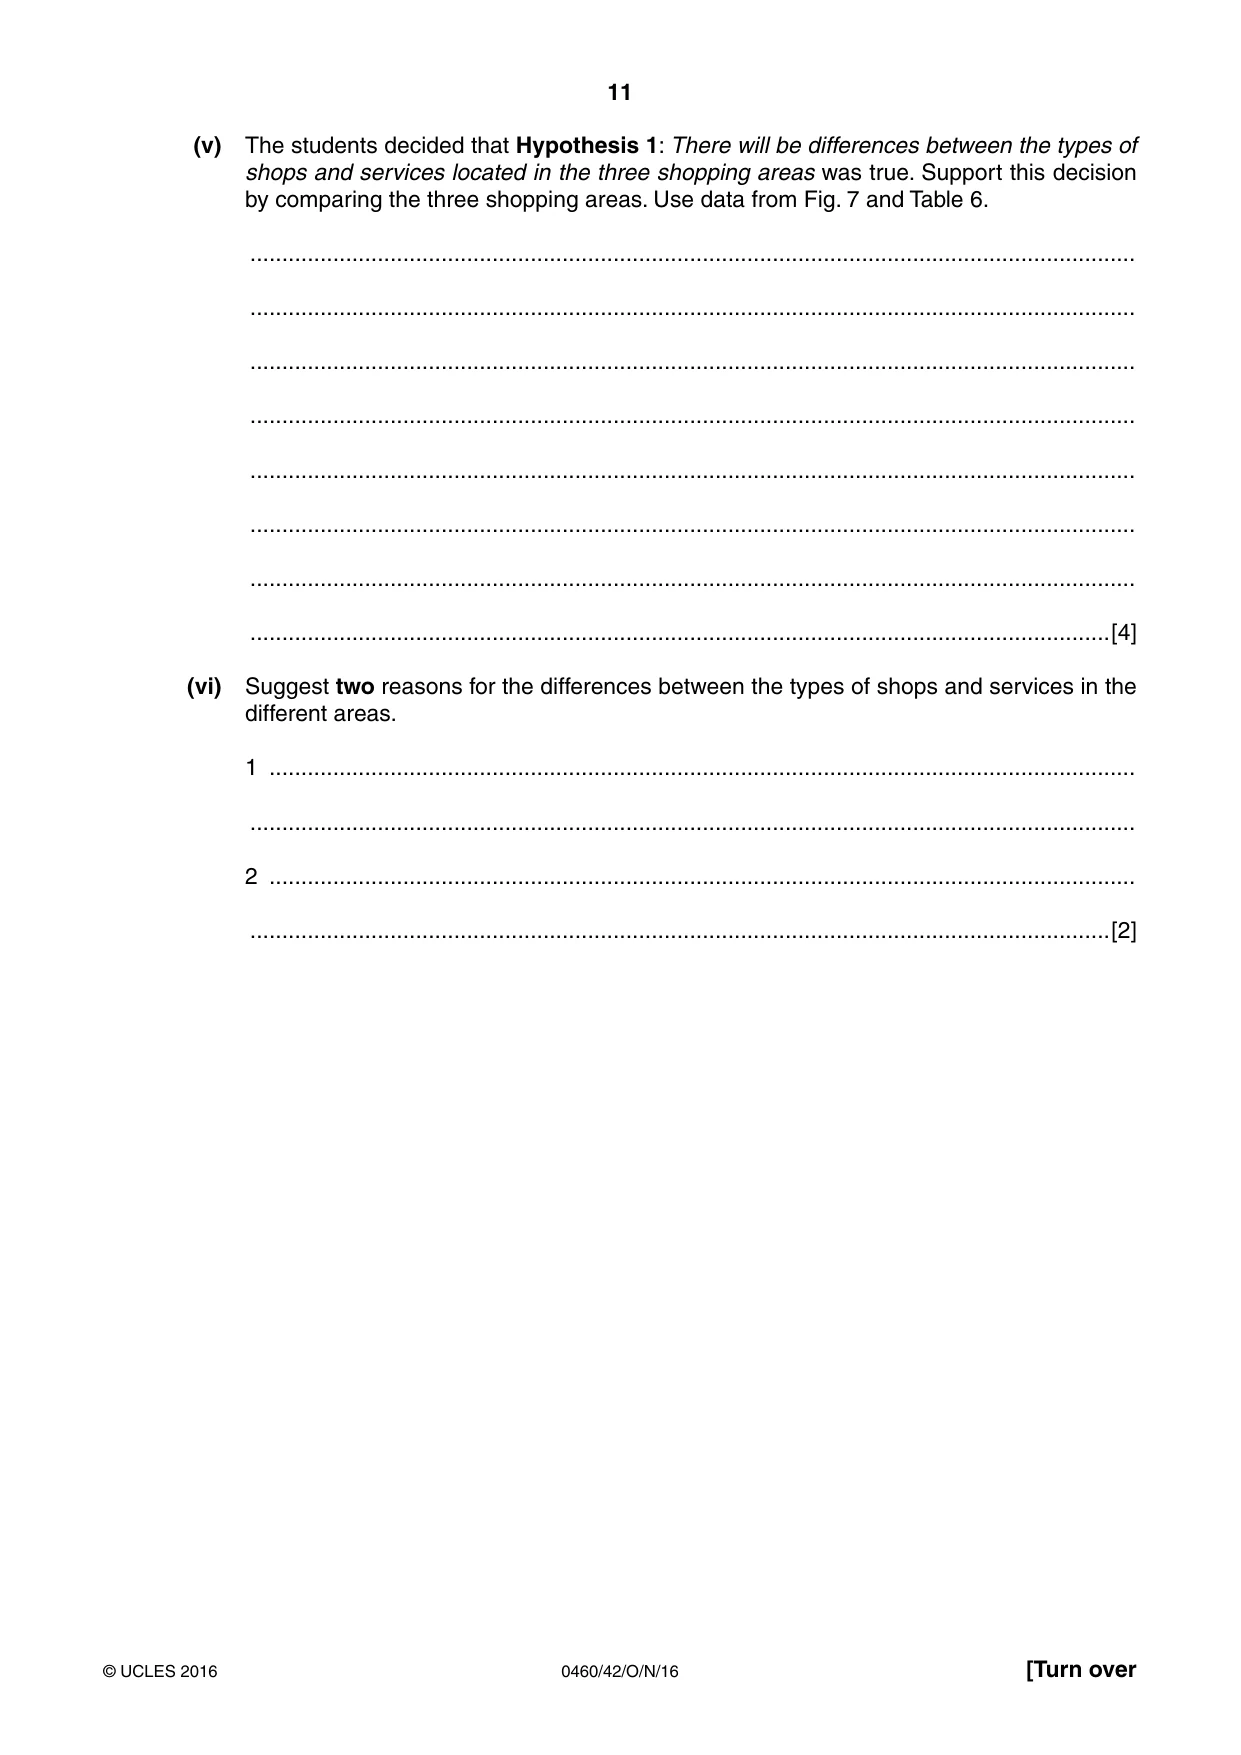
11 0460/42/O/N/16 © UCLES 2016 [Turn over (v) The students decided that Hypothesis 1: There will be differences between the types of shops and services located in the three shopping areas was true. Support this decision by comparing the three shopping areas. Use data from Fig. 7 and Table 6. … … … … … … … …[4] (vi) Suggest two reasons for the differences between the types of shops and services in the different areas. 1 … … 2 … …[2]
Question paper, page 12
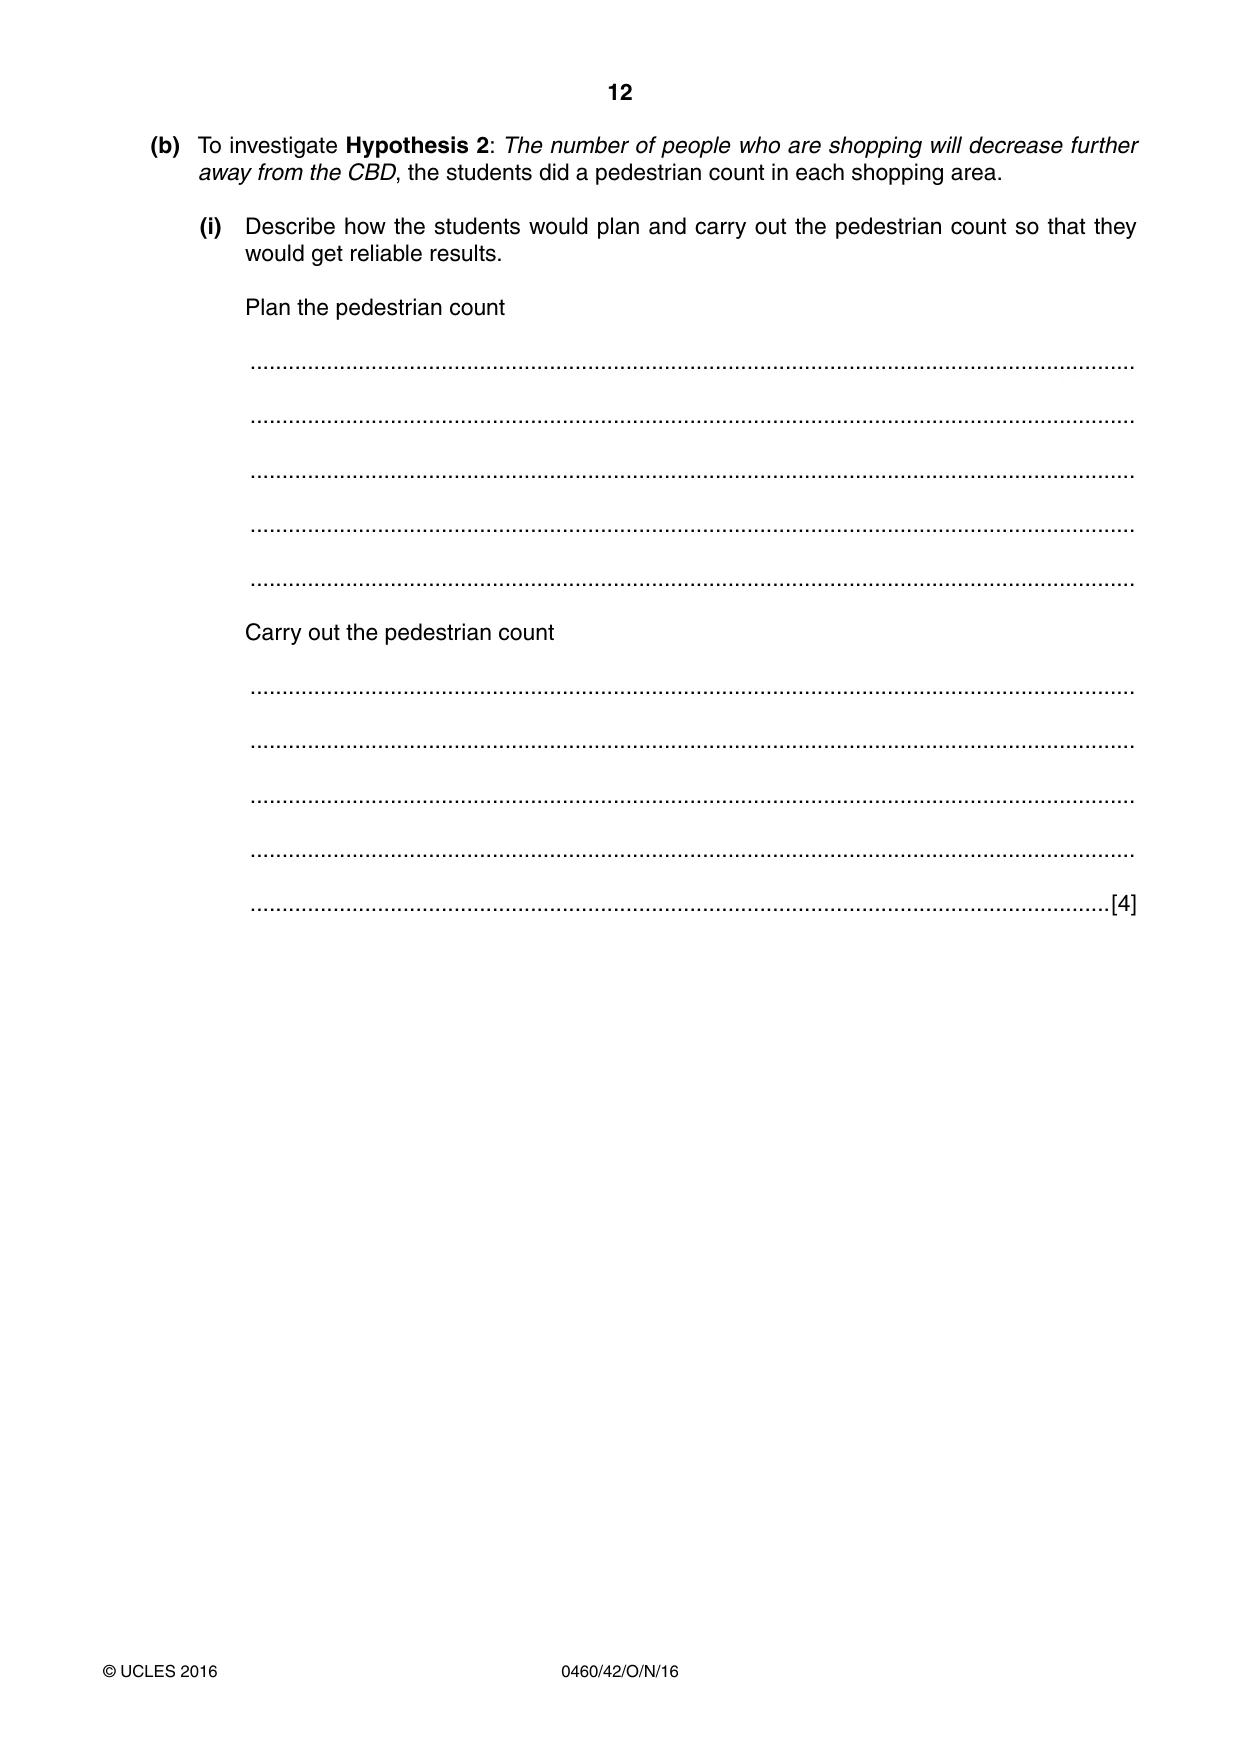
12 0460/42/O/N/16 © UCLES 2016 (b) To investigate Hypothesis 2: The number of people who are shopping will decrease further away from the CBD, the students did a pedestrian count in each shopping area. (i) Describe how the students would plan and carry out the pedestrian count so that they would get reliable results. Plan the pedestrian count … … … … … Carry out the pedestrian count … … … … …[4]
Question paper, page 13
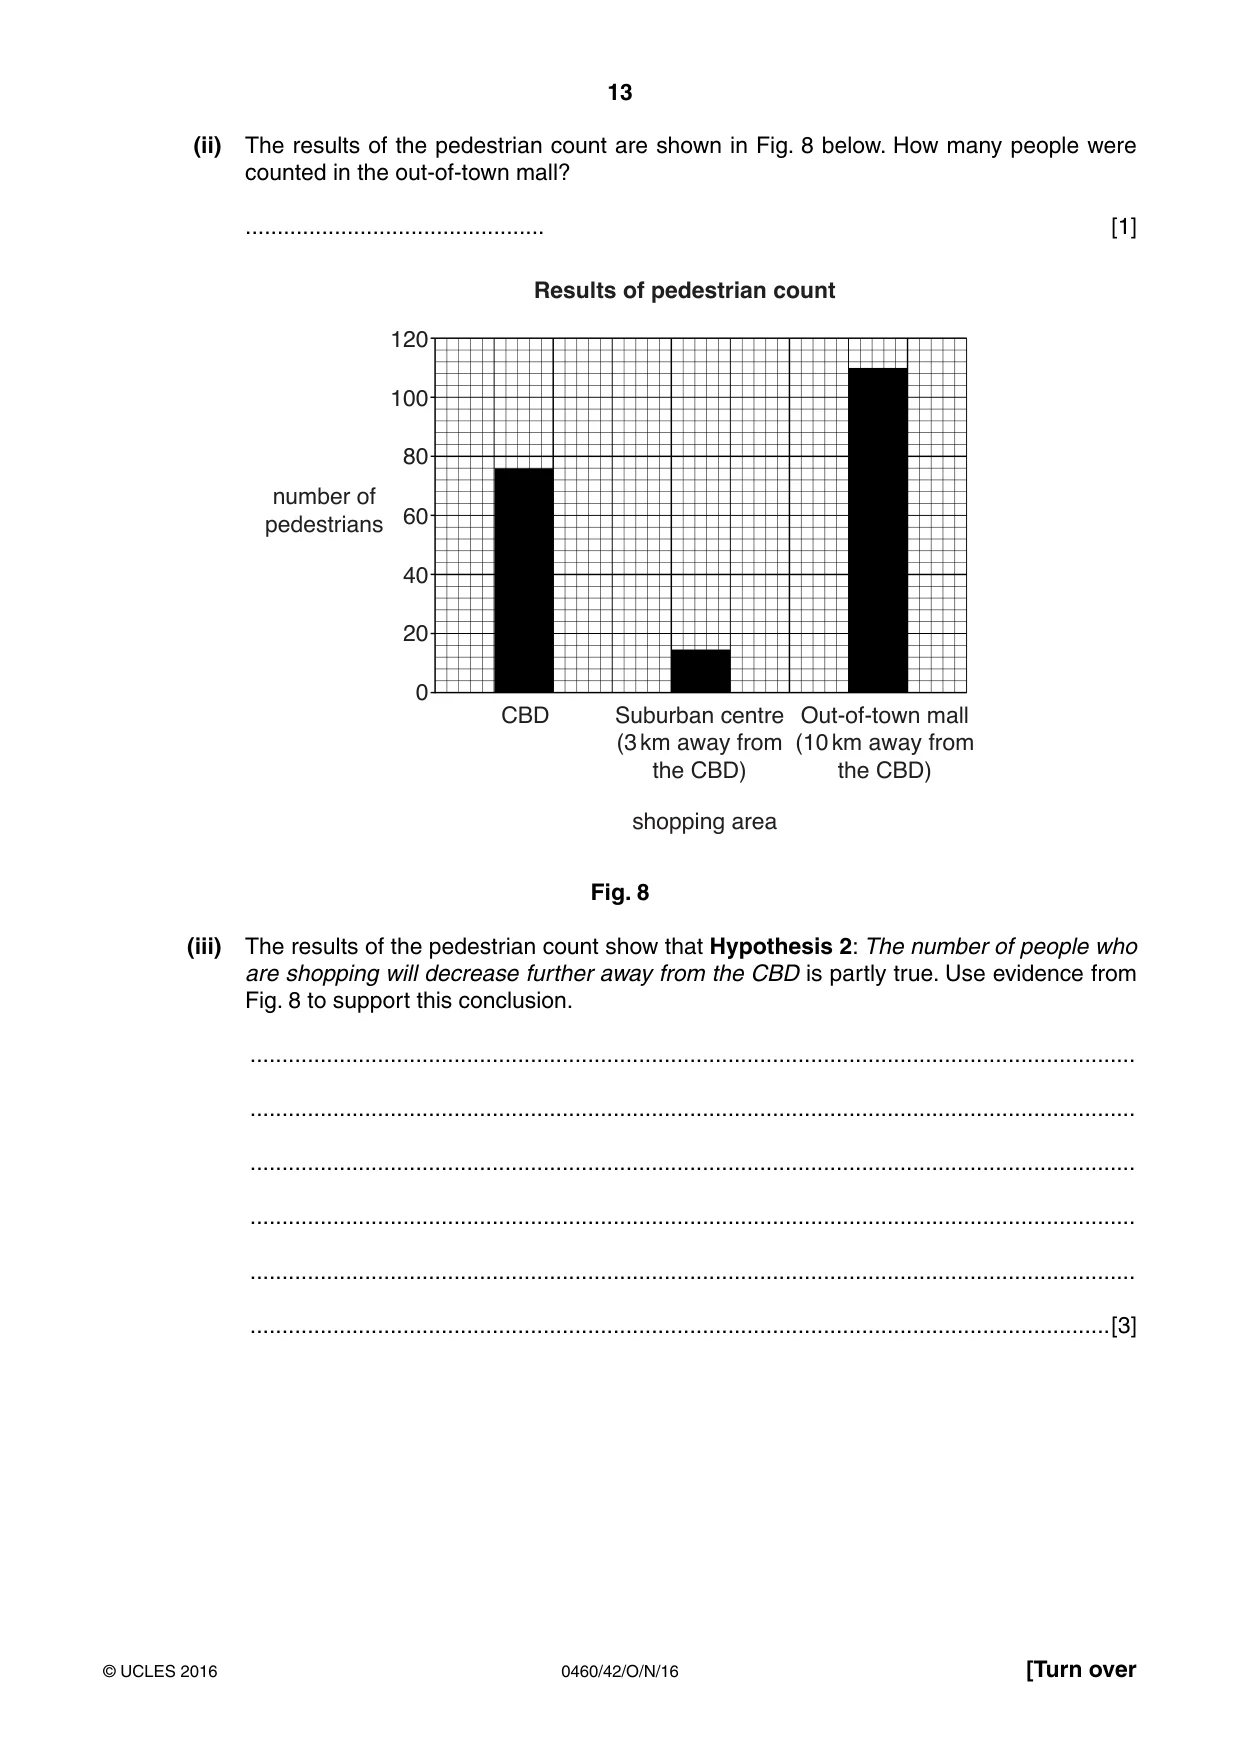
13 0460/42/O/N/16 © UCLES 2016 [Turn over (ii) The results of the pedestrian count are shown in Fig. 8 below. How many people were counted in the out-of-town mall? … [1] 0 20 40 60 80 100 120 CBD Suburban centre (3 km away from the CBD) Out-of-town mall (10 km away from the CBD) number of pedestrians shopping area Results of pedestrian count Fig. 8 (iii) The results of the pedestrian count show that Hypothesis 2: The number of people who are shopping will decrease further away from the CBD is partly true. Use evidence from Fig. 8 to support this conclusion. … … … … … …[3]
Question paper, page 14
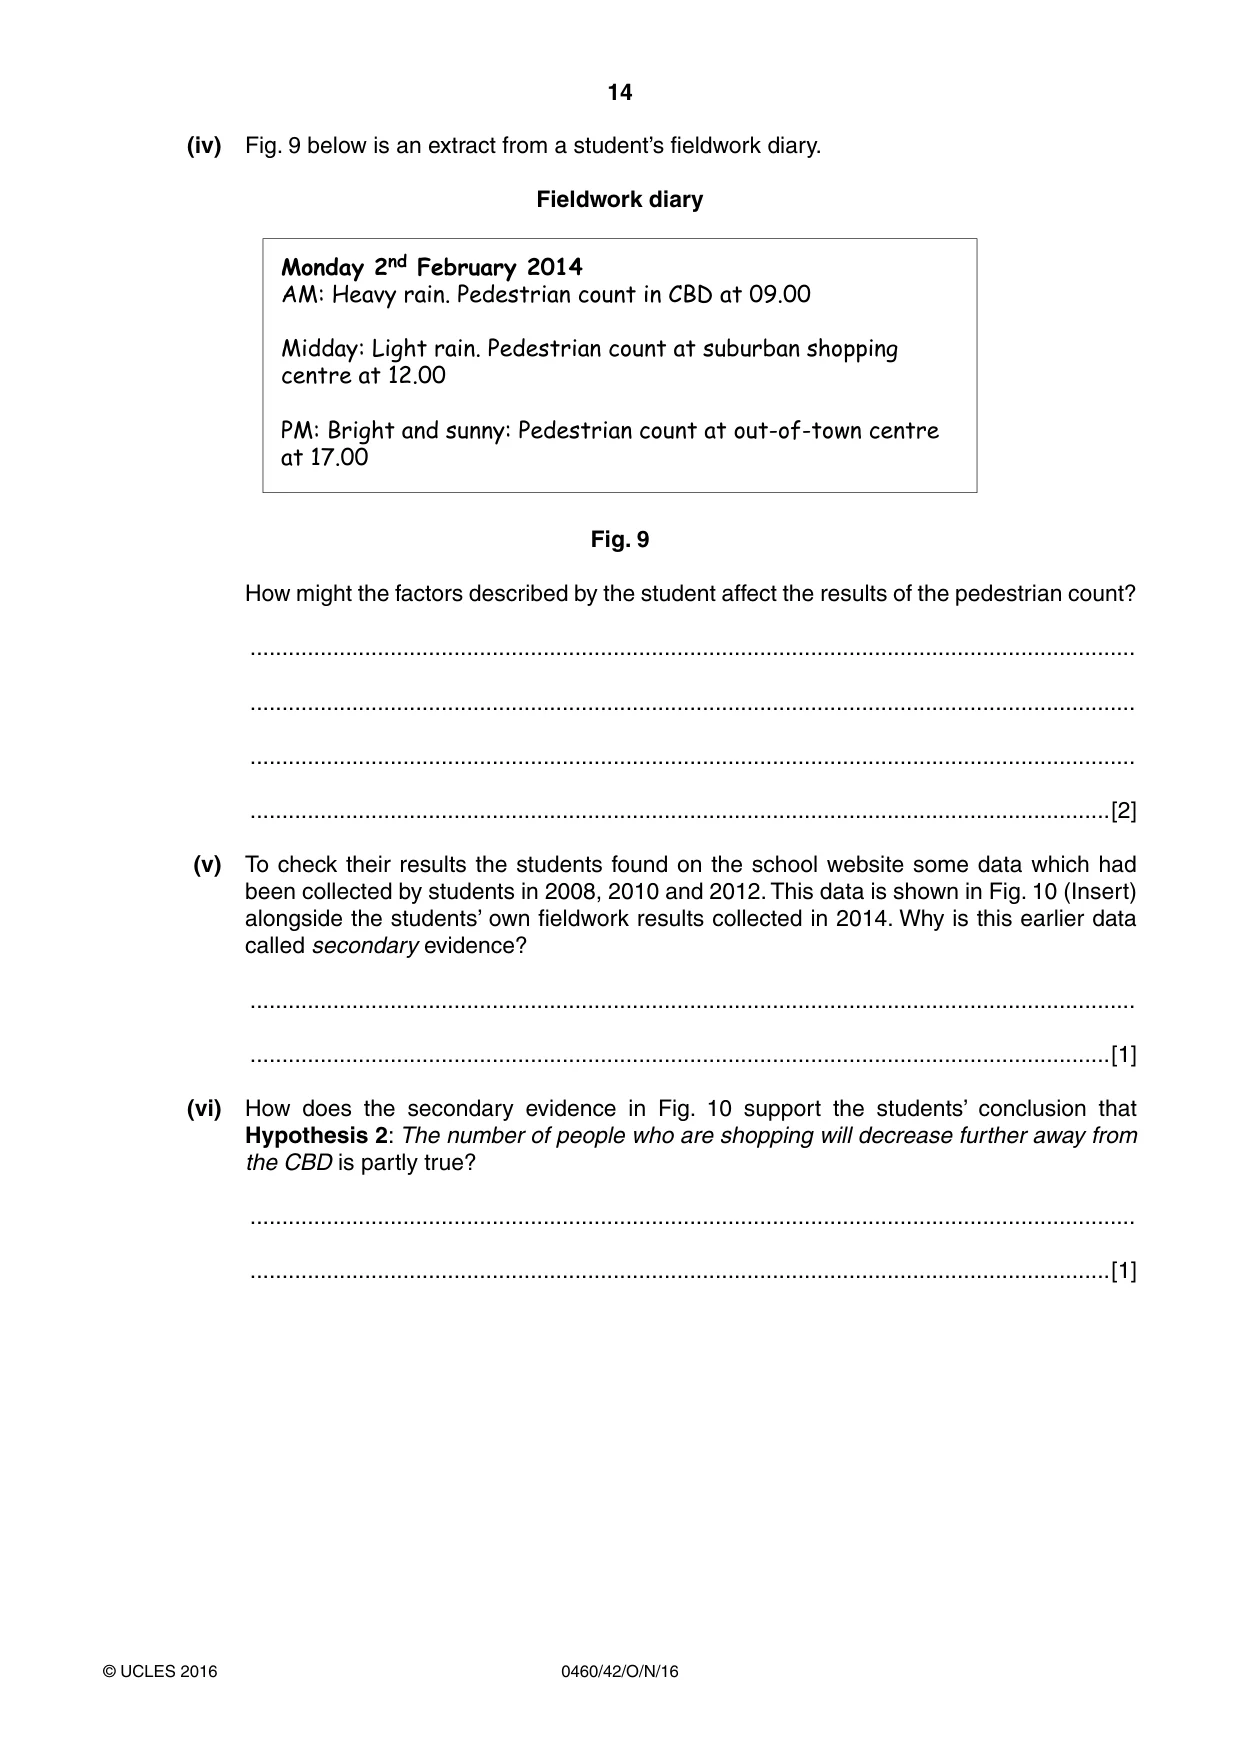
14 0460/42/O/N/16 © UCLES 2016 (iv) Fig. 9 below is an extract from a student’s fieldwork diary. Fieldwork diary Monday 2nd February 2014 AM: Heavy rain. Pedestrian count in CBD at 09.00 Midday: Light rain. Pedestrian count at suburban shopping centre at 12.00 PM: Bright and sunny: Pedestrian count at out-of-town centre at 17.00 Fig. 9 How might the factors described by the student affect the results of the pedestrian count? … … … …[2] (v) To check their results the students found on the school website some data which had been collected by students in 2008, 2010 and 2012. This data is shown in Fig. 10 (Insert) alongside the students’ own fieldwork results collected in 2014. Why is this earlier data called secondary evidence? … …[1] (vi) How does the secondary evidence in Fig. 10 support the students’ conclusion that Hypothesis 2: The number of people who are shopping will decrease further away from the CBD is partly true? … …[1]
Question paper, page 15
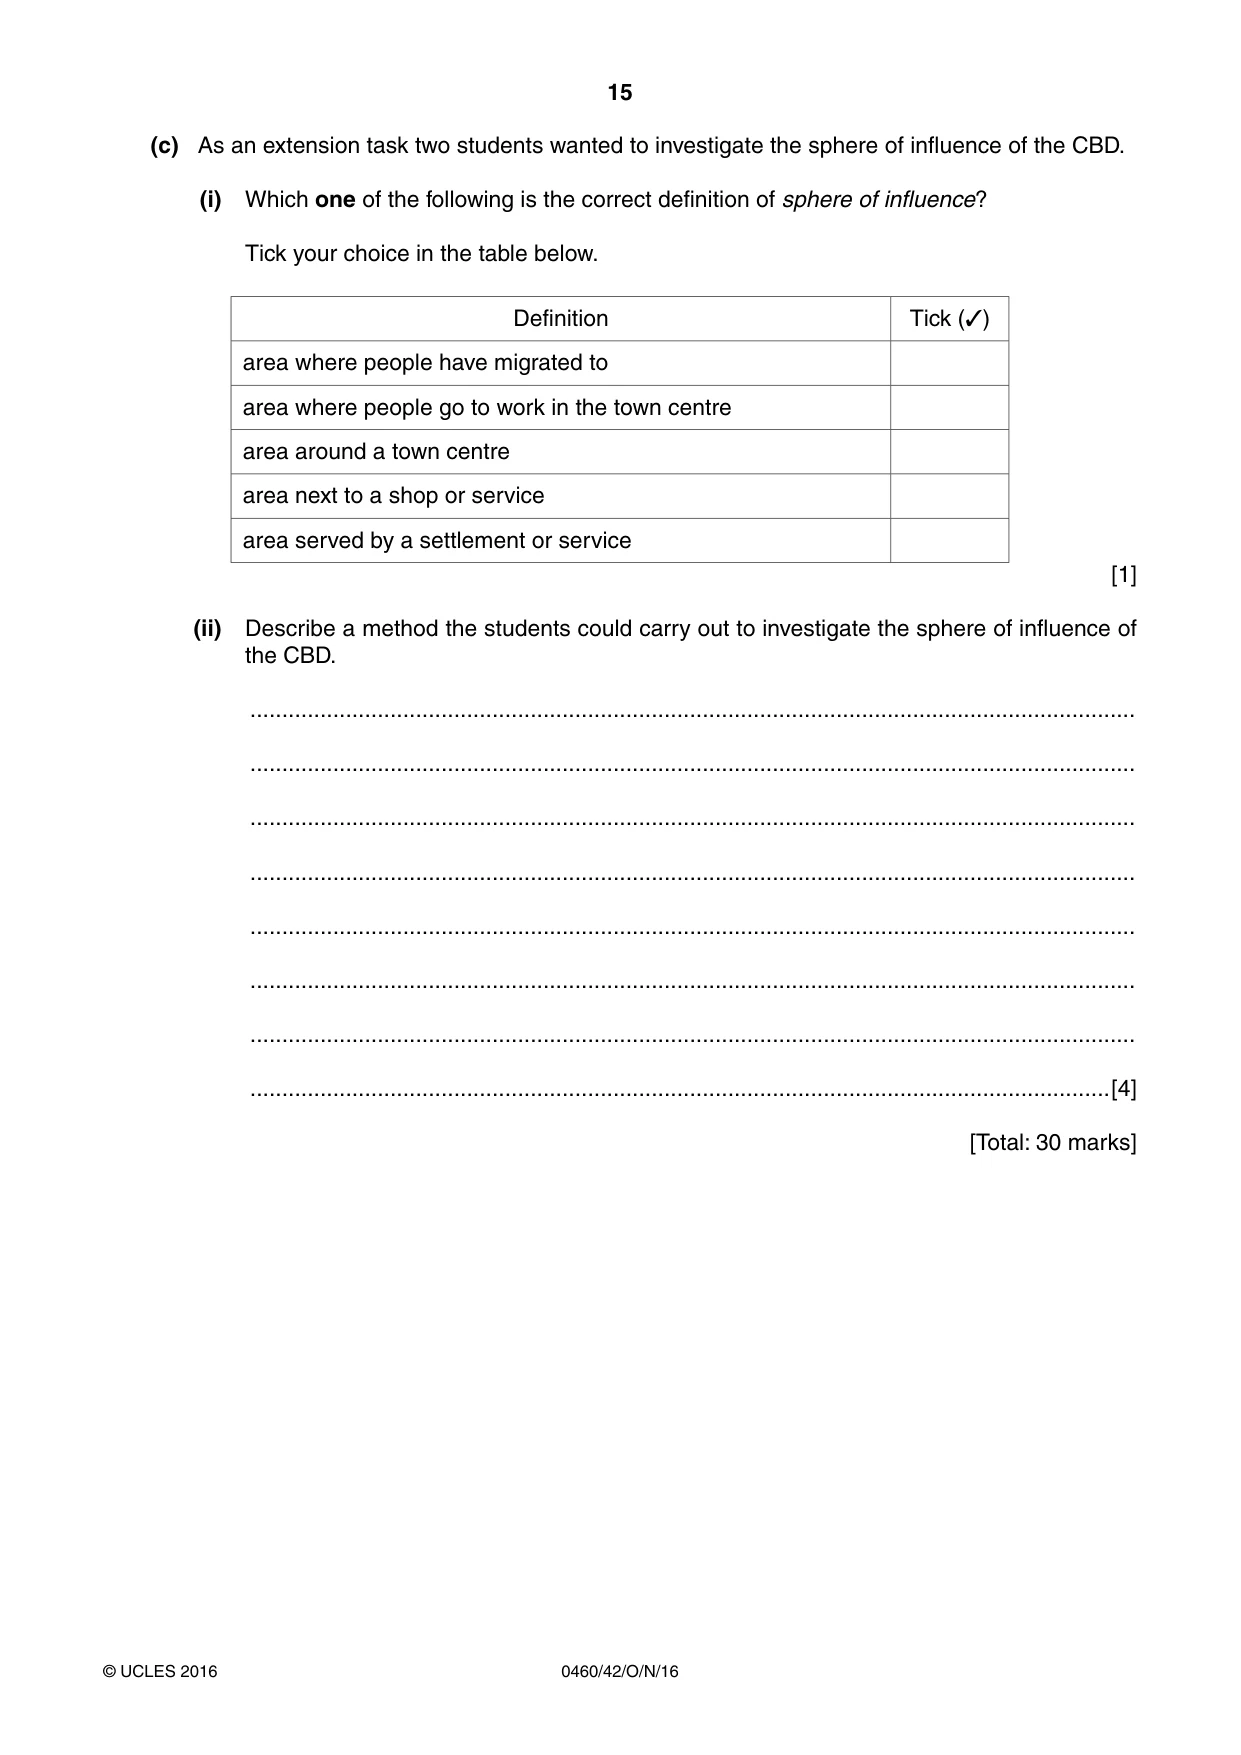
15 0460/42/O/N/16 © UCLES 2016 (c) As an extension task two students wanted to investigate the sphere of influence of the CBD. (i) Which one of the following is the correct definition of sphere of influence? Tick your choice in the table below. Definition Tick (✓) area where people have migrated to area where people go to work in the town centre area around a town centre area next to a shop or service area served by a settlement or service [1] (ii) Describe a method the students could carry out to investigate the sphere of influence of the CBD. … … … … … … … …[4] [Total: 30 marks]
Question paper, page 16
16 0460/42/O/N/16 © UCLES 2016 Additional Pages If you use the following lined pages to complete the answer(s) to any question(s), the question number(s) must be clearly shown. … … … … … … … … … … … … … … … … … … … … … … … … … …
Question paper, page 17
17 0460/42/O/N/16 © UCLES 2016 … … … … … … … … … … … … … … … … … … … … … … … … … … … …
Question paper, page 18
18 0460/42/O/N/16 © UCLES 2016 BLANK PAGE
Question paper, page 19
19 0460/42/O/N/16 © UCLES 2016 BLANK PAGE
Question paper, page 20
20 0460/42/O/N/16 © UCLES 2016 BLANK PAGE Permission to reproduce items where third-party owned material protected by copyright is included has been sought and cleared where possible. Every reasonable effort has been made by the publisher (UCLES) to trace copyright holders, but if any items requiring clearance have unwittingly been included, the publisher will be pleased to make amends at the earliest possible opportunity. To avoid the issue of disclosure of answer-related information to candidates, all copyright acknowledgements are reproduced online in the Cambridge International Examinations Copyright Acknowledgements Booklet. This is produced for each series of examinations and is freely available to download at www.cie.org.uk after the live examination series. Cambridge International Examinations is part of the Cambridge Assessment Group. Cambridge Assessment is the brand name of University of Cambridge Local Examinations Syndicate (UCLES), which is itself a department of the University of Cambridge.
Mark scheme, page 1
® IGCSE is the registered trademark of Cambridge International Examinations. This syllabus is approved for use in England, Wales and Northern Ireland as a Cambridge International Level 1/Level 2 Certificate. This document consists of 6 printed pages. © UCLES 2016 [Turn over Cambridge International Examinations Cambridge International General Certificate of Secondary Education GEOGRAPHY 0460/42 Paper 4 Alternative to Coursework October/November 2016 MARK SCHEME Maximum Mark: 60 Published This mark scheme is published as an aid to teachers and candidates, to indicate the requirements of the examination. It shows the basis on which Examiners were instructed to award marks. It does not indicate the details of the discussions that took place at an Examiners’ meeting before marking began, which would have considered the acceptability of alternative answers. Mark schemes should be read in conjunction with the question paper and the Principal Examiner Report for Teachers. Cambridge will not enter into discussions about these mark schemes. Cambridge is publishing the mark schemes for the October/November 2016 series for most Cambridge IGCSE®, Cambridge International A and AS Level components and some Cambridge O Level components.
Mark scheme, page 2
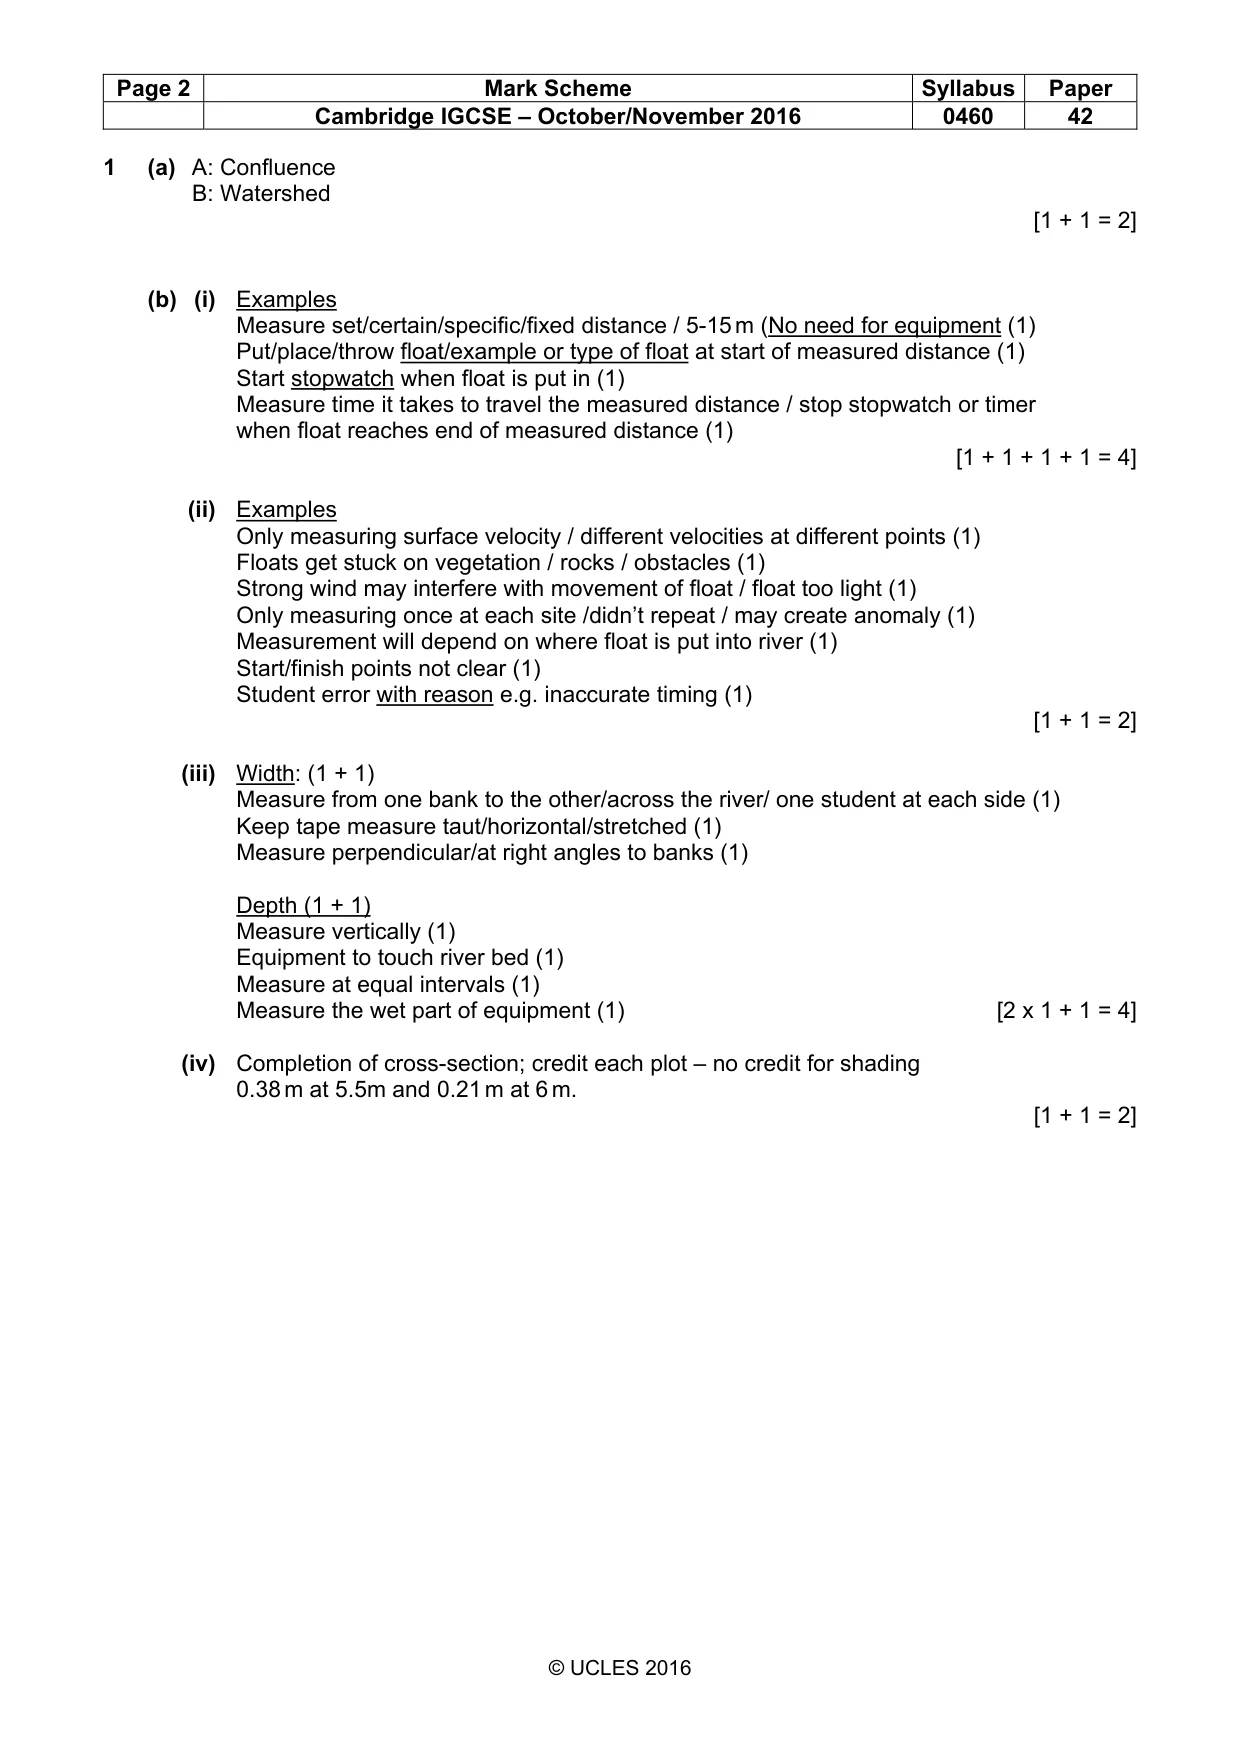
Page 2 Mark Scheme Syllabus Paper Cambridge IGCSE – October/November 2016 0460 42 © UCLES 2016 1 (a) A: Confluence B: Watershed [1 + 1 = 2] (b) (i) Examples Measure set/certain/specific/fixed distance / 5-15 m (No need for equipment (1) Put/place/throw float/example or type of float at start of measured distance (1) Start stopwatch when float is put in (1) Measure time it takes to travel the measured distance / stop stopwatch or timer when float reaches end of measured distance (1) [1 + 1 + 1 + 1 = 4] (ii) Examples Only measuring surface velocity / different velocities at different points (1) Floats get stuck on vegetation / rocks / obstacles (1) Strong wind may interfere with movement of float / float too light (1) Only measuring once at each site /didn’t repeat / may create anomaly (1) Measurement will depend on where float is put into river (1) Start/finish points not clear (1) Student error with reason e.g. inaccurate timing (1) [1 + 1 = 2] (iii) Width: (1 + 1) Measure from one bank to the other/across the river/ one student at each side (1) Keep tape measure taut/horizontal/stretched (1) Measure perpendicular/at right angles to banks (1) Depth (1 + 1) Measure vertically (1) Equipment to touch river bed (1) Measure at equal intervals (1) Measure the wet part of equipment (1) [2 x 1 + 1 = 4] (iv) Completion of cross-section; credit each plot – no credit for shading 0.38 m at 5.5m and 0.21 m at 6 m. [1 + 1 = 2]
Mark scheme, page 3
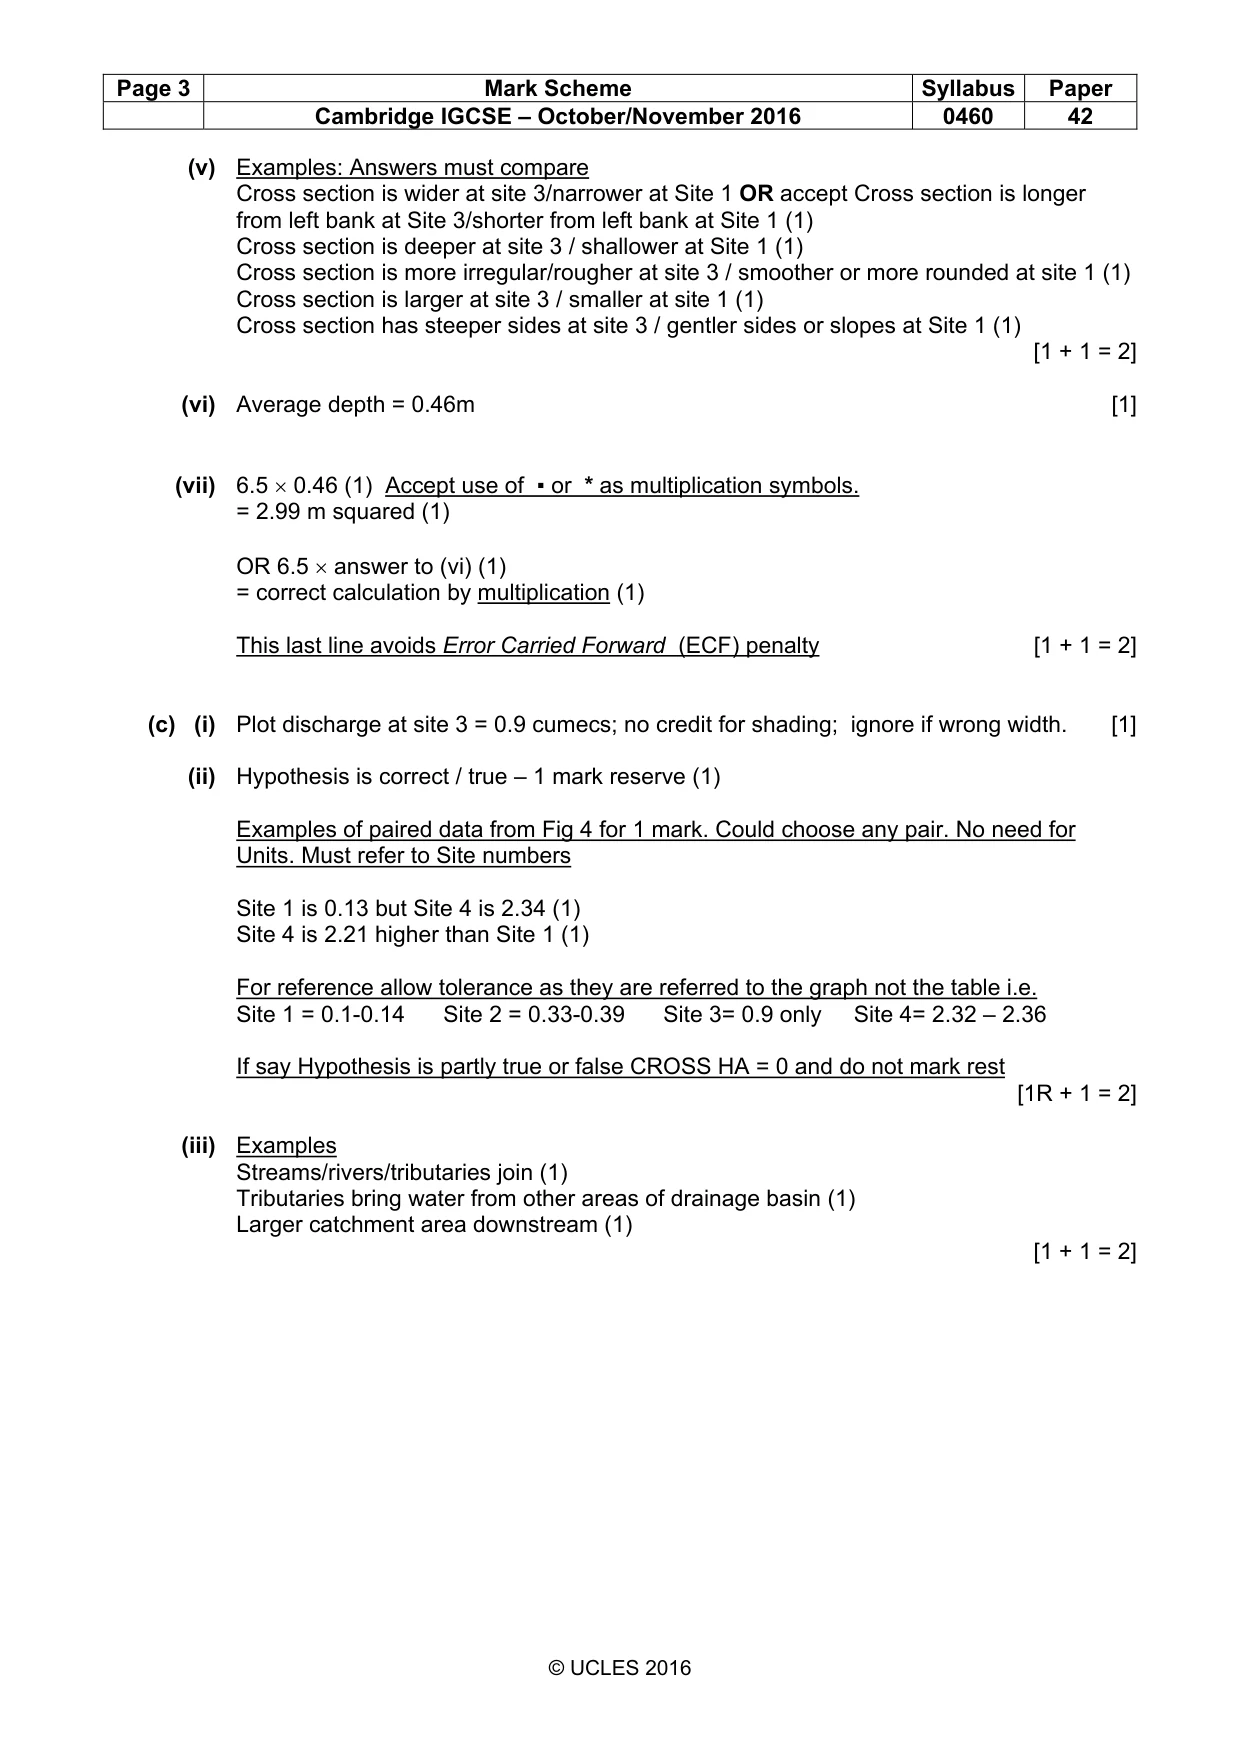
Page 3 Mark Scheme Syllabus Paper Cambridge IGCSE – October/November 2016 0460 42 © UCLES 2016 (v) Examples: Answers must compare Cross section is wider at site 3/narrower at Site 1 OR accept Cross section is longer from left bank at Site 3/shorter from left bank at Site 1 (1) Cross section is deeper at site 3 / shallower at Site 1 (1) Cross section is more irregular/rougher at site 3 / smoother or more rounded at site 1 (1) Cross section is larger at site 3 / smaller at site 1 (1) Cross section has steeper sides at site 3 / gentler sides or slopes at Site 1 (1) [1 + 1 = 2] (vi) Average depth = 0.46m [1] (vii) 6.5 × 0.46 (1) Accept use of ▪ or * as multiplication symbols. = 2.99 m squared (1) OR 6.5 × answer to (vi) (1) = correct calculation by multiplication (1) This last line avoids Error Carried Forward (ECF) penalty [1 + 1 = 2] (c) (i) Plot discharge at site 3 = 0.9 cumecs; no credit for shading; ignore if wrong width. [1] (ii) Hypothesis is correct / true – 1 mark reserve (1) Examples of paired data from Fig 4 for 1 mark. Could choose any pair. No need for Units. Must refer to Site numbers Site 1 is 0.13 but Site 4 is 2.34 (1) Site 4 is 2.21 higher than Site 1 (1) For reference allow tolerance as they are referred to the graph not the table i.e. Site 1 = 0.1-0.14 Site 2 = 0.33-0.39 Site 3= 0.9 only Site 4= 2.32 – 2.36 If say Hypothesis is partly true or false CROSS HA = 0 and do not mark rest [1R + 1 = 2] (iii) Examples Streams/rivers/tributaries join (1) Tributaries bring water from other areas of drainage basin (1) Larger catchment area downstream (1) [1 + 1 = 2]
Mark scheme, page 4
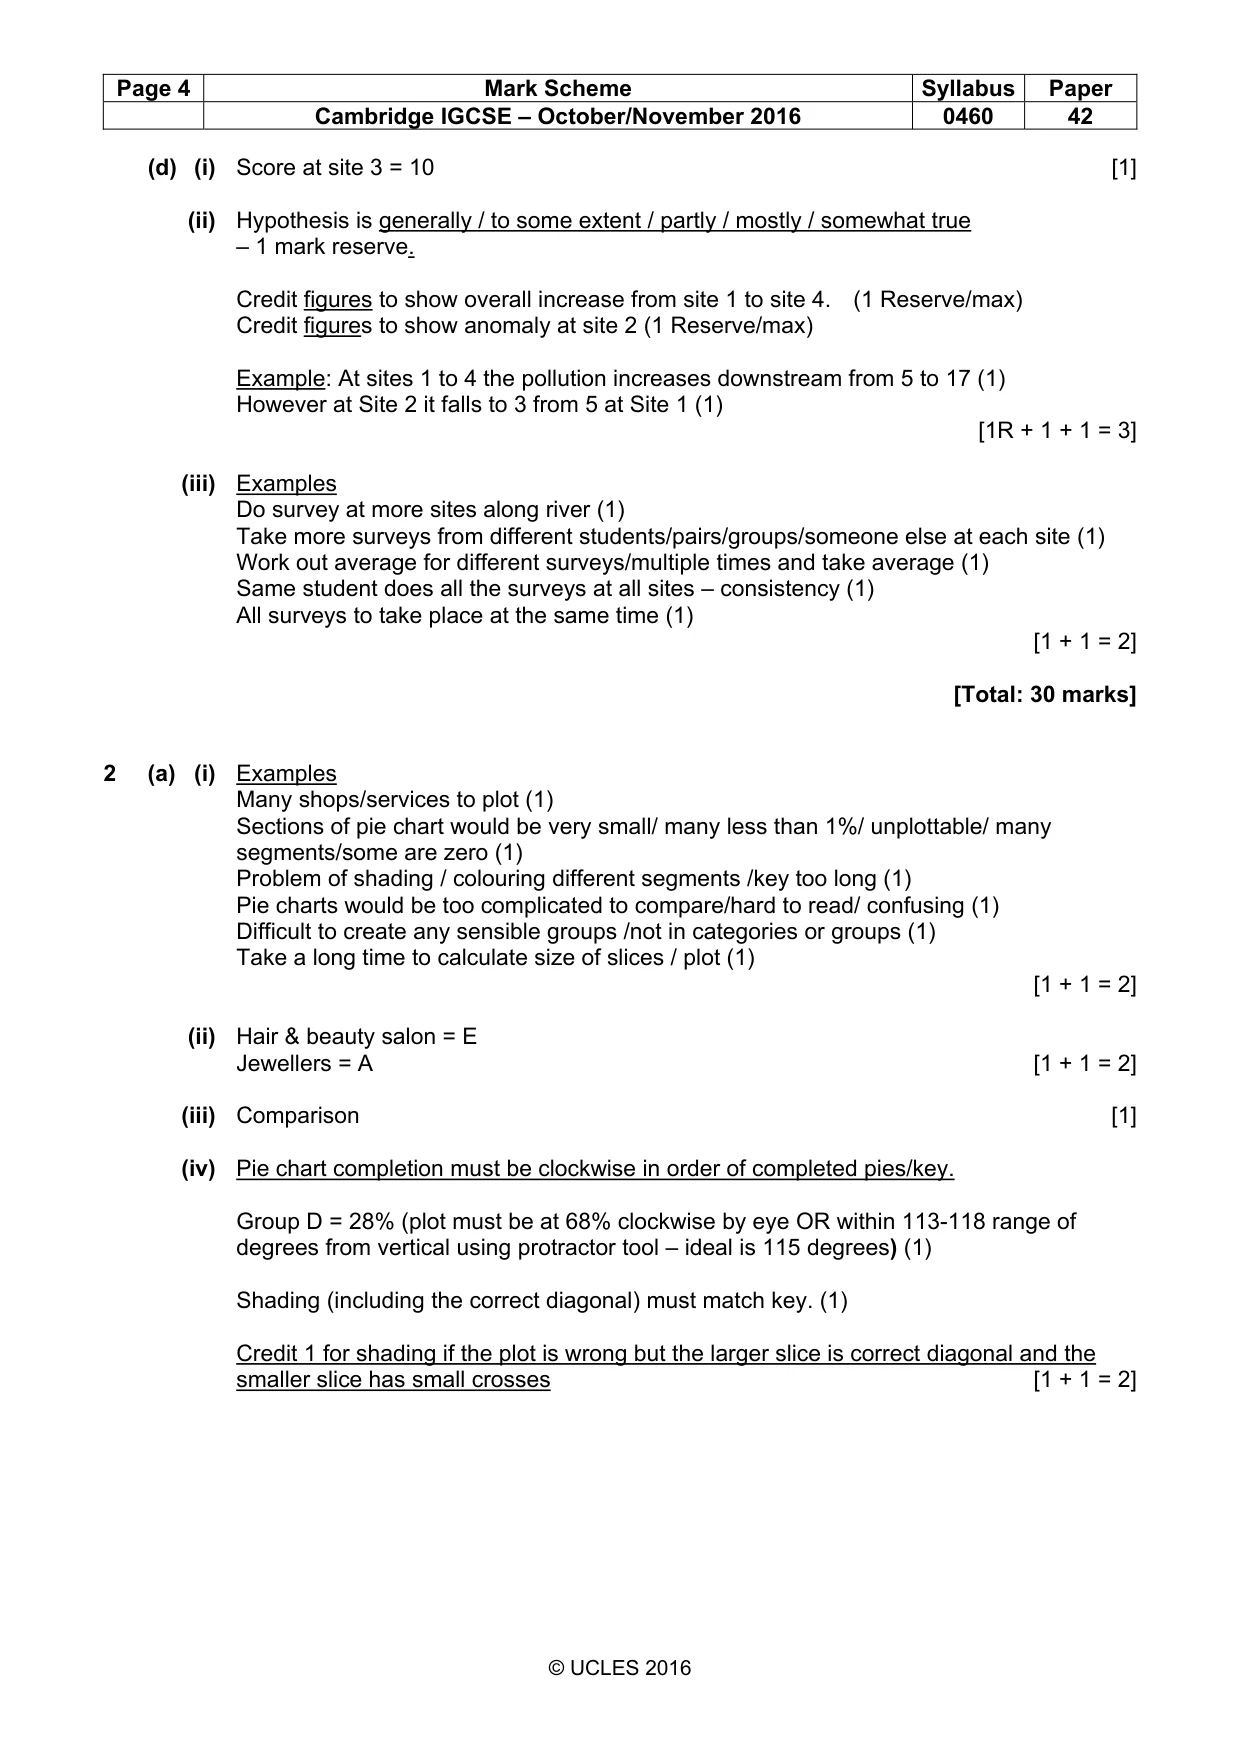
Page 4 Mark Scheme Syllabus Paper Cambridge IGCSE – October/November 2016 0460 42 © UCLES 2016 (d) (i) Score at site 3 = 10 [1] (ii) Hypothesis is generally / to some extent / partly / mostly / somewhat true – 1 mark reserve. Credit figures to show overall increase from site 1 to site 4. (1 Reserve/max) Credit figures to show anomaly at site 2 (1 Reserve/max) Example: At sites 1 to 4 the pollution increases downstream from 5 to 17 (1) However at Site 2 it falls to 3 from 5 at Site 1 (1) [1R + 1 + 1 = 3] (iii) Examples Do survey at more sites along river (1) Take more surveys from different students/pairs/groups/someone else at each site (1) Work out average for different surveys/multiple times and take average (1) Same student does all the surveys at all sites – consistency (1) All surveys to take place at the same time (1) [1 + 1 = 2] [Total: 30 marks] 2 (a) (i) Examples Many shops/services to plot (1) Sections of pie chart would be very small/ many less than 1%/ unplottable/ many segments/some are zero (1) Problem of shading / colouring different segments /key too long (1) Pie charts would be too complicated to compare/hard to read/ confusing (1) Difficult to create any sensible groups /not in categories or groups (1) Take a long time to calculate size of slices / plot (1) [1 + 1 = 2] (ii) Hair & beauty salon = E Jewellers = A [1 + 1 = 2] (iii) Comparison [1] (iv) Pie chart completion must be clockwise in order of completed pies/key. Group D = 28% (plot must be at 68% clockwise by eye OR within 113-118 range of degrees from vertical using protractor tool – ideal is 115 degrees) (1) Shading (including the correct diagonal) must match key. (1) Credit 1 for shading if the plot is wrong but the larger slice is correct diagonal and the smaller slice has small crosses [1 + 1 = 2]
Mark scheme, page 5
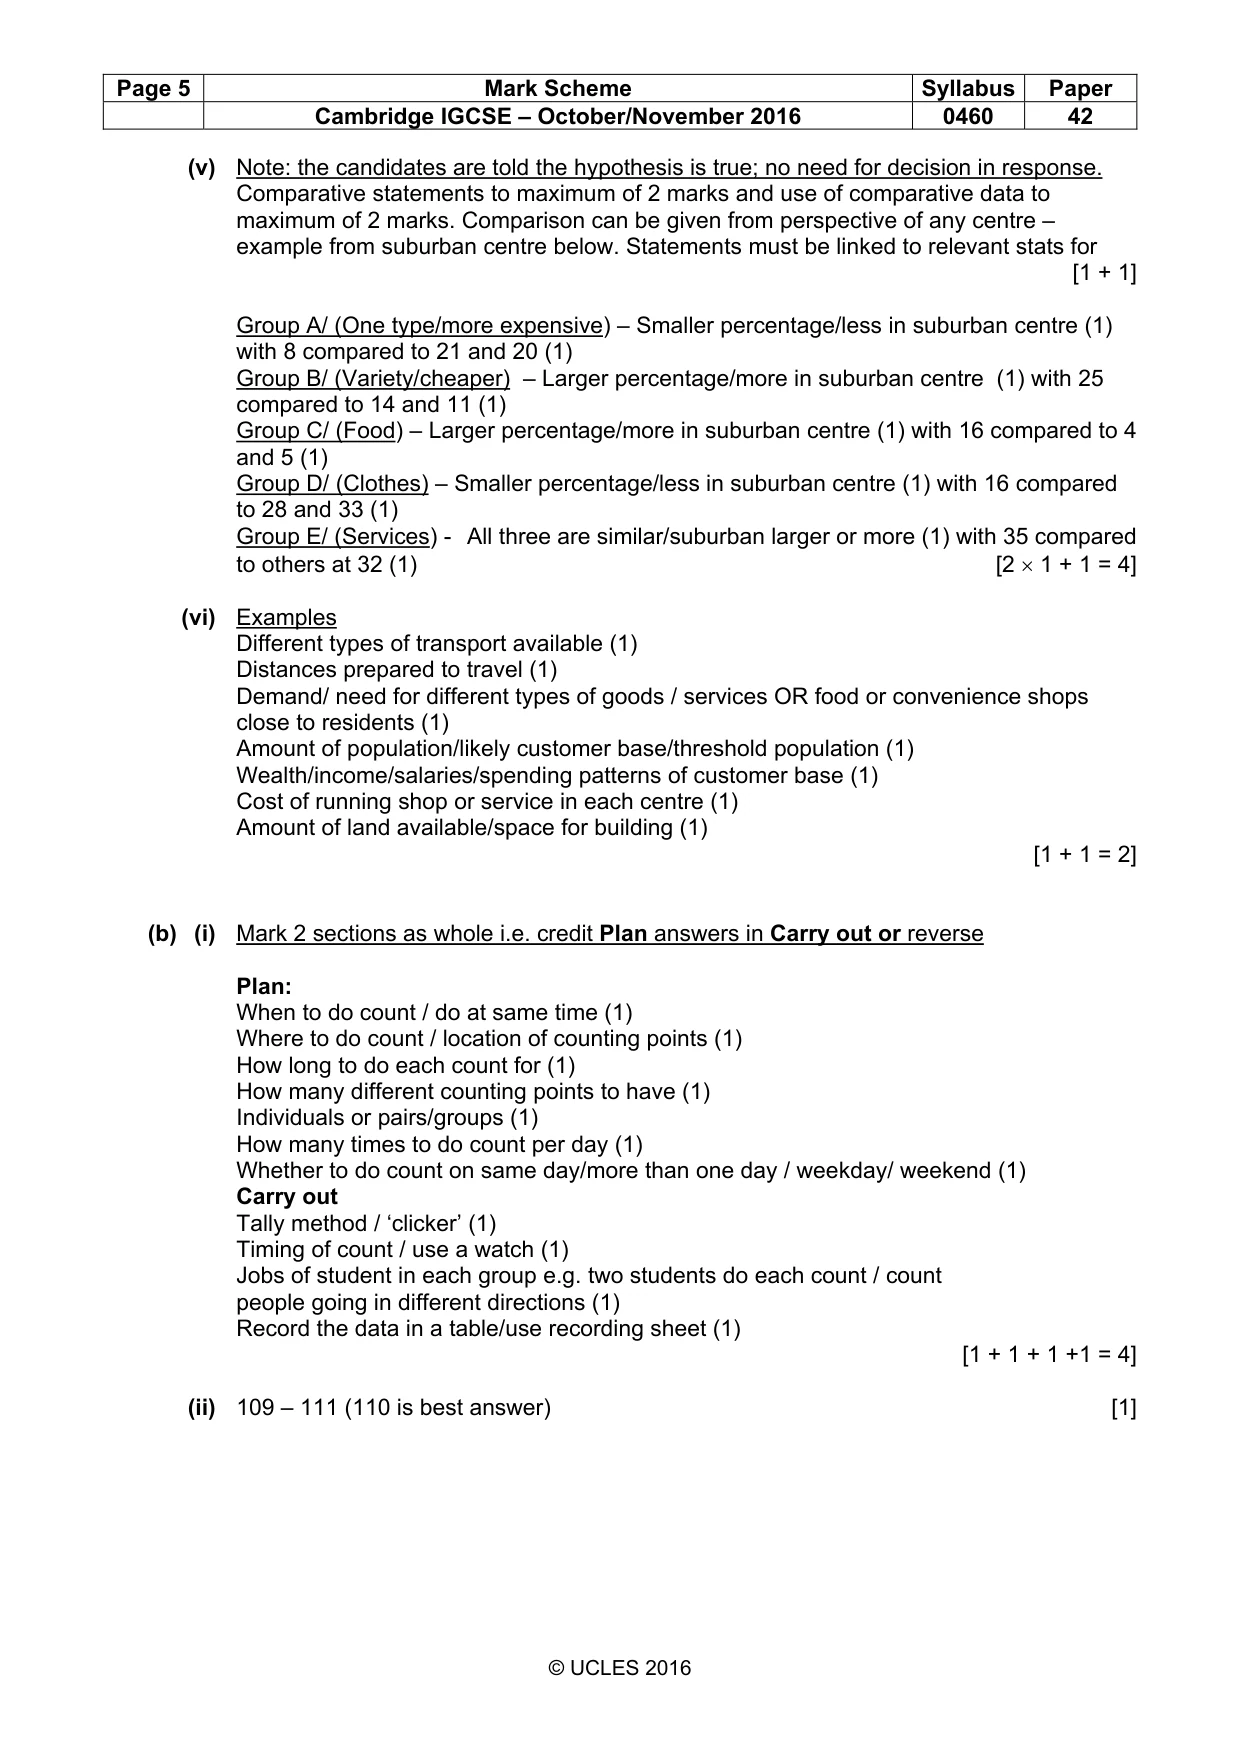
Page 5 Mark Scheme Syllabus Paper Cambridge IGCSE – October/November 2016 0460 42 © UCLES 2016 (v) Note: the candidates are told the hypothesis is true; no need for decision in response. Comparative statements to maximum of 2 marks and use of comparative data to maximum of 2 marks. Comparison can be given from perspective of any centre – example from suburban centre below. Statements must be linked to relevant stats for [1 + 1] Group A/ (One type/more expensive) – Smaller percentage/less in suburban centre (1) with 8 compared to 21 and 20 (1) Group B/ (Variety/cheaper) – Larger percentage/more in suburban centre (1) with 25 compared to 14 and 11 (1) Group C/ (Food) – Larger percentage/more in suburban centre (1) with 16 compared to 4 and 5 (1) Group D/ (Clothes) – Smaller percentage/less in suburban centre (1) with 16 compared to 28 and 33 (1) Group E/ (Services) - All three are similar/suburban larger or more (1) with 35 compared to others at 32 (1) [2 × 1 + 1 = 4] (vi) Examples Different types of transport available (1) Distances prepared to travel (1) Demand/ need for different types of goods / services OR food or convenience shops close to residents (1) Amount of population/likely customer base/threshold population (1) Wealth/income/salaries/spending patterns of customer base (1) Cost of running shop or service in each centre (1) Amount of land available/space for building (1) [1 + 1 = 2] (b) (i) Mark 2 sections as whole i.e. credit Plan answers in Carry out or reverse Plan: When to do count / do at same time (1) Where to do count / location of counting points (1) How long to do each count for (1) How many different counting points to have (1) Individuals or pairs/groups (1) How many times to do count per day (1) Whether to do count on same day/more than one day / weekday/ weekend (1) Carry out Tally method / ‘clicker’ (1) Timing of count / use a watch (1) Jobs of student in each group e.g. two students do each count / count people going in different directions (1) Record the data in a table/use recording sheet (1) [1 + 1 + 1 +1 = 4] (ii) 109 – 111 (110 is best answer) [1]
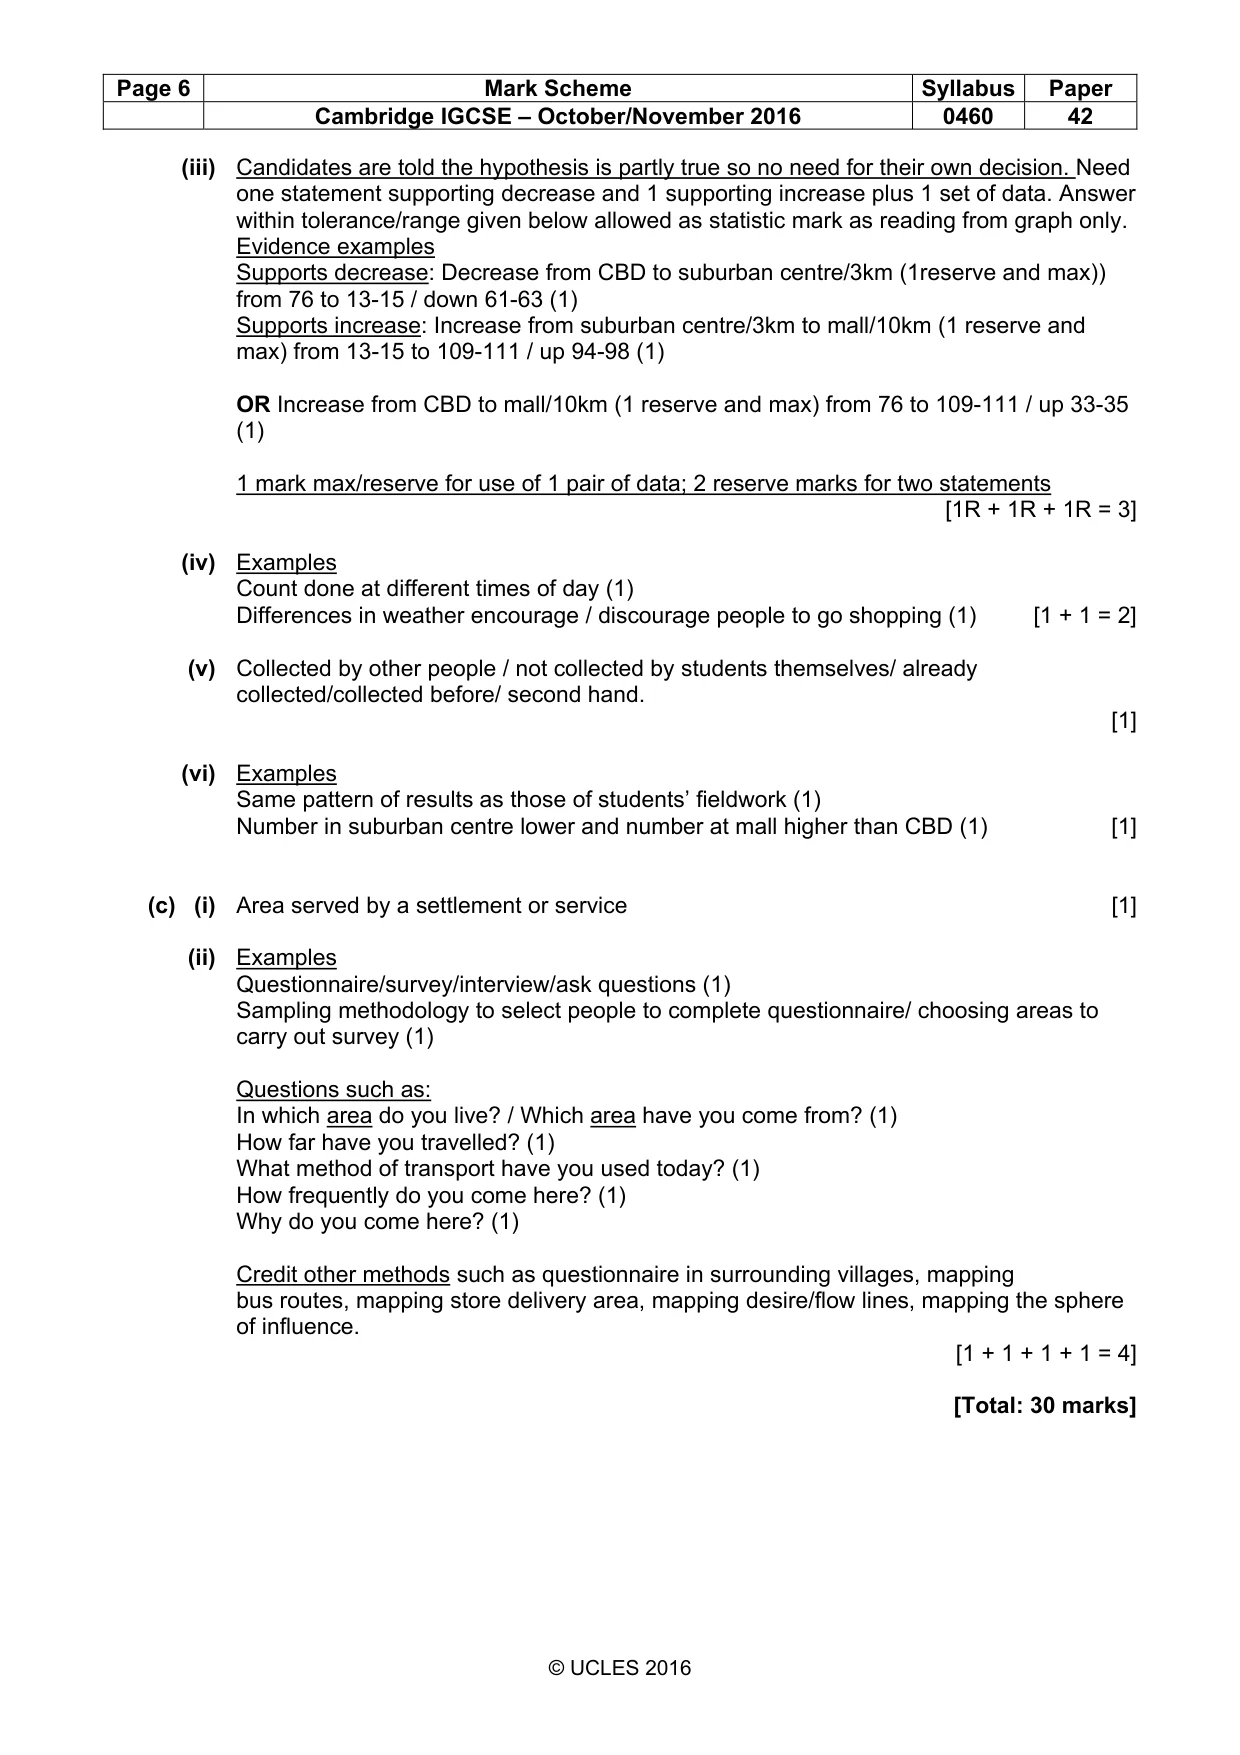
Mark scheme, page 6
Page 6 Mark Scheme Syllabus Paper Cambridge IGCSE – October/November 2016 0460 42 © UCLES 2016 (iii) Candidates are told the hypothesis is partly true so no need for their own decision. Need one statement supporting decrease and 1 supporting increase plus 1 set of data. Answer within tolerance/range given below allowed as statistic mark as reading from graph only. Evidence examples Supports decrease: Decrease from CBD to suburban centre/3km (1reserve and max)) from 76 to 13-15 / down 61-63 (1) Supports increase: Increase from suburban centre/3km to mall/10km (1 reserve and max) from 13-15 to 109-111 / up 94-98 (1) OR Increase from CBD to mall/10km (1 reserve and max) from 76 to 109-111 / up 33-35 (1) 1 mark max/reserve for use of 1 pair of data; 2 reserve marks for two statements [1R + 1R + 1R = 3] (iv) Examples Count done at different times of day (1) Differences in weather encourage / discourage people to go shopping (1) [1 + 1 = 2] (v) Collected by other people / not collected by students themselves/ already collected/collected before/ second hand. [1] (vi) Examples Same pattern of results as those of students’ fieldwork (1) Number in suburban centre lower and number at mall higher than CBD (1) [1] (c) (i) Area served by a settlement or service [1] (ii) Examples Questionnaire/survey/interview/ask questions (1) Sampling methodology to select people to complete questionnaire/ choosing areas to carry out survey (1) Questions such as: In which area do you live? / Which area have you come from? (1) How far have you travelled? (1) What method of transport have you used today? (1) How frequently do you come here? (1) Why do you come here? (1) Credit other methods such as questionnaire in surrounding villages, mapping bus routes, mapping store delivery area, mapping desire/flow lines, mapping the sphere of influence. [1 + 1 + 1 + 1 = 4] [Total: 30 marks]
What you needed in this session
Cambridge’s own grade thresholds for 2016 Oct/Nov, Paper 4 · Variant 2. A higher threshold means an easier paper — the bar moves with how the cohort did.