Cambridge IGCSE Geography 0460 — 2015 Oct/Nov Paper 2 · Variant 1
0460/21/O/N/15 · 60 marks · ≈68 min
The question paper and its mark scheme, free to read here and free to download. This is Cambridge’s own paper, exactly as it was sat.
Question paper20 pages

Mark scheme5 pages
Answers below. Sit the paper first if you are practising.
Paper as text
Question paper, page 1
This document consists of 16 printed pages, 4 blank pages and 1 Insert. DC (ST/AR) 128462 © UCLES 2015 [Turn over * 4 4 2 1 1 4 5 2 9 8 * The syllabus is approved for use in England, Wales and Northern Ireland as a Cambridge International Level 1/Level 2 Certificate. Cambridge International Examinations Cambridge International General Certificate of Secondary Education GEOGRAPHY 0460/21 Paper 2 October/November 2015 1 hour 30 minutes Candidates answer on the Question Paper. Additional Materials: Ruler Protractor Plain paper Calculator 1:50 000 Survey Map Extract is enclosed with this Question Paper. READ THESE INSTRUCTIONS FIRST Write your Centre number, candidate number and name in the spaces provided. Write in dark blue or black pen. You may use an HB pencil for any diagrams or graphs. Do not use staples, paper clips, glue or correction fluid. DO NOT WRITE IN ANY BARCODES. Write your answer to each question in the space provided. If additional space is required, you should use the lined pages at the end of this booklet. The question number(s) must be clearly shown. Answer all questions. The Insert contains Photograph A for Question 3 and Photograph B for Question 5. The Survey Map Extract and the Insert are not required by the Examiner. Sketch maps and diagrams should be drawn whenever they serve to illustrate an answer. At the end of the examination, fasten all your work securely together. The number of marks is given in brackets [ ] at the end of each question or part question.
Question paper, page 2
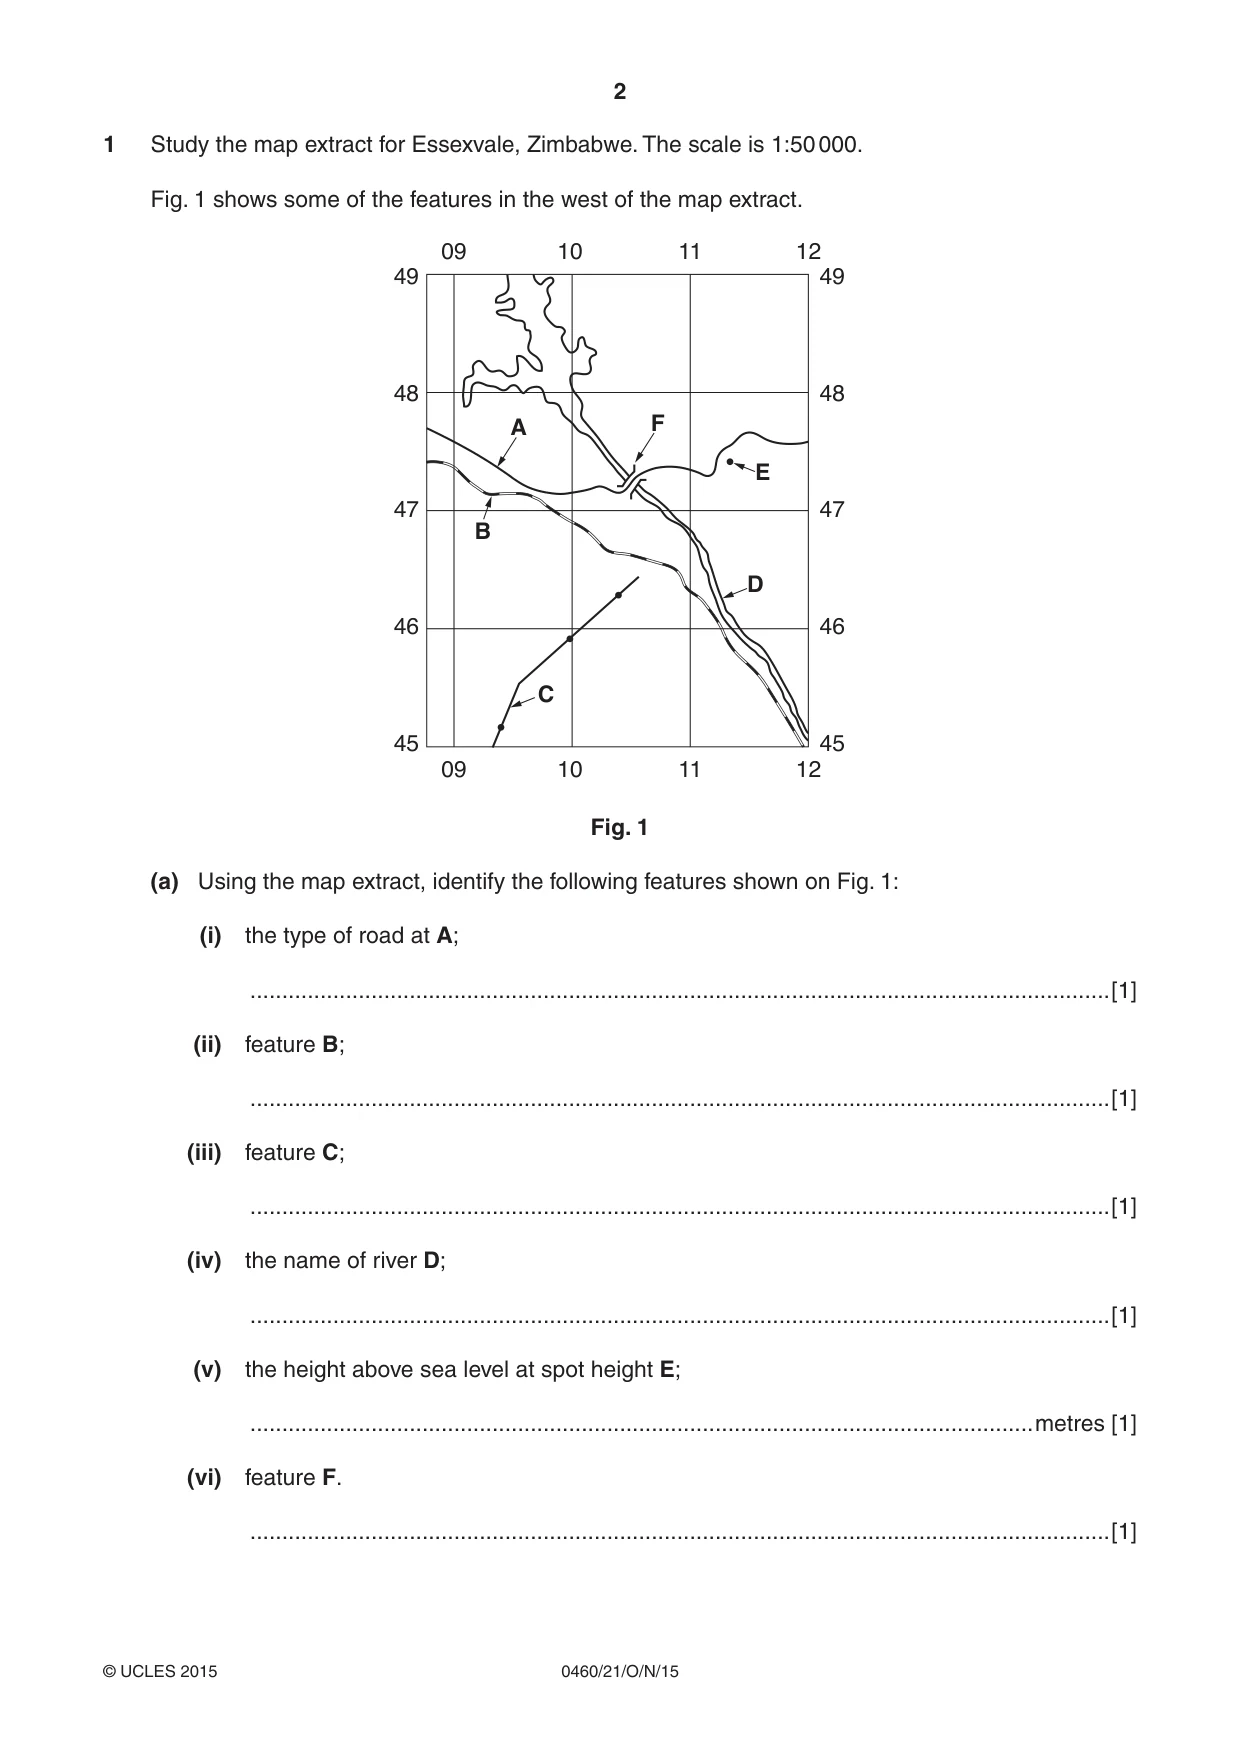
2 0460/21/O/N/15 © UCLES 2015 1 Study the map extract for Essexvale, Zimbabwe. The scale is 1:50 000. Fig. 1 shows some of the features in the west of the map extract. 09 10 11 12 09 10 11 12 49 48 47 46 45 49 48 47 46 45 A F E B D C Fig. 1 (a) Using the map extract, identify the following features shown on Fig. 1: (i) the type of road at A; …[1] (ii) feature B; …[1] (iii) feature C; …[1] (iv) the name of river D; …[1] (v) the height above sea level at spot height E; …metres [1] (vi) feature F. …[1]
Question paper, page 3
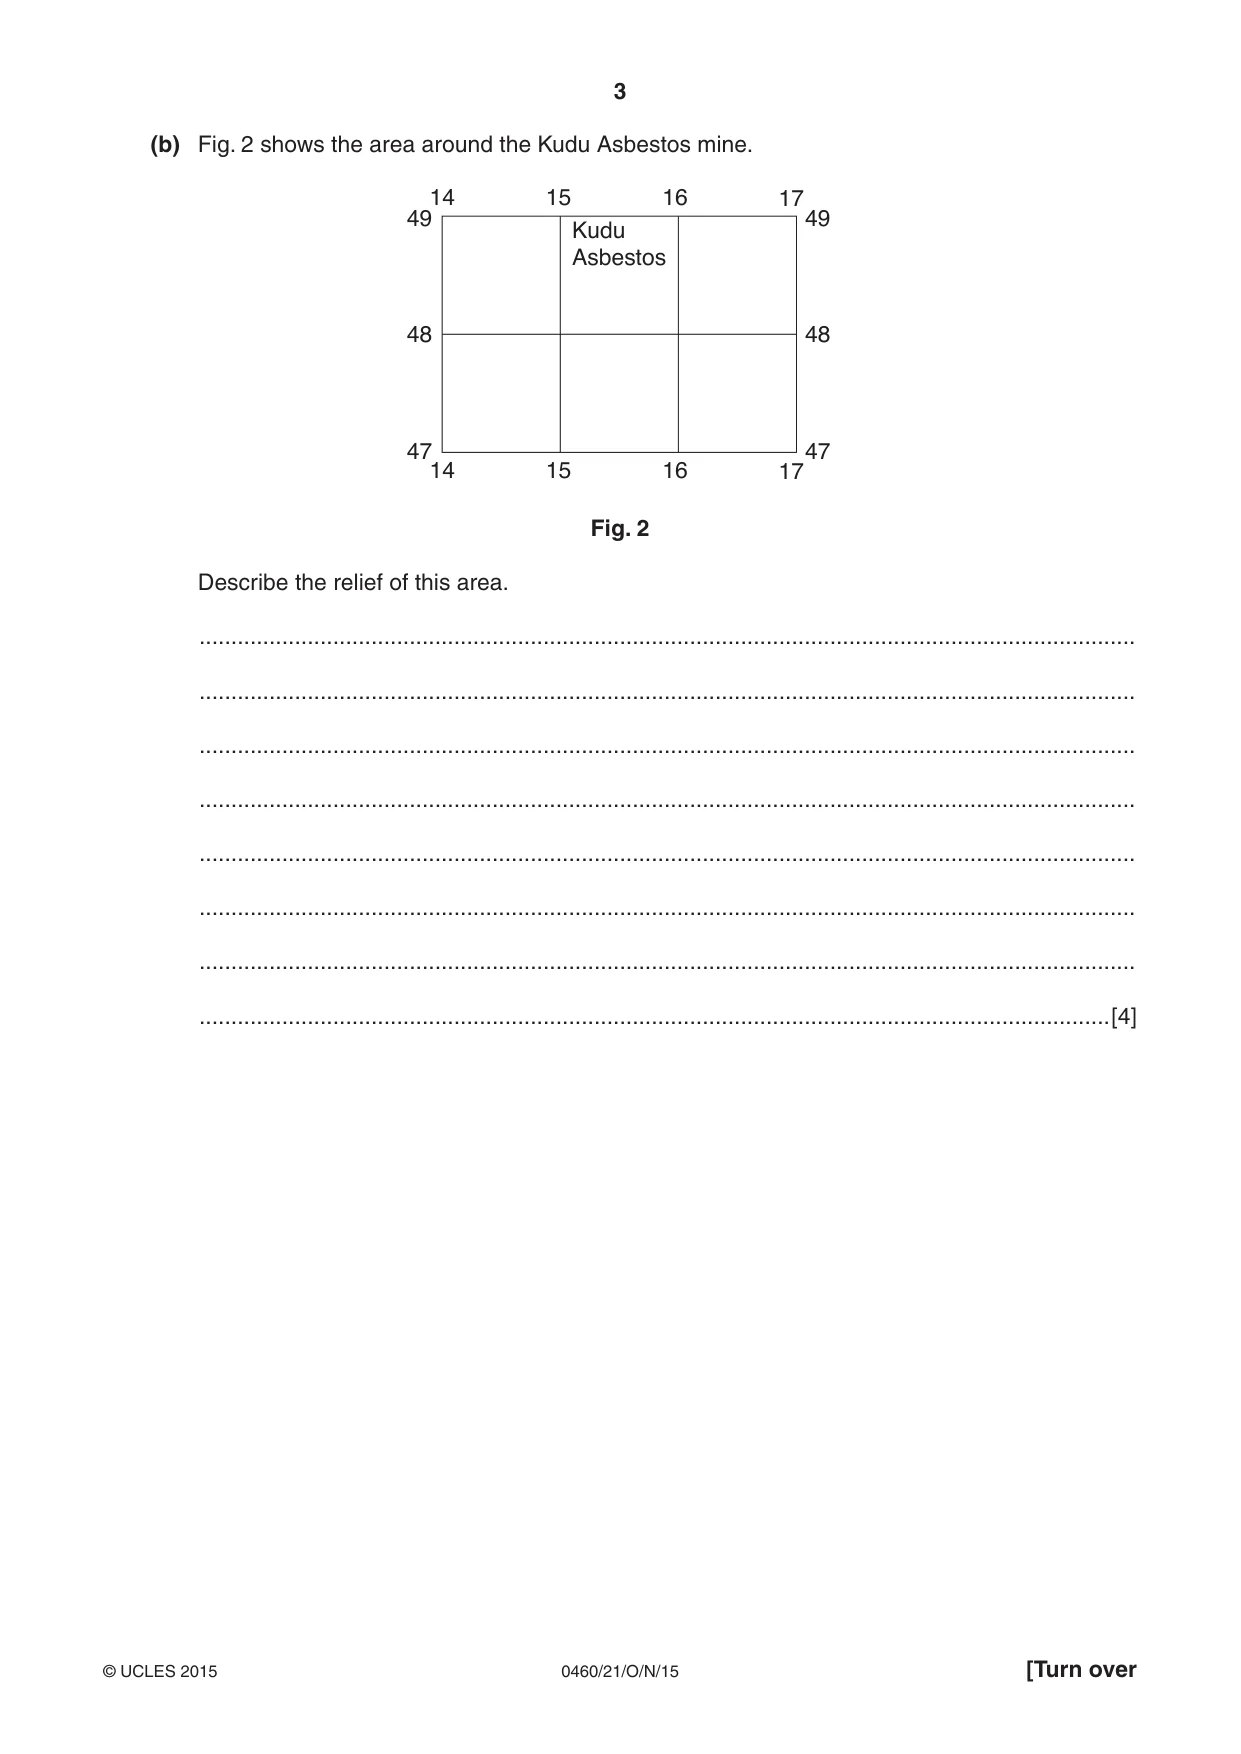
3 0460/21/O/N/15 © UCLES 2015 [Turn over (b) Fig. 2 shows the area around the Kudu Asbestos mine. 14 15 16 17 14 15 16 17 49 48 47 49 48 47 Kudu Asbestos Fig. 2 Describe the relief of this area. … … … … … … … …[4]
Question paper, page 4
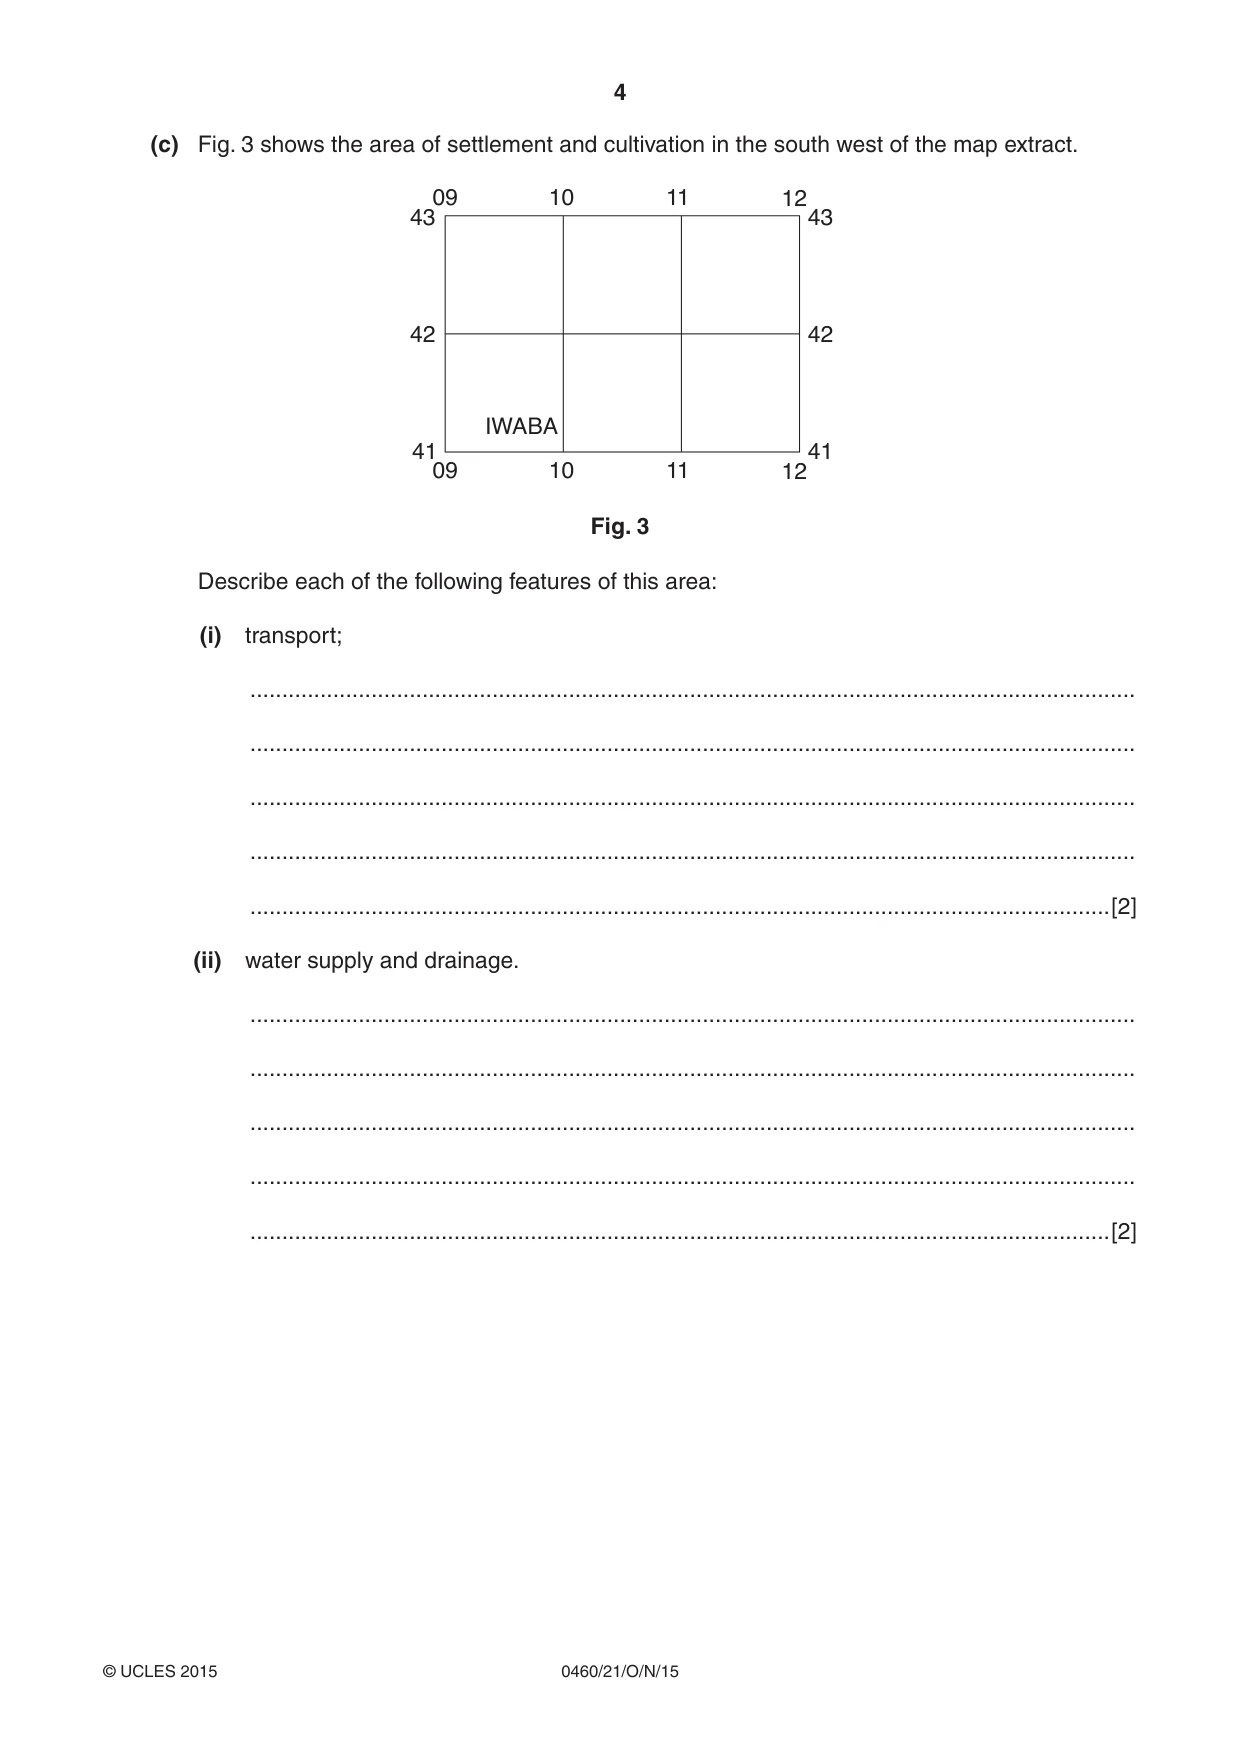
4 0460/21/O/N/15 © UCLES 2015 (c) Fig. 3 shows the area of settlement and cultivation in the south west of the map extract. 09 10 11 12 09 10 11 12 43 42 43 42 41 41 IWABA Fig. 3 Describe each of the following features of this area: (i) transport; … … … … …[2] (ii) water supply and drainage. … … … … …[2]
Question paper, page 5
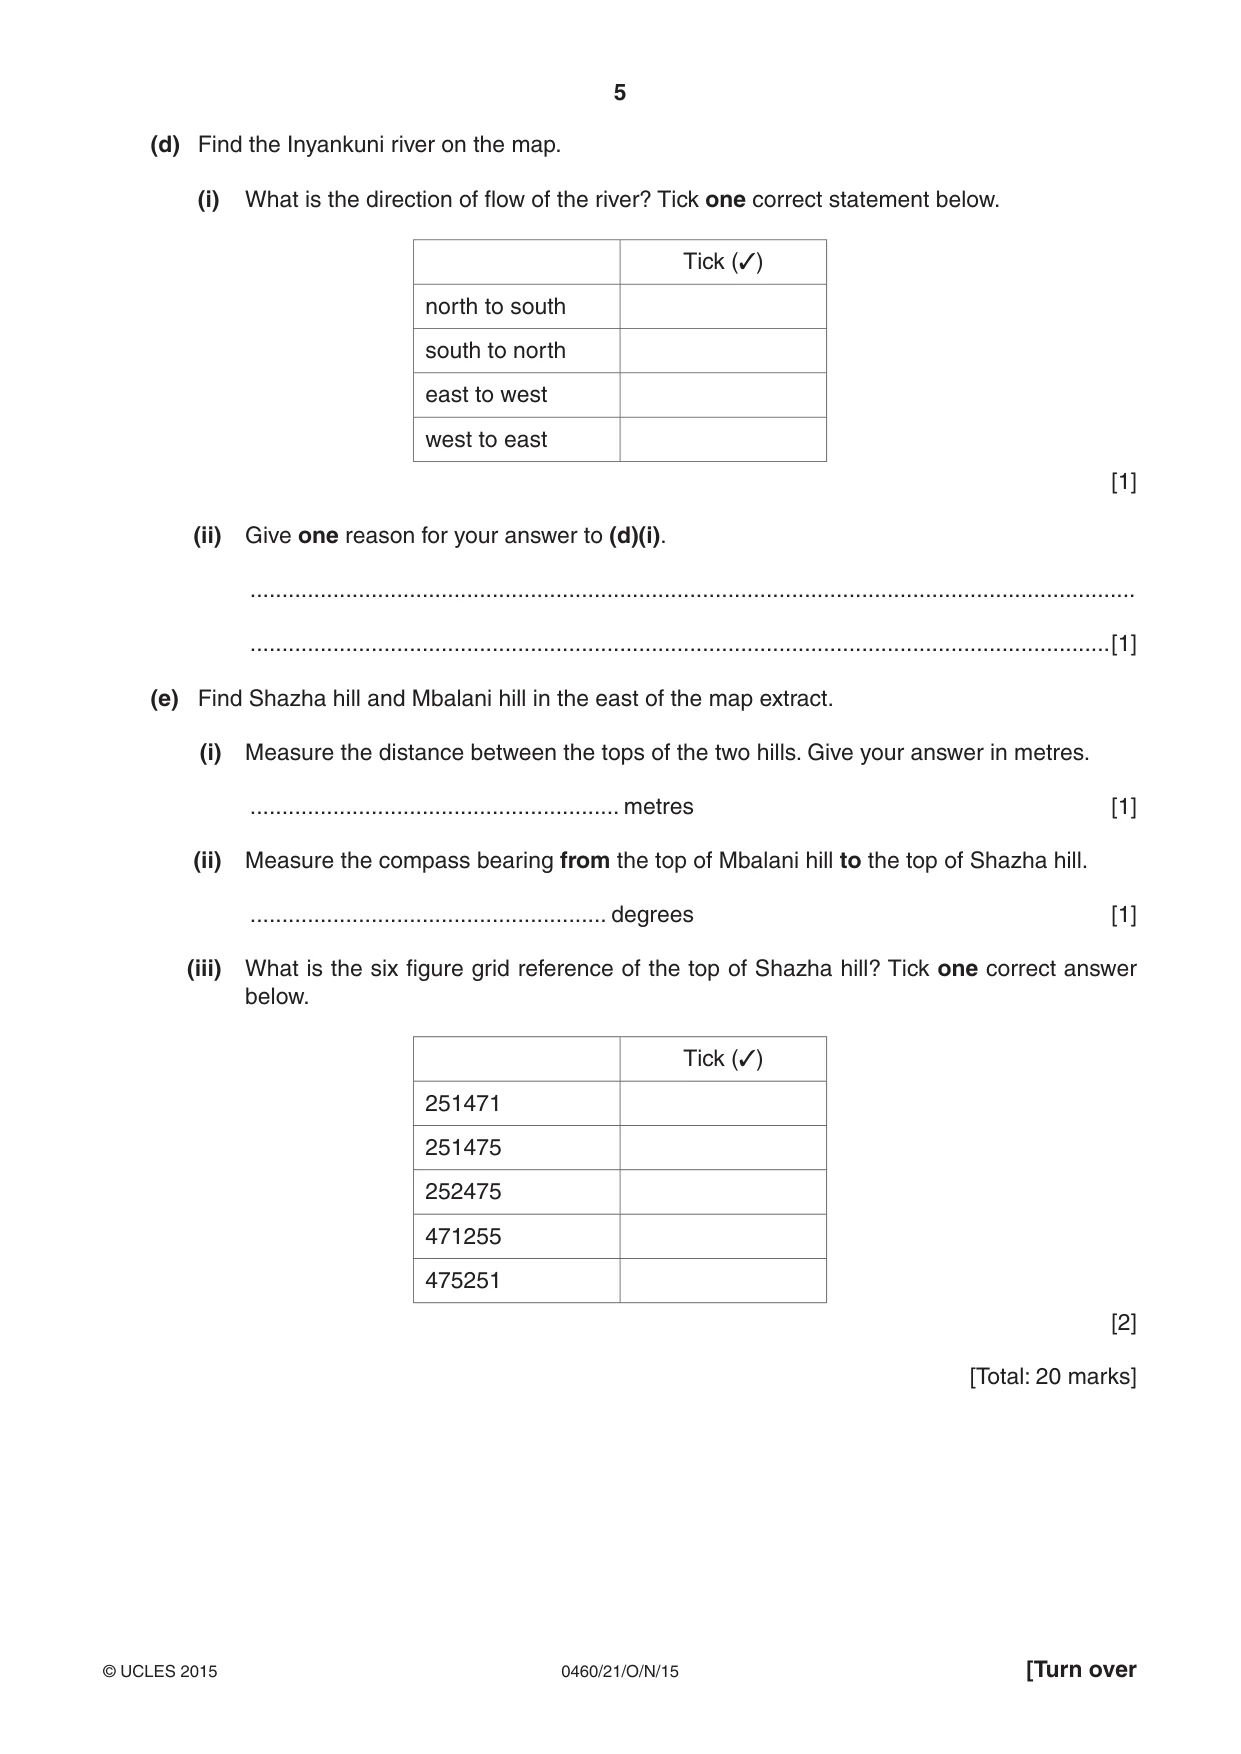
5 0460/21/O/N/15 © UCLES 2015 [Turn over (d) Find the Inyankuni river on the map. (i) What is the direction of flow of the river? Tick one correct statement below. Tick (3) north to south south to north east to west west to east [1] (ii) Give one reason for your answer to (d)(i). … …[1] (e) Find Shazha hill and Mbalani hill in the east of the map extract. (i) Measure the distance between the tops of the two hills. Give your answer in metres. … metres [1] (ii) Measure the compass bearing from the top of Mbalani hill to the top of Shazha hill. … degrees [1] (iii) What is the six figure grid reference of the top of Shazha hill? Tick one correct answer below. Tick (3) 251471 251475 252475 471255 475251 [2] [Total: 20 marks]
Question paper, page 6
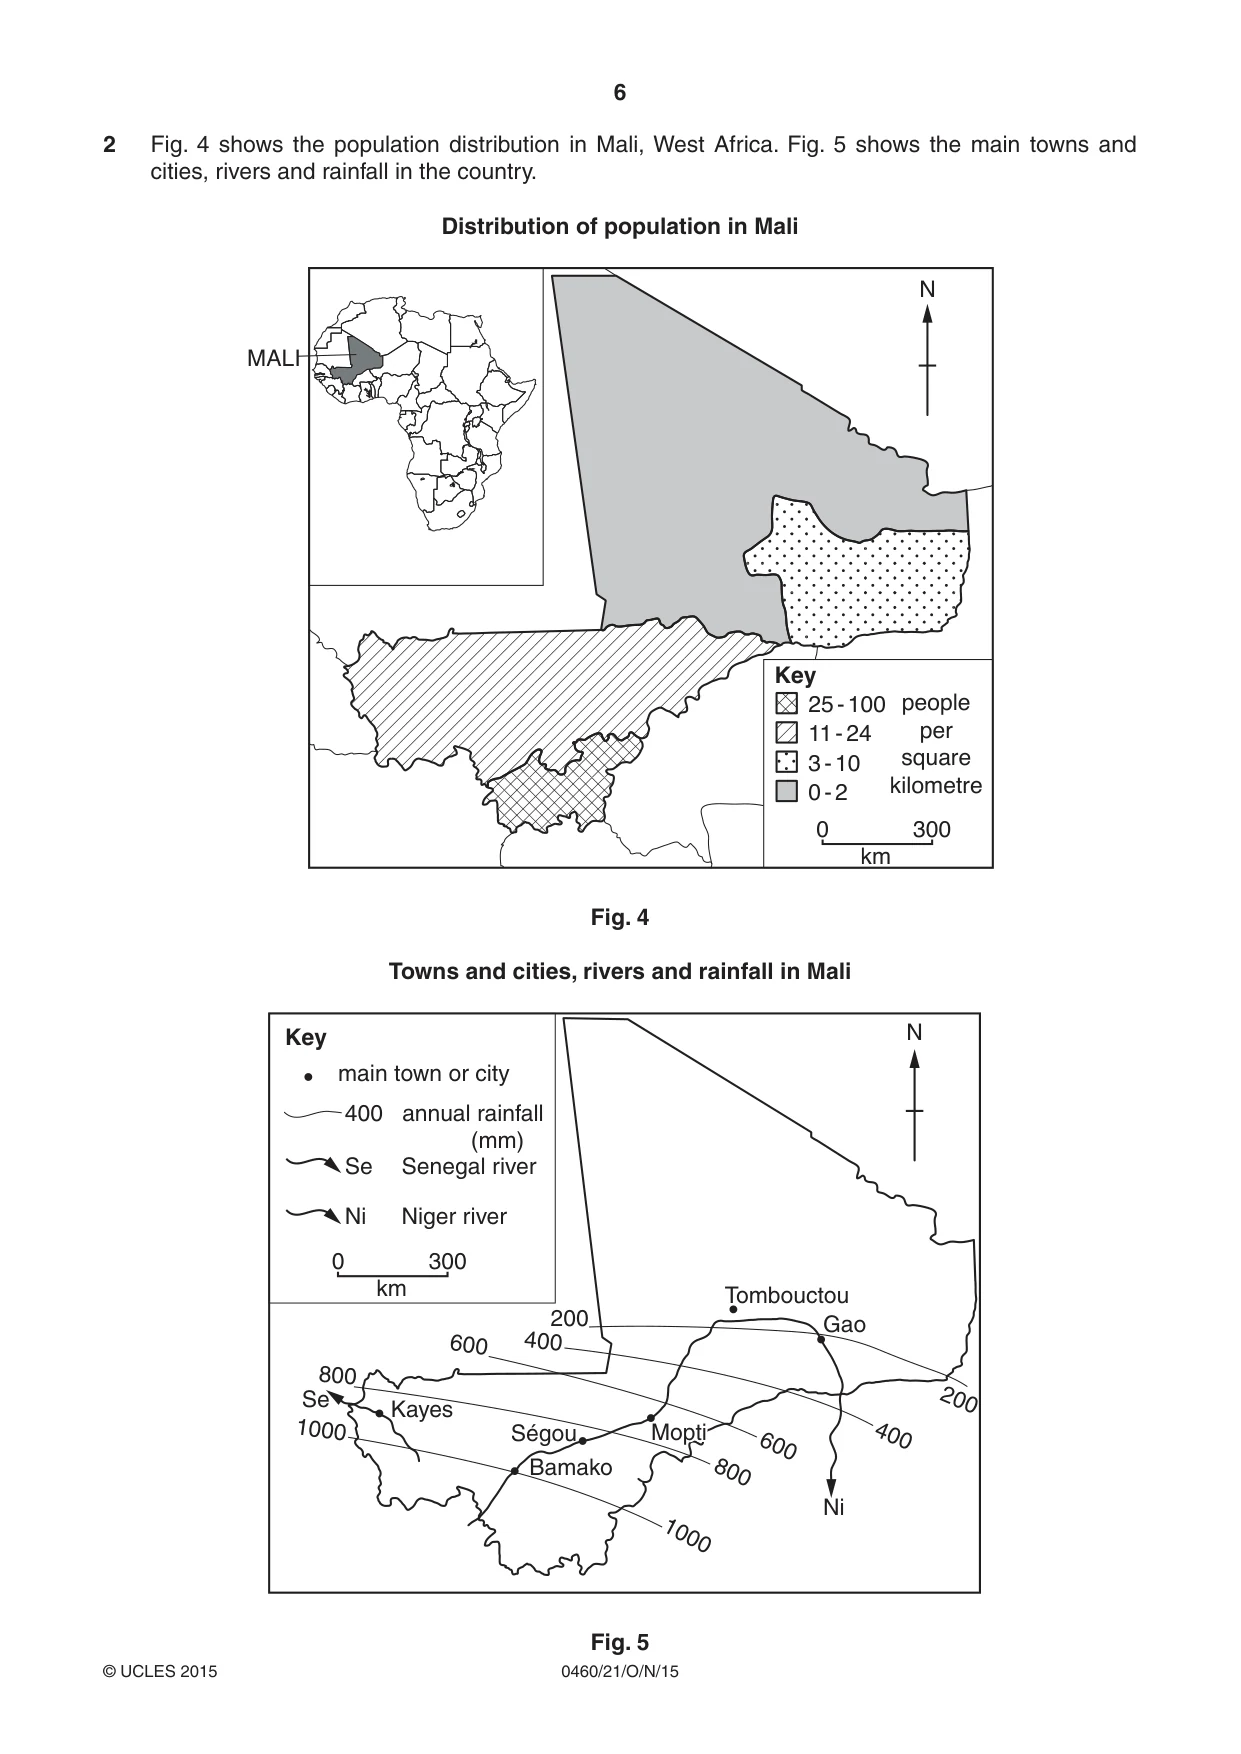
6 0460/21/O/N/15 © UCLES 2015 2 Fig. 4 shows the population distribution in Mali, West Africa. Fig. 5 shows the main towns and cities, rivers and rainfall in the country. Distribution of population in Mali Key N 25 - 100 11 - 24 3 - 10 0 - 2 people per square kilometre 0 300 km MALI Fig. 4 Towns and cities, rivers and rainfall in Mali N Tombouctou Kayes Bamako Gao 200 200 400 400 600 800 800 600 1000 1000 Se main town or city 400 annual rainfall (mm) Se Senegal river Ni Niger river Ségou Mopti Mopti Key 0 300 km Ni Fig. 5
Question paper, page 7
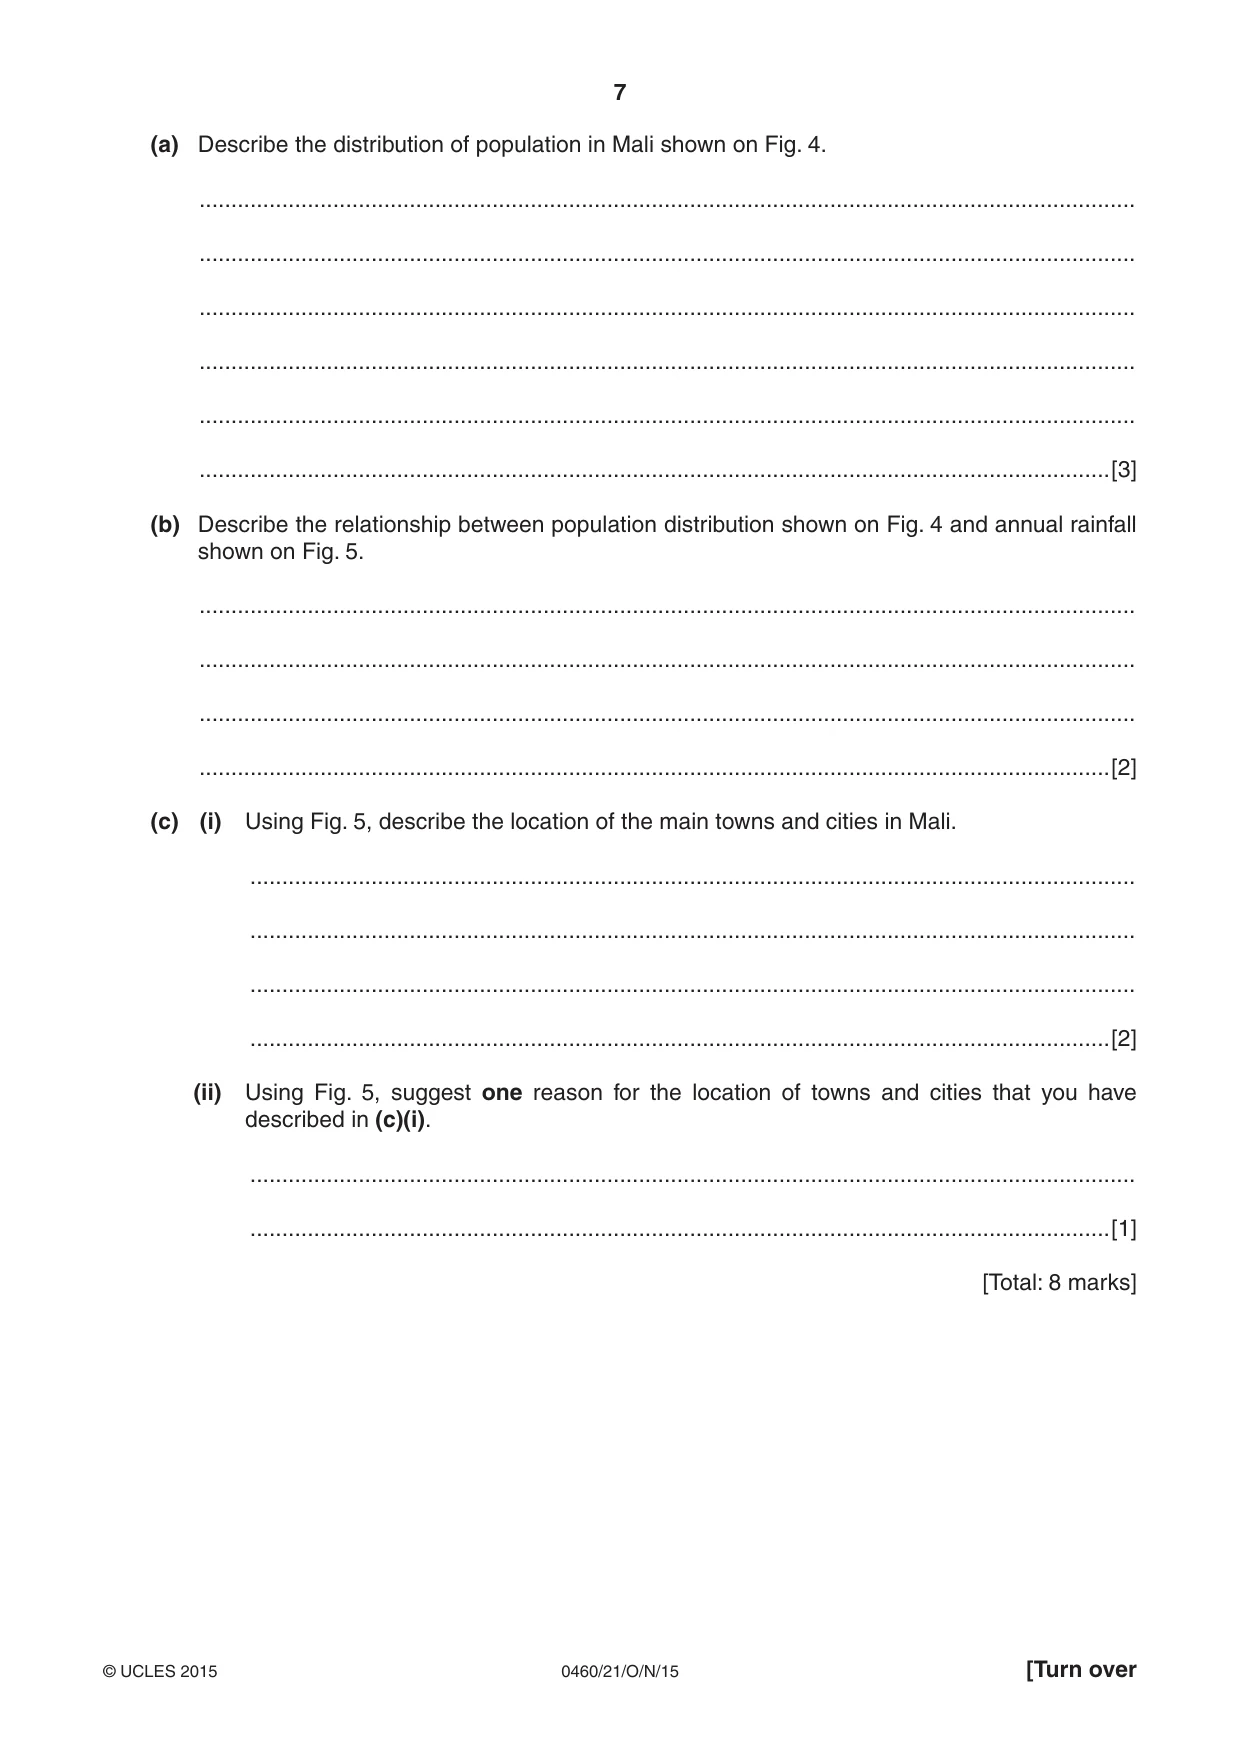
7 0460/21/O/N/15 © UCLES 2015 [Turn over (a) Describe the distribution of population in Mali shown on Fig. 4. … … … … … …[3] (b) Describe the relationship between population distribution shown on Fig. 4 and annual rainfall shown on Fig. 5. … … … …[2] (c) (i) Using Fig. 5, describe the location of the main towns and cities in Mali. … … … …[2] (ii) Using Fig. 5, suggest one reason for the location of towns and cities that you have described in (c)(i). … …[1] [Total: 8 marks]
Question paper, page 8
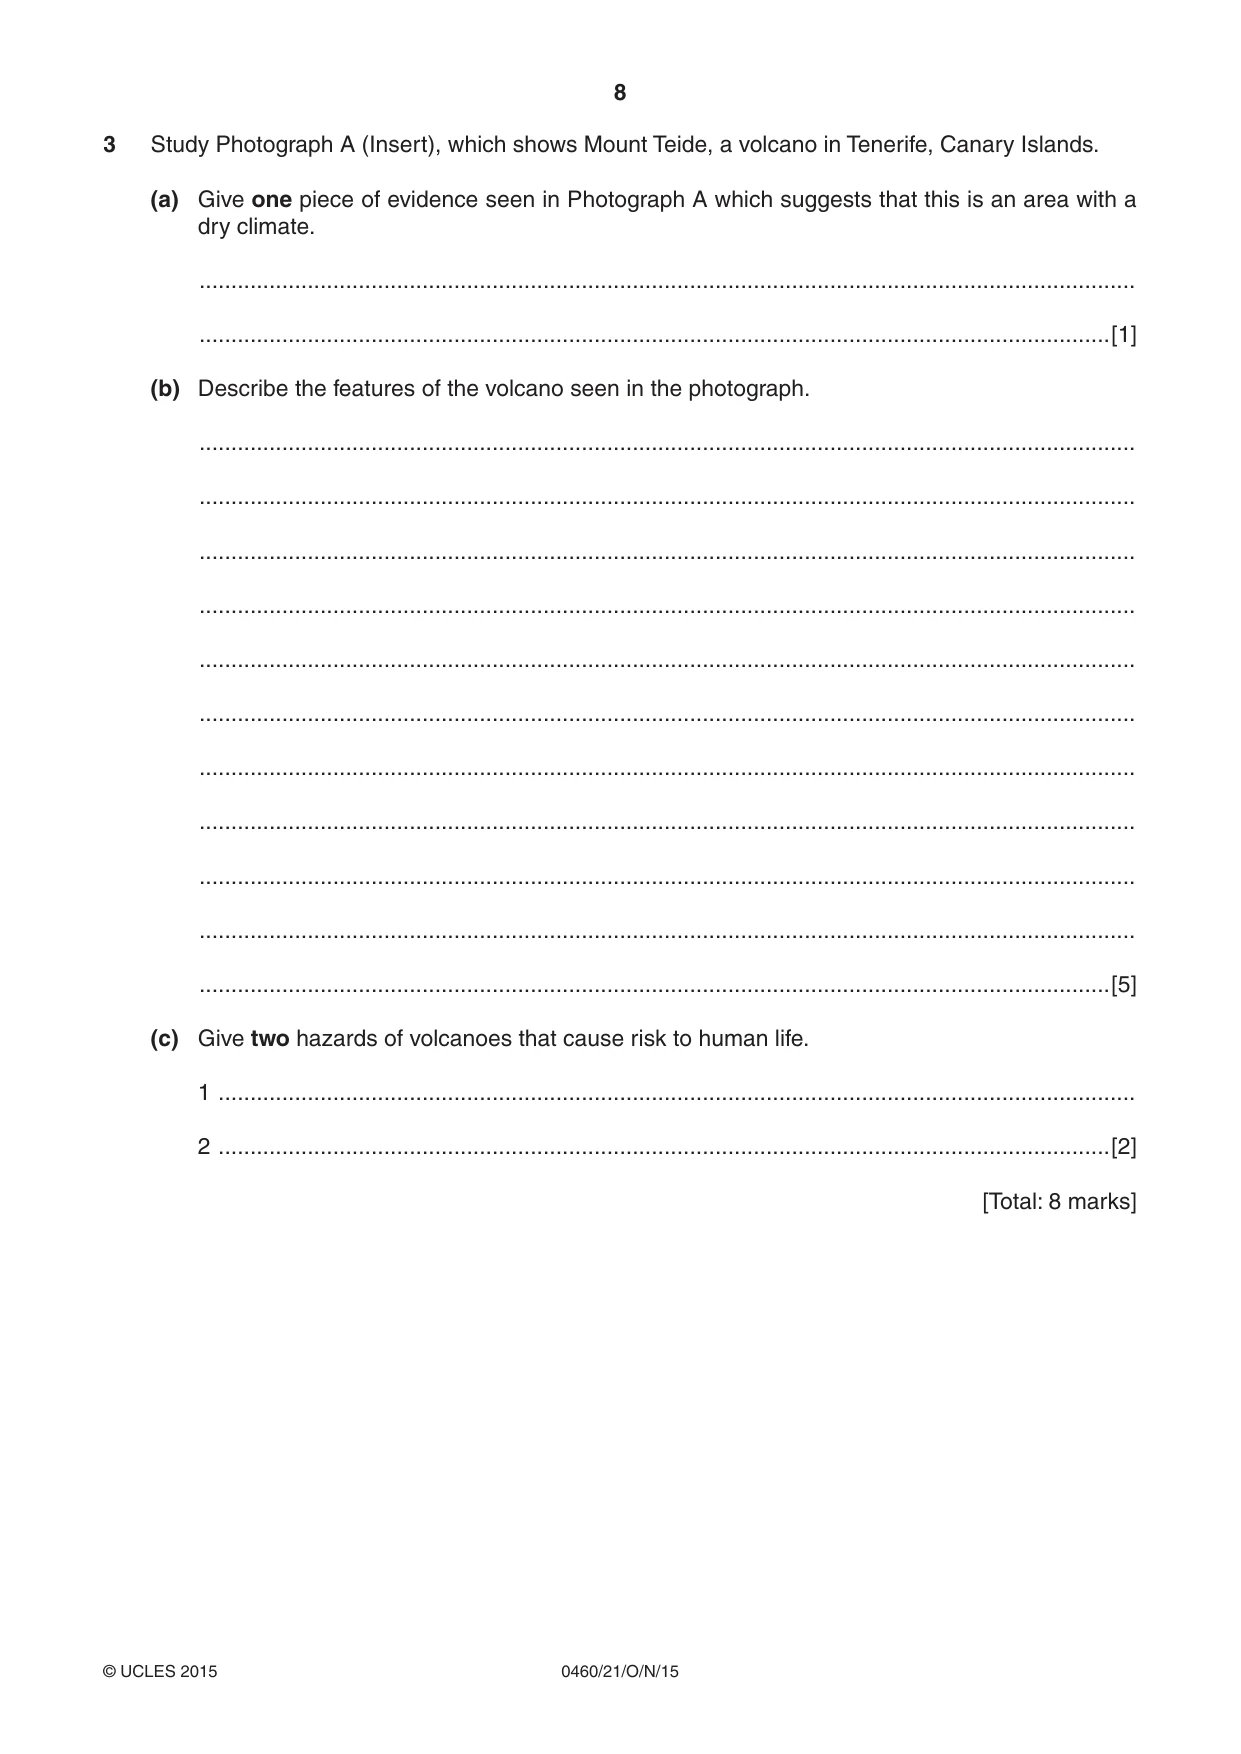
8 0460/21/O/N/15 © UCLES 2015 3 Study Photograph A (Insert), which shows Mount Teide, a volcano in Tenerife, Canary Islands. (a) Give one piece of evidence seen in Photograph A which suggests that this is an area with a dry climate. … …[1] (b) Describe the features of the volcano seen in the photograph. … … … … … … … … … … …[5] (c) Give two hazards of volcanoes that cause risk to human life. 1 … 2 …[2] [Total: 8 marks]
Question paper, page 9
9 0460/21/O/N/15 © UCLES 2015 [Turn over 4 (a) Fig. 6 shows the output of four areas which are important for the production of high technology goods. (i) Using Fig. 6, state the value of Japan’s output of high technology goods in 2000. …billion US$ [1] (ii) How has China’s output changed between 1998 and 2010 compared to the other three areas? … …[1] (iii) How has Japan’s output changed between 1998 and 2010 compared to the other three areas? … …[1] Content removed due to copyright restrictions.
Question paper, page 10
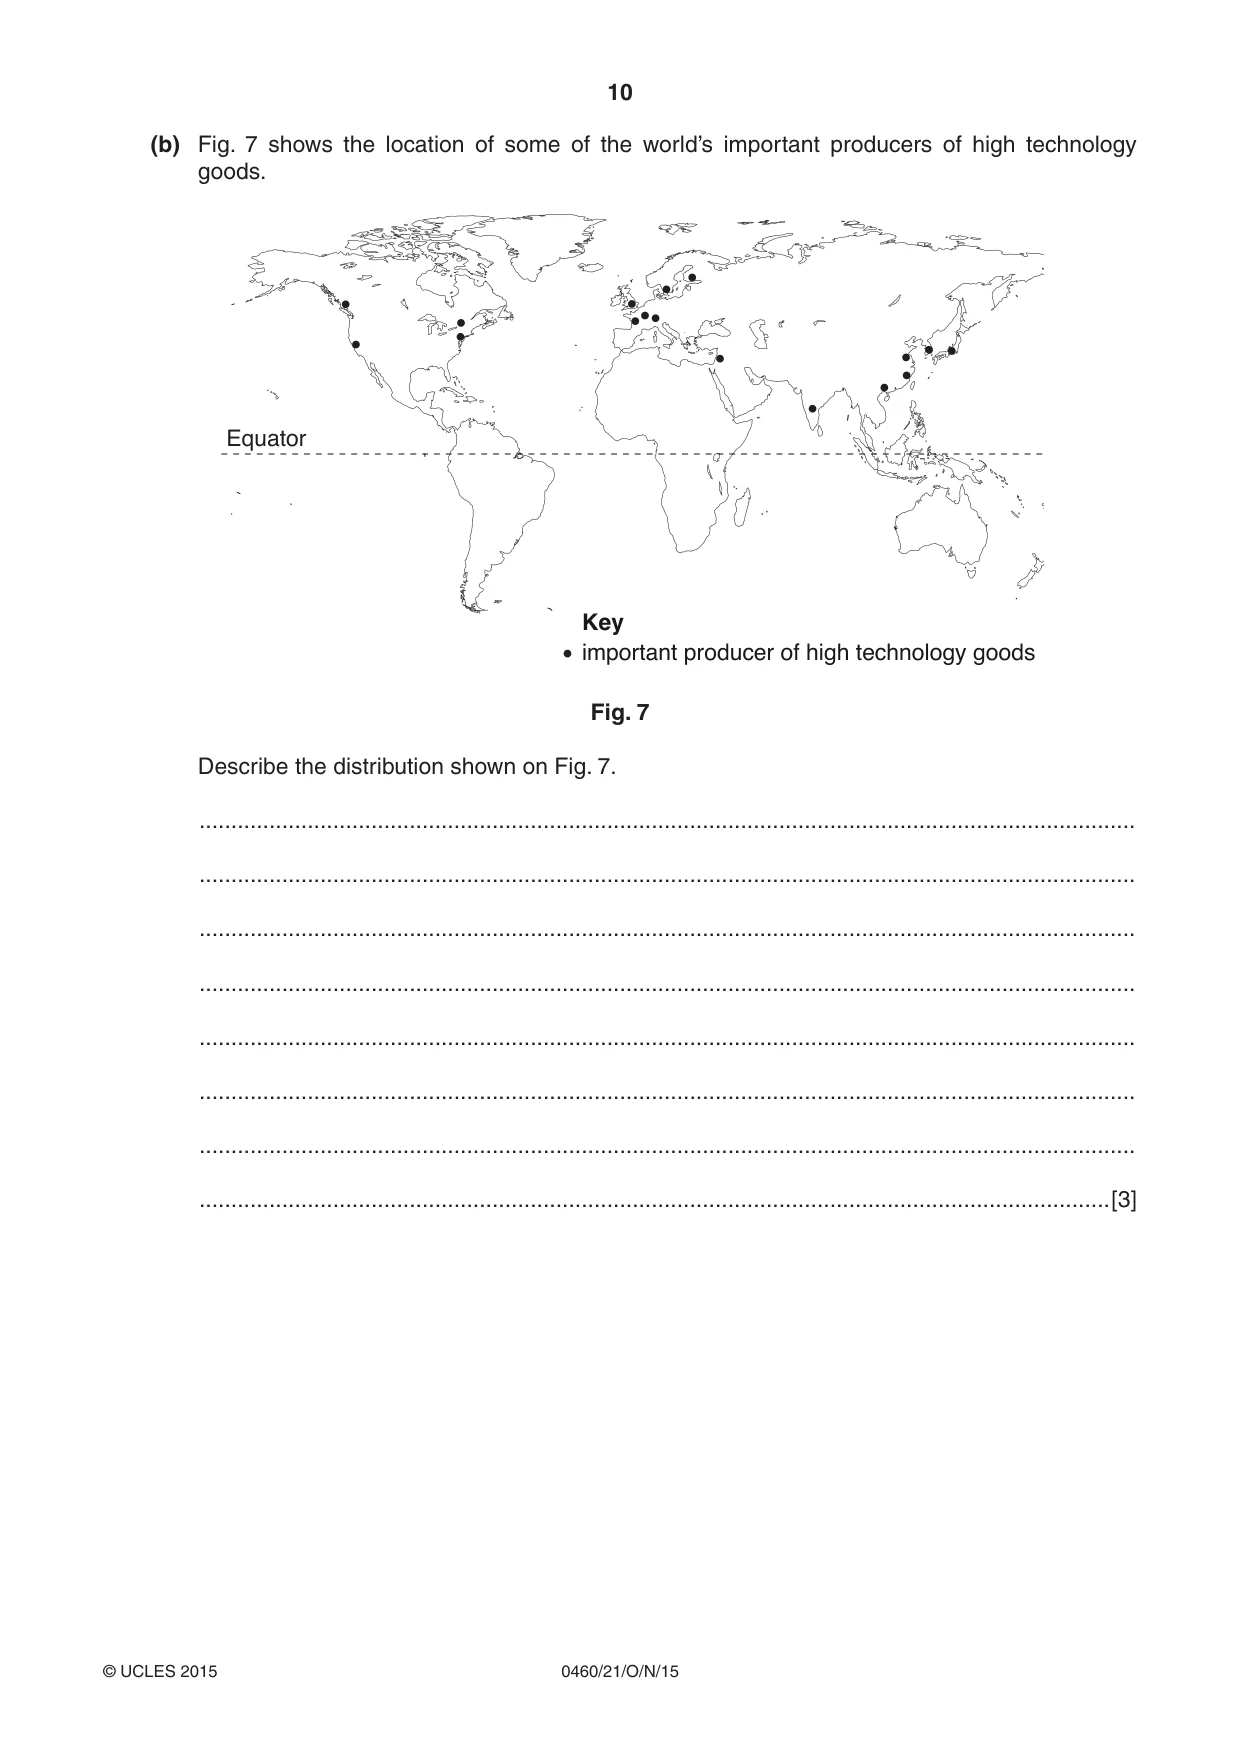
10 0460/21/O/N/15 © UCLES 2015 (b) Fig. 7 shows the location of some of the world’s important producers of high technology goods. Equator important producer of high technology goods Key Fig. 7 Describe the distribution shown on Fig. 7. … … … … … … … …[3]
Question paper, page 11
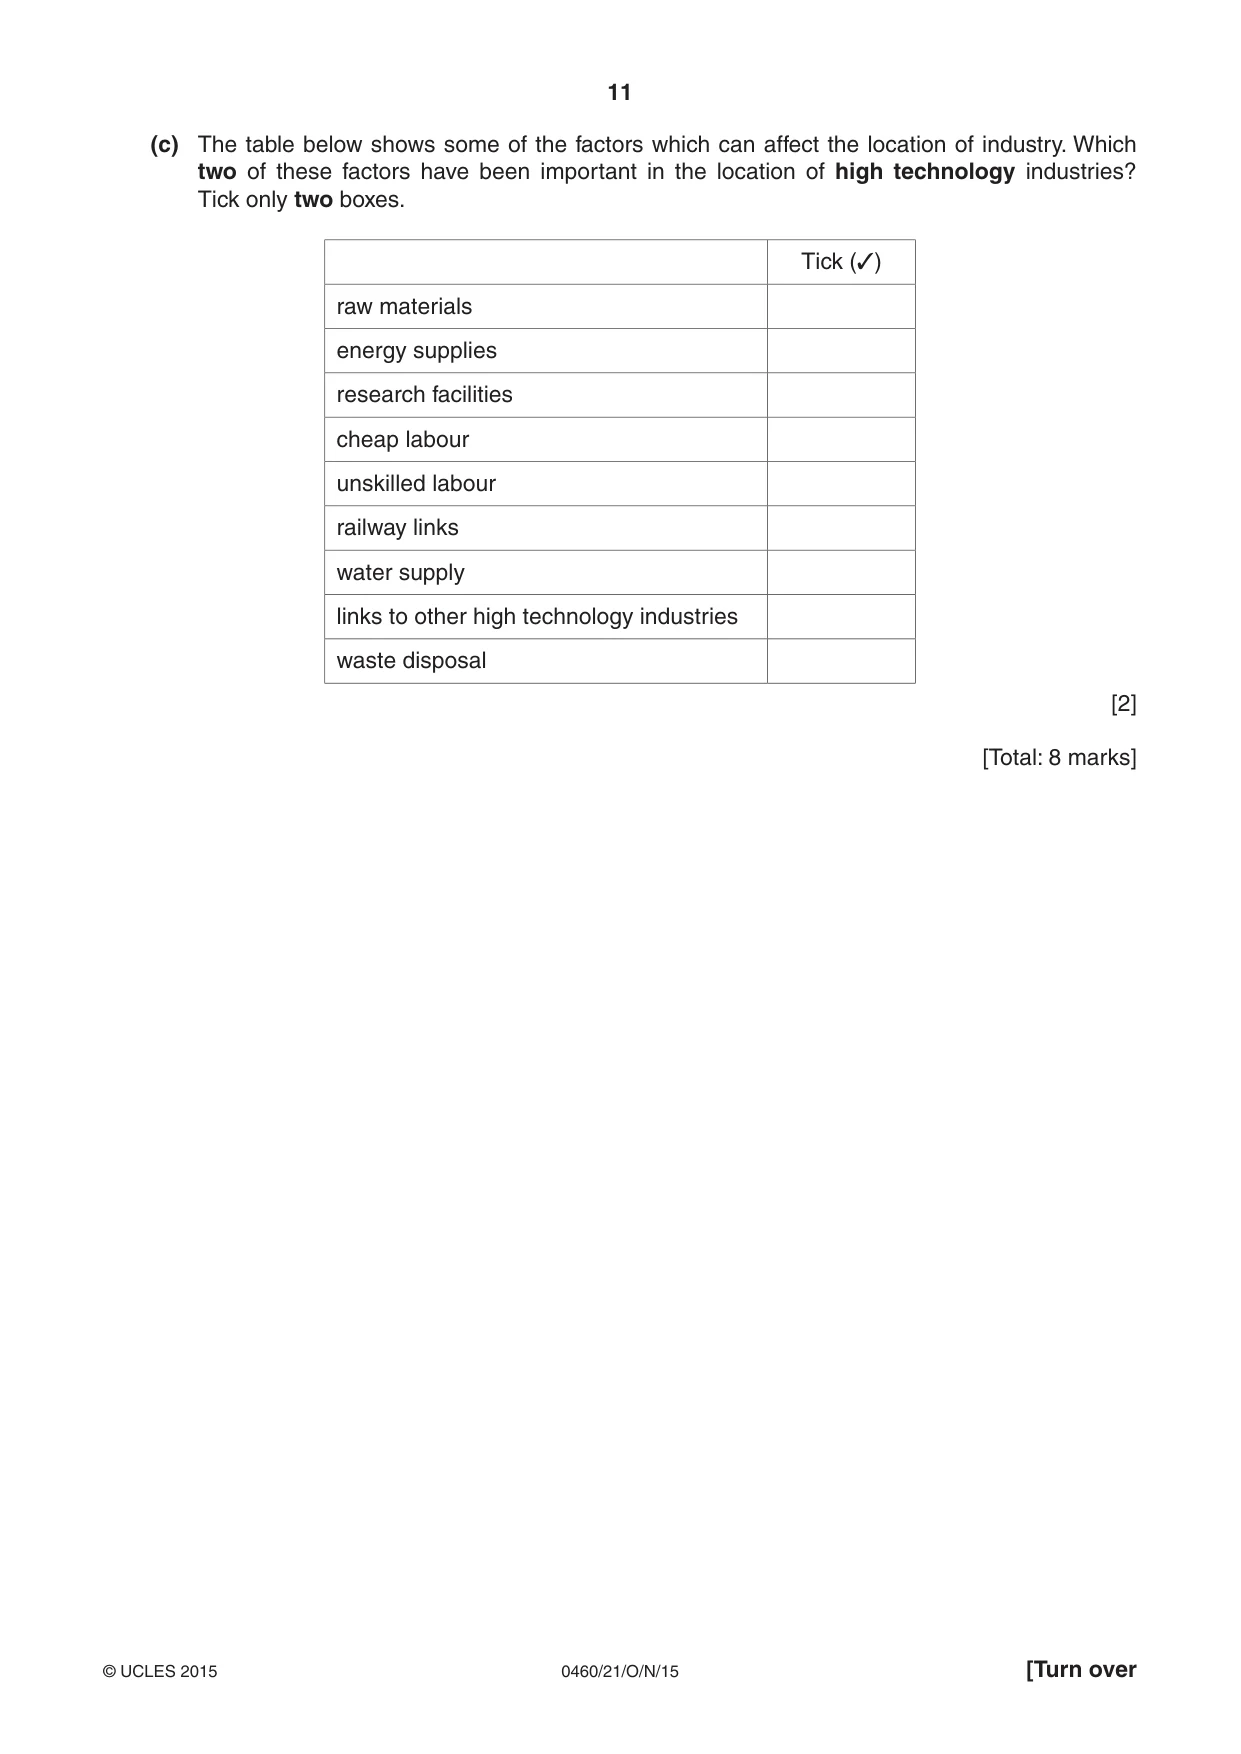
11 0460/21/O/N/15 © UCLES 2015 [Turn over (c) The table below shows some of the factors which can affect the location of industry. Which two of these factors have been important in the location of high technology industries? Tick only two boxes. Tick (3) raw materials energy supplies research facilities cheap labour unskilled labour railway links water supply links to other high technology industries waste disposal [2] [Total: 8 marks]
Question paper, page 12
12 0460/21/O/N/15 © UCLES 2015 BLANK PAGE
Question paper, page 13
13 0460/21/O/N/15 © UCLES 2015 [Turn over 5 Photograph B (Insert) shows a weather station in Spain. The box on the left of the photograph is old and the instruments inside the fence on the right of the photograph are newer. (a) (i) Identify the name of the box on the left of the photograph. …[1] (ii) Name one of the instruments seen inside the fence on the right of the photograph. …[1] (b) Using evidence from the photograph, suggest why this might not be a good location for the weather station. … … … …[2] (c) Using evidence from the photograph, how is data from the instruments on the right recorded? … … … …[2] (d) The box on the left of the photograph has been replaced by instruments inside the fence on the right of the photograph. Suggest why. … … … …[2] [Total: 8 marks]
Question paper, page 14
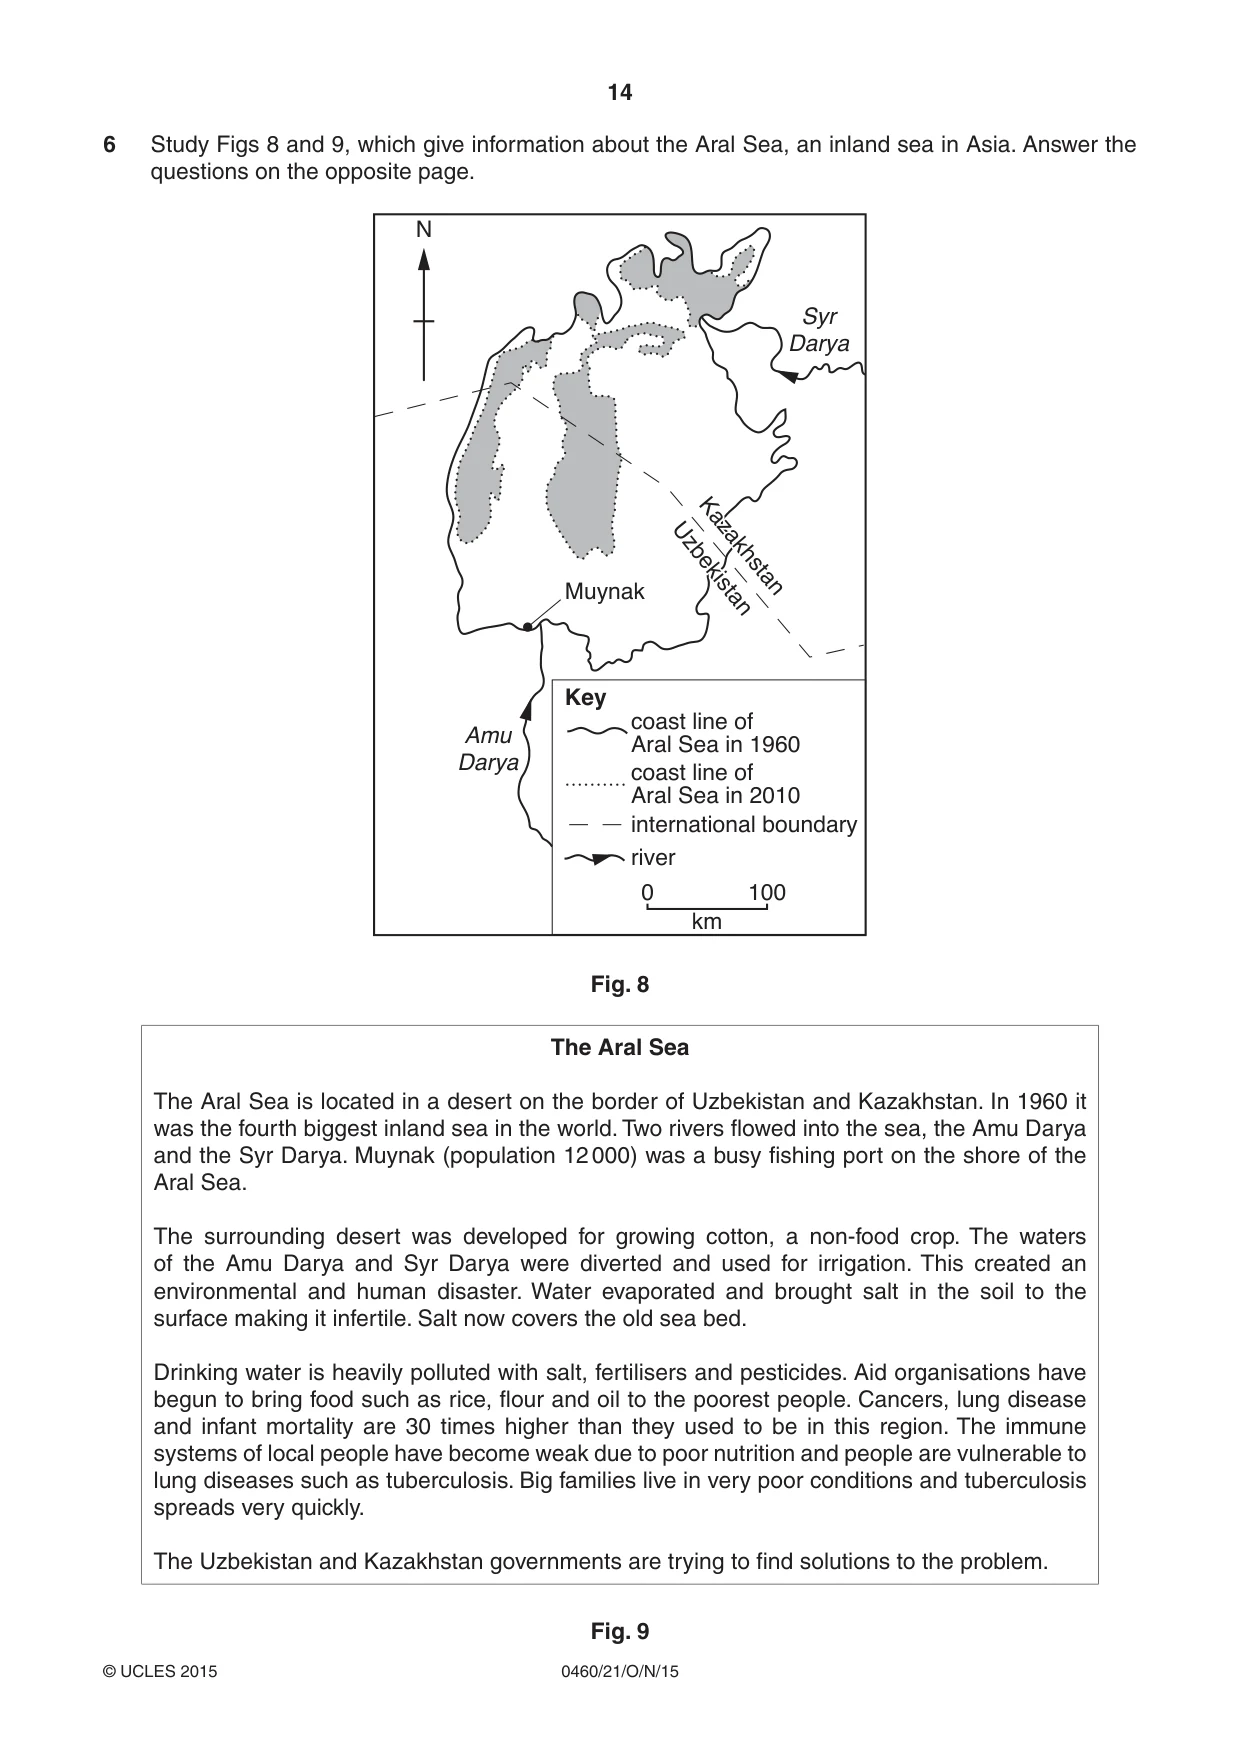
14 0460/21/O/N/15 © UCLES 2015 6 Study Figs 8 and 9, which give information about the Aral Sea, an inland sea in Asia. Answer the questions on the opposite page. Muynak coast line of Aral Sea in 1960 coast line of Aral Sea in 2010 international boundary river N Key 0 100 km Uzbekistan Kazakhstan Uzbekistan Kazakhstan Uzbekistan Kazakhstan Uzbekistan Kazakhstan Syr Darya Amu Darya Fig. 8 The Aral Sea The Aral Sea is located in a desert on the border of Uzbekistan and Kazakhstan. In 1960 it was the fourth biggest inland sea in the world. Two rivers flowed into the sea, the Amu Darya and the Syr Darya. Muynak (population 12 000) was a busy fishing port on the shore of the Aral Sea. The surrounding desert was developed for growing cotton, a non-food crop. The waters of the Amu Darya and Syr Darya were diverted and used for irrigation. This created an environmental and human disaster. Water evaporated and brought salt in the soil to the surface making it infertile. Salt now covers the old sea bed. Drinking water is heavily polluted with salt, fertilisers and pesticides. Aid organisations have begun to bring food such as rice, flour and oil to the poorest people. Cancers, lung disease and infant mortality are 30 times higher than they used to be in this region. The immune systems of local people have become weak due to poor nutrition and people are vulnerable to lung diseases such as tuberculosis. Big families live in very poor conditions and tuberculosis spreads very quickly. The Uzbekistan and Kazakhstan governments are trying to find solutions to the problem. Fig. 9
Question paper, page 15
15 0460/21/O/N/15 © UCLES 2015 (a) (i) Using Fig. 8, how has the Aral Sea changed between 1960 and 2010? … …[1] (ii) Using Figs 8 and 9, suggest how the economy of Muynak has changed between 1960 and 2010. … …[1] (b) Using Fig. 9, explain why the people of the area have food and health problems. … … … … … … … …[4] (c) It has been suggested that stopping irrigation would help the situation in the Aral Sea and surrounding area. Suggest one advantage and one disadvantage of doing this. Advantage … … … Disadvantage … … …[2] [Total: 8 marks]
Question paper, page 16
16 0460/21/O/N/15 © UCLES 2015 Additional Pages If you use the following lined pages to complete the answer(s) to any question(s), the question number(s) must be clearly shown. … … … … … … … … … … … … … … … … … … … … … … … … … …
Question paper, page 17
17 0460/21/O/N/15 © UCLES 2015 … … … … … … … … … … … … … … … … … … … … … … … … … … …
Question paper, page 18
18 0460/21/O/N/15 © UCLES 2015 BLANK PAGE
Question paper, page 19
19 0460/21/O/N/15 © UCLES 2015 BLANK PAGE
Question paper, page 20
20 0460/21/O/N/15 © UCLES 2015 BLANK PAGE Permission to reproduce items where third-party owned material protected by copyright is included has been sought and cleared where possible. Every reasonable effort has been made by the publisher (UCLES) to trace copyright holders, but if any items requiring clearance have unwittingly been included, the publisher will be pleased to make amends at the earliest possible opportunity. To avoid the issue of disclosure of answer-related information to candidates, all copyright acknowledgements are reproduced online in the Cambridge International Examinations Copyright Acknowledgements Booklet. This is produced for each series of examinations and is freely available to download at www.cie.org.uk after the live examination series. Cambridge International Examinations is part of the Cambridge Assessment Group. Cambridge Assessment is the brand name of University of Cambridge Local Examinations Syndicate (UCLES), which is itself a department of the University of Cambridge.
Mark scheme, page 1
® IGCSE is the registered trademark of Cambridge International Examinations. CAMBRIDGE INTERNATIONAL EXAMINATIONS Cambridge International General Certificate of Secondary Education MARK SCHEME for the October/November 2015 series 0460 GEOGRAPHY 0460/21 Paper 2, maximum raw mark 60 This mark scheme is published as an aid to teachers and candidates, to indicate the requirements of the examination. It shows the basis on which Examiners were instructed to award marks. It does not indicate the details of the discussions that took place at an Examiners’ meeting before marking began, which would have considered the acceptability of alternative answers. Mark schemes should be read in conjunction with the question paper and the Principal Examiner Report for Teachers. Cambridge will not enter into discussions about these mark schemes. Cambridge is publishing the mark schemes for the October/November 2015 series for most Cambridge IGCSE®, Cambridge International A and AS Level components and some Cambridge O Level components.
Mark scheme, page 2
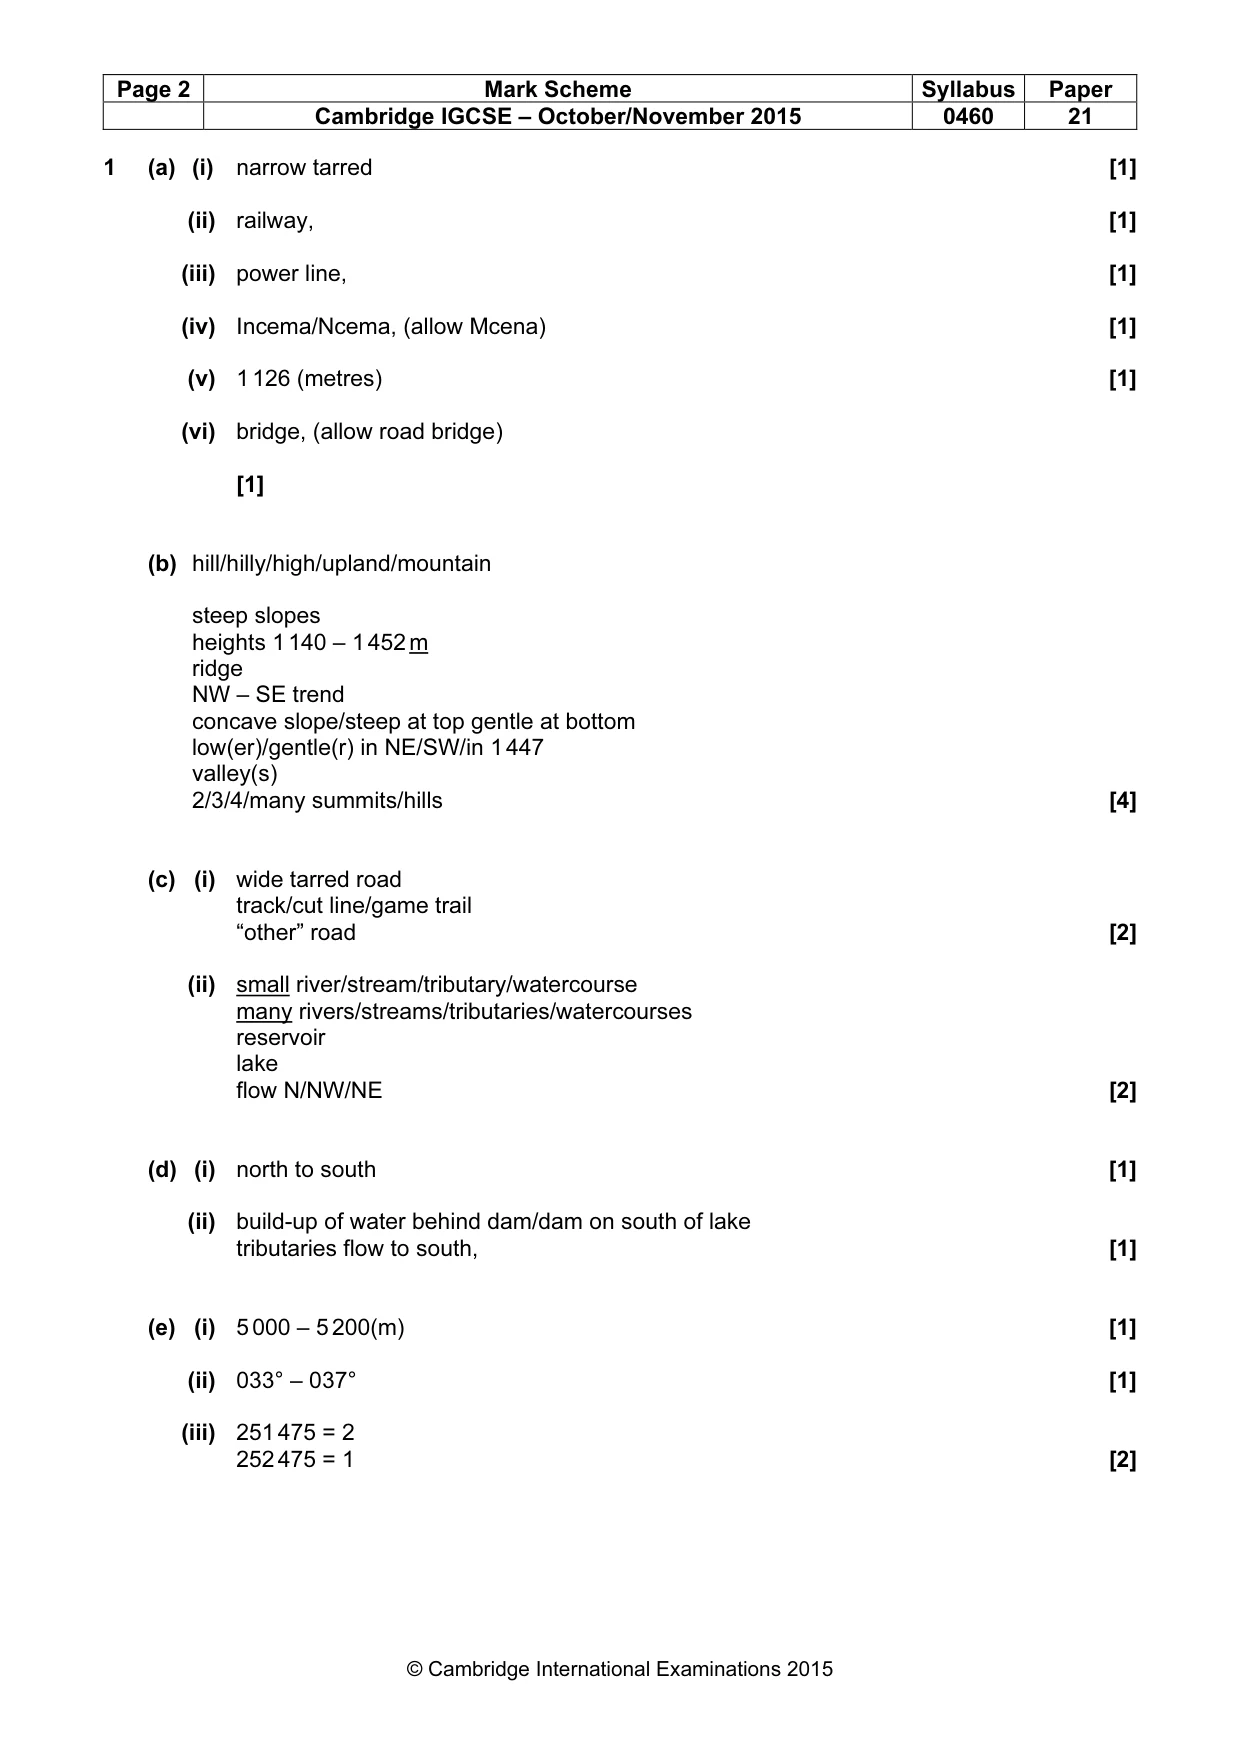
Page 2 Mark Scheme Syllabus Paper Cambridge IGCSE – October/November 2015 0460 21 © Cambridge International Examinations 2015 1 (a) (i) narrow tarred [1] (ii) railway, [1] (iii) power line, [1] (iv) Incema/Ncema, (allow Mcena) [1] (v) 1 126 (metres) [1] (vi) bridge, (allow road bridge) [1] (b) hill/hilly/high/upland/mountain steep slopes heights 1 140 – 1 452 m ridge NW – SE trend concave slope/steep at top gentle at bottom low(er)/gentle(r) in NE/SW/in 1 447 valley(s) 2/3/4/many summits/hills [4] (c) (i) wide tarred road track/cut line/game trail “other” road [2] (ii) small river/stream/tributary/watercourse many rivers/streams/tributaries/watercourses reservoir lake flow N/NW/NE [2] (d) (i) north to south [1] (ii) build-up of water behind dam/dam on south of lake tributaries flow to south, [1] (e) (i) 5 000 – 5 200(m) [1] (ii) 033° – 037° [1] (iii) 251 475 = 2 252 475 = 1 [2]
Mark scheme, page 3
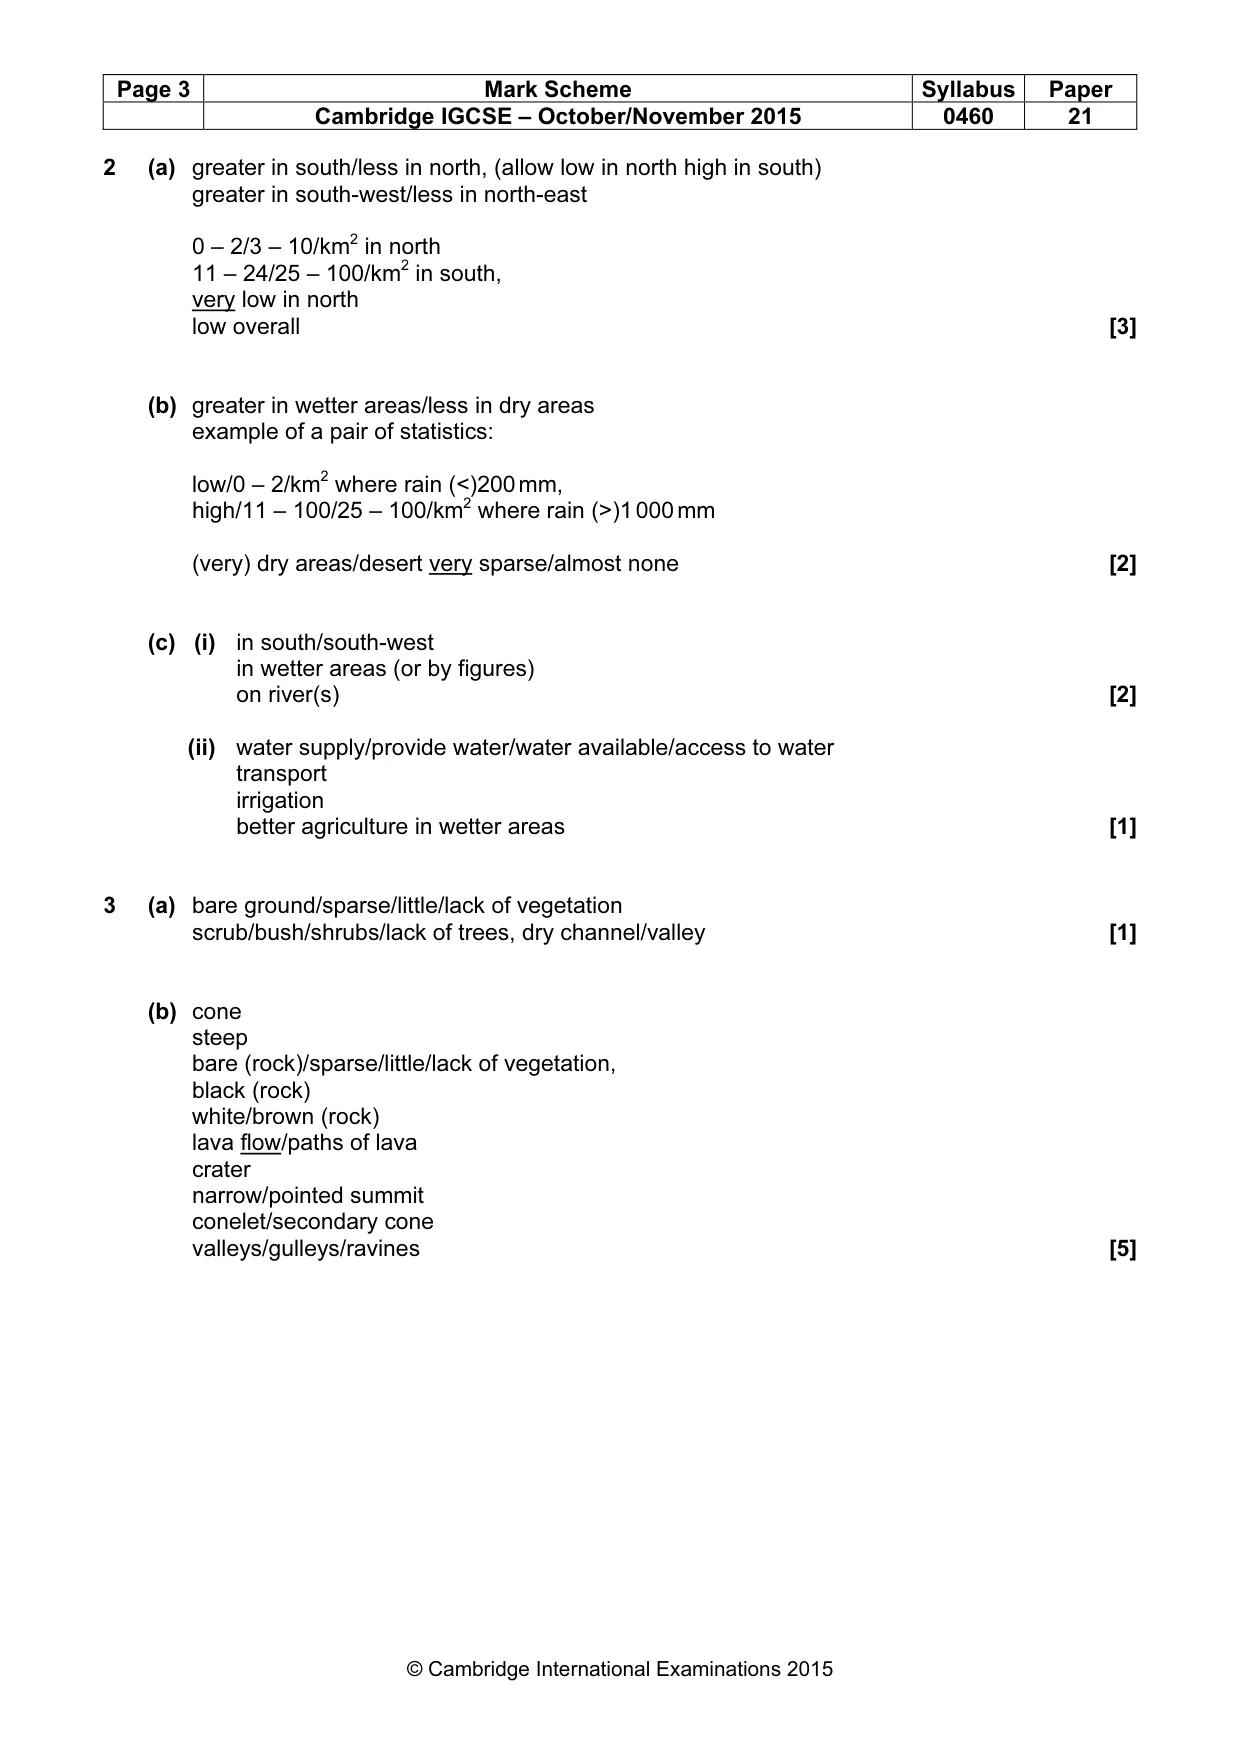
Page 3 Mark Scheme Syllabus Paper Cambridge IGCSE – October/November 2015 0460 21 © Cambridge International Examinations 2015 2 (a) greater in south/less in north, (allow low in north high in south) greater in south-west/less in north-east 0 – 2/3 – 10/km2 in north 11 – 24/25 – 100/km2 in south, very low in north low overall [3] (b) greater in wetter areas/less in dry areas example of a pair of statistics: low/0 – 2/km2 where rain (<)200 mm, high/11 – 100/25 – 100/km2 where rain (>)1 000 mm (very) dry areas/desert very sparse/almost none [2] (c) (i) in south/south-west in wetter areas (or by figures) on river(s) [2] (ii) water supply/provide water/water available/access to water transport irrigation better agriculture in wetter areas [1] 3 (a) bare ground/sparse/little/lack of vegetation scrub/bush/shrubs/lack of trees, dry channel/valley [1] (b) cone steep bare (rock)/sparse/little/lack of vegetation, black (rock) white/brown (rock) lava flow/paths of lava crater narrow/pointed summit conelet/secondary cone valleys/gulleys/ravines [5]
Mark scheme, page 4
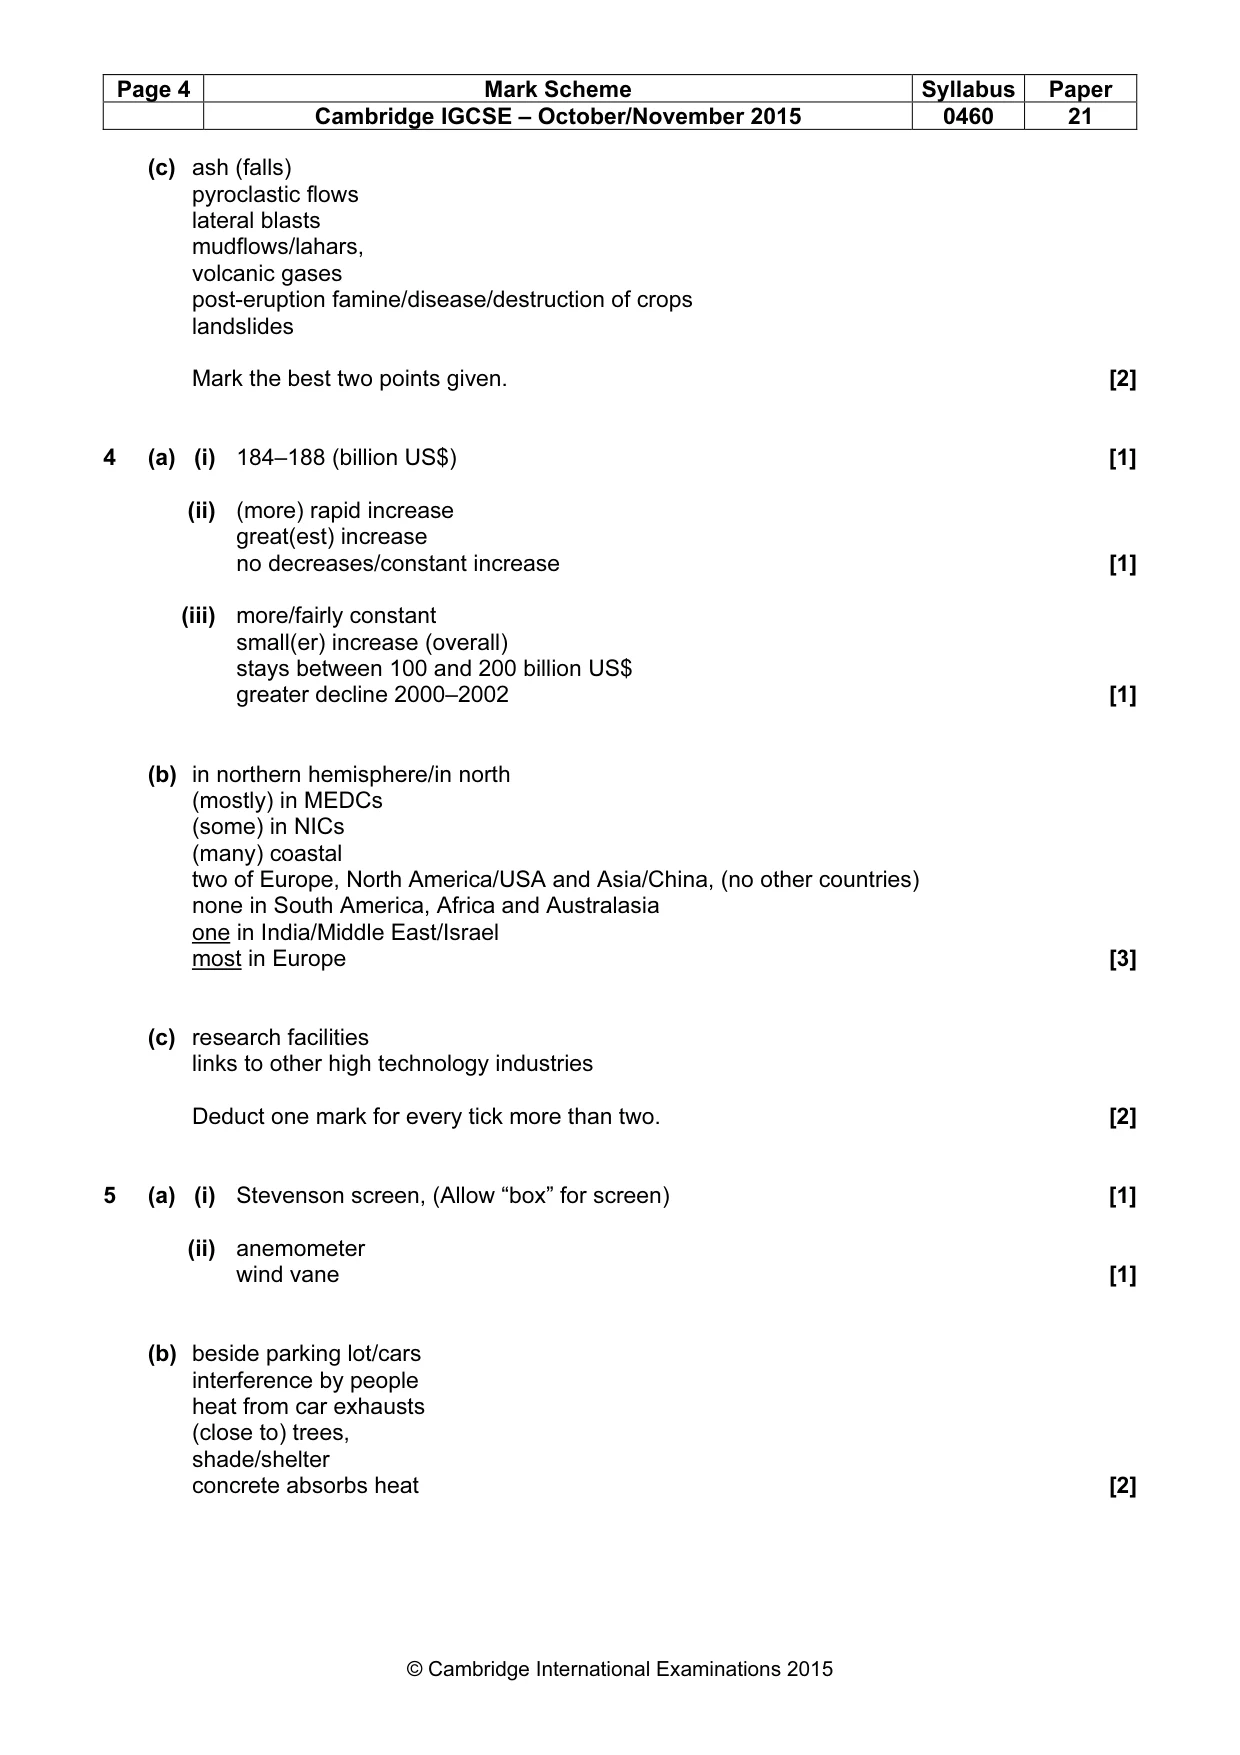
Page 4 Mark Scheme Syllabus Paper Cambridge IGCSE – October/November 2015 0460 21 © Cambridge International Examinations 2015 (c) ash (falls) pyroclastic flows lateral blasts mudflows/lahars, volcanic gases post-eruption famine/disease/destruction of crops landslides Mark the best two points given. [2] 4 (a) (i) 184–188 (billion US$) [1] (ii) (more) rapid increase great(est) increase no decreases/constant increase [1] (iii) more/fairly constant small(er) increase (overall) stays between 100 and 200 billion US$ greater decline 2000–2002 [1] (b) in northern hemisphere/in north (mostly) in MEDCs (some) in NICs (many) coastal two of Europe, North America/USA and Asia/China, (no other countries) none in South America, Africa and Australasia one in India/Middle East/Israel most in Europe [3] (c) research facilities links to other high technology industries Deduct one mark for every tick more than two. [2] 5 (a) (i) Stevenson screen, (Allow “box” for screen) [1] (ii) anemometer wind vane [1] (b) beside parking lot/cars interference by people heat from car exhausts (close to) trees, shade/shelter concrete absorbs heat [2]
Mark scheme, page 5
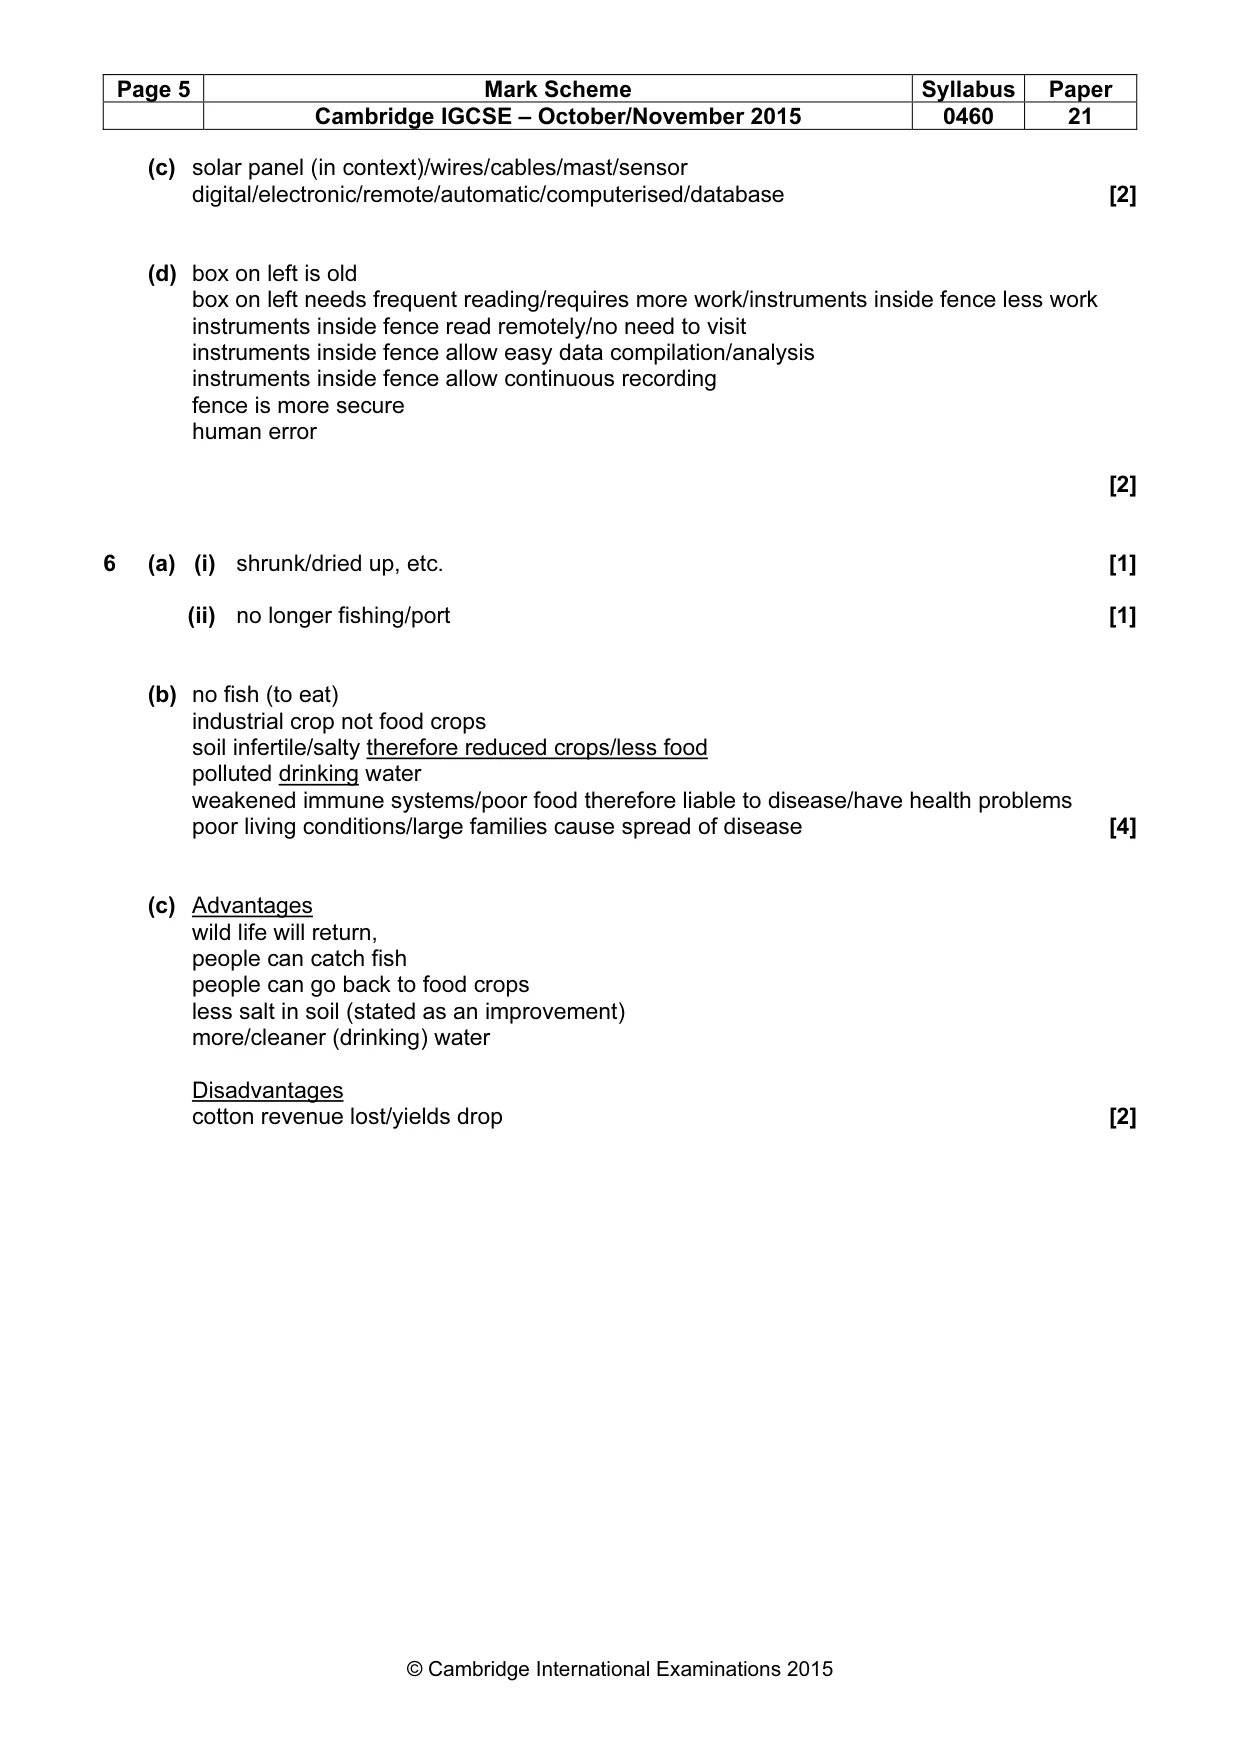
Page 5 Mark Scheme Syllabus Paper Cambridge IGCSE – October/November 2015 0460 21 © Cambridge International Examinations 2015 (c) solar panel (in context)/wires/cables/mast/sensor digital/electronic/remote/automatic/computerised/database [2] (d) box on left is old box on left needs frequent reading/requires more work/instruments inside fence less work instruments inside fence read remotely/no need to visit instruments inside fence allow easy data compilation/analysis instruments inside fence allow continuous recording fence is more secure human error [2] 6 (a) (i) shrunk/dried up, etc. [1] (ii) no longer fishing/port [1] (b) no fish (to eat) industrial crop not food crops soil infertile/salty therefore reduced crops/less food polluted drinking water weakened immune systems/poor food therefore liable to disease/have health problems poor living conditions/large families cause spread of disease [4] (c) Advantages wild life will return, people can catch fish people can go back to food crops less salt in soil (stated as an improvement) more/cleaner (drinking) water Disadvantages cotton revenue lost/yields drop [2]
What you needed in this session
Cambridge’s own grade thresholds for 2015 Oct/Nov, Paper 2 · Variant 1. A higher threshold means an easier paper — the bar moves with how the cohort did.