Cambridge IGCSE Geography 0460 — 2014 May/June Paper 2 · Variant 2
0460/22/M/J/14 · 60 marks · ≈68 min
The question paper and its mark scheme, free to read here and free to download. This is Cambridge’s own paper, exactly as it was sat.
Question paper16 pages



Mark scheme5 pages
Answers below. Sit the paper first if you are practising.
Paper as text
Question paper, page 1
This document consists of 15 printed pages, 1 blank page and 1 Insert. DC (LK/CGW) 79515/7 © UCLES 2014 [Turn over Cambridge International Examinations Cambridge International General Certificate of Secondary Education * 6 5 1 9 6 9 5 7 6 1 * GEOGRAPHY 0460/22 Paper 2 May/June 2014 1 hour 30 minutes Candidates answer on the Question Paper. Additional Materials: Ruler Protractor Plain paper Calculator 1:50 000 Survey Map Extract is enclosed with this Question Paper. READ THESE INSTRUCTIONS FIRST Write your Centre number, candidate number and name in the spaces provided. Write in dark blue or black pen. You may use an HB pencil for any diagrams or graphs. Do not use staples, paper clips, glue or correction fluid. DO NOT WRITE IN ANY BARCODES. Answer all questions. The Insert contains Photograph A for Question 3 and Photograph B for Question 4. The Survey Map Extract and the Insert are not required by the Examiner. Sketch maps and diagrams should be drawn whenever they serve to illustrate an answer. At the end of the examination, fasten all your work securely together. The number of marks is given in brackets [ ] at the end of each question or part question. The syllabus is approved for use in England, Wales and Northern Ireland as a Cambridge International Level 1/Level 2 Certificate.
Question paper, page 2
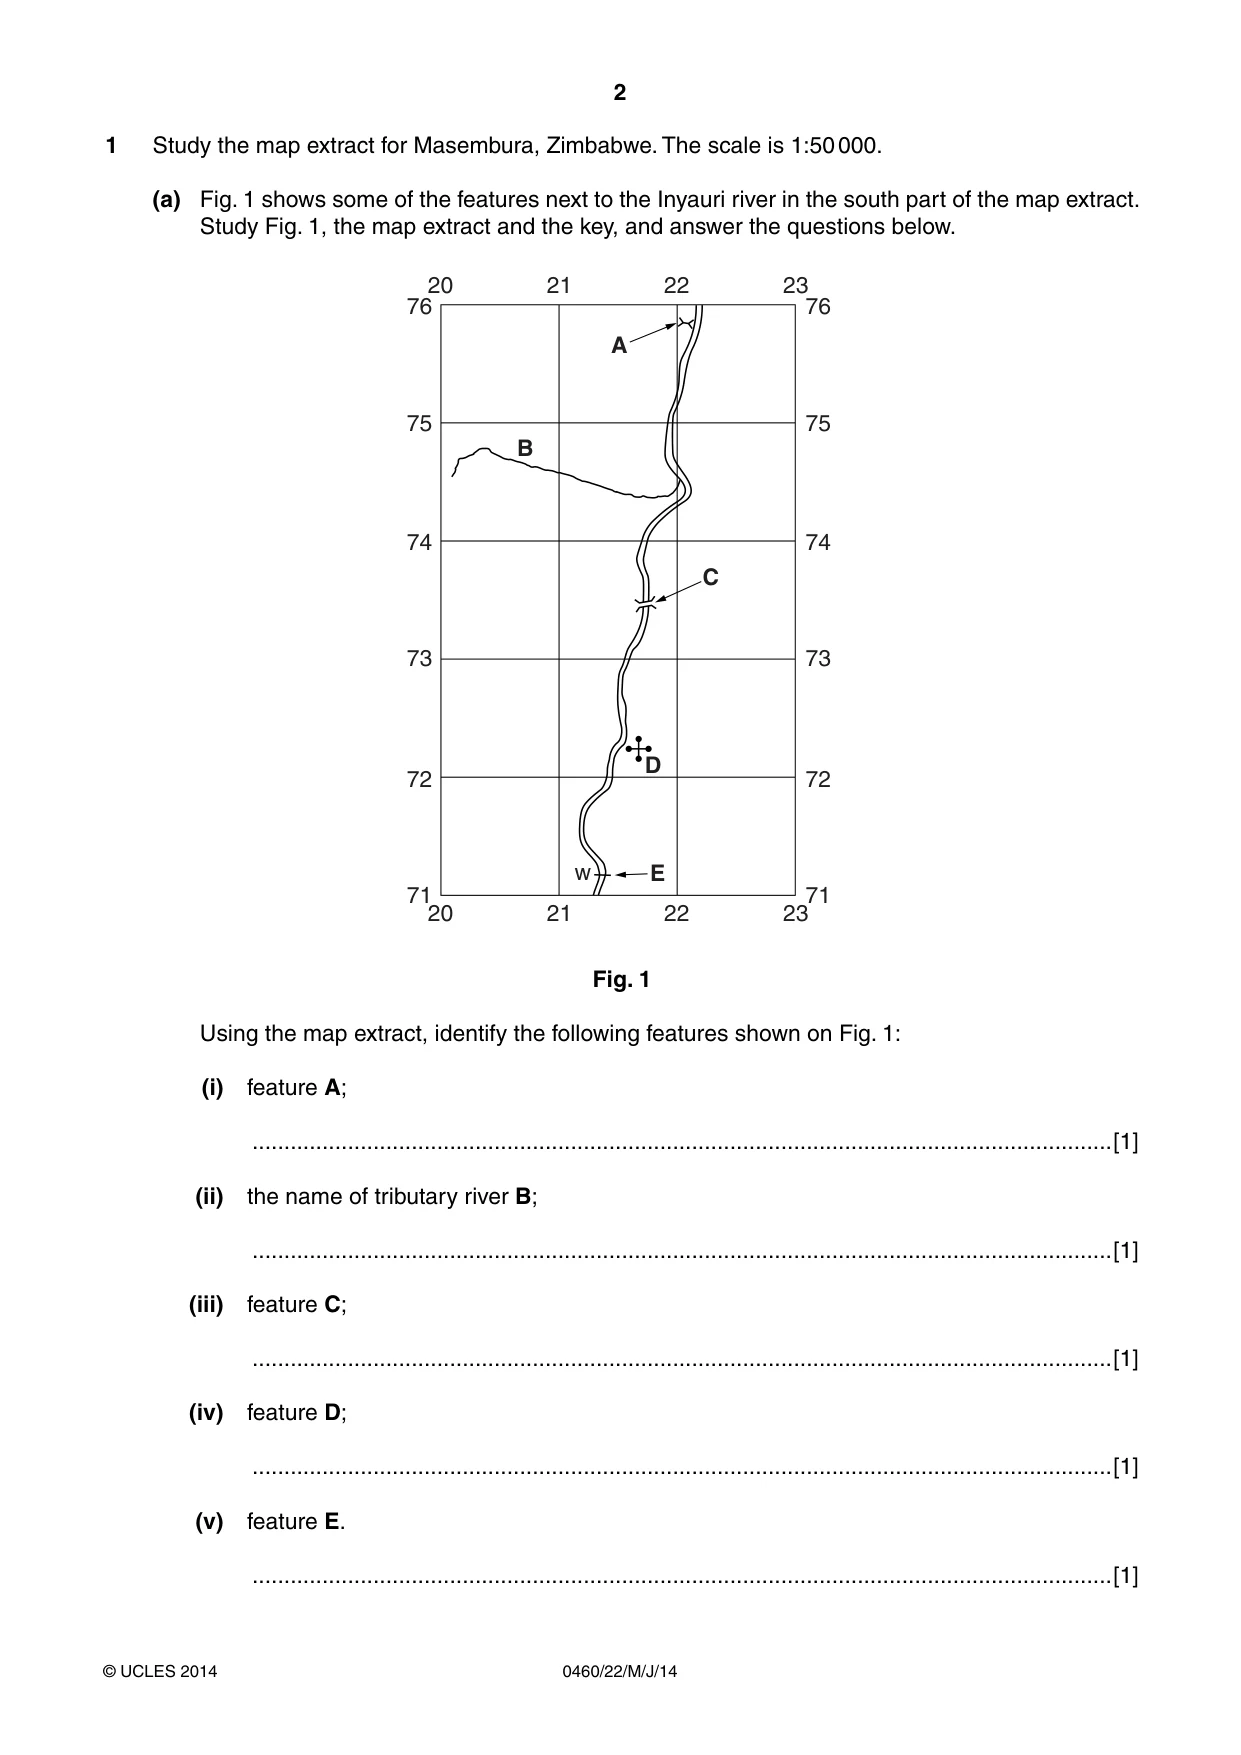
2 0460/22/M/J/14 © UCLES 2014 1 Study the map extract for Masembura, Zimbabwe. The scale is 1:50 000. (a) Fig. 1 shows some of the features next to the Inyauri river in the south part of the map extract. Study Fig. 1, the map extract and the key, and answer the questions below. 21 20 23 22 21 20 23 71 72 73 74 75 76 A B C D E 71 72 73 w 74 75 76 22 Fig. 1 Using the map extract, identify the following features shown on Fig. 1: (i) feature A; …[1] (ii) the name of tributary river B; …[1] (iii) feature C; …[1] (iv) feature D; …[1] (v) feature E. …[1]
Question paper, page 3
3 0460/22/M/J/14 © UCLES 2014 [Turn over (b) Look at the Inyauri river from the southern edge of the map to where it joins the Pote river. Describe the physical (natural) features of the river. … … … … … … … … … …[5]
Question paper, page 4
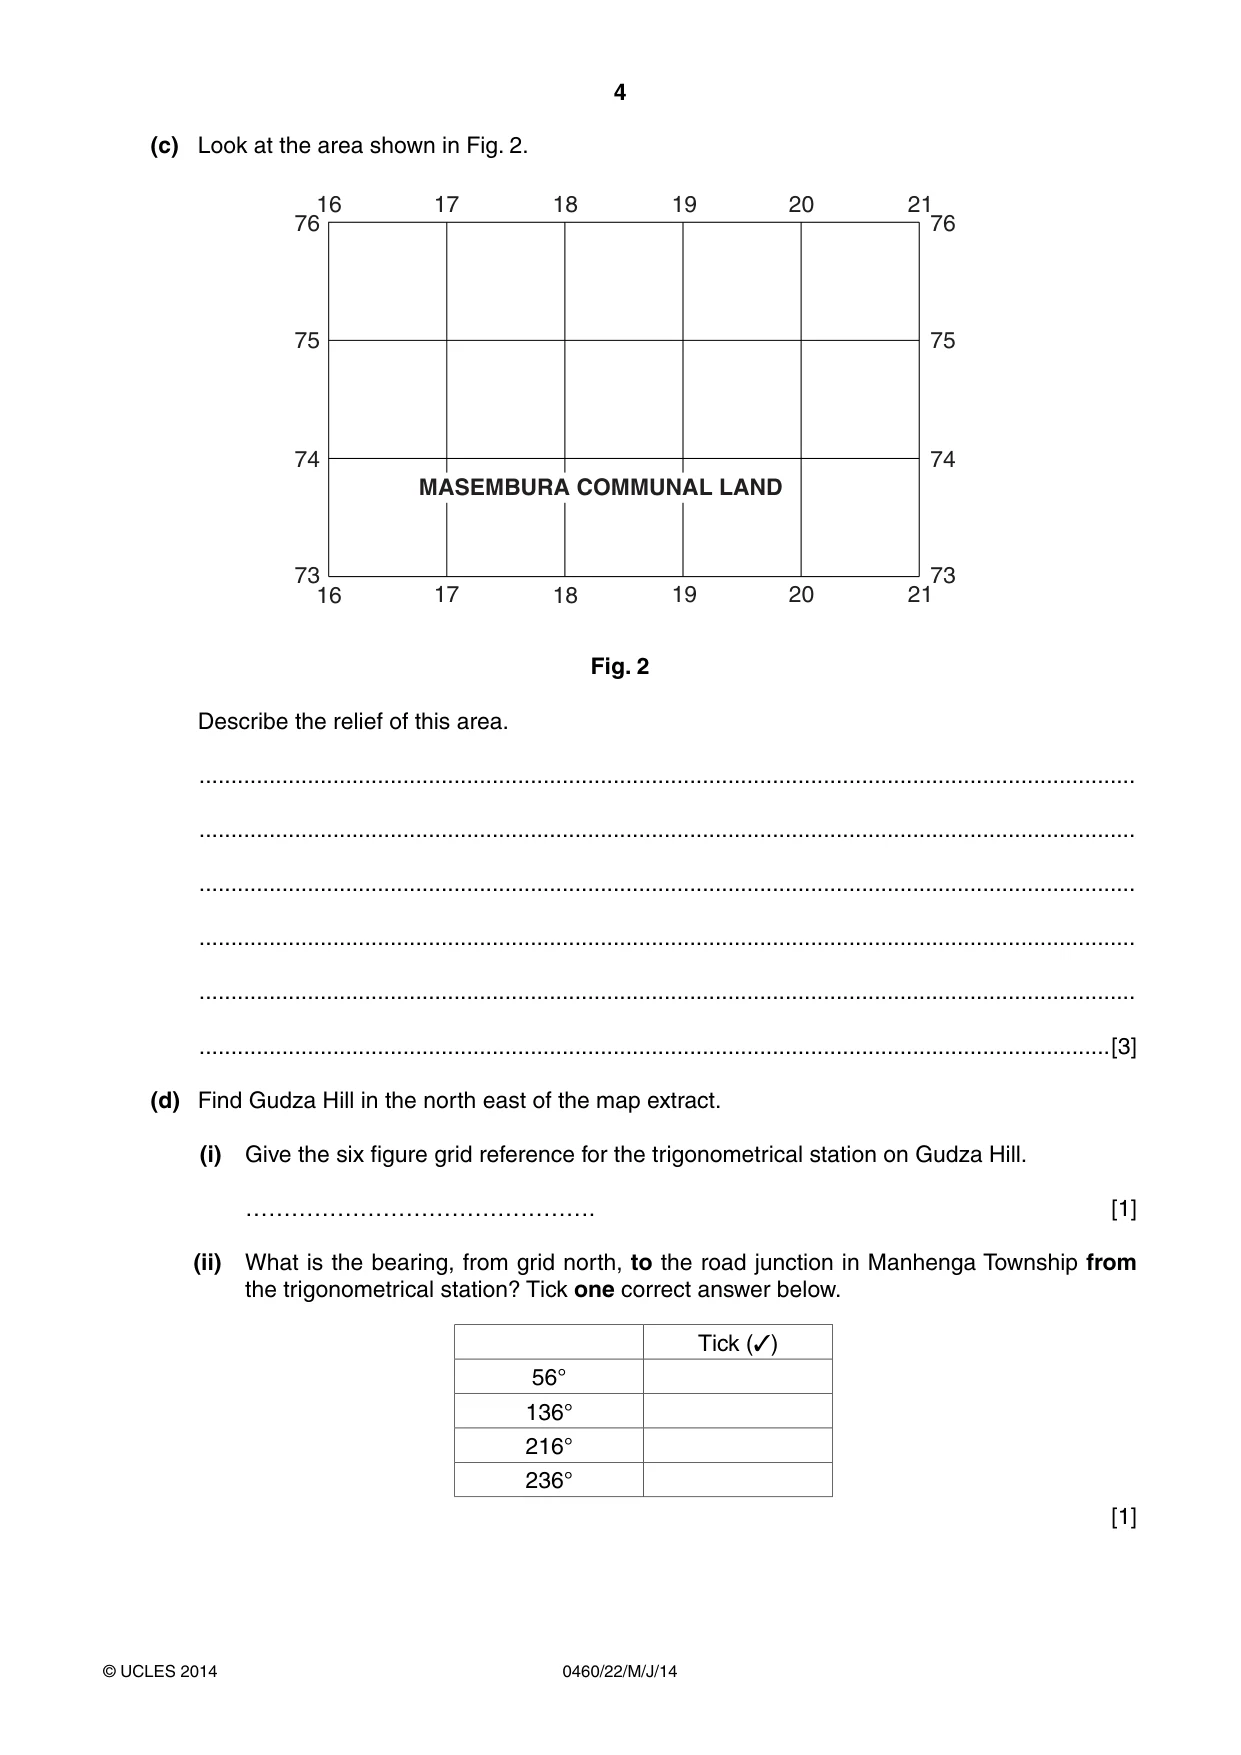
4 0460/22/M/J/14 © UCLES 2014 (c) Look at the area shown in Fig. 2. 16 18 73 74 75 76 73 74 75 76 17 19 21 20 16 18 17 19 21 20 MASEMBURA COMMUNAL LAND Fig. 2 Describe the relief of this area. … … … … … …[3] (d) Find Gudza Hill in the north east of the map extract. (i) Give the six figure grid reference for the trigonometrical station on Gudza Hill. ………………………………………. [1] (ii) What is the bearing, from grid north, to the road junction in Manhenga Township from the trigonometrical station? Tick one correct answer below. Tick (✓) 56° 136° 216° 236° [1]
Question paper, page 5
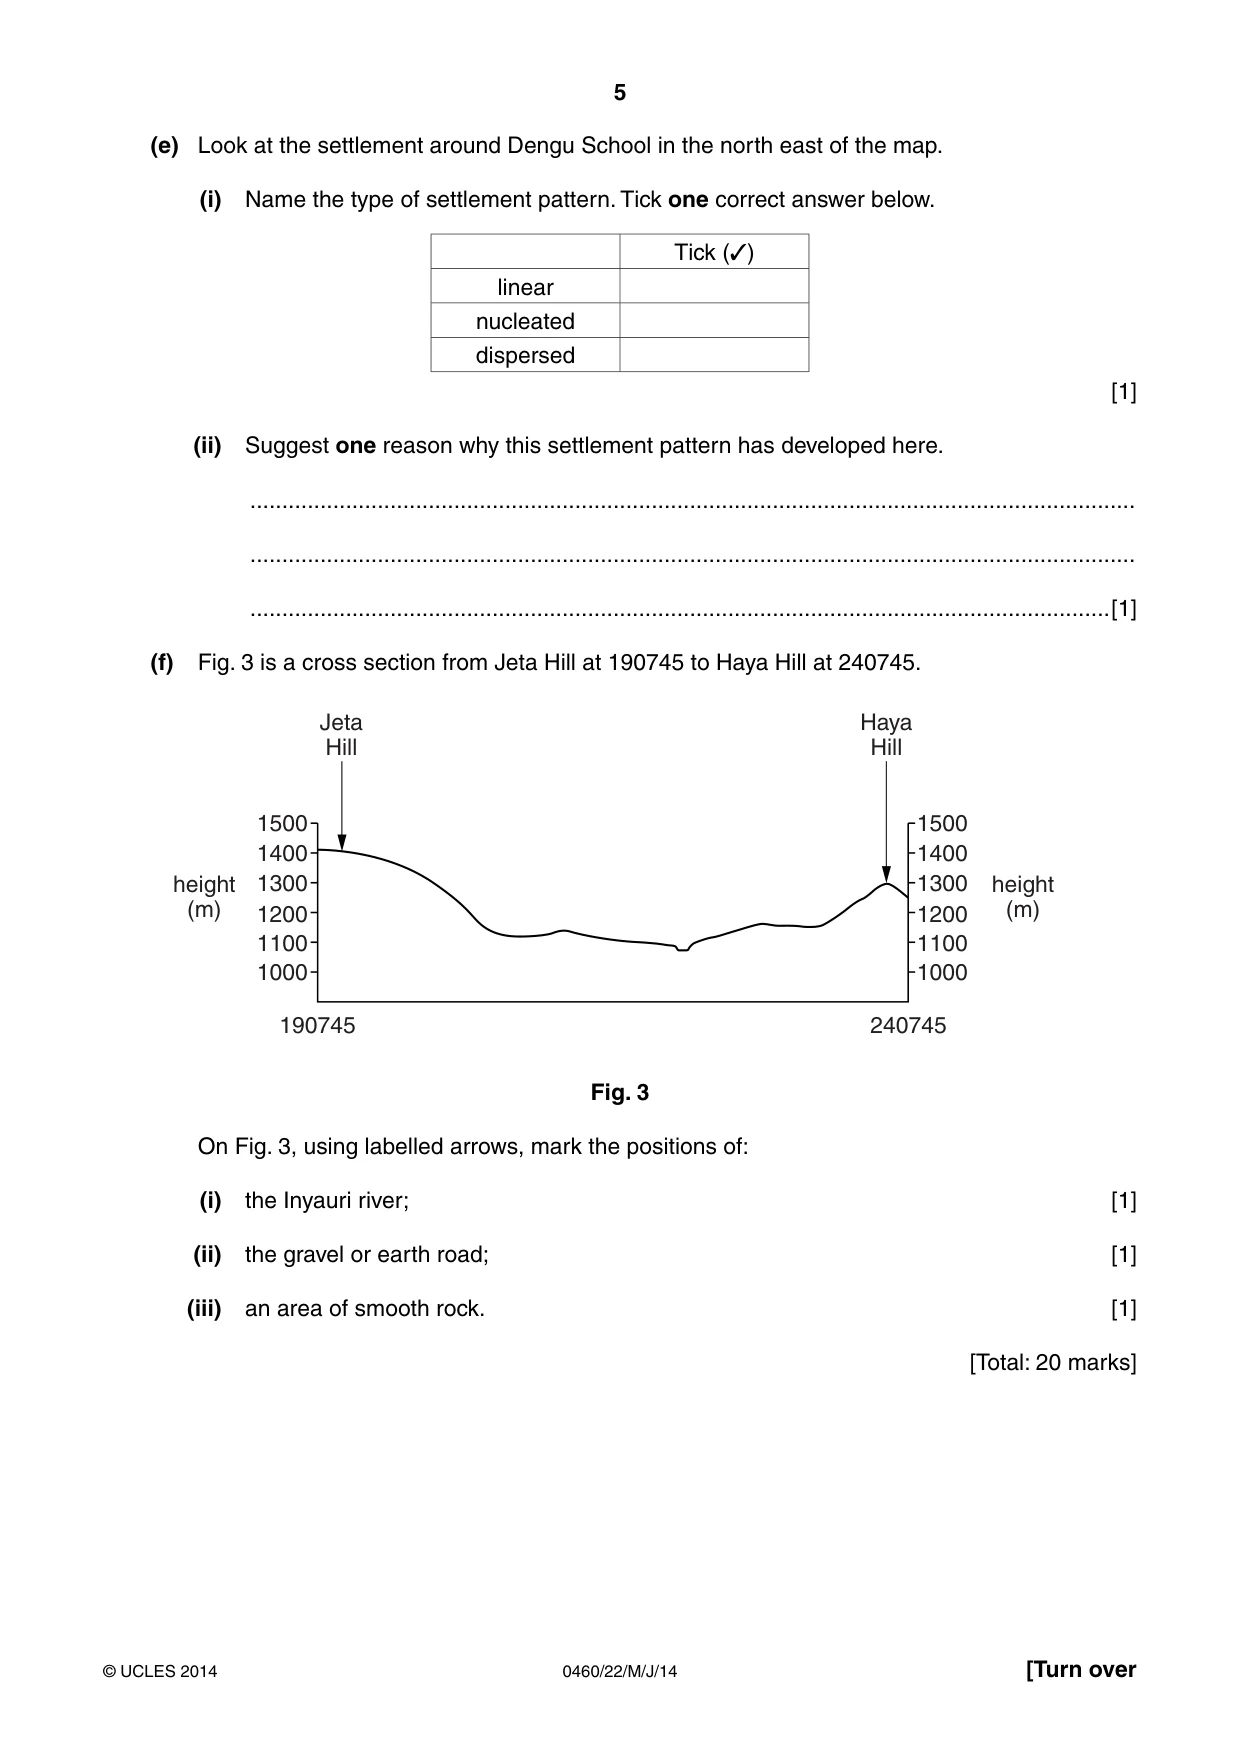
5 0460/22/M/J/14 © UCLES 2014 [Turn over (e) Look at the settlement around Dengu School in the north east of the map. (i) Name the type of settlement pattern. Tick one correct answer below. Tick (✓) linear nucleated dispersed [1] (ii) Suggest one reason why this settlement pattern has developed here. … … …[1] (f) Fig. 3 is a cross section from Jeta Hill at 190745 to Haya Hill at 240745. Jeta Hill 1500 1400 1300 1200 1100 1000 1500 1400 1300 1200 height (m) height (m) 1100 1000 190745 240745 Haya Hill Fig. 3 On Fig. 3, using labelled arrows, mark the positions of: (i) the Inyauri river; [1] (ii) the gravel or earth road; [1] (iii) an area of smooth rock. [1] [Total: 20 marks]
Question paper, page 6
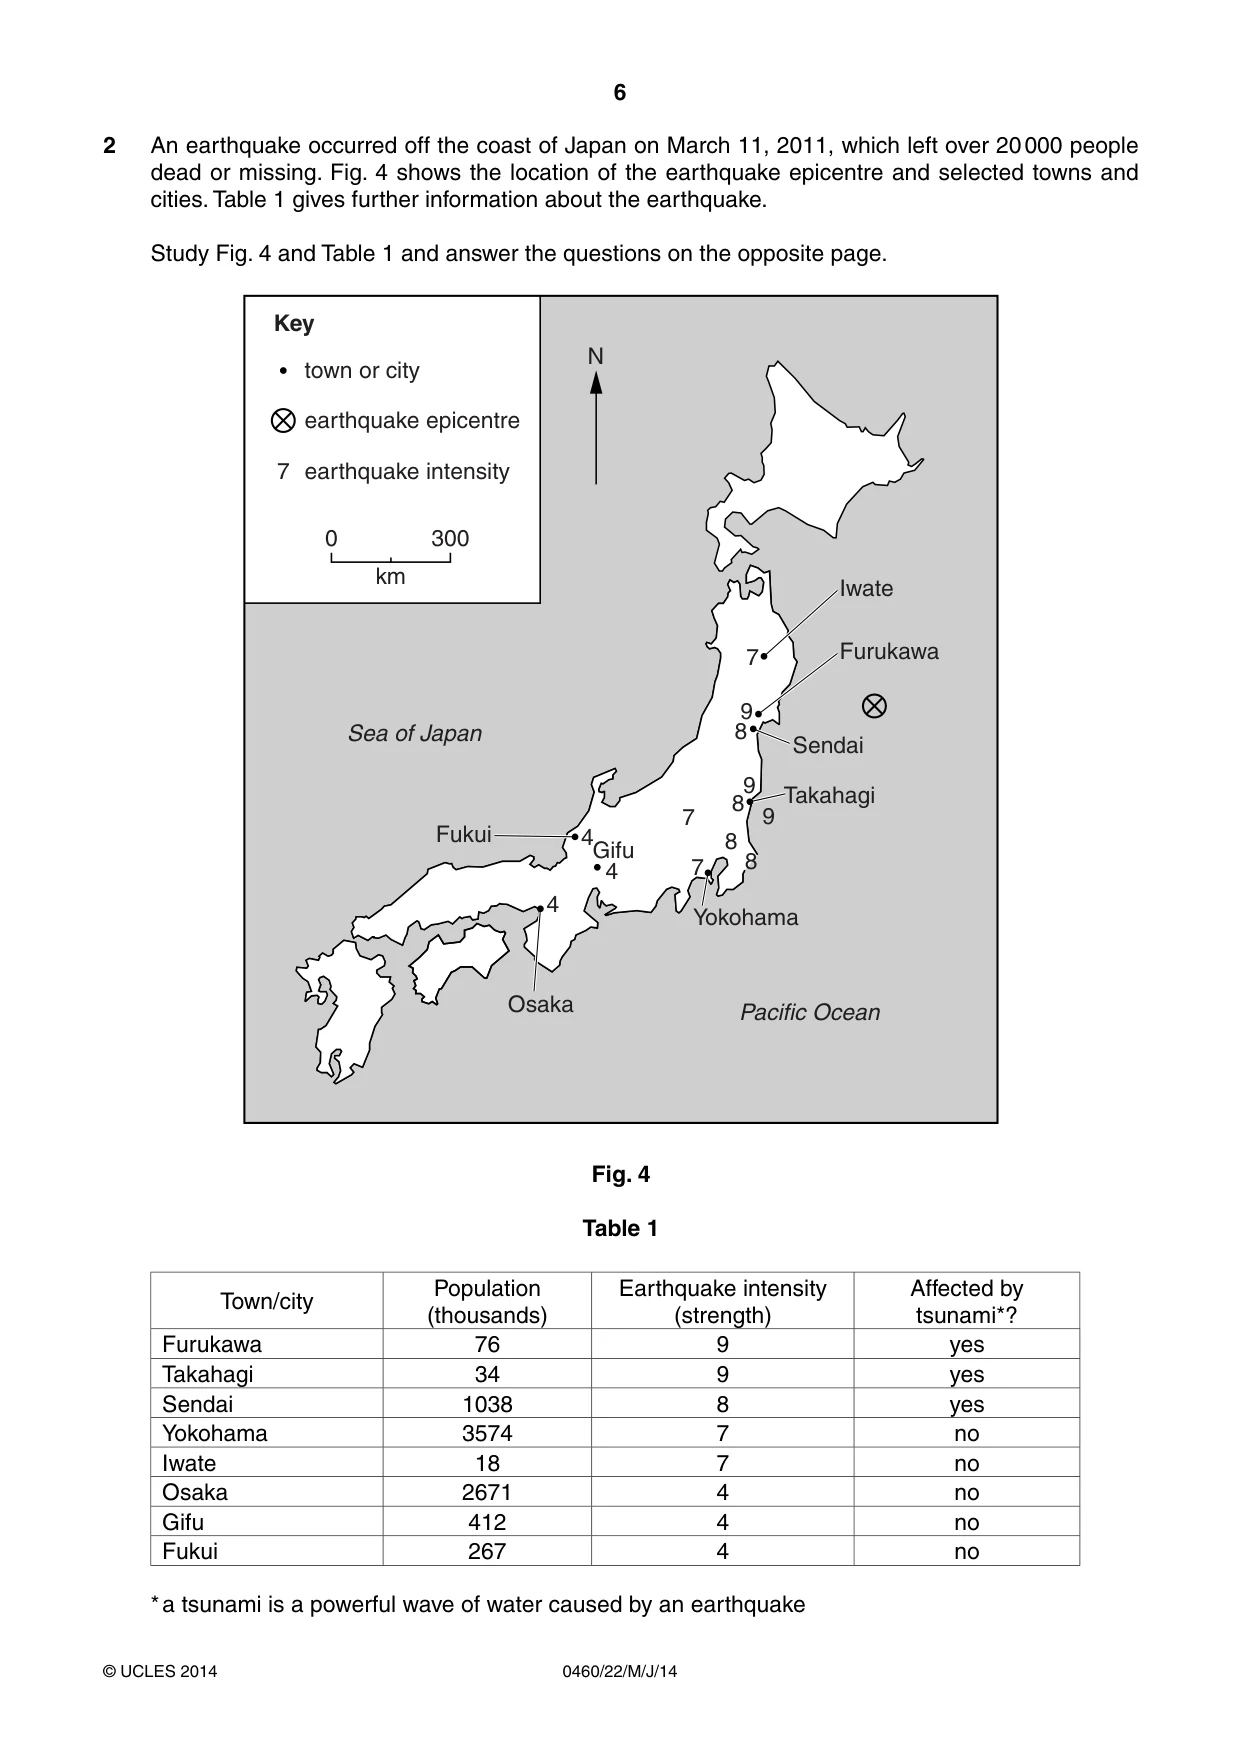
6 0460/22/M/J/14 © UCLES 2014 2 An earthquake occurred off the coast of Japan on March 11, 2011, which left over 20 000 people dead or missing. Fig. 4 shows the location of the earthquake epicentre and selected towns and cities. Table 1 gives further information about the earthquake. Study Fig. 4 and Table 1 and answer the questions on the opposite page. Key town or city N Sea of Japan Pacific Ocean earthquake epicentre earthquake intensity 7 0 300 Fukui Osaka Yokohama Takahagi Sendai Furukawa Iwate Gifu 4 4 4 7 7 7 9 9 9 8 8 8 8 km Fig. 4 Table 1 Town/city Population (thousands) Earthquake intensity (strength) Affected by tsunami*? Furukawa 76 9 yes Takahagi 34 9 yes Sendai 1038 8 yes Yokohama 3574 7 no Iwate 18 7 no Osaka 2671 4 no Gifu 412 4 no Fukui 267 4 no * a tsunami is a powerful wave of water caused by an earthquake
Question paper, page 7
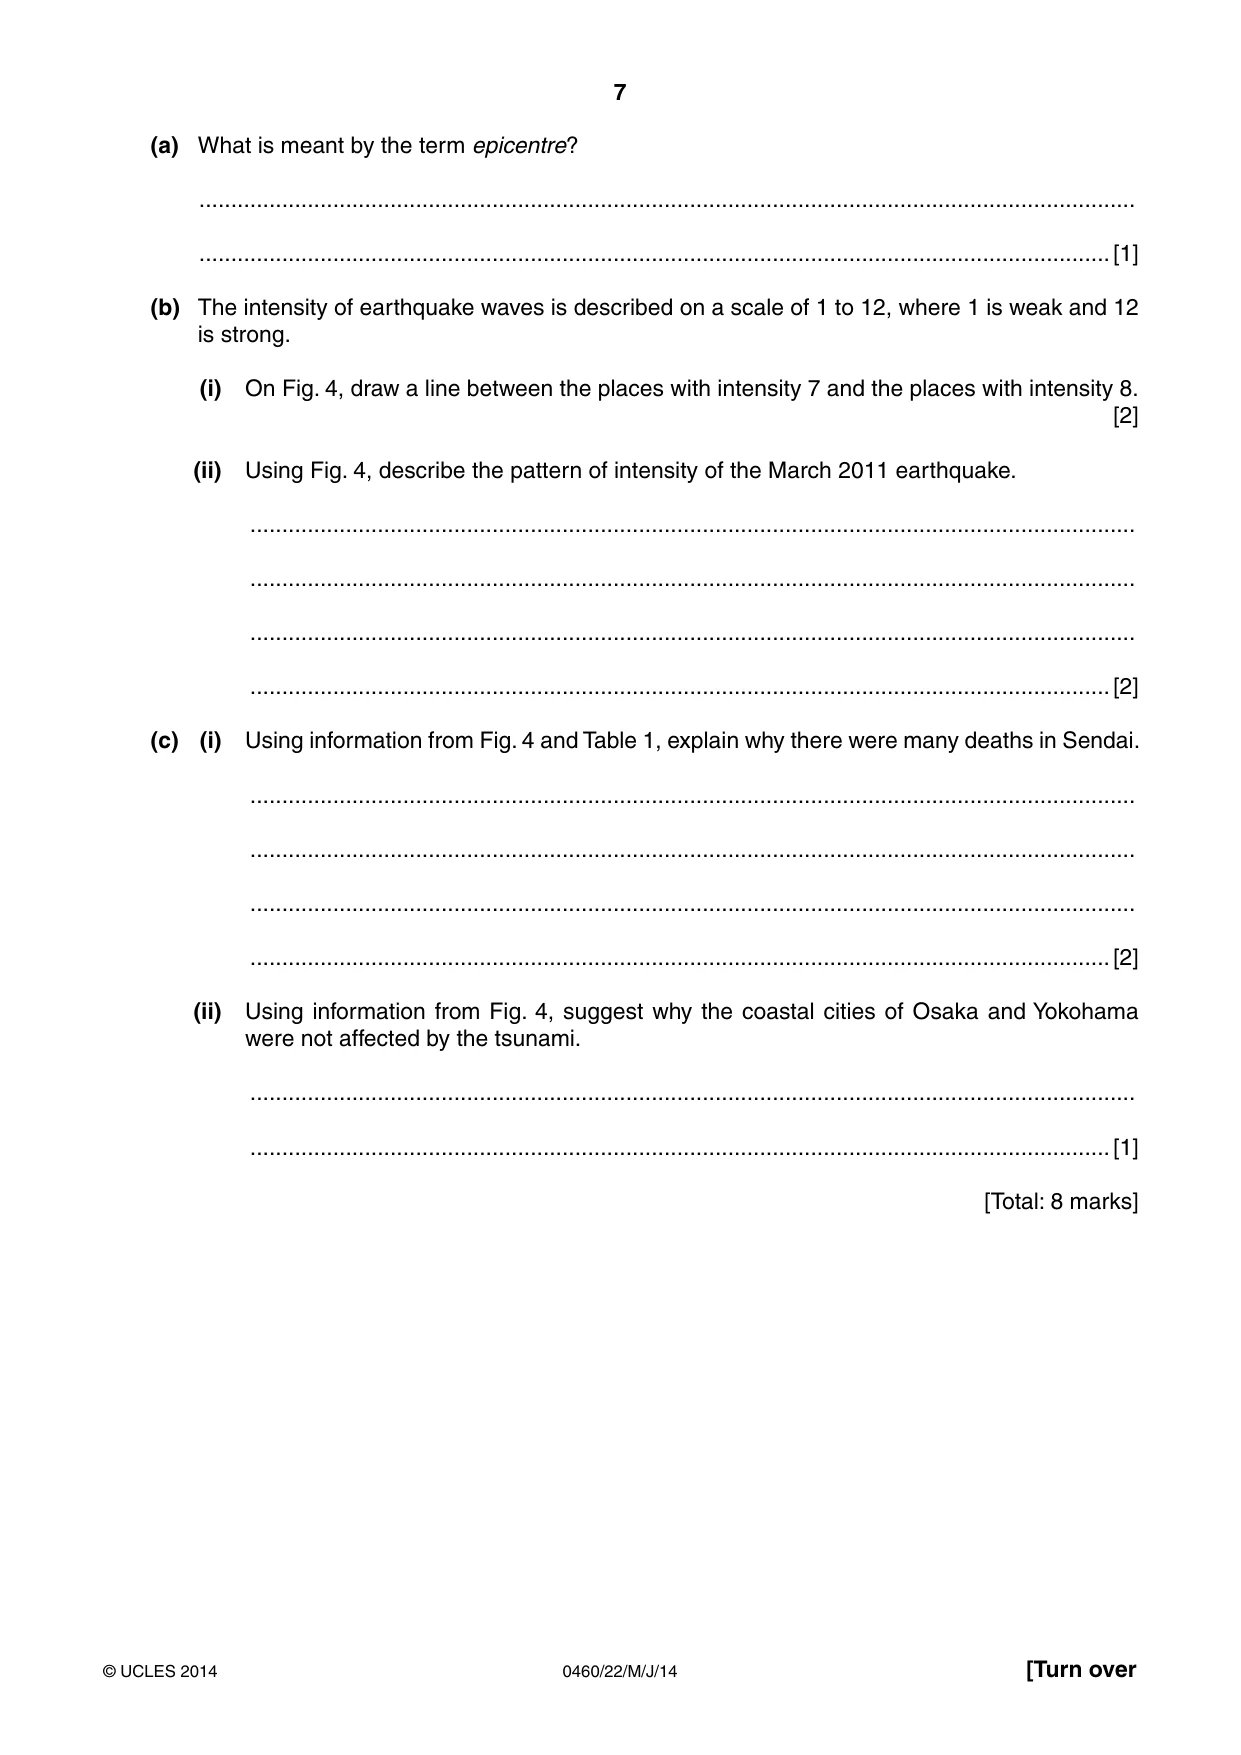
7 0460/22/M/J/14 © UCLES 2014 [Turn over (a) What is meant by the term epicentre? … …[1] (b) The intensity of earthquake waves is described on a scale of 1 to 12, where 1 is weak and 12 is strong. (i) On Fig. 4, draw a line between the places with intensity 7 and the places with intensity 8. [2] (ii) Using Fig. 4, describe the pattern of intensity of the March 2011 earthquake. … … … …[2] (c) (i) Using information from Fig. 4 and Table 1, explain why there were many deaths in Sendai. … … … …[2] (ii) Using information from Fig. 4, suggest why the coastal cities of Osaka and Yokohama were not affected by the tsunami. … …[1] [Total: 8 marks]
Question paper, page 8
8 0460/22/M/J/14 © UCLES 2014 3 (a) Study Photograph A (Insert), which shows an area in south west Africa. Describe the relief and vegetation shown in the photograph. Relief… … … … … … … … Vegetation … … … … … … … [6]
Question paper, page 9
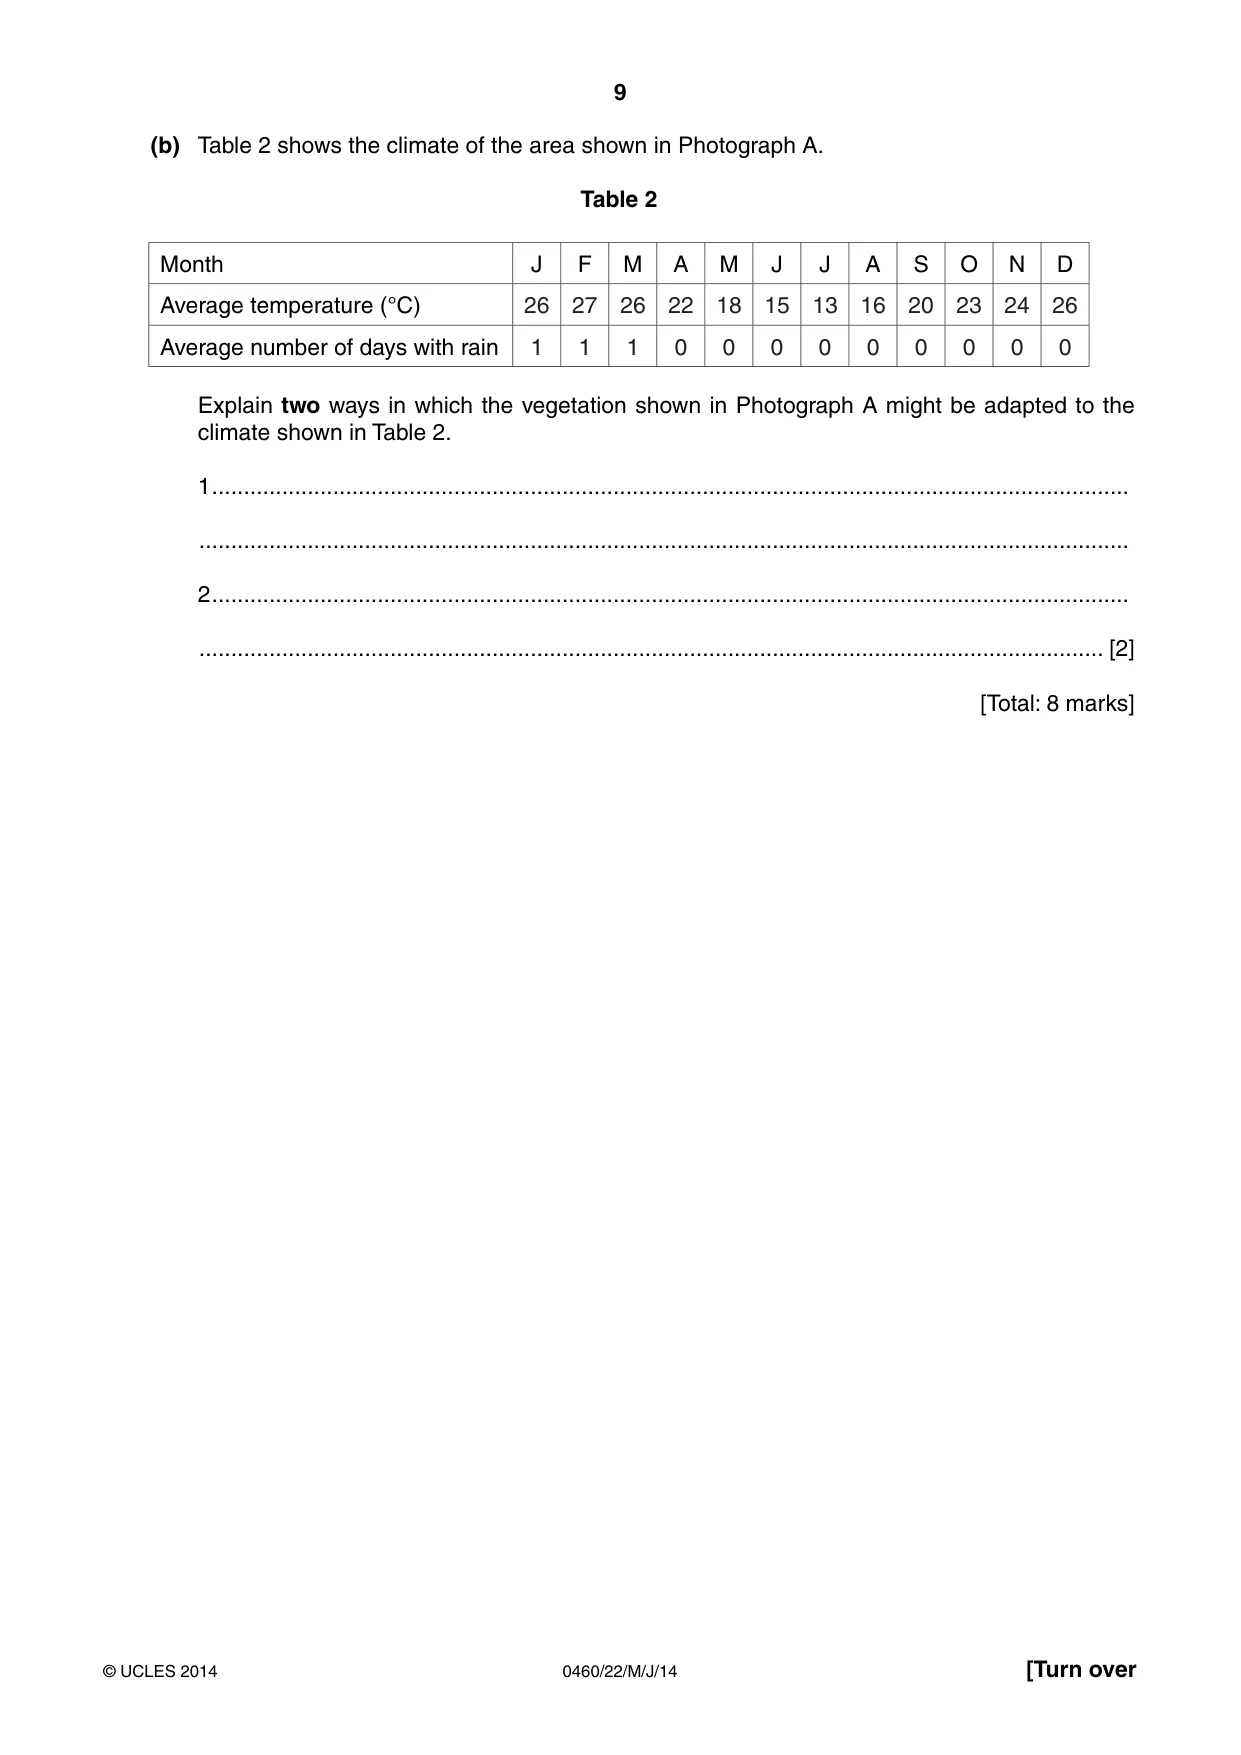
9 0460/22/M/J/14 © UCLES 2014 [Turn over (b) Table 2 shows the climate of the area shown in Photograph A. Table 2 Month J F M A M J J A S O N D Average temperature (°C) 26 27 26 22 18 15 13 16 20 23 24 26 Average number of days with rain 1 1 1 0 0 0 0 0 0 0 0 0 Explain two ways in which the vegetation shown in Photograph A might be adapted to the climate shown in Table 2. 1 … … 2 … … [2] [Total: 8 marks]
Question paper, page 10
10 0460/22/M/J/14 © UCLES 2014 BLANK PAGE
Question paper, page 11
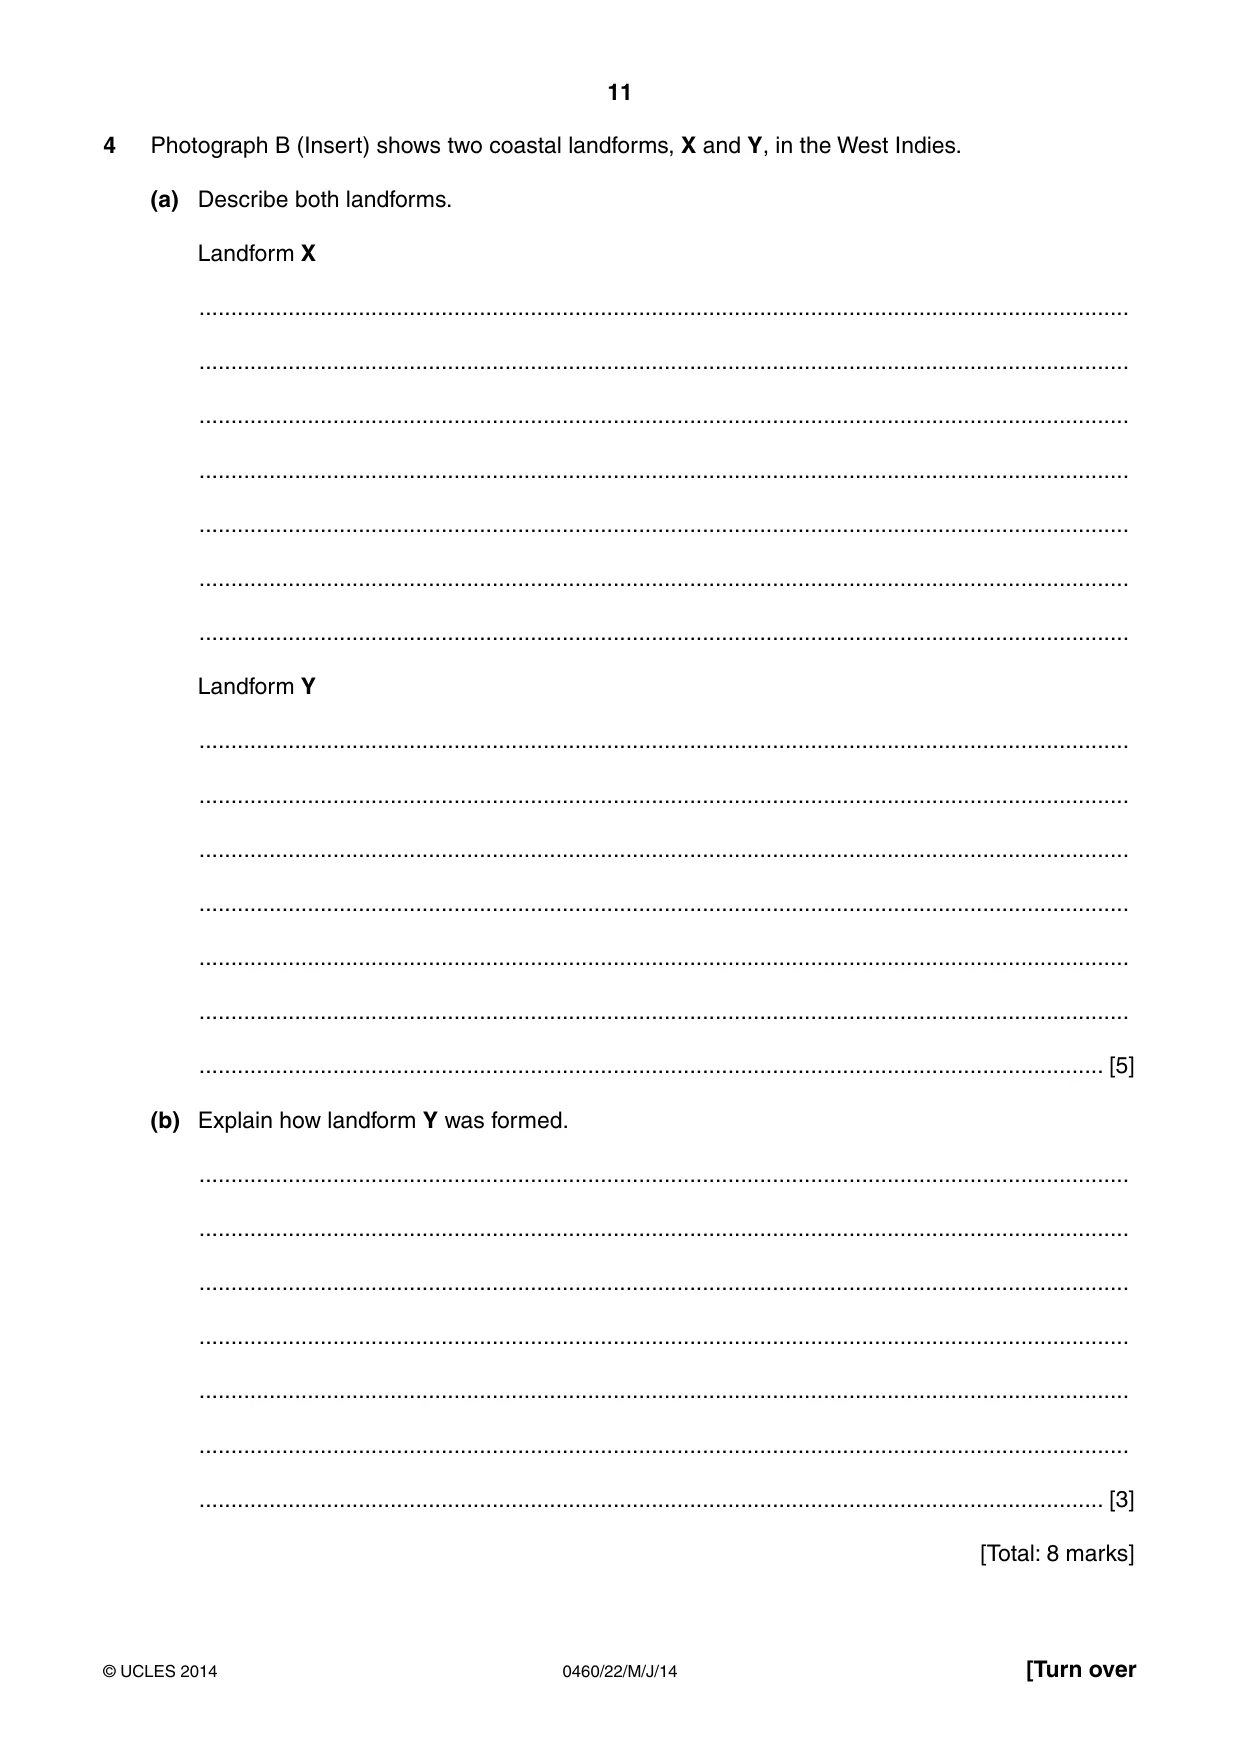
11 0460/22/M/J/14 © UCLES 2014 [Turn over 4 Photograph B (Insert) shows two coastal landforms, X and Y, in the West Indies. (a) Describe both landforms. Landform X … … … … … … … Landform Y … … … … … … … [5] (b) Explain how landform Y was formed. … … … … … … … [3] [Total: 8 marks]
Question paper, page 12
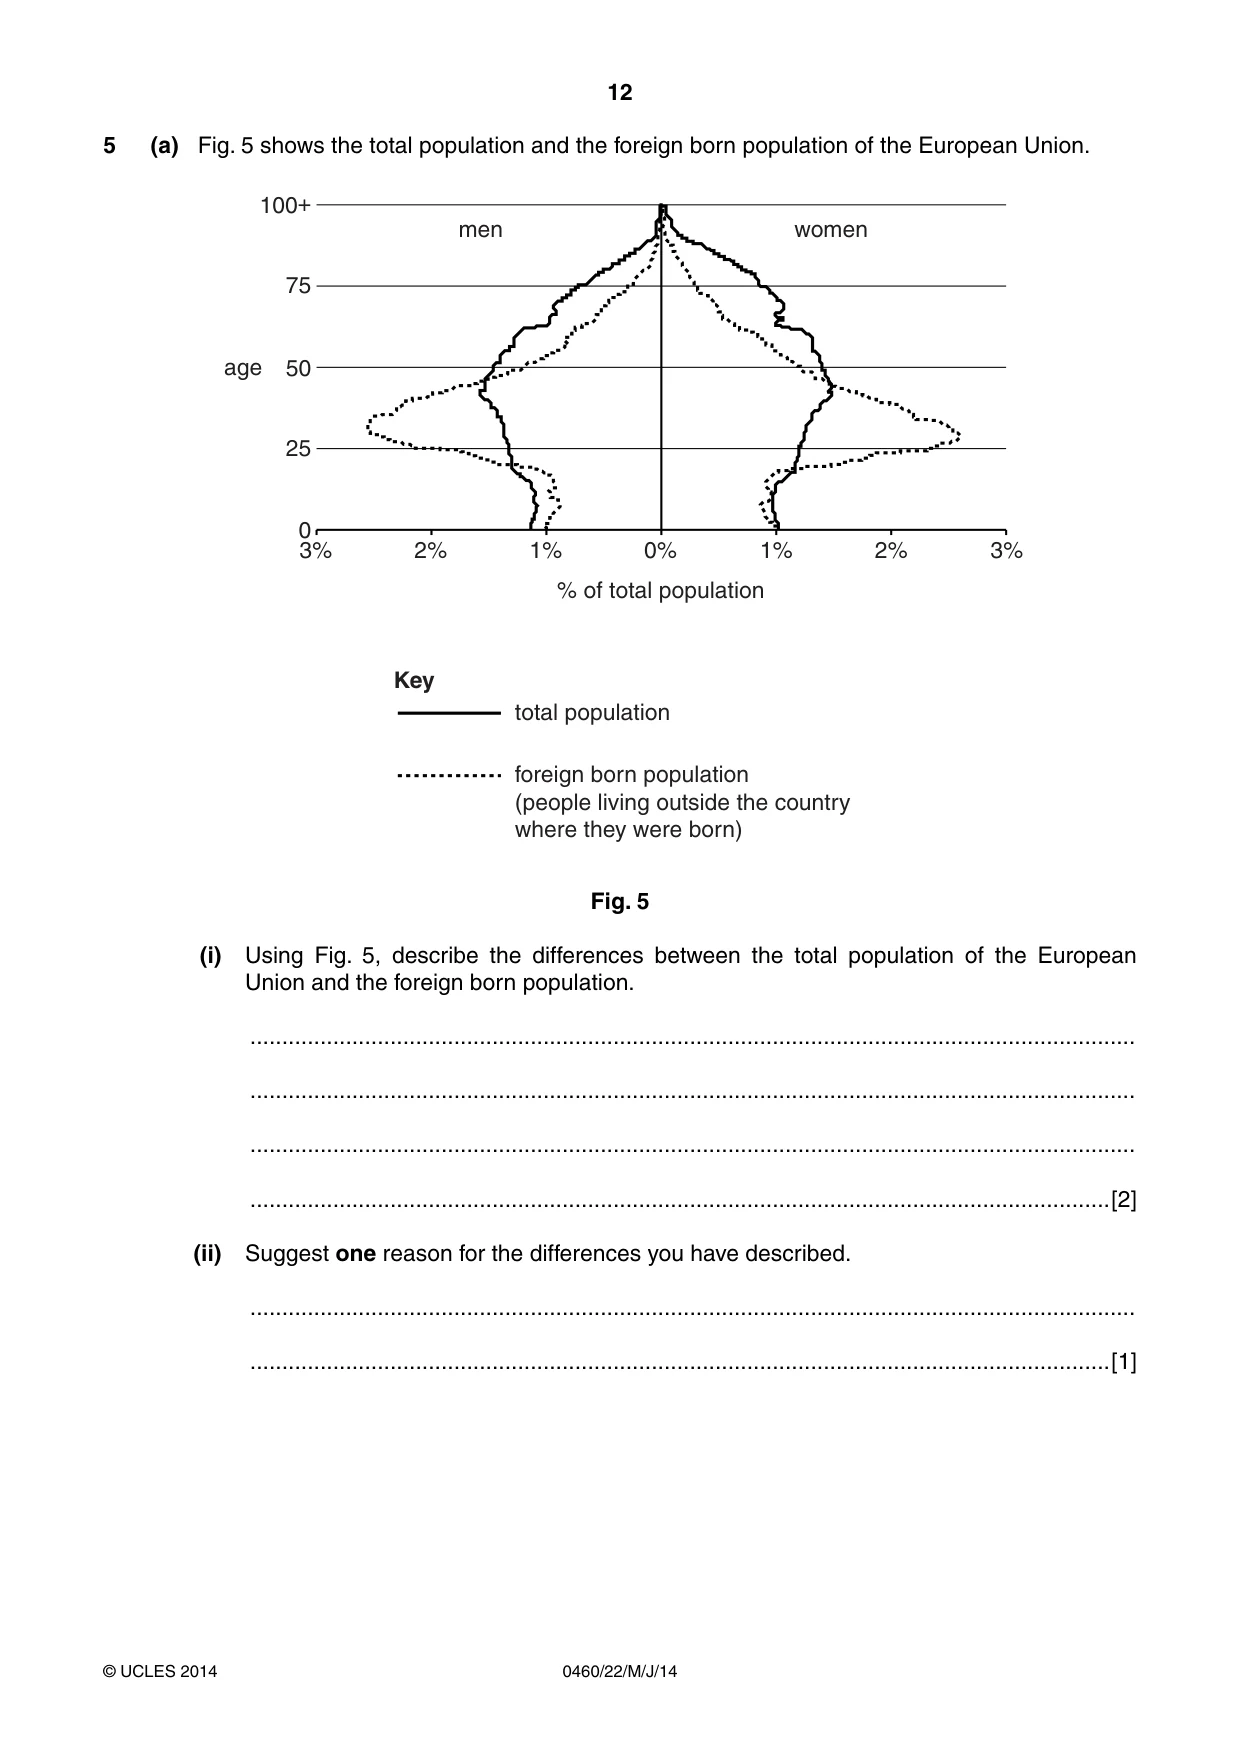
12 0460/22/M/J/14 © UCLES 2014 5 (a) Fig. 5 shows the total population and the foreign born population of the European Union. 100+ age 75 50 25 3% 2% men women Key total population foreign born population (people living outside the country where they were born) 1% 0% % of total population 1% 3% 2% 0 Fig. 5 (i) Using Fig. 5, describe the differences between the total population of the European Union and the foreign born population. … … … …[2] (ii) Suggest one reason for the differences you have described. … …[1]
Question paper, page 13
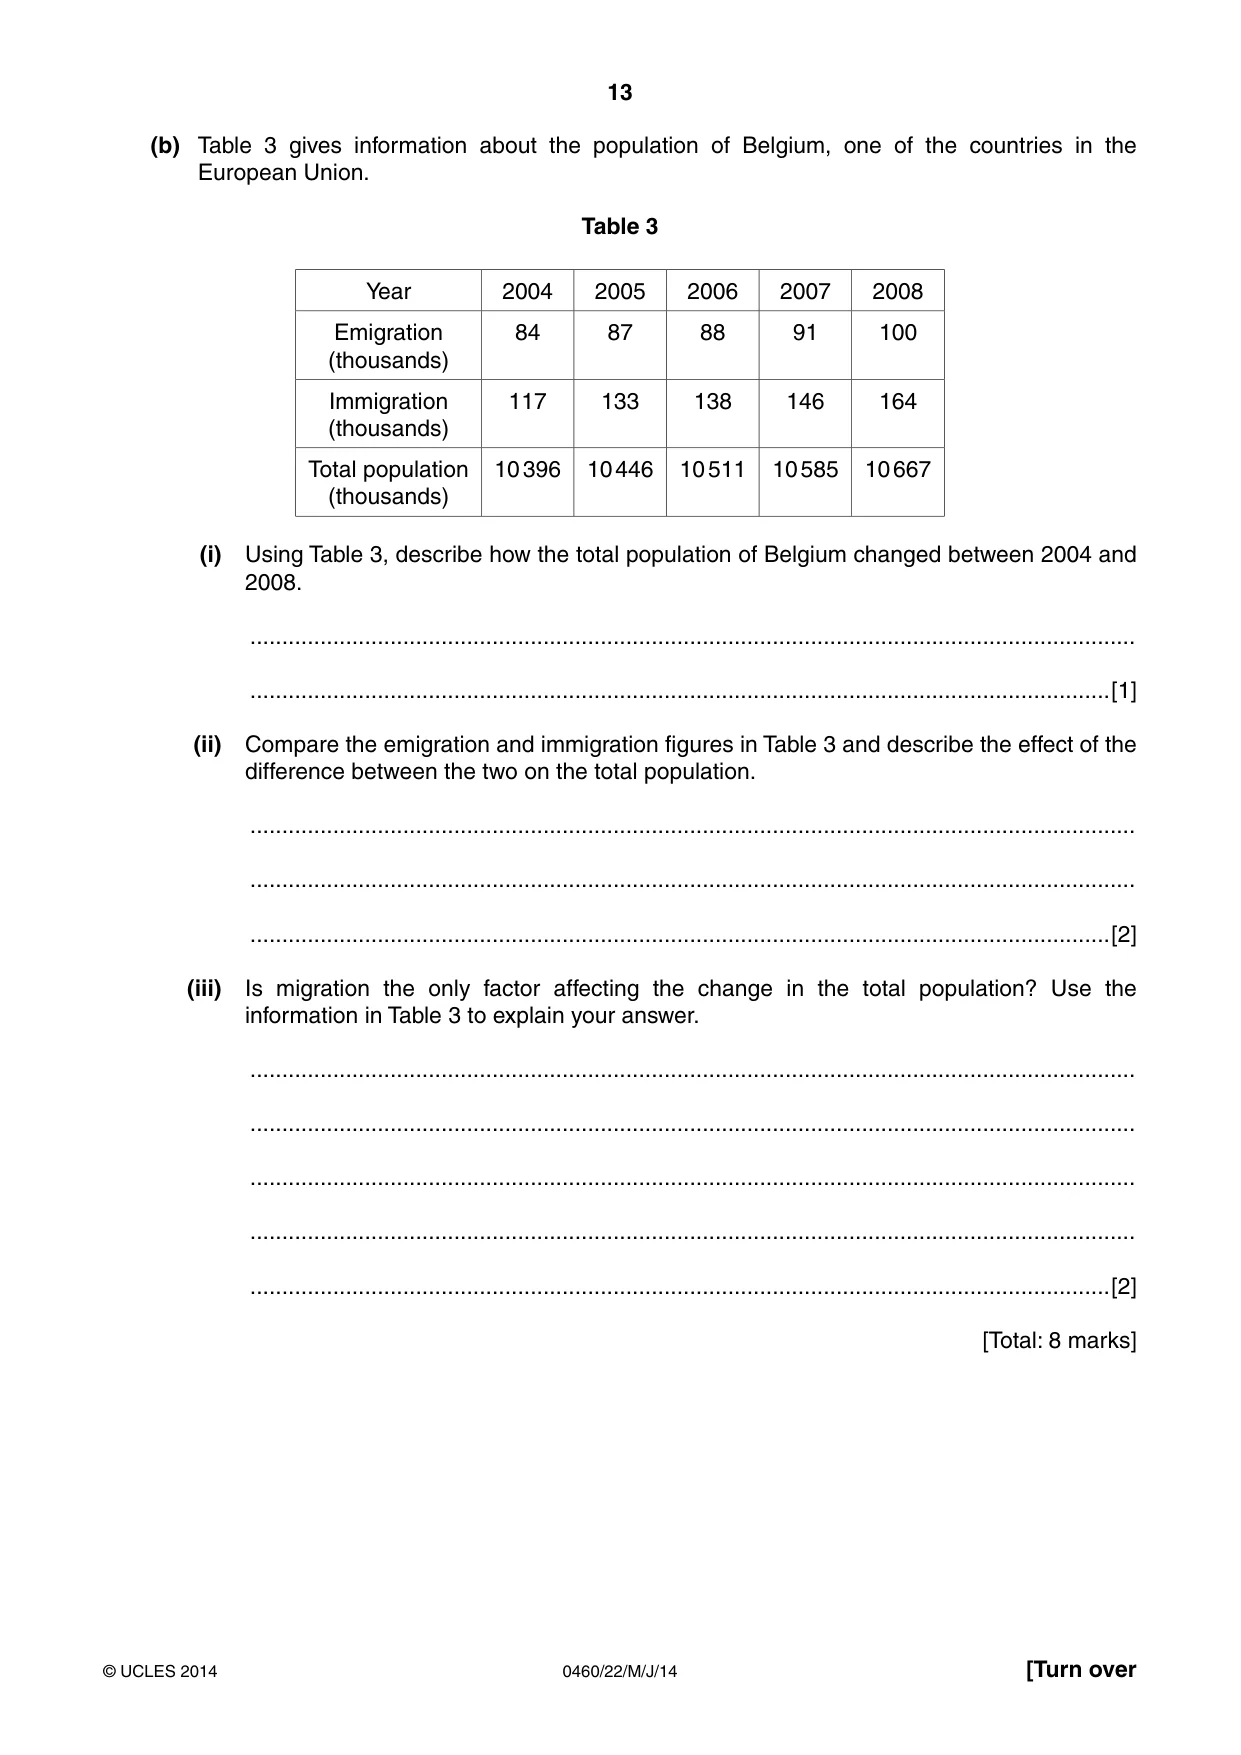
13 0460/22/M/J/14 © UCLES 2014 [Turn over (b) Table 3 gives information about the population of Belgium, one of the countries in the European Union. Table 3 Year 2004 2005 2006 2007 2008 Emigration (thousands) 84 87 88 91 100 Immigration (thousands) 117 133 138 146 164 Total population (thousands) 10 396 10 446 10 511 10 585 10 667 (i) Using Table 3, describe how the total population of Belgium changed between 2004 and 2008. … …[1] (ii) Compare the emigration and immigration figures in Table 3 and describe the effect of the difference between the two on the total population. … … …[2] (iii) Is migration the only factor affecting the change in the total population? Use the information in Table 3 to explain your answer. … … … … …[2] [Total: 8 marks]
Question paper, page 14
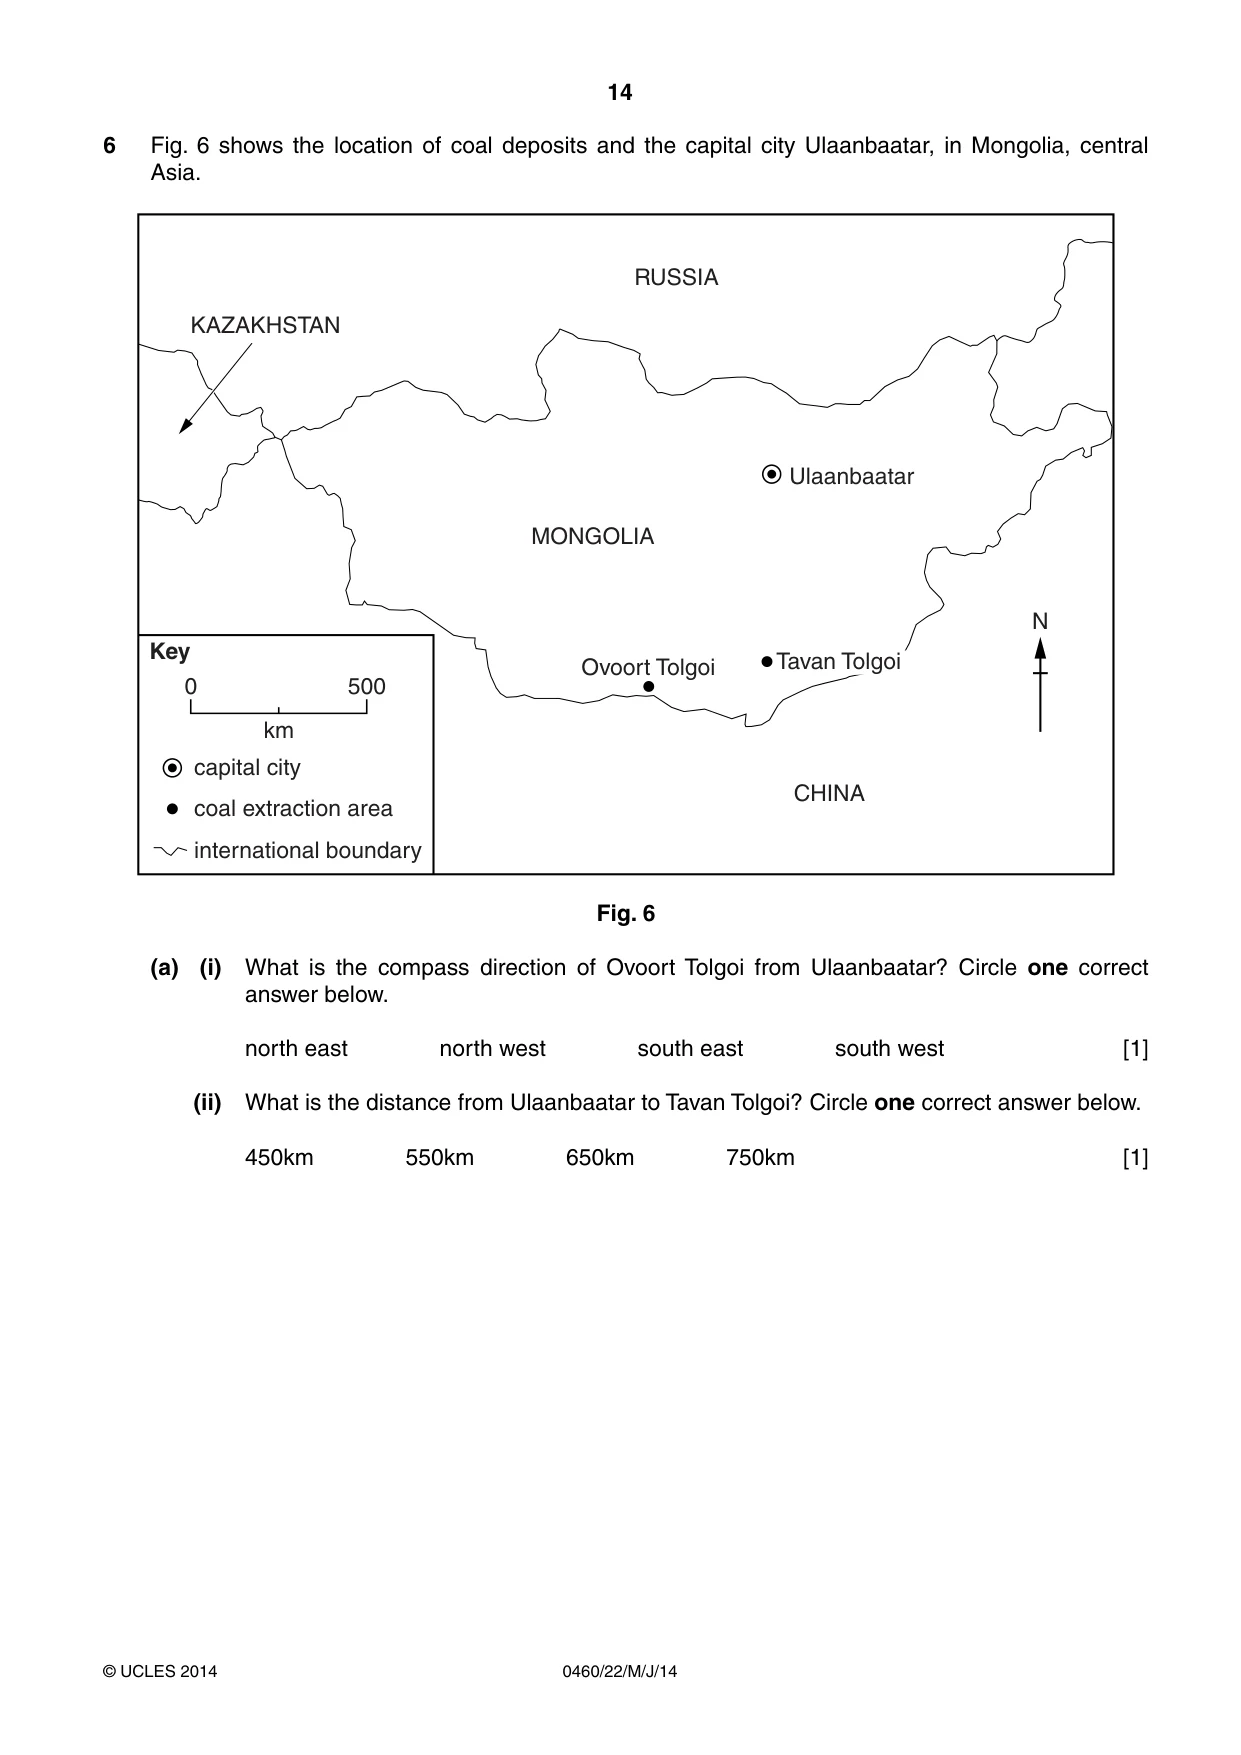
14 0460/22/M/J/14 © UCLES 2014 6 Fig. 6 shows the location of coal deposits and the capital city Ulaanbaatar, in Mongolia, central Asia. RUSSIA KAZAKHSTAN MONGOLIA CHINA N Ulaanbaatar Ovoort Tolgoi Key 0 500 km capital city coal extraction area international boundary Tavan Tolgoi Fig. 6 (a) (i) What is the compass direction of Ovoort Tolgoi from Ulaanbaatar? Circle one correct answer below. north east north west south east south west [1] (ii) What is the distance from Ulaanbaatar to Tavan Tolgoi? Circle one correct answer below. 450km 550km 650km 750km [1]
Question paper, page 15
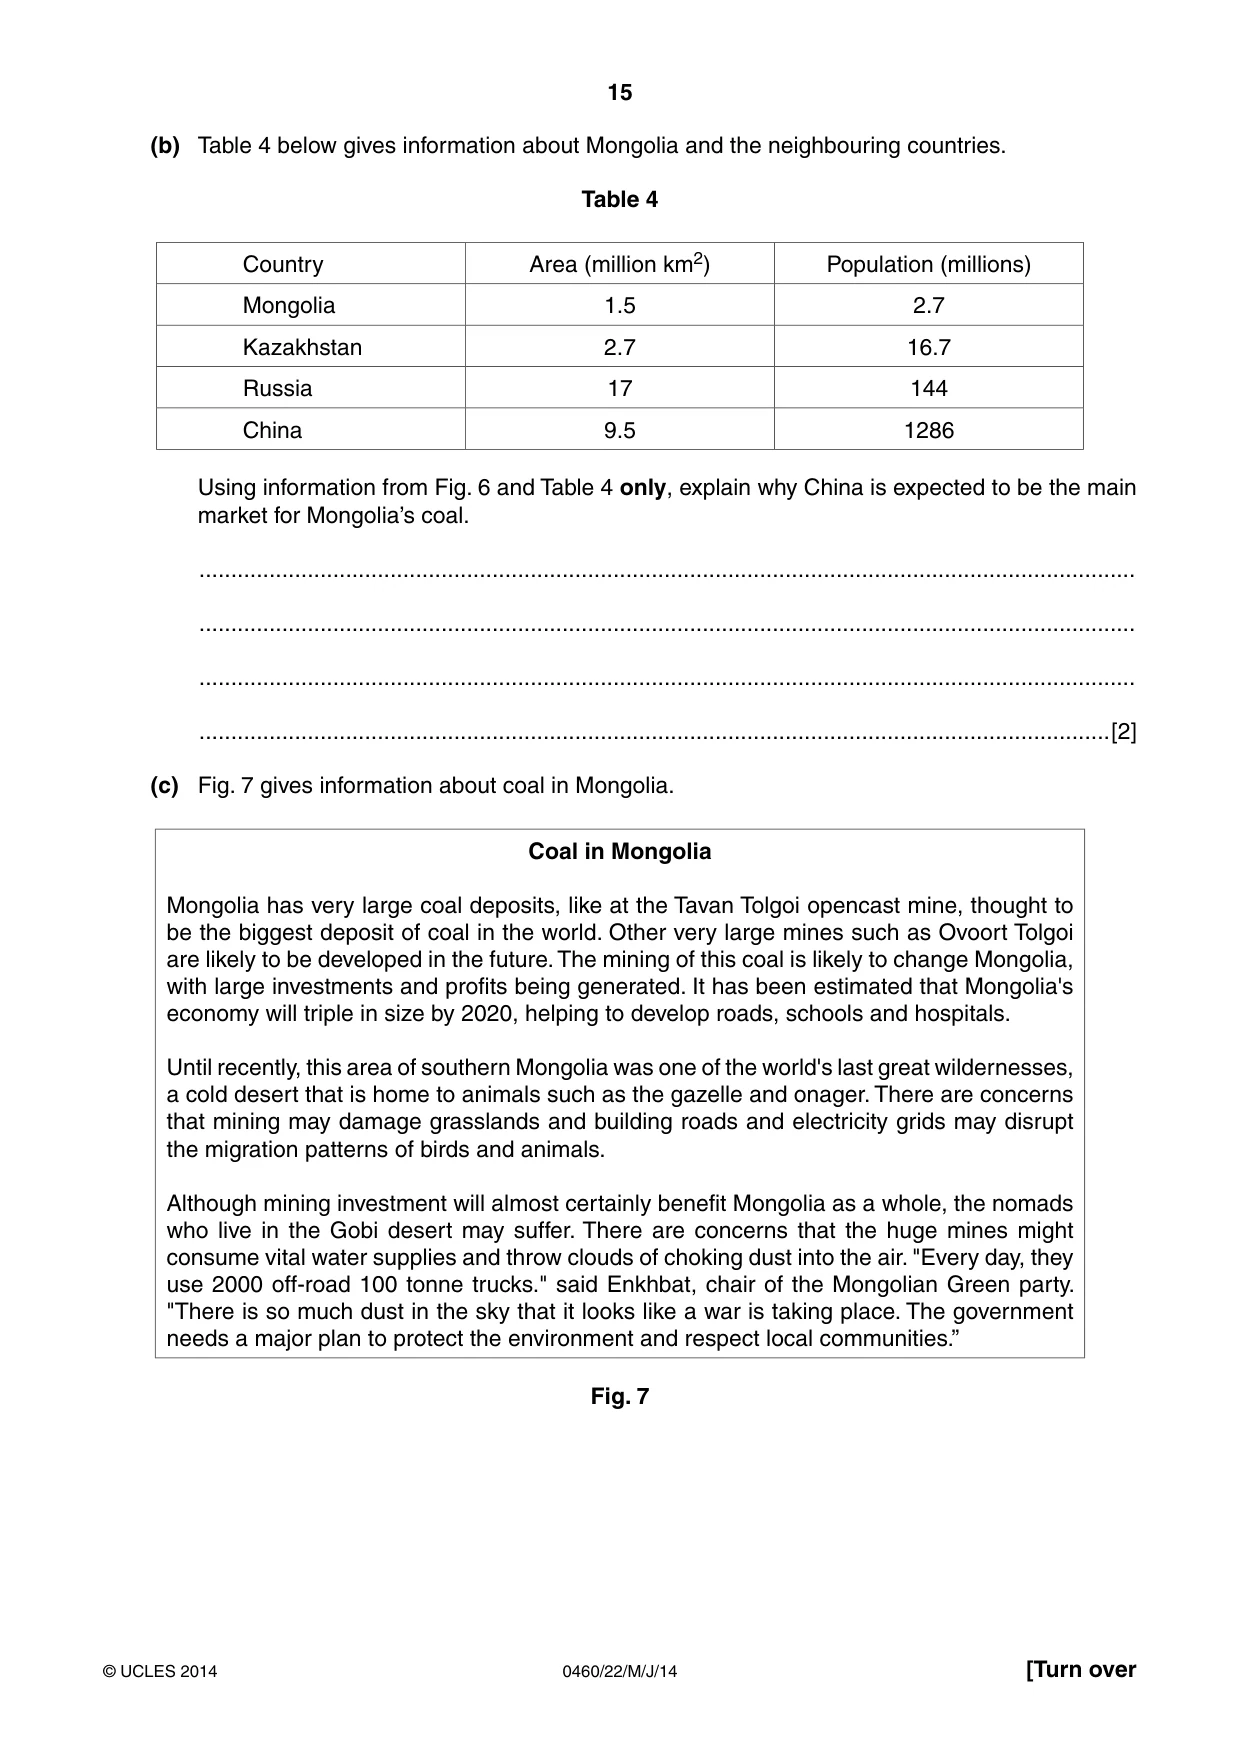
15 0460/22/M/J/14 © UCLES 2014 [Turn over (b) Table 4 below gives information about Mongolia and the neighbouring countries. Table 4 Country Area (million km2) Population (millions) Mongolia 1.5 2.7 Kazakhstan 2.7 16.7 Russia 17 144 China 9.5 1286 Using information from Fig. 6 and Table 4 only, explain why China is expected to be the main market for Mongolia’s coal. … … … …[2] (c) Fig. 7 gives information about coal in Mongolia. Coal in Mongolia Mongolia has very large coal deposits, like at the Tavan Tolgoi opencast mine, thought to be the biggest deposit of coal in the world. Other very large mines such as Ovoort Tolgoi are likely to be developed in the future. The mining of this coal is likely to change Mongolia, with large investments and profits being generated. It has been estimated that Mongolia's economy will triple in size by 2020, helping to develop roads, schools and hospitals. Until recently, this area of southern Mongolia was one of the world's last great wildernesses, a cold desert that is home to animals such as the gazelle and onager. There are concerns that mining may damage grasslands and building roads and electricity grids may disrupt the migration patterns of birds and animals. Although mining investment will almost certainly benefit Mongolia as a whole, the nomads who live in the Gobi desert may suffer. There are concerns that the huge mines might consume vital water supplies and throw clouds of choking dust into the air. "Every day, they use 2000 off-road 100 tonne trucks." said Enkhbat, chair of the Mongolian Green party. "There is so much dust in the sky that it looks like a war is taking place. The government needs a major plan to protect the environment and respect local communities.” Fig. 7
Question paper, page 16
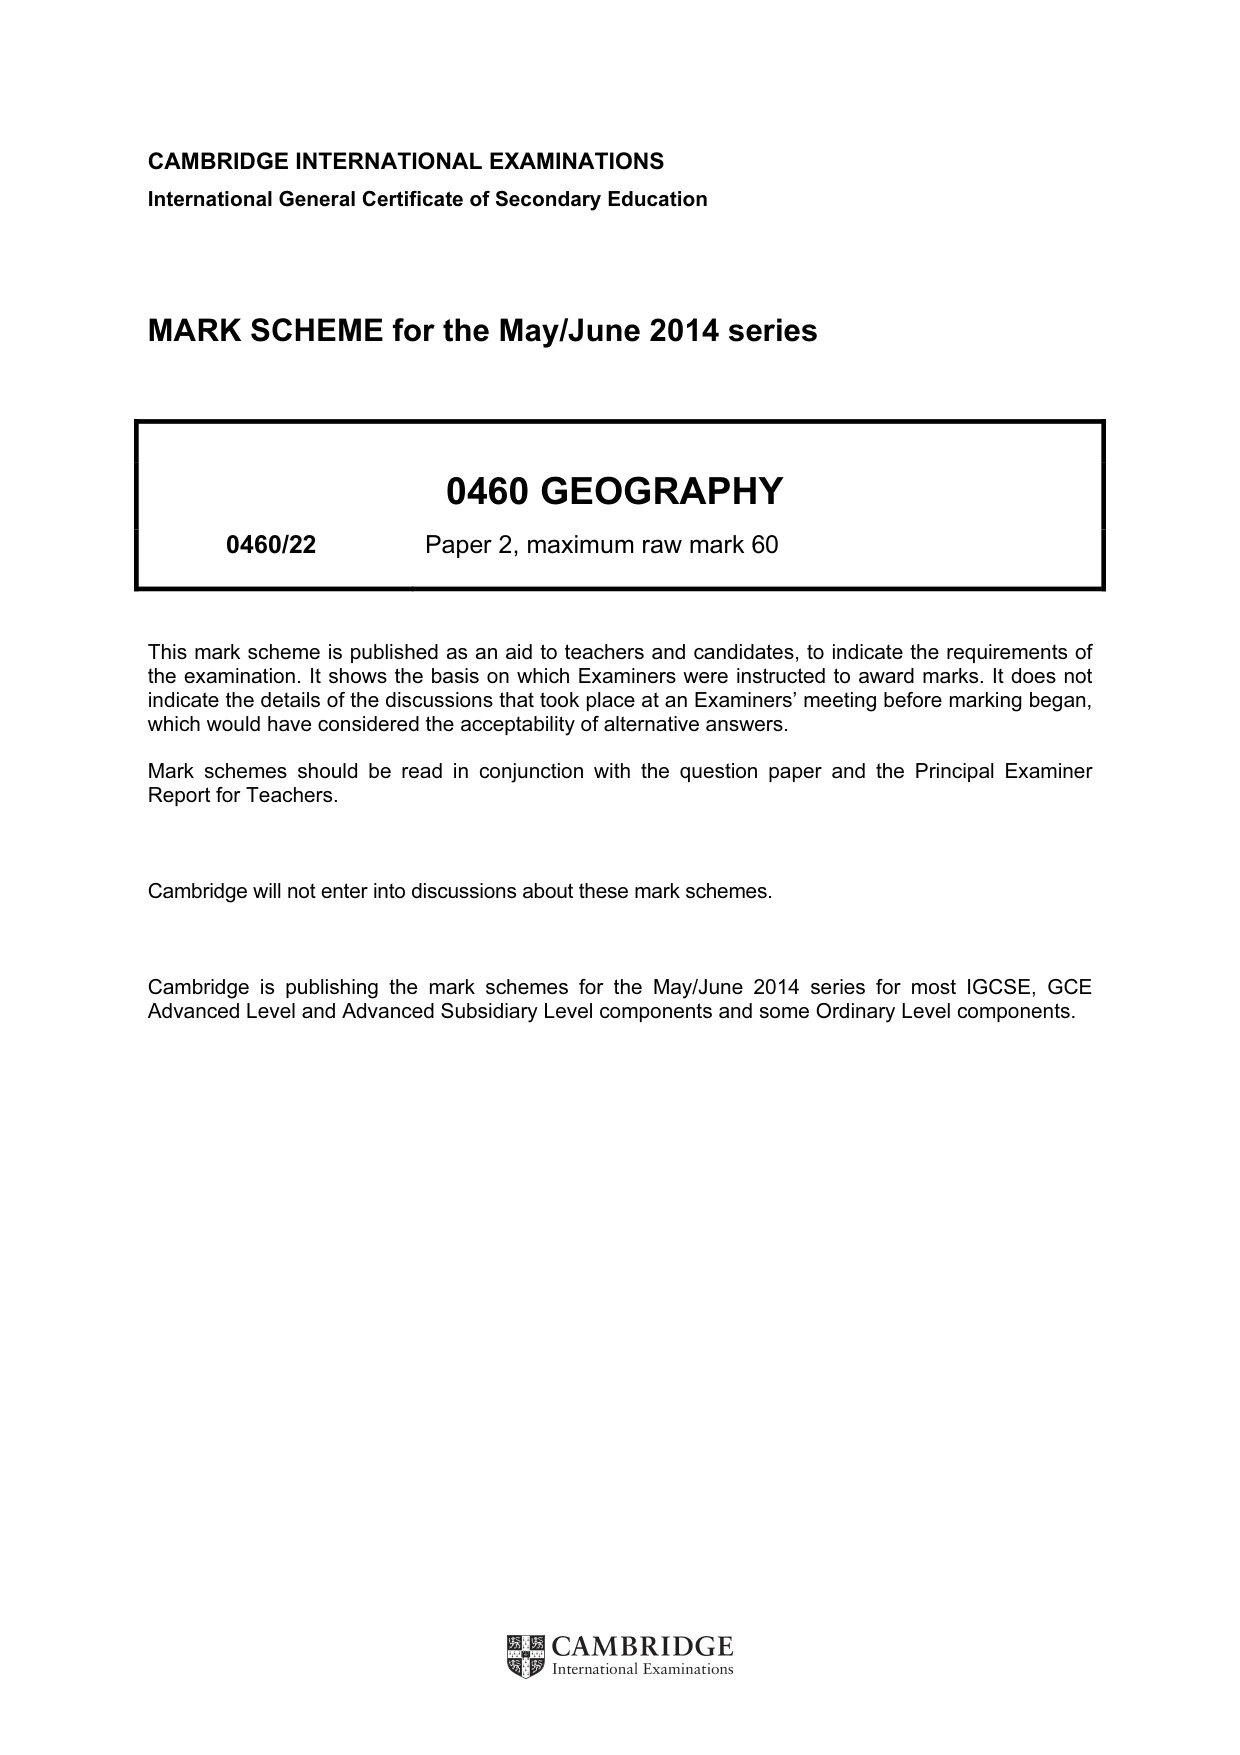
16 0460/22/M/J/14 © UCLES 2014 Copyright Acknowledgements: Question 2 Table 1 and Fig. 4 http://earthquakes.usgs.gov/earthquakes/ Question 3 Photograph A David Kelly © UCLES. Question 4 Photograph B David Kelly © UCLES. Question 5 Fig. 5 © http://epp.eurostat.ec.europa.eu/statistics_explained/index.php/Migration_and_migrant_population_statistics Question 5 Table 3 © http://epp.eurostat.ec.europa.eu/portal/page/portal/population/data/mai Question 6 Fig. 7 © www.miningtechnology.com/features Permission to reproduce items where third-party owned material protected by copyright is included has been sought and cleared where possible. Every reasonable effort has been made by the publisher (UCLES) to trace copyright holders, but if any items requiring clearance have unwittingly been included, the publisher will be pleased to make amends at the earliest possible opportunity. Cambridge International Examinations is part of the Cambridge Assessment Group. Cambridge Assessment is the brand name of University of Cambridge Local Examinations Syndicate (UCLES), which is itself a department of the University of Cambridge. Coal mining will bring advantages and disadvantages to Mongolia. Using information from Fig. 7, explain what these might be. Advantages … … … … … Disadvantages … … … … …[4] [Total: 8 marks]
Mark scheme, page 1
CAMBRIDGE INTERNATIONAL EXAMINATIONS International General Certificate of Secondary Education MARK SCHEME for the May/June 2014 series 0460 GEOGRAPHY 0460/22 Paper 2, maximum raw mark 60 This mark scheme is published as an aid to teachers and candidates, to indicate the requirements of the examination. It shows the basis on which Examiners were instructed to award marks. It does not indicate the details of the discussions that took place at an Examiners’ meeting before marking began, which would have considered the acceptability of alternative answers. Mark schemes should be read in conjunction with the question paper and the Principal Examiner Report for Teachers. Cambridge will not enter into discussions about these mark schemes. Cambridge is publishing the mark schemes for the May/June 2014 series for most IGCSE, GCE Advanced Level and Advanced Subsidiary Level components and some Ordinary Level components.
Mark scheme, page 2
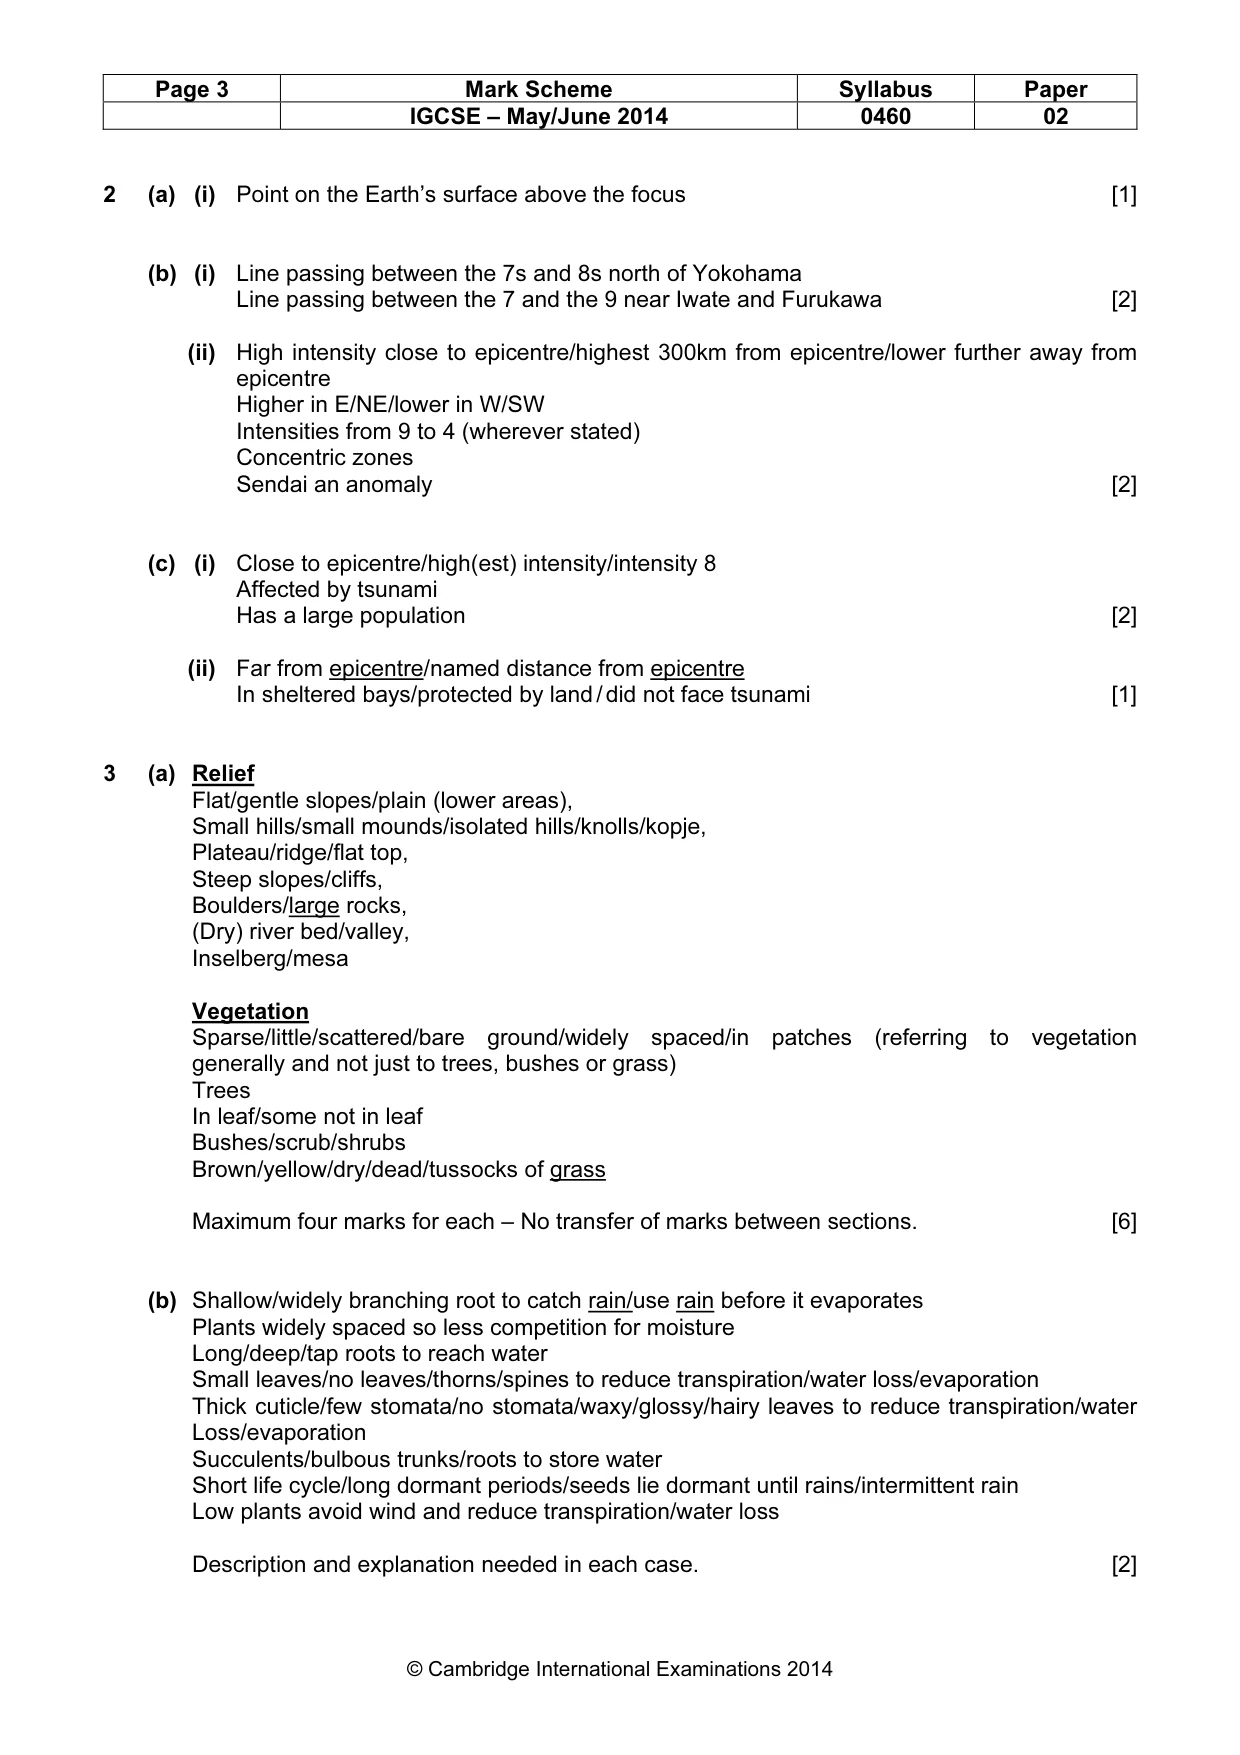
Page 2 Mark Scheme Syllabus Paper IGCSE – May/June 2014 0460 02 © Cambridge International Examinations 2014 1 (a) (i) Dip tank/Jeta Dip [1] (ii) Adoka [1] (iii) Bridge [1] (iv) National monument/place of historic interest/rock painting [1] (v) Waterfall(s)/weir [1] (b) Flows N/NNE (Then) flows NE/ENE/E, meanders (Fairly) straight sections Many/several tributaries/confluences Small tributaries, (Don’t allow tributaries leaving the river) 100m – 300m wide (allow distances between)/wide/widens towards Pote/NE/downstream Islands/braided/splits and rejoins Rapids Waterfall(s) Gentle gradient [5] (c) Hill/mountain/high/upland/Jeta hill Plateau/flat(ter) top/gentle(r) top, Steep (sides) 1401m – 1459m (Allow any height in between) Escarpment/scarp Valley(s) [3] (d) (i) 244/5 787 [1] (ii) 2360 [1] (e) (i) Linear [1] (ii) On/along road/for transport/for access Gentle slope/avoids steep/avoids high Edge of cultivated land Water supply from small rivers Avoids flooding Mark (i) and (ii) independently [1] (f) (i) Inyauri river 61 – 63mm from left [1] (ii) Road, 37 – 39mm from left [1] (iii) Smooth rock 7 – 27mm or 83 – 100mm from left (two options) [1]
Mark scheme, page 3
Page 3 Mark Scheme Syllabus Paper IGCSE – May/June 2014 0460 02 © Cambridge International Examinations 2014 2 (a) (i) Point on the Earth’s surface above the focus [1] (b) (i) Line passing between the 7s and 8s north of Yokohama Line passing between the 7 and the 9 near Iwate and Furukawa [2] (ii) High intensity close to epicentre/highest 300km from epicentre/lower further away from epicentre Higher in E/NE/lower in W/SW Intensities from 9 to 4 (wherever stated) Concentric zones Sendai an anomaly [2] (c) (i) Close to epicentre/high(est) intensity/intensity 8 Affected by tsunami Has a large population [2] (ii) Far from epicentre/named distance from epicentre In sheltered bays/protected by land / did not face tsunami [1] 3 (a) Relief Flat/gentle slopes/plain (lower areas), Small hills/small mounds/isolated hills/knolls/kopje, Plateau/ridge/flat top, Steep slopes/cliffs, Boulders/large rocks, (Dry) river bed/valley, Inselberg/mesa Vegetation Sparse/little/scattered/bare ground/widely spaced/in patches (referring to vegetation generally and not just to trees, bushes or grass) Trees In leaf/some not in leaf Bushes/scrub/shrubs Brown/yellow/dry/dead/tussocks of grass Maximum four marks for each – No transfer of marks between sections. [6] (b) Shallow/widely branching root to catch rain/use rain before it evaporates Plants widely spaced so less competition for moisture Long/deep/tap roots to reach water Small leaves/no leaves/thorns/spines to reduce transpiration/water loss/evaporation Thick cuticle/few stomata/no stomata/waxy/glossy/hairy leaves to reduce transpiration/water Loss/evaporation Succulents/bulbous trunks/roots to store water Short life cycle/long dormant periods/seeds lie dormant until rains/intermittent rain Low plants avoid wind and reduce transpiration/water loss Description and explanation needed in each case. [2]
Mark scheme, page 4
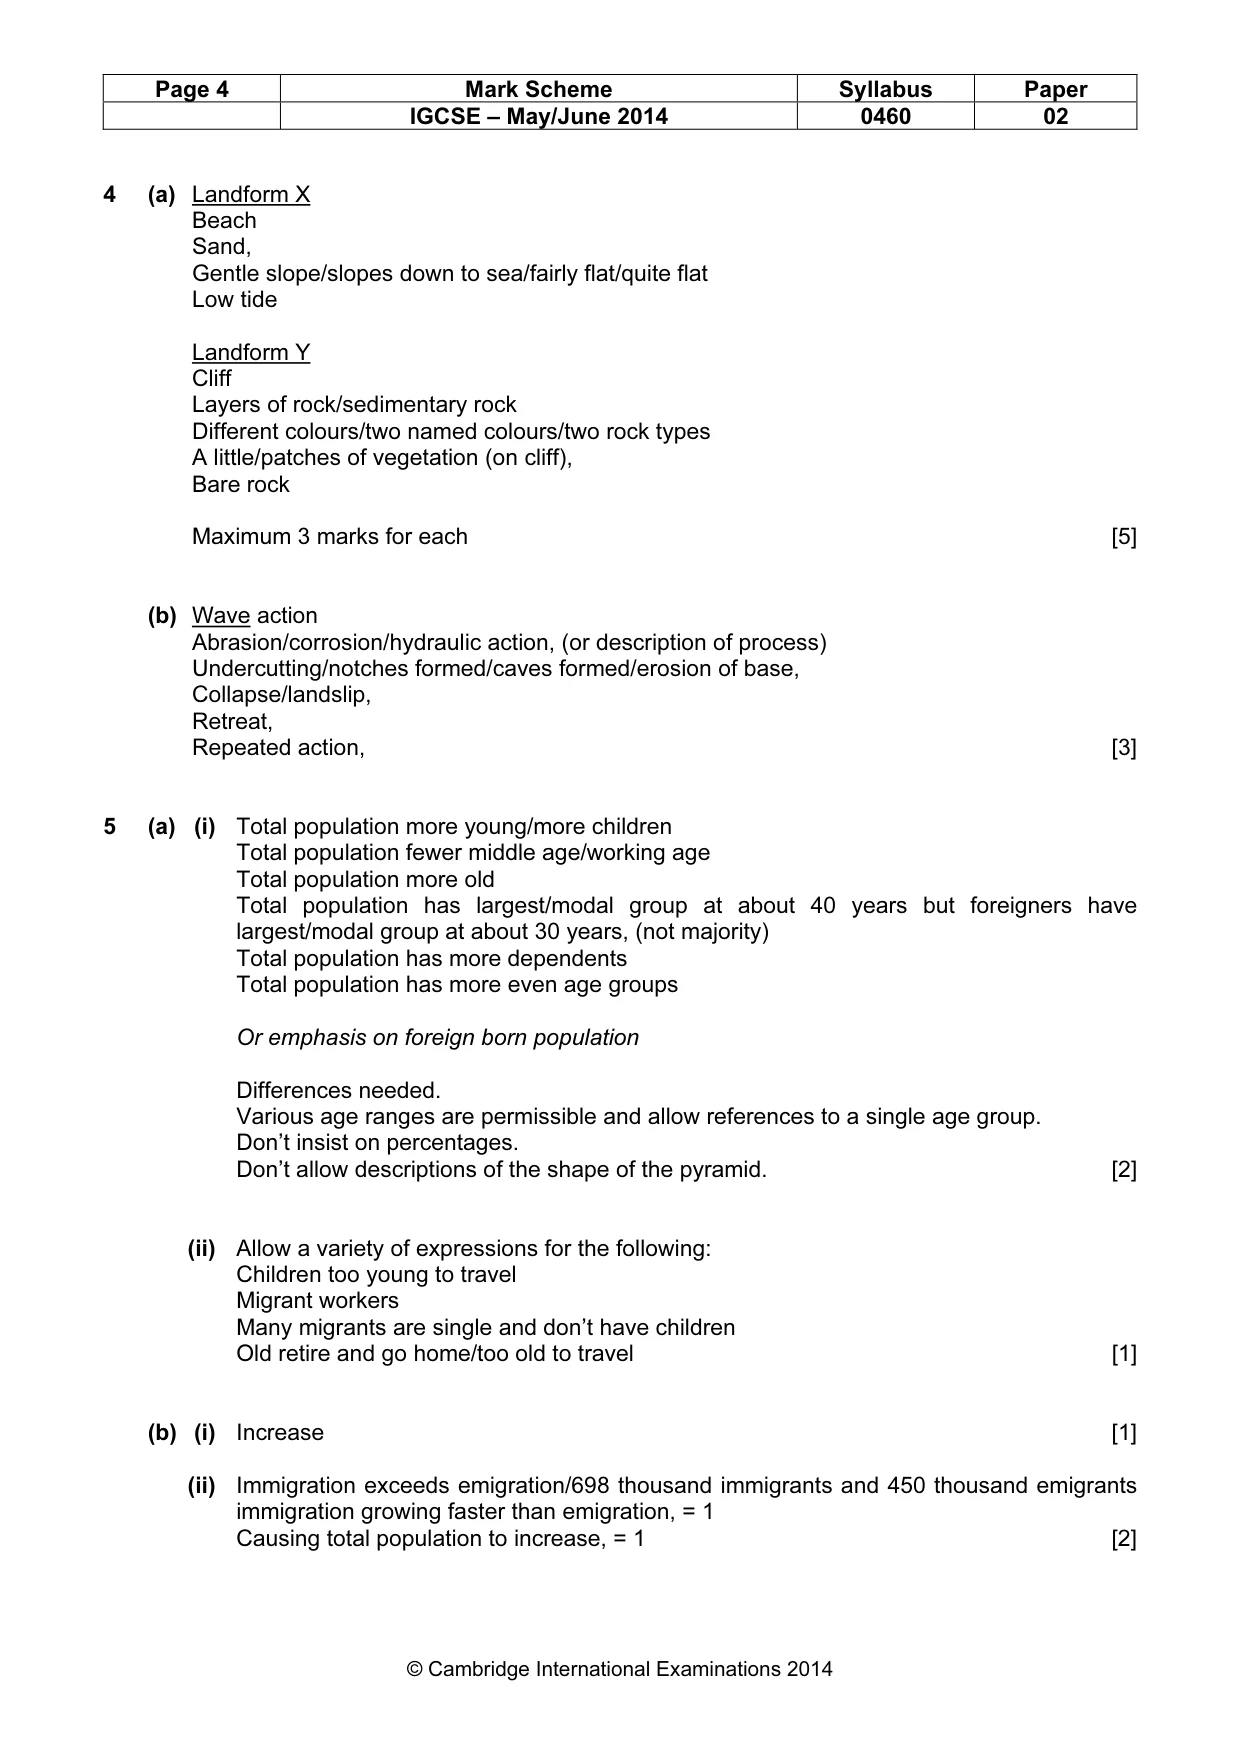
Page 4 Mark Scheme Syllabus Paper IGCSE – May/June 2014 0460 02 © Cambridge International Examinations 2014 4 (a) Landform X Beach Sand, Gentle slope/slopes down to sea/fairly flat/quite flat Low tide Landform Y Cliff Layers of rock/sedimentary rock Different colours/two named colours/two rock types A little/patches of vegetation (on cliff), Bare rock Maximum 3 marks for each [5] (b) Wave action Abrasion/corrosion/hydraulic action, (or description of process) Undercutting/notches formed/caves formed/erosion of base, Collapse/landslip, Retreat, Repeated action, [3] 5 (a) (i) Total population more young/more children Total population fewer middle age/working age Total population more old Total population has largest/modal group at about 40 years but foreigners have largest/modal group at about 30 years, (not majority) Total population has more dependents Total population has more even age groups Or emphasis on foreign born population Differences needed. Various age ranges are permissible and allow references to a single age group. Don’t insist on percentages. Don’t allow descriptions of the shape of the pyramid. [2] (ii) Allow a variety of expressions for the following: Children too young to travel Migrant workers Many migrants are single and don’t have children Old retire and go home/too old to travel [1] (b) (i) Increase [1] (ii) Immigration exceeds emigration/698 thousand immigrants and 450 thousand emigrants immigration growing faster than emigration, = 1 Causing total population to increase, = 1 [2]
Mark scheme, page 5
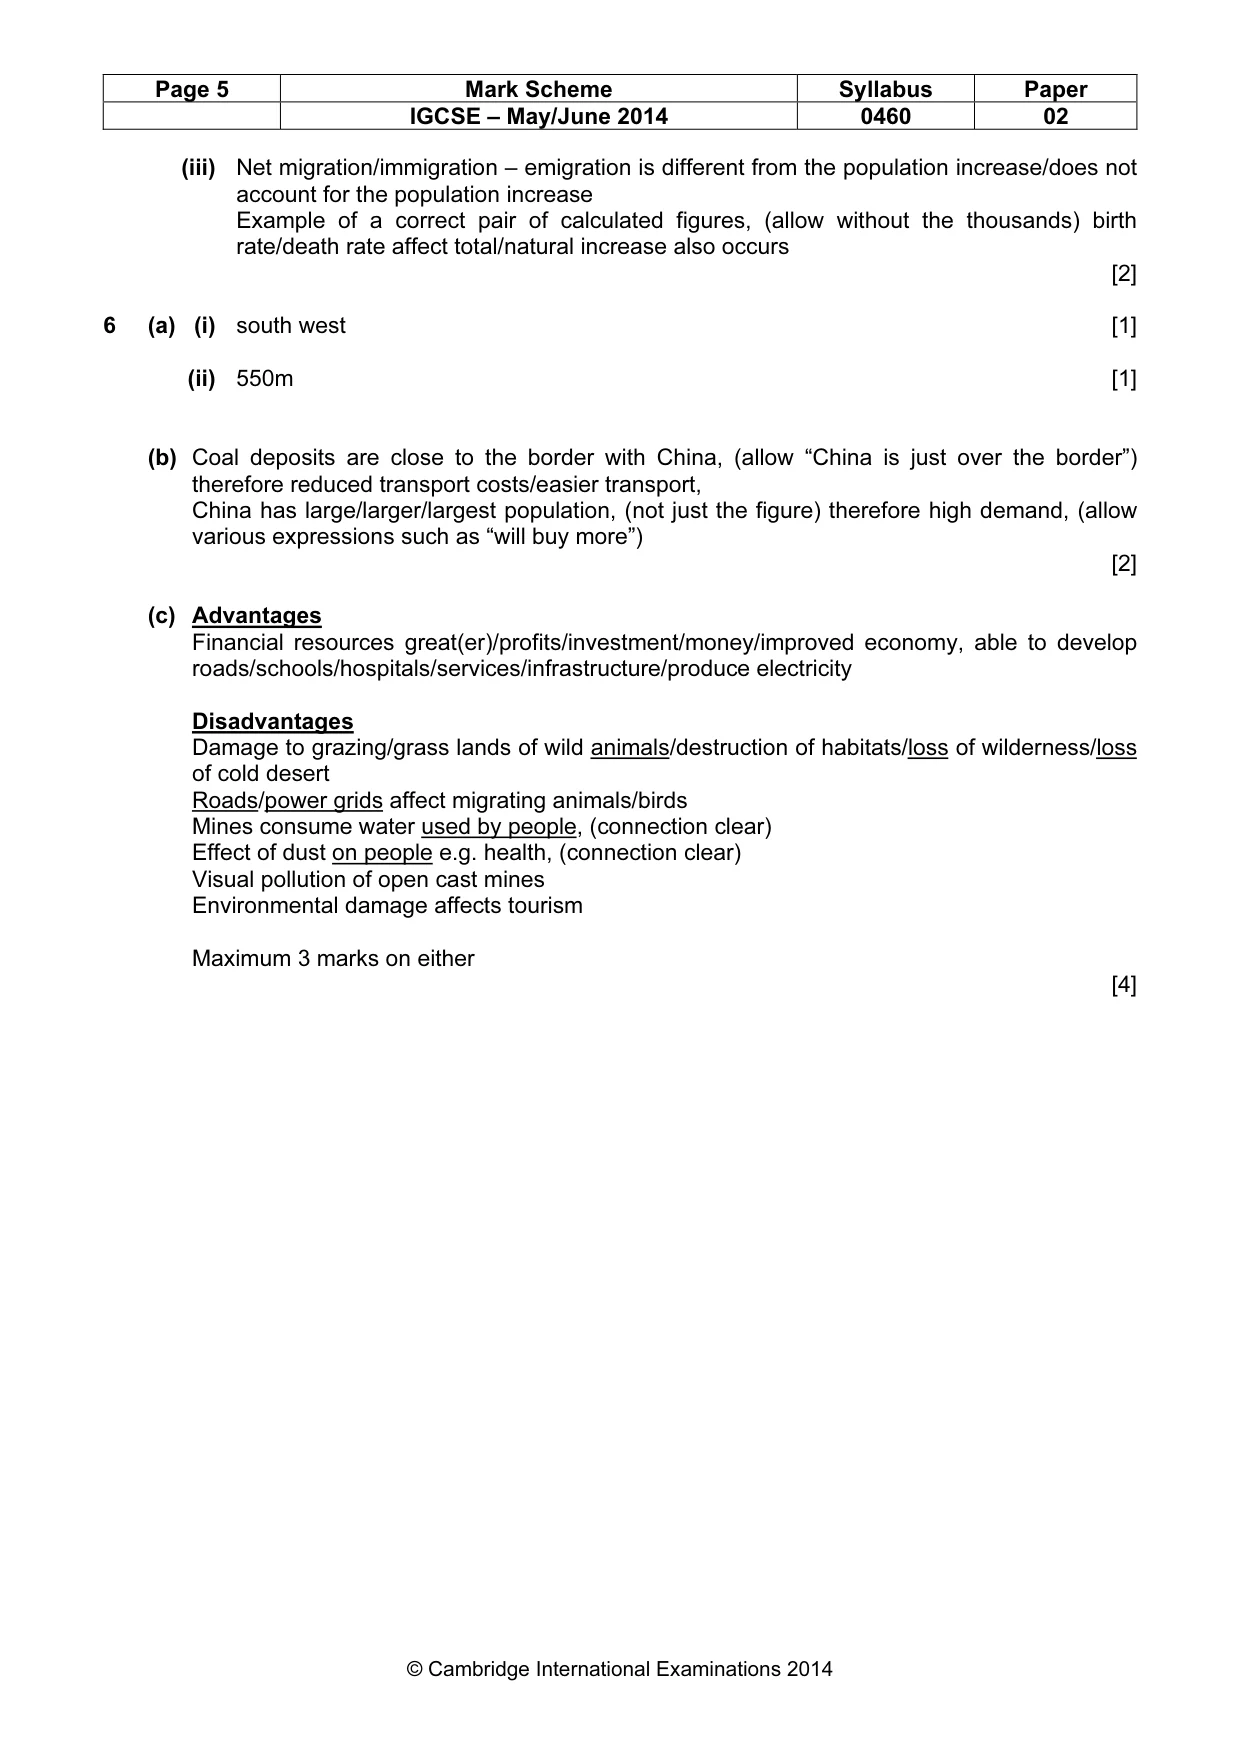
Page 5 Mark Scheme Syllabus Paper IGCSE – May/June 2014 0460 02 © Cambridge International Examinations 2014 (iii) Net migration/immigration – emigration is different from the population increase/does not account for the population increase Example of a correct pair of calculated figures, (allow without the thousands) birth rate/death rate affect total/natural increase also occurs [2] 6 (a) (i) south west [1] (ii) 550m [1] (b) Coal deposits are close to the border with China, (allow “China is just over the border”) therefore reduced transport costs/easier transport, China has large/larger/largest population, (not just the figure) therefore high demand, (allow various expressions such as “will buy more”) [2] (c) Advantages Financial resources great(er)/profits/investment/money/improved economy, able to develop roads/schools/hospitals/services/infrastructure/produce electricity Disadvantages Damage to grazing/grass lands of wild animals/destruction of habitats/loss of wilderness/loss of cold desert Roads/power grids affect migrating animals/birds Mines consume water used by people, (connection clear) Effect of dust on people e.g. health, (connection clear) Visual pollution of open cast mines Environmental damage affects tourism Maximum 3 marks on either [4]
What you needed in this session
Cambridge’s own grade thresholds for 2014 May/June, Paper 2 · Variant 2. A higher threshold means an easier paper — the bar moves with how the cohort did.