Cambridge IGCSE Geography 0460 — 2013 Oct/Nov Paper 2 · Variant 2
0460/22/O/N/13 · 60 marks · ≈68 min
The question paper and its mark scheme, free to read here and free to download. This is Cambridge’s own paper, exactly as it was sat.
Question paper16 pages


Mark scheme6 pages
Answers below. Sit the paper first if you are practising.
Paper as text
Question paper, page 1
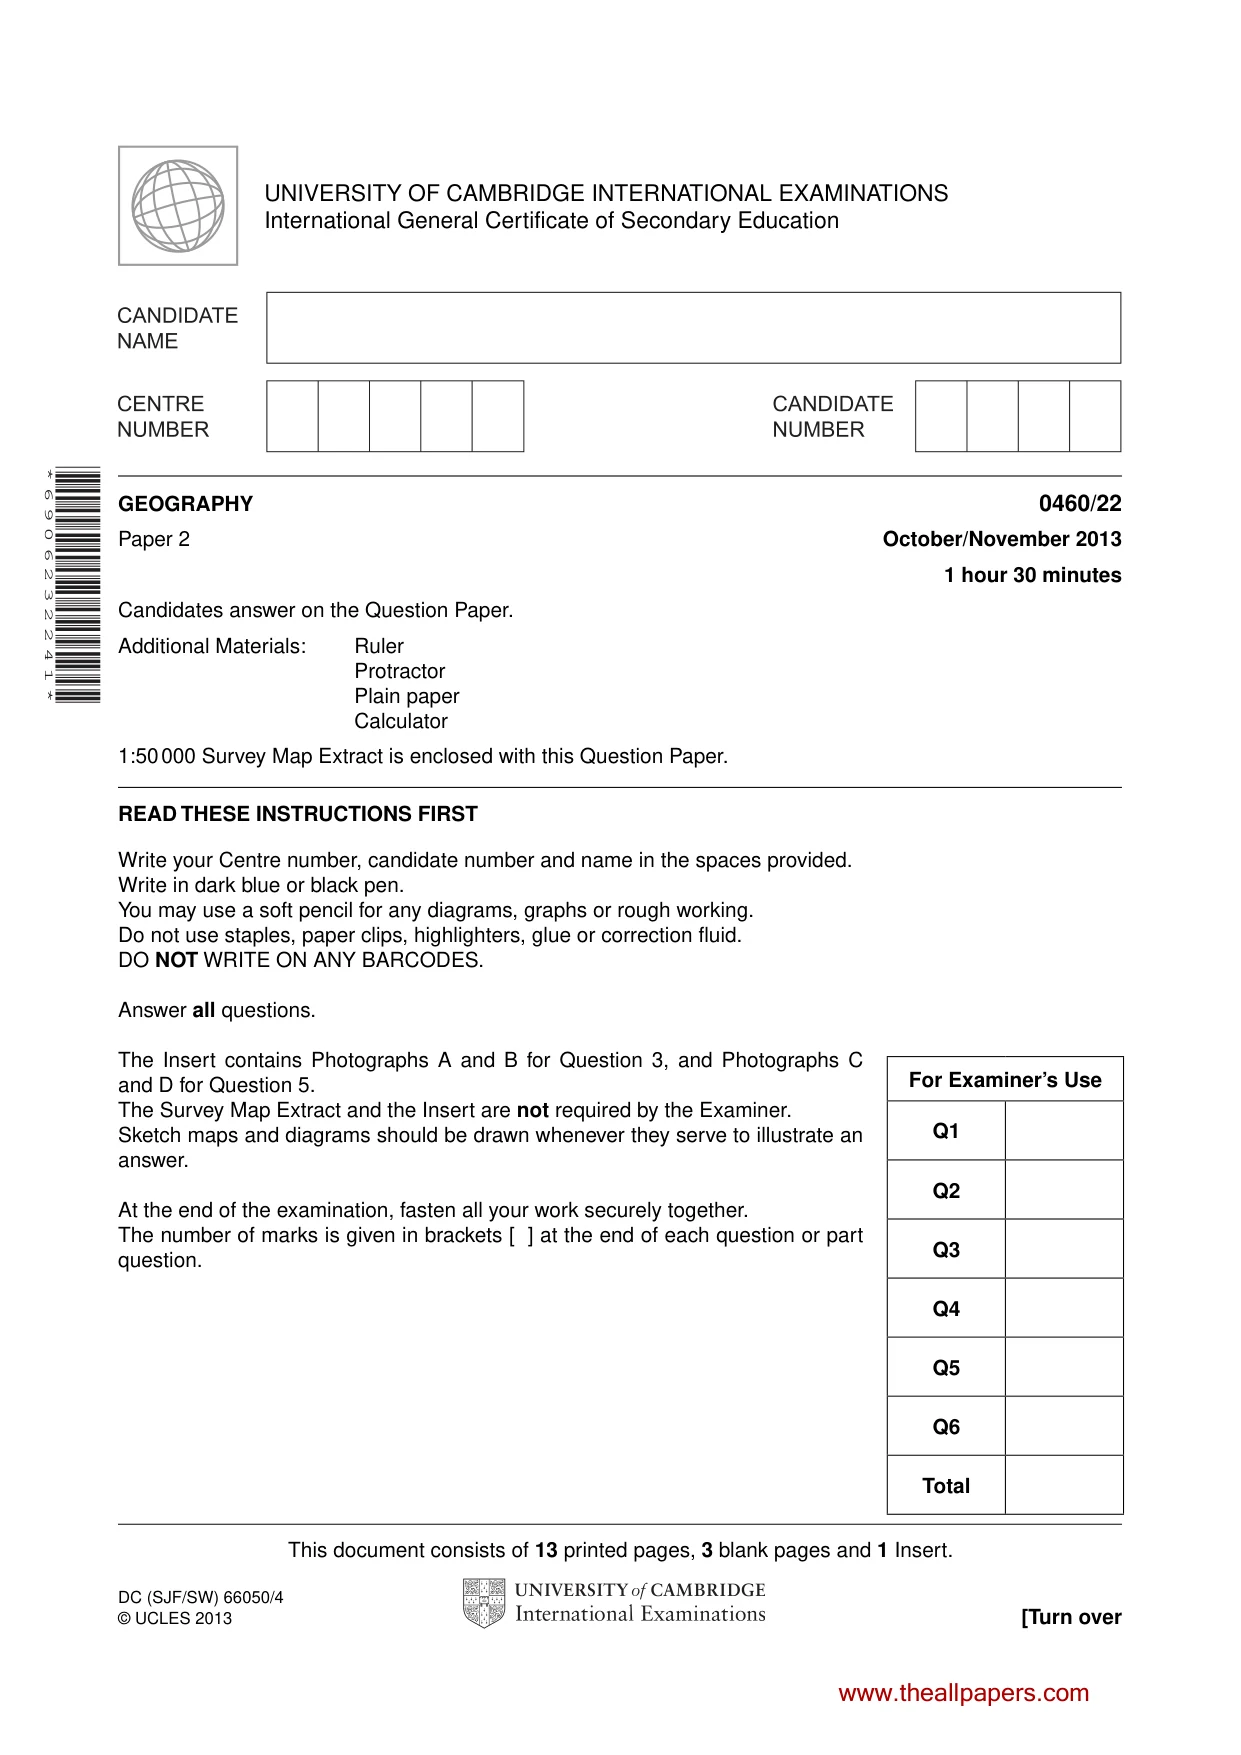
This document consists of 13 printed pages, 3 blank pages and 1 Insert. DC (SJF/SW) 66050/4 © UCLES 2013 [Turn over UNIVERSITY OF CAMBRIDGE INTERNATIONAL EXAMINATIONS International General Certificate of Secondary Education READ THESE INSTRUCTIONS FIRST Write your Centre number, candidate number and name in the spaces provided. Write in dark blue or black pen. You may use a soft pencil for any diagrams, graphs or rough working. Do not use staples, paper clips, highlighters, glue or correction fluid. DO NOT WRITE ON ANY BARCODES. Answer all questions. The Insert contains Photographs A and B for Question 3, and Photographs C and D for Question 5. The Survey Map Extract and the Insert are not required by the Examiner. Sketch maps and diagrams should be drawn whenever they serve to illustrate an answer. At the end of the examination, fasten all your work securely together. The number of marks is given in brackets [ ] at the end of each question or part question. * 6 9 0 6 2 3 2 2 4 1 * GEOGRAPHY 0460/22 Paper 2 October/November 2013 1 hour 30 minutes Candidates answer on the Question Paper. Additional Materials: Ruler Protractor Plain paper Calculator 1:50 000 Survey Map Extract is enclosed with this Question Paper. For Examiner’s Use Q1 Q2 Q3 Q4 Q5 Q6 Total www.theallpapers.com
Question paper, page 2
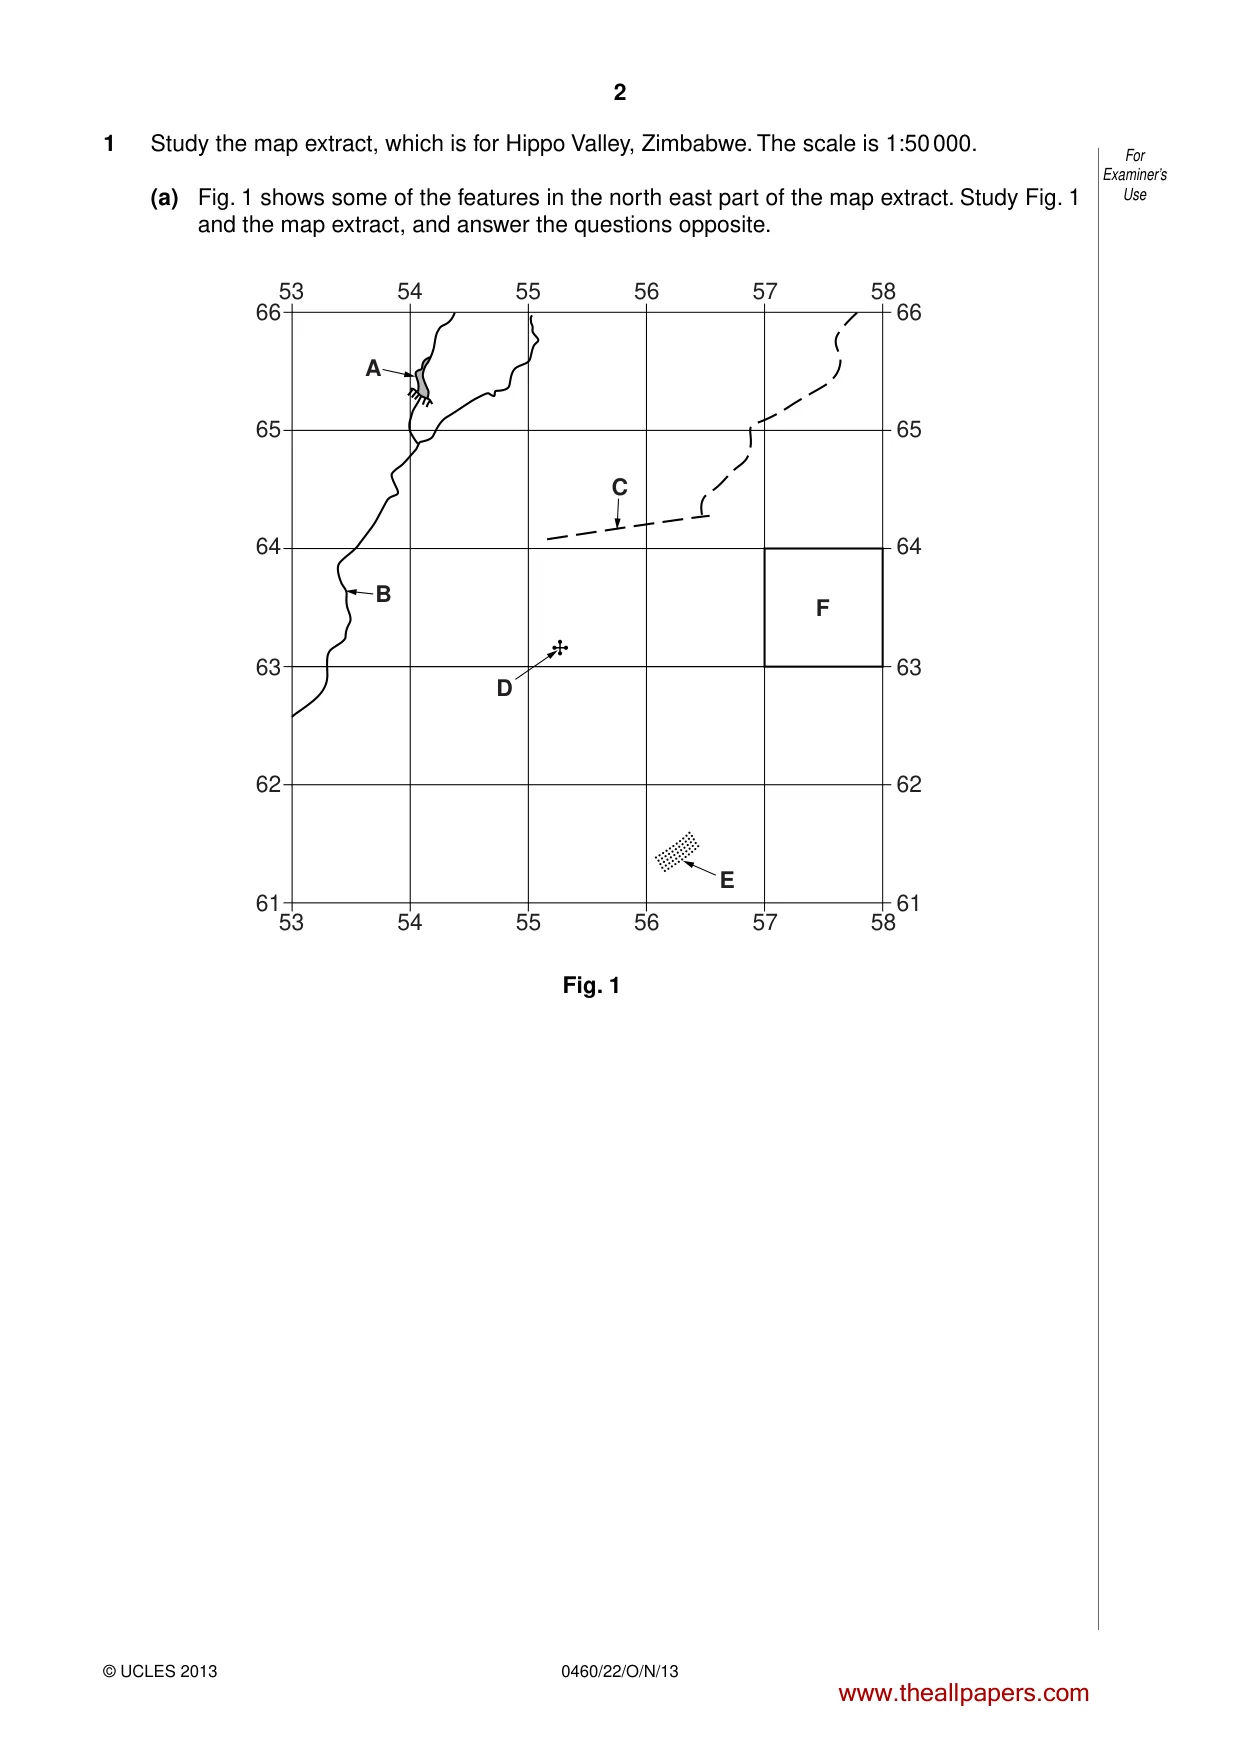
2 For Examiner’s Use 0460/22/O/N/13 © UCLES 2013 1 Study the map extract, which is for Hippo Valley, Zimbabwe. The scale is 1:50 000. (a) Fig. 1 shows some of the features in the north east part of the map extract. Study Fig. 1 and the map extract, and answer the questions opposite. 53 54 55 56 57 58 53 61 62 63 64 65 66 61 62 63 64 65 66 54 55 56 57 58 A C F E D B Fig. 1 www.theallpapers.com
Question paper, page 3
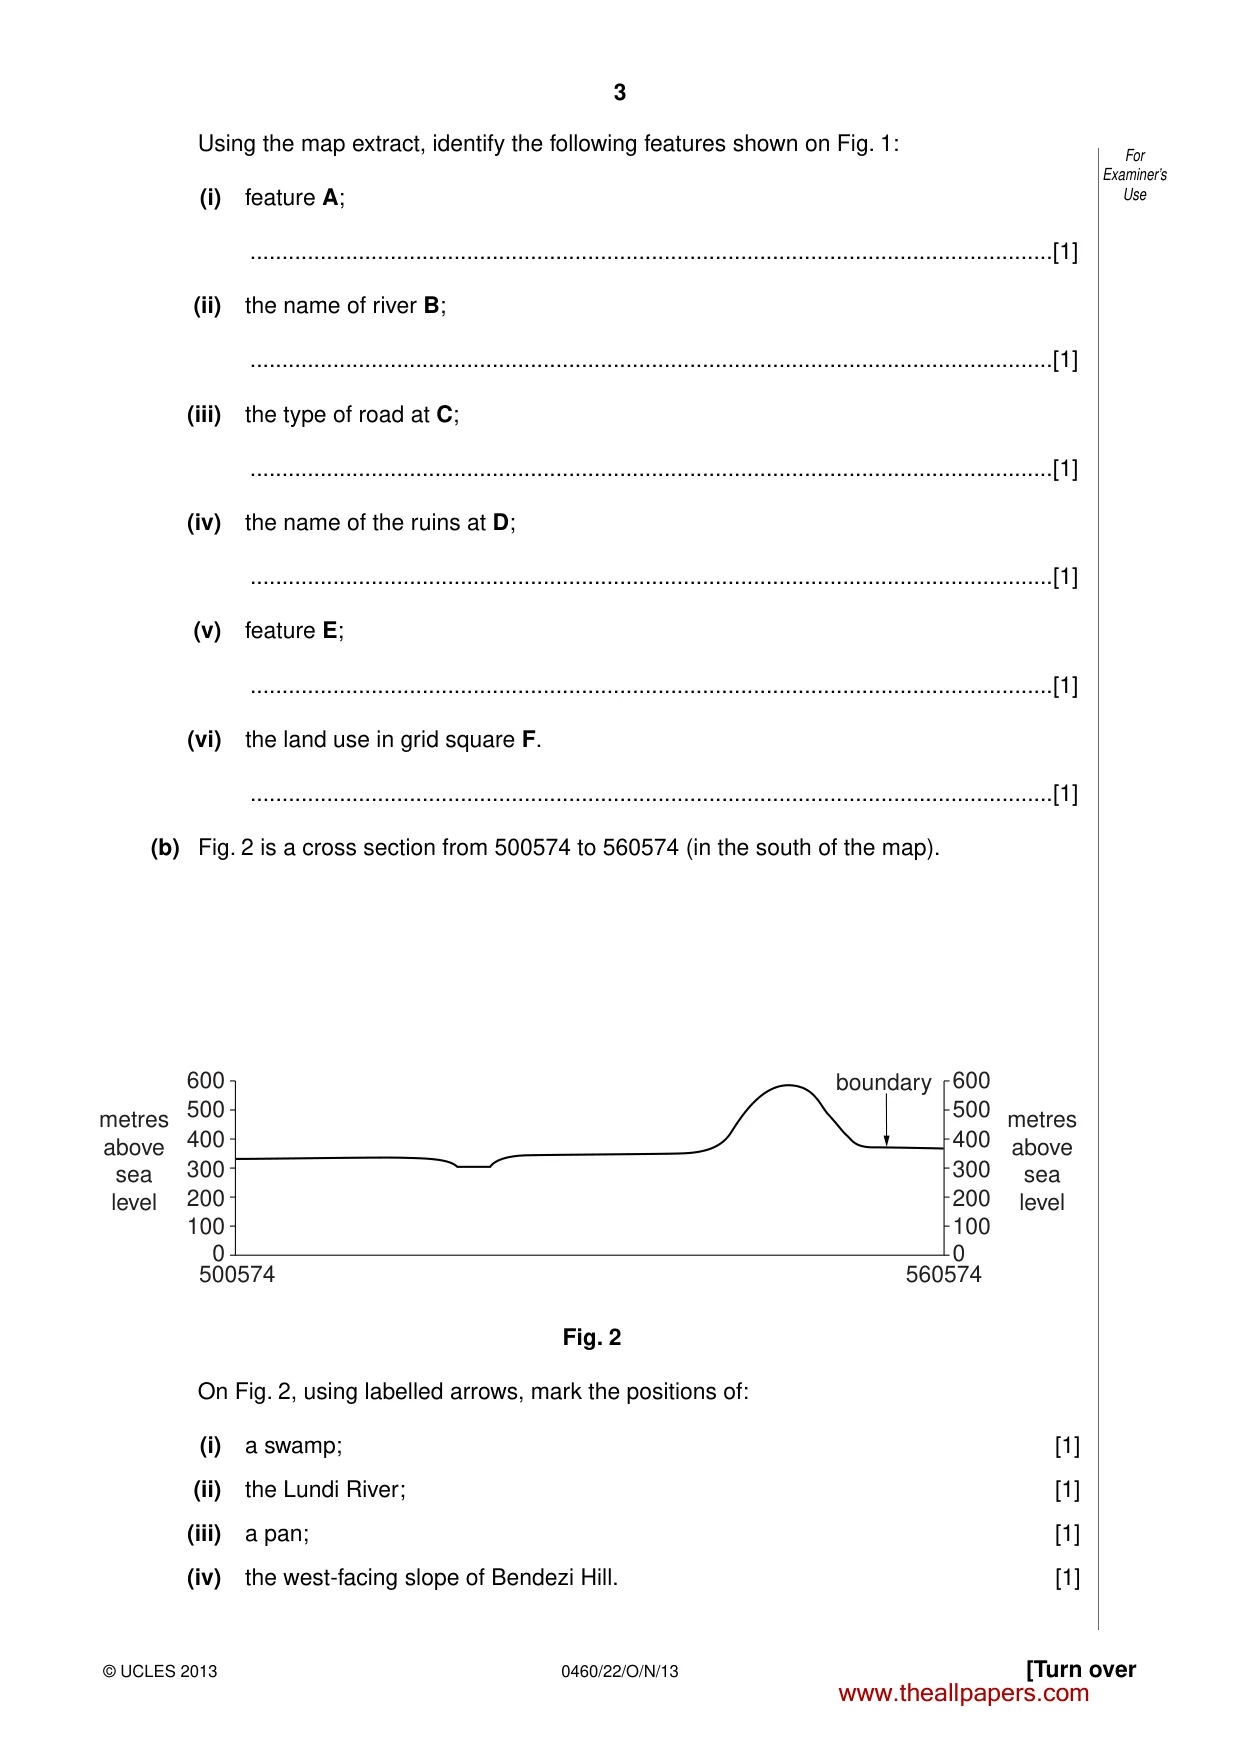
3 [Turn over For Examiner’s Use © UCLES 2013 0460/22/O/N/13 Using the map extract, identify the following features shown on Fig. 1: (i) feature A; …[1] (ii) the name of river B; …[1] (iii) the type of road at C; …[1] (iv) the name of the ruins at D; …[1] (v) feature E; …[1] (vi) the land use in grid square F. …[1] (b) Fig. 2 is a cross section from 500574 to 560574 (in the south of the map). 600 500 400 300 200 100 0 500574 560574 600 metres above sea level metres above sea level boundary 500 400 300 200 100 0 Fig. 2 On Fig. 2, using labelled arrows, mark the positions of: (i) a swamp; [1] (ii) the Lundi River; [1] (iii) a pan; [1] (iv) the west-facing slope of Bendezi Hill. [1] www.theallpapers.com
Question paper, page 4
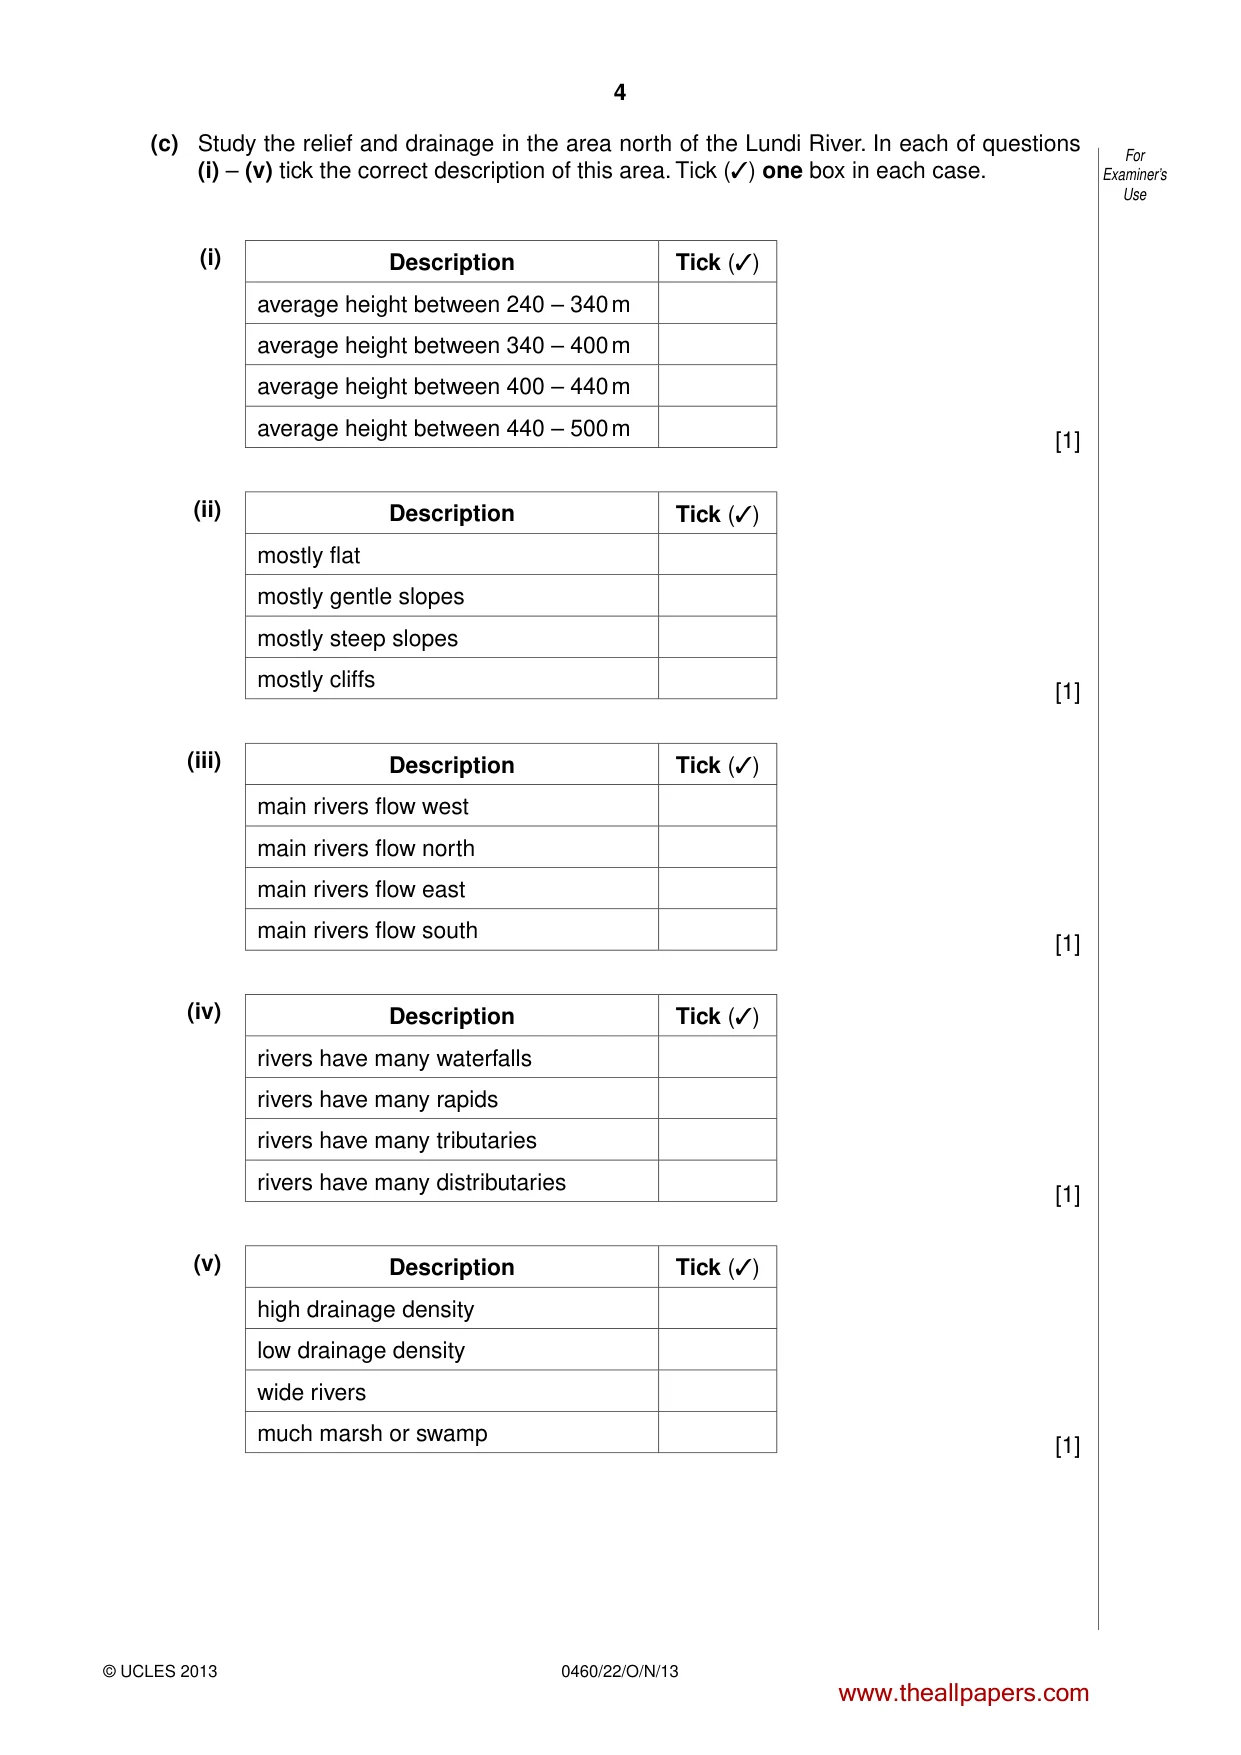
4 For Examiner’s Use 0460/22/O/N/13 © UCLES 2013 (c) Study the relief and drainage in the area north of the Lundi River. In each of questions (i) – (v) tick the correct description of this area. Tick (✓) one box in each case. (i) Description Tick (✓) average height between 240 – 340 m average height between 340 – 400 m average height between 400 – 440 m average height between 440 – 500 m [1] (ii) Description Tick (✓) mostly flat mostly gentle slopes mostly steep slopes mostly cliffs [1] (iii) Description Tick (✓) main rivers flow west main rivers flow north main rivers flow east main rivers flow south [1] (iv) Description Tick (✓) rivers have many waterfalls rivers have many rapids rivers have many tributaries rivers have many distributaries [1] (v) Description Tick (✓) high drainage density low drainage density wide rivers much marsh or swamp [1] www.theallpapers.com
Question paper, page 5
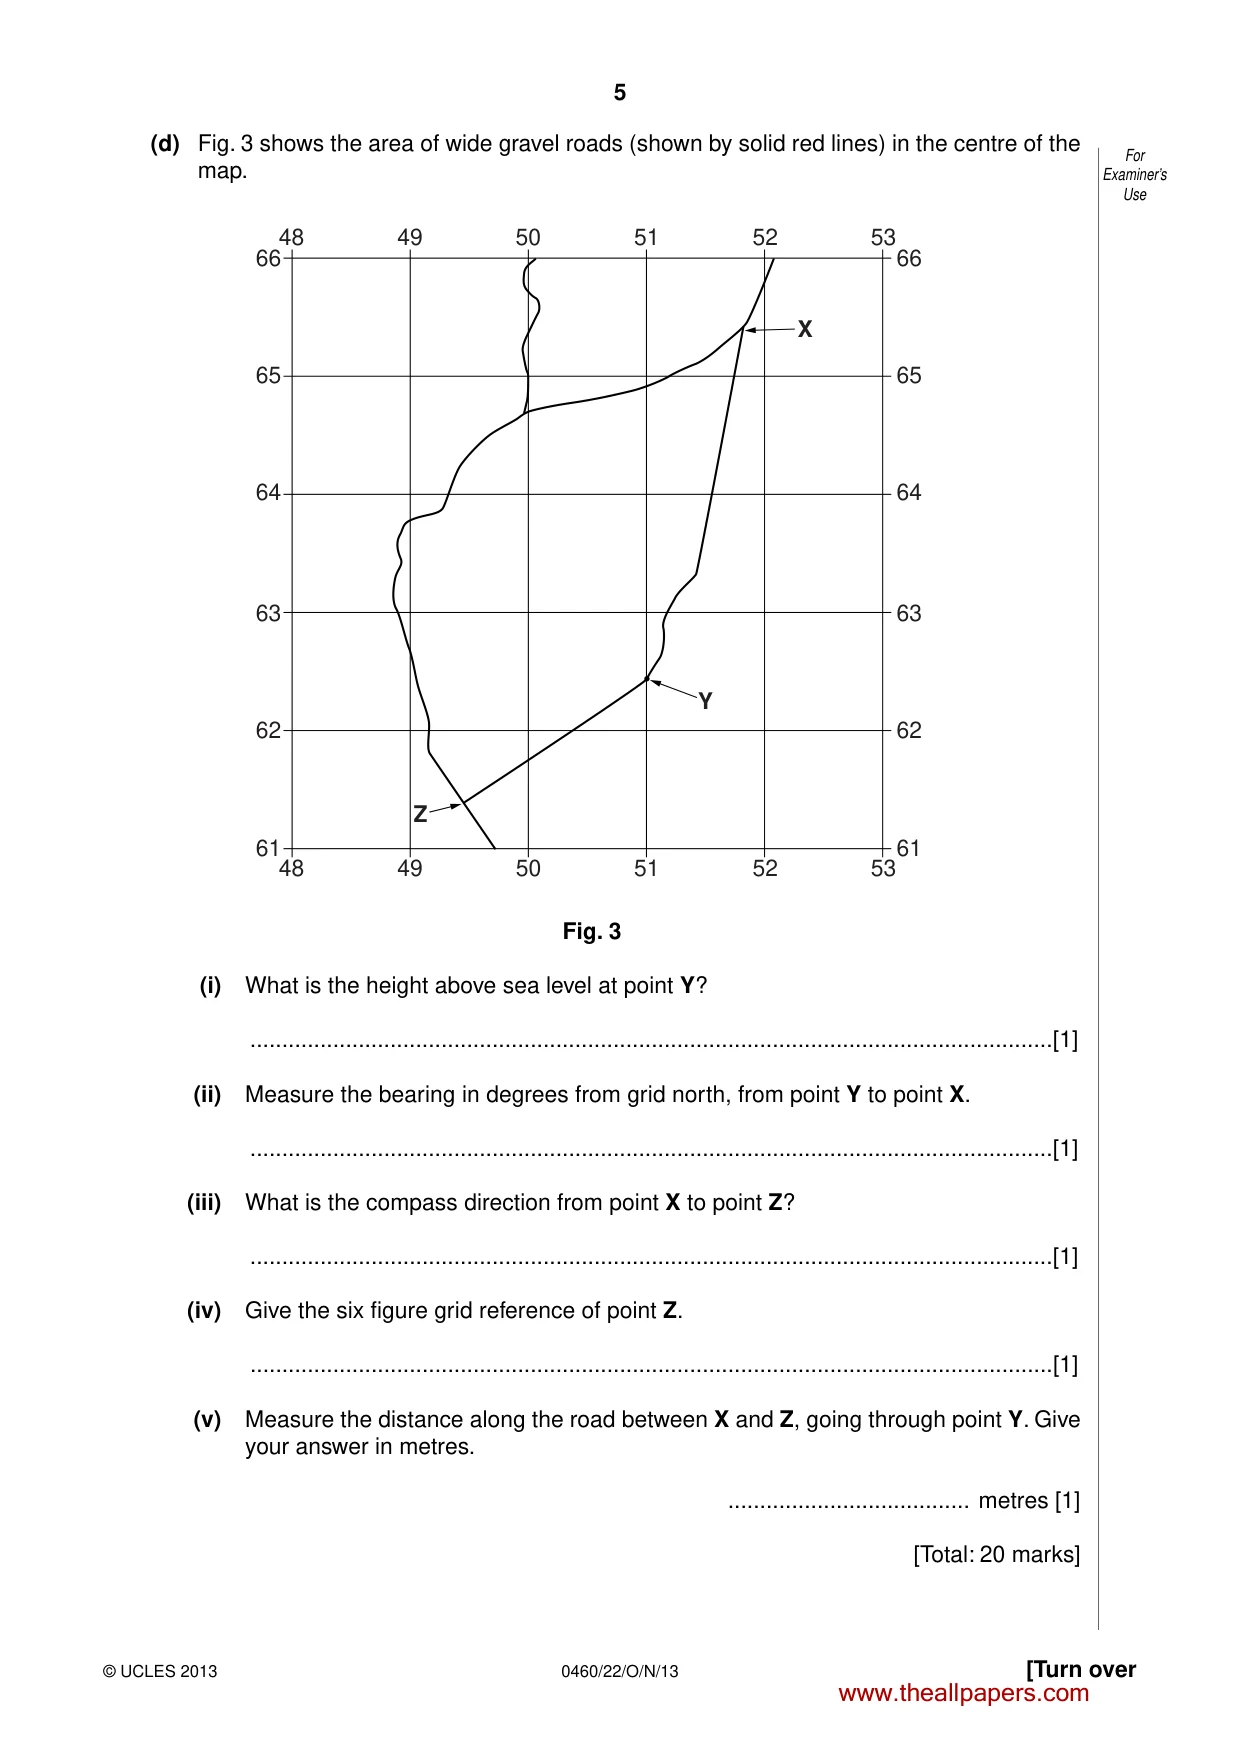
5 [Turn over For Examiner’s Use © UCLES 2013 0460/22/O/N/13 (d) Fig. 3 shows the area of wide gravel roads (shown by solid red lines) in the centre of the map. 48 49 50 51 52 53 48 61 62 63 64 65 66 61 62 63 64 65 66 49 50 51 52 53 X Y Z Fig. 3 (i) What is the height above sea level at point Y? …[1] (ii) Measure the bearing in degrees from grid north, from point Y to point X. …[1] (iii) What is the compass direction from point X to point Z? …[1] (iv) Give the six figure grid reference of point Z. …[1] (v) Measure the distance along the road between X and Z, going through point Y. Give your answer in metres. … metres [1] [Total: 20 marks] www.theallpapers.com
Question paper, page 6
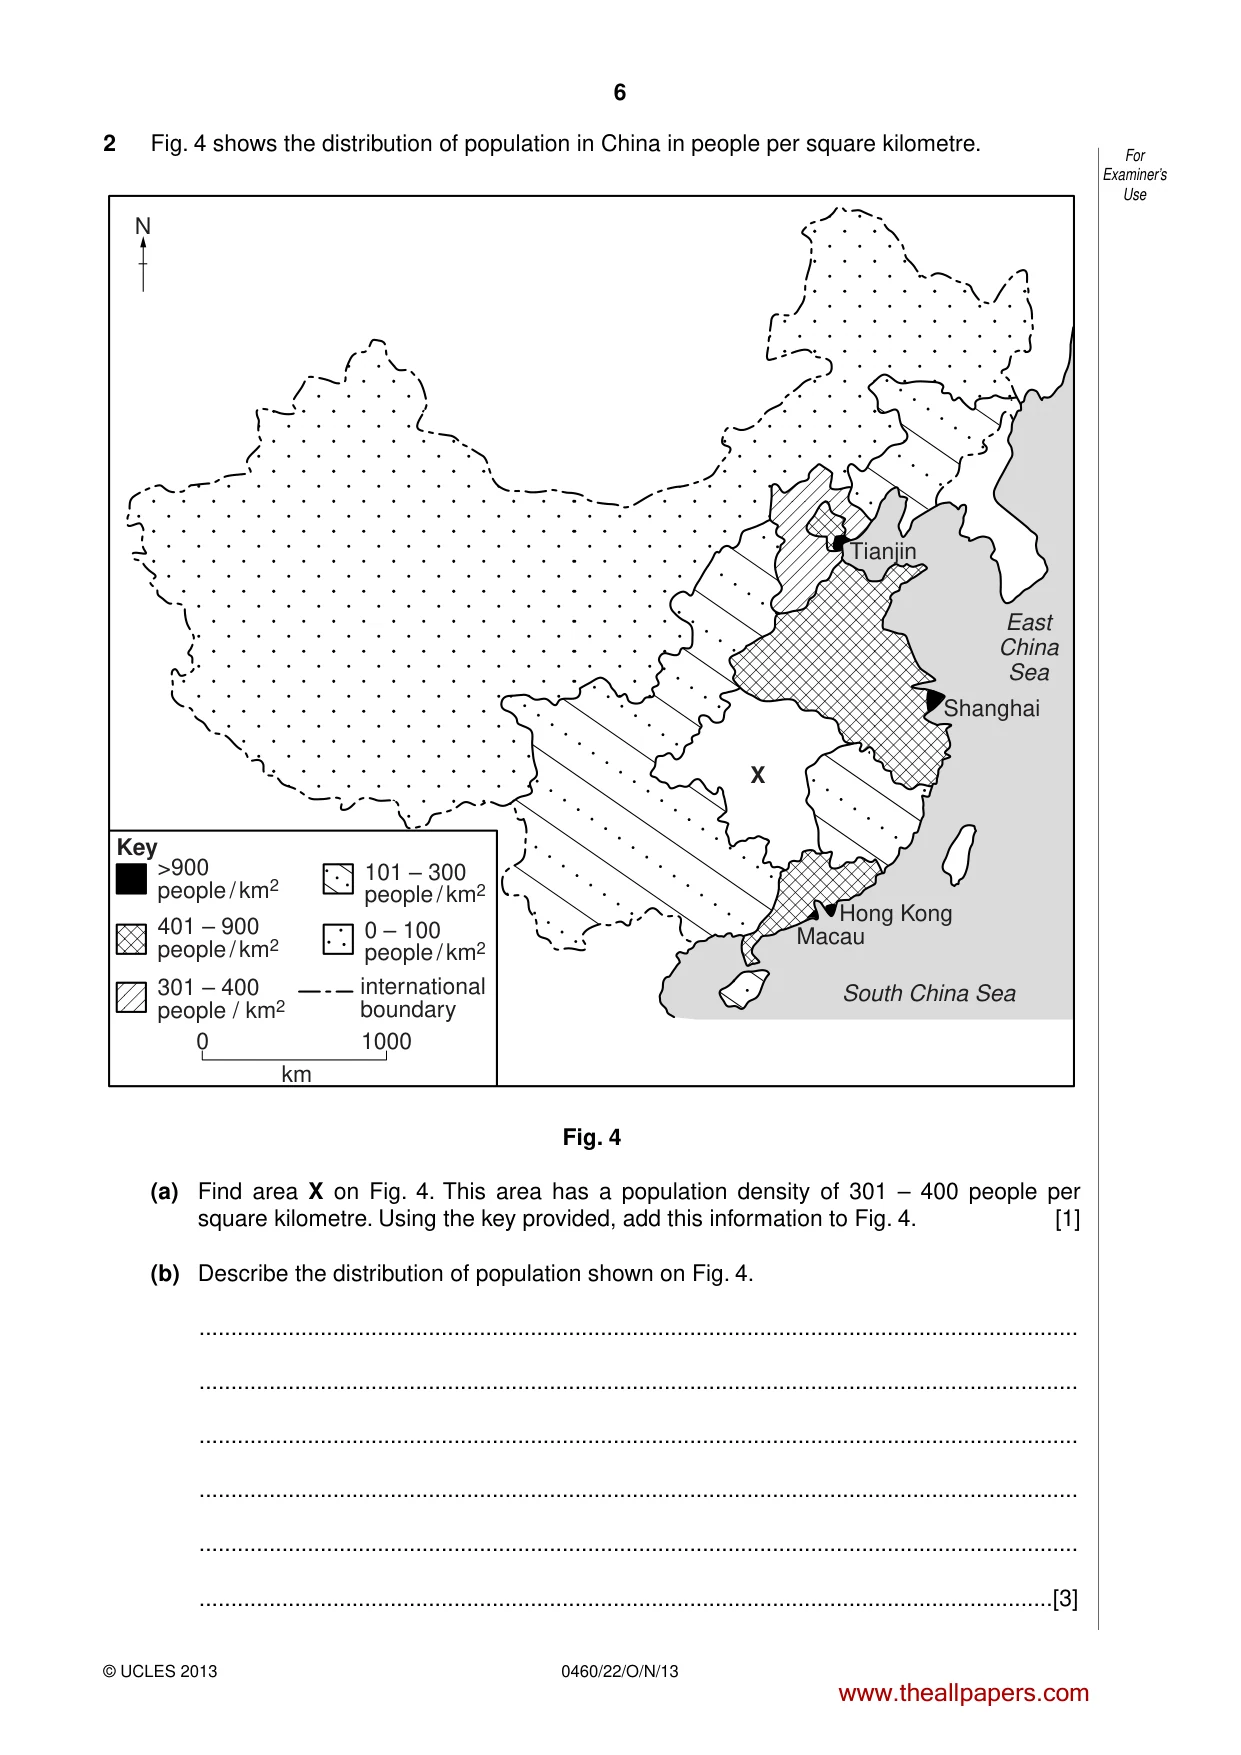
6 For Examiner’s Use 0460/22/O/N/13 © UCLES 2013 2 Fig. 4 shows the distribution of population in China in people per square kilometre. X >900 people / km2 Key 401 – 900 people / km2 301 – 400 people / km2 101 – 300 people / km2 0 – 100 people / km2 international boundary 0 1000 km Shanghai Tianjin Hong Kong South China Sea East China Sea Macau N Fig. 4 (a) Find area X on Fig. 4. This area has a population density of 301 – 400 people per square kilometre. Using the key provided, add this information to Fig. 4. [1] (b) Describe the distribution of population shown on Fig. 4. … … … … … …[3] www.theallpapers.com
Question paper, page 7
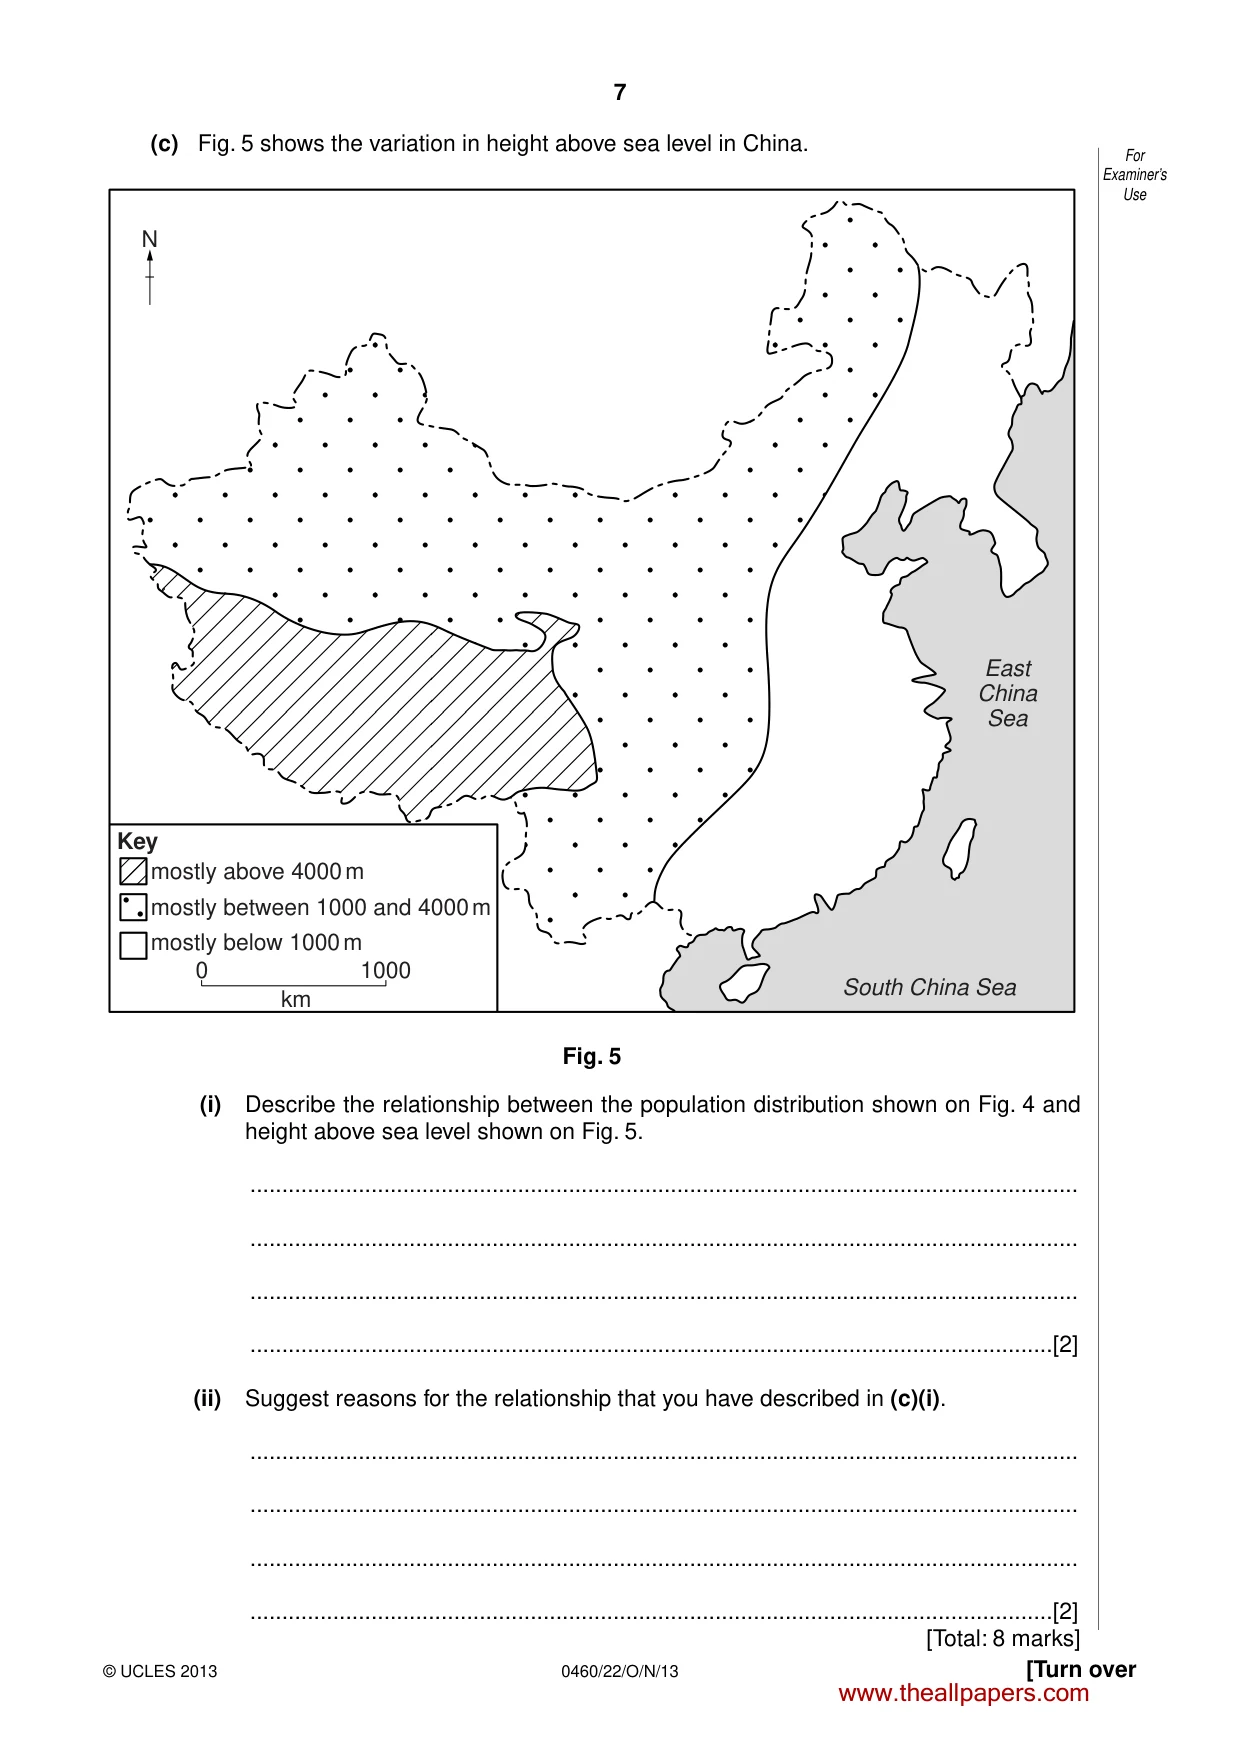
7 [Turn over For Examiner’s Use © UCLES 2013 0460/22/O/N/13 (c) Fig. 5 shows the variation in height above sea level in China. Key 0 1000 km South China Sea East China Sea N mostly above 4000 m mostly between 1000 and 4000 m mostly below 1000 m Fig. 5 (i) Describe the relationship between the population distribution shown on Fig. 4 and height above sea level shown on Fig. 5. … … … …[2] (ii) Suggest reasons for the relationship that you have described in (c)(i). … … … …[2] [Total: 8 marks] www.theallpapers.com
Question paper, page 8
8 0460/22/O/N/13 © UCLES 2013 BLANK PAGE www.theallpapers.com
Question paper, page 9
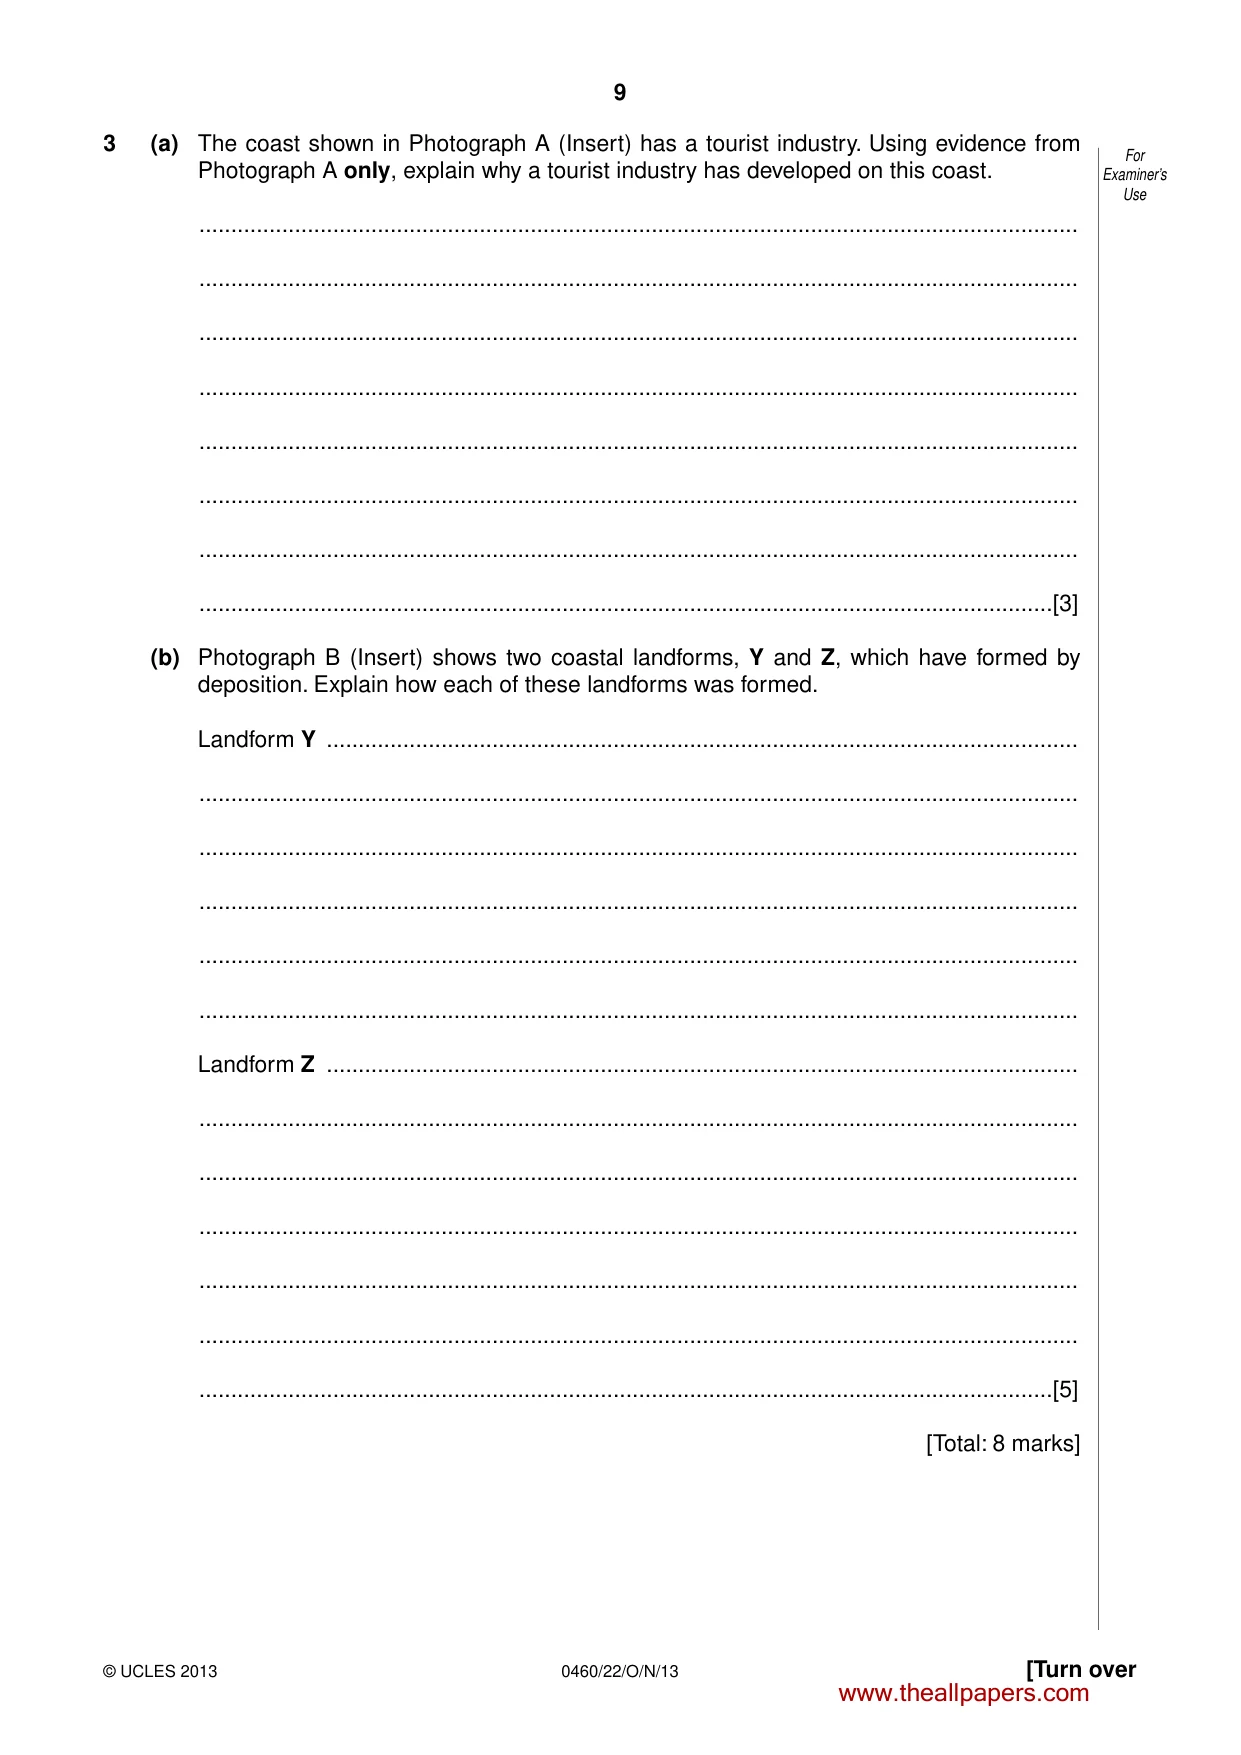
9 [Turn over For Examiner’s Use © UCLES 2013 0460/22/O/N/13 3 (a) The coast shown in Photograph A (Insert) has a tourist industry. Using evidence from Photograph A only, explain why a tourist industry has developed on this coast. … … … … … … … …[3] (b) Photograph B (Insert) shows two coastal landforms, Y and Z, which have formed by deposition. Explain how each of these landforms was formed. Landform Y … … … … … … Landform Z … … … … … … …[5] [Total: 8 marks] www.theallpapers.com
Question paper, page 10
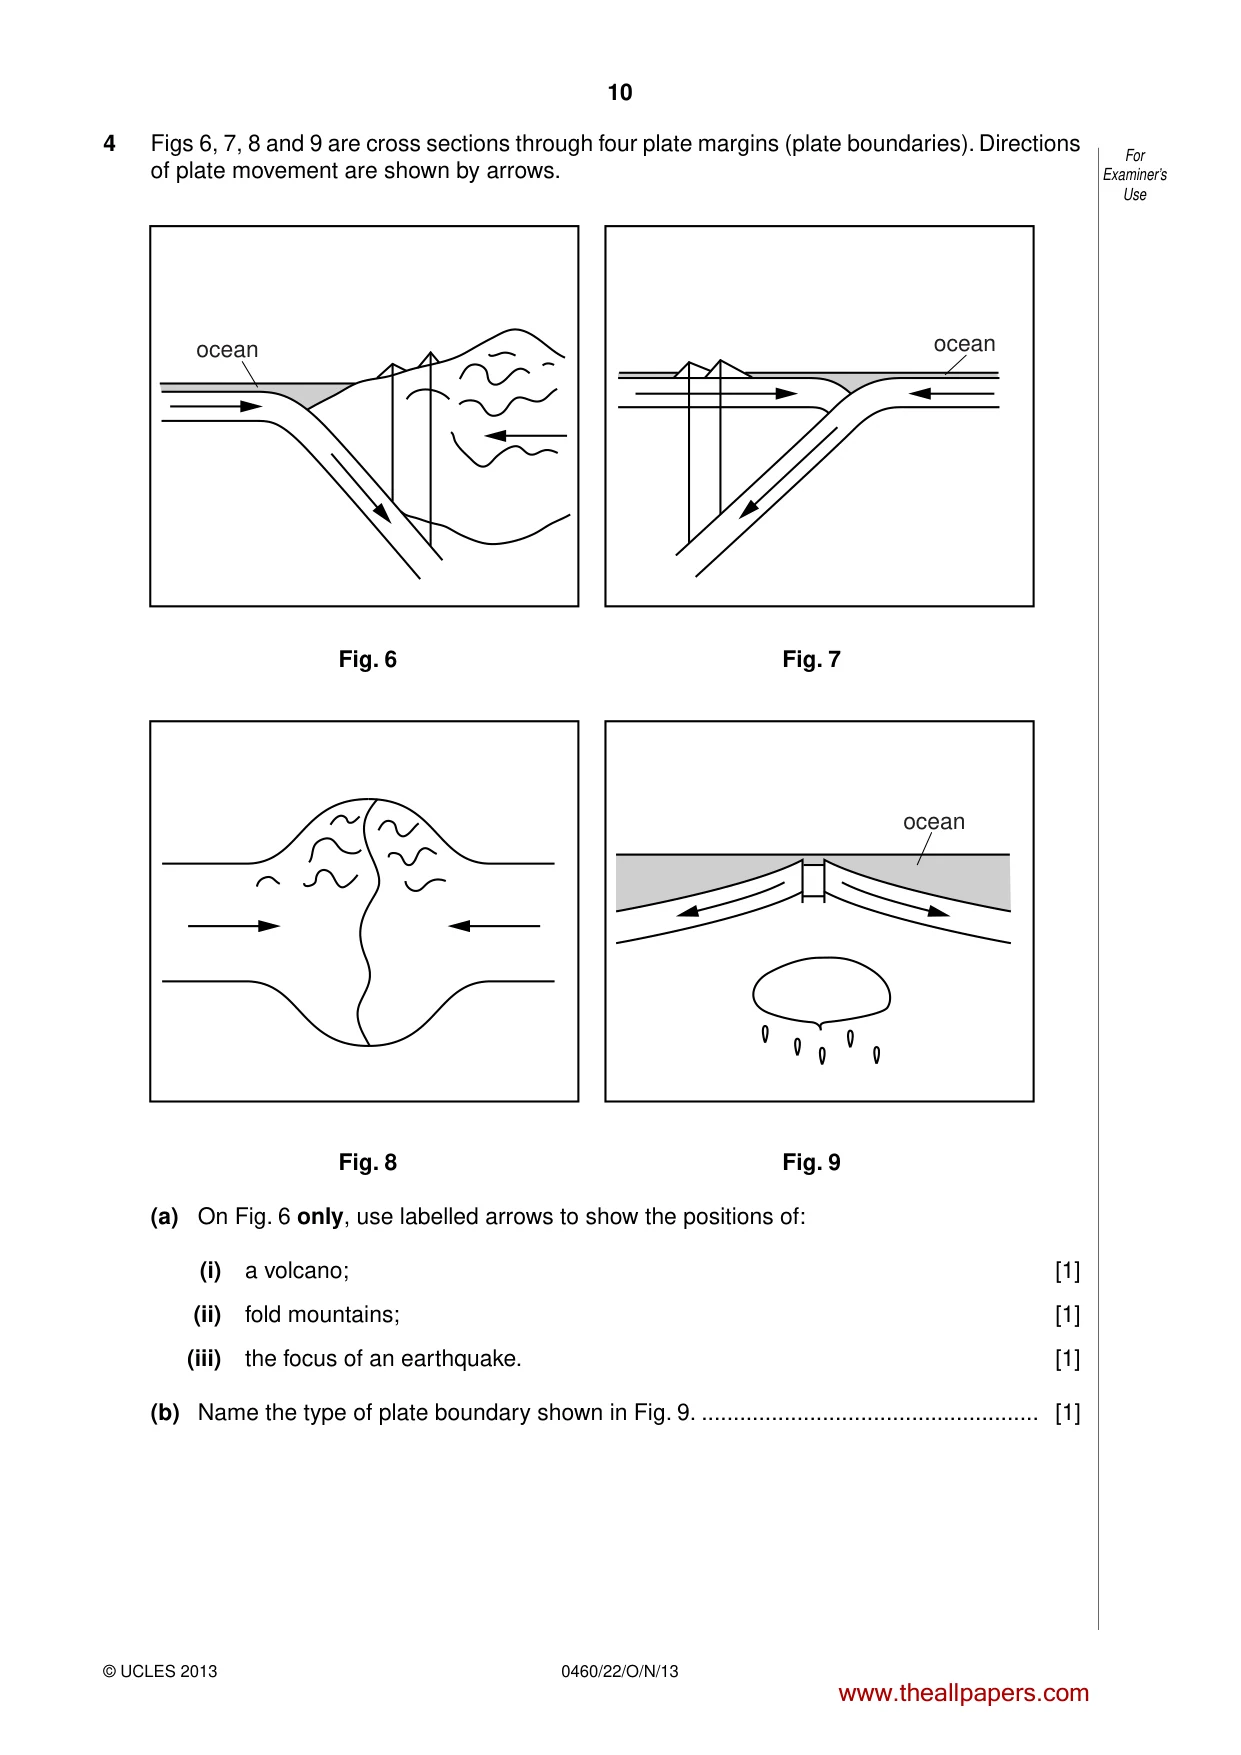
10 For Examiner’s Use 0460/22/O/N/13 © UCLES 2013 4 Figs 6, 7, 8 and 9 are cross sections through four plate margins (plate boundaries). Directions of plate movement are shown by arrows. ocean ocean Fig. 6 Fig. 7 ocean Fig. 8 Fig. 9 (a) On Fig. 6 only, use labelled arrows to show the positions of: (i) a volcano; [1] (ii) fold mountains; [1] (iii) the focus of an earthquake. [1] (b) Name the type of plate boundary shown in Fig. 9. … [1] www.theallpapers.com
Question paper, page 11
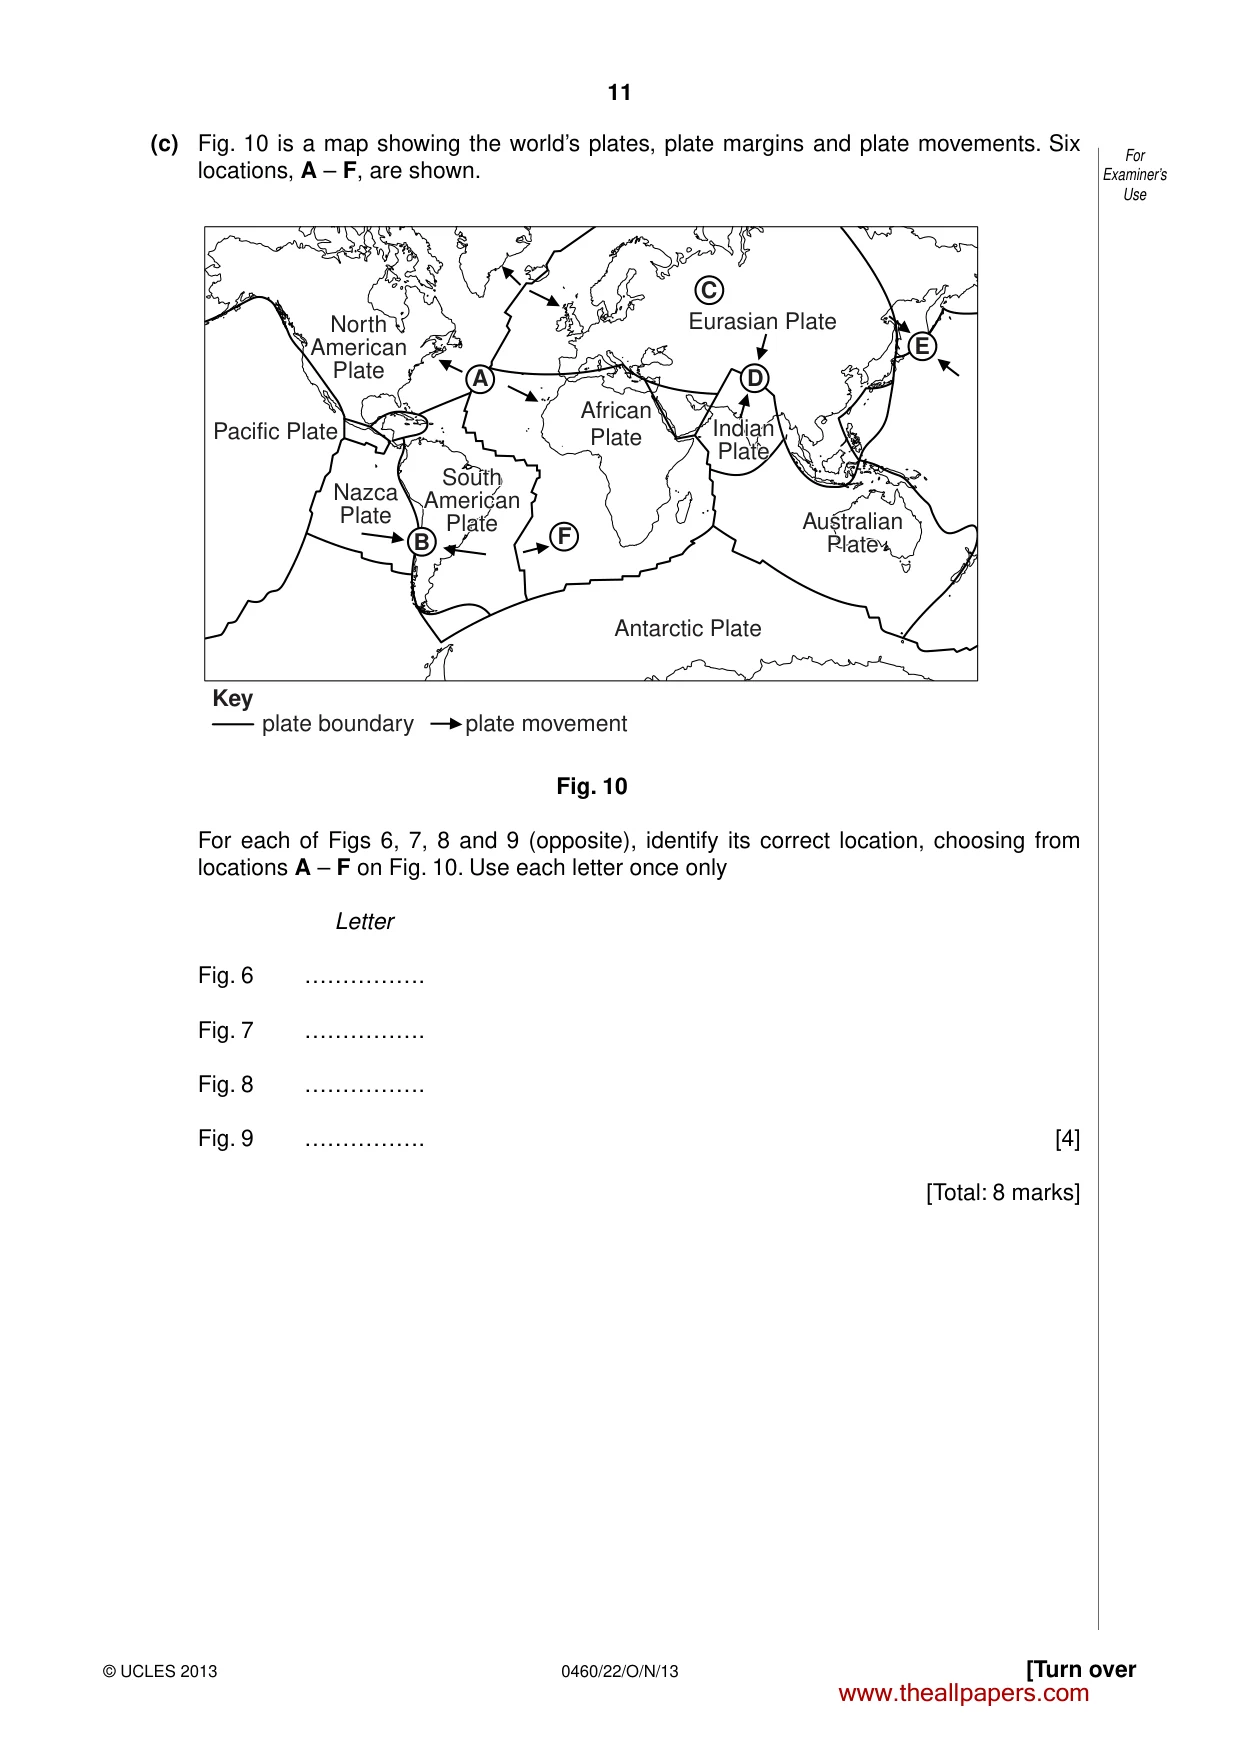
11 [Turn over For Examiner’s Use © UCLES 2013 0460/22/O/N/13 (c) Fig. 10 is a map showing the world’s plates, plate margins and plate movements. Six locations, A – F, are shown. B A C D F E Antarctic Plate African Plate North American Plate Australian Plate South American Plate Indian Plate Eurasian Plate Nazca Plate Key plate boundary plate movement Pacific Plate Fig. 10 For each of Figs 6, 7, 8 and 9 (opposite), identify its correct location, choosing from locations A – F on Fig. 10. Use each letter once only Letter Fig. 6 ……………. Fig. 7 ……………. Fig. 8 ……………. Fig. 9 ……………. [4] [Total: 8 marks] www.theallpapers.com
Question paper, page 12
12 0460/22/O/N/13 © UCLES 2013 BLANK PAGE www.theallpapers.com
Question paper, page 13
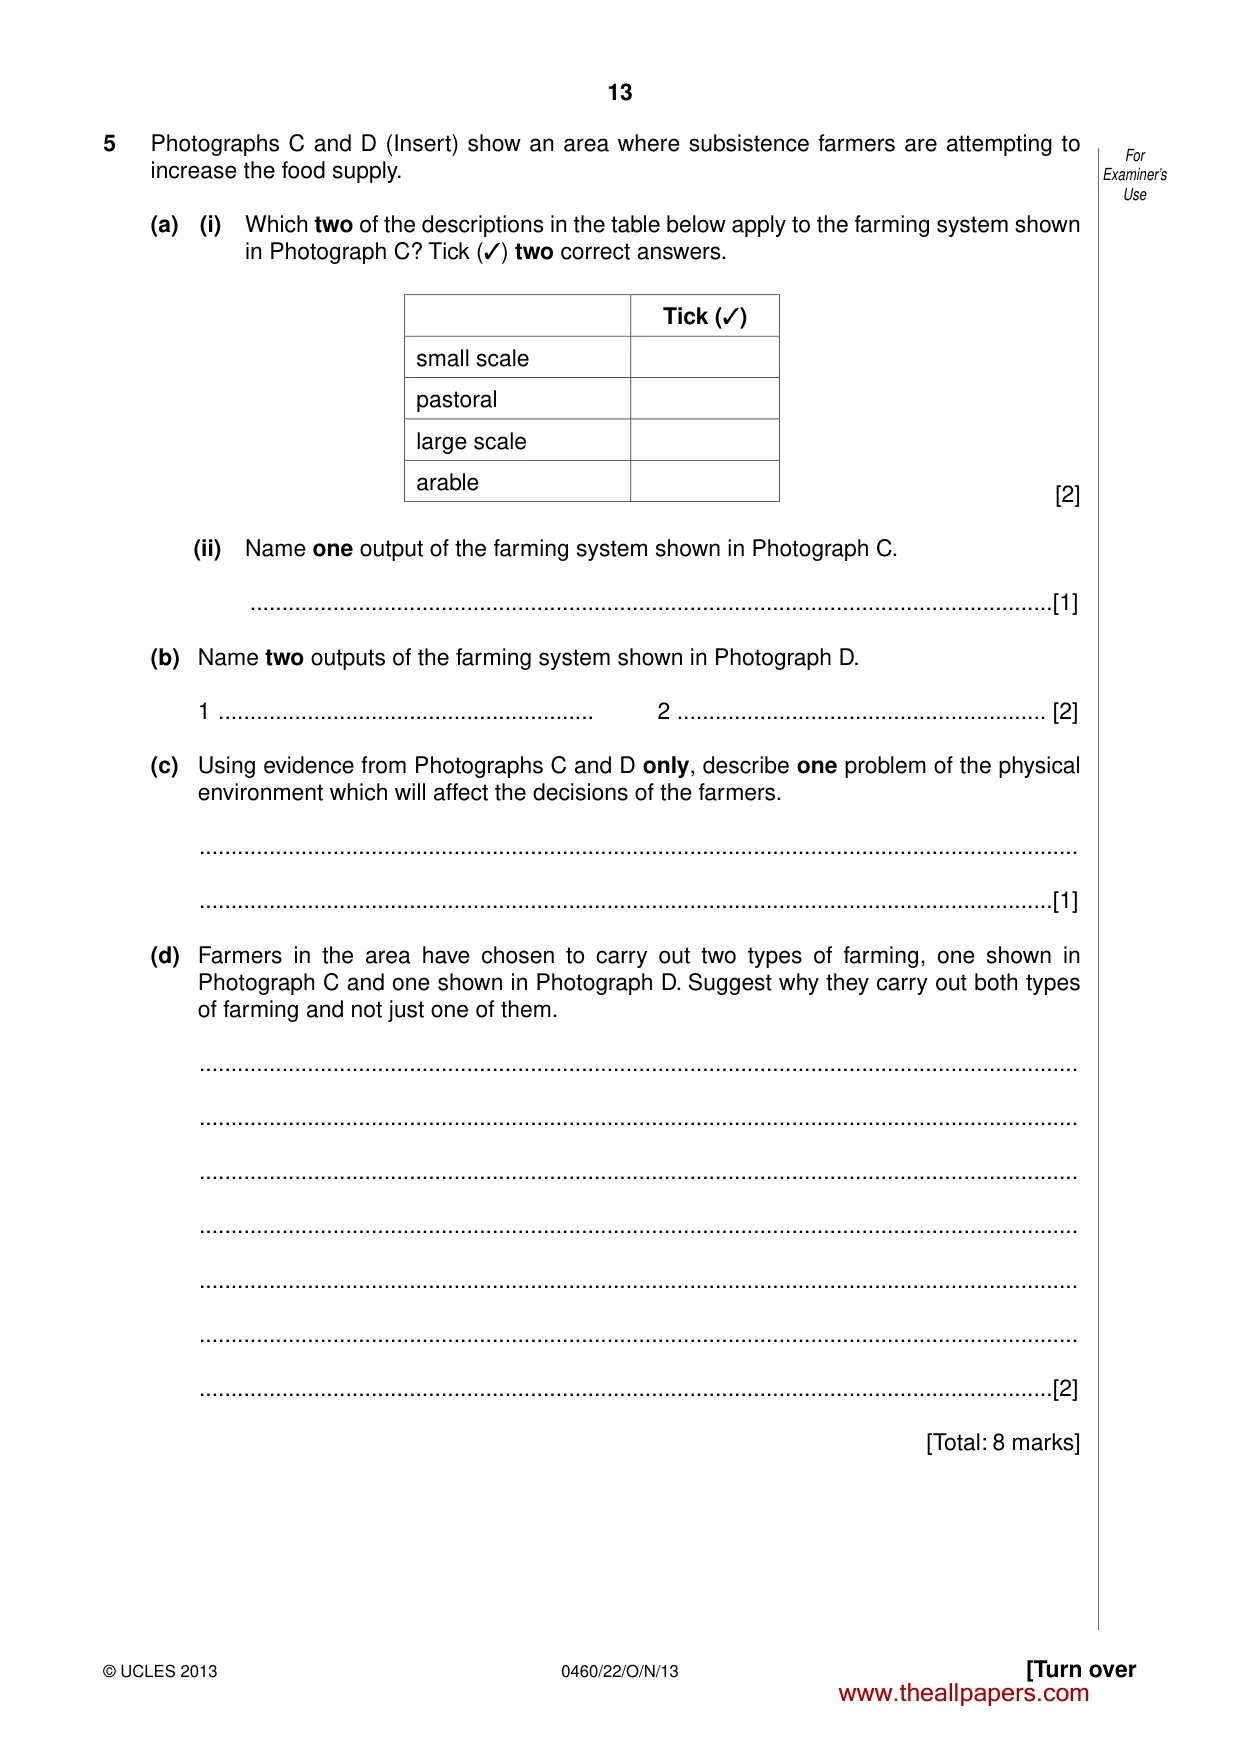
13 [Turn over For Examiner’s Use © UCLES 2013 0460/22/O/N/13 5 Photographs C and D (Insert) show an area where subsistence farmers are attempting to increase the food supply. (a) (i) Which two of the descriptions in the table below apply to the farming system shown in Photograph C? Tick (✓) two correct answers. Tick (✓) small scale pastoral large scale arable [2] (ii) Name one output of the farming system shown in Photograph C. …[1] (b) Name two outputs of the farming system shown in Photograph D. 1 … 2 … [2] (c) Using evidence from Photographs C and D only, describe one problem of the physical environment which will affect the decisions of the farmers. … …[1] (d) Farmers in the area have chosen to carry out two types of farming, one shown in Photograph C and one shown in Photograph D. Suggest why they carry out both types of farming and not just one of them. … … … … … … …[2] [Total: 8 marks] www.theallpapers.com
Question paper, page 14
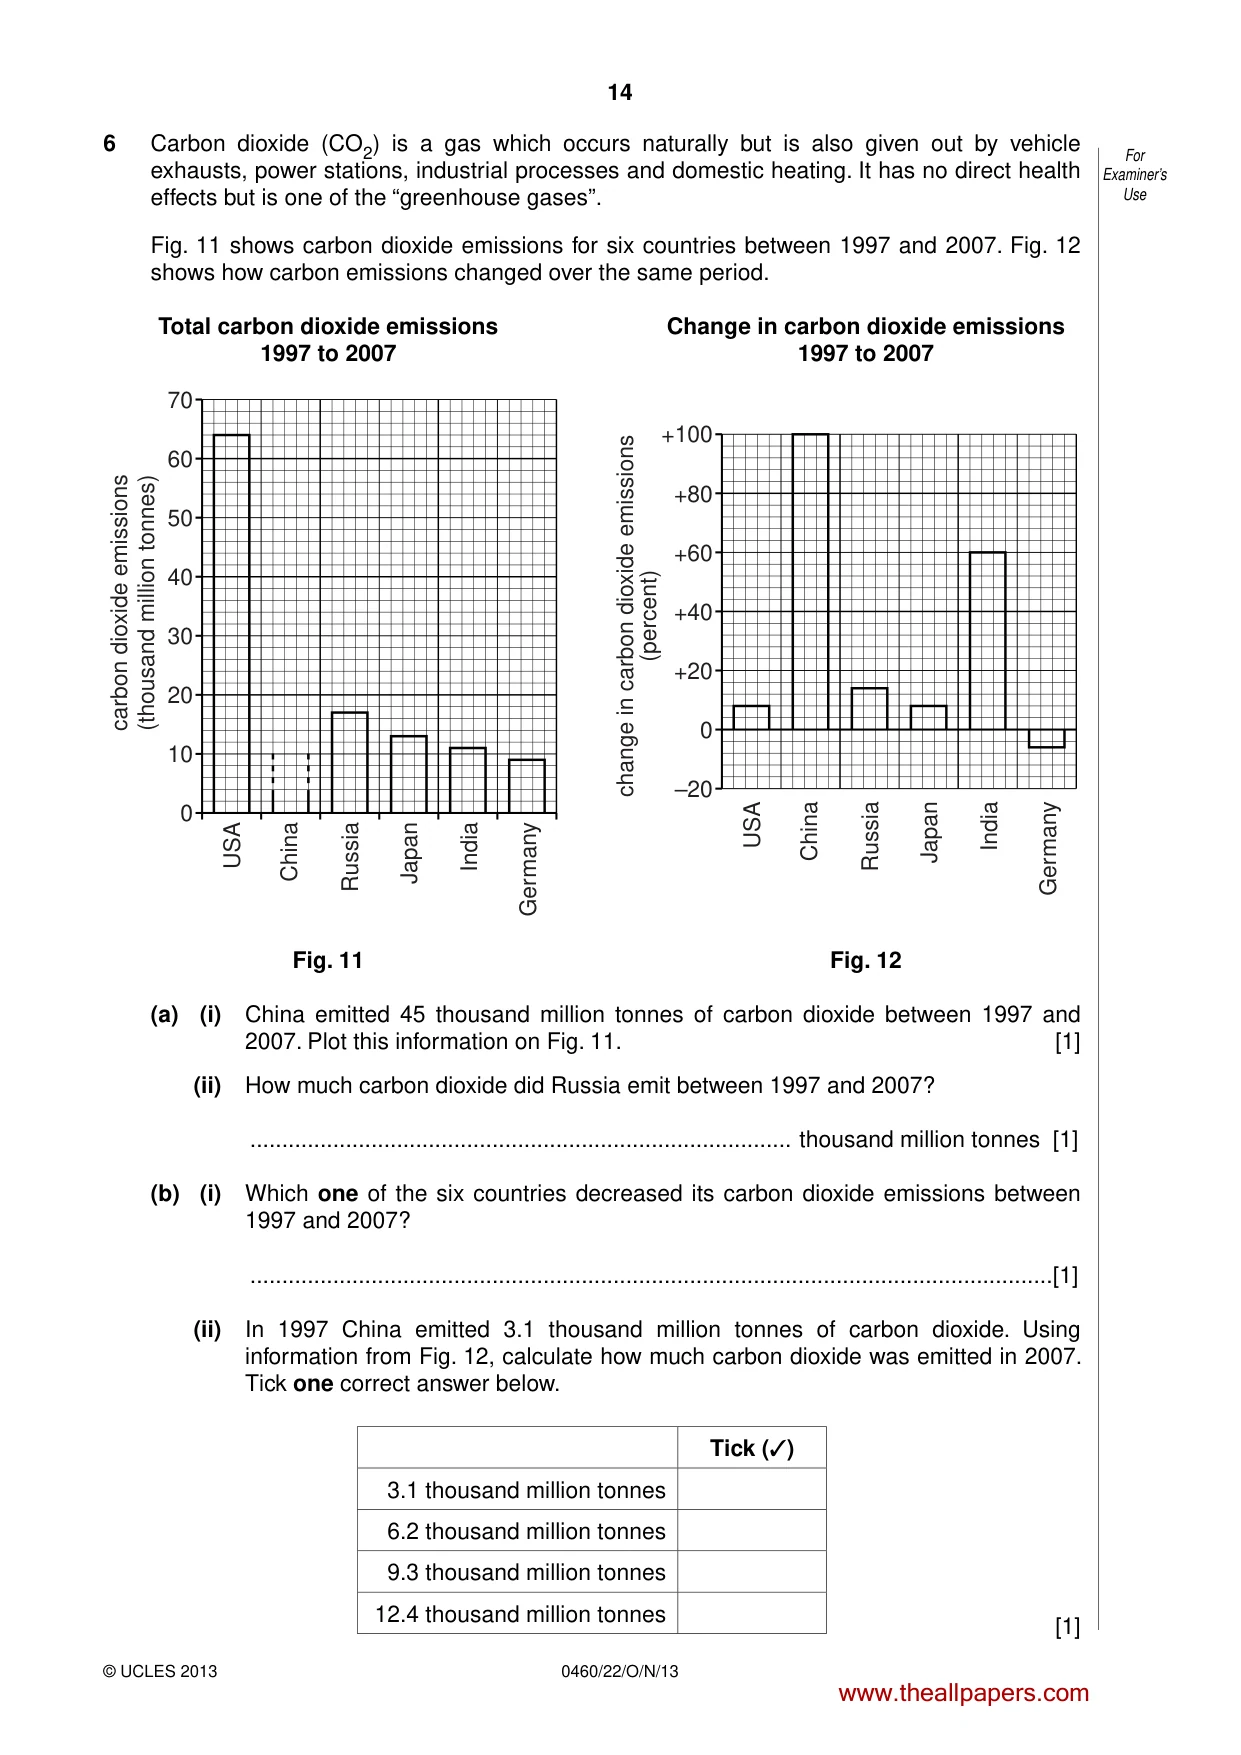
14 For Examiner’s Use 0460/22/O/N/13 © UCLES 2013 6 Carbon dioxide (CO2) is a gas which occurs naturally but is also given out by vehicle exhausts, power stations, industrial processes and domestic heating. It has no direct health effects but is one of the “greenhouse gases”. Fig. 11 shows carbon dioxide emissions for six countries between 1997 and 2007. Fig. 12 shows how carbon emissions changed over the same period. Total carbon dioxide emissions Change in carbon dioxide emissions 1997 to 2007 1997 to 2007 0 10 20 30 40 50 60 70 carbon dioxide emissions (thousand million tonnes) USA China Russia Japan India Germany –20 0 +20 +40 +60 +80 +100 change in carbon dioxide emissions (percent) USA China Russia Japan India Germany Fig. 11 Fig. 12 (a) (i) China emitted 45 thousand million tonnes of carbon dioxide between 1997 and 2007. Plot this information on Fig. 11. [1] (ii) How much carbon dioxide did Russia emit between 1997 and 2007? … thousand million tonnes [1] (b) (i) Which one of the six countries decreased its carbon dioxide emissions between 1997 and 2007? …[1] (ii) In 1997 China emitted 3.1 thousand million tonnes of carbon dioxide. Using information from Fig. 12, calculate how much carbon dioxide was emitted in 2007. Tick one correct answer below. Tick (✓) 3.1 thousand million tonnes 6.2 thousand million tonnes 9.3 thousand million tonnes 12.4 thousand million tonnes [1] www.theallpapers.com
Question paper, page 15
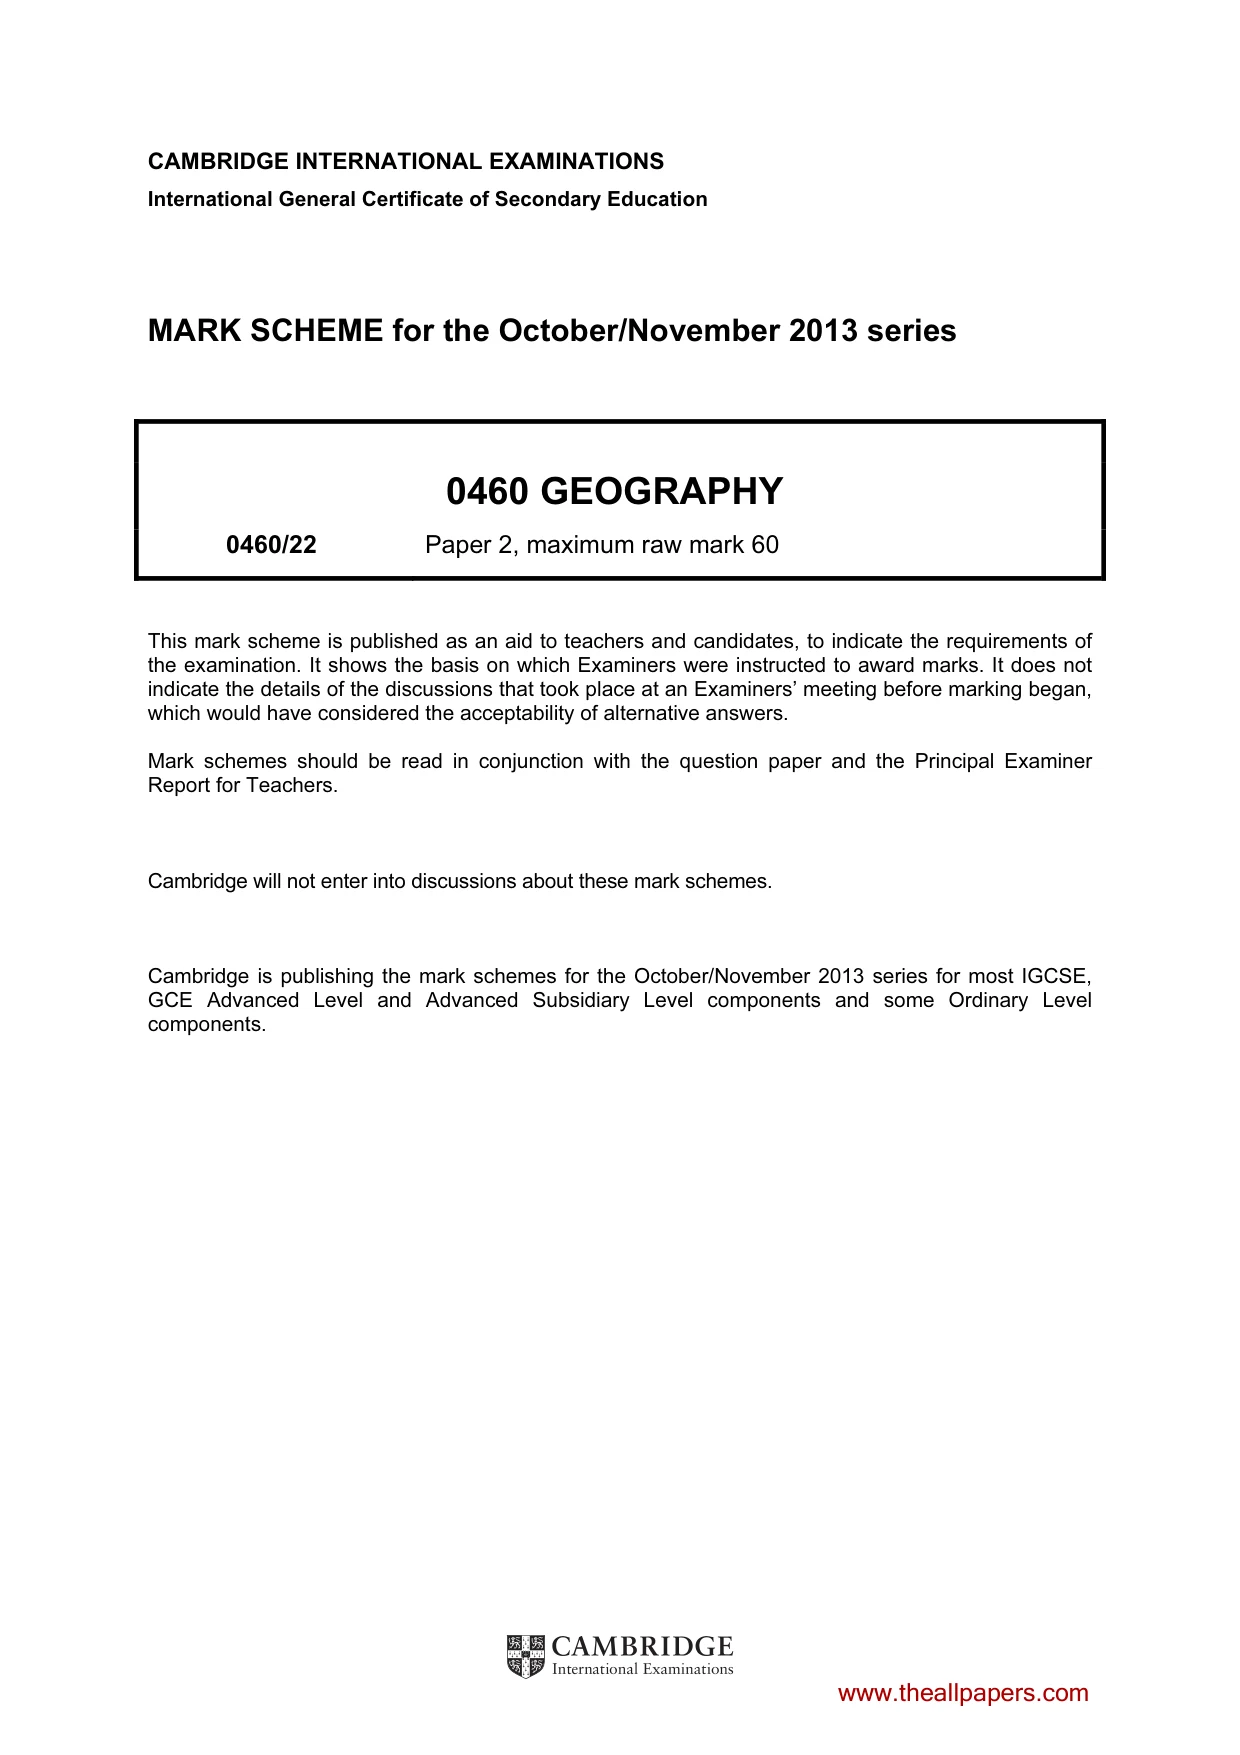
15 For Examiner’s Use © UCLES 2013 0460/22/O/N/13 (c) Fig. 13 shows the “greenhouse effect”. Ea rt h’ s su rf ac e short wave radiation long wave radiation to space long wave radiation absorbed by greenhouse gases short wave radiation long wave radiation back to earth long wave radiation Gre en ho us e g as es e.g . C O2 SUN Fig. 13 Using information from Fig. 13 only, explain how increases in the carbon dioxide content of the atmosphere could lead to climatic changes. … … … … … … … …[4] [Total: 8 marks] www.theallpapers.com
Question paper, page 16
16 0460/22/O/N/13 © UCLES 2013 Copyright Acknowledgements: Question 3 Photographs A and B David Kelly © UCLES. Question 5 Photographs C and D David Kelly © UCLES. Question 6 Figs 11 and 12 © Total Carbon Dioxide Emissions from the Consumption of Energy; http://www.eia.gov/cfapps/ipdbproject/IEDIndex3.cfm?tid=90&pid=44&aid=8. Permission to reproduce items where third-party owned material protected by copyright is included has been sought and cleared where possible. Every reasonable effort has been made by the publisher (UCLES) to trace copyright holders, but if any items requiring clearance have unwittingly been included, the publisher will be pleased to make amends at the earliest possible opportunity. University of Cambridge International Examinations is part of the Cambridge Assessment Group. Cambridge Assessment is the brand name of University of Cambridge Local Examinations Syndicate (UCLES), which is itself a department of the University of Cambridge. BLANK PAGE www.theallpapers.com
Mark scheme, page 1
CAMBRIDGE INTERNATIONAL EXAMINATIONS International General Certificate of Secondary Education MARK SCHEME for the October/November 2013 series 0460 GEOGRAPHY 0460/22 Paper 2, maximum raw mark 60 This mark scheme is published as an aid to teachers and candidates, to indicate the requirements of the examination. It shows the basis on which Examiners were instructed to award marks. It does not indicate the details of the discussions that took place at an Examiners’ meeting before marking began, which would have considered the acceptability of alternative answers. Mark schemes should be read in conjunction with the question paper and the Principal Examiner Report for Teachers. Cambridge will not enter into discussions about these mark schemes. Cambridge is publishing the mark schemes for the October/November 2013 series for most IGCSE, GCE Advanced Level and Advanced Subsidiary Level components and some Ordinary Level components. www.theallpapers.com
Mark scheme, page 2
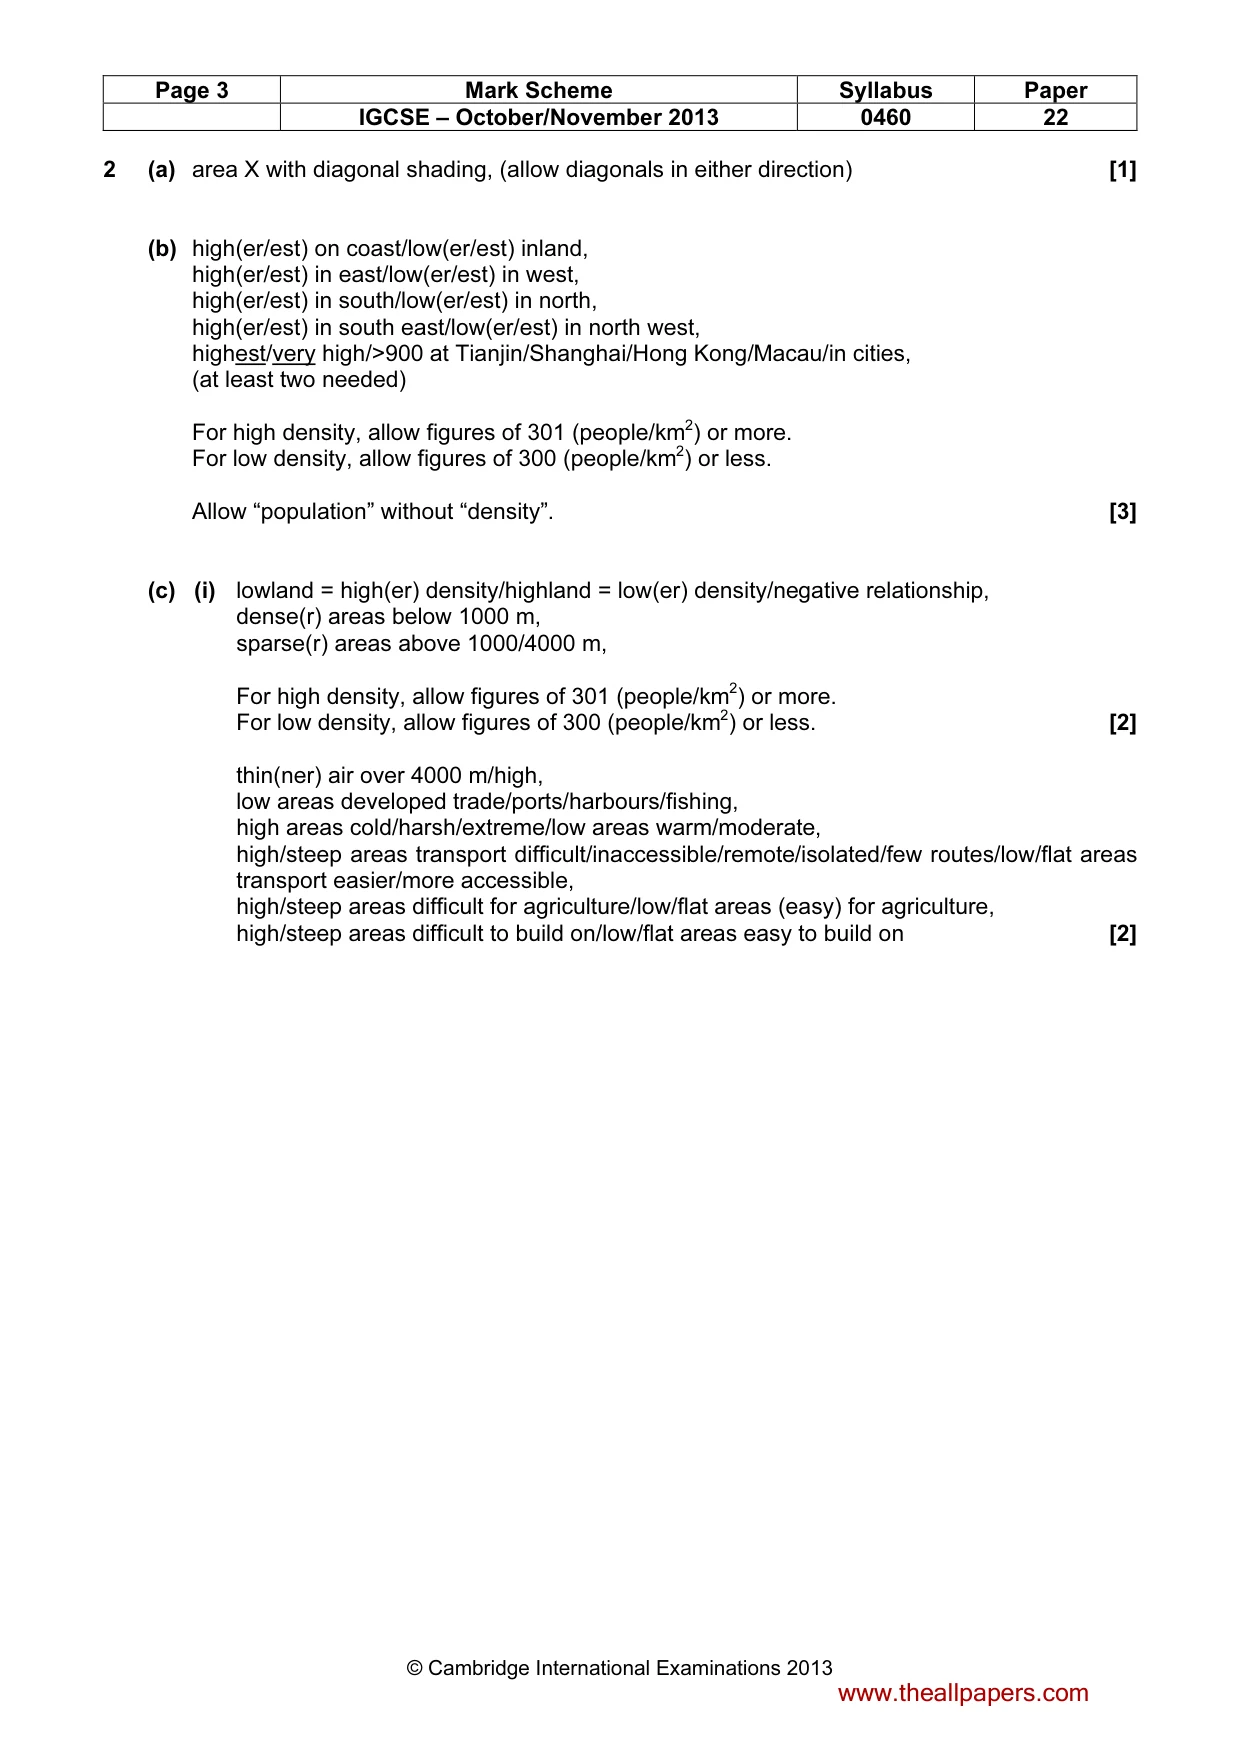
Page 2 Mark Scheme Syllabus Paper IGCSE – October/November 2013 0460 22 © Cambridge International Examinations 2013 1 (a) (i) dam [1] (ii) Mteri [1] (iii) narrow gravel/(narrow) earth [1] (iv) Lipfuli/national monument/place of historical interest [1] (v) compound, [1] cultivation/dam, (agriculture, cadastral boundary, narrow road, track and cut line don’t spoil) More than one answer and one is wrong = 0 (unless stated above). [1] (b) 4 correctly placed arrows within the following tolerances: (i) swamp 11–20 mm (allow 77–80 mm) [1] (ii) Lundi River 36–44 mm [1] (iii) pan 58–64 mm [1] (iv) west facing slope of Bendezi Hill 80–92 mm, (allow 77–95 mm if a range is given) Use the ruler device to measure the answers. Arrows should end within about 1cm of the profile. Measure to the point that the arrow projects to. There should be no ambiguity. If there is more than one response and one is wrong, or if a range is given and part is out of tolerance, then the answer = 0. Allow labels by names or question numbers. [1] (c) (i) average height between 340–400 m [1] (ii) mostly gentle slopes [1] (iii) main rivers flow south [1] (iv) rivers have many tributaries [1] (v) high drainage density [1] More than 1 tick per item = 0. (d) (i) 368 m [1] (ii) 13–17(0) [1] (iii) south west/south south west [1] (iv) 494613/4 [1] (v) 5000–5200 (m) [1] www.theallpapers.com
Mark scheme, page 3
Page 3 Mark Scheme Syllabus Paper IGCSE – October/November 2013 0460 22 © Cambridge International Examinations 2013 2 (a) area X with diagonal shading, (allow diagonals in either direction) [1] (b) high(er/est) on coast/low(er/est) inland, high(er/est) in east/low(er/est) in west, high(er/est) in south/low(er/est) in north, high(er/est) in south east/low(er/est) in north west, highest/very high/>900 at Tianjin/Shanghai/Hong Kong/Macau/in cities, (at least two needed) For high density, allow figures of 301 (people/km2) or more. For low density, allow figures of 300 (people/km2) or less. Allow “population” without “density”. [3] (c) (i) lowland = high(er) density/highland = low(er) density/negative relationship, dense(r) areas below 1000 m, sparse(r) areas above 1000/4000 m, For high density, allow figures of 301 (people/km2) or more. For low density, allow figures of 300 (people/km2) or less. [2] thin(ner) air over 4000 m/high, low areas developed trade/ports/harbours/fishing, high areas cold/harsh/extreme/low areas warm/moderate, high/steep areas transport difficult/inaccessible/remote/isolated/few routes/low/flat areas transport easier/more accessible, high/steep areas difficult for agriculture/low/flat areas (easy) for agriculture, high/steep areas difficult to build on/low/flat areas easy to build on [2] www.theallpapers.com
Mark scheme, page 4
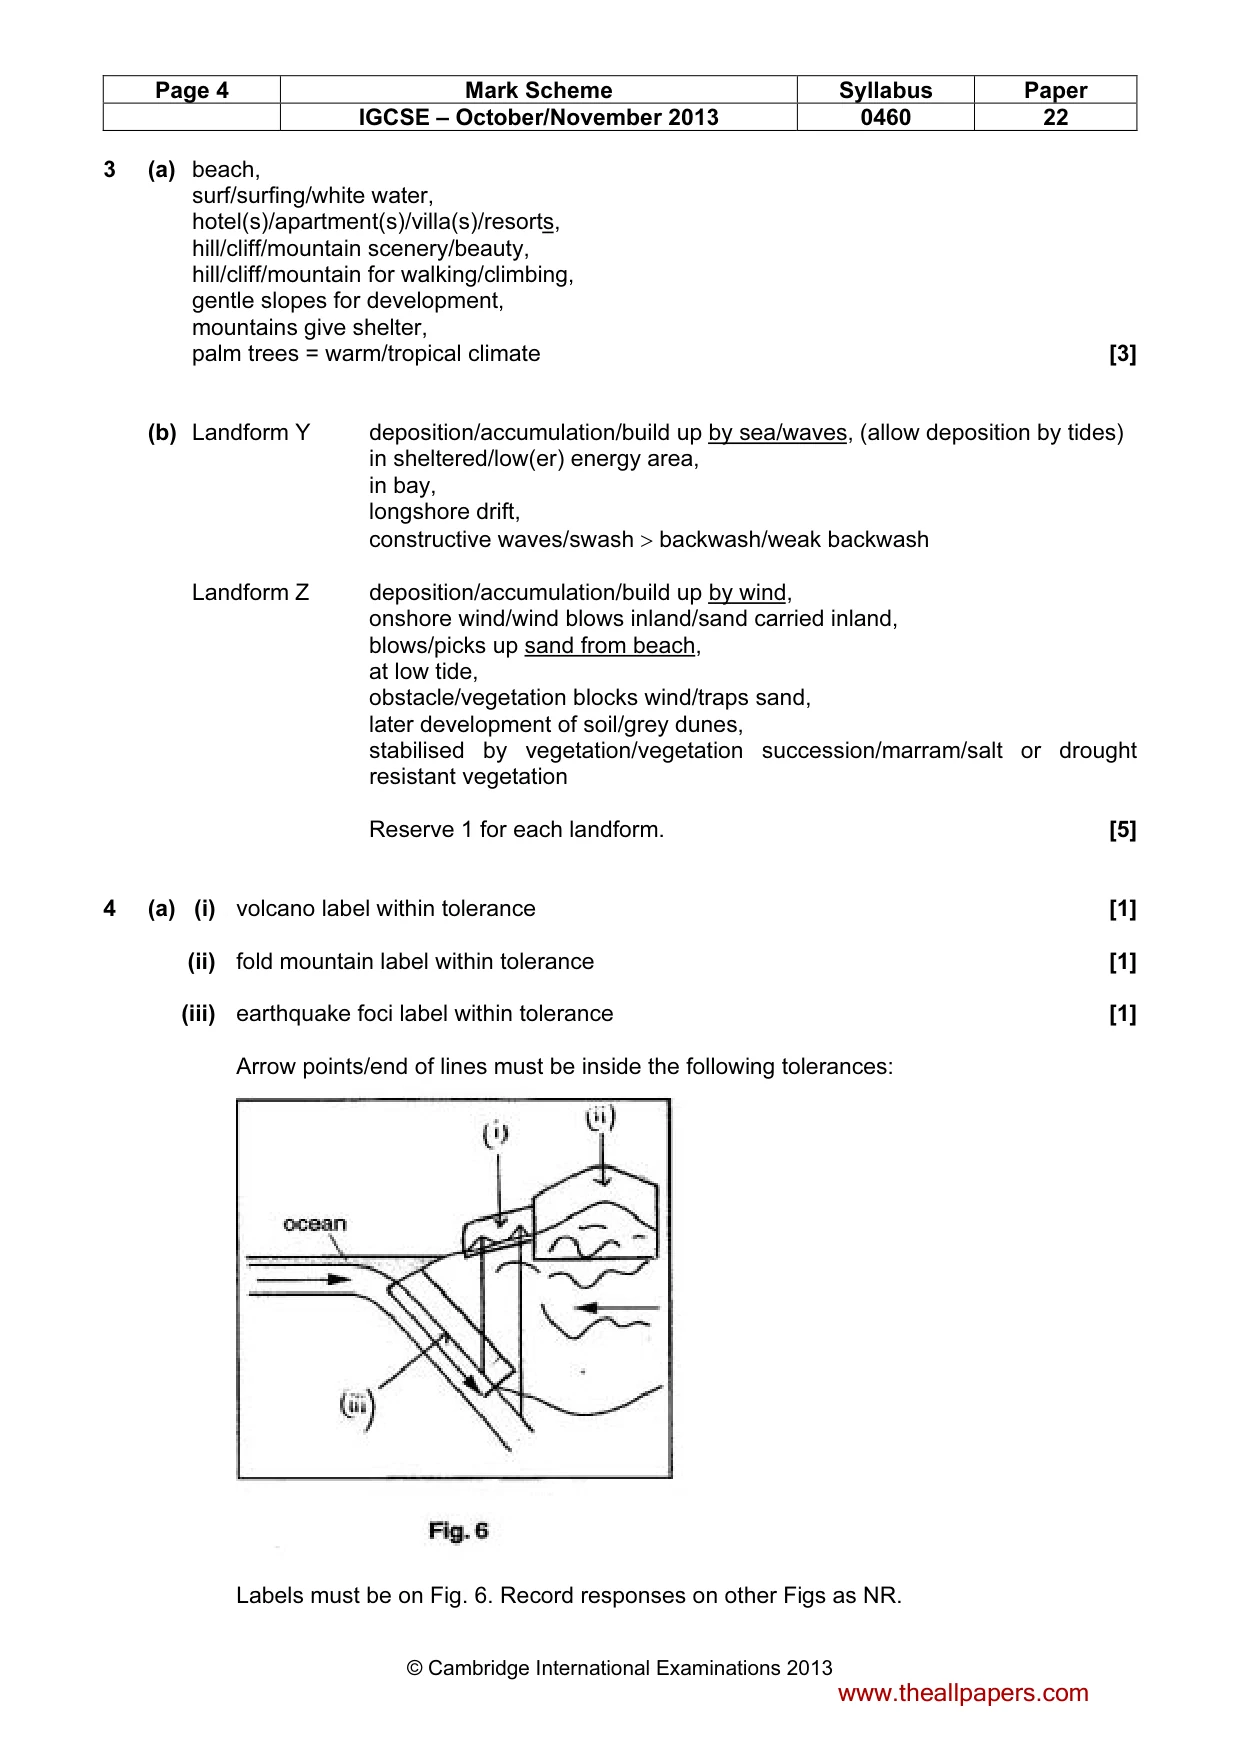
Page 4 Mark Scheme Syllabus Paper IGCSE – October/November 2013 0460 22 © Cambridge International Examinations 2013 3 (a) beach, surf/surfing/white water, hotel(s)/apartment(s)/villa(s)/resorts, hill/cliff/mountain scenery/beauty, hill/cliff/mountain for walking/climbing, gentle slopes for development, mountains give shelter, palm trees = warm/tropical climate [3] (b) Landform Y deposition/accumulation/build up by sea/waves, (allow deposition by tides) in sheltered/low(er) energy area, in bay, longshore drift, constructive waves/swash > backwash/weak backwash Landform Z deposition/accumulation/build up by wind, onshore wind/wind blows inland/sand carried inland, blows/picks up sand from beach, at low tide, obstacle/vegetation blocks wind/traps sand, later development of soil/grey dunes, stabilised by vegetation/vegetation succession/marram/salt or drought resistant vegetation Reserve 1 for each landform. [5] 4 (a) (i) volcano label within tolerance [1] (ii) fold mountain label within tolerance [1] (iii) earthquake foci label within tolerance [1] Arrow points/end of lines must be inside the following tolerances: Labels must be on Fig. 6. Record responses on other Figs as NR. www.theallpapers.com
Mark scheme, page 5
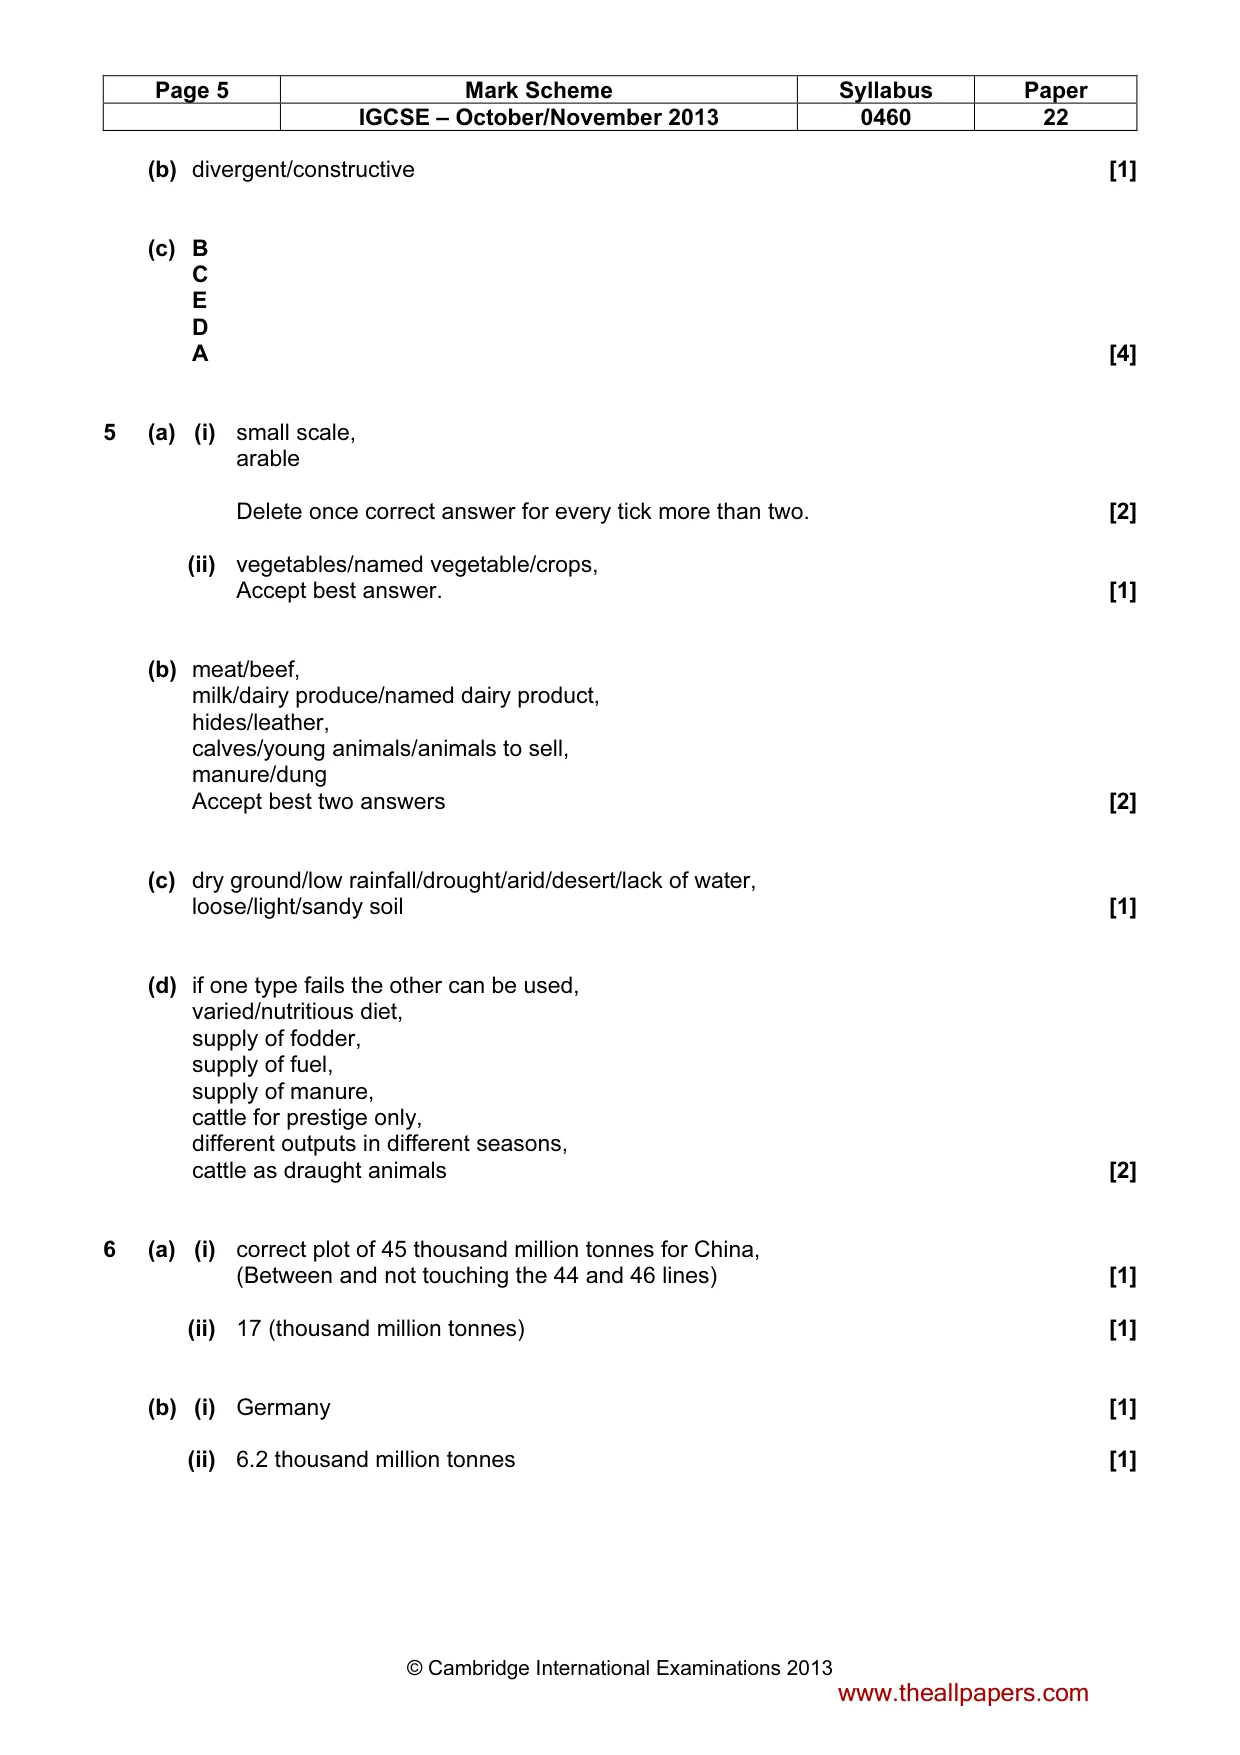
Page 5 Mark Scheme Syllabus Paper IGCSE – October/November 2013 0460 22 © Cambridge International Examinations 2013 (b) divergent/constructive [1] (c) B C E D A [4] 5 (a) (i) small scale, arable Delete once correct answer for every tick more than two. [2] (ii) vegetables/named vegetable/crops, Accept best answer. [1] (b) meat/beef, milk/dairy produce/named dairy product, hides/leather, calves/young animals/animals to sell, manure/dung Accept best two answers [2] (c) dry ground/low rainfall/drought/arid/desert/lack of water, loose/light/sandy soil [1] (d) if one type fails the other can be used, varied/nutritious diet, supply of fodder, supply of fuel, supply of manure, cattle for prestige only, different outputs in different seasons, cattle as draught animals [2] 6 (a) (i) correct plot of 45 thousand million tonnes for China, (Between and not touching the 44 and 46 lines) [1] (ii) 17 (thousand million tonnes) [1] (b) (i) Germany [1] (ii) 6.2 thousand million tonnes [1] www.theallpapers.com
Mark scheme, page 6
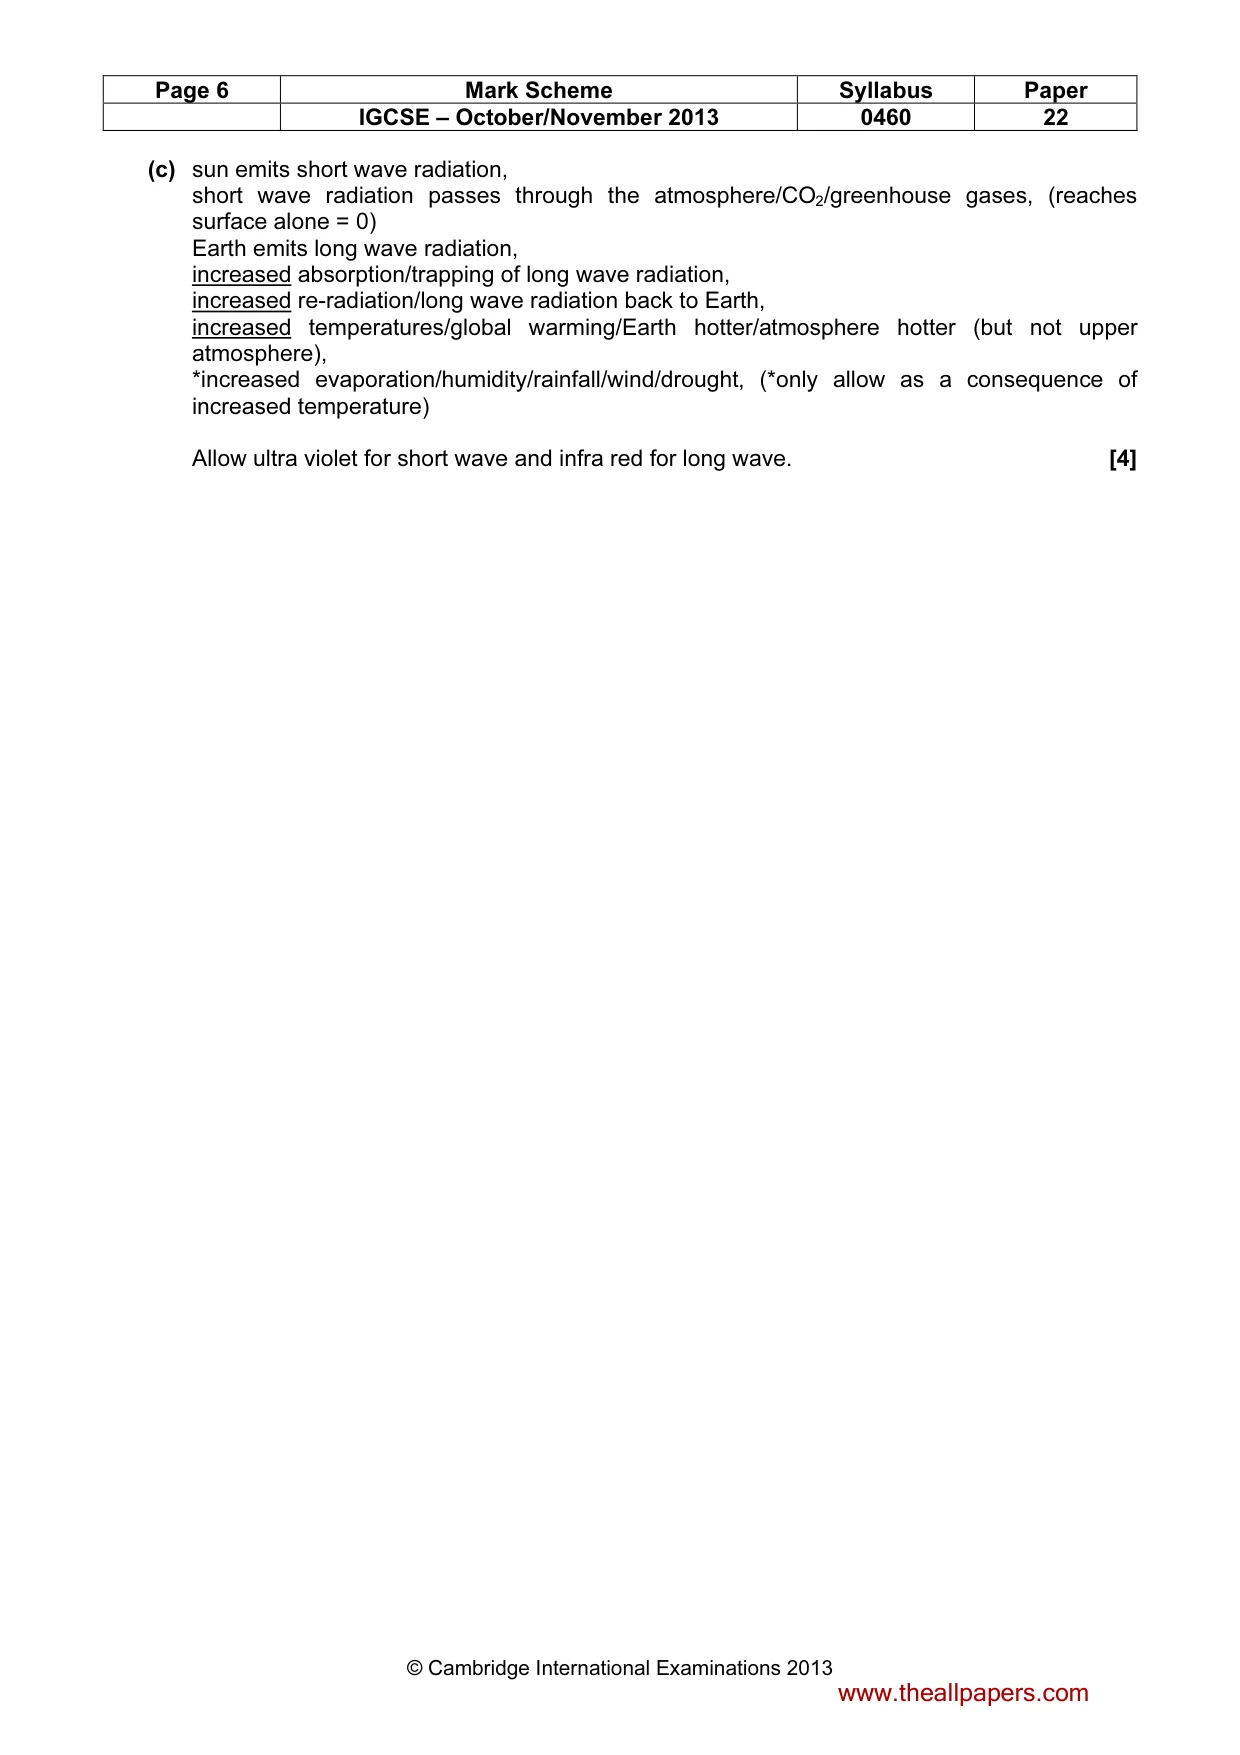
Page 6 Mark Scheme Syllabus Paper IGCSE – October/November 2013 0460 22 © Cambridge International Examinations 2013 (c) sun emits short wave radiation, short wave radiation passes through the atmosphere/CO2/greenhouse gases, (reaches surface alone = 0) Earth emits long wave radiation, increased absorption/trapping of long wave radiation, increased re-radiation/long wave radiation back to Earth, increased temperatures/global warming/Earth hotter/atmosphere hotter (but not upper atmosphere), *increased evaporation/humidity/rainfall/wind/drought, (*only allow as a consequence of increased temperature) Allow ultra violet for short wave and infra red for long wave. [4] www.theallpapers.com
What you needed in this session
Cambridge’s own grade thresholds for 2013 Oct/Nov, Paper 2 · Variant 2. A higher threshold means an easier paper — the bar moves with how the cohort did.