Cambridge IGCSE Geography 0460 — 2012 May/June Paper 2 · Variant 2
0460/22/M/J/12 · 60 marks · ≈68 min
The question paper and its mark scheme, free to read here and free to download. This is Cambridge’s own paper, exactly as it was sat.
Question paper16 pages


Mark scheme5 pages
Answers below. Sit the paper first if you are practising.
Paper as text
Question paper, page 1
This document consists of 13 printed pages, 3 blank pages and 1 Insert. DC (LEO/JG) 47677/6 © UCLES 2012 [Turn over UNIVERSITY OF CAMBRIDGE INTERNATIONAL EXAMINATIONS International General Certificate of Secondary Education * 8 9 4 7 4 7 4 5 3 8 * GEOGRAPHY 0460/22 Paper 2 May/June 2012 1 hour 30 minutes Candidates answer on the Question Paper. Additional Materials: Ruler Protractor Plain paper 1:50 000 Survey Map Extract is enclosed with this question paper. READ THESE INSTRUCTIONS FIRST Write your Centre number, candidate number and name in the spaces provided. Write in dark blue or black pen. You may use a soft pencil for any diagrams, graphs or rough working. Do not use staples, paper clips, highlighters, glue or correction fluid. DO NOT WRITE ON ANY BARCODES. Answer all questions. The Insert contains Photographs A and B for Question 4, and Photographs C, D and E for Question 6. The Survey Map Extract and the Insert are not required by the Examiner. Sketch maps and diagrams should be drawn whenever they serve to illustrate an answer. At the end of the examination, fasten all your work securely together. The number of marks is given in brackets [ ] at the end of each question or part question. For Examiner’s Use Q1 Q2 Q3 Q4 Q5 Q6 Total www.theallpapers.com
Question paper, page 2
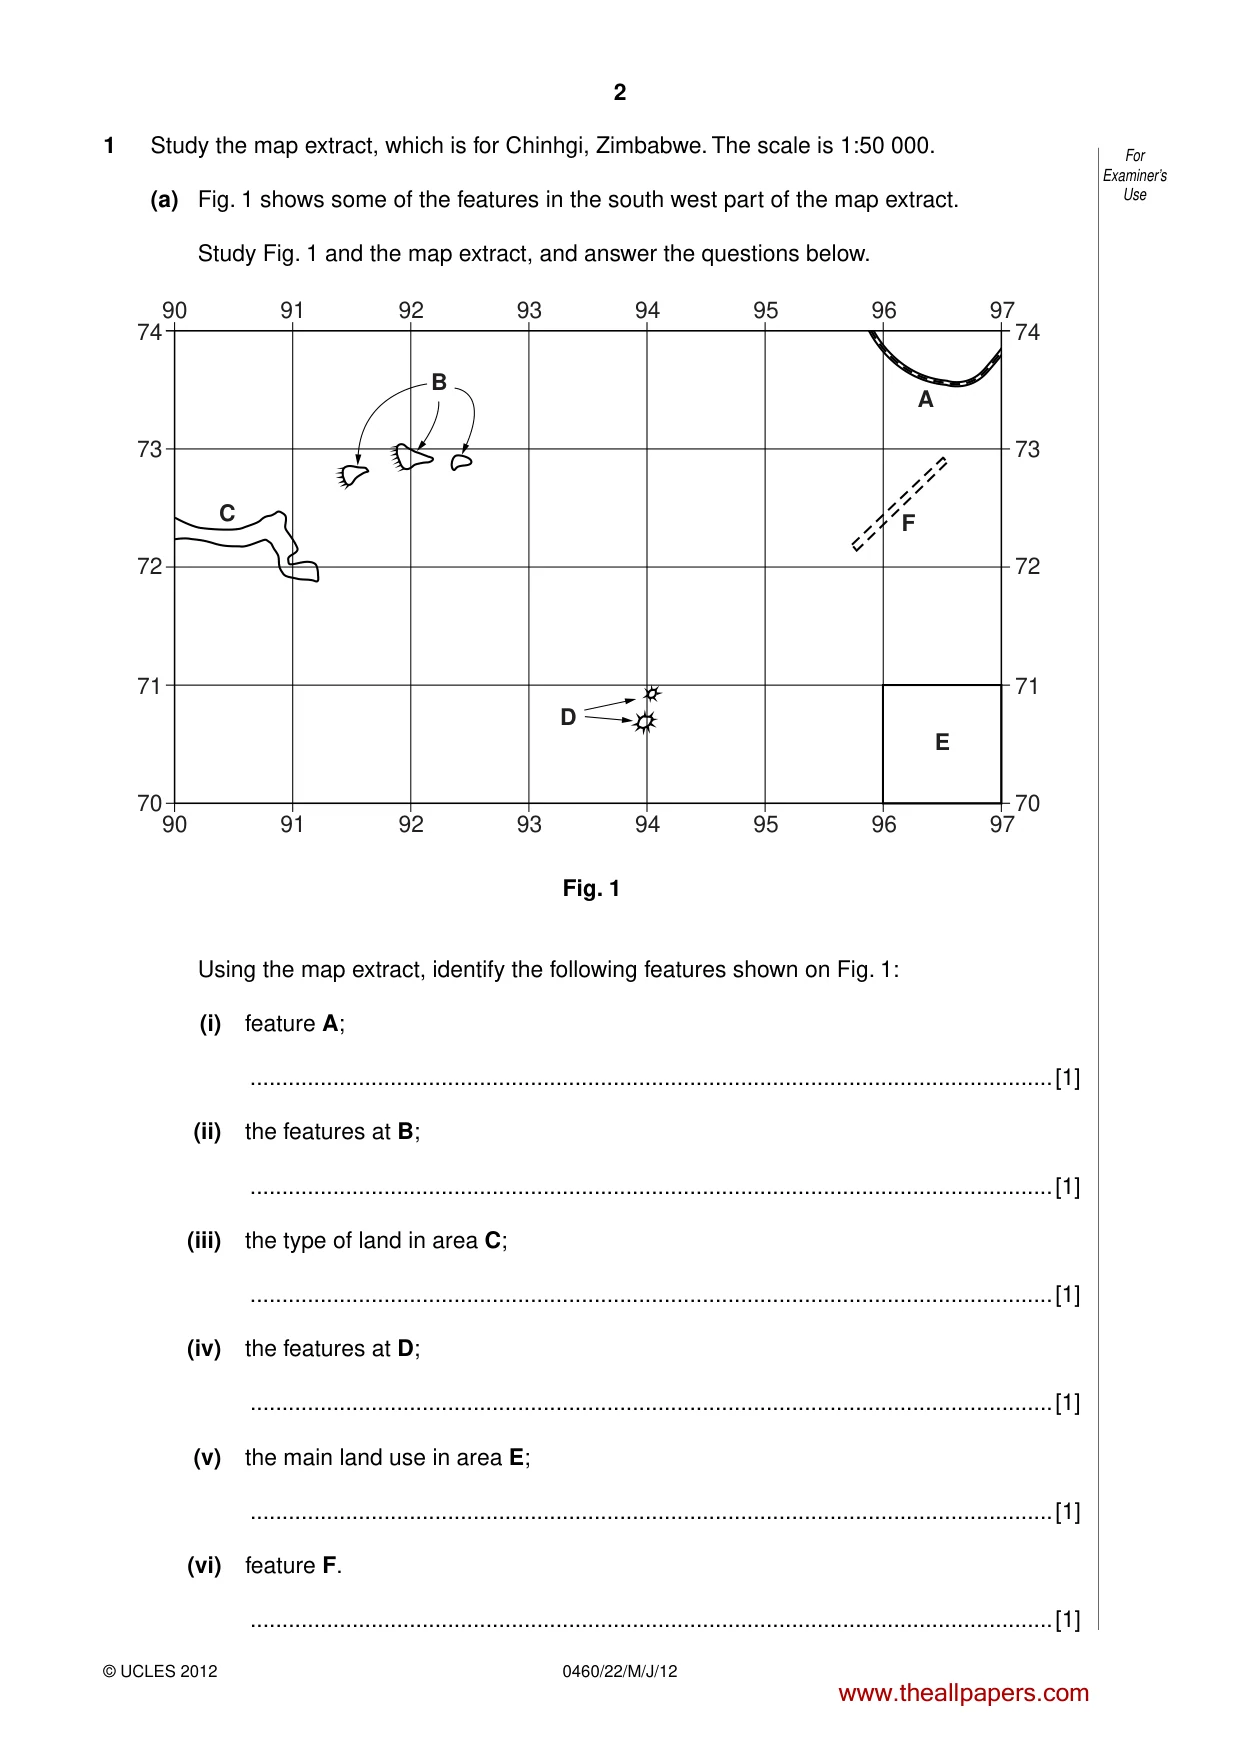
2 0460/22/M/J/12 © UCLES 2012 For Examiner’s Use 1 Study the map extract, which is for Chinhgi, Zimbabwe. The scale is 1:50 000. (a) Fig. 1 shows some of the features in the south west part of the map extract. Study Fig. 1 and the map extract, and answer the questions below. 90 91 92 93 94 95 96 97 90 91 92 93 94 95 96 97 70 71 72 73 74 70 71 72 73 74 B C D A E F Fig. 1 Using the map extract, identify the following features shown on Fig. 1: (i) feature A; …[1] (ii) the features at B; …[1] (iii) the type of land in area C; …[1] (iv) the features at D; …[1] (v) the main land use in area E; …[1] (vi) feature F. …[1] www.theallpapers.com
Question paper, page 3
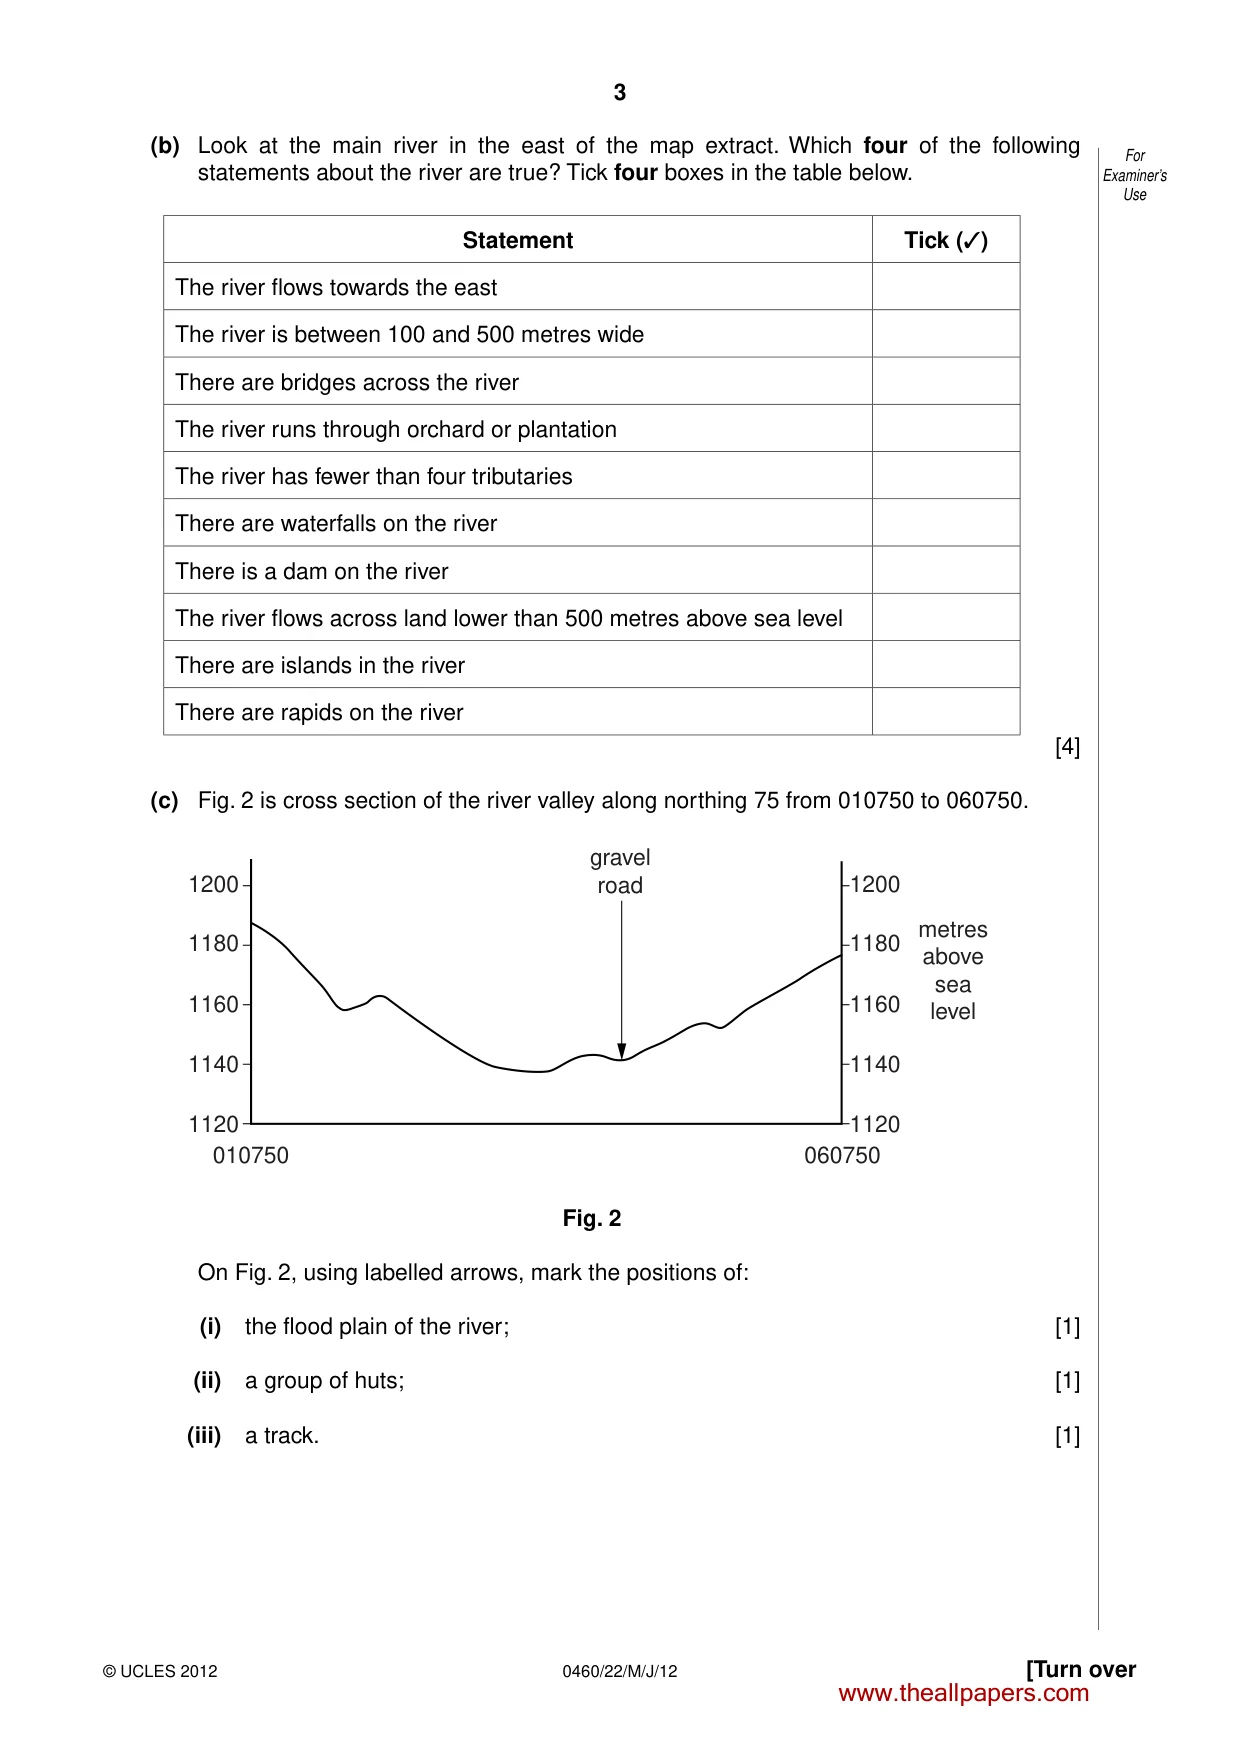
3 0460/22/M/J/12 © UCLES 2012 [Turn over For Examiner’s Use (b) Look at the main river in the east of the map extract. Which four of the following statements about the river are true? Tick four boxes in the table below. Statement Tick (✓) The river flows towards the east The river is between 100 and 500 metres wide There are bridges across the river The river runs through orchard or plantation The river has fewer than four tributaries There are waterfalls on the river There is a dam on the river The river flows across land lower than 500 metres above sea level There are islands in the river There are rapids on the river [4] (c) Fig. 2 is cross section of the river valley along northing 75 from 010750 to 060750. 1200 1180 1160 1140 1120 1200 1180 1160 1140 1120 060750 010750 gravel road metres above sea level Fig. 2 On Fig. 2, using labelled arrows, mark the positions of: (i) the flood plain of the river; [1] (ii) a group of huts; [1] (iii) a track. [1] www.theallpapers.com
Question paper, page 4
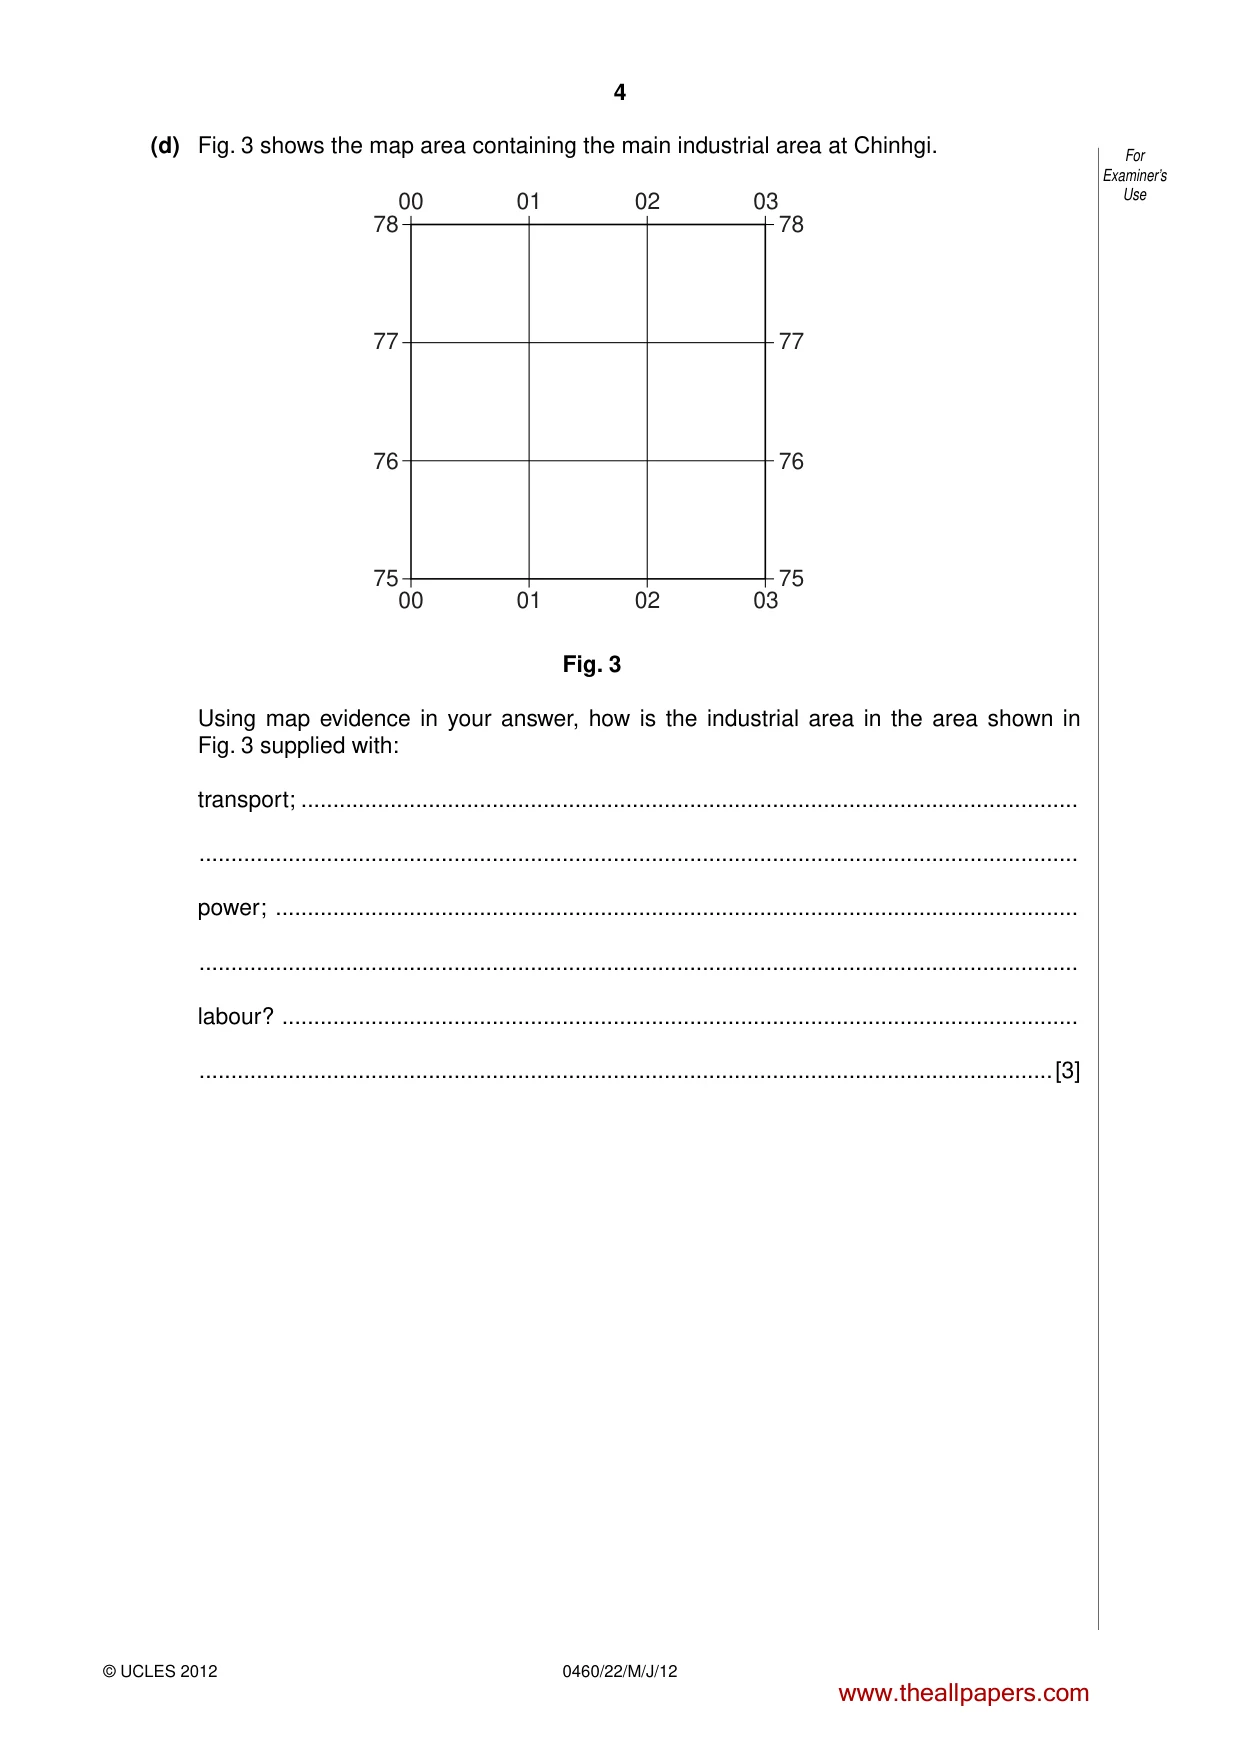
4 0460/22/M/J/12 © UCLES 2012 For Examiner’s Use (d) Fig. 3 shows the map area containing the main industrial area at Chinhgi. 00 01 02 03 00 01 02 03 75 76 78 77 75 76 78 77 Fig. 3 Using map evidence in your answer, how is the industrial area in the area shown in Fig. 3 supplied with: transport; … … power; … … labour? … …[3] www.theallpapers.com
Question paper, page 5
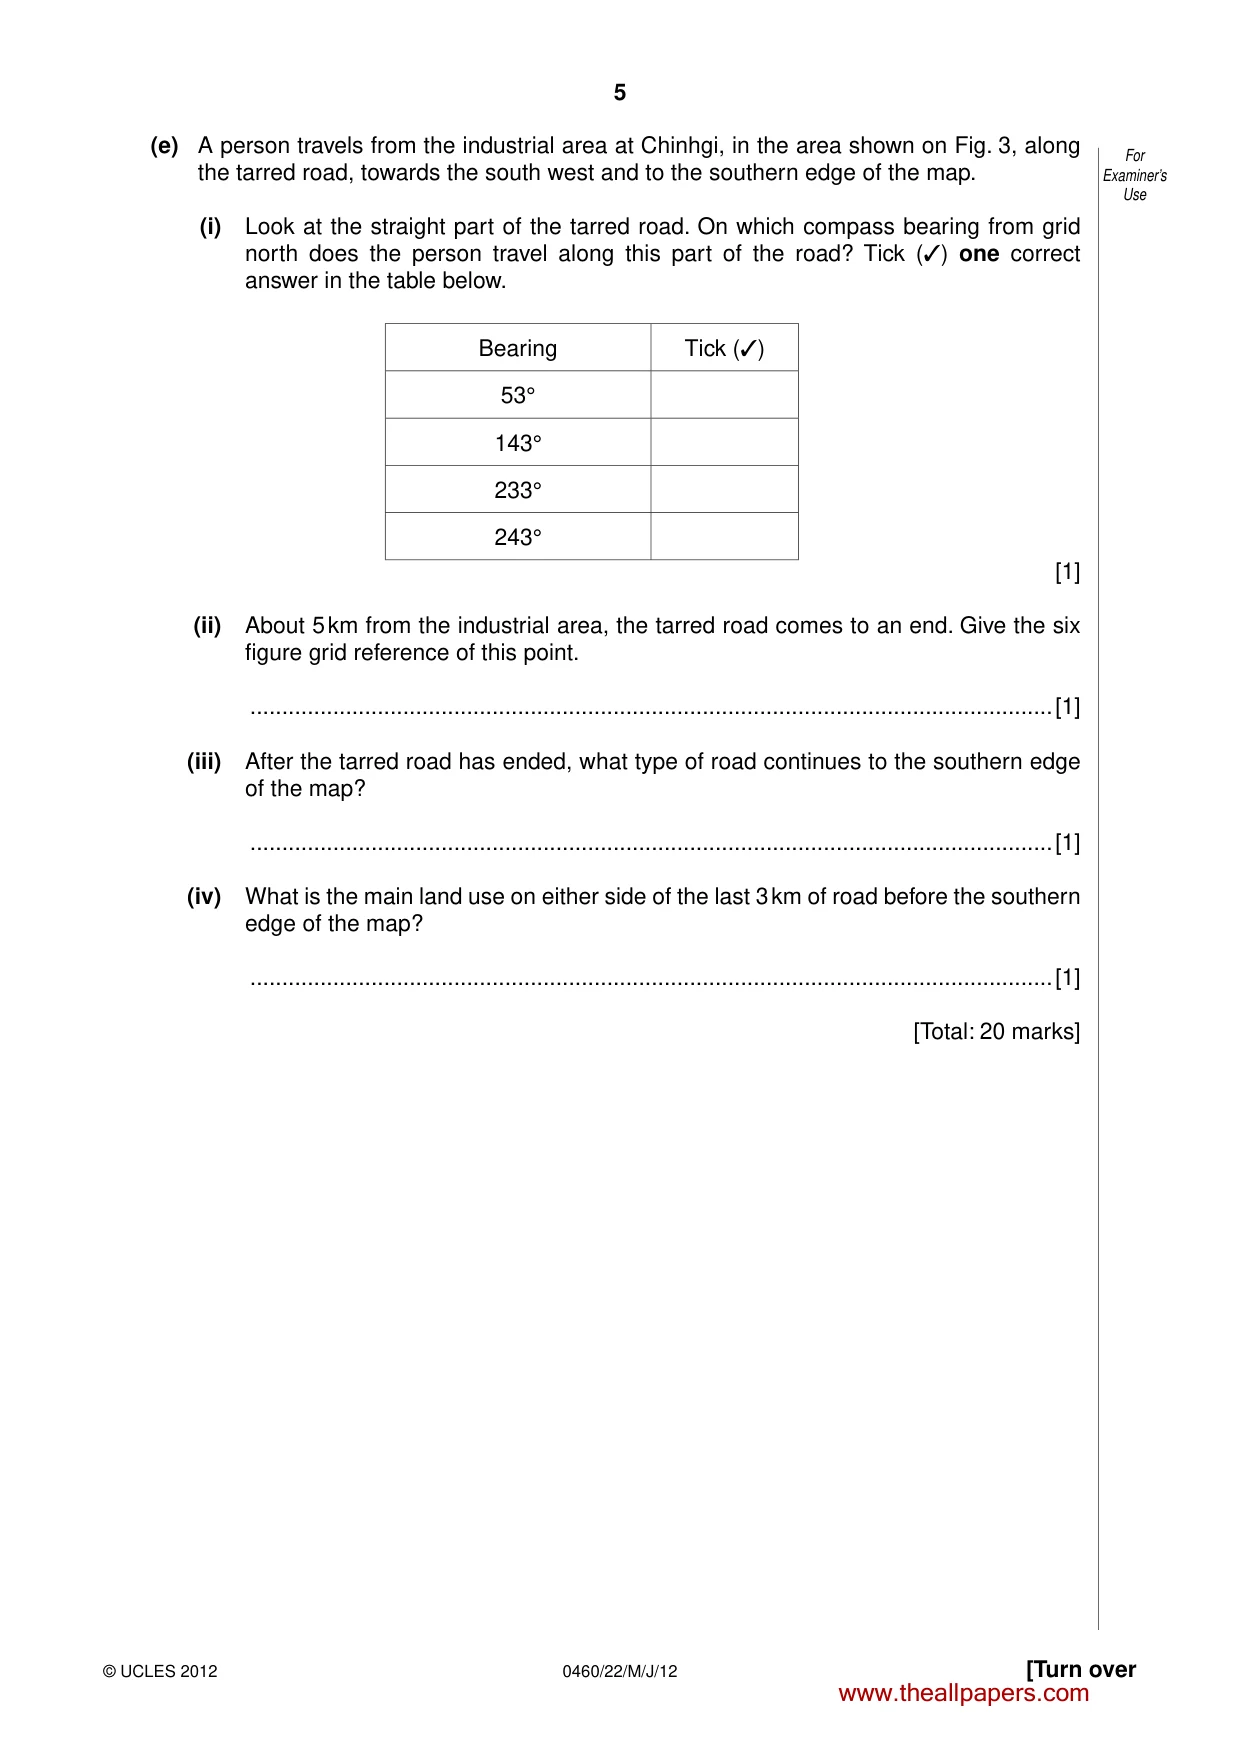
5 0460/22/M/J/12 © UCLES 2012 [Turn over For Examiner’s Use (e) A person travels from the industrial area at Chinhgi, in the area shown on Fig. 3, along the tarred road, towards the south west and to the southern edge of the map. (i) Look at the straight part of the tarred road. On which compass bearing from grid north does the person travel along this part of the road? Tick (✓) one correct answer in the table below. Bearing Tick (✓) 53° 143° 233° 243° [1] (ii) About 5 km from the industrial area, the tarred road comes to an end. Give the six figure grid reference of this point. …[1] (iii) After the tarred road has ended, what type of road continues to the southern edge of the map? …[1] (iv) What is the main land use on either side of the last 3 km of road before the southern edge of the map? …[1] [Total: 20 marks] www.theallpapers.com
Question paper, page 6
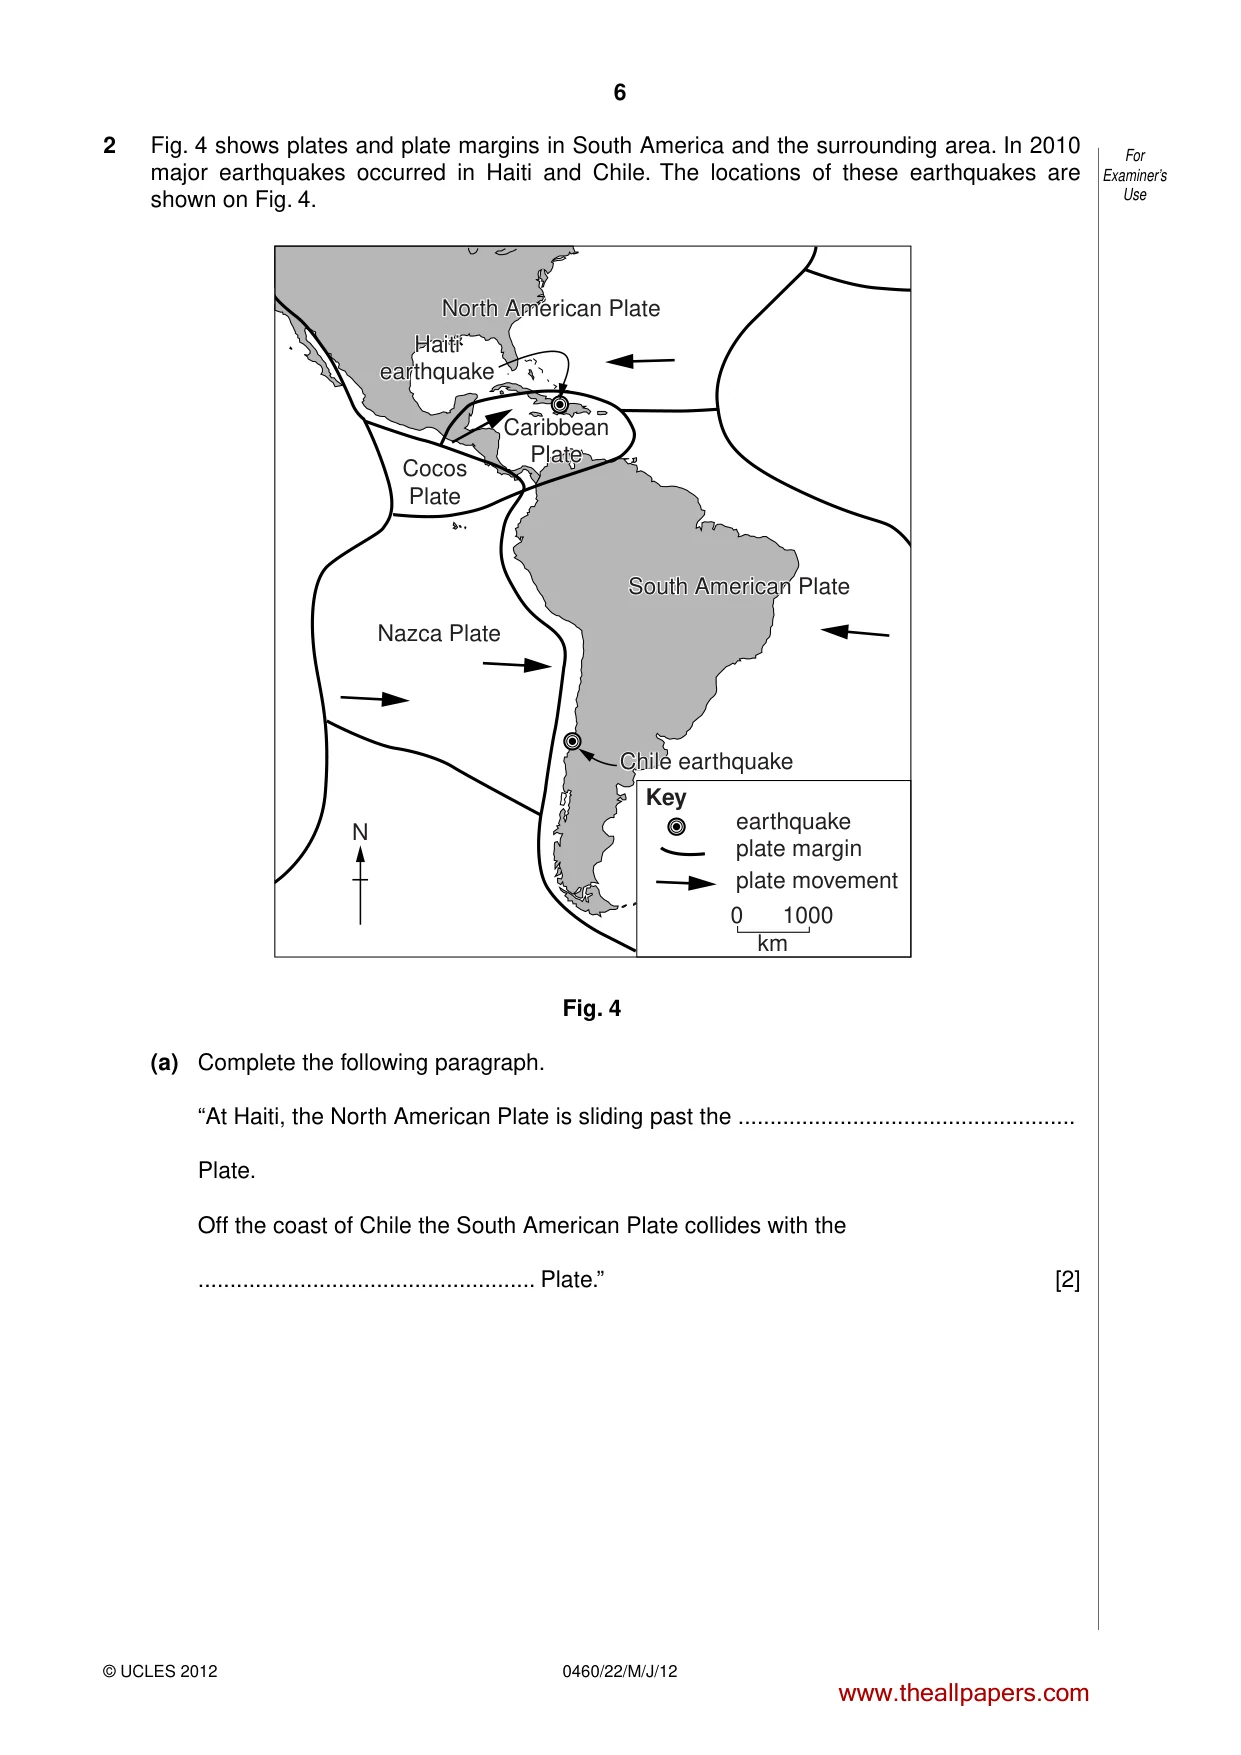
6 0460/22/M/J/12 © UCLES 2012 For Examiner’s Use 2 Fig. 4 shows plates and plate margins in South America and the surrounding area. In 2010 major earthquakes occurred in Haiti and Chile. The locations of these earthquakes are shown on Fig. 4. 0 1000 km earthquake plate margin plate movement Key North American Plate South American Plate Caribbean Plate Haiti earthquake Cocos Plate Chile earthquake North American Plate South American Plate Caribbean Plate Haiti earthquake Cocos Plate Chile earthquake N Nazca Plate Fig. 4 (a) Complete the following paragraph. “At Haiti, the North American Plate is sliding past the … Plate. Off the coast of Chile the South American Plate collides with the … Plate.” [2] www.theallpapers.com
Question paper, page 7
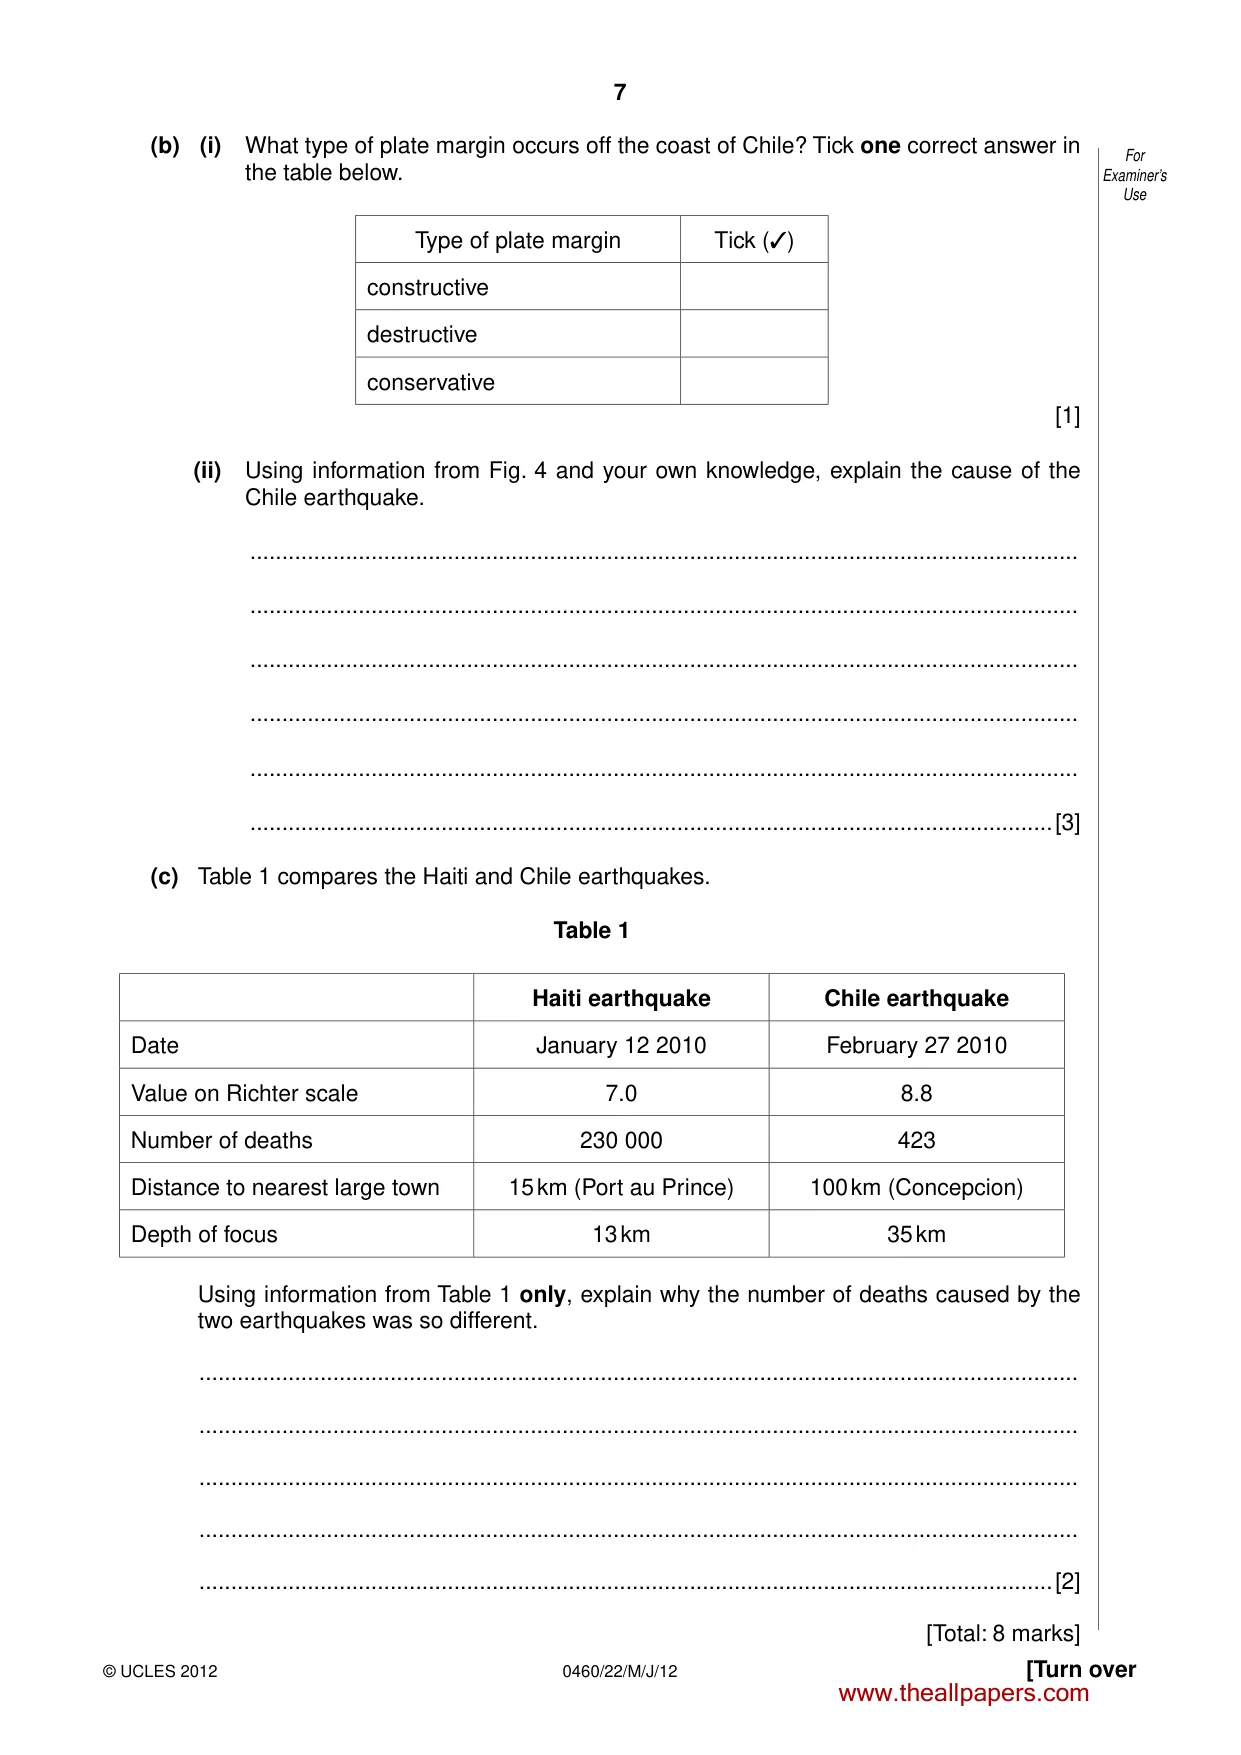
7 0460/22/M/J/12 © UCLES 2012 [Turn over For Examiner’s Use (b) (i) What type of plate margin occurs off the coast of Chile? Tick one correct answer in the table below. Type of plate margin Tick (✓) constructive destructive conservative [1] (ii) Using information from Fig. 4 and your own knowledge, explain the cause of the Chile earthquake. … … … … … …[3] (c) Table 1 compares the Haiti and Chile earthquakes. Table 1 Haiti earthquake Chile earthquake Date January 12 2010 February 27 2010 Value on Richter scale 7.0 8.8 Number of deaths 230 000 423 Distance to nearest large town 15 km (Port au Prince) 100 km (Concepcion) Depth of focus 13 km 35 km Using information from Table 1 only, explain why the number of deaths caused by the two earthquakes was so different. … … … … …[2] [Total: 8 marks] www.theallpapers.com
Question paper, page 8
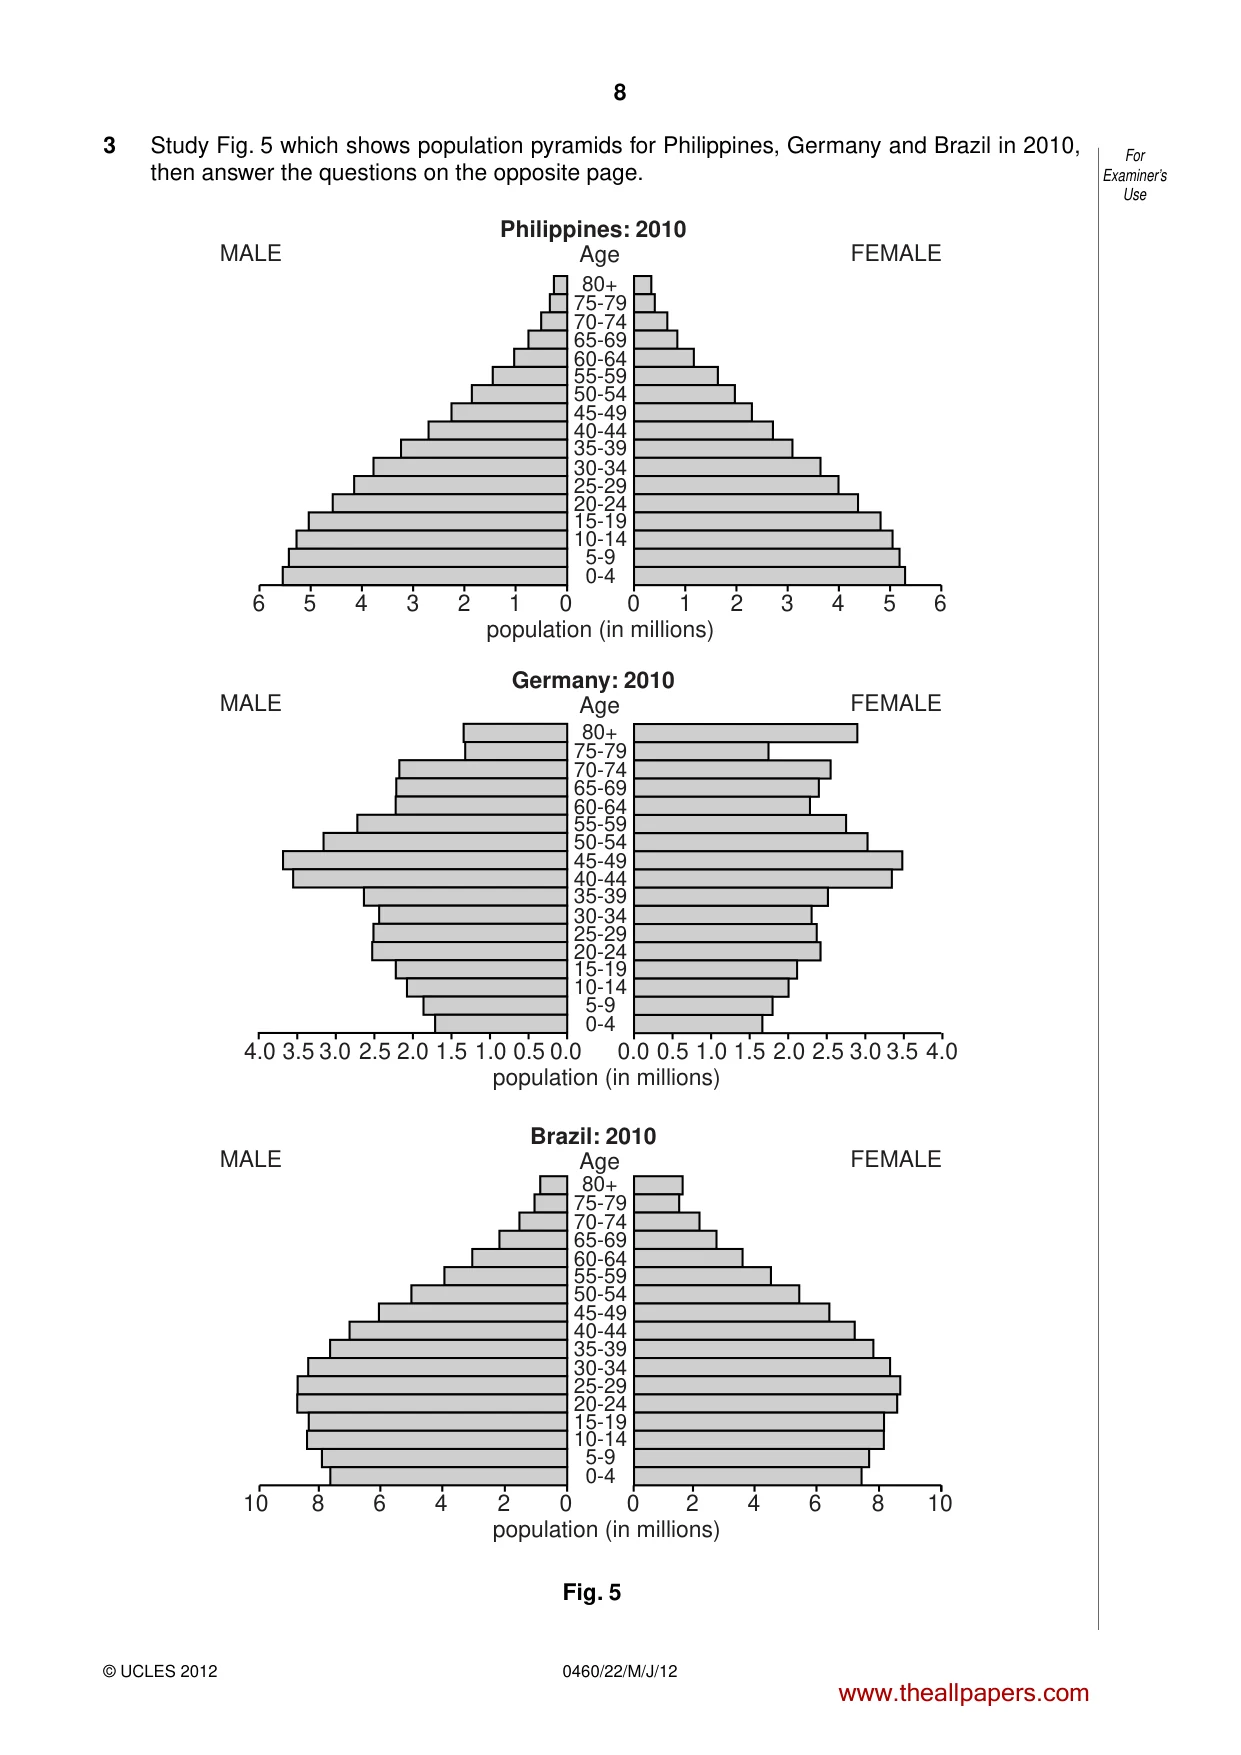
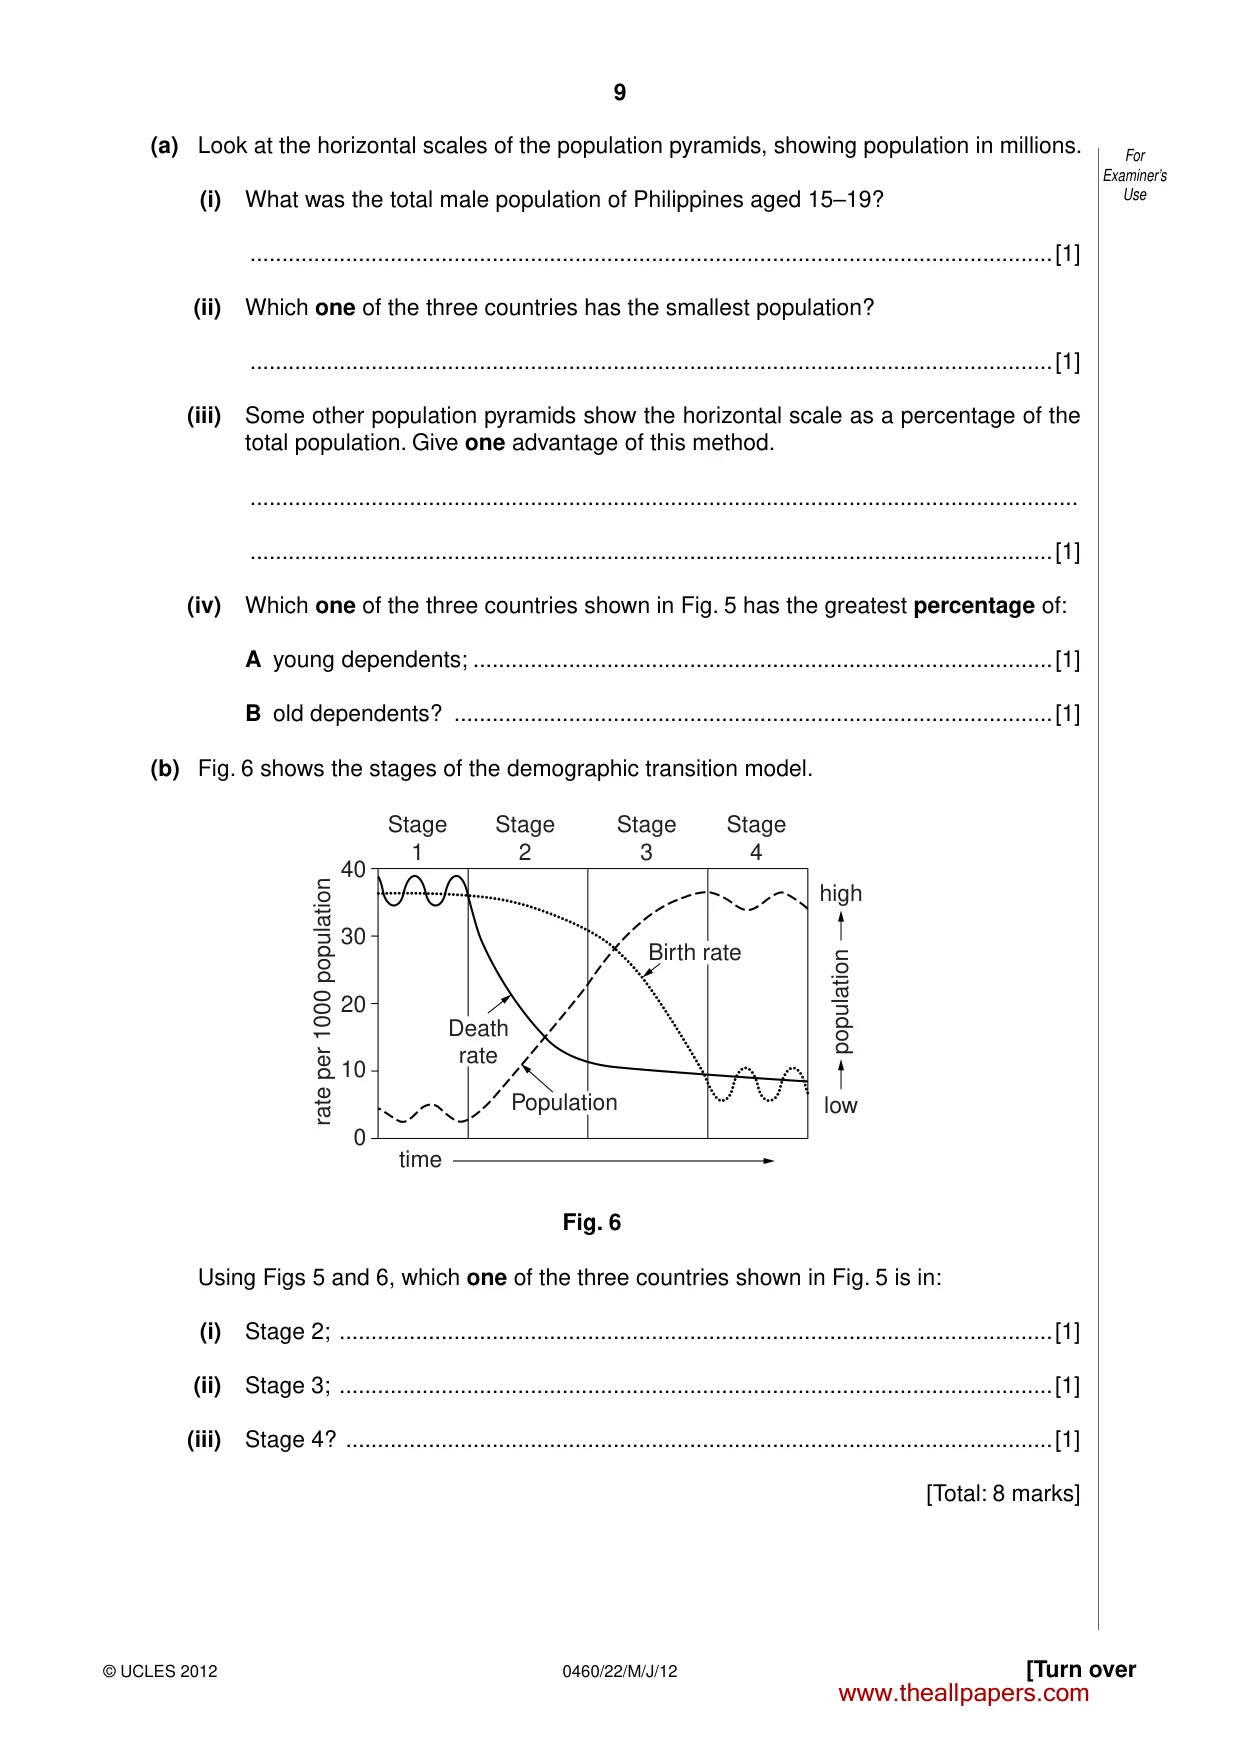
8 0460/22/M/J/12 © UCLES 2012 For Examiner’s Use 3 Study Fig. 5 which shows population pyramids for Philippines, Germany and Brazil in 2010, then answer the questions on the opposite page. 80+ Age 75-79 70-74 65-69 60-64 55-59 50-54 45-49 40-44 35-39 30-34 25-29 20-24 15-19 10-14 5-9 0-4 0 0 1 2 3 4 5 6 0.0 0.0 1.0 0.5 1.5 2.0 2.5 3.0 3.5 4.0 0.5 1.0 1.5 2.0 2.5 3.0 3.5 4.0 0 2 4 6 8 10 10 8 6 4 2 0 1 2 3 4 5 6 population (in millions) 80+ 75-79 70-74 65-69 60-64 55-59 50-54 45-49 40-44 35-39 30-34 25-29 20-24 15-19 10-14 5-9 0-4 population (in millions) 80+ 75-79 70-74 65-69 60-64 55-59 50-54 45-49 40-44 35-39 30-34 25-29 20-24 15-19 10-14 5-9 0-4 population (in millions) Philippines: 2010 MALE FEMALE Age Germany: 2010 MALE FEMALE Age Brazil: 2010 MALE FEMALE Fig. 5 www.theallpapers.com
Question paper, page 9
9 0460/22/M/J/12 © UCLES 2012 [Turn over For Examiner’s Use (a) Look at the horizontal scales of the population pyramids, showing population in millions. (i) What was the total male population of Philippines aged 15–19? …[1] (ii) Which one of the three countries has the smallest population? …[1] (iii) Some other population pyramids show the horizontal scale as a percentage of the total population. Give one advantage of this method. … …[1] (iv) Which one of the three countries shown in Fig. 5 has the greatest percentage of: A young dependents; …[1] B old dependents? …[1] (b) Fig. 6 shows the stages of the demographic transition model. Stage 1 Stage 2 Stage 3 Stage 4 time rate per 1000 population population high low 40 30 20 10 0 Population Birth rate Death rate Fig. 6 Using Figs 5 and 6, which one of the three countries shown in Fig. 5 is in: (i) Stage 2; …[1] (ii) Stage 3; …[1] (iii) Stage 4? …[1] [Total: 8 marks] www.theallpapers.com
Question paper, page 10
10 0460/22/M/J/12 © UCLES 2012 BLANK PAGE www.theallpapers.com
Question paper, page 11
11 0460/22/M/J/12 © UCLES 2012 [Turn over For Examiner’s Use 4 Photographs A and B (Insert) show parts of the same coastal area. Describe the geographical features shown in the photographs. You may refer to the sea, the coastline and the land next to the sea. … … … … … … … … … … … … … … … … [Total: 8 marks] www.theallpapers.com
Question paper, page 12
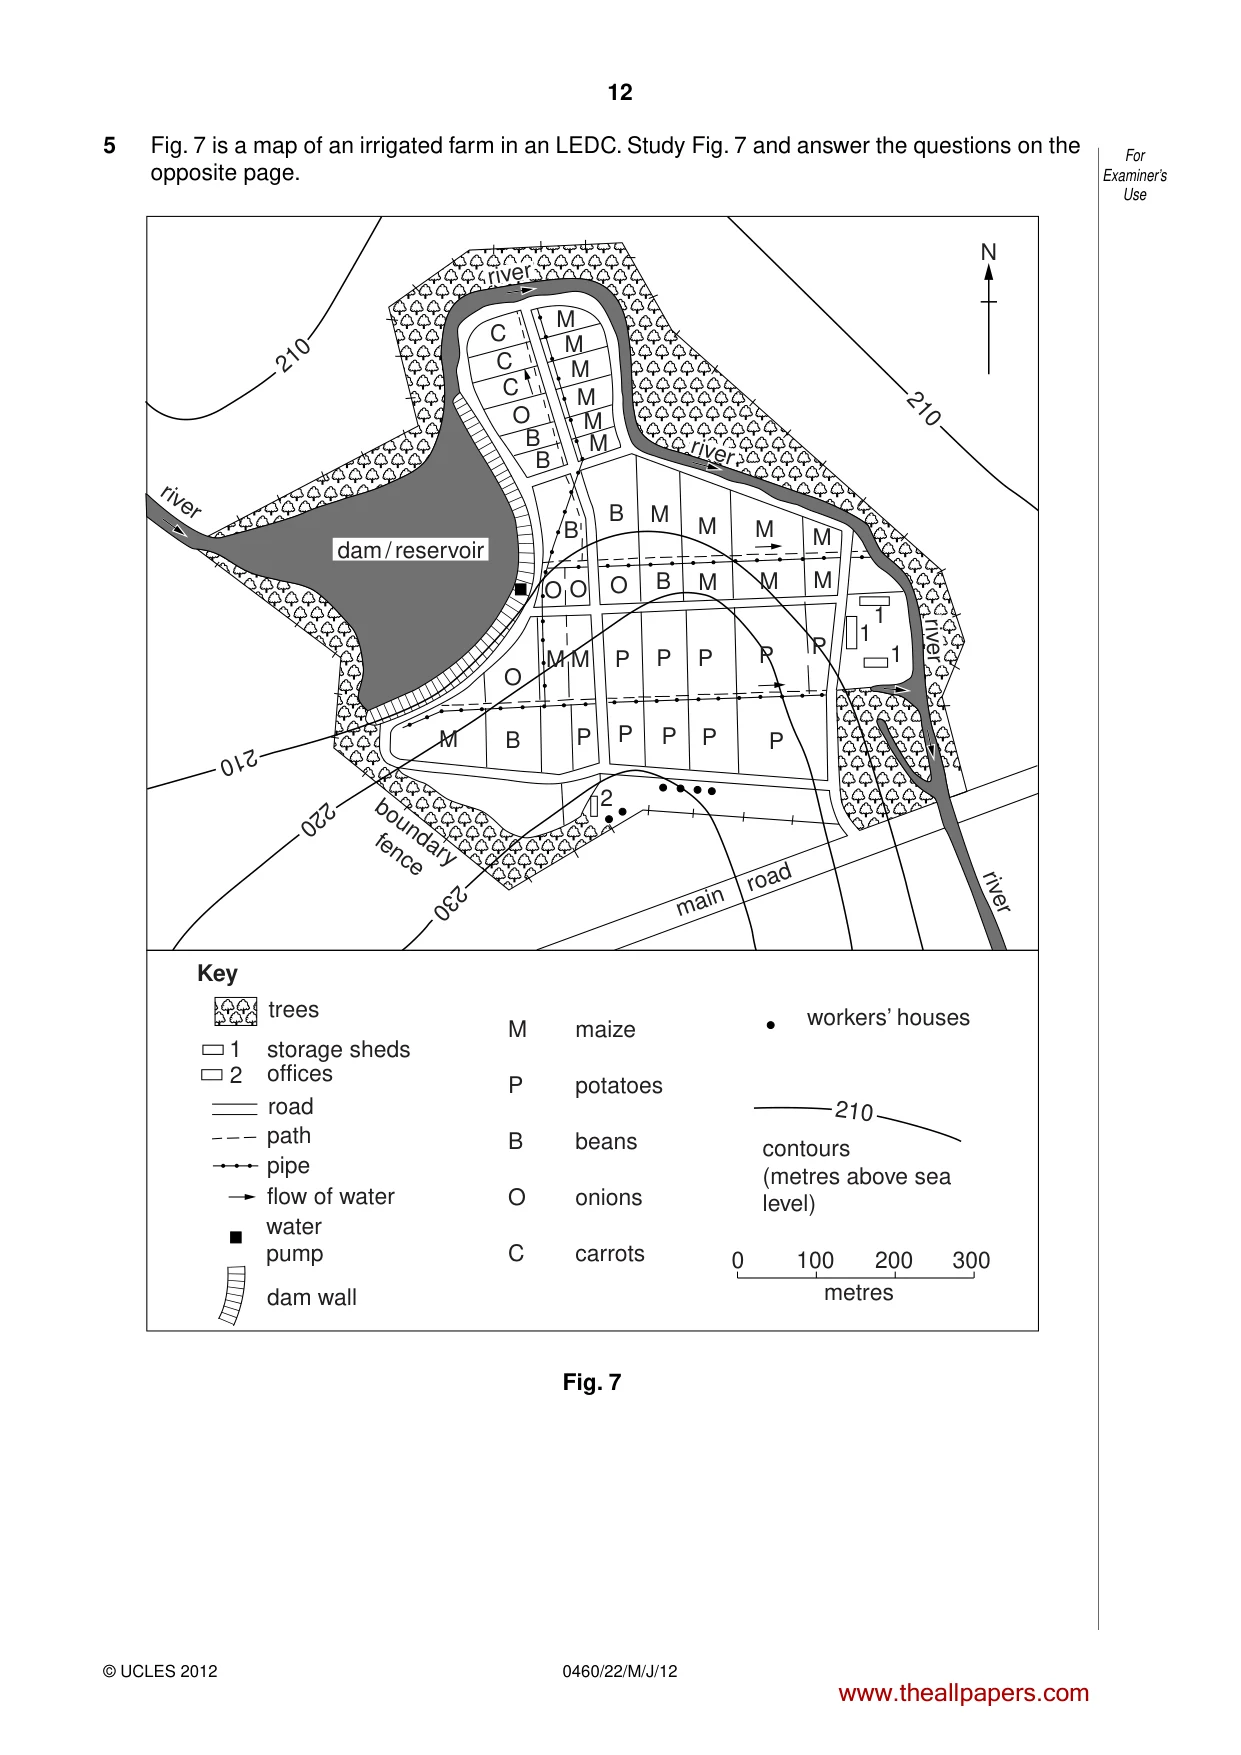
12 0460/22/M/J/12 © UCLES 2012 For Examiner’s Use 5 Fig. 7 is a map of an irrigated farm in an LEDC. Study Fig. 7 and answer the questions on the opposite page. 0 100 200 300 metres N river river trees storage sheds offices road path pipe flow of water dam wall water pump M P B O C maize potatoes beans onions carrots 1 2 workers’ houses contours (metres above sea level) 210 Key boundary fence 210 230 220 210 210 1 1 1 2 C C C O O O O O B B B B B B M M M M M M M M M M M P P P P P P P P P P M M M M M main road dam / reservoir river river river Fig. 7 www.theallpapers.com
Question paper, page 13
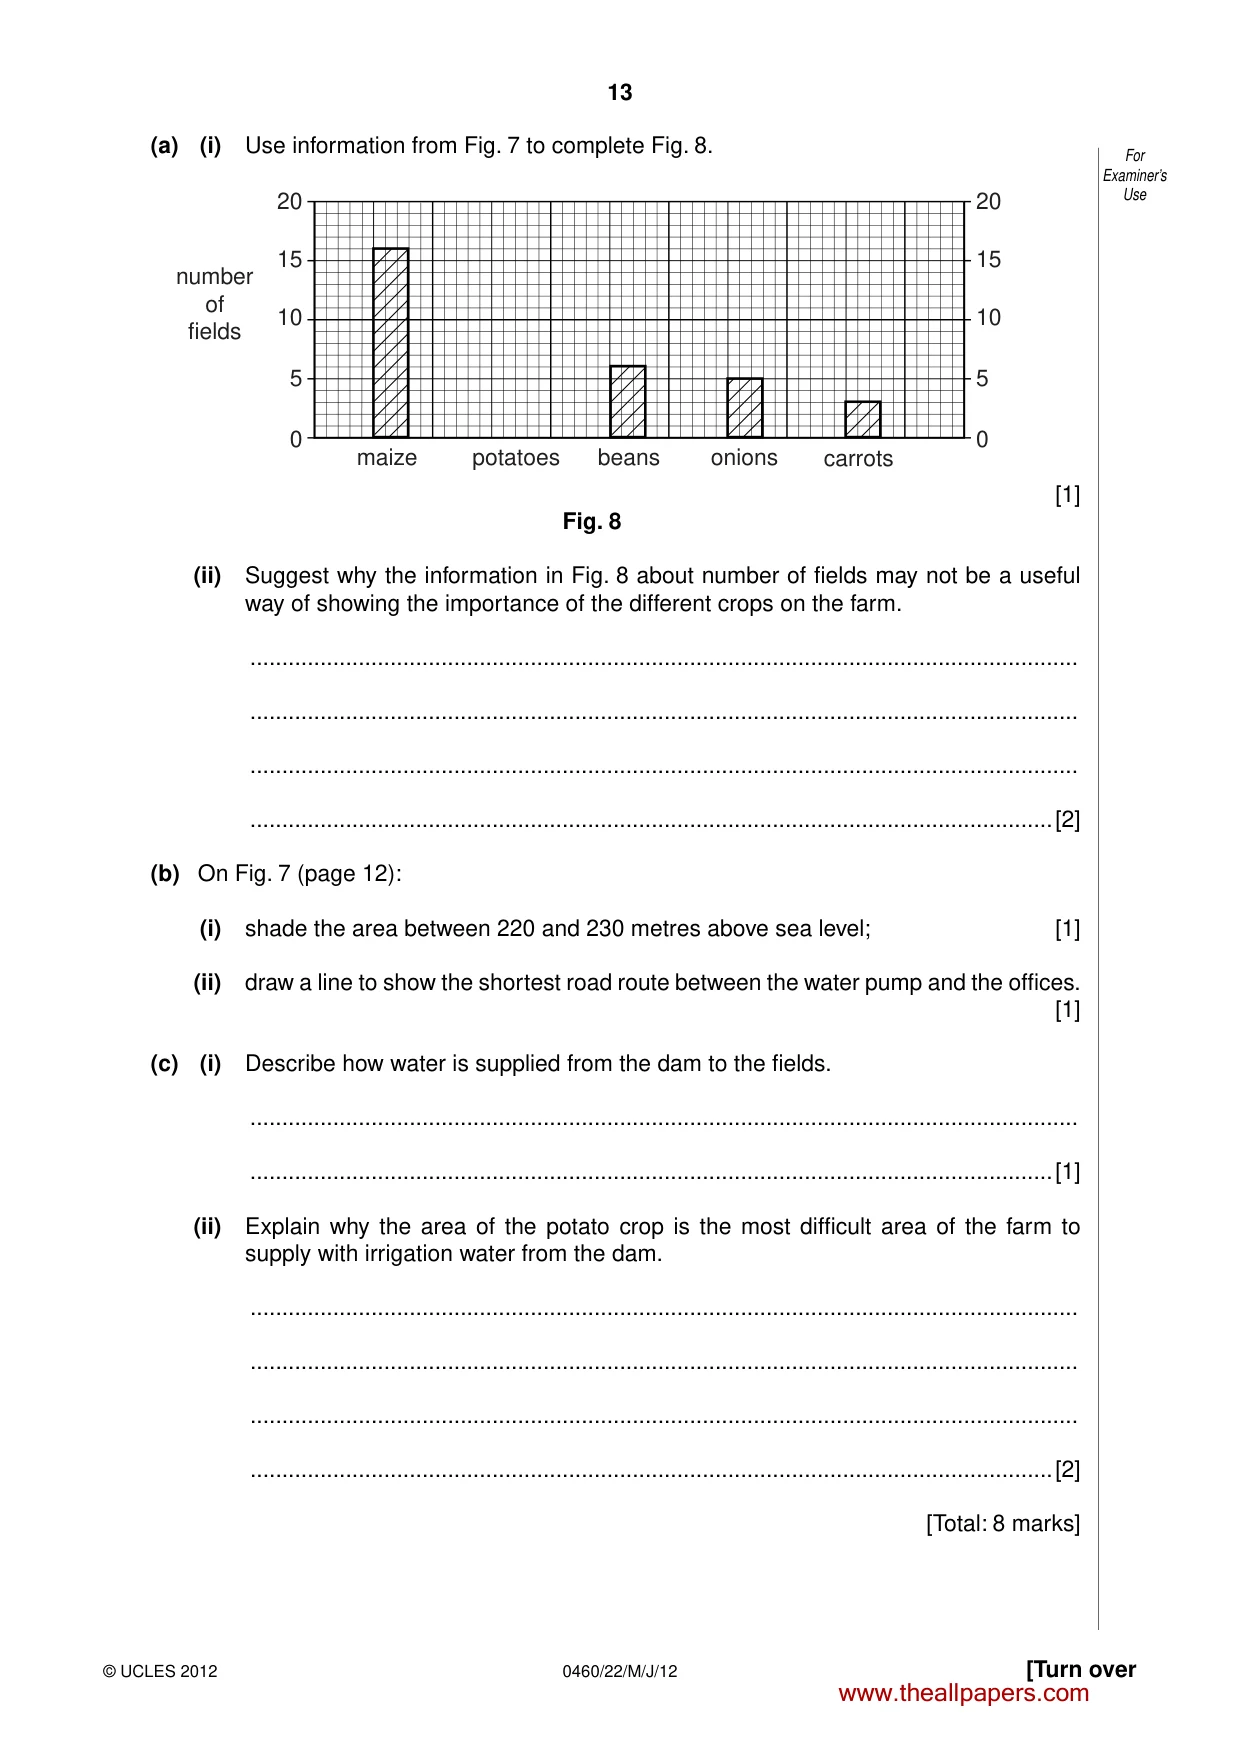
13 0460/22/M/J/12 © UCLES 2012 [Turn over For Examiner’s Use (a) (i) Use information from Fig. 7 to complete Fig. 8. 0 5 10 15 20 0 5 10 15 20 maize potatoes beans onions carrots number of fields [1] Fig. 8 (ii) Suggest why the information in Fig. 8 about number of fields may not be a useful way of showing the importance of the different crops on the farm. … … … …[2] (b) On Fig. 7 (page 12): (i) shade the area between 220 and 230 metres above sea level; [1] (ii) draw a line to show the shortest road route between the water pump and the offices. [1] (c) (i) Describe how water is supplied from the dam to the fields. … …[1] (ii) Explain why the area of the potato crop is the most difficult area of the farm to supply with irrigation water from the dam. … … … …[2] [Total: 8 marks] www.theallpapers.com
Question paper, page 14
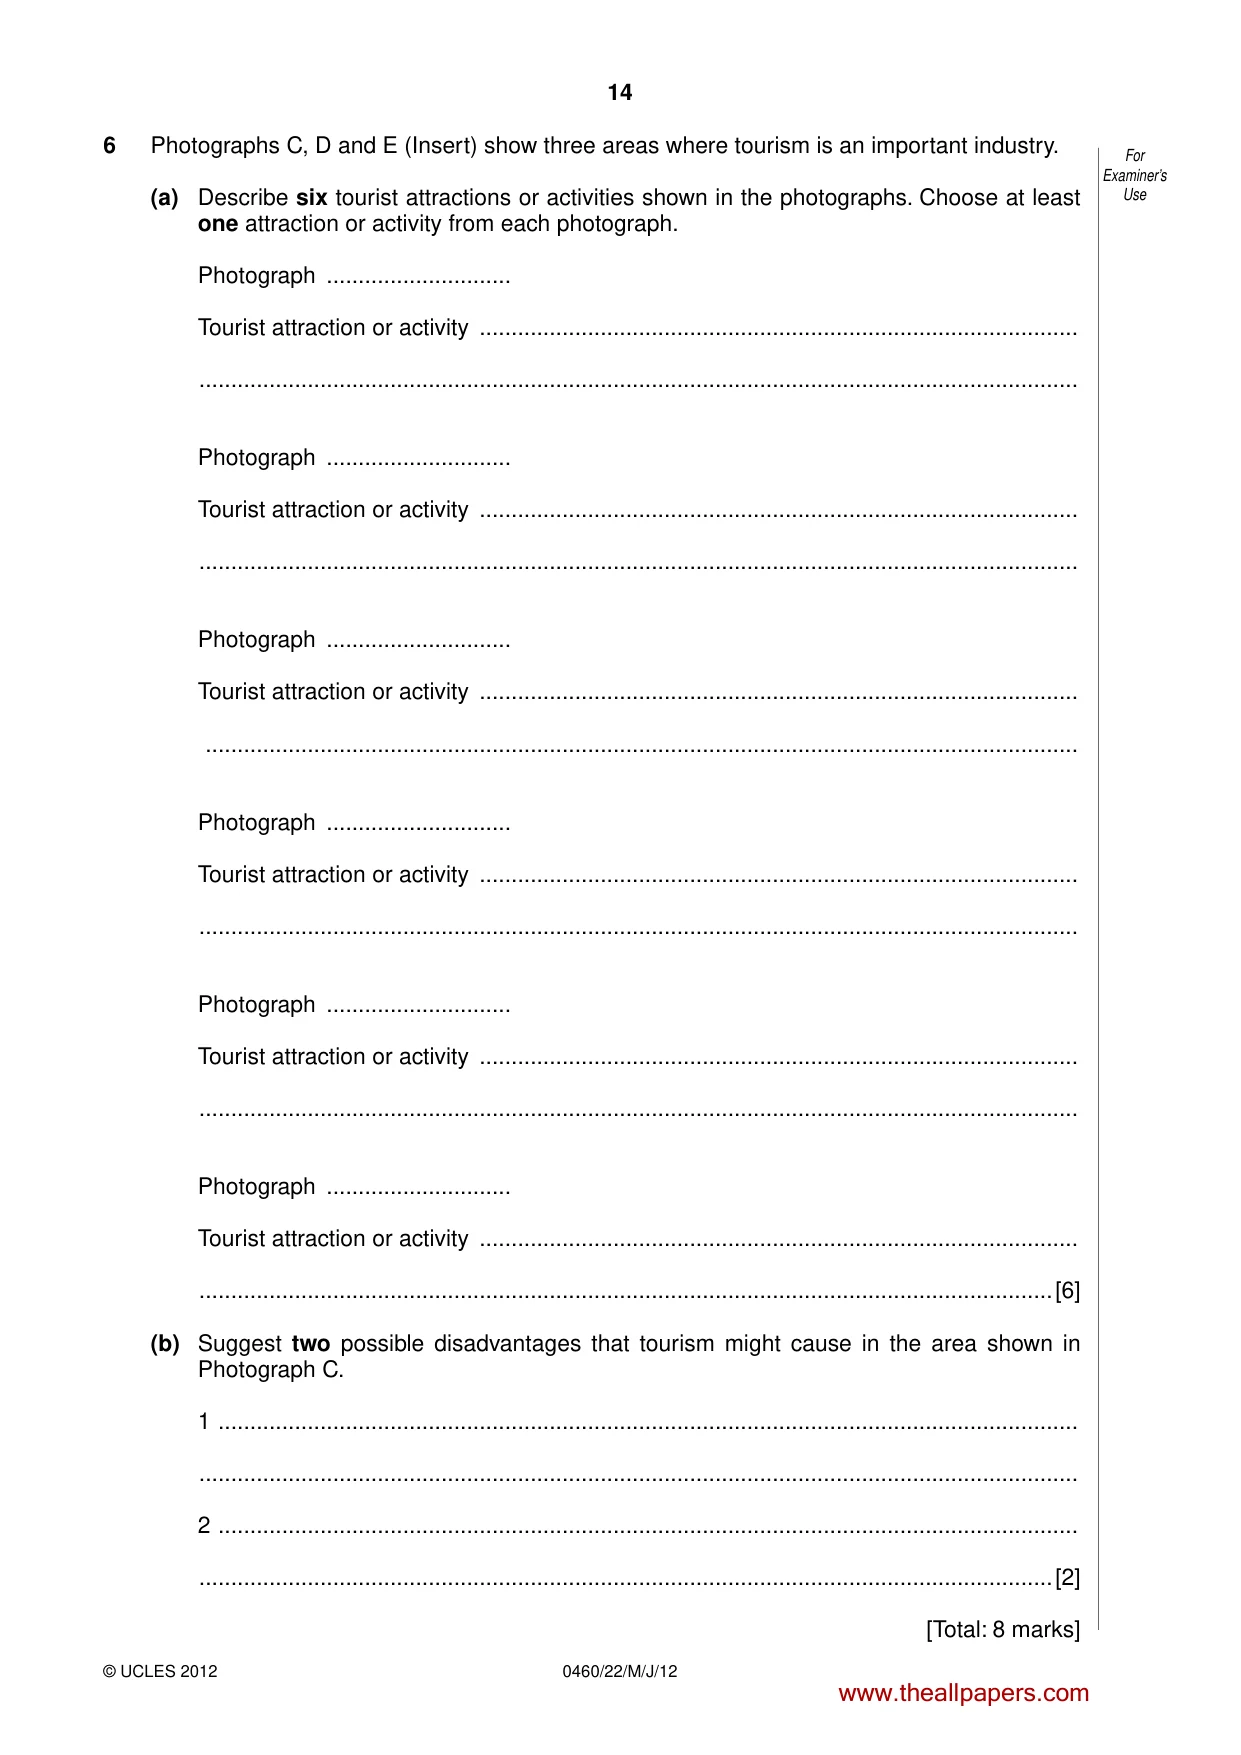
14 0460/22/M/J/12 © UCLES 2012 For Examiner’s Use 6 Photographs C, D and E (Insert) show three areas where tourism is an important industry. (a) Describe six tourist attractions or activities shown in the photographs. Choose at least one attraction or activity from each photograph. Photograph … Tourist attraction or activity … … Photograph … Tourist attraction or activity … … Photograph … Tourist attraction or activity … … Photograph … Tourist attraction or activity … … Photograph … Tourist attraction or activity … … Photograph … Tourist attraction or activity … …[6] (b) Suggest two possible disadvantages that tourism might cause in the area shown in Photograph C. 1 … … 2 … …[2] [Total: 8 marks] www.theallpapers.com
Question paper, page 15
15 0460/22/M/J/12 © UCLES 2012 BLANK PAGE www.theallpapers.com
Question paper, page 16
16 0460/22/M/J/12 © UCLES 2012 BLANK PAGE Copyright Acknowledgements: Question 5 Fig. 7 © McLeod; A Certificate Geography of Lesotho; Longman Lesotho; 1989. Photographs A, B, C, D & E D A Kelly © UCLES. Permission to reproduce items where third-party owned material protected by copyright is included has been sought and cleared where possible. Every reasonable effort has been made by the publisher (UCLES) to trace copyright holders, but if any items requiring clearance have unwittingly been included, the publisher will be pleased to make amends at the earliest possible opportunity. University of Cambridge International Examinations is part of the Cambridge Assessment Group. Cambridge Assessment is the brand name of University of Cambridge Local Examinations Syndicate (UCLES), which is itself a department of the University of Cambridge. www.theallpapers.com
Mark scheme, page 1
UNIVERSITY OF CAMBRIDGE INTERNATIONAL EXAMINATIONS International General Certificate of Secondary Education MARK SCHEME for the May/June 2012 question paper for the guidance of teachers 0460 GEOGRAPHY 0460/22 Paper 2, maximum raw mark 60 This mark scheme is published as an aid to teachers and candidates, to indicate the requirements of the examination. It shows the basis on which Examiners were instructed to award marks. It does not indicate the details of the discussions that took place at an Examiners’ meeting before marking began, which would have considered the acceptability of alternative answers. Mark schemes must be read in conjunction with the question papers and the report on the examination. • Cambridge will not enter into discussions or correspondence in connection with these mark schemes. Cambridge is publishing the mark schemes for the May/June 2012 question papers for most IGCSE, GCE Advanced Level and Advanced Subsidiary Level syllabuses and some Ordinary Level syllabuses. www.theallpapers.com
Mark scheme, page 2
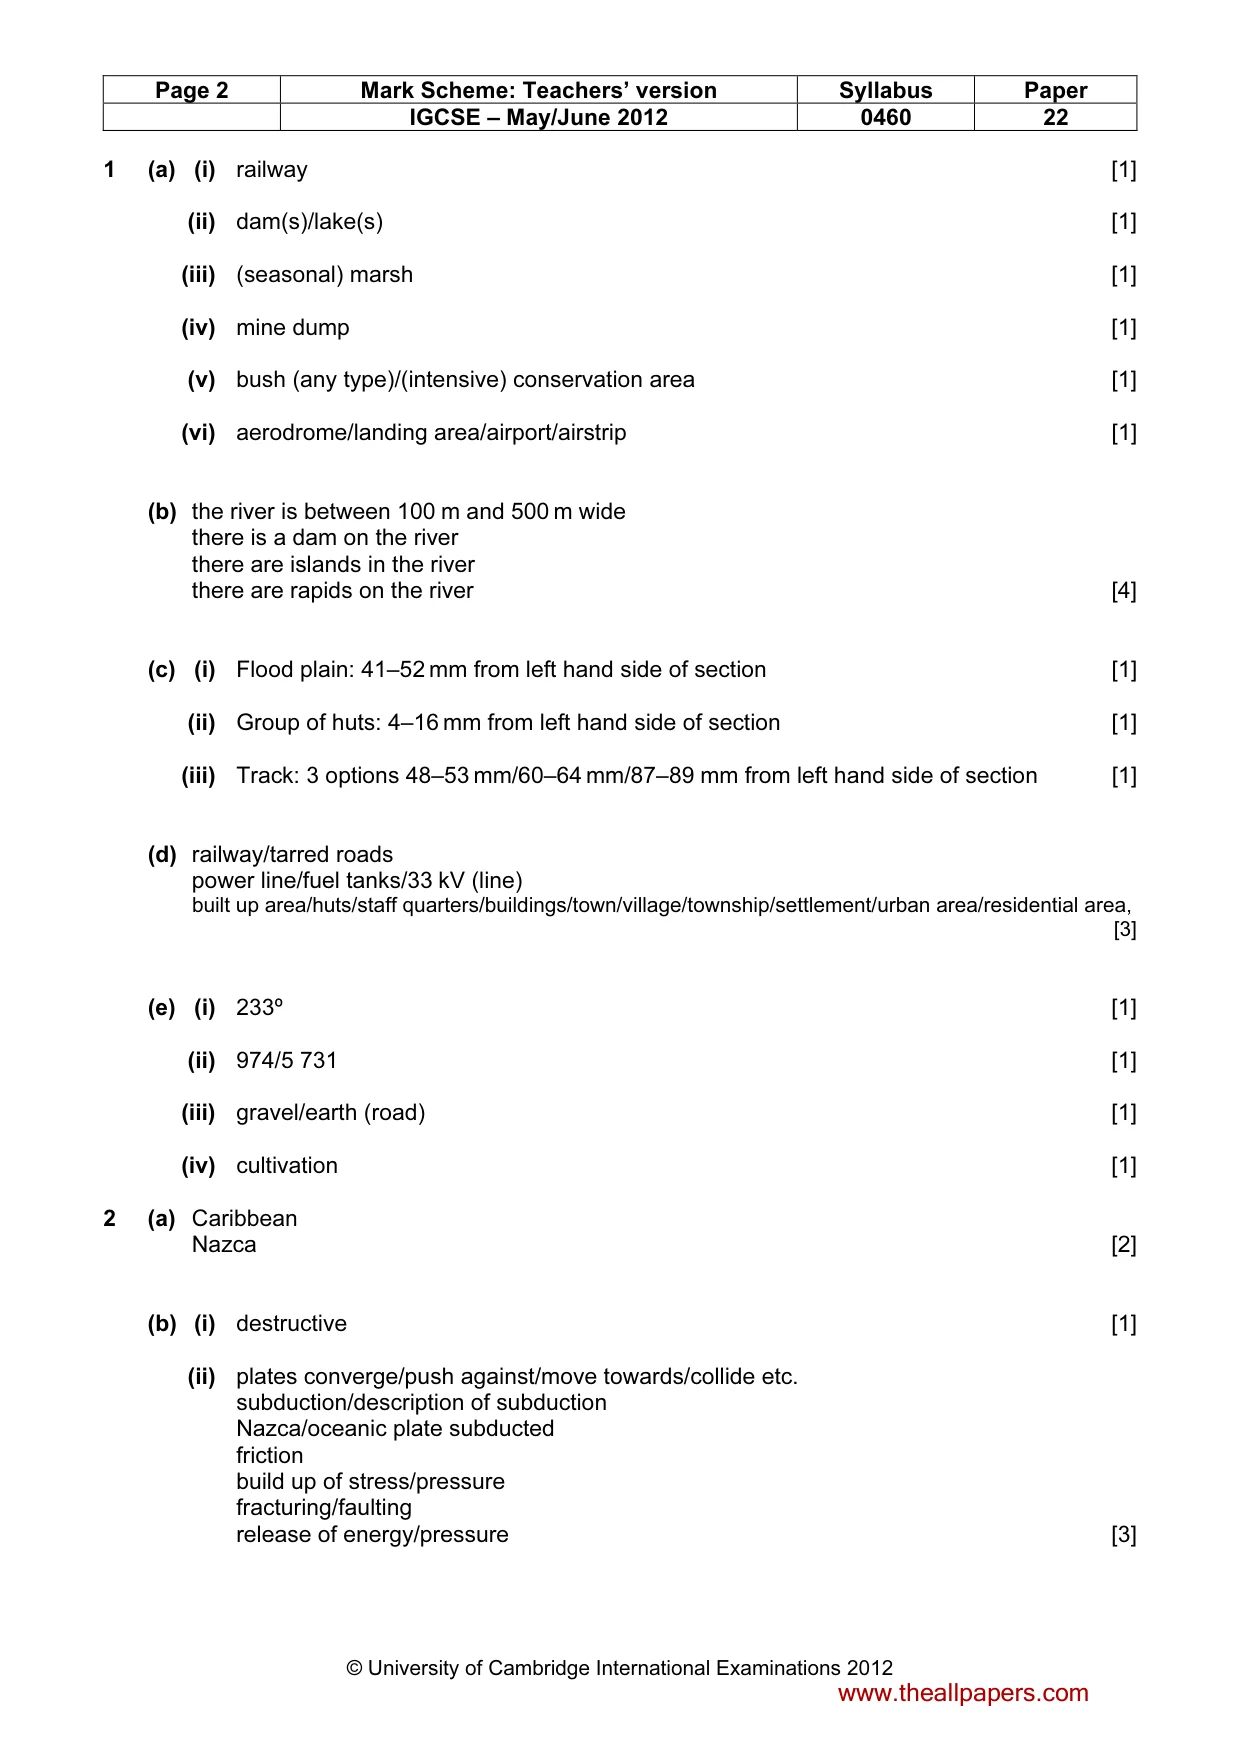
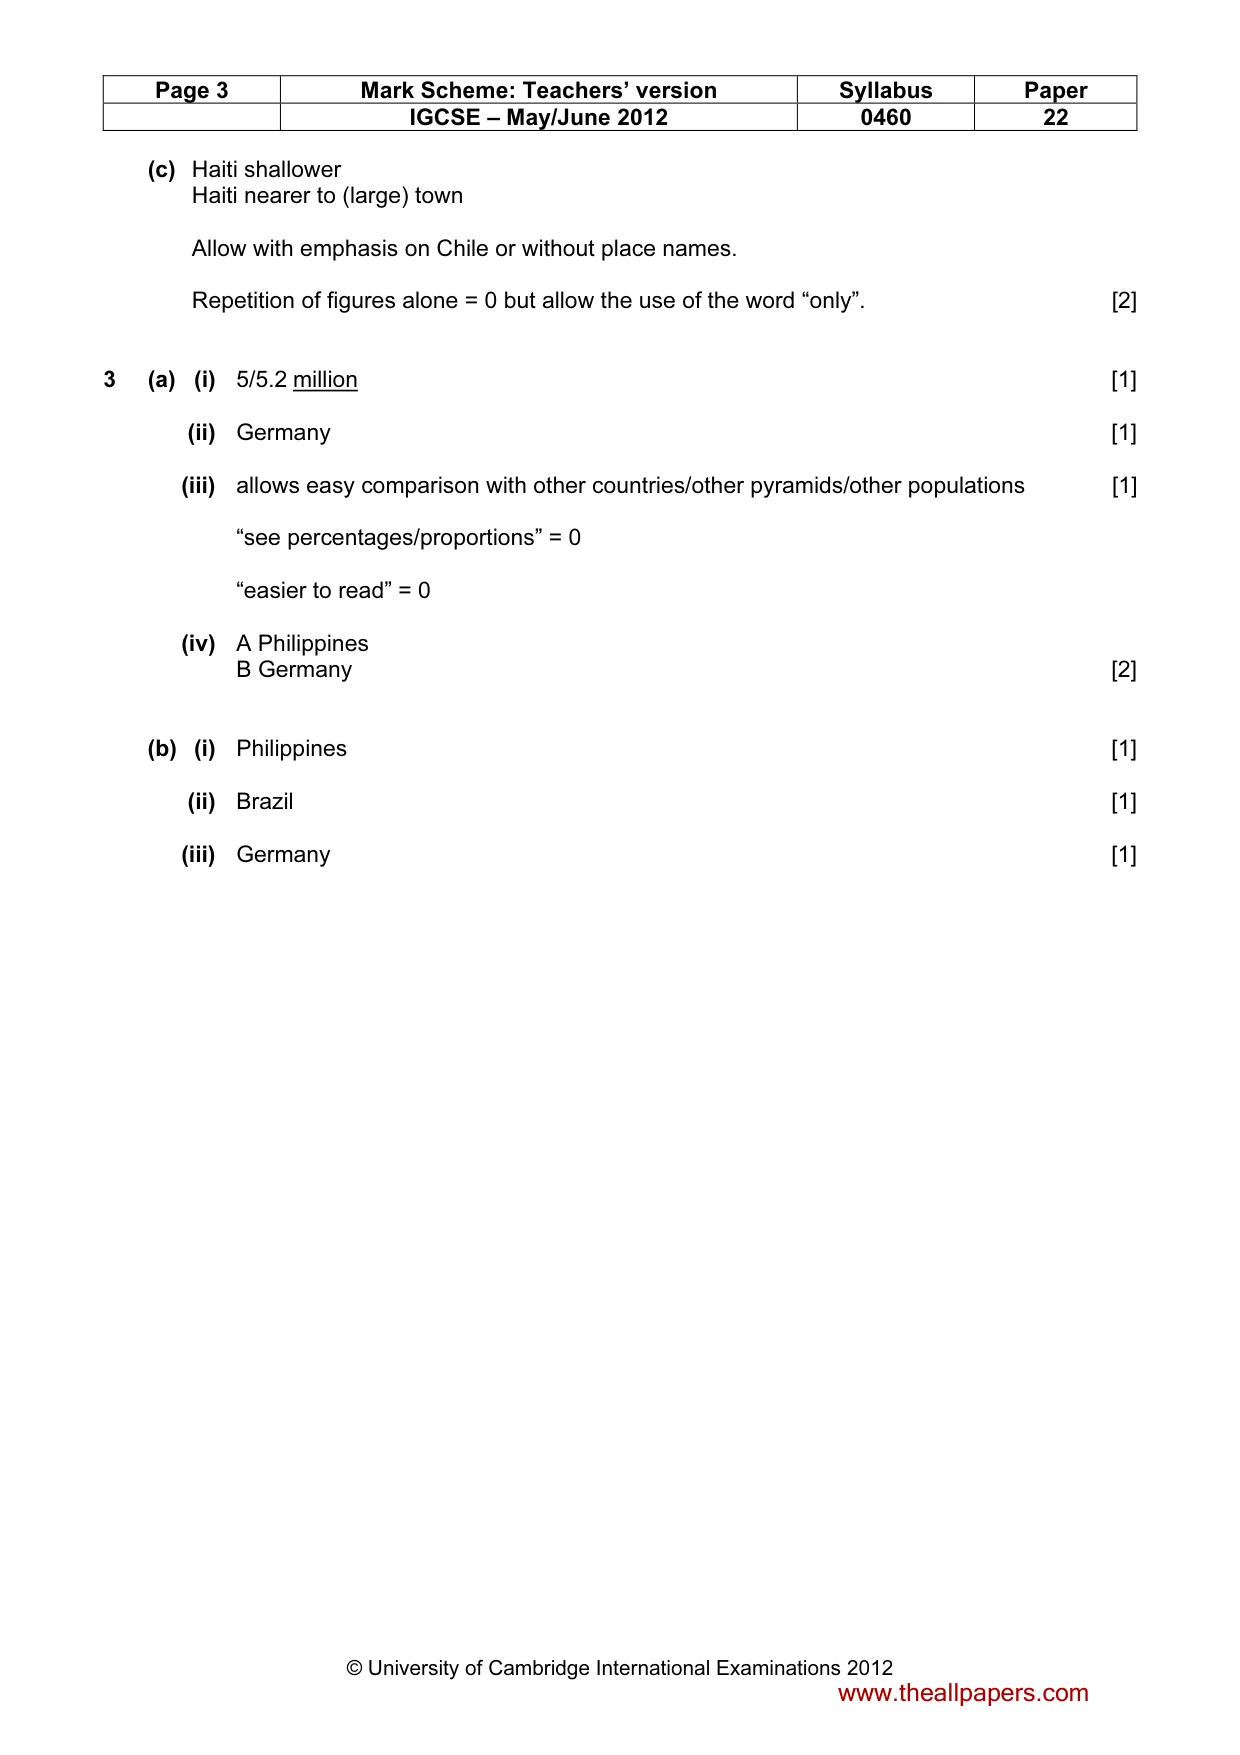
Page 2 Mark Scheme: Teachers’ version Syllabus Paper IGCSE – May/June 2012 0460 22 © University of Cambridge International Examinations 2012 1 (a) (i) railway [1] (ii) dam(s)/lake(s) [1] (iii) (seasonal) marsh [1] (iv) mine dump [1] (v) bush (any type)/(intensive) conservation area [1] (vi) aerodrome/landing area/airport/airstrip [1] (b) the river is between 100 m and 500 m wide there is a dam on the river there are islands in the river there are rapids on the river [4] (c) (i) Flood plain: 41–52 mm from left hand side of section [1] (ii) Group of huts: 4–16 mm from left hand side of section [1] (iii) Track: 3 options 48–53 mm/60–64 mm/87–89 mm from left hand side of section [1] (d) railway/tarred roads power line/fuel tanks/33 kV (line) built up area/huts/staff quarters/buildings/town/village/township/settlement/urban area/residential area, [3] (e) (i) 233º [1] (ii) 974/5 731 [1] (iii) gravel/earth (road) [1] (iv) cultivation [1] 2 (a) Caribbean Nazca [2] (b) (i) destructive [1] (ii) plates converge/push against/move towards/collide etc. subduction/description of subduction Nazca/oceanic plate subducted friction build up of stress/pressure fracturing/faulting release of energy/pressure [3] www.theallpapers.com
Mark scheme, page 3
Page 3 Mark Scheme: Teachers’ version Syllabus Paper IGCSE – May/June 2012 0460 22 © University of Cambridge International Examinations 2012 (c) Haiti shallower Haiti nearer to (large) town Allow with emphasis on Chile or without place names. Repetition of figures alone = 0 but allow the use of the word “only”. [2] 3 (a) (i) 5/5.2 million [1] (ii) Germany [1] (iii) allows easy comparison with other countries/other pyramids/other populations [1] “see percentages/proportions” = 0 “easier to read” = 0 (iv) A Philippines B Germany [2] (b) (i) Philippines [1] (ii) Brazil [1] (iii) Germany [1] www.theallpapers.com
Mark scheme, page 4
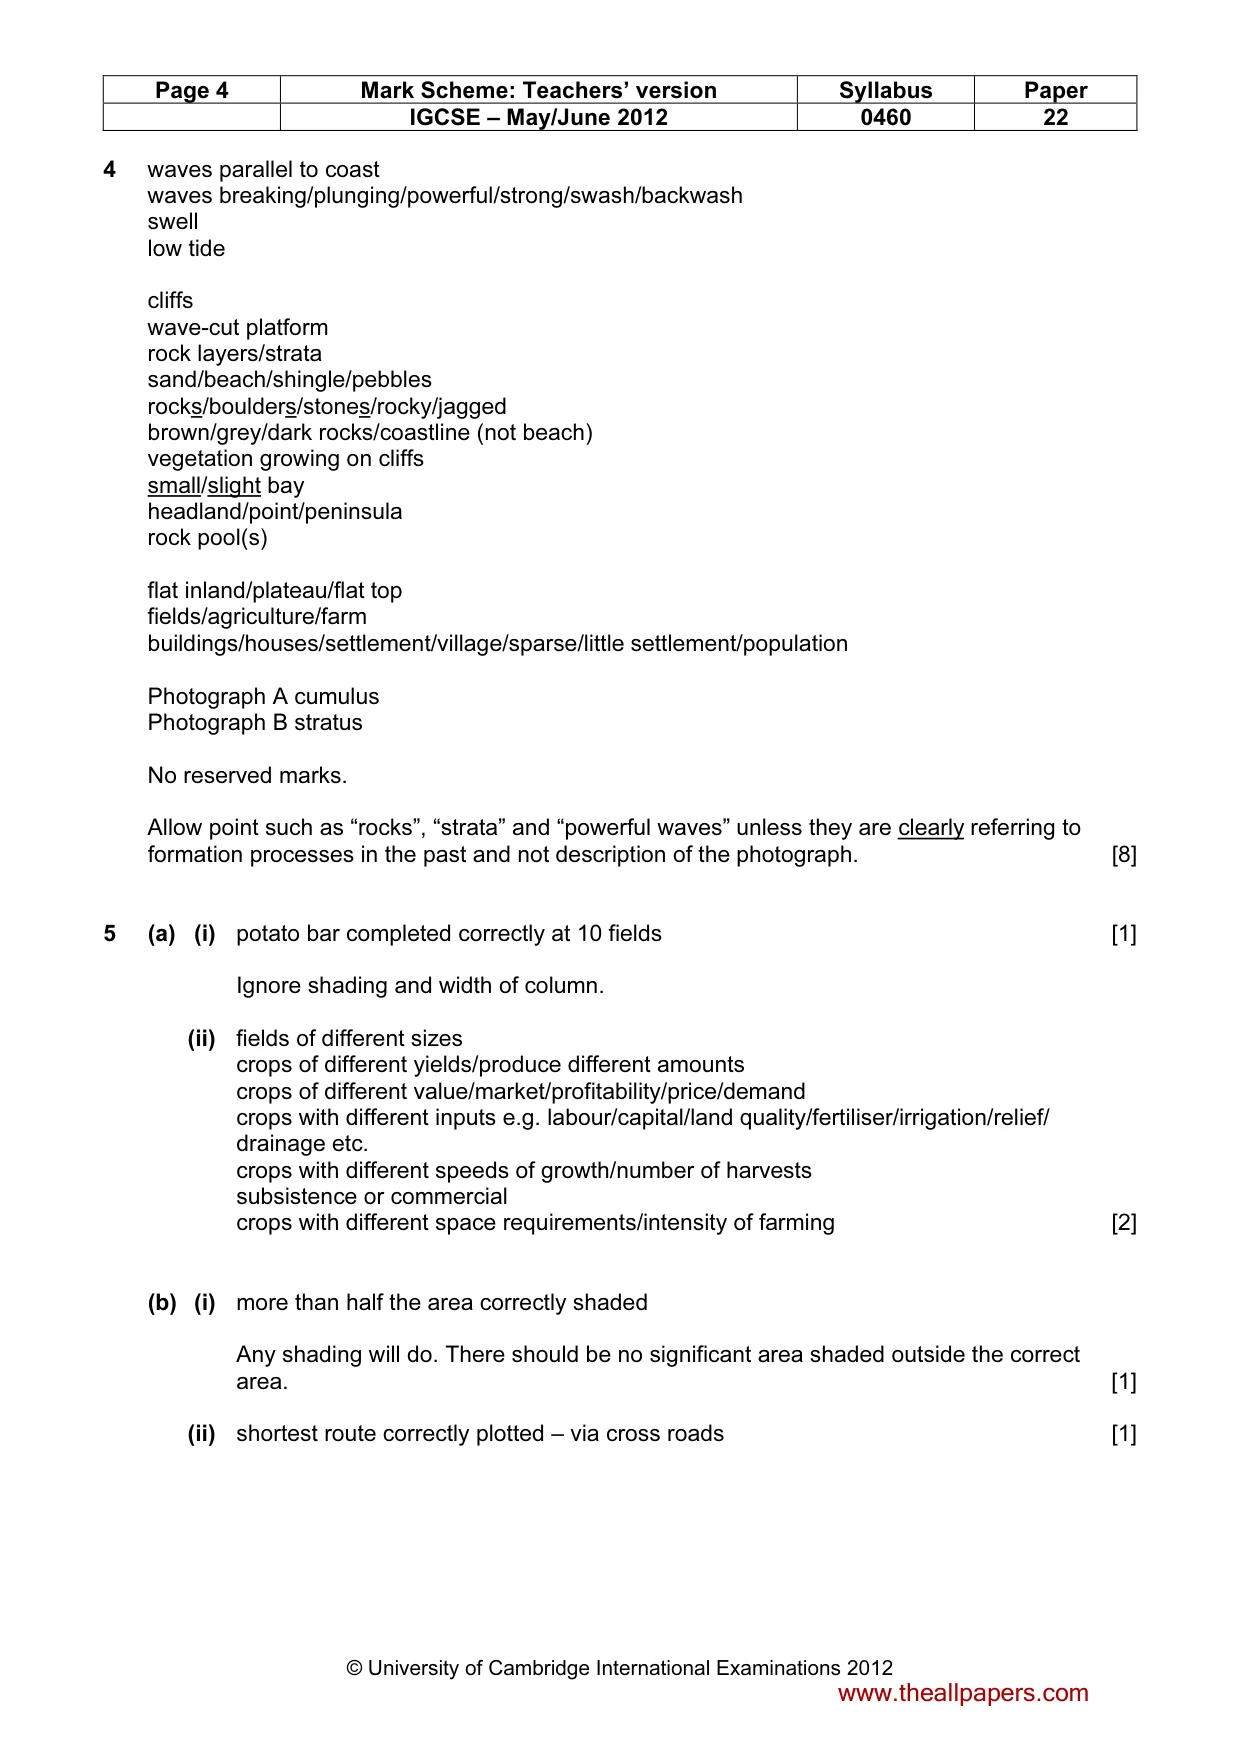
Page 4 Mark Scheme: Teachers’ version Syllabus Paper IGCSE – May/June 2012 0460 22 © University of Cambridge International Examinations 2012 4 waves parallel to coast waves breaking/plunging/powerful/strong/swash/backwash swell low tide cliffs wave-cut platform rock layers/strata sand/beach/shingle/pebbles rocks/boulders/stones/rocky/jagged brown/grey/dark rocks/coastline (not beach) vegetation growing on cliffs small/slight bay headland/point/peninsula rock pool(s) flat inland/plateau/flat top fields/agriculture/farm buildings/houses/settlement/village/sparse/little settlement/population Photograph A cumulus Photograph B stratus No reserved marks. Allow point such as “rocks”, “strata” and “powerful waves” unless they are clearly referring to formation processes in the past and not description of the photograph. [8] 5 (a) (i) potato bar completed correctly at 10 fields [1] Ignore shading and width of column. (ii) fields of different sizes crops of different yields/produce different amounts crops of different value/market/profitability/price/demand crops with different inputs e.g. labour/capital/land quality/fertiliser/irrigation/relief/ drainage etc. crops with different speeds of growth/number of harvests subsistence or commercial crops with different space requirements/intensity of farming [2] (b) (i) more than half the area correctly shaded Any shading will do. There should be no significant area shaded outside the correct area. [1] (ii) shortest route correctly plotted – via cross roads [1] www.theallpapers.com
Mark scheme, page 5
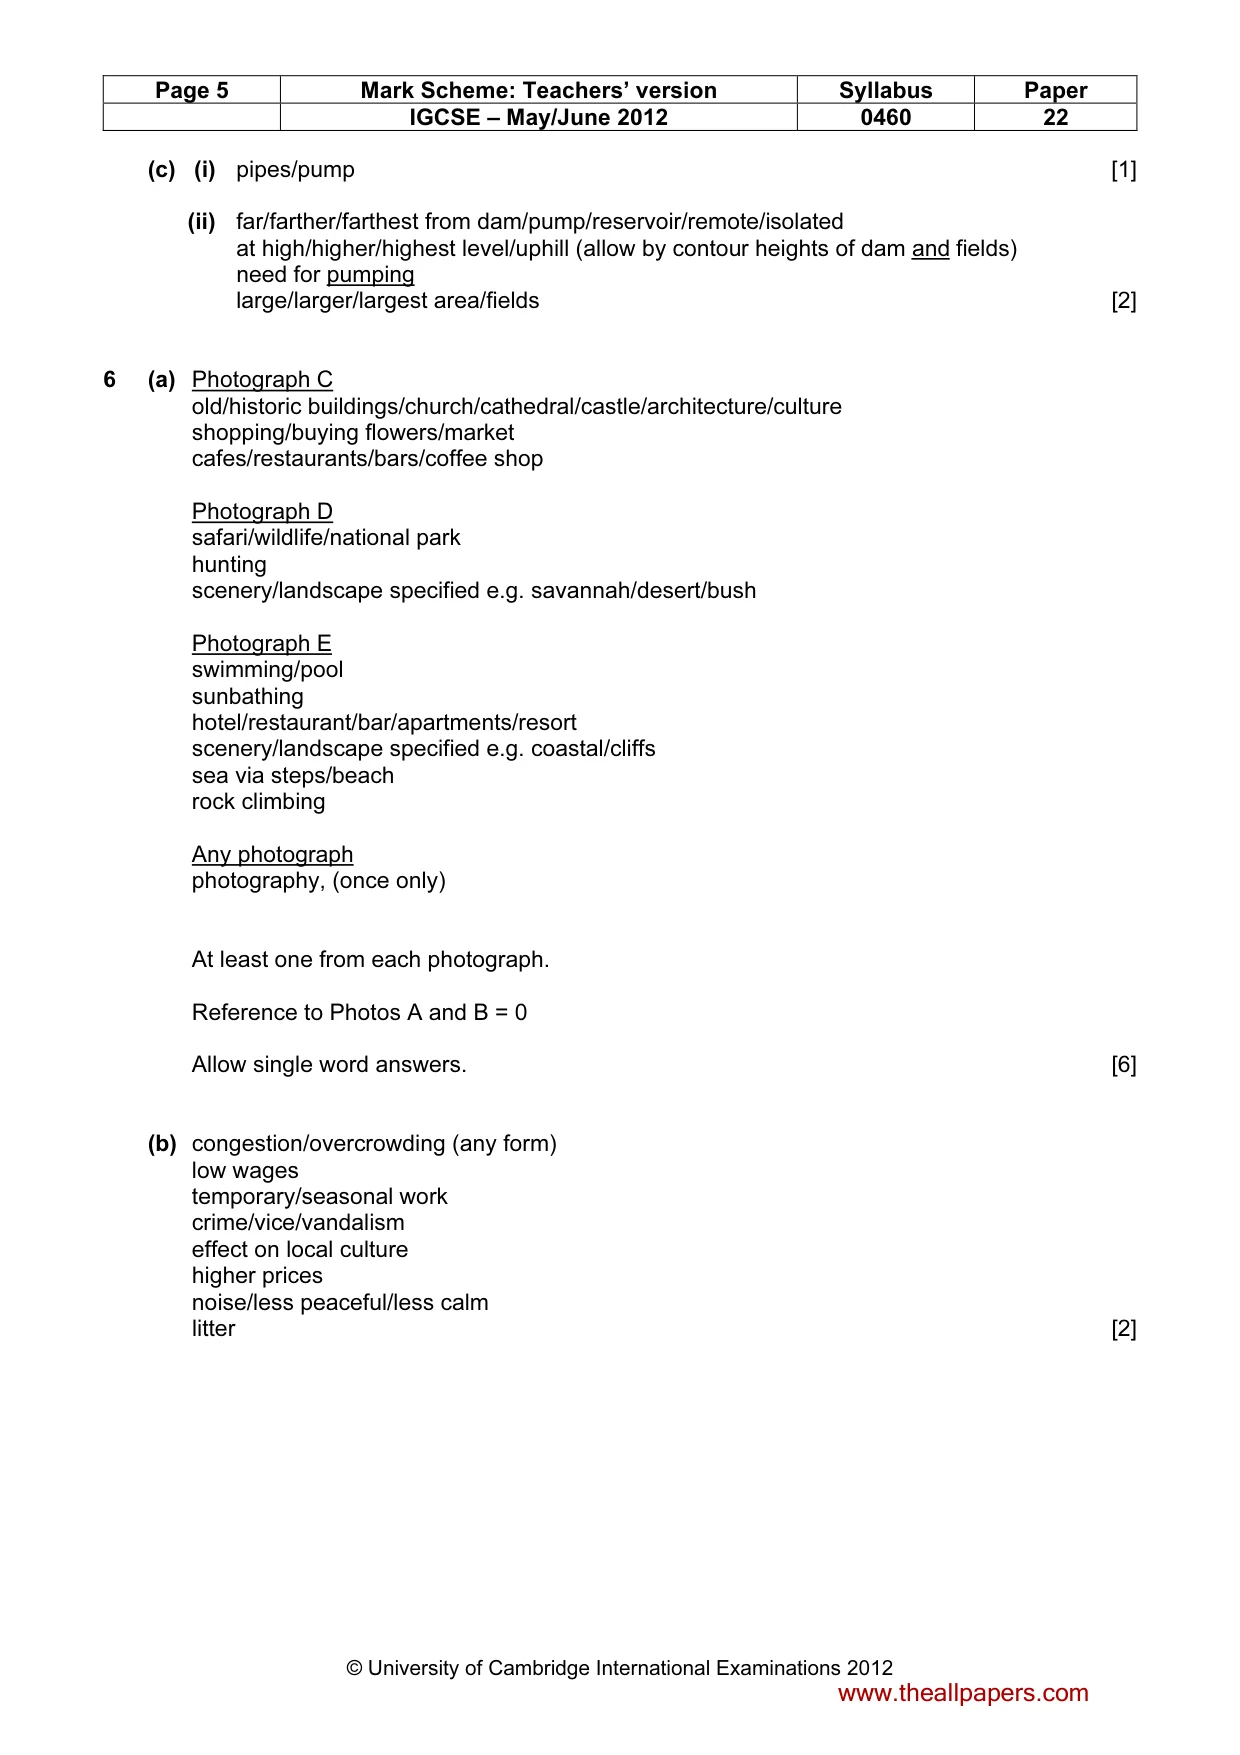
Page 5 Mark Scheme: Teachers’ version Syllabus Paper IGCSE – May/June 2012 0460 22 © University of Cambridge International Examinations 2012 (c) (i) pipes/pump [1] (ii) far/farther/farthest from dam/pump/reservoir/remote/isolated at high/higher/highest level/uphill (allow by contour heights of dam and fields) need for pumping large/larger/largest area/fields [2] 6 (a) Photograph C old/historic buildings/church/cathedral/castle/architecture/culture shopping/buying flowers/market cafes/restaurants/bars/coffee shop Photograph D safari/wildlife/national park hunting scenery/landscape specified e.g. savannah/desert/bush Photograph E swimming/pool sunbathing hotel/restaurant/bar/apartments/resort scenery/landscape specified e.g. coastal/cliffs sea via steps/beach rock climbing Any photograph photography, (once only) At least one from each photograph. Reference to Photos A and B = 0 Allow single word answers. [6] (b) congestion/overcrowding (any form) low wages temporary/seasonal work crime/vice/vandalism effect on local culture higher prices noise/less peaceful/less calm litter [2] www.theallpapers.com
What you needed in this session
Cambridge’s own grade thresholds for 2012 May/June, Paper 2 · Variant 2. A higher threshold means an easier paper — the bar moves with how the cohort did.