Cambridge IGCSE Geography 0460 — 2010 Oct/Nov Paper 4 · Variant 1
0460/41/O/N/10 · 60 marks · ≈68 min
The question paper and its mark scheme, free to read here and free to download. This is Cambridge’s own paper, exactly as it was sat.
Question paper12 pages
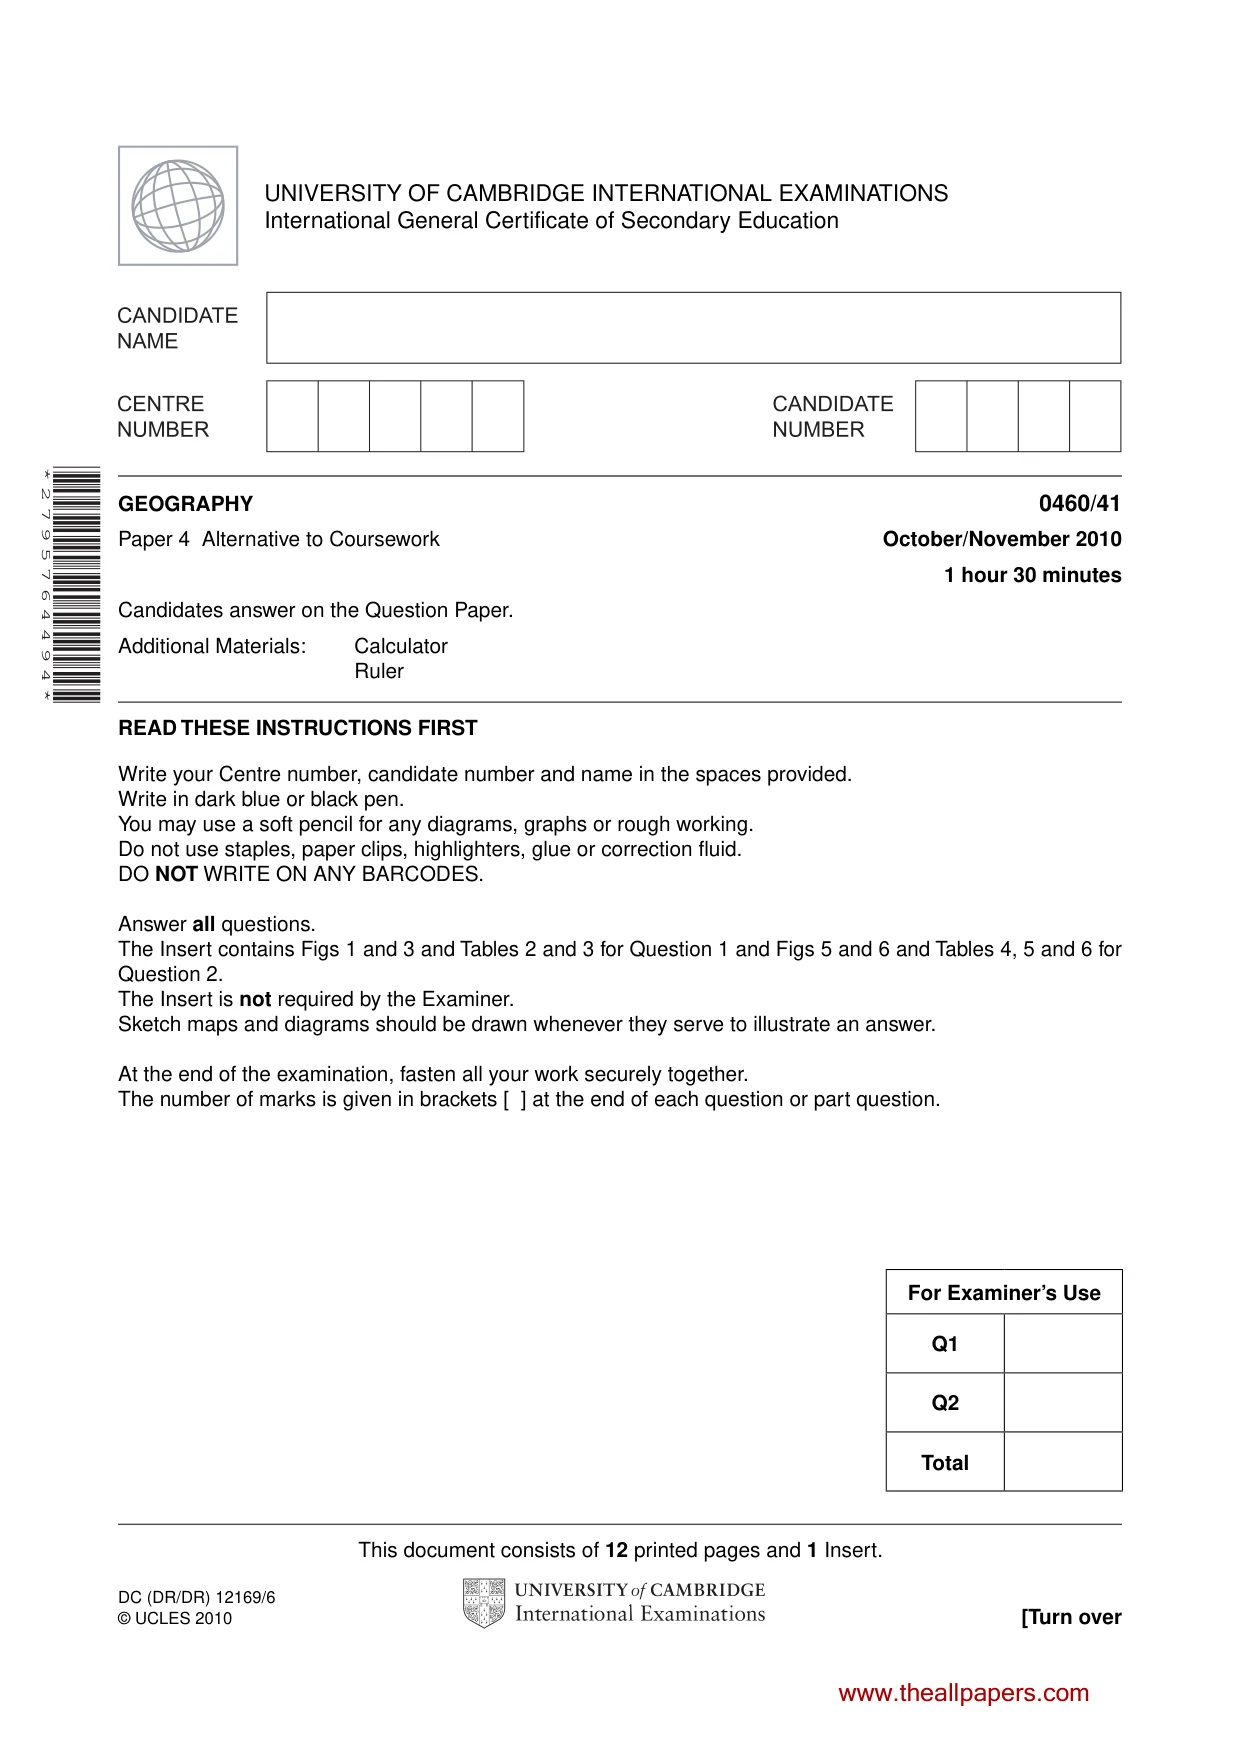
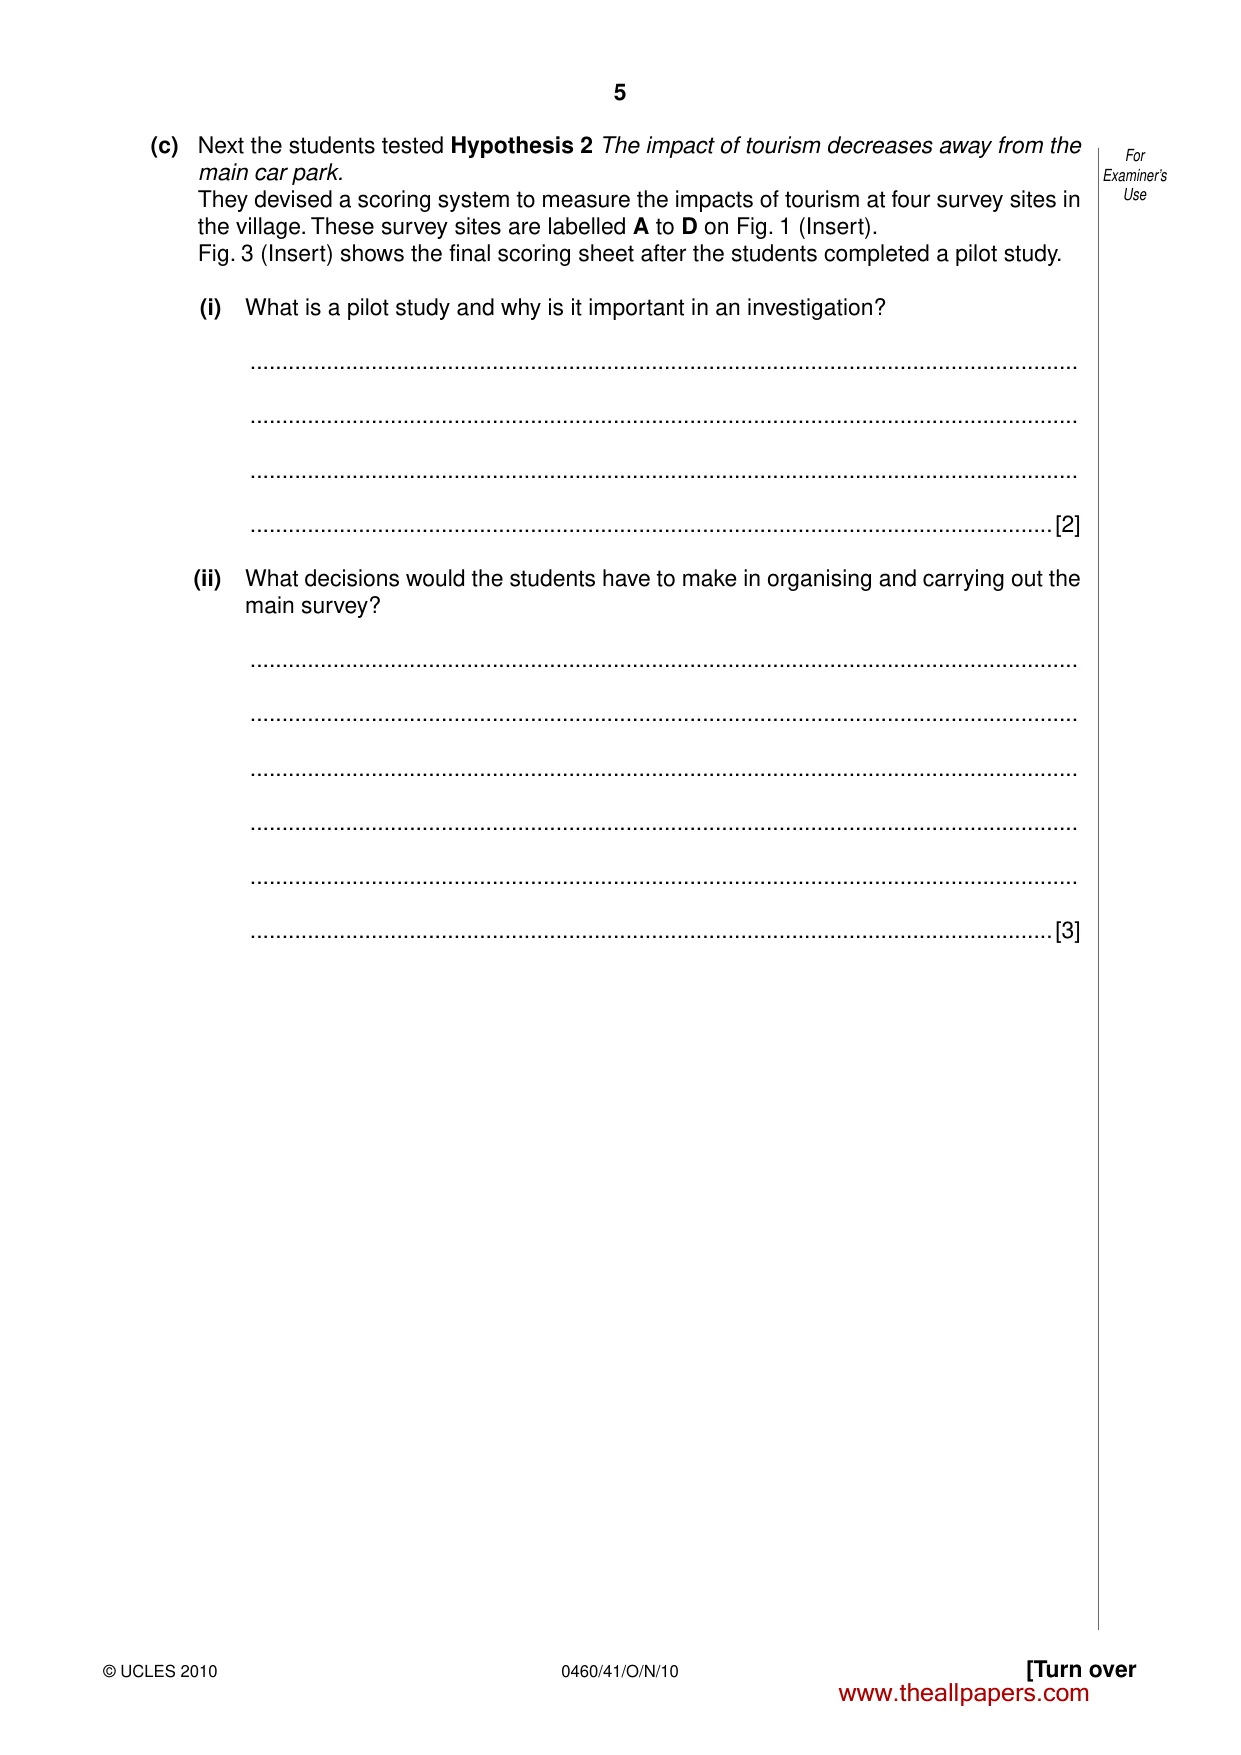
Mark scheme5 pages
Answers below. Sit the paper first if you are practising.
Paper as text
Question paper, page 1
This document consists of 12 printed pages and 1 Insert. DC (DR/DR) 12169/6 © UCLES 2010 [Turn over UNIVERSITY OF CAMBRIDGE INTERNATIONAL EXAMINATIONS International General Certificate of Secondary Education * 2 7 9 5 7 6 4 4 9 4 * GEOGRAPHY 0460/41 Paper 4 Alternative to Coursework October/November 2010 1 hour 30 minutes Candidates answer on the Question Paper. Additional Materials: Calculator Ruler READ THESE INSTRUCTIONS FIRST Write your Centre number, candidate number and name in the spaces provided. Write in dark blue or black pen. You may use a soft pencil for any diagrams, graphs or rough working. Do not use staples, paper clips, highlighters, glue or correction fluid. DO NOT WRITE ON ANY BARCODES. Answer all questions. The Insert contains Figs 1 and 3 and Tables 2 and 3 for Question 1 and Figs 5 and 6 and Tables 4, 5 and 6 for Question 2. The Insert is not required by the Examiner. Sketch maps and diagrams should be drawn whenever they serve to illustrate an answer. At the end of the examination, fasten all your work securely together. The number of marks is given in brackets [ ] at the end of each question or part question. For Examiner’s Use Q1 Q2 Total www.theallpapers.com
Question paper, page 2
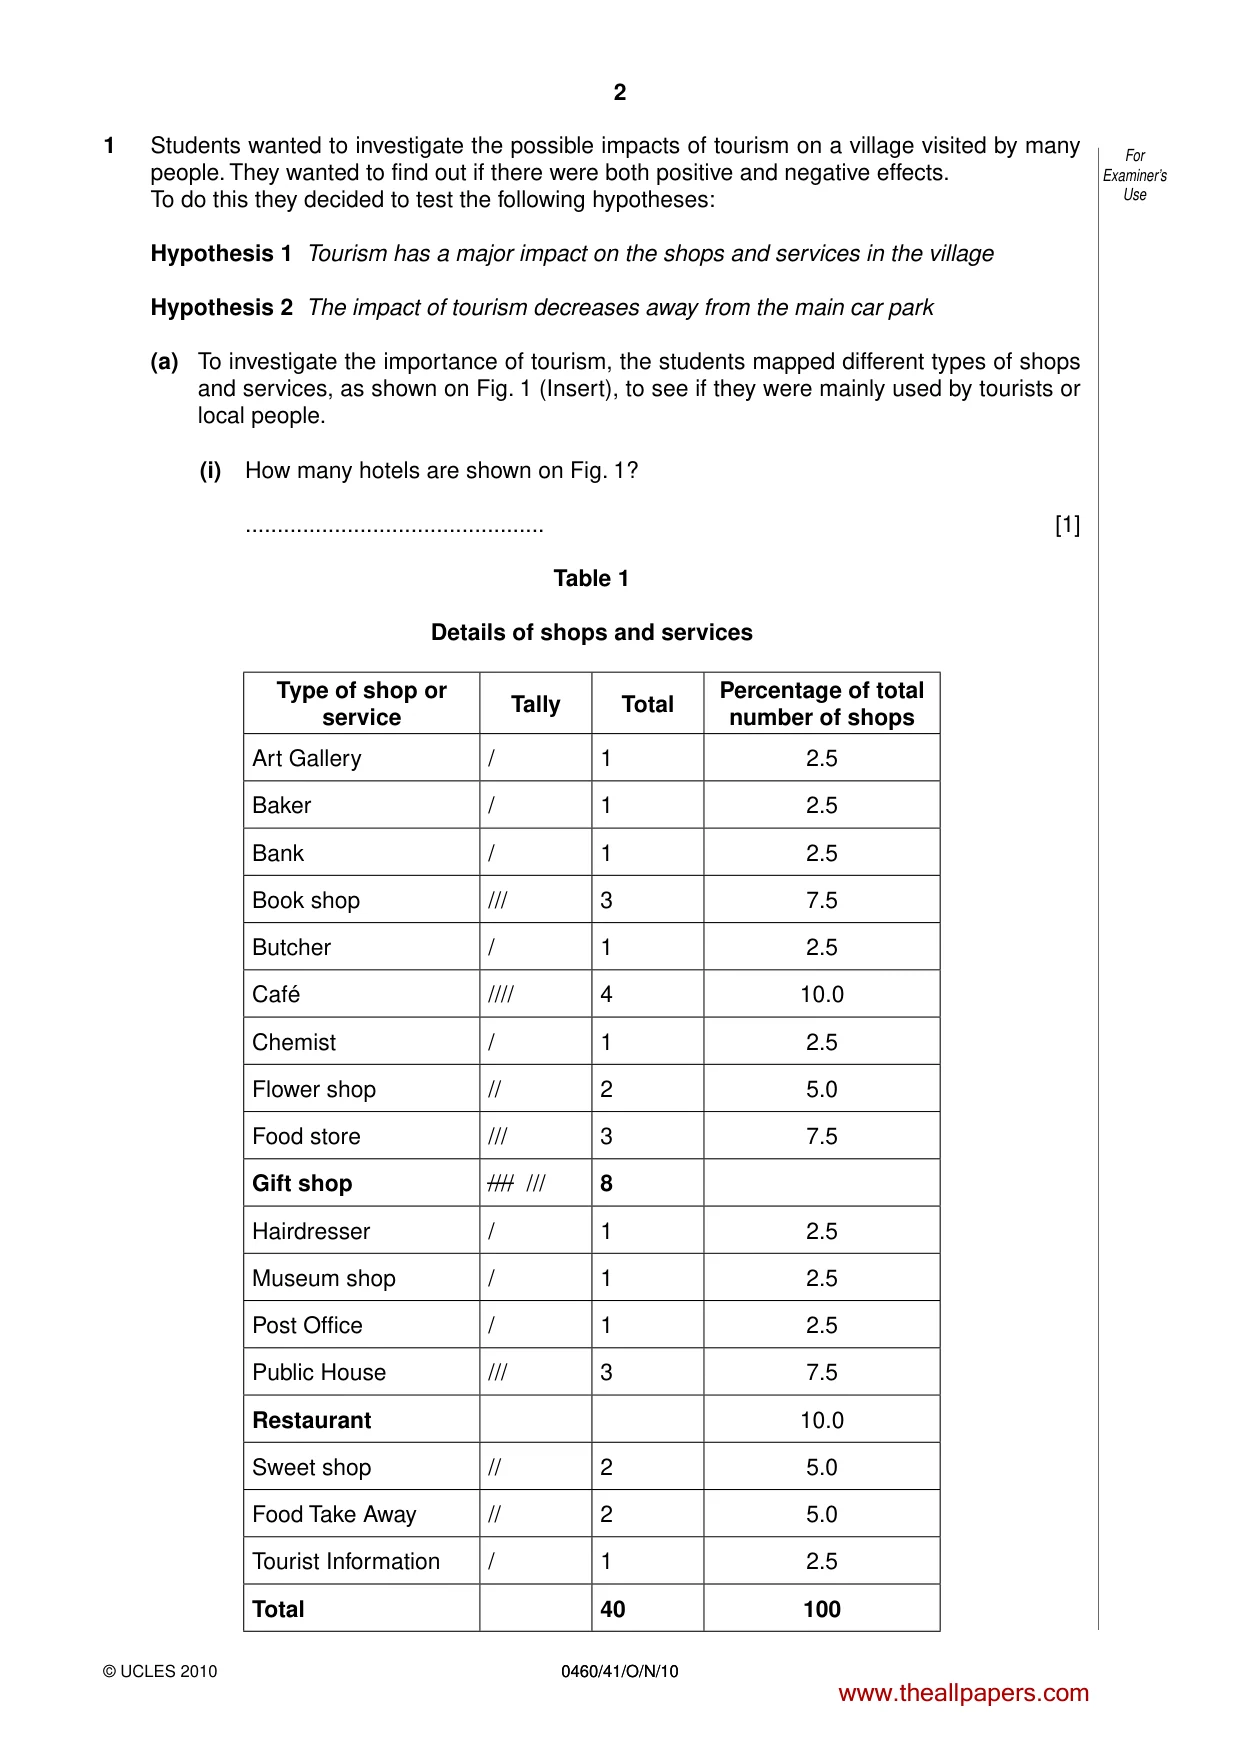
2 0460/41/O/N/10 © UCLES 2010 For Examiner’s Use 0460/41/O/N/10 1 Students wanted to investigate the possible impacts of tourism on a village visited by many people. They wanted to find out if there were both positive and negative effects. To do this they decided to test the following hypotheses: Hypothesis 1 Tourism has a major impact on the shops and services in the village Hypothesis 2 The impact of tourism decreases away from the main car park (a) To investigate the importance of tourism, the students mapped different types of shops and services, as shown on Fig. 1 (Insert), to see if they were mainly used by tourists or local people. (i) How many hotels are shown on Fig. 1? … [1] Table 1 Details of shops and services Type of shop or service Tally Total Percentage of total number of shops Art Gallery / 1 2.5 Baker / 1 2.5 Bank / 1 2.5 Book shop /// 3 7.5 Butcher / 1 2.5 Café //// 4 10.0 Chemist / 1 2.5 Flower shop // 2 5.0 Food store /// 3 7.5 Gift shop //// /// 8 Hairdresser / 1 2.5 Museum shop / 1 2.5 Post Office / 1 2.5 Public House /// 3 7.5 Restaurant 10.0 Sweet shop // 2 5.0 Food Take Away // 2 5.0 Tourist Information / 1 2.5 Total 40 100 www.theallpapers.com
Question paper, page 3
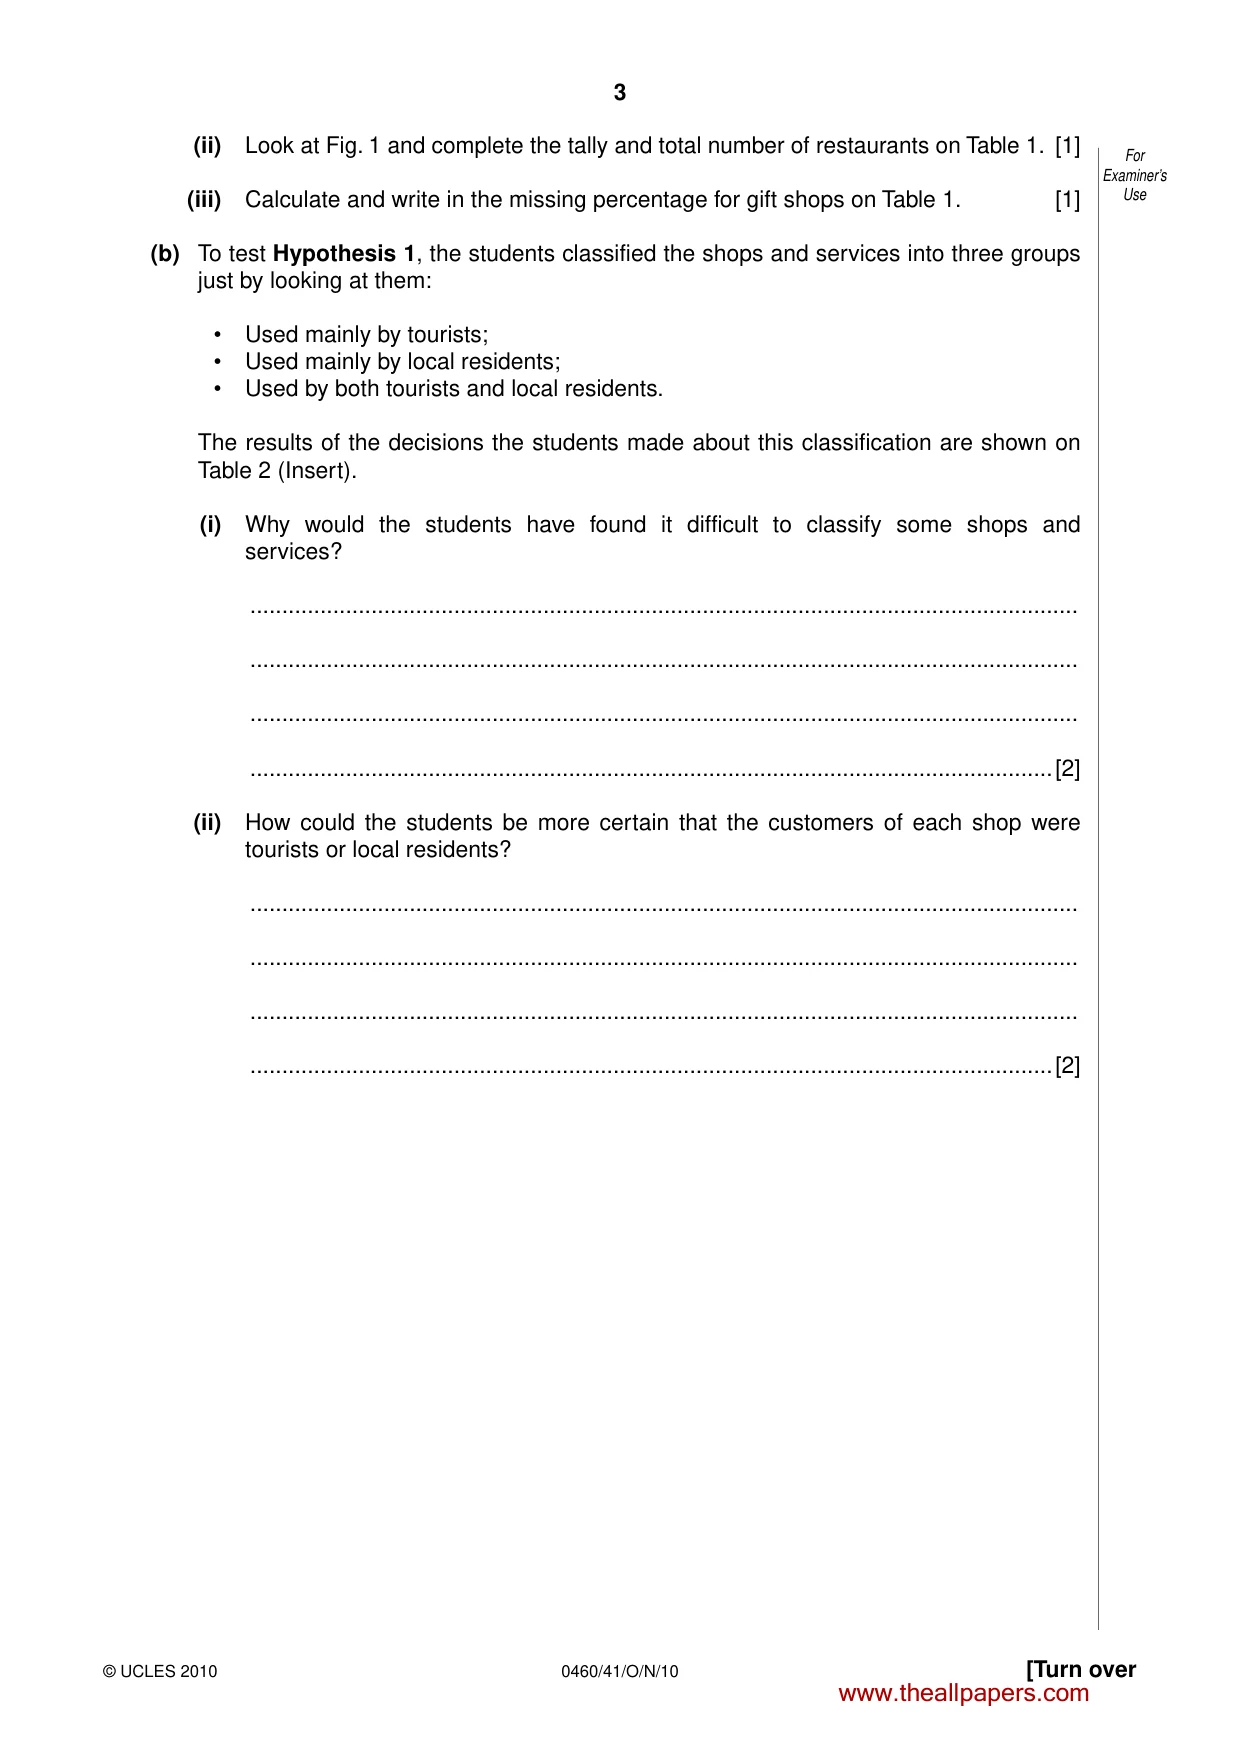
3 0460/41/O/N/10 © UCLES 2010 [Turn over For Examiner’s Use (ii) Look at Fig. 1 and complete the tally and total number of restaurants on Table 1. [1] (iii) Calculate and write in the missing percentage for gift shops on Table 1. [1] (b) To test Hypothesis 1, the students classified the shops and services into three groups just by looking at them: • Used mainly by tourists; • Used mainly by local residents; • Used by both tourists and local residents. The results of the decisions the students made about this classification are shown on Table 2 (Insert). (i) Why would the students have found it difficult to classify some shops and services? … … … …[2] (ii) How could the students be more certain that the customers of each shop were tourists or local residents? … … … …[2] www.theallpapers.com
Question paper, page 4
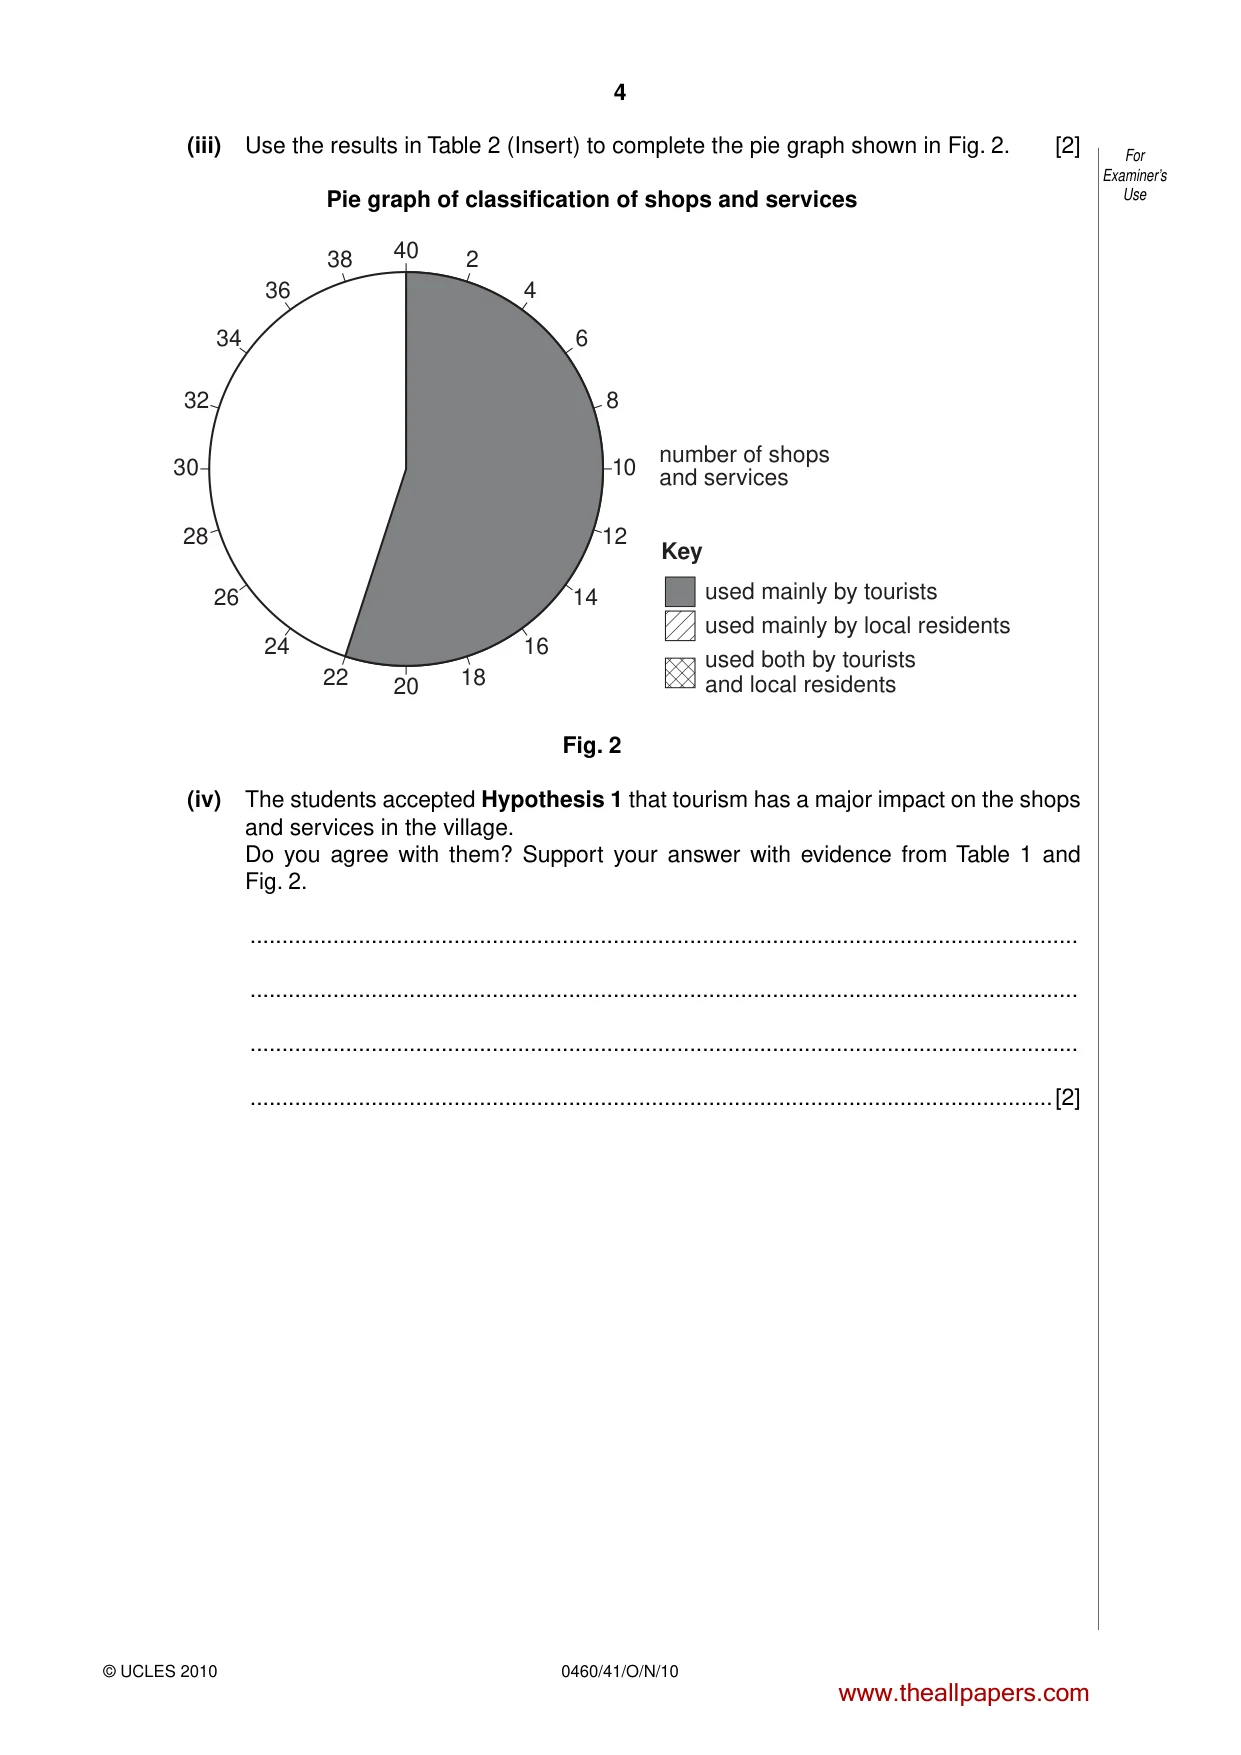
4 0460/41/O/N/10 © UCLES 2010 For Examiner’s Use (iii) Use the results in Table 2 (Insert) to complete the pie graph shown in Fig. 2. [2] Pie graph of classification of shops and services 40 20 2 38 4 36 6 34 8 32 12 28 14 26 16 24 18 22 10 30 number of shops and services Key used mainly by tourists used mainly by local residents used both by tourists and local residents Fig. 2 (iv) The students accepted Hypothesis 1 that tourism has a major impact on the shops and services in the village. Do you agree with them? Support your answer with evidence from Table 1 and Fig. 2. … … … …[2] www.theallpapers.com
Question paper, page 5
5 0460/41/O/N/10 © UCLES 2010 [Turn over For Examiner’s Use (c) Next the students tested Hypothesis 2 The impact of tourism decreases away from the main car park. They devised a scoring system to measure the impacts of tourism at four survey sites in the village. These survey sites are labelled A to D on Fig. 1 (Insert). Fig. 3 (Insert) shows the final scoring sheet after the students completed a pilot study. (i) What is a pilot study and why is it important in an investigation? … … … …[2] (ii) What decisions would the students have to make in organising and carrying out the main survey? … … … … … …[3] www.theallpapers.com
Question paper, page 6
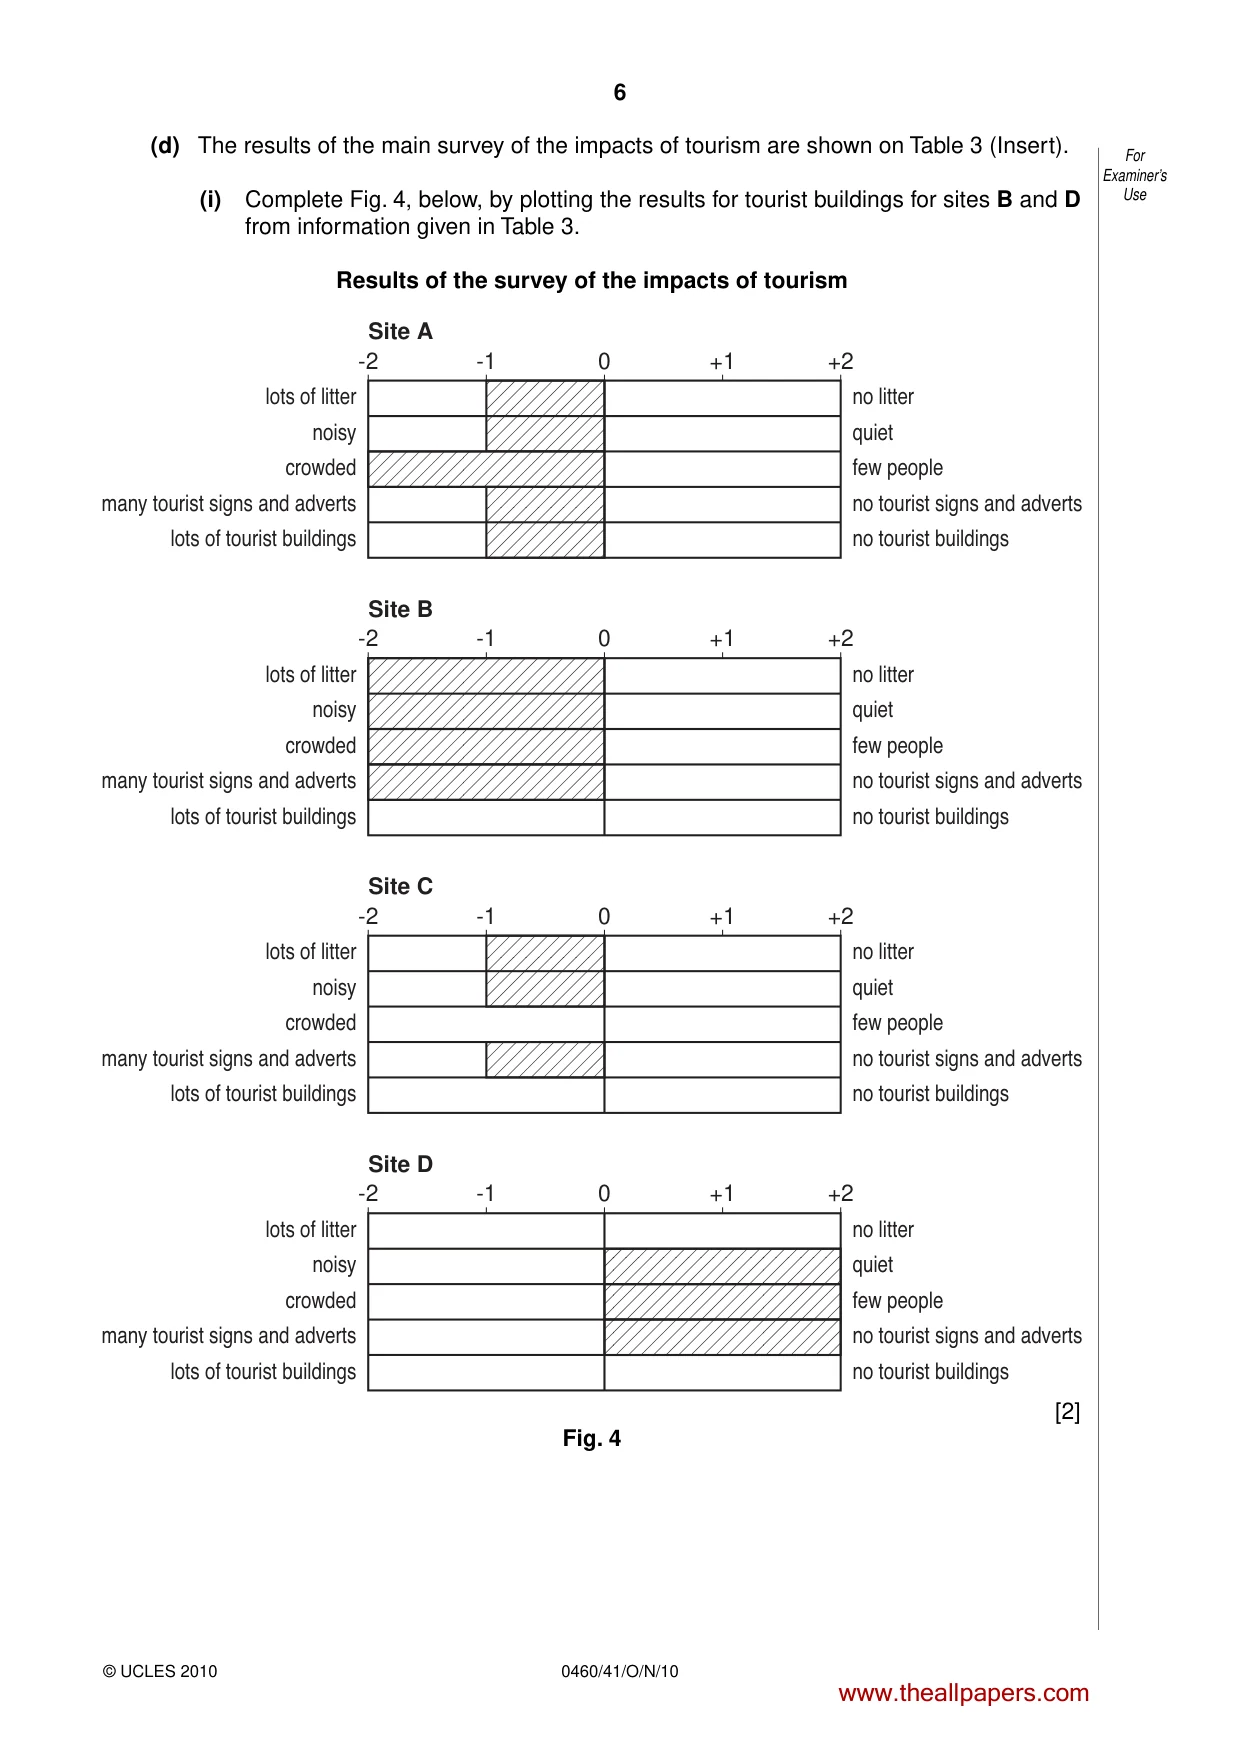
6 0460/41/O/N/10 © UCLES 2010 For Examiner’s Use (d) The results of the main survey of the impacts of tourism are shown on Table 3 (Insert). (i) Complete Fig. 4, below, by plotting the results for tourist buildings for sites B and D from information given in Table 3. Results of the survey of the impacts of tourism -2 -1 0 +1 +2 lots of litter noisy crowded many tourist signs and adverts lots of tourist buildings no litter quiet few people no tourist signs and adverts no tourist buildings Site A -2 -1 0 +1 +2 lots of litter noisy crowded many tourist signs and adverts lots of tourist buildings no litter quiet few people no tourist signs and adverts no tourist buildings Site B -2 -1 0 +1 +2 lots of litter noisy crowded many tourist signs and adverts lots of tourist buildings no litter quiet few people no tourist signs and adverts no tourist buildings Site C -2 -1 0 +1 +2 lots of litter noisy crowded many tourist signs and adverts lots of tourist buildings no litter quiet few people no tourist signs and adverts no tourist buildings Site D [2] Fig. 4 www.theallpapers.com
Question paper, page 7
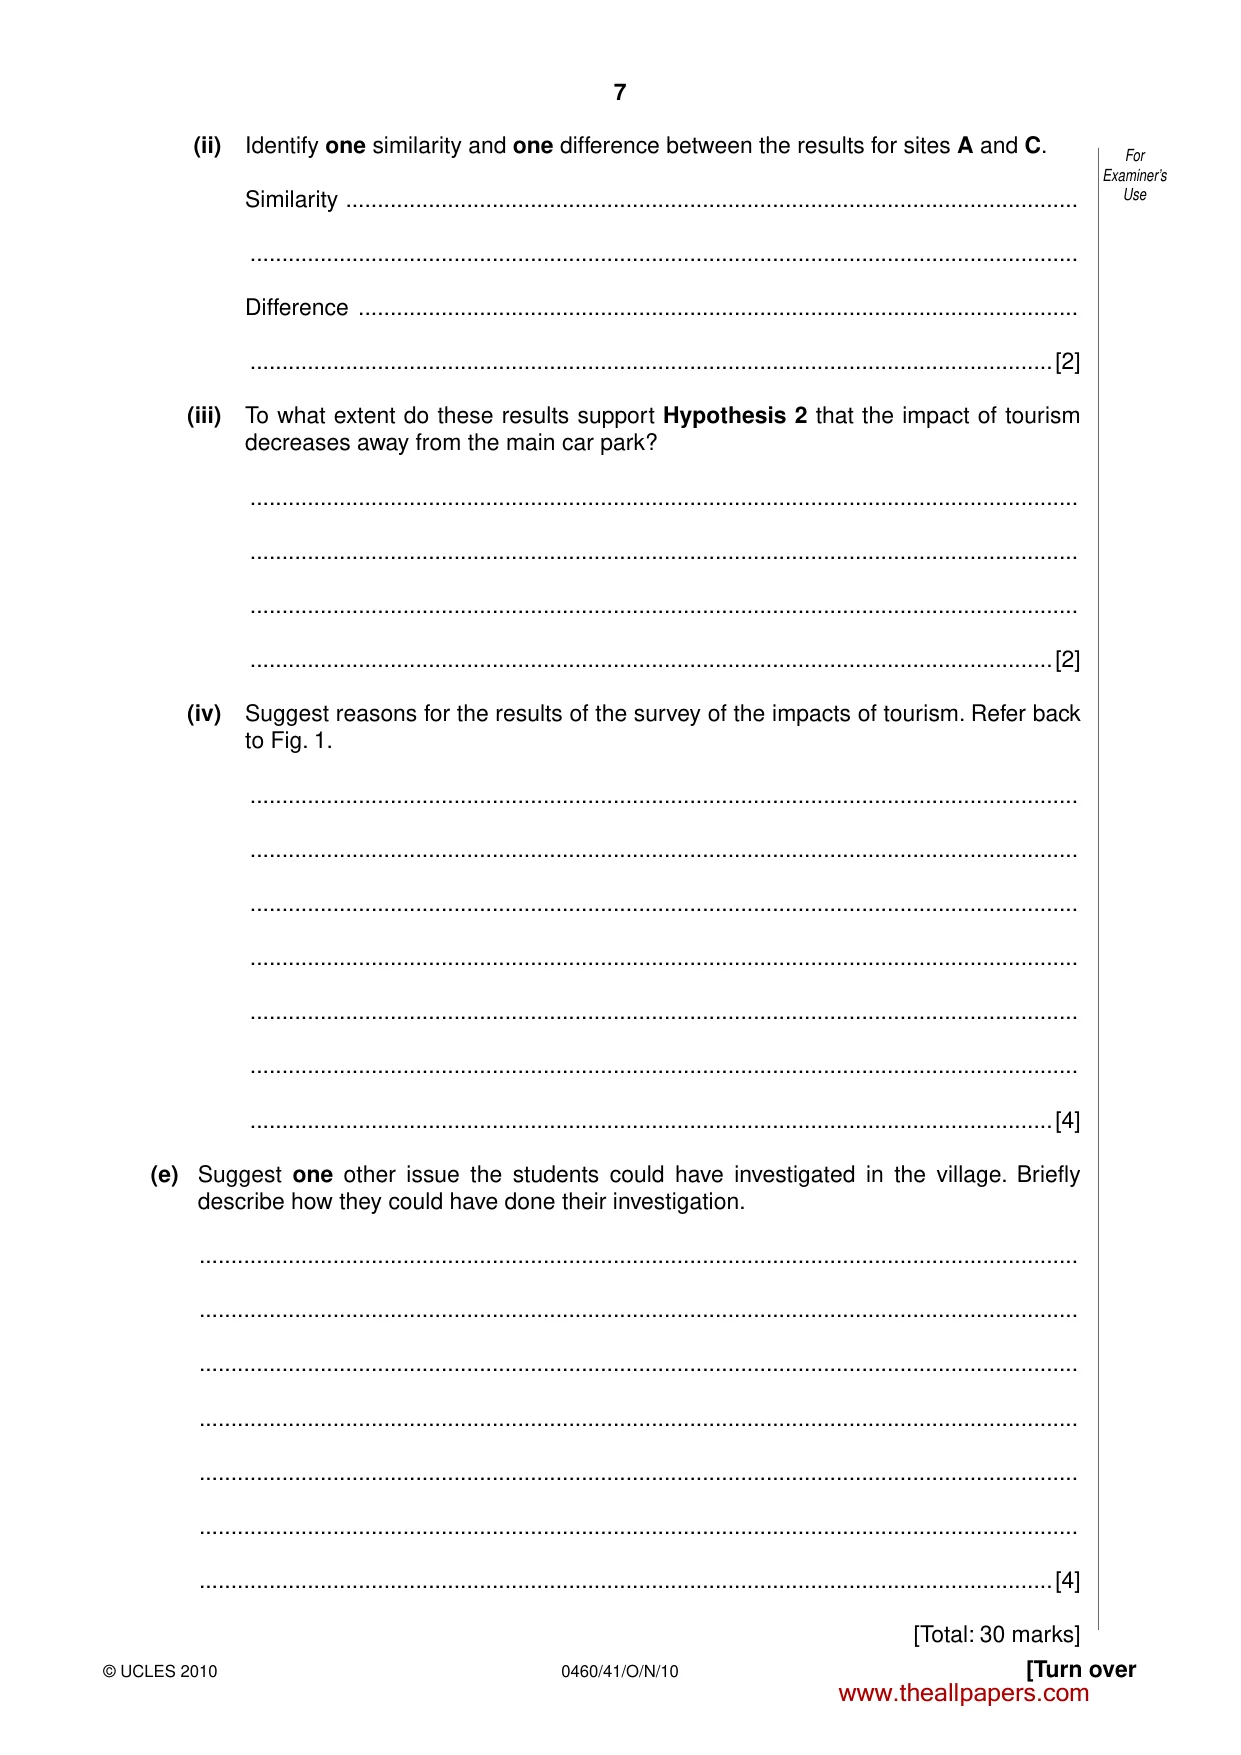
7 0460/41/O/N/10 © UCLES 2010 [Turn over For Examiner’s Use (ii) Identify one similarity and one difference between the results for sites A and C. Similarity … … Difference … …[2] (iii) To what extent do these results support Hypothesis 2 that the impact of tourism decreases away from the main car park? … … … …[2] (iv) Suggest reasons for the results of the survey of the impacts of tourism. Refer back to Fig. 1. … … … … … … …[4] (e) Suggest one other issue the students could have investigated in the village. Briefly describe how they could have done their investigation. … … … … … … …[4] [Total: 30 marks] www.theallpapers.com
Question paper, page 8
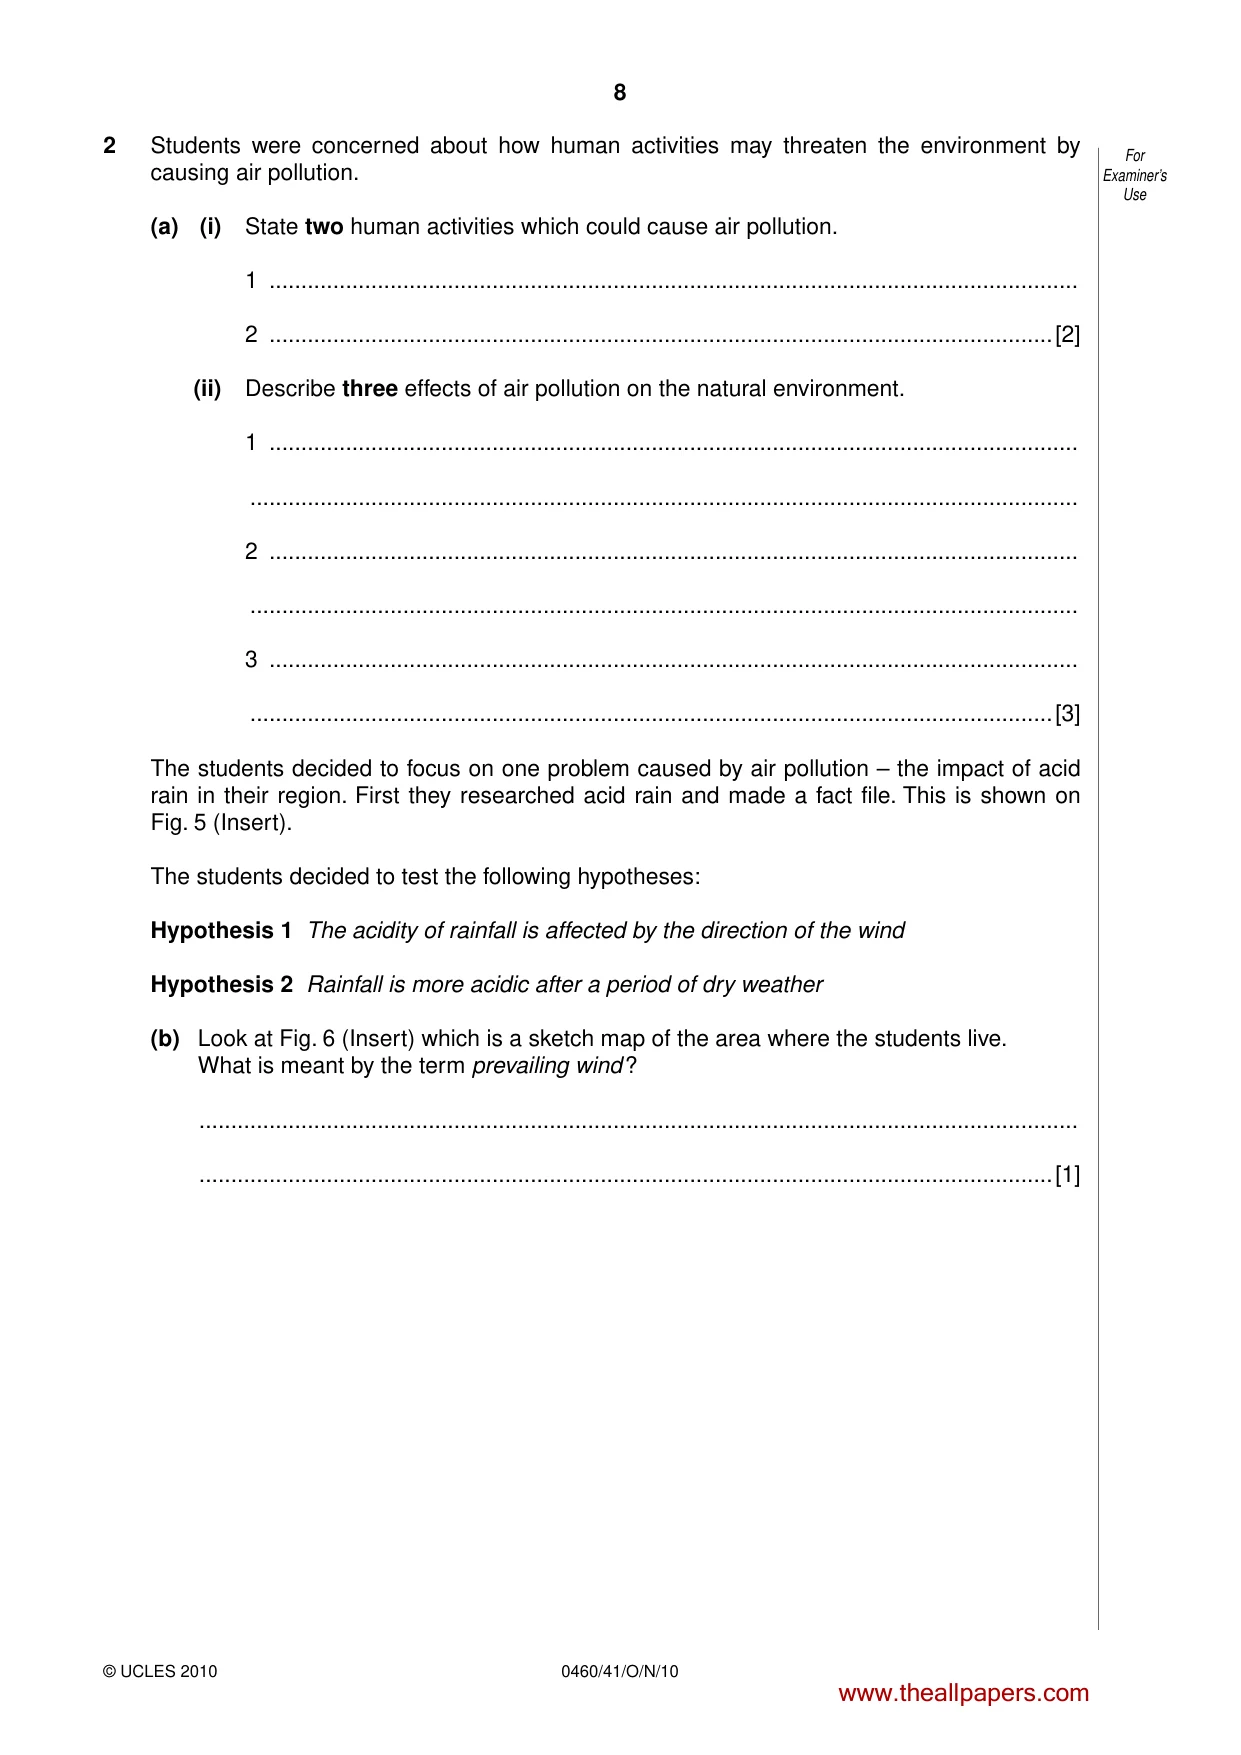
8 0460/41/O/N/10 © UCLES 2010 For Examiner’s Use 2 Students were concerned about how human activities may threaten the environment by causing air pollution. (a) (i) State two human activities which could cause air pollution. 1 … 2 …[2] (ii) Describe three effects of air pollution on the natural environment. 1 … … 2 … … 3 … …[3] The students decided to focus on one problem caused by air pollution – the impact of acid rain in their region. First they researched acid rain and made a fact file. This is shown on Fig. 5 (Insert). The students decided to test the following hypotheses: Hypothesis 1 The acidity of rainfall is affected by the direction of the wind Hypothesis 2 Rainfall is more acidic after a period of dry weather (b) Look at Fig. 6 (Insert) which is a sketch map of the area where the students live. What is meant by the term prevailing wind ? … …[1] www.theallpapers.com
Question paper, page 9
9 0460/41/O/N/10 © UCLES 2010 [Turn over For Examiner’s Use (c) The students realised that this investigation would be long-term, so they agreed to do their investigation every day for four months. They set up a recording station in the grounds of their school. Each day they recorded the following: • wind direction, • amount of rain that had fallen in the previous 24 hours, • pH value of any rainwater collected. They recorded their results as a data log. Part of this log is shown on Table 4 (Insert). (i) Describe how they collected their data. Refer to equipment used in your answer. The answer for pH has been done for you. Wind direction … … Amount of rain that had fallen … … pH They used a pH meter or pH strips to measure the pH value of rainwater. [2] (ii) Why did the students decide to do their investigation over four months? … … … …[2] (iii) What difficulties might the students have had in collecting their data, which may have affected their results? … … … … … …[3] www.theallpapers.com
Question paper, page 10
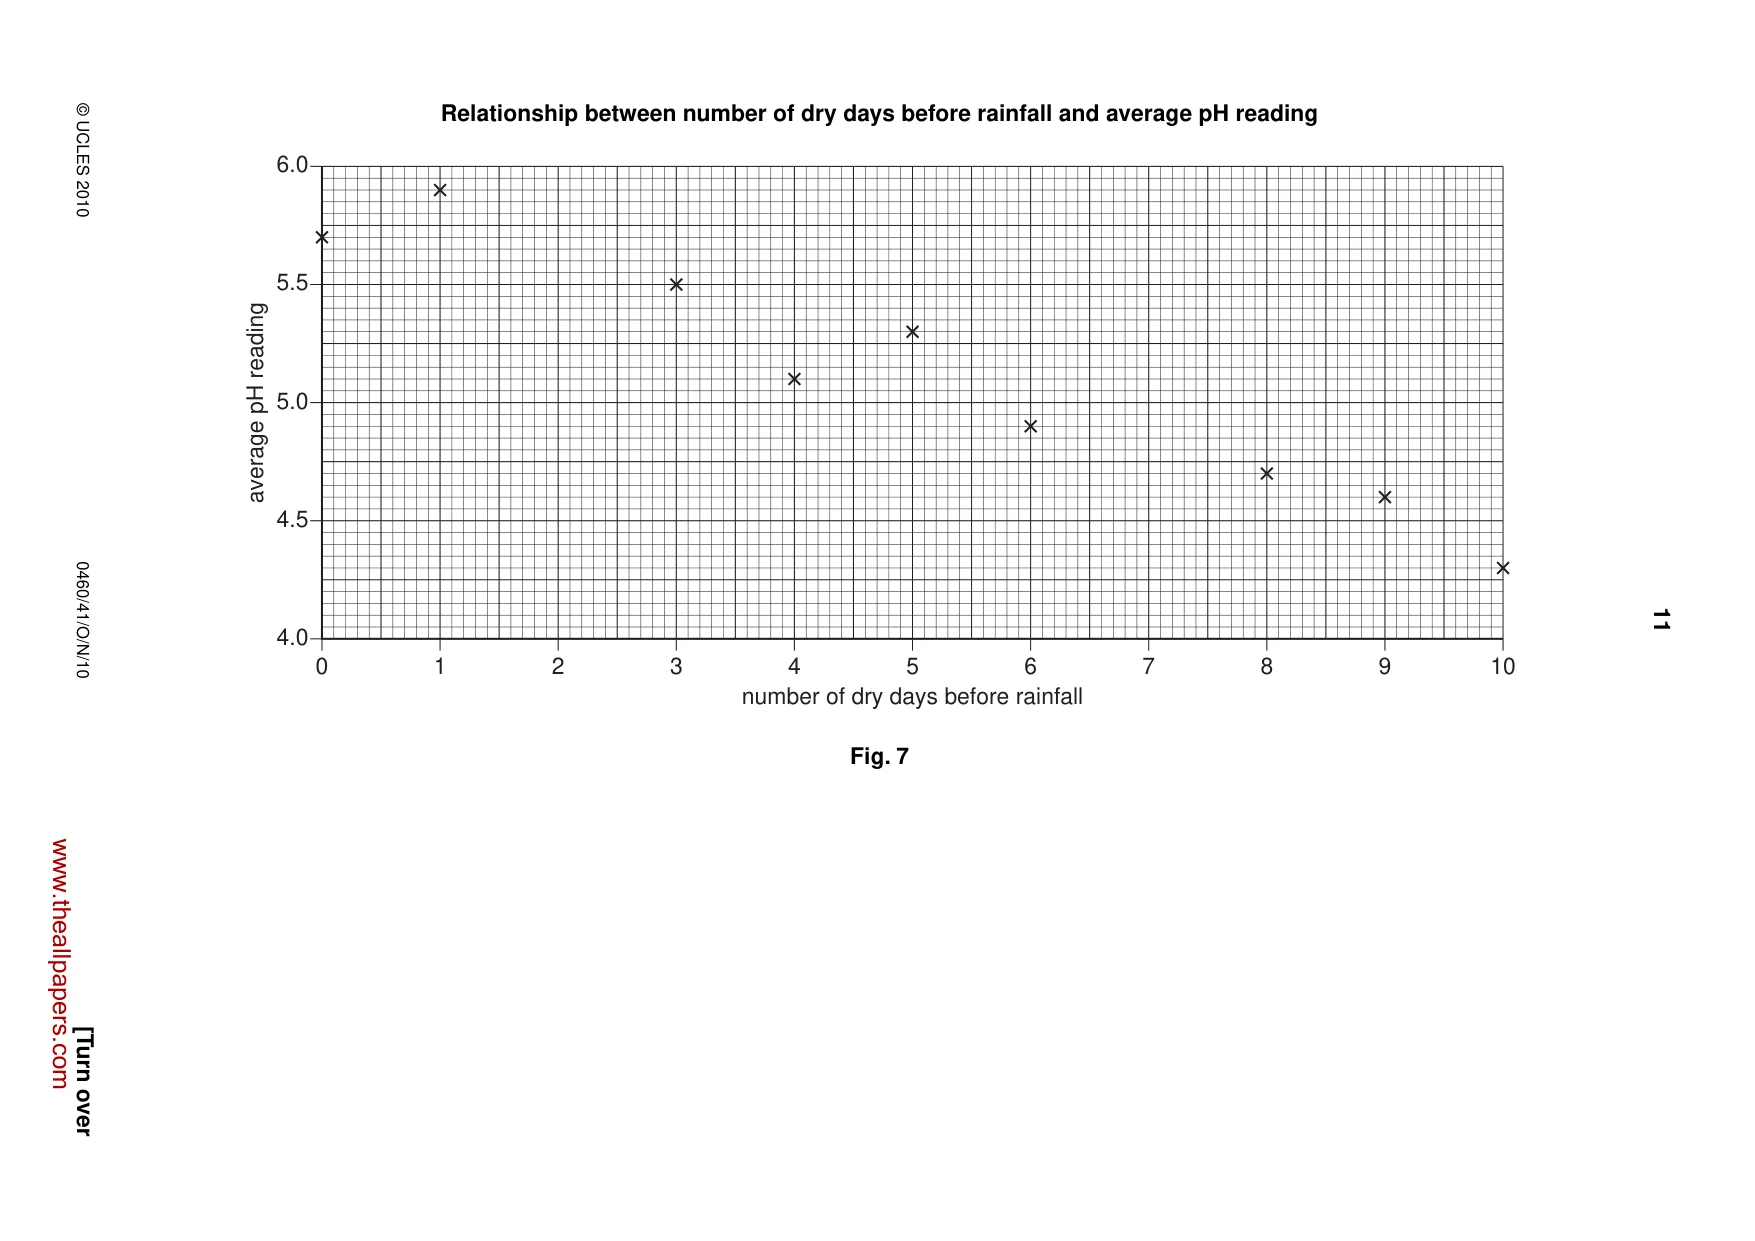
10 0460/41/O/N/10 © UCLES 2010 For Examiner’s Use (iv) Using their data log, they produced the summary in Table 5 (Insert). By studying this summary, what conclusion could the students make about Hypothesis 1 The acidity of rainfall is affected by the direction of the wind ? What evidence from Table 5 supports their conclusion? … … … … … …[3] (v) Use information from Figs 5 and 6 (Insert) to explain why the level of acidity in rainfall varies with wind direction. … … … … … …[3] Next, the students looked at Hypothesis 2 Rainfall is more acidic after a period of dry weather. (d) Using their data log again, the students produced the summary in Table 6 (Insert). (i) Use the results recorded in bold in Table 6 to complete the scatter graph, Fig. 7 (opposite) and draw in a best-fit line. [3] (ii) The students accepted Hypothesis 2 Rainfall is more acidic after a period of dry weather. Do you agree with them? Support your answer with evidence from Fig. 7. … … … …[2] www.theallpapers.com
Question paper, page 11
11 0460/41/O/N/10 © UCLES 2010 [Turn over Relationship between number of dry days before rainfall and average pH reading 4.0 4.5 5.0 5.5 6.0 0 1 2 3 4 5 number of dry days before rainfall 6 7 8 9 10 average pH reading Fig. 7 www.theallpapers.com
Question paper, page 12
12 0460/41/O/N/10 © UCLES 2010 For Examiner’s Use Permission to reproduce items where third-party owned material protected by copyright is included has been sought and cleared where possible. Every reasonable effort has been made by the publisher (UCLES) to trace copyright holders, but if any items requiring clearance have unwittingly been included, the publisher will be pleased to make amends at the earliest possible opportunity. University of Cambridge International Examinations is part of the Cambridge Assessment Group. Cambridge Assessment is the brand name of University of Cambridge Local Examinations Syndicate (UCLES), which is itself a department of the University of Cambridge. (e) (i) The students wanted to investigate the impact of another kind of pollution. Suggest a possible hypothesis about water pollution and describe appropriate data collection methods. … … … … … … … …[4] (ii) Having completed their investigation of water pollution, what recommendations might the students have made to a water authority about how to reduce the level of pollution? … … … …[2] [Total: 30 marks] www.theallpapers.com
Mark scheme, page 1
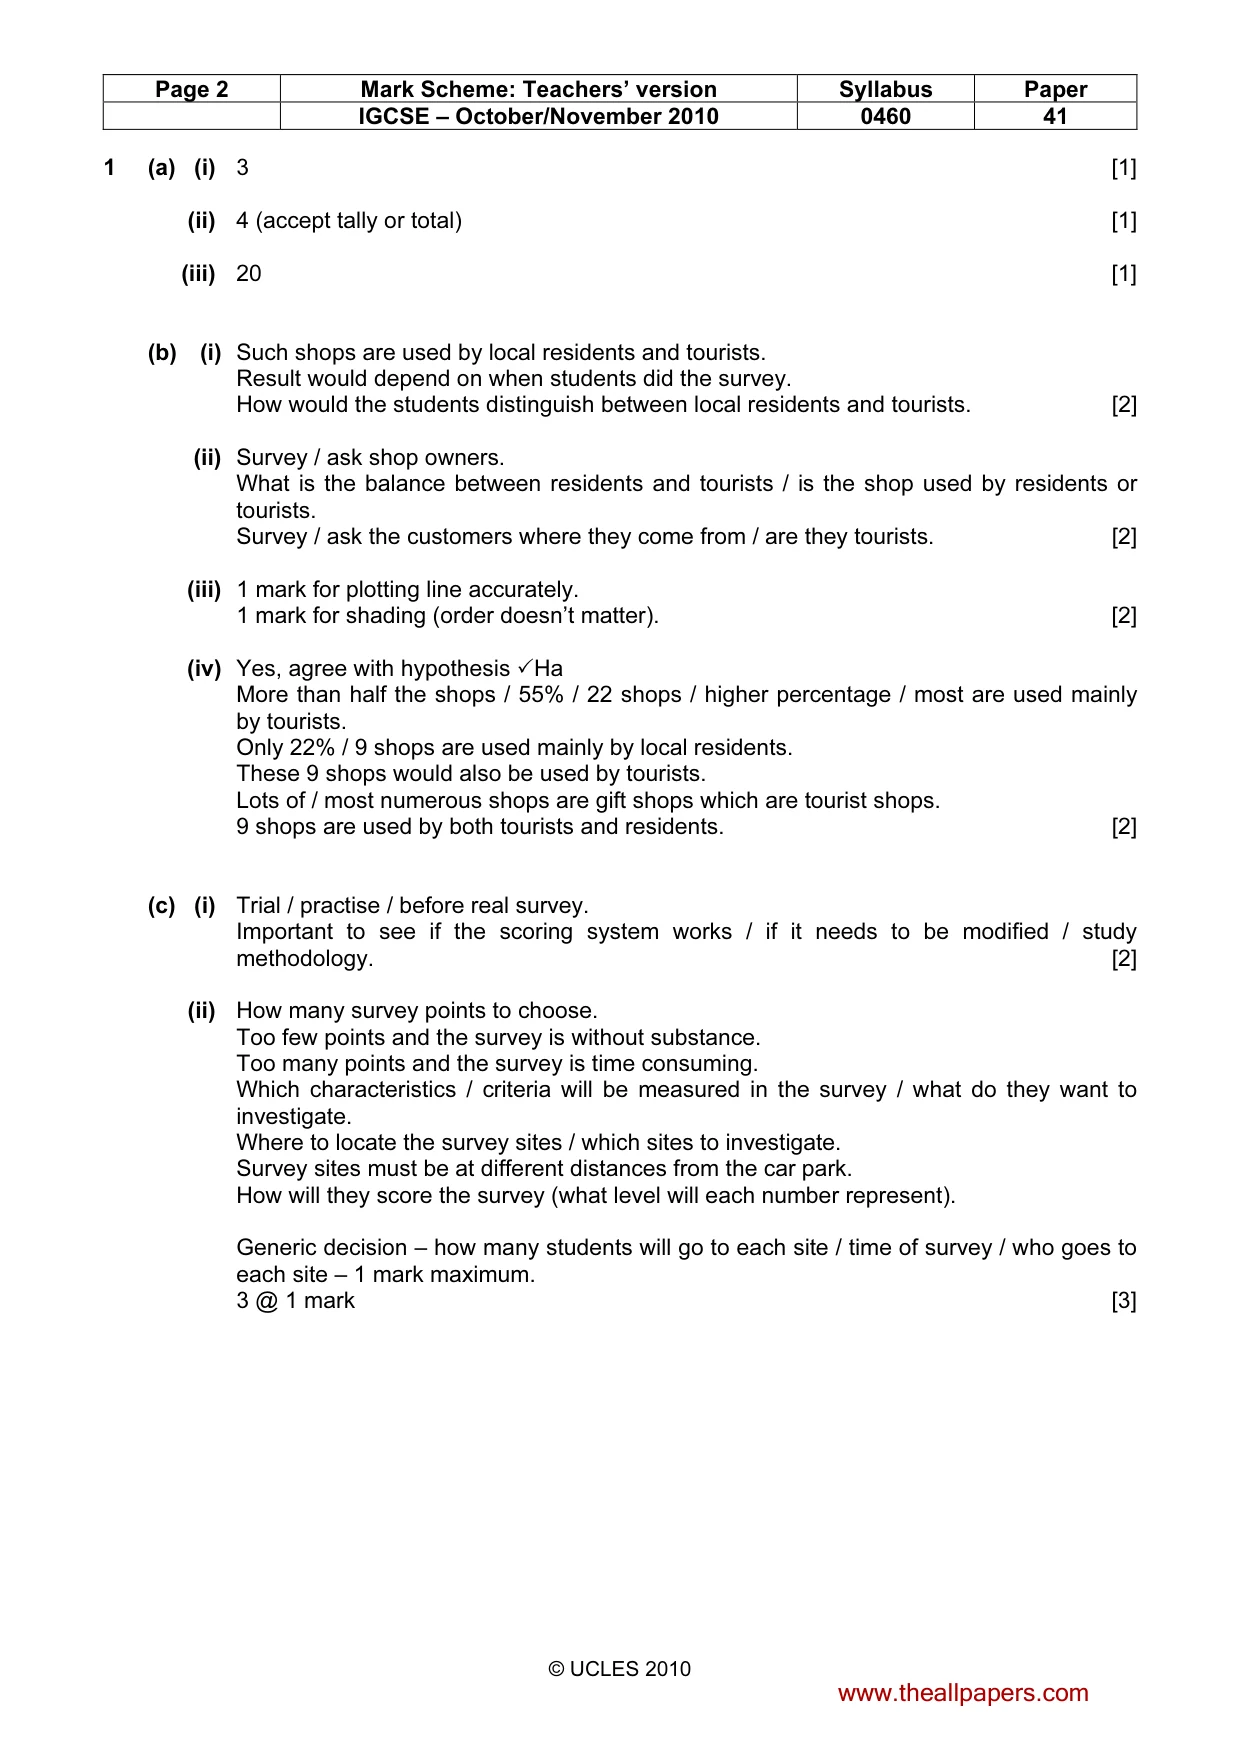
UNIVERSITY OF CAMBRIDGE INTERNATIONAL EXAMINATIONS International General Certificate of Secondary Education MARK SCHEME for the October/November 2010 question paper for the guidance of teachers 0460 GEOGRAPHY 0460/41 Paper 4 (Alternative to Coursework), maximum raw mark 60 This mark scheme is published as an aid to teachers and candidates, to indicate the requirements of the examination. It shows the basis on which Examiners were instructed to award marks. It does not indicate the details of the discussions that took place at an Examiners’ meeting before marking began, which would have considered the acceptability of alternative answers. Mark schemes must be read in conjunction with the question papers and the report on the examination. • CIE will not enter into discussions or correspondence in connection with these mark schemes. CIE is publishing the mark schemes for the October/November 2010 question papers for most IGCSE, GCE Advanced Level and Advanced Subsidiary Level syllabuses and some Ordinary Level syllabuses. www.theallpapers.com
Mark scheme, page 2
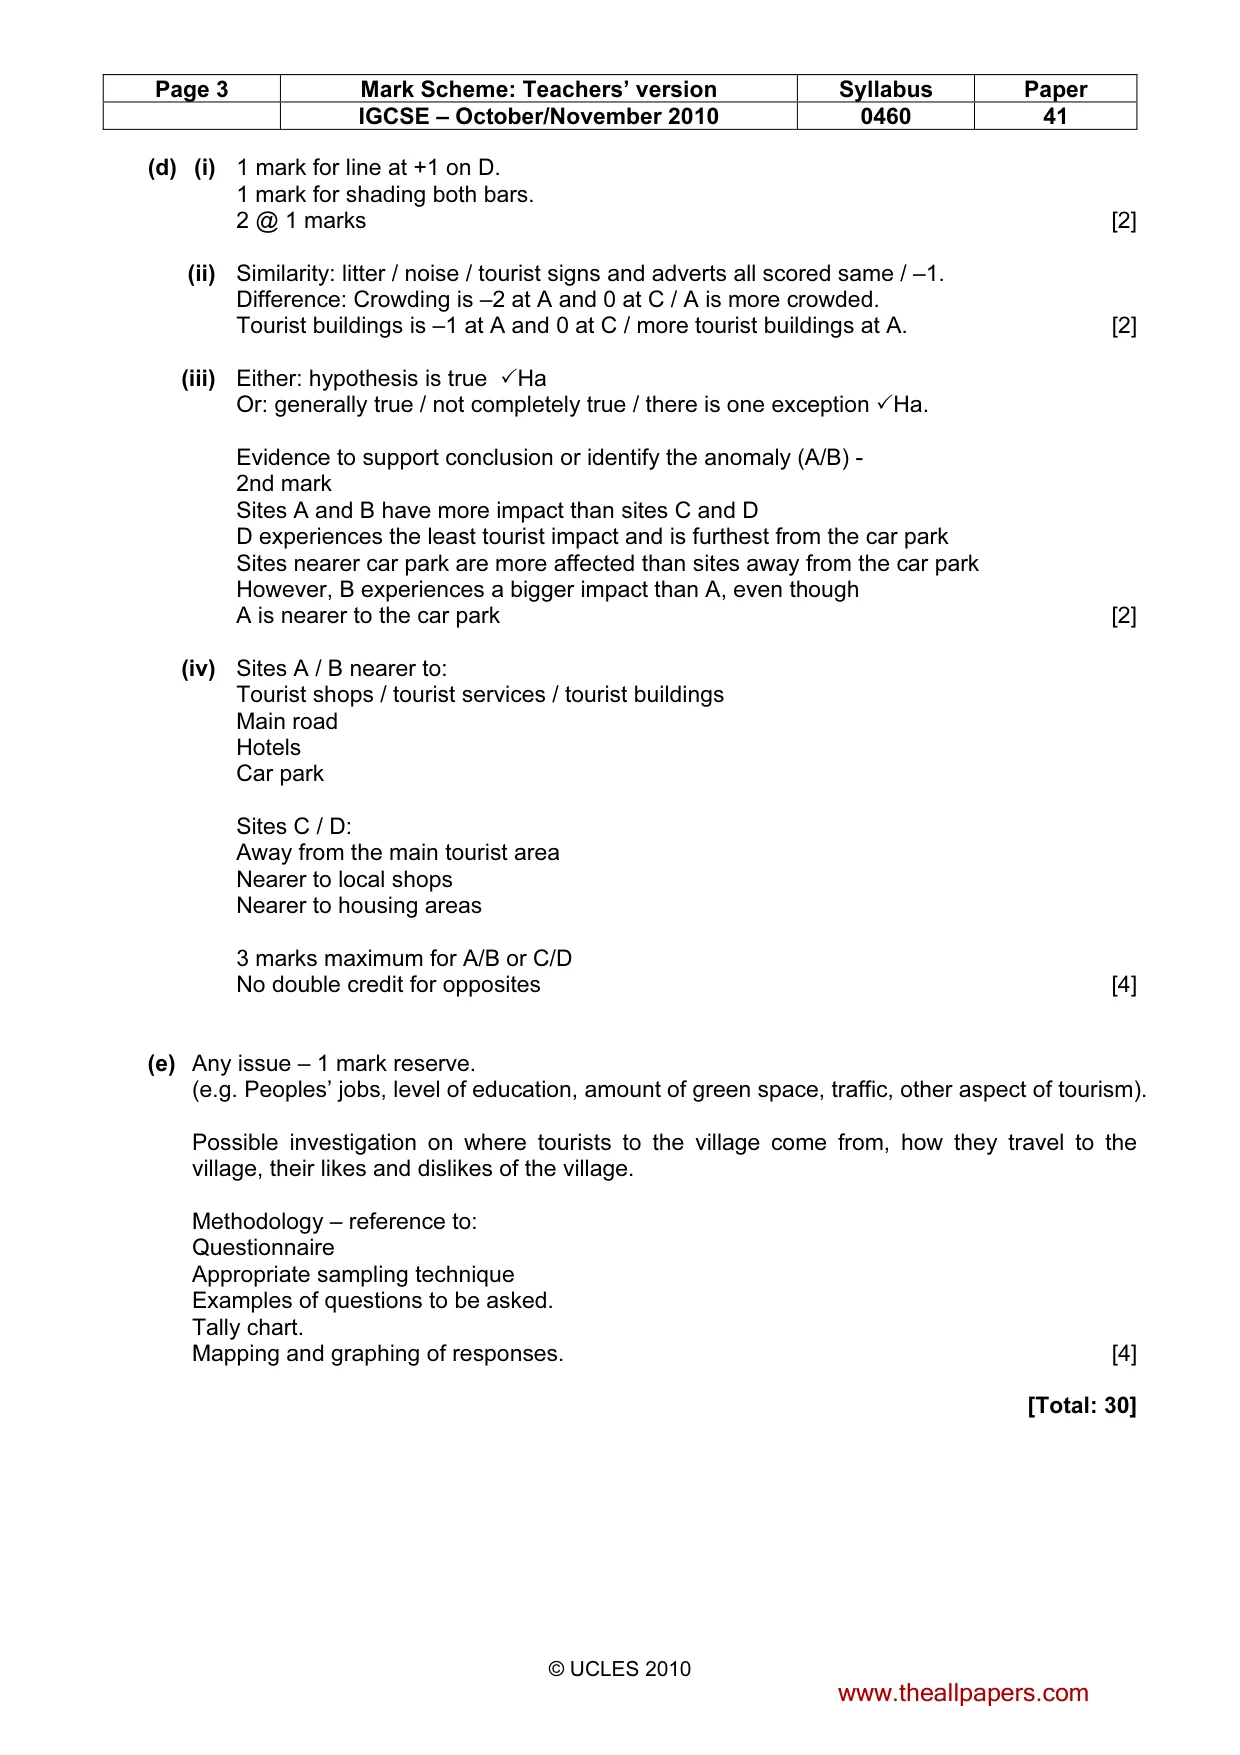
Page 2 Mark Scheme: Teachers’ version Syllabus Paper IGCSE – October/November 2010 0460 41 © UCLES 2010 1 (a) (i) 3 [1] (ii) 4 (accept tally or total) [1] (iii) 20 [1] (b) (i) Such shops are used by local residents and tourists. Result would depend on when students did the survey. How would the students distinguish between local residents and tourists. [2] (ii) Survey / ask shop owners. What is the balance between residents and tourists / is the shop used by residents or tourists. Survey / ask the customers where they come from / are they tourists. [2] (iii) 1 mark for plotting line accurately. 1 mark for shading (order doesn’t matter). [2] (iv) Yes, agree with hypothesis ✓Ha More than half the shops / 55% / 22 shops / higher percentage / most are used mainly by tourists. Only 22% / 9 shops are used mainly by local residents. These 9 shops would also be used by tourists. Lots of / most numerous shops are gift shops which are tourist shops. 9 shops are used by both tourists and residents. [2] (c) (i) Trial / practise / before real survey. Important to see if the scoring system works / if it needs to be modified / study methodology. [2] (ii) How many survey points to choose. Too few points and the survey is without substance. Too many points and the survey is time consuming. Which characteristics / criteria will be measured in the survey / what do they want to investigate. Where to locate the survey sites / which sites to investigate. Survey sites must be at different distances from the car park. How will they score the survey (what level will each number represent). Generic decision – how many students will go to each site / time of survey / who goes to each site – 1 mark maximum. 3 @ 1 mark [3] www.theallpapers.com
Mark scheme, page 3
Page 3 Mark Scheme: Teachers’ version Syllabus Paper IGCSE – October/November 2010 0460 41 © UCLES 2010 (d) (i) 1 mark for line at +1 on D. 1 mark for shading both bars. 2 @ 1 marks [2] (ii) Similarity: litter / noise / tourist signs and adverts all scored same / –1. Difference: Crowding is –2 at A and 0 at C / A is more crowded. Tourist buildings is –1 at A and 0 at C / more tourist buildings at A. [2] (iii) Either: hypothesis is true ✓Ha Or: generally true / not completely true / there is one exception ✓Ha. Evidence to support conclusion or identify the anomaly (A/B) - 2nd mark Sites A and B have more impact than sites C and D D experiences the least tourist impact and is furthest from the car park Sites nearer car park are more affected than sites away from the car park However, B experiences a bigger impact than A, even though A is nearer to the car park [2] (iv) Sites A / B nearer to: Tourist shops / tourist services / tourist buildings Main road Hotels Car park Sites C / D: Away from the main tourist area Nearer to local shops Nearer to housing areas 3 marks maximum for A/B or C/D No double credit for opposites [4] (e) Any issue – 1 mark reserve. (e.g. Peoples’ jobs, level of education, amount of green space, traffic, other aspect of tourism). Possible investigation on where tourists to the village come from, how they travel to the village, their likes and dislikes of the village. Methodology – reference to: Questionnaire Appropriate sampling technique Examples of questions to be asked. Tally chart. Mapping and graphing of responses. [4] [Total: 30] www.theallpapers.com
Mark scheme, page 4
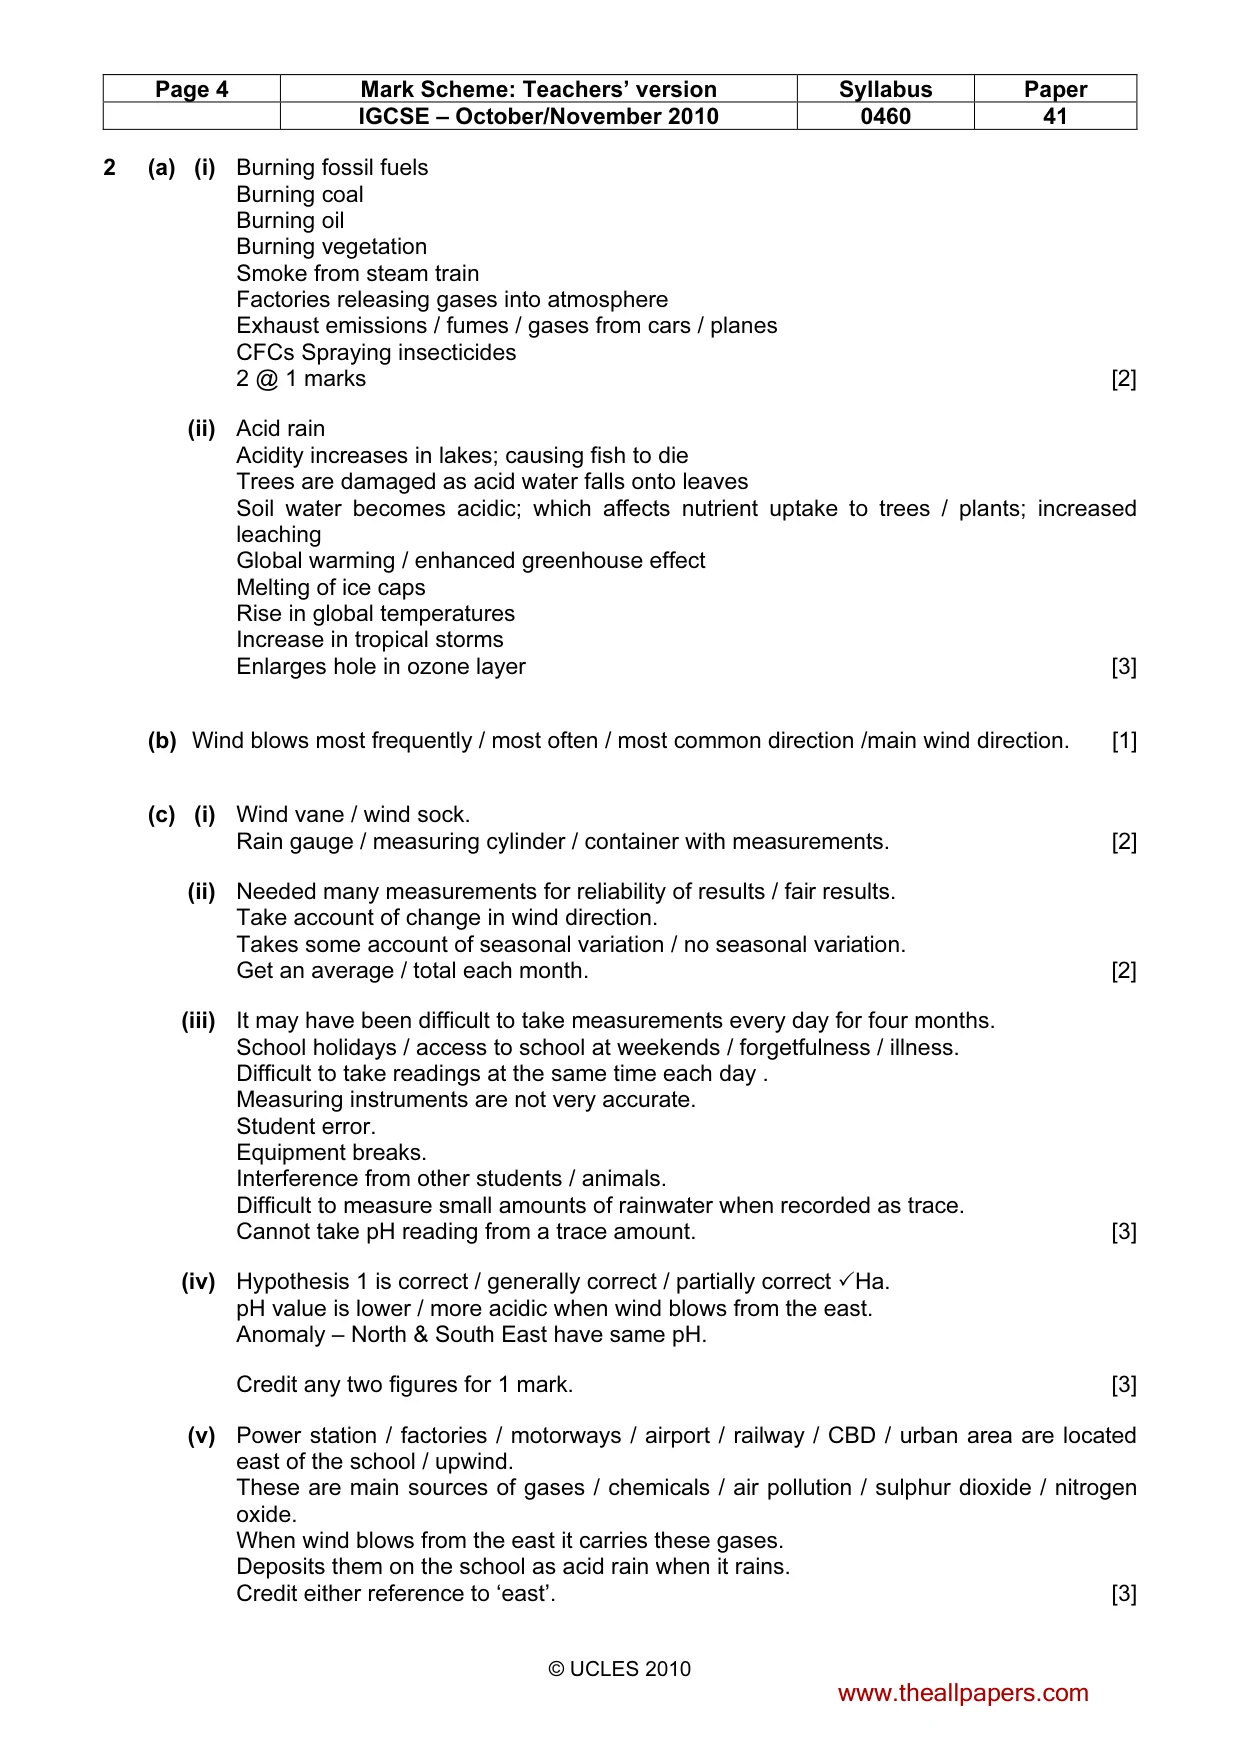
Page 4 Mark Scheme: Teachers’ version Syllabus Paper IGCSE – October/November 2010 0460 41 © UCLES 2010 2 (a) (i) Burning fossil fuels Burning coal Burning oil Burning vegetation Smoke from steam train Factories releasing gases into atmosphere Exhaust emissions / fumes / gases from cars / planes CFCs Spraying insecticides 2 @ 1 marks [2] (ii) Acid rain Acidity increases in lakes; causing fish to die Trees are damaged as acid water falls onto leaves Soil water becomes acidic; which affects nutrient uptake to trees / plants; increased leaching Global warming / enhanced greenhouse effect Melting of ice caps Rise in global temperatures Increase in tropical storms Enlarges hole in ozone layer [3] (b) Wind blows most frequently / most often / most common direction /main wind direction. [1] (c) (i) Wind vane / wind sock. Rain gauge / measuring cylinder / container with measurements. [2] (ii) Needed many measurements for reliability of results / fair results. Take account of change in wind direction. Takes some account of seasonal variation / no seasonal variation. Get an average / total each month. [2] (iii) It may have been difficult to take measurements every day for four months. School holidays / access to school at weekends / forgetfulness / illness. Difficult to take readings at the same time each day . Measuring instruments are not very accurate. Student error. Equipment breaks. Interference from other students / animals. Difficult to measure small amounts of rainwater when recorded as trace. Cannot take pH reading from a trace amount. [3] (iv) Hypothesis 1 is correct / generally correct / partially correct ✓Ha. pH value is lower / more acidic when wind blows from the east. Anomaly – North & South East have same pH. Credit any two figures for 1 mark. [3] (v) Power station / factories / motorways / airport / railway / CBD / urban area are located east of the school / upwind. These are main sources of gases / chemicals / air pollution / sulphur dioxide / nitrogen oxide. When wind blows from the east it carries these gases. Deposits them on the school as acid rain when it rains. Credit either reference to ‘east’. [3] www.theallpapers.com
Mark scheme, page 5
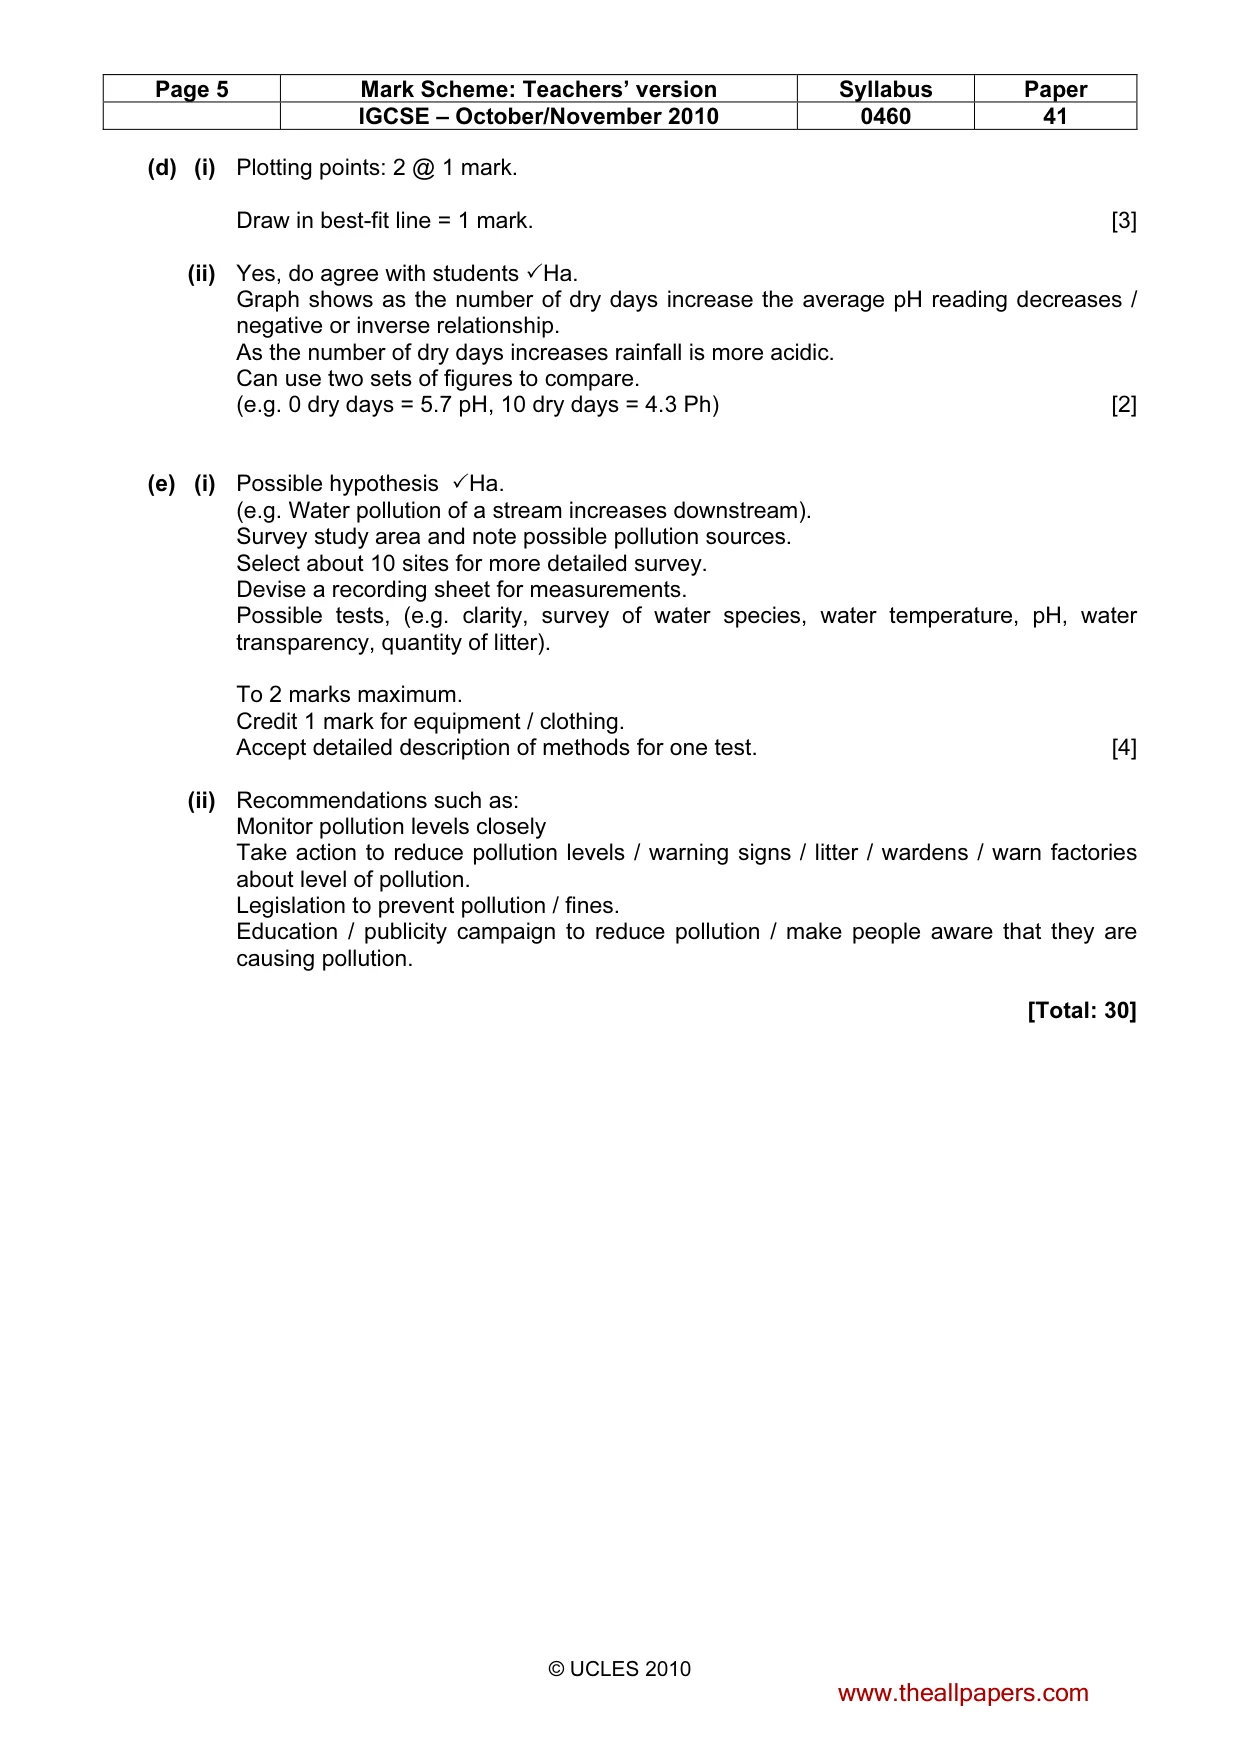
Page 5 Mark Scheme: Teachers’ version Syllabus Paper IGCSE – October/November 2010 0460 41 © UCLES 2010 (d) (i) Plotting points: 2 @ 1 mark. Draw in best-fit line = 1 mark. [3] (ii) Yes, do agree with students ✓Ha. Graph shows as the number of dry days increase the average pH reading decreases / negative or inverse relationship. As the number of dry days increases rainfall is more acidic. Can use two sets of figures to compare. (e.g. 0 dry days = 5.7 pH, 10 dry days = 4.3 Ph) [2] (e) (i) Possible hypothesis ✓Ha. (e.g. Water pollution of a stream increases downstream). Survey study area and note possible pollution sources. Select about 10 sites for more detailed survey. Devise a recording sheet for measurements. Possible tests, (e.g. clarity, survey of water species, water temperature, pH, water transparency, quantity of litter). To 2 marks maximum. Credit 1 mark for equipment / clothing. Accept detailed description of methods for one test. [4] (ii) Recommendations such as: Monitor pollution levels closely Take action to reduce pollution levels / warning signs / litter / wardens / warn factories about level of pollution. Legislation to prevent pollution / fines. Education / publicity campaign to reduce pollution / make people aware that they are causing pollution. [Total: 30] www.theallpapers.com
What you needed in this session
Cambridge’s own grade thresholds for 2010 Oct/Nov, Paper 4 · Variant 1. A higher threshold means an easier paper — the bar moves with how the cohort did.