Cambridge IGCSE Geography 0460 — 2010 Oct/Nov Paper 4 · Variant 2
0460/42/O/N/10 · 60 marks · ≈68 min
The question paper and its mark scheme, free to read here and free to download. This is Cambridge’s own paper, exactly as it was sat.
Question paper16 pages







Mark scheme5 pages
Answers below. Sit the paper first if you are practising.
Paper as text
Question paper, page 1
This document consists of 14 printed pages, 2 blank pages, and 1 Insert. DC (LEO/SW) 23697/6 © UCLES 2010 [Turn over UNIVERSITY OF CAMBRIDGE INTERNATIONAL EXAMINATIONS International General Certificate of Secondary Education READ THESE INSTRUCTIONS FIRST Write your Centre number, candidate number and name on all the work you hand in. Write in dark blue or black pen. You may use a soft pencil for any diagrams, graphs or rough working. Do not use staples, paper clips, highlighters, glue or correction fluid. DO NOT WRITE ON ANY BARCODES. Answer all questions. The Insert contains Figs 1 and 2 for Question 1, Figs 5 and 6 and Photographs A, B, C, D and E for Question 2. The Insert is not required by the Examiner. Sketch maps and diagrams should be drawn whenever they serve to illustrate an answer. At the end of the examination, fasten all your work securely together. The number of marks is given in brackets [ ] at the end of each question or part question. GEOGRAPHY 0460/42 Paper 4 Alternative to Coursework October/November 2010 1 hour 30 minutes Candidates answer on the Question Paper. Additional Materials: Ruler For Examiner’s Use Q1 Q2 Total * 2 3 2 6 9 0 8 0 1 8 * www.theallpapers.com
Question paper, page 2
2 0460/42/O/N/10 © UCLES 2010 BLANK PAGE www.theallpapers.com
Question paper, page 3
3 0460/42/O/N/10 © UCLES 2010 [Turn over For Examiner’s Use 1 Some students were studying how the characteristics of a river change downstream. They decided to focus their fieldwork investigation on a local river to see if it had some characteristics of a text book example. These characteristics are shown in Fig. 1 (Insert). The students agreed to investigate two hypotheses: Hypothesis 1: The width, depth and cross-sectional area of the river increase downstream. Hypothesis 2: Velocity is greater where the river is deeper. (a) (i) The students wanted to take measurements at six study sites along the river. Suggest why it was important that they took all their measurements on one day. … …[1] (ii) Suggest two other things they had to consider in choosing their investigation sites. 1 … … 2 … …[2] (iii) In preparation they visited a local stream to do a pilot study. Give two advantages of doing a pilot study. 1 … … 2 … …[2] www.theallpapers.com
Question paper, page 4
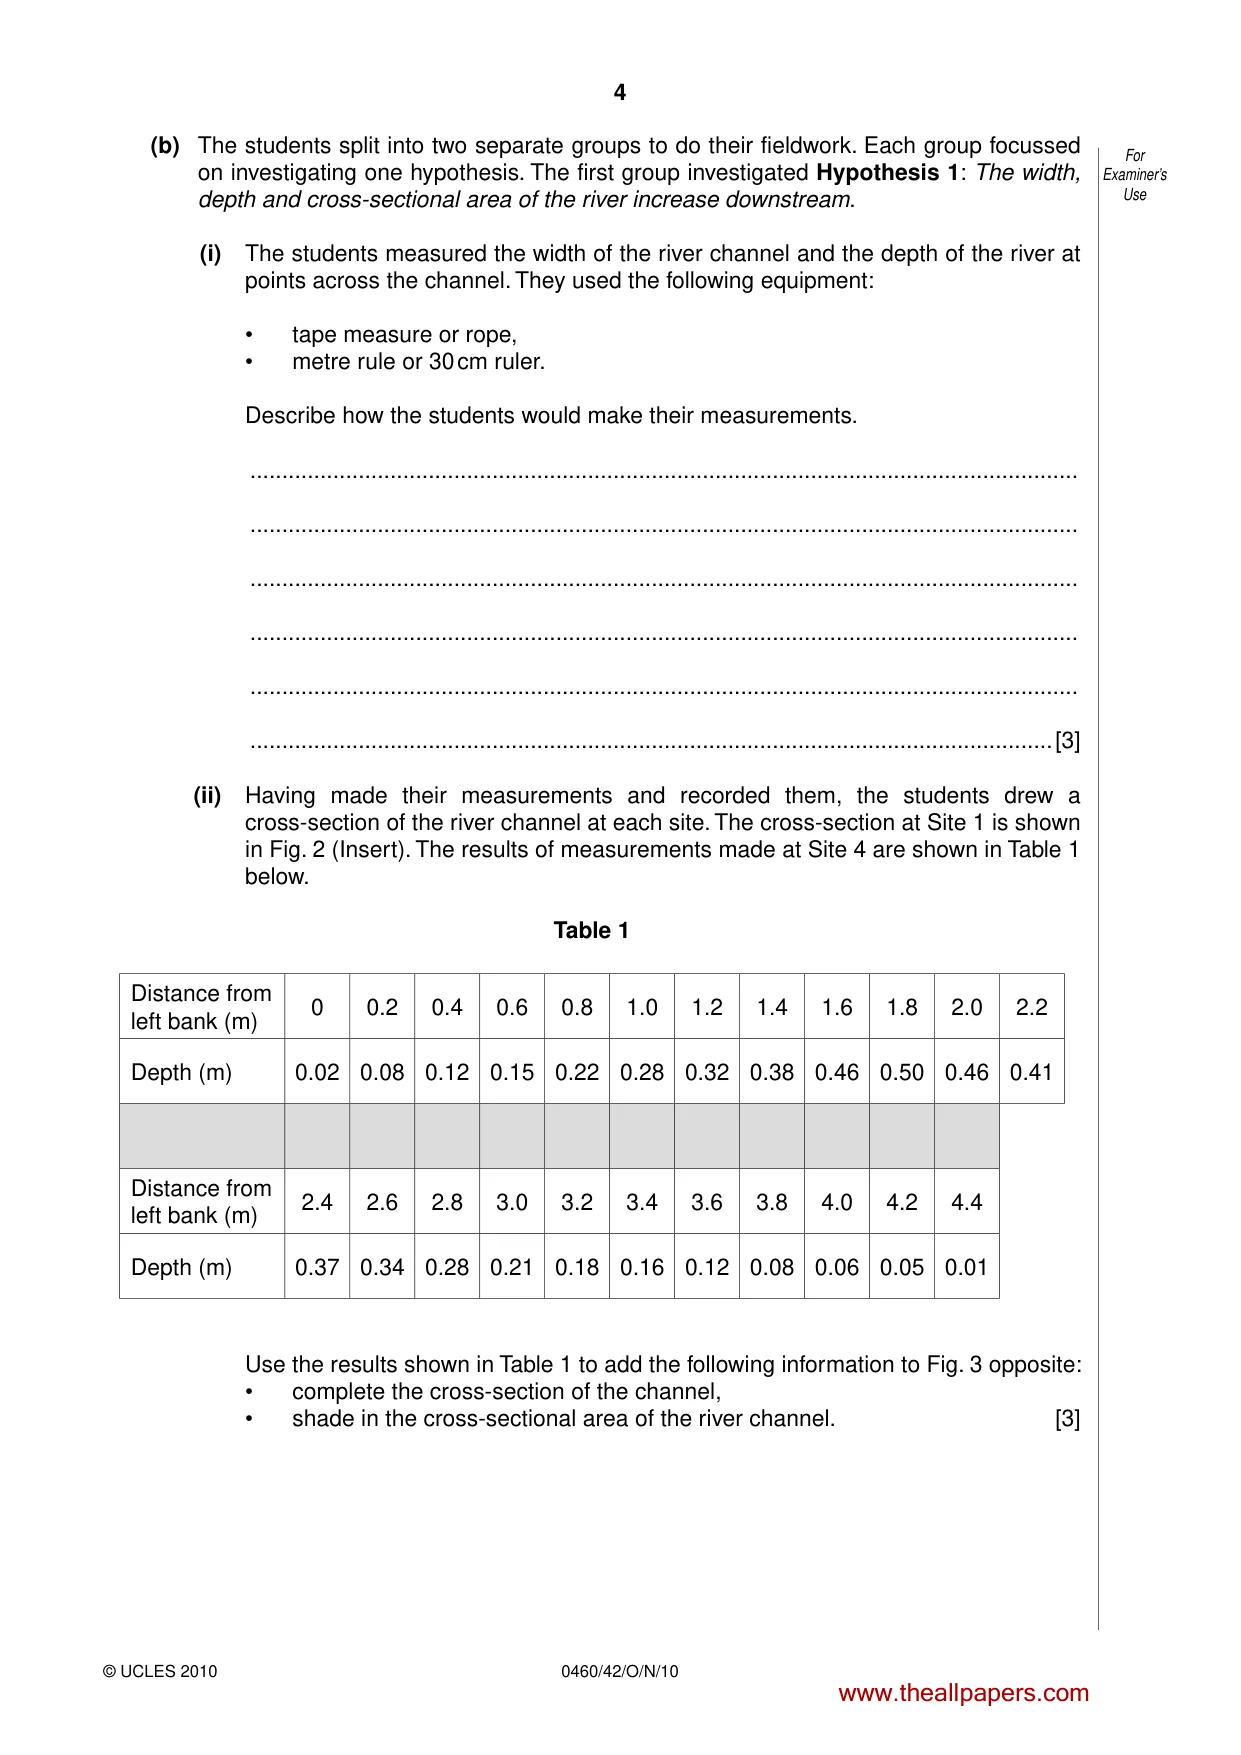
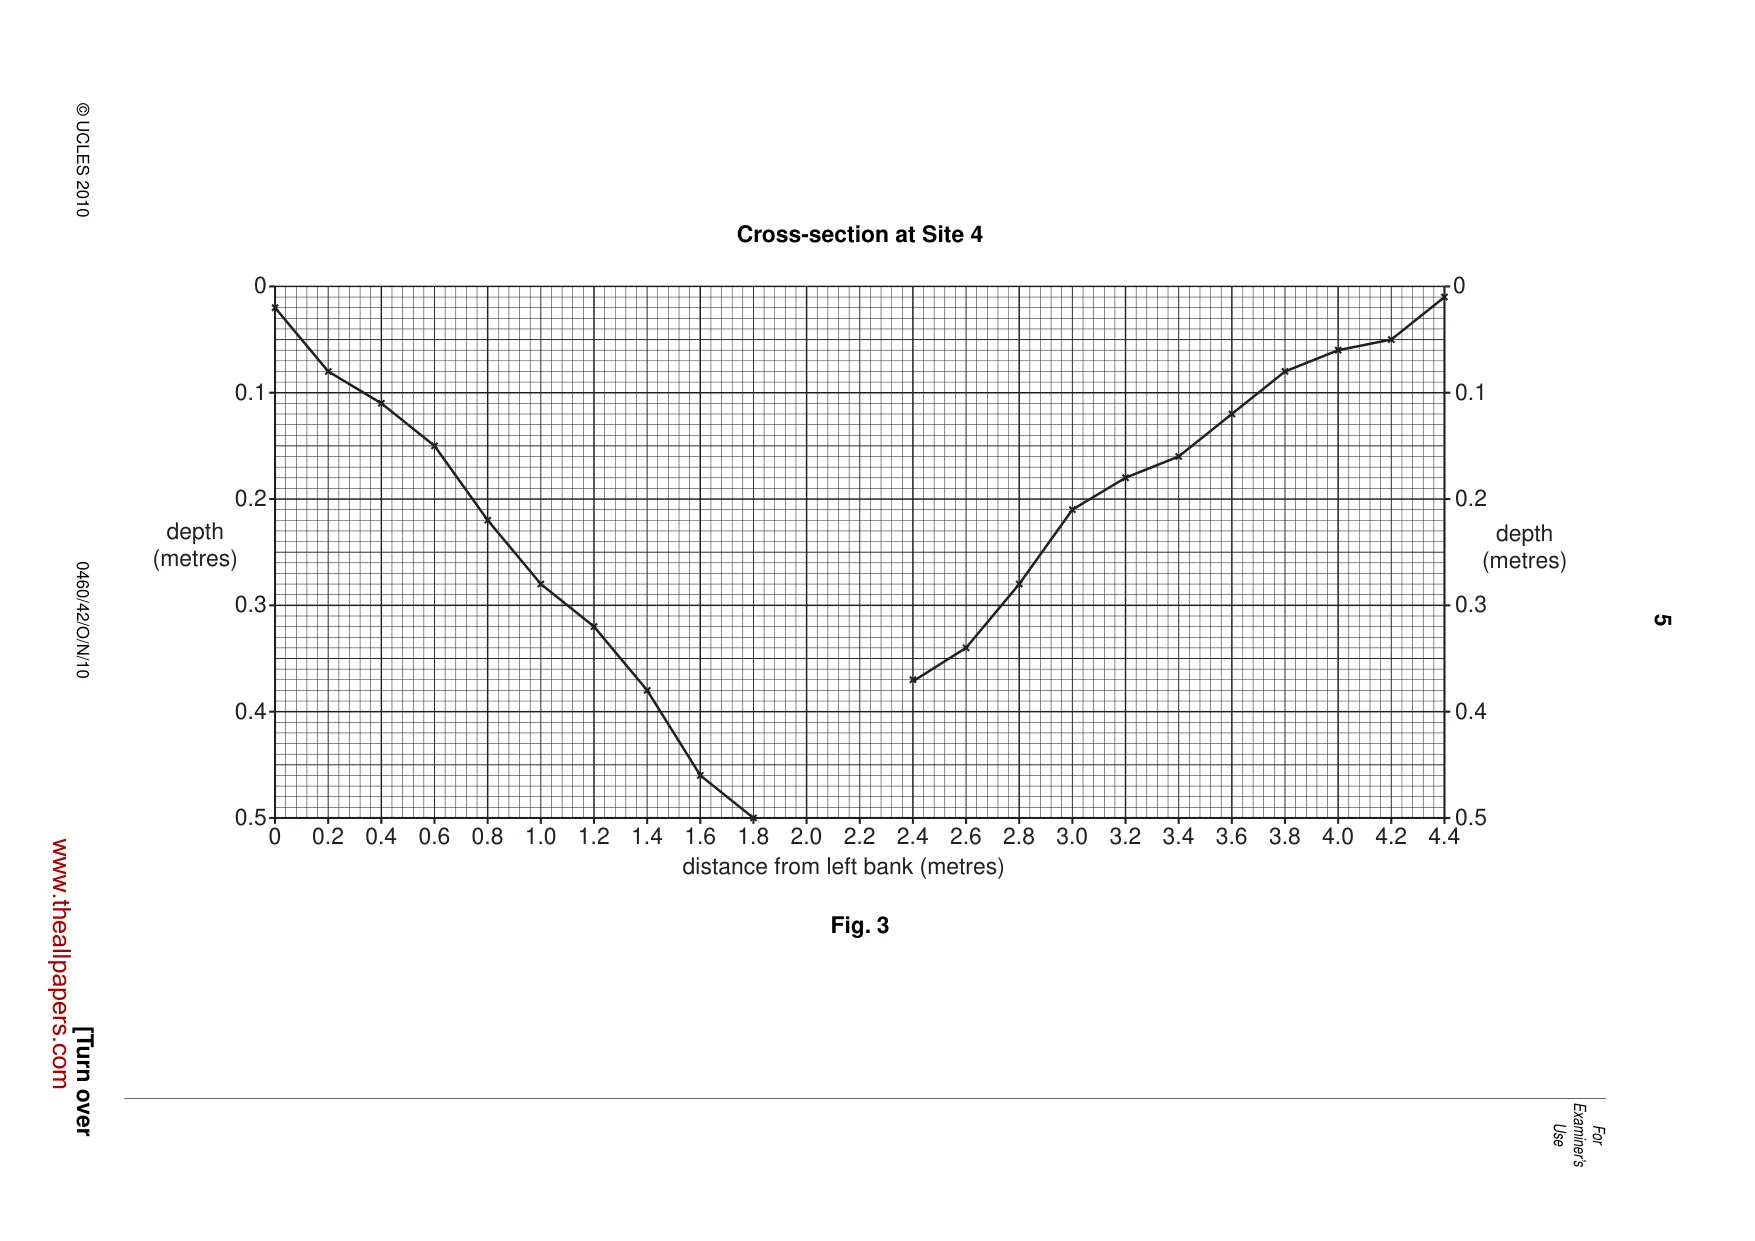
4 0460/42/O/N/10 © UCLES 2010 For Examiner’s Use (b) The students split into two separate groups to do their fieldwork. Each group focussed on investigating one hypothesis. The first group investigated Hypothesis 1: The width, depth and cross-sectional area of the river increase downstream. (i) The students measured the width of the river channel and the depth of the river at points across the channel. They used the following equipment: • tape measure or rope, • metre rule or 30 cm ruler. Describe how the students would make their measurements. … … … … … …[3] (ii) Having made their measurements and recorded them, the students drew a cross-section of the river channel at each site. The cross-section at Site 1 is shown in Fig. 2 (Insert). The results of measurements made at Site 4 are shown in Table 1 below. Table 1 Distance from left bank (m) 0 0.2 0.4 0.6 0.8 1.0 1.2 1.4 1.6 1.8 2.0 2.2 Depth (m) 0.02 0.08 0.12 0.15 0.22 0.28 0.32 0.38 0.46 0.50 0.46 0.41 Distance from left bank (m) 2.4 2.6 2.8 3.0 3.2 3.4 3.6 3.8 4.0 4.2 4.4 Depth (m) 0.37 0.34 0.28 0.21 0.18 0.16 0.12 0.08 0.06 0.05 0.01 Use the results shown in Table 1 to add the following information to Fig. 3 opposite: • complete the cross-section of the channel, • shade in the cross-sectional area of the river channel. [3] www.theallpapers.com
Question paper, page 5
5 0460/42/O/N/10 © UCLES 2010 [Turn over For Examiner’s Use Cross-section at Site 4 0 0.5 0.4 0.3 0.2 0.1 0 0.5 0.4 0.3 0.2 0.1 0 depth (metres) depth (metres) distance from left bank (metres) 0.2 0.4 0.6 0.8 1.0 1.2 1.4 1.6 1.8 2.0 2.2 2.4 2.6 2.8 3.0 3.2 3.4 3.6 3.8 4.0 4.2 4.4 Fig. 3 www.theallpapers.com
Question paper, page 6
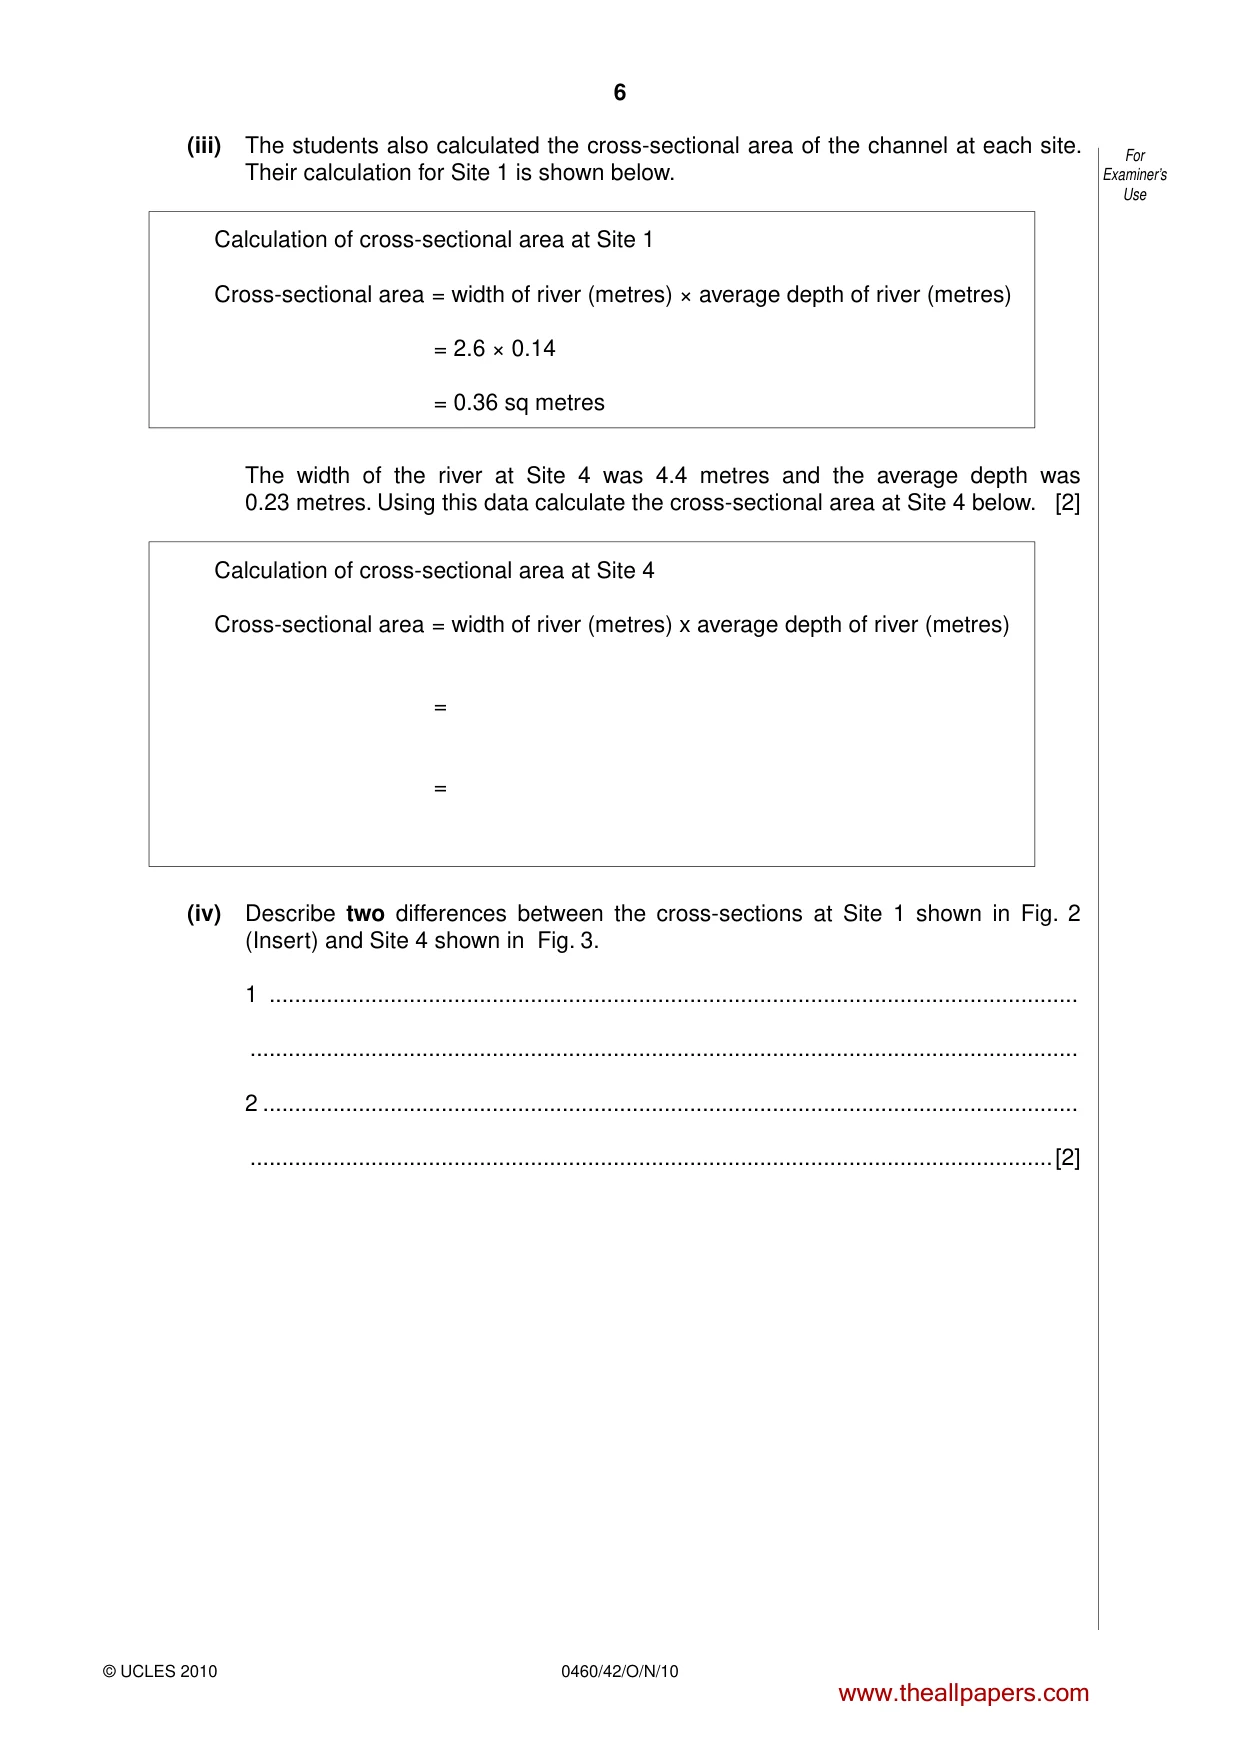
6 0460/42/O/N/10 © UCLES 2010 For Examiner’s Use (iii) The students also calculated the cross-sectional area of the channel at each site. Their calculation for Site 1 is shown below. Calculation of cross-sectional area at Site 1 Cross-sectional area = width of river (metres) × average depth of river (metres) = 2.6 × 0.14 = 0.36 sq metres The width of the river at Site 4 was 4.4 metres and the average depth was 0.23 metres. Using this data calculate the cross-sectional area at Site 4 below. [2] Calculation of cross-sectional area at Site 4 Cross-sectional area = width of river (metres) x average depth of river (metres) = = (iv) Describe two differences between the cross-sections at Site 1 shown in Fig. 2 (Insert) and Site 4 shown in Fig. 3. 1 … … 2 … …[2] www.theallpapers.com
Question paper, page 7
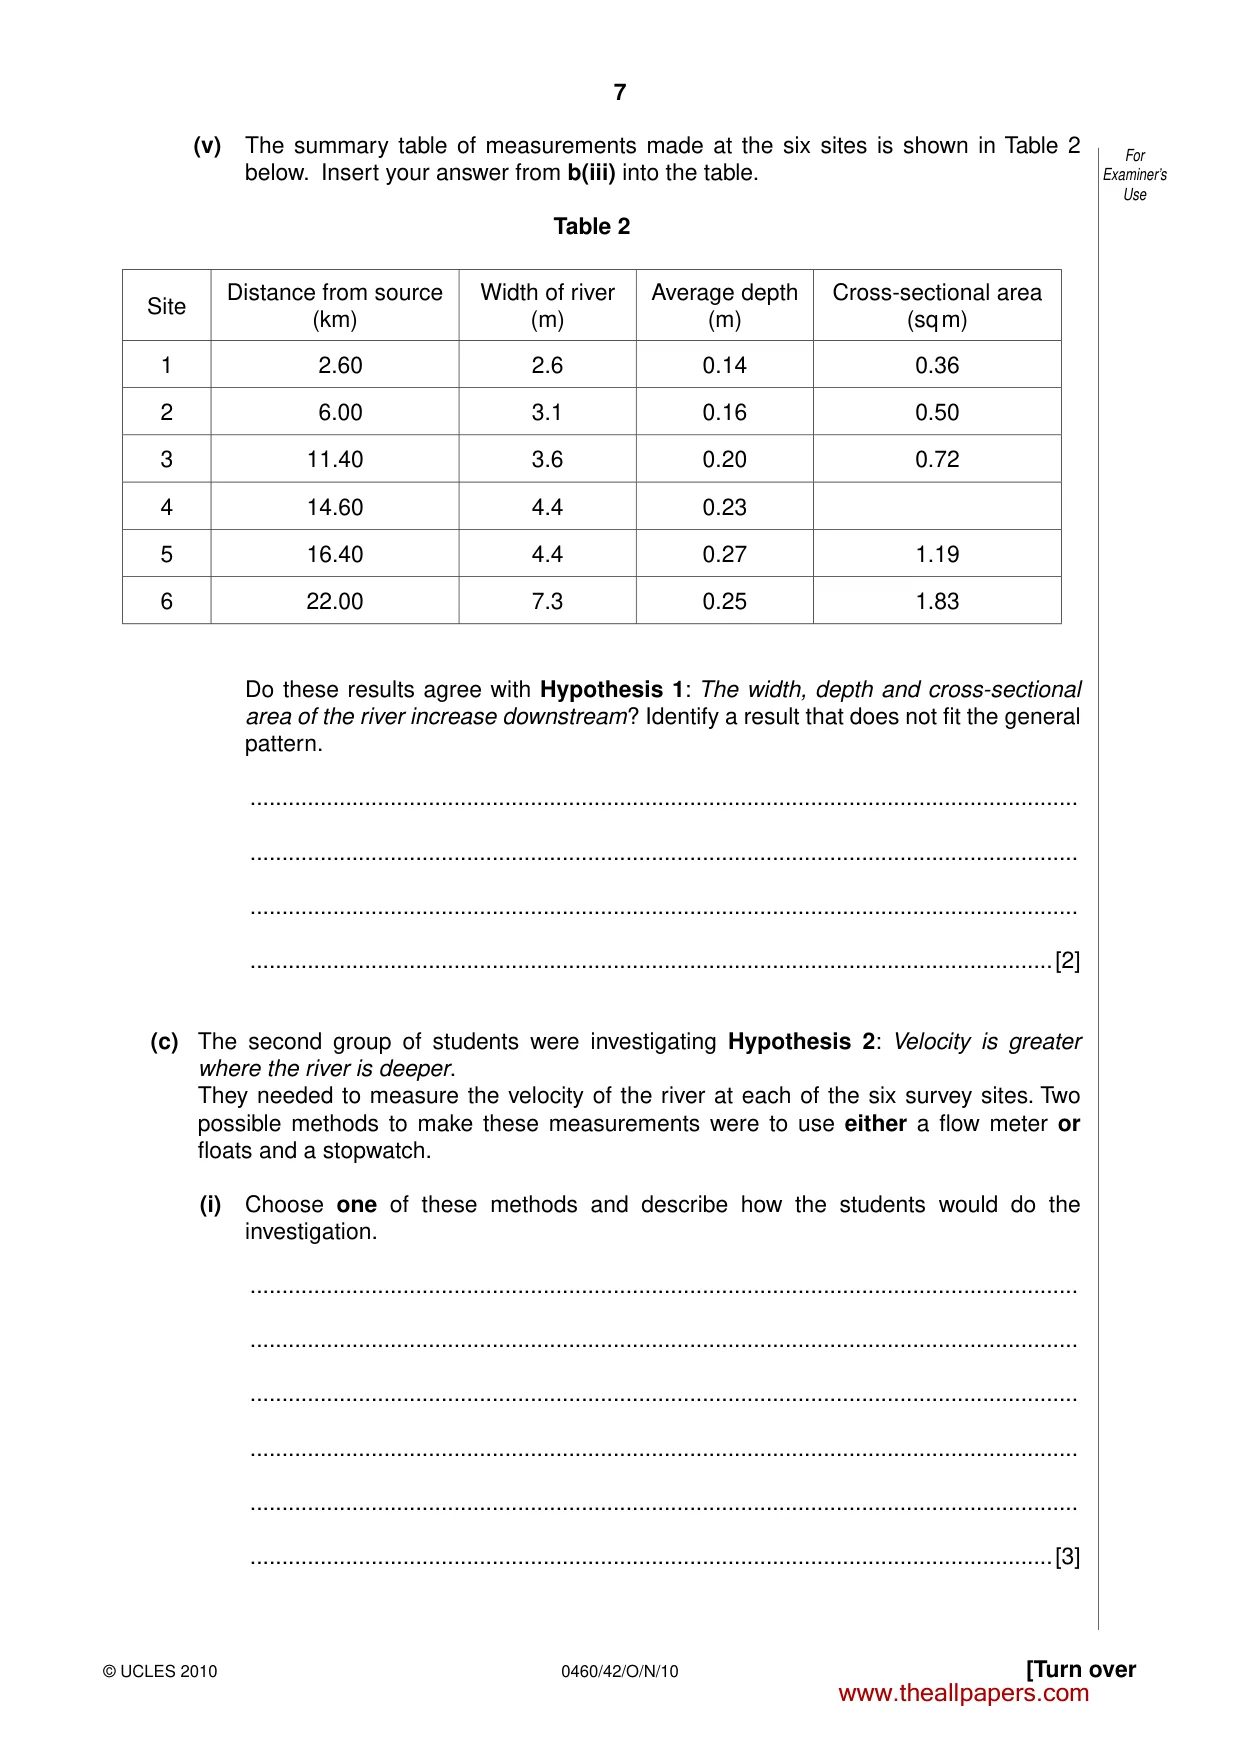
7 0460/42/O/N/10 © UCLES 2010 [Turn over For Examiner’s Use (v) The summary table of measurements made at the six sites is shown in Table 2 below. Insert your answer from b(iii) into the table. Table 2 Site Distance from source (km) Width of river (m) Average depth (m) Cross-sectional area (sq m) 1 2.60 2.6 0.14 0.36 2 6.00 3.1 0.16 0.50 3 11.40 3.6 0.20 0.72 4 14.60 4.4 0.23 5 16.40 4.4 0.27 1.19 6 22.00 7.3 0.25 1.83 Do these results agree with Hypothesis 1: The width, depth and cross-sectional area of the river increase downstream? Identify a result that does not fit the general pattern. … … … …[2] (c) The second group of students were investigating Hypothesis 2: Velocity is greater where the river is deeper. They needed to measure the velocity of the river at each of the six survey sites. Two possible methods to make these measurements were to use either a flow meter or floats and a stopwatch. (i) Choose one of these methods and describe how the students would do the investigation. … … … … … …[3] www.theallpapers.com
Question paper, page 8
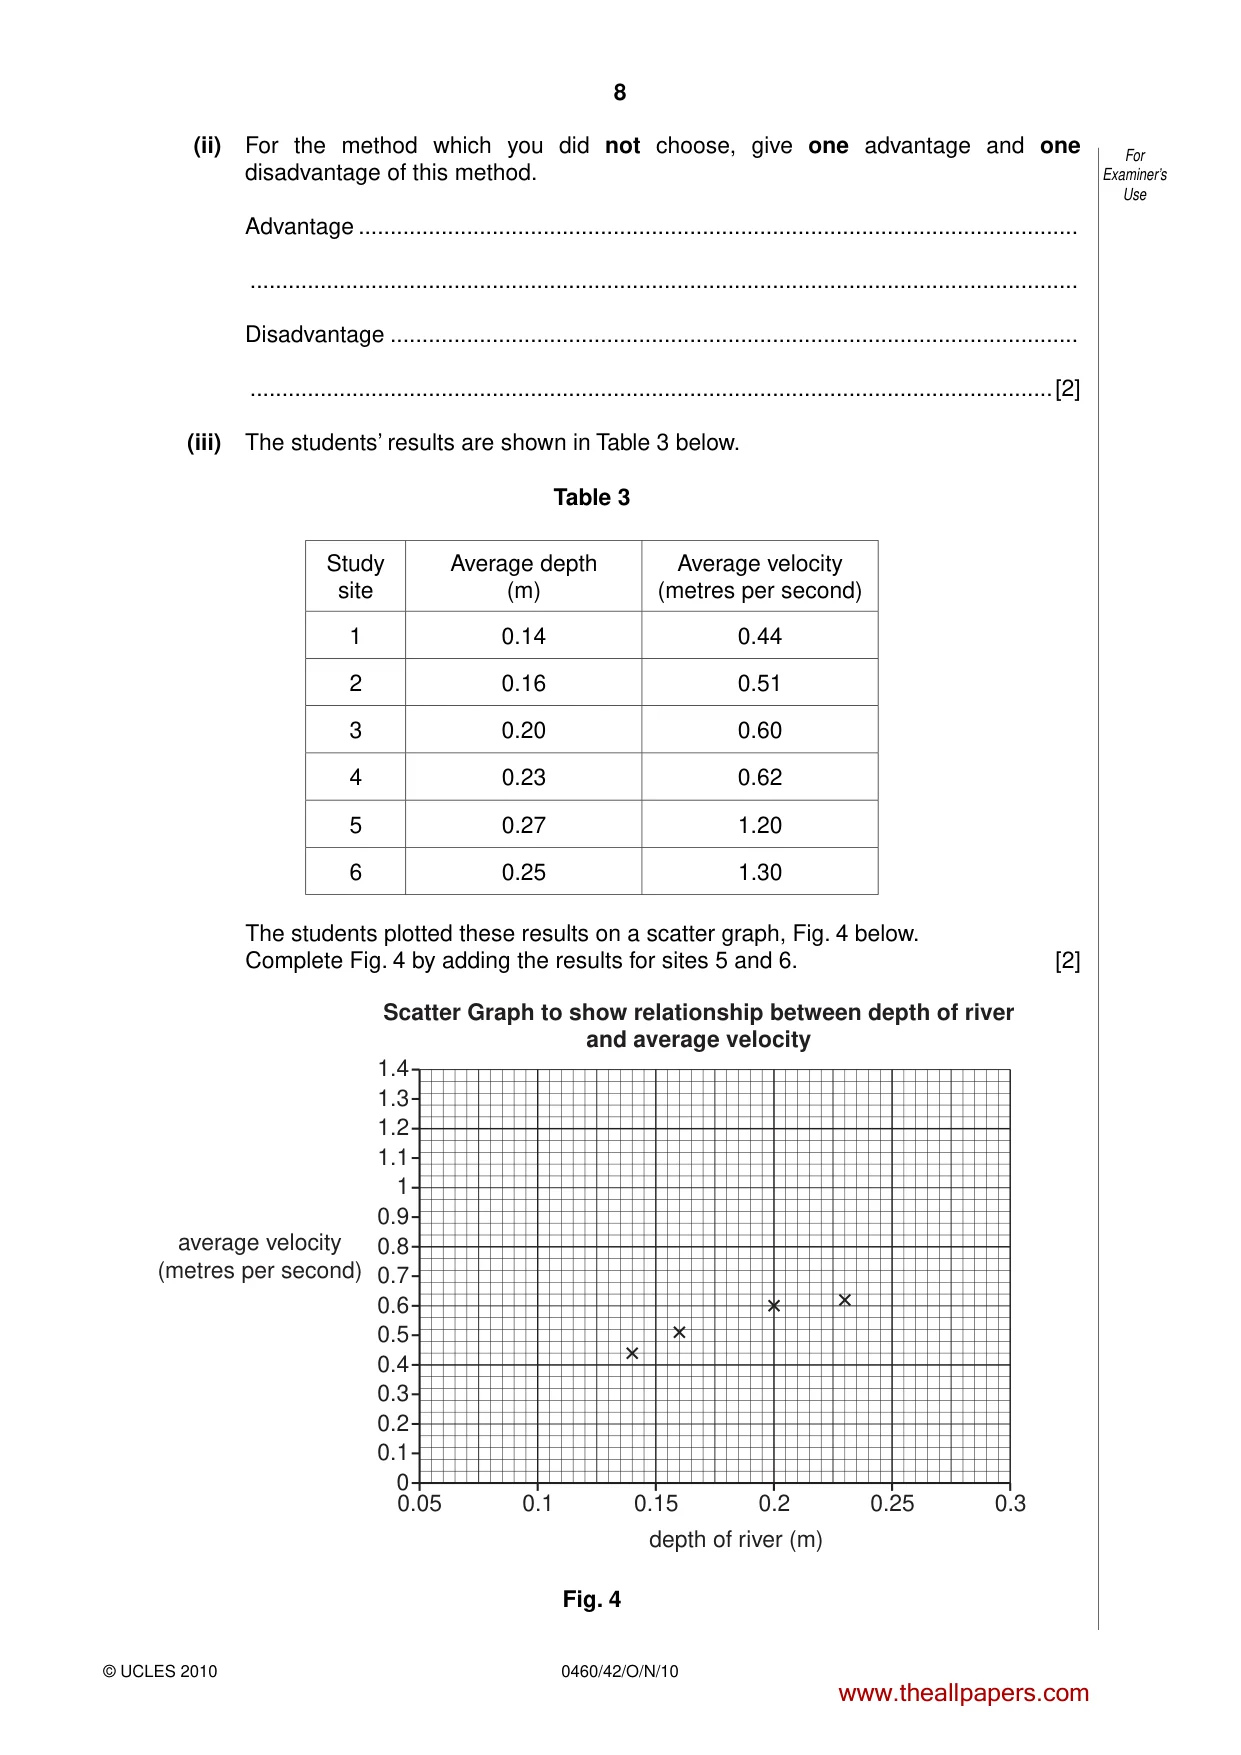
8 0460/42/O/N/10 © UCLES 2010 For Examiner’s Use (ii) For the method which you did not choose, give one advantage and one disadvantage of this method. Advantage … … Disadvantage … …[2] (iii) The students’ results are shown in Table 3 below. Table 3 Study site Average depth (m) Average velocity (metres per second) 1 0.14 0.44 2 0.16 0.51 3 0.20 0.60 4 0.23 0.62 5 0.27 1.20 6 0.25 1.30 The students plotted these results on a scatter graph, Fig. 4 below. Complete Fig. 4 by adding the results for sites 5 and 6. [2] 0 0.2 0.4 0.6 0.8 1 1.2 1.4 0.1 0.3 0.5 0.7 0.9 1.1 average velocity (metres per second) Scatter Graph to show relationship between depth of river and average velocity depth of river (m) 1.3 0.05 0.1 0.15 0.2 0.3 0.25 Fig. 4 www.theallpapers.com
Question paper, page 9
9 0460/42/O/N/10 © UCLES 2010 [Turn over For Examiner’s Use (iv) To what extent do you agree with Hypothesis 2: Velocity is greater where the river is deeper? Use the information in Fig. 4 to help you to answer. … … … … … …[3] (d) Whilst making their measurements, one observant student noticed how the river valley was different at the six sites. How could the student record these differences during fieldwork? … … … … … …[3] [Total: 30 marks] www.theallpapers.com
Question paper, page 10
10 0460/42/O/N/10 © UCLES 2010 For Examiner’s Use 2 A group of students decided to do an investigation about the location of high technology industries. They wanted to discover more about some location factors which they had studied in their course. These factors are shown in Fig. 5 (Insert). The students based their hypotheses on two of these factors. Hypothesis 1: Companies in high technology industries are usually located near to other similar high technology companies. Hypothesis 2: Companies in high technology industries need highly skilled or trained employees. To begin their investigation the students visited an industrial area on the edge of the city where they lived. This industrial estate is shown in Fig. 6 (Insert) and Photograph A (Insert). (a) Look at Fig. 6 and Photograph A. (i) Which landscape feature is labelled X on Photograph A? … [1] (ii) What is the number of the building labelled Y on Photograph A? … [1] (b) Look at Photographs B to E (Insert). They show different views of the industrial estate. Describe features of the landscape and buildings shown in the photographs. Landscape … … … … Buildings … … … …[4] www.theallpapers.com
Question paper, page 11
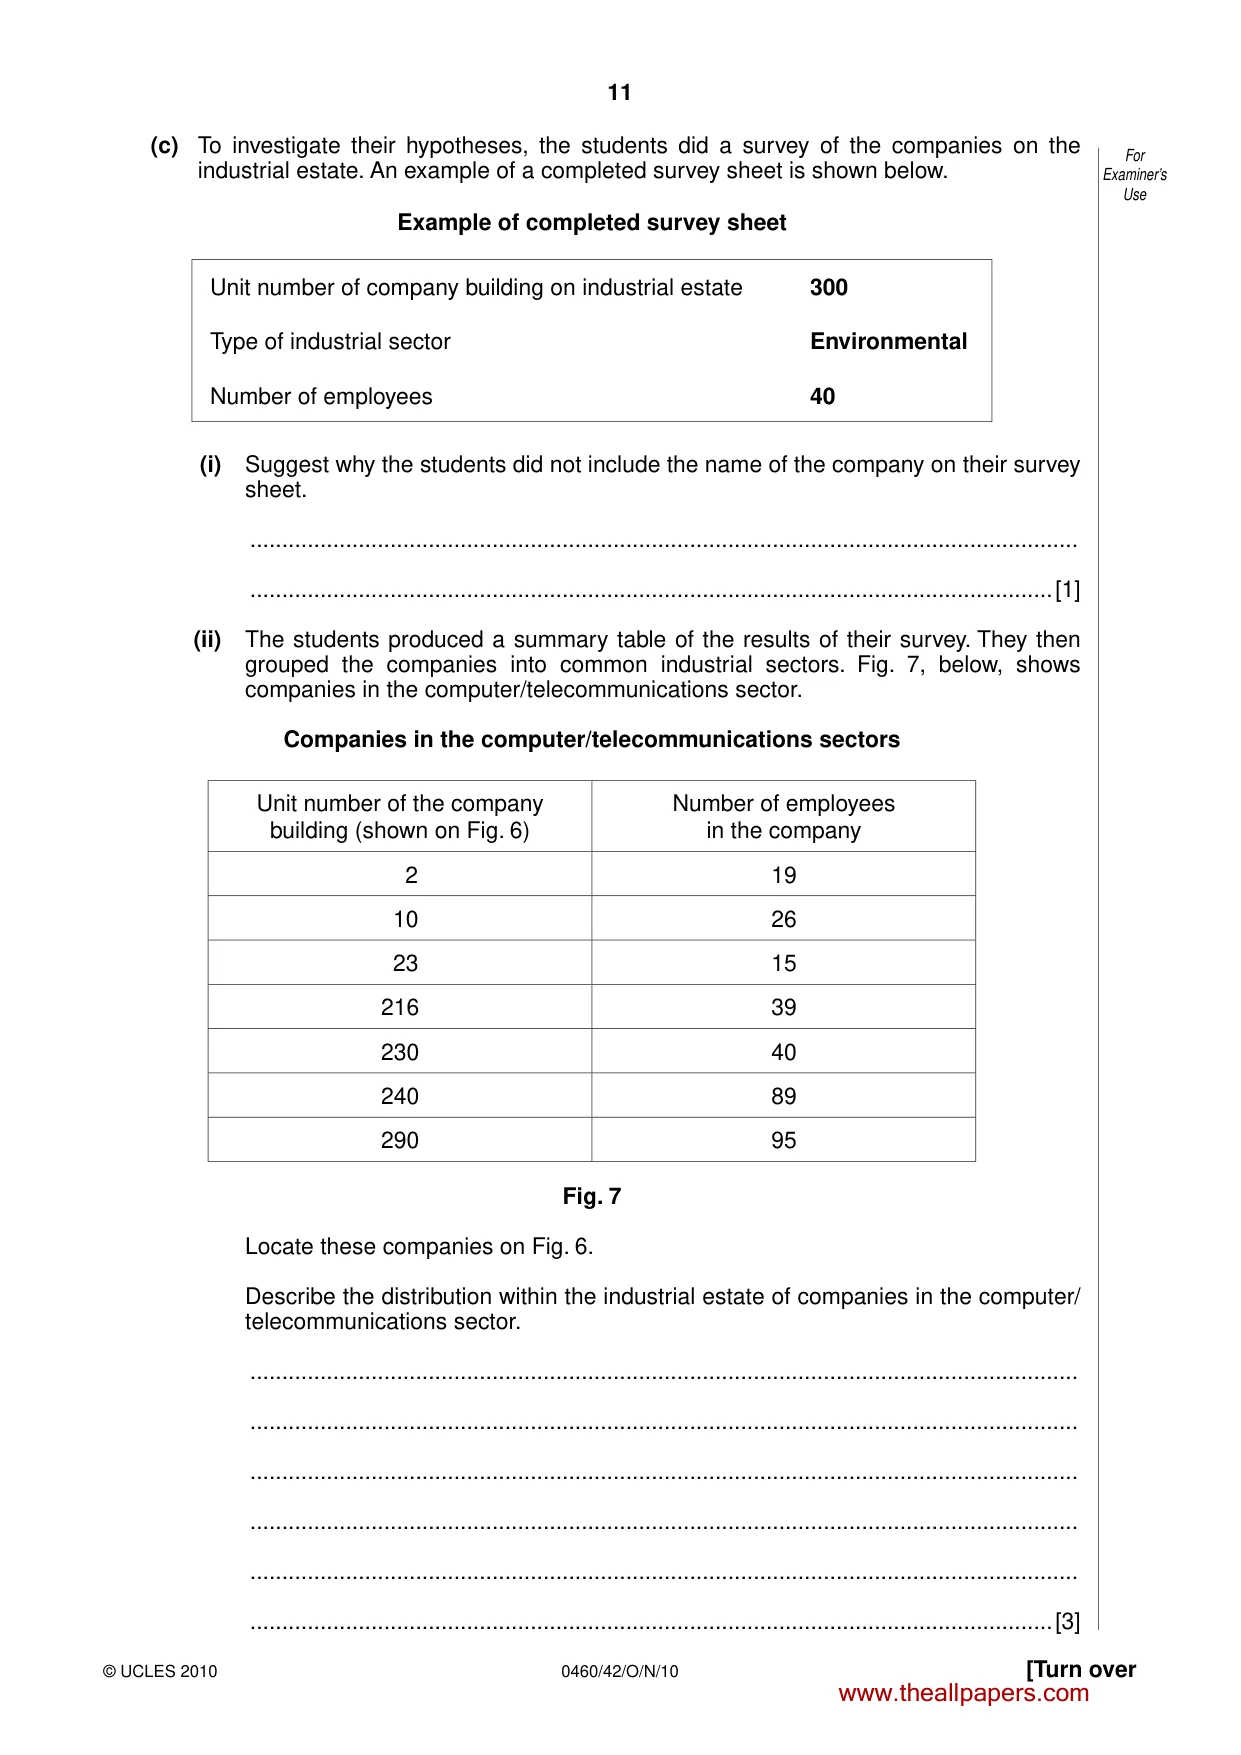
11 0460/42/O/N/10 © UCLES 2010 [Turn over For Examiner’s Use (c) To investigate their hypotheses, the students did a survey of the companies on the industrial estate. An example of a completed survey sheet is shown below. Example of completed survey sheet Unit number of company building on industrial estate 300 Type of industrial sector Environmental Number of employees 40 (i) Suggest why the students did not include the name of the company on their survey sheet. … …[1] (ii) The students produced a summary table of the results of their survey. They then grouped the companies into common industrial sectors. Fig. 7, below, shows companies in the computer/telecommunications sector. Companies in the computer/telecommunications sectors Unit number of the company building (shown on Fig. 6) Number of employees in the company 2 19 10 26 23 15 216 39 230 40 240 89 290 95 Fig. 7 Locate these companies on Fig. 6. Describe the distribution within the industrial estate of companies in the computer/ telecommunications sector. … … … … … …[3] www.theallpapers.com
Question paper, page 12
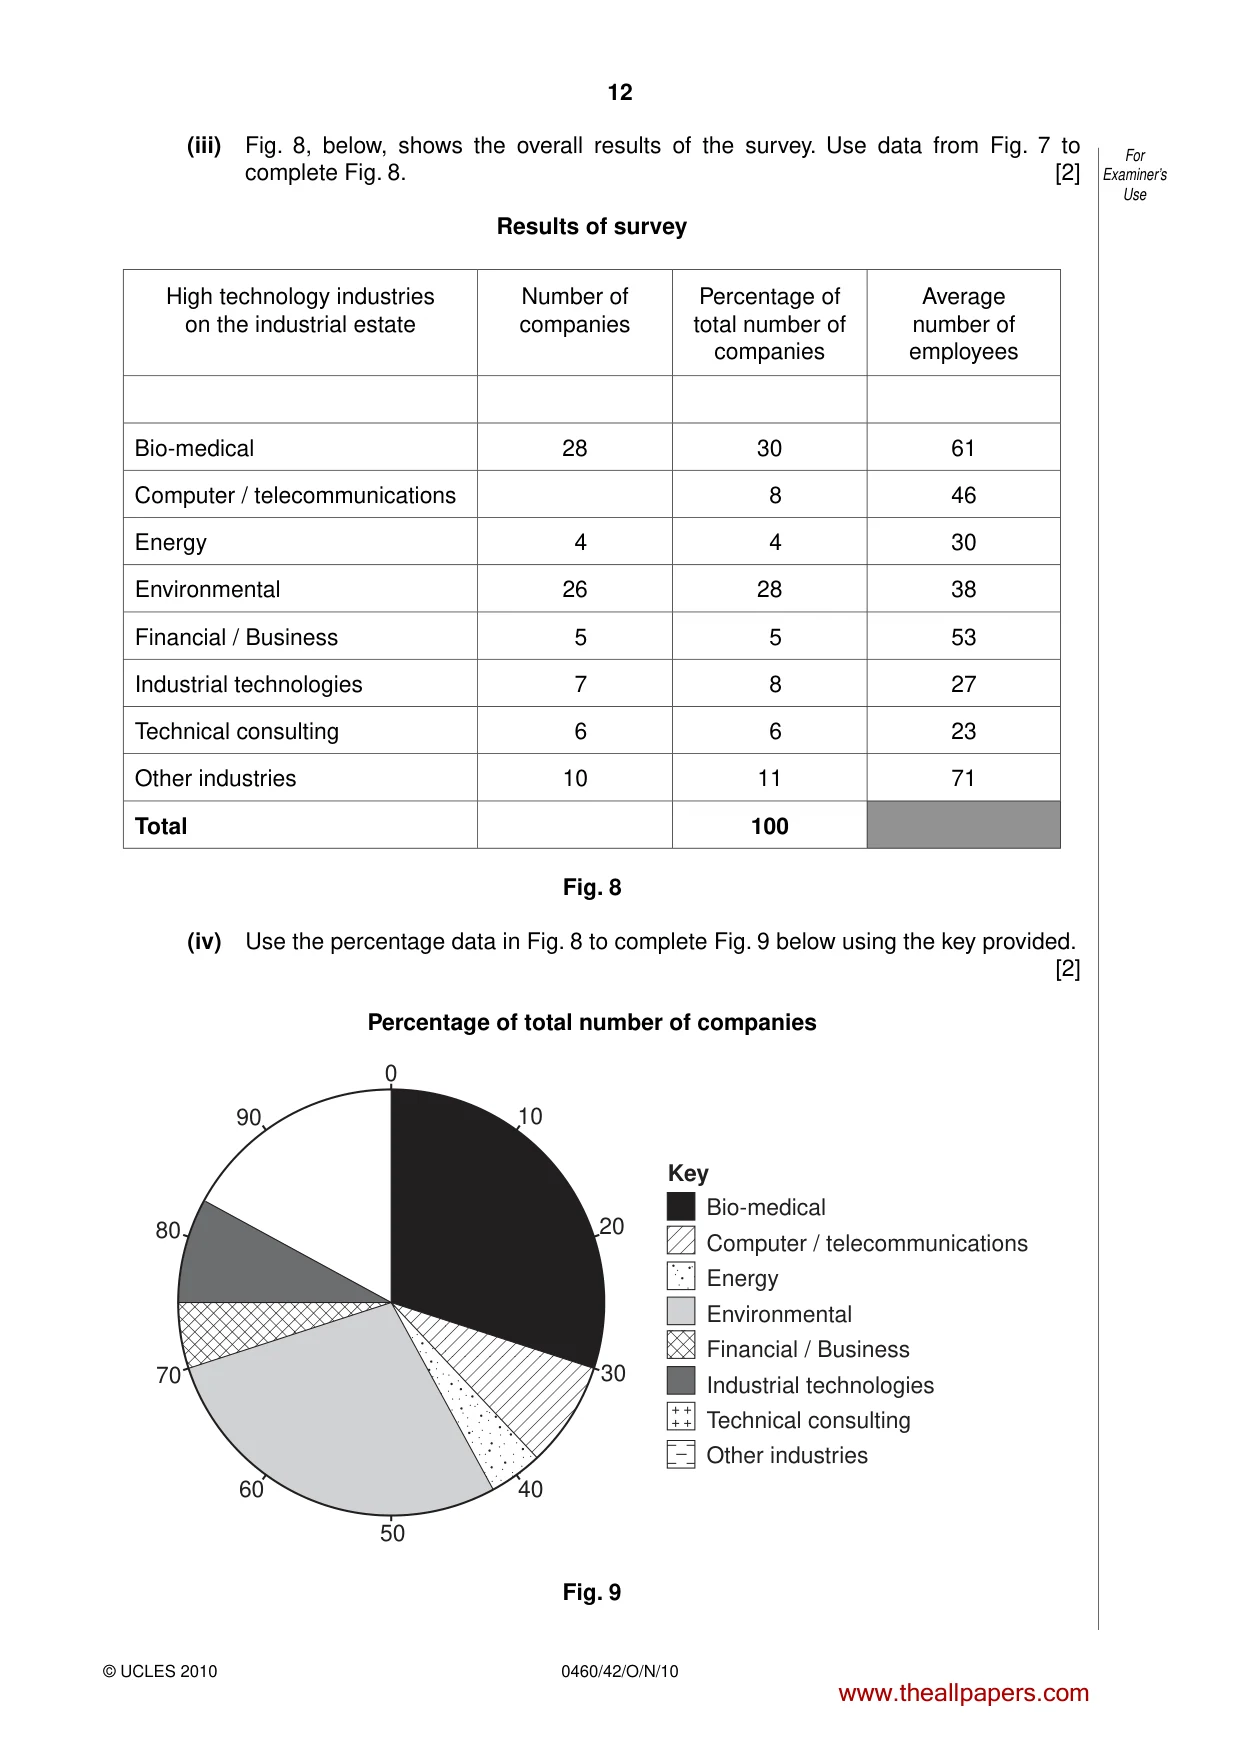
12 0460/42/O/N/10 © UCLES 2010 For Examiner’s Use (iii) Fig. 8, below, shows the overall results of the survey. Use data from Fig. 7 to complete Fig. 8. [2] Results of survey High technology industries on the industrial estate Number of companies Percentage of total number of companies Average number of employees Bio-medical 28 30 61 Computer / telecommunications 8 46 Energy 4 4 30 Environmental 26 28 38 Financial / Business 5 5 53 Industrial technologies 7 8 27 Technical consulting 6 6 23 Other industries 10 11 71 Total 100 Fig. 8 (iv) Use the percentage data in Fig. 8 to complete Fig. 9 below using the key provided. [2] Percentage of total number of companies 0 10 20 30 40 50 60 70 80 90 Bio-medical Computer / telecommunications Energy Environmental Financial / Business Industrial technologies Technical consulting Other industries Key Fig. 9 www.theallpapers.com
Question paper, page 13
13 0460/42/O/N/10 © UCLES 2010 [Turn over For Examiner’s Use (v) Why did the students come to the conclusion that Hypothesis 1: Companies in high technology industries are usually located near to other similar high technology companies is true? Use the results in Figs 8 and 9 to support your answer. … … … …[2] (vi) Explain why high-technology companies are usually located near to other similar companies. … … … … … …[3] (vii) Whilst doing their survey, the students found out that companies in the ‘other industries’ sector shown in Fig. 8 included services such as a nursery, gym, restaurant and leisure centre. Suggest two reasons why such companies would locate on this industrial estate. 1 … … 2 … …[2] www.theallpapers.com
Question paper, page 14
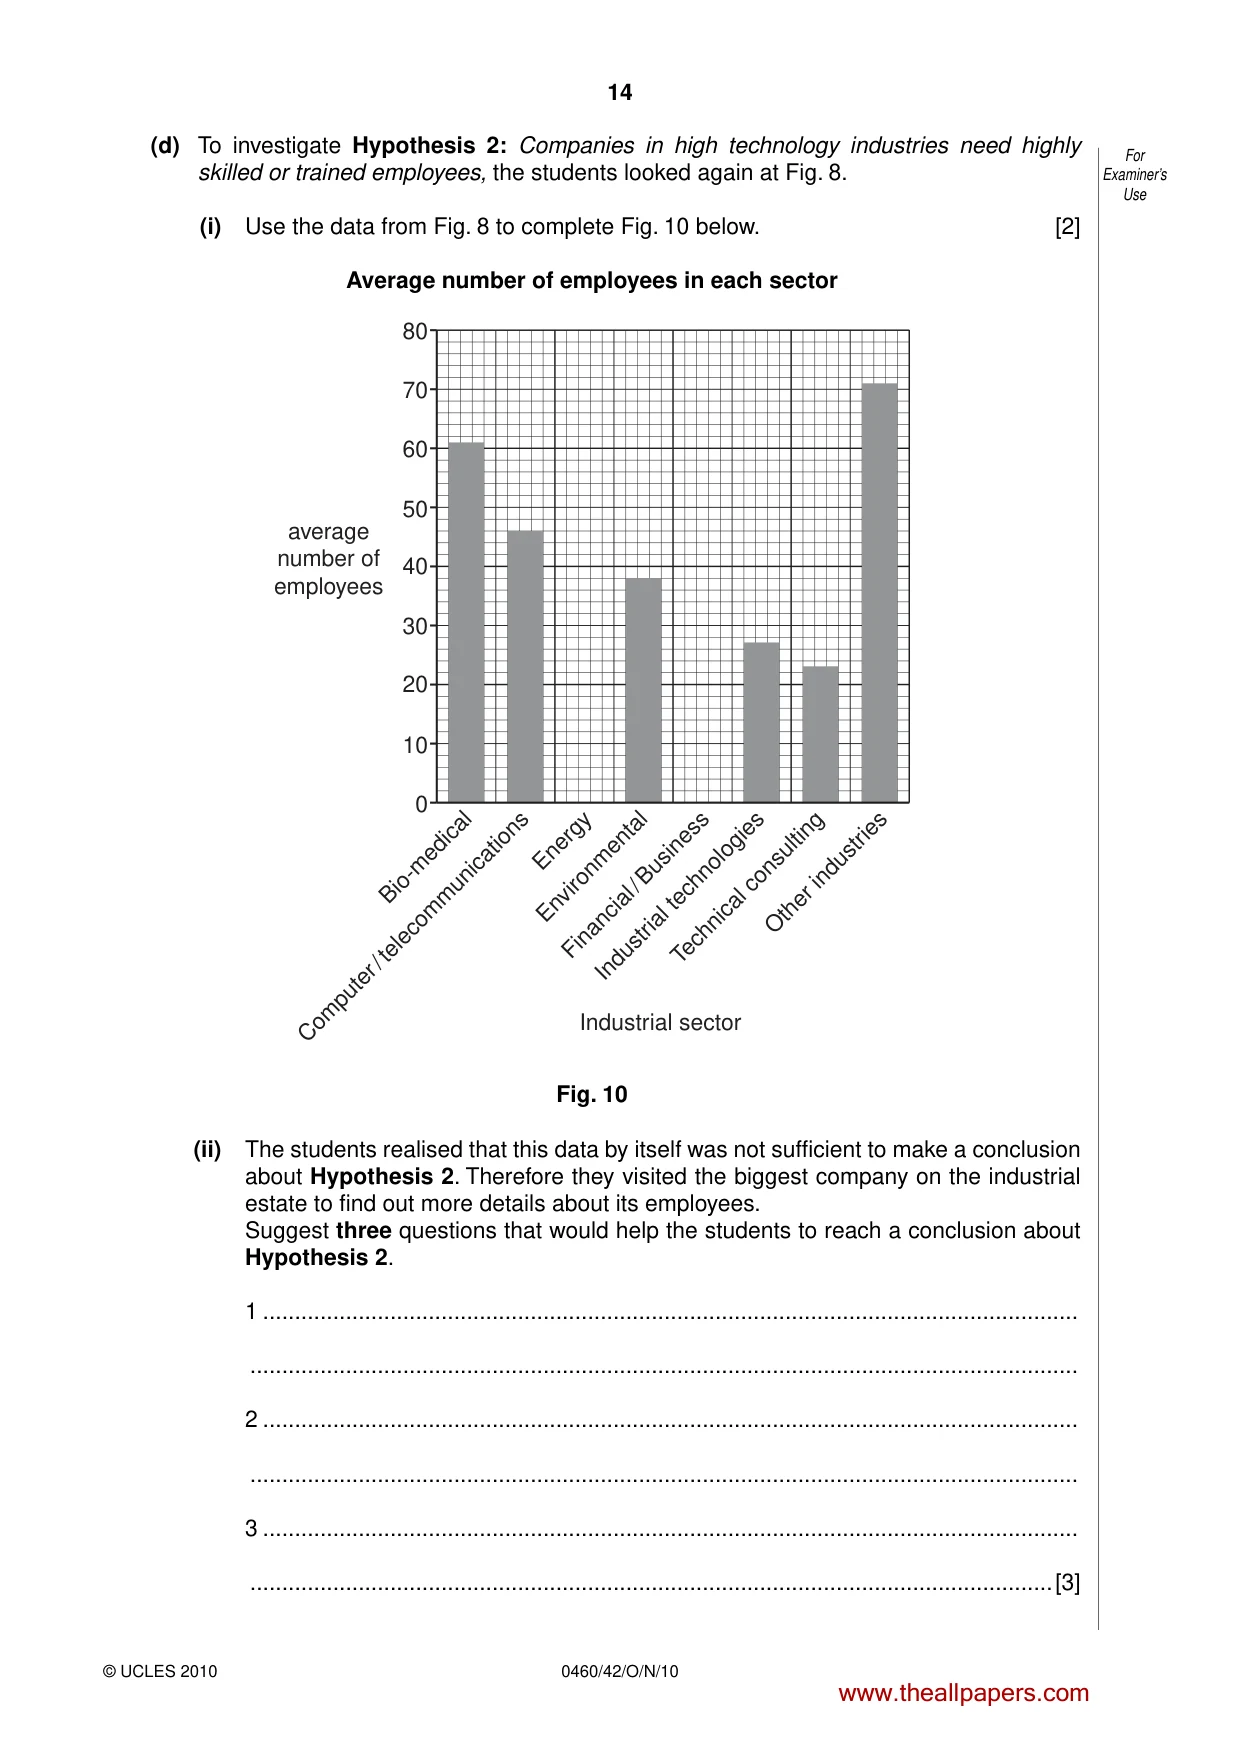
14 0460/42/O/N/10 © UCLES 2010 For Examiner’s Use (d) To investigate Hypothesis 2: Companies in high technology industries need highly skilled or trained employees, the students looked again at Fig. 8. (i) Use the data from Fig. 8 to complete Fig. 10 below. [2] Average number of employees in each sector average number of employees Industrial sector Bio-medical Computer / telecommunications Energy Environmental Financial / Business Industrial technologies Technical consulting Other industries 0 10 20 30 40 50 60 70 80 Fig. 10 (ii) The students realised that this data by itself was not sufficient to make a conclusion about Hypothesis 2. Therefore they visited the biggest company on the industrial estate to find out more details about its employees. Suggest three questions that would help the students to reach a conclusion about Hypothesis 2. 1 … … 2 … … 3 … …[3] www.theallpapers.com
Question paper, page 15
15 0460/42/O/N/10 © UCLES 2010 For Examiner’s Use (e) Having completed their study, the students decided to do a further investigation task and look at the other factors which affect the location of high technology industries shown in Fig. 5 (Insert). These two factors are: • High technology industries need good transport links. • High technology industries need small quantities of raw materials. Suggest how they could carry out an investigation into one of these factors. … … … … … … … …[4] [Total: 30 marks] www.theallpapers.com
Question paper, page 16
16 0460/42/O/N/10 © UCLES 2010 BLANK PAGE Copyright Acknowledgements: Question 2 Figure 6 © Map; Cambridge Science Park. Question 2 Photos A–E © Photographs; Cambridge Science Park. Permission to reproduce items where third-party owned material protected by copyright is included has been sought and cleared where possible. Every reasonable effort has been made by the publisher (UCLES) to trace copyright holders, but if any items requiring clearance have unwittingly been included, the publisher will be pleased to make amends at the earliest possible opportunity. University of Cambridge International Examinations is part of the Cambridge Assessment Group. Cambridge Assessment is the brand name of University of Cambridge Local Examinations Syndicate (UCLES), which is itself a department of the University of Cambridge. www.theallpapers.com
Mark scheme, page 1
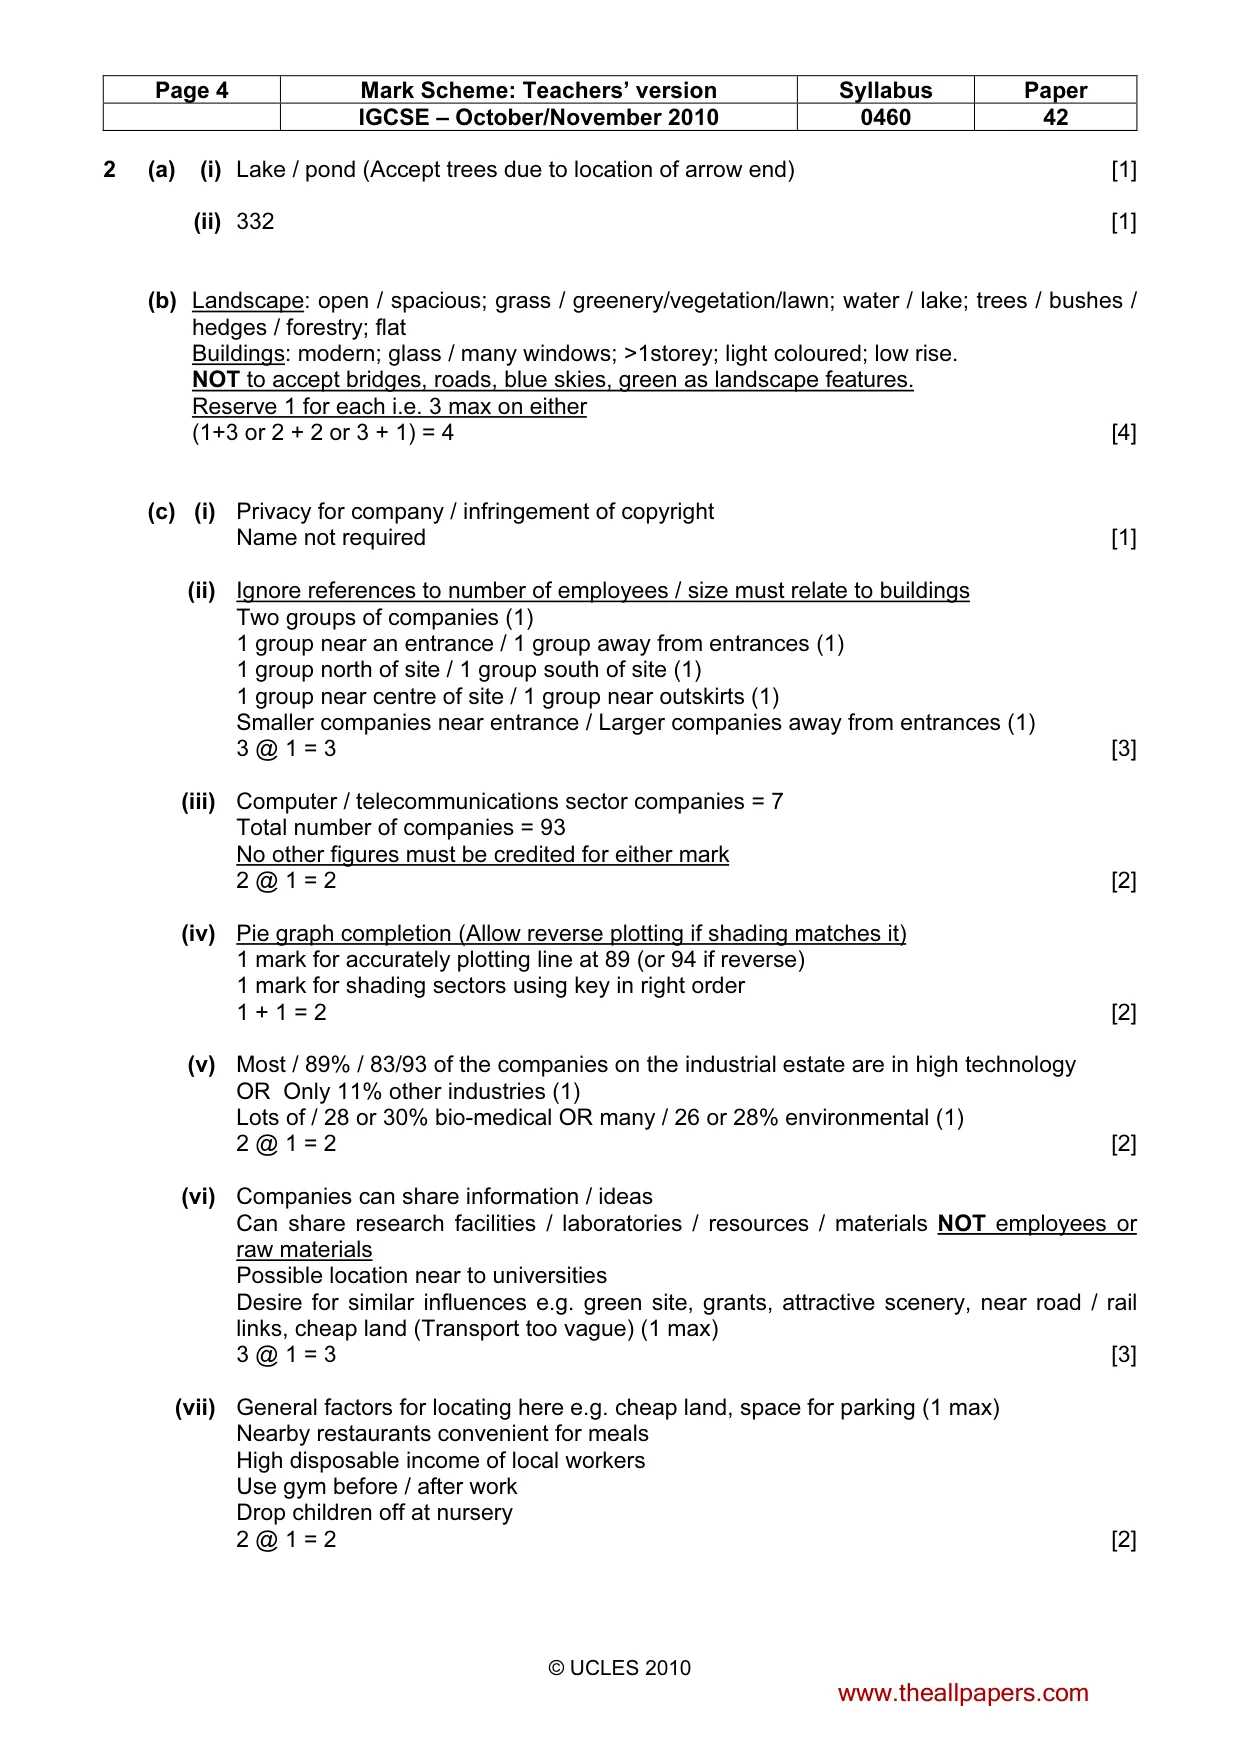
UNIVERSITY OF CAMBRIDGE INTERNATIONAL EXAMINATIONS International General Certificate of Secondary Education MARK SCHEME for the October/November 2010 question paper for the guidance of teachers 0460 GEOGRAPHY 0460/42 Paper 4 (Alternative to Coursework), maximum raw mark 60 This mark scheme is published as an aid to teachers and candidates, to indicate the requirements of the examination. It shows the basis on which Examiners were instructed to award marks. It does not indicate the details of the discussions that took place at an Examiners’ meeting before marking began, which would have considered the acceptability of alternative answers. Mark schemes must be read in conjunction with the question papers and the report on the examination. • CIE will not enter into discussions or correspondence in connection with these mark schemes. CIE is publishing the mark schemes for the October/November 2010 question papers for most IGCSE, GCE Advanced Level and Advanced Subsidiary Level syllabuses and some Ordinary Level syllabuses. www.theallpapers.com
Mark scheme, page 2
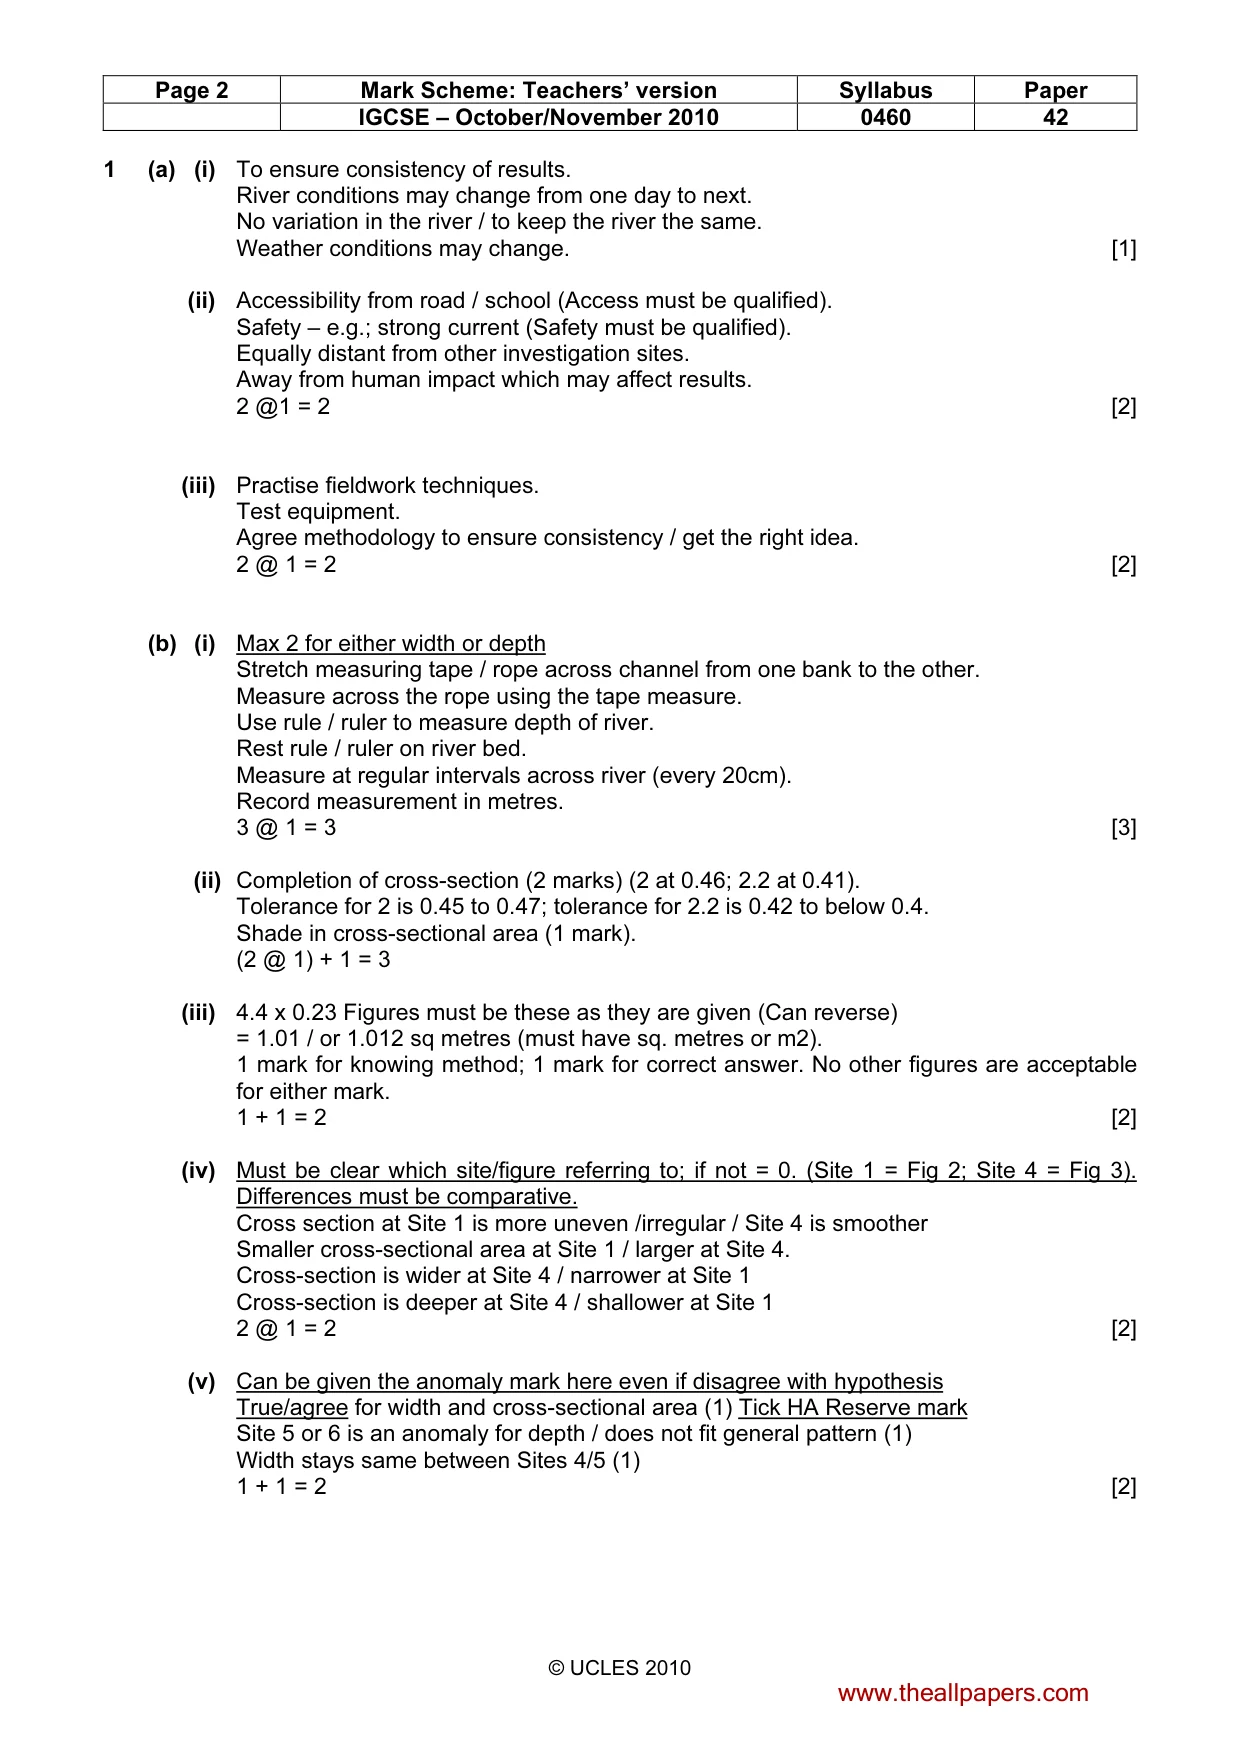
Page 2 Mark Scheme: Teachers’ version Syllabus Paper IGCSE – October/November 2010 0460 42 © UCLES 2010 1 (a) (i) To ensure consistency of results. River conditions may change from one day to next. No variation in the river / to keep the river the same. Weather conditions may change. [1] (ii) Accessibility from road / school (Access must be qualified). Safety – e.g.; strong current (Safety must be qualified). Equally distant from other investigation sites. Away from human impact which may affect results. 2 @1 = 2 [2] (iii) Practise fieldwork techniques. Test equipment. Agree methodology to ensure consistency / get the right idea. 2 @ 1 = 2 [2] (b) (i) Max 2 for either width or depth Stretch measuring tape / rope across channel from one bank to the other. Measure across the rope using the tape measure. Use rule / ruler to measure depth of river. Rest rule / ruler on river bed. Measure at regular intervals across river (every 20cm). Record measurement in metres. 3 @ 1 = 3 [3] (ii) Completion of cross-section (2 marks) (2 at 0.46; 2.2 at 0.41). Tolerance for 2 is 0.45 to 0.47; tolerance for 2.2 is 0.42 to below 0.4. Shade in cross-sectional area (1 mark). (2 @ 1) + 1 = 3 (iii) 4.4 x 0.23 Figures must be these as they are given (Can reverse) = 1.01 / or 1.012 sq metres (must have sq. metres or m2). 1 mark for knowing method; 1 mark for correct answer. No other figures are acceptable for either mark. 1 + 1 = 2 [2] (iv) Must be clear which site/figure referring to; if not = 0. (Site 1 = Fig 2; Site 4 = Fig 3). Differences must be comparative. Cross section at Site 1 is more uneven /irregular / Site 4 is smoother Smaller cross-sectional area at Site 1 / larger at Site 4. Cross-section is wider at Site 4 / narrower at Site 1 Cross-section is deeper at Site 4 / shallower at Site 1 2 @ 1 = 2 [2] (v) Can be given the anomaly mark here even if disagree with hypothesis True/agree for width and cross-sectional area (1) Tick HA Reserve mark Site 5 or 6 is an anomaly for depth / does not fit general pattern (1) Width stays same between Sites 4/5 (1) 1 + 1 = 2 [2] www.theallpapers.com
Mark scheme, page 3
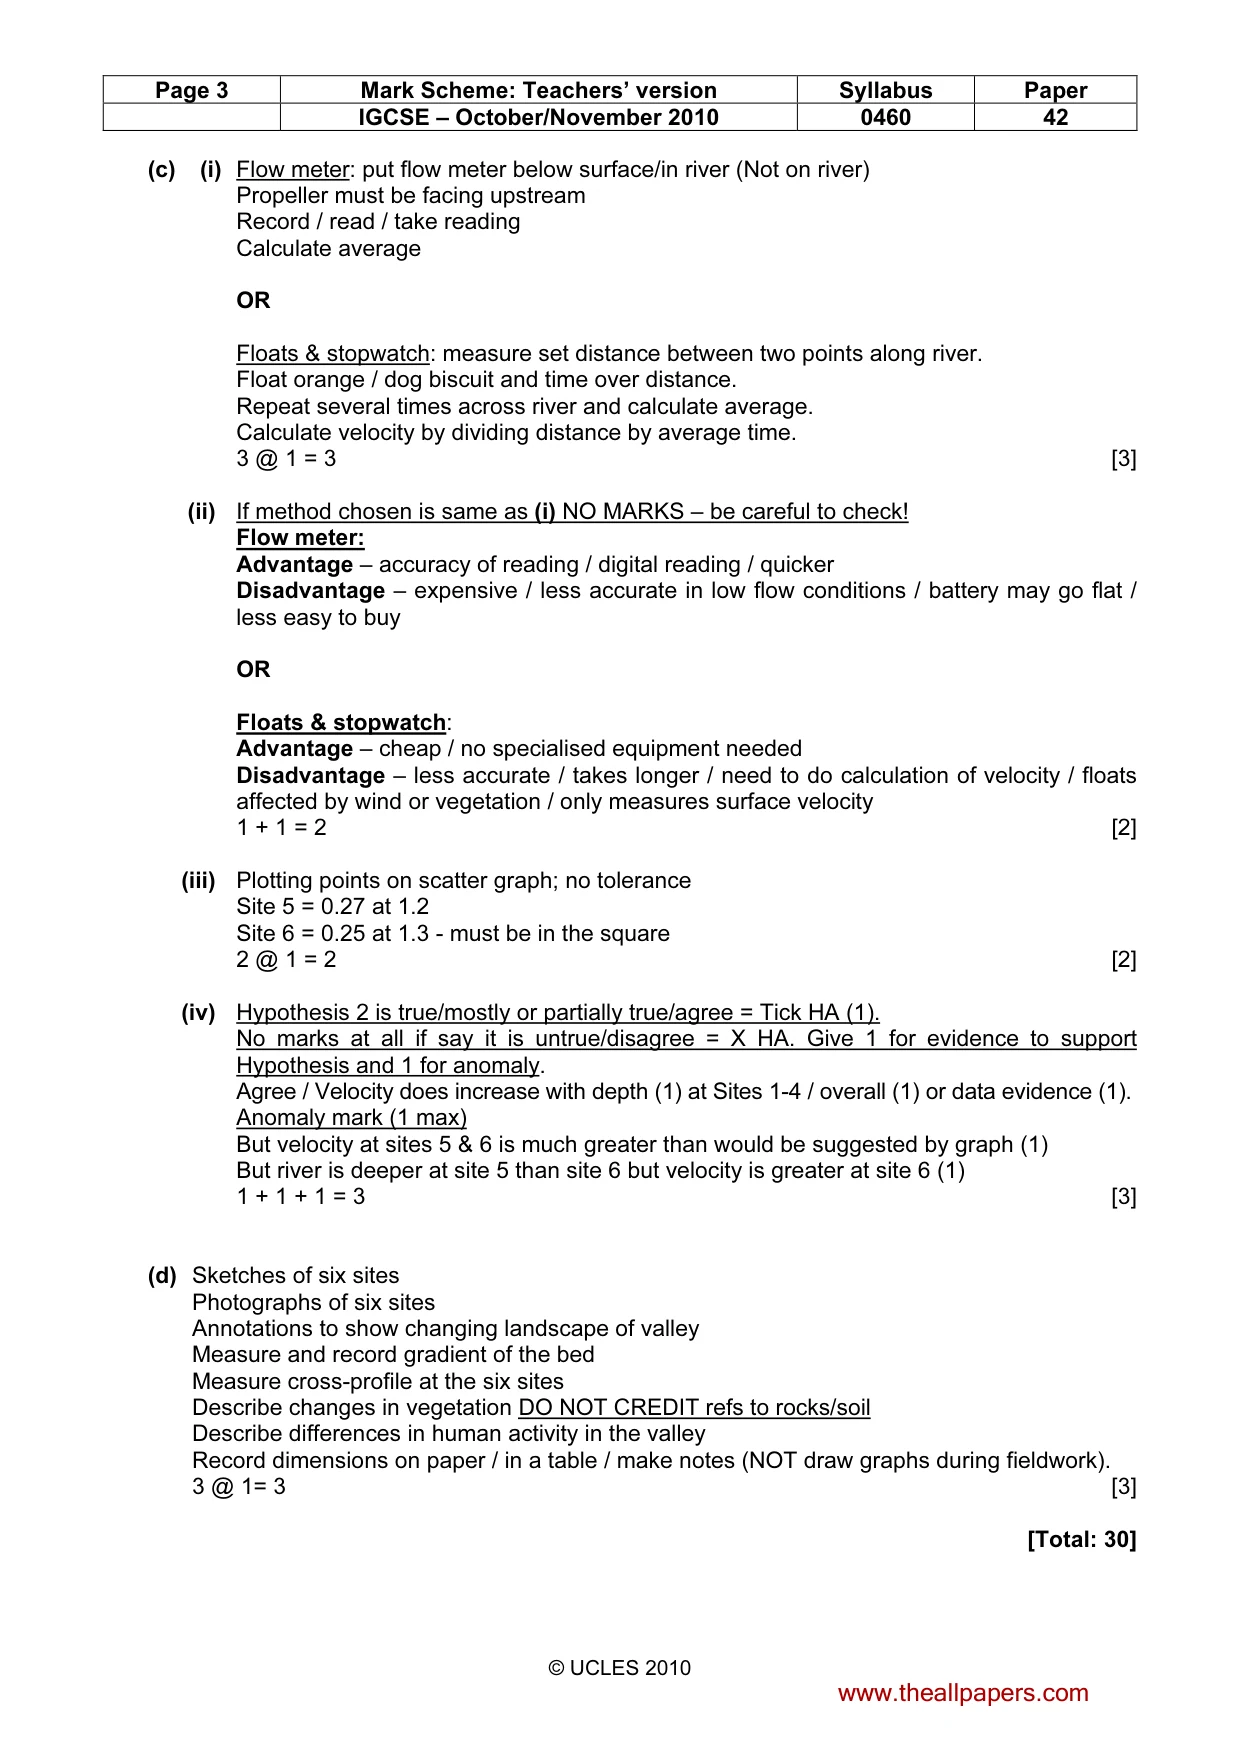
Page 3 Mark Scheme: Teachers’ version Syllabus Paper IGCSE – October/November 2010 0460 42 © UCLES 2010 (c) (i) Flow meter: put flow meter below surface/in river (Not on river) Propeller must be facing upstream Record / read / take reading Calculate average OR Floats & stopwatch: measure set distance between two points along river. Float orange / dog biscuit and time over distance. Repeat several times across river and calculate average. Calculate velocity by dividing distance by average time. 3 @ 1 = 3 [3] (ii) If method chosen is same as (i) NO MARKS – be careful to check! Flow meter: Advantage – accuracy of reading / digital reading / quicker Disadvantage – expensive / less accurate in low flow conditions / battery may go flat / less easy to buy OR Floats & stopwatch: Advantage – cheap / no specialised equipment needed Disadvantage – less accurate / takes longer / need to do calculation of velocity / floats affected by wind or vegetation / only measures surface velocity 1 + 1 = 2 [2] (iii) Plotting points on scatter graph; no tolerance Site 5 = 0.27 at 1.2 Site 6 = 0.25 at 1.3 - must be in the square 2 @ 1 = 2 [2] (iv) Hypothesis 2 is true/mostly or partially true/agree = Tick HA (1). No marks at all if say it is untrue/disagree = X HA. Give 1 for evidence to support Hypothesis and 1 for anomaly. Agree / Velocity does increase with depth (1) at Sites 1-4 / overall (1) or data evidence (1). Anomaly mark (1 max) But velocity at sites 5 & 6 is much greater than would be suggested by graph (1) But river is deeper at site 5 than site 6 but velocity is greater at site 6 (1) 1 + 1 + 1 = 3 [3] (d) Sketches of six sites Photographs of six sites Annotations to show changing landscape of valley Measure and record gradient of the bed Measure cross-profile at the six sites Describe changes in vegetation DO NOT CREDIT refs to rocks/soil Describe differences in human activity in the valley Record dimensions on paper / in a table / make notes (NOT draw graphs during fieldwork). 3 @ 1= 3 [3] [Total: 30] www.theallpapers.com
Mark scheme, page 4
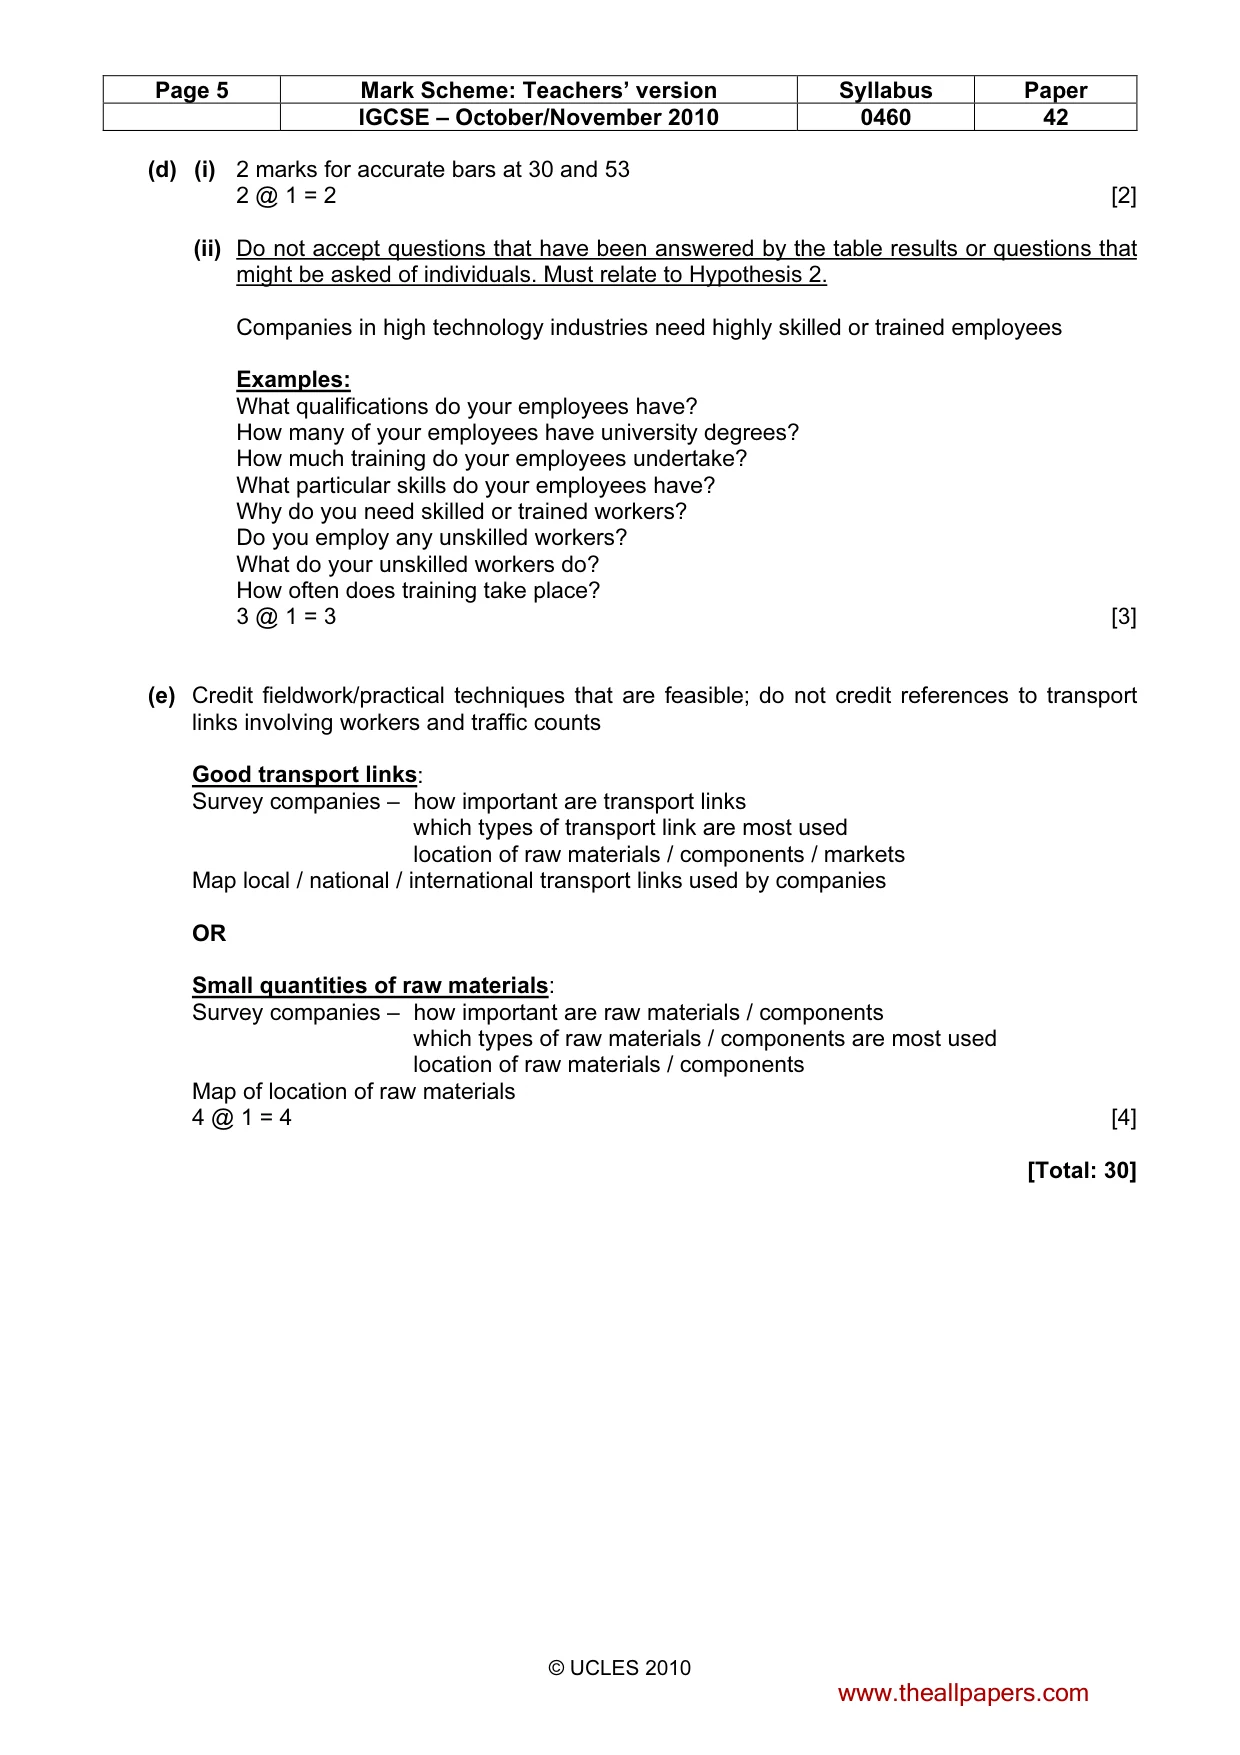
Page 4 Mark Scheme: Teachers’ version Syllabus Paper IGCSE – October/November 2010 0460 42 © UCLES 2010 2 (a) (i) Lake / pond (Accept trees due to location of arrow end) [1] (ii) 332 [1] (b) Landscape: open / spacious; grass / greenery/vegetation/lawn; water / lake; trees / bushes / hedges / forestry; flat Buildings: modern; glass / many windows; >1storey; light coloured; low rise. NOT to accept bridges, roads, blue skies, green as landscape features. Reserve 1 for each i.e. 3 max on either (1+3 or 2 + 2 or 3 + 1) = 4 [4] (c) (i) Privacy for company / infringement of copyright Name not required [1] (ii) Ignore references to number of employees / size must relate to buildings Two groups of companies (1) 1 group near an entrance / 1 group away from entrances (1) 1 group north of site / 1 group south of site (1) 1 group near centre of site / 1 group near outskirts (1) Smaller companies near entrance / Larger companies away from entrances (1) 3 @ 1 = 3 [3] (iii) Computer / telecommunications sector companies = 7 Total number of companies = 93 No other figures must be credited for either mark 2 @ 1 = 2 [2] (iv) Pie graph completion (Allow reverse plotting if shading matches it) 1 mark for accurately plotting line at 89 (or 94 if reverse) 1 mark for shading sectors using key in right order 1 + 1 = 2 [2] (v) Most / 89% / 83/93 of the companies on the industrial estate are in high technology OR Only 11% other industries (1) Lots of / 28 or 30% bio-medical OR many / 26 or 28% environmental (1) 2 @ 1 = 2 [2] (vi) Companies can share information / ideas Can share research facilities / laboratories / resources / materials NOT employees or raw materials Possible location near to universities Desire for similar influences e.g. green site, grants, attractive scenery, near road / rail links, cheap land (Transport too vague) (1 max) 3 @ 1 = 3 [3] (vii) General factors for locating here e.g. cheap land, space for parking (1 max) Nearby restaurants convenient for meals High disposable income of local workers Use gym before / after work Drop children off at nursery 2 @ 1 = 2 [2] www.theallpapers.com
Mark scheme, page 5
Page 5 Mark Scheme: Teachers’ version Syllabus Paper IGCSE – October/November 2010 0460 42 © UCLES 2010 (d) (i) 2 marks for accurate bars at 30 and 53 2 @ 1 = 2 [2] (ii) Do not accept questions that have been answered by the table results or questions that might be asked of individuals. Must relate to Hypothesis 2. Companies in high technology industries need highly skilled or trained employees Examples: What qualifications do your employees have? How many of your employees have university degrees? How much training do your employees undertake? What particular skills do your employees have? Why do you need skilled or trained workers? Do you employ any unskilled workers? What do your unskilled workers do? How often does training take place? 3 @ 1 = 3 [3] (e) Credit fieldwork/practical techniques that are feasible; do not credit references to transport links involving workers and traffic counts Good transport links: Survey companies – how important are transport links which types of transport link are most used location of raw materials / components / markets Map local / national / international transport links used by companies OR Small quantities of raw materials: Survey companies – how important are raw materials / components which types of raw materials / components are most used location of raw materials / components Map of location of raw materials 4 @ 1 = 4 [4] [Total: 30] www.theallpapers.com
What you needed in this session
Cambridge’s own grade thresholds for 2010 Oct/Nov, Paper 4 · Variant 2. A higher threshold means an easier paper — the bar moves with how the cohort did.