Cambridge IGCSE Environmental Management 0680 — 2025 Oct/Nov Paper 2 · Variant 3
0680/23/O/N/25 · 5 questions · 80 marks · 105 min
The question paper and its mark scheme, free to read here and free to download. This is Cambridge’s own paper, exactly as it was sat.
Question paper20 pages
Mark scheme13 pages
Answers below. Sit the paper first if you are practising.
Questions as text
Q1 · The working population of Argentina is aged between 15–64 years old
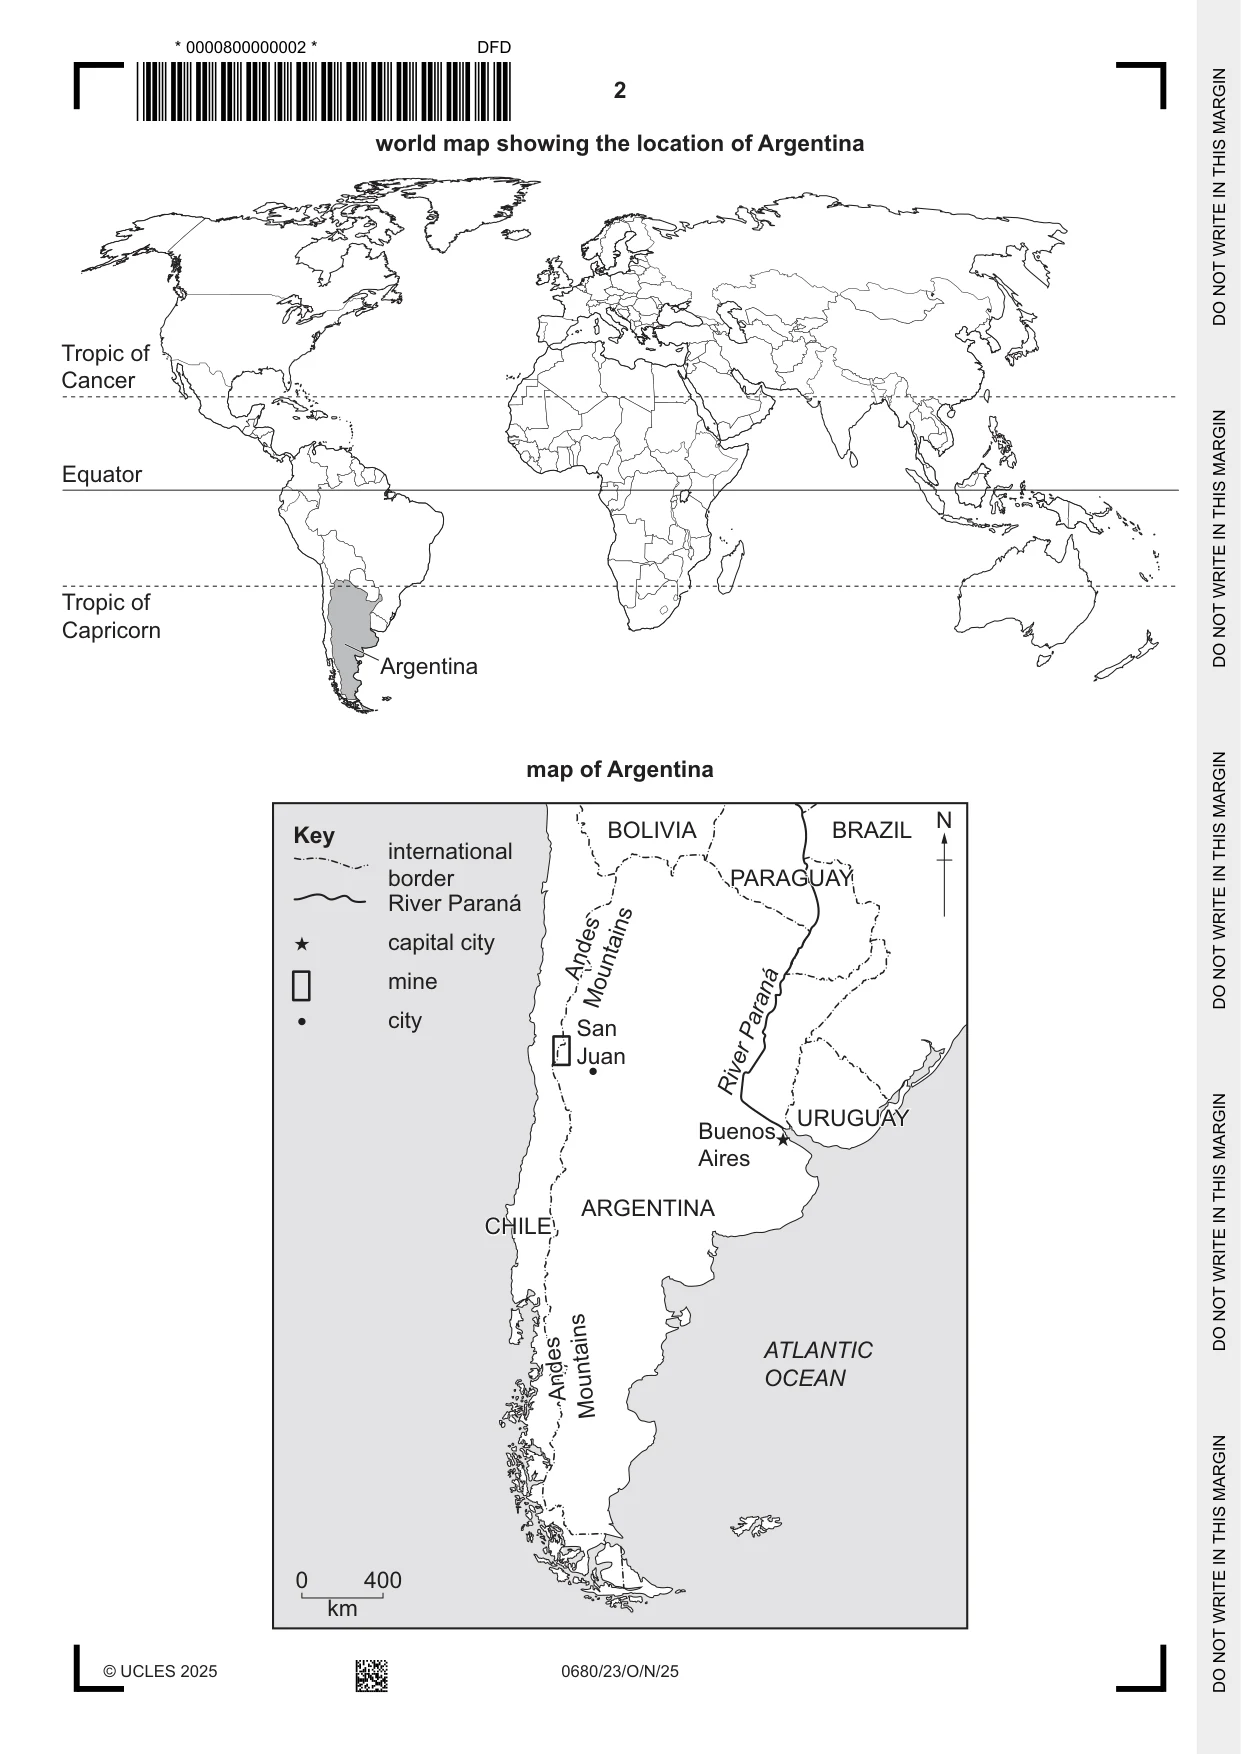
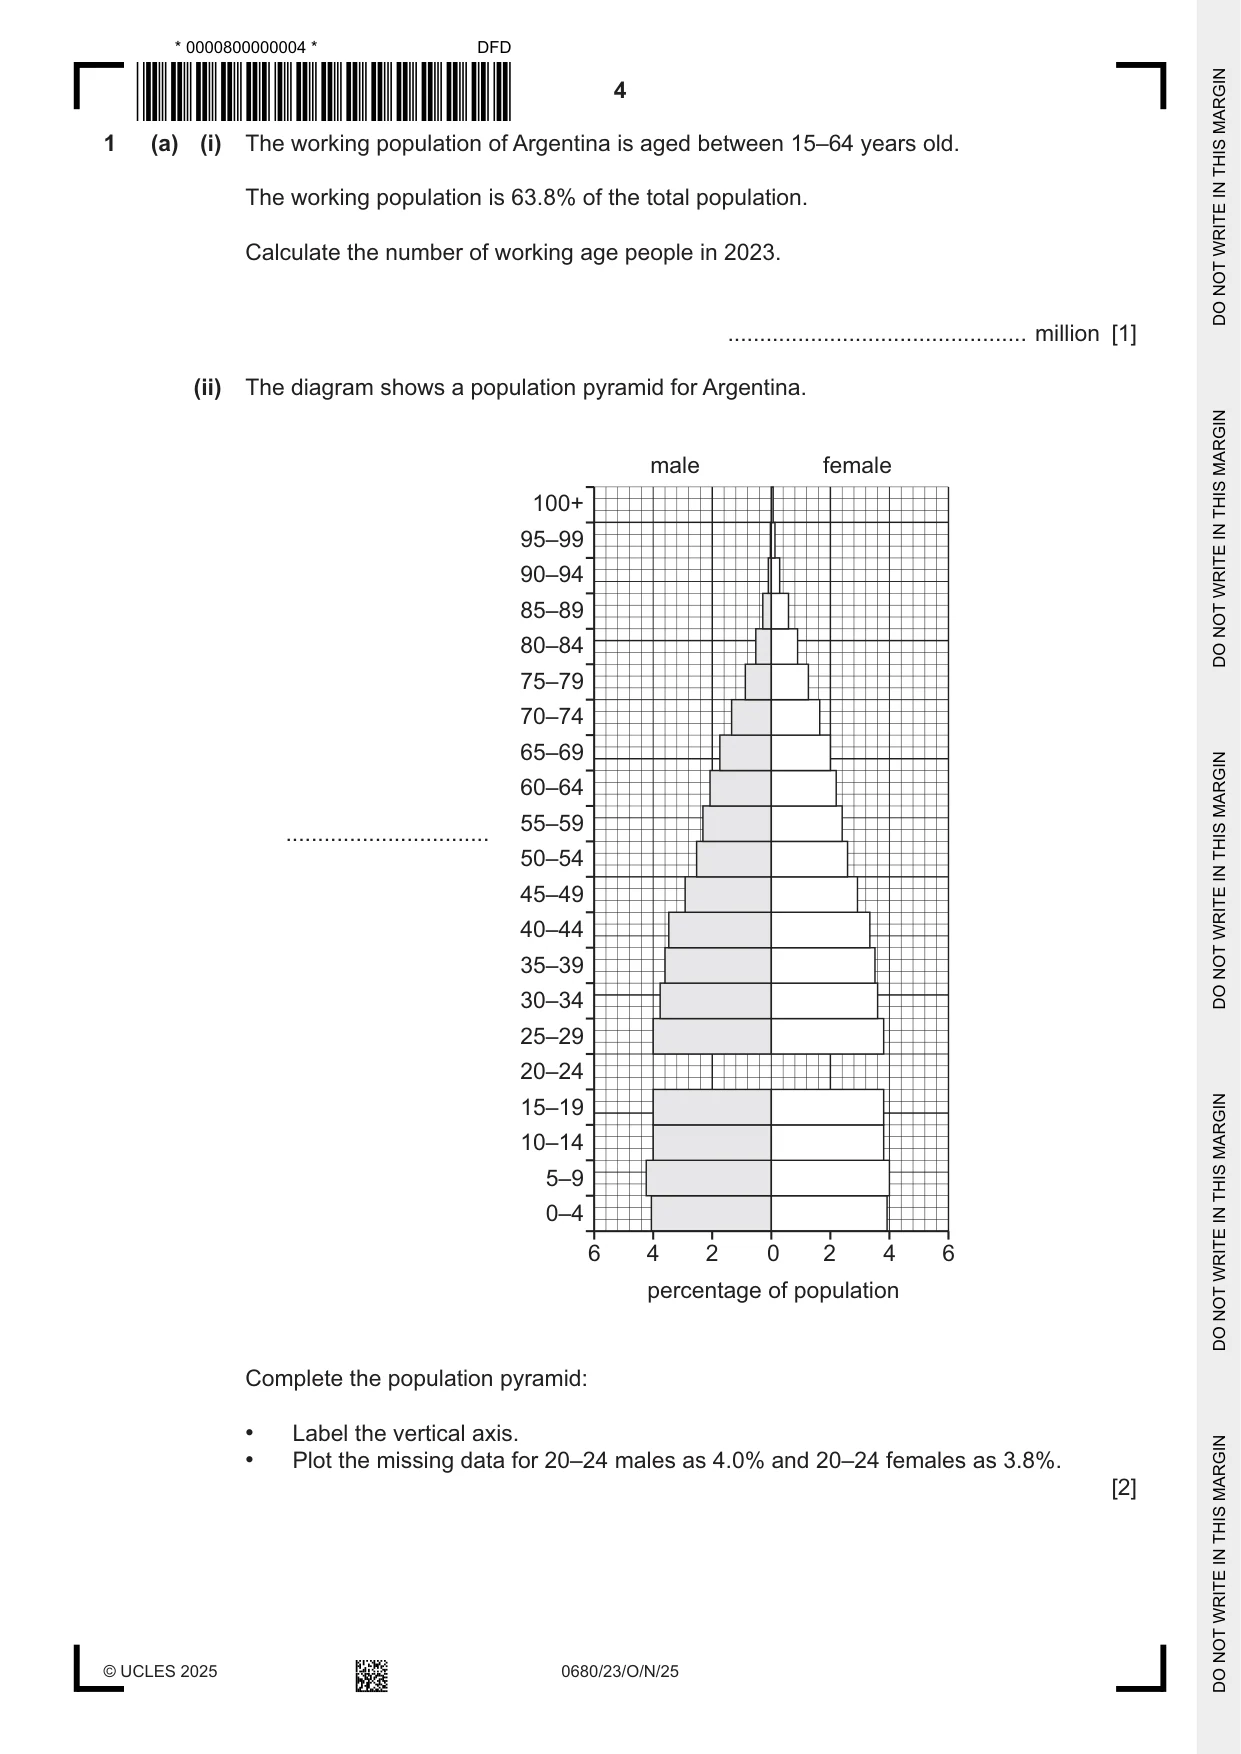
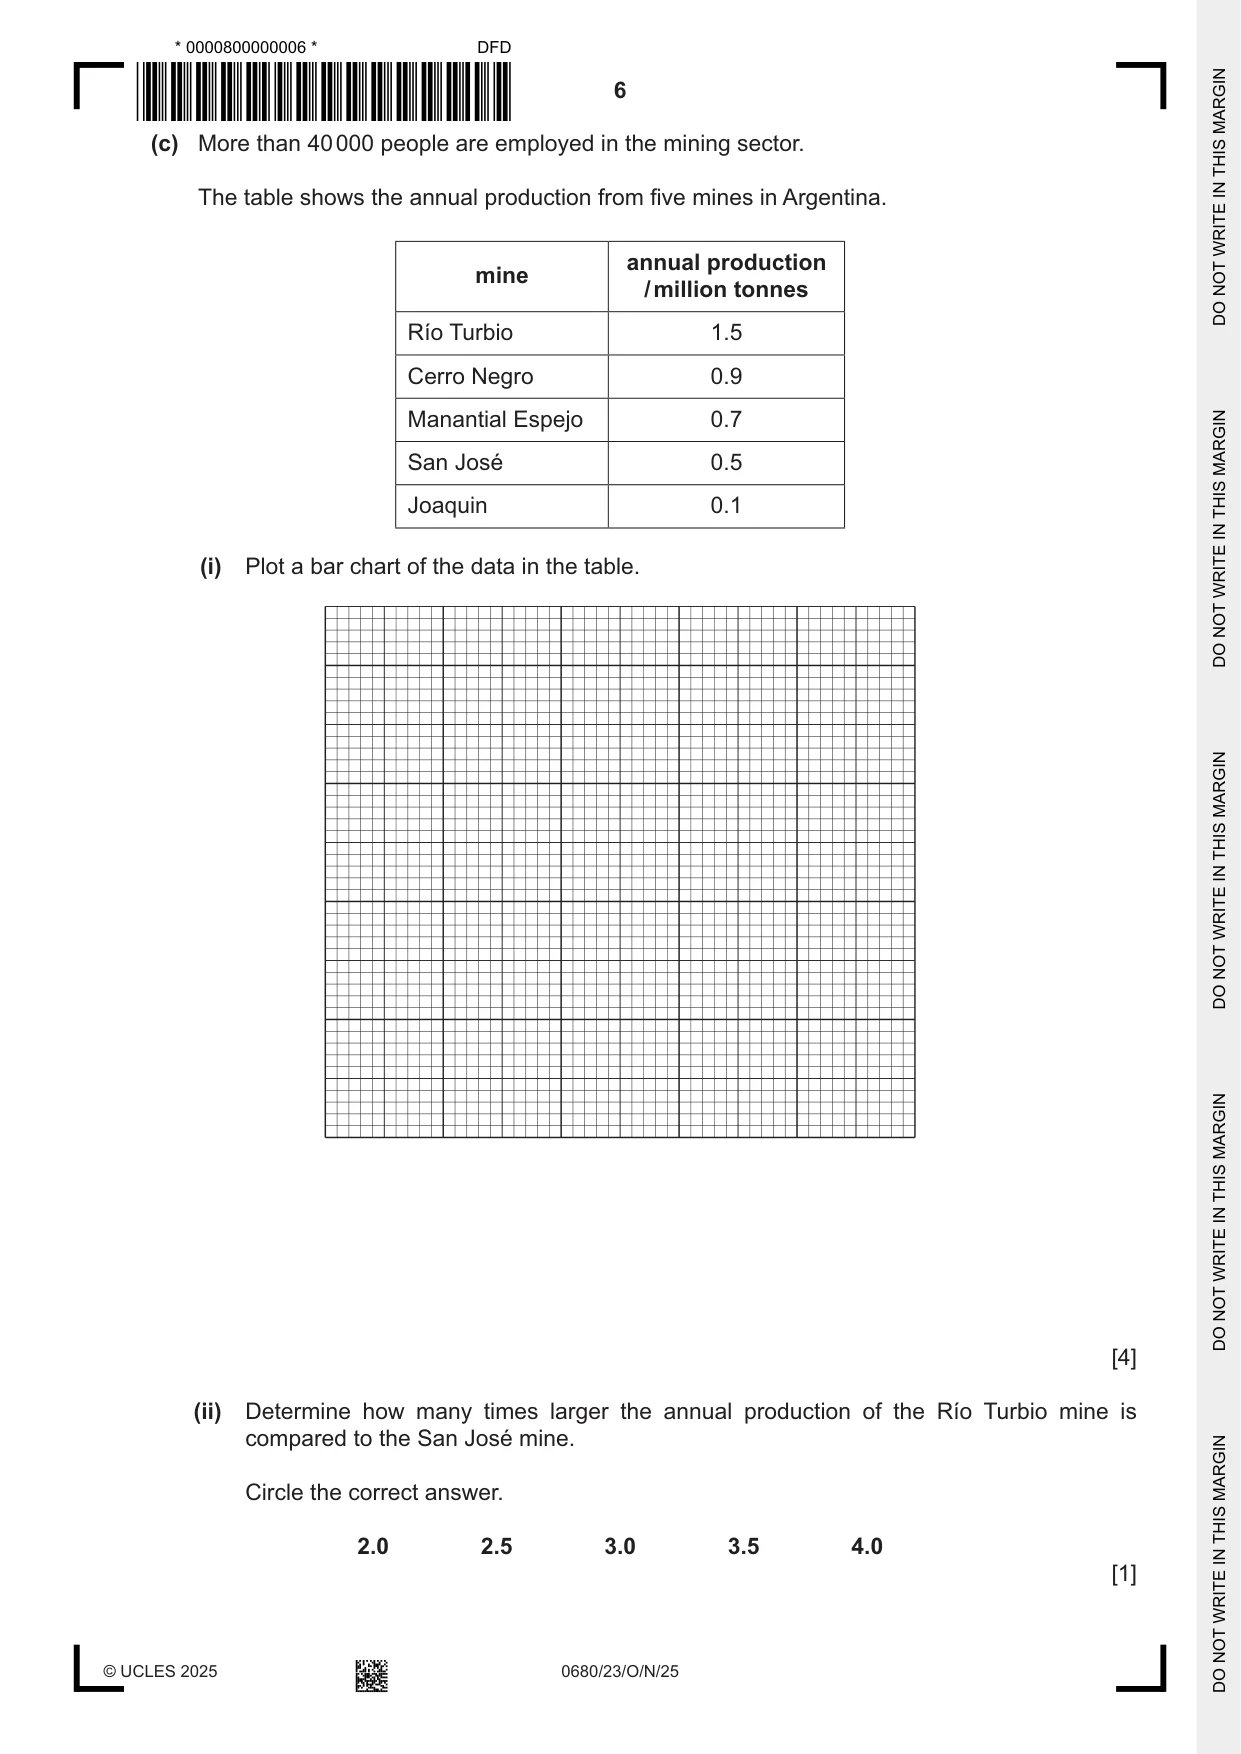
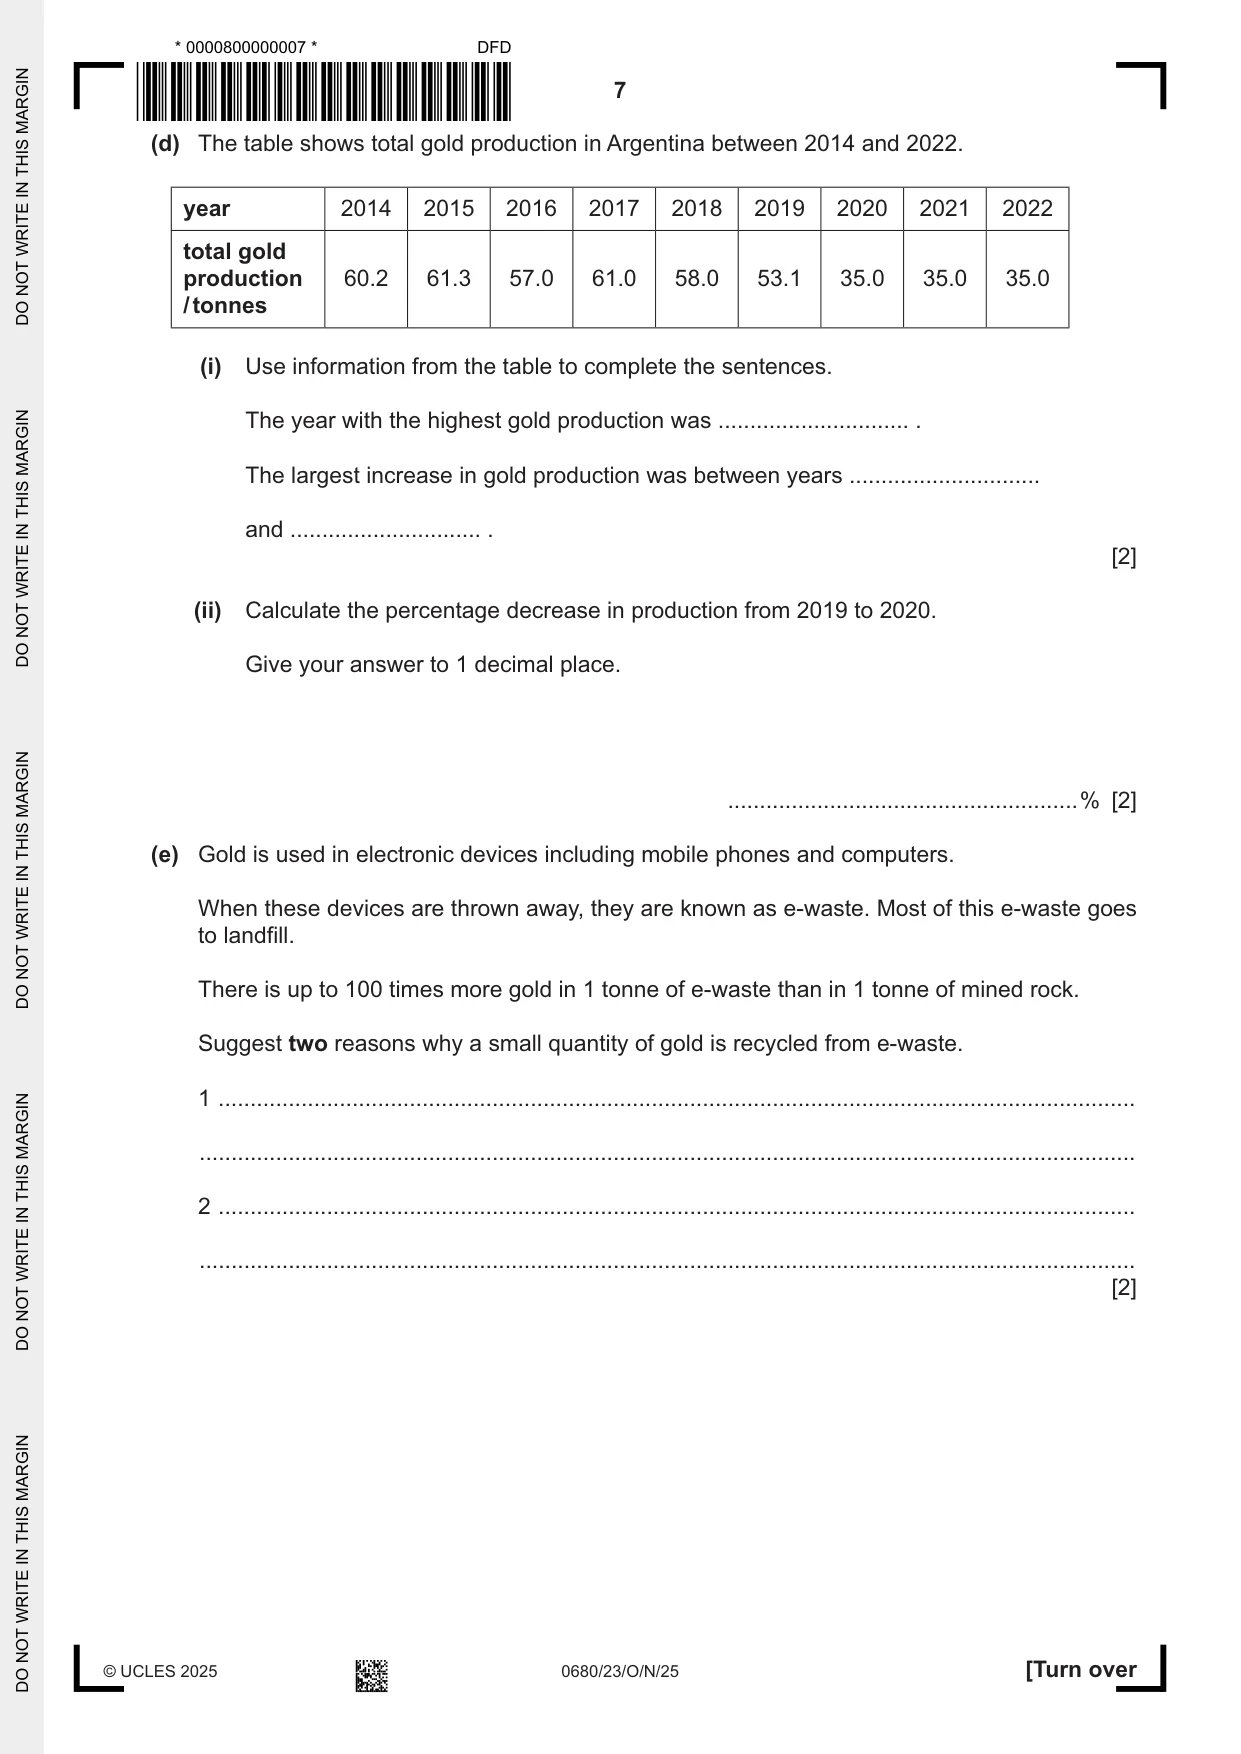
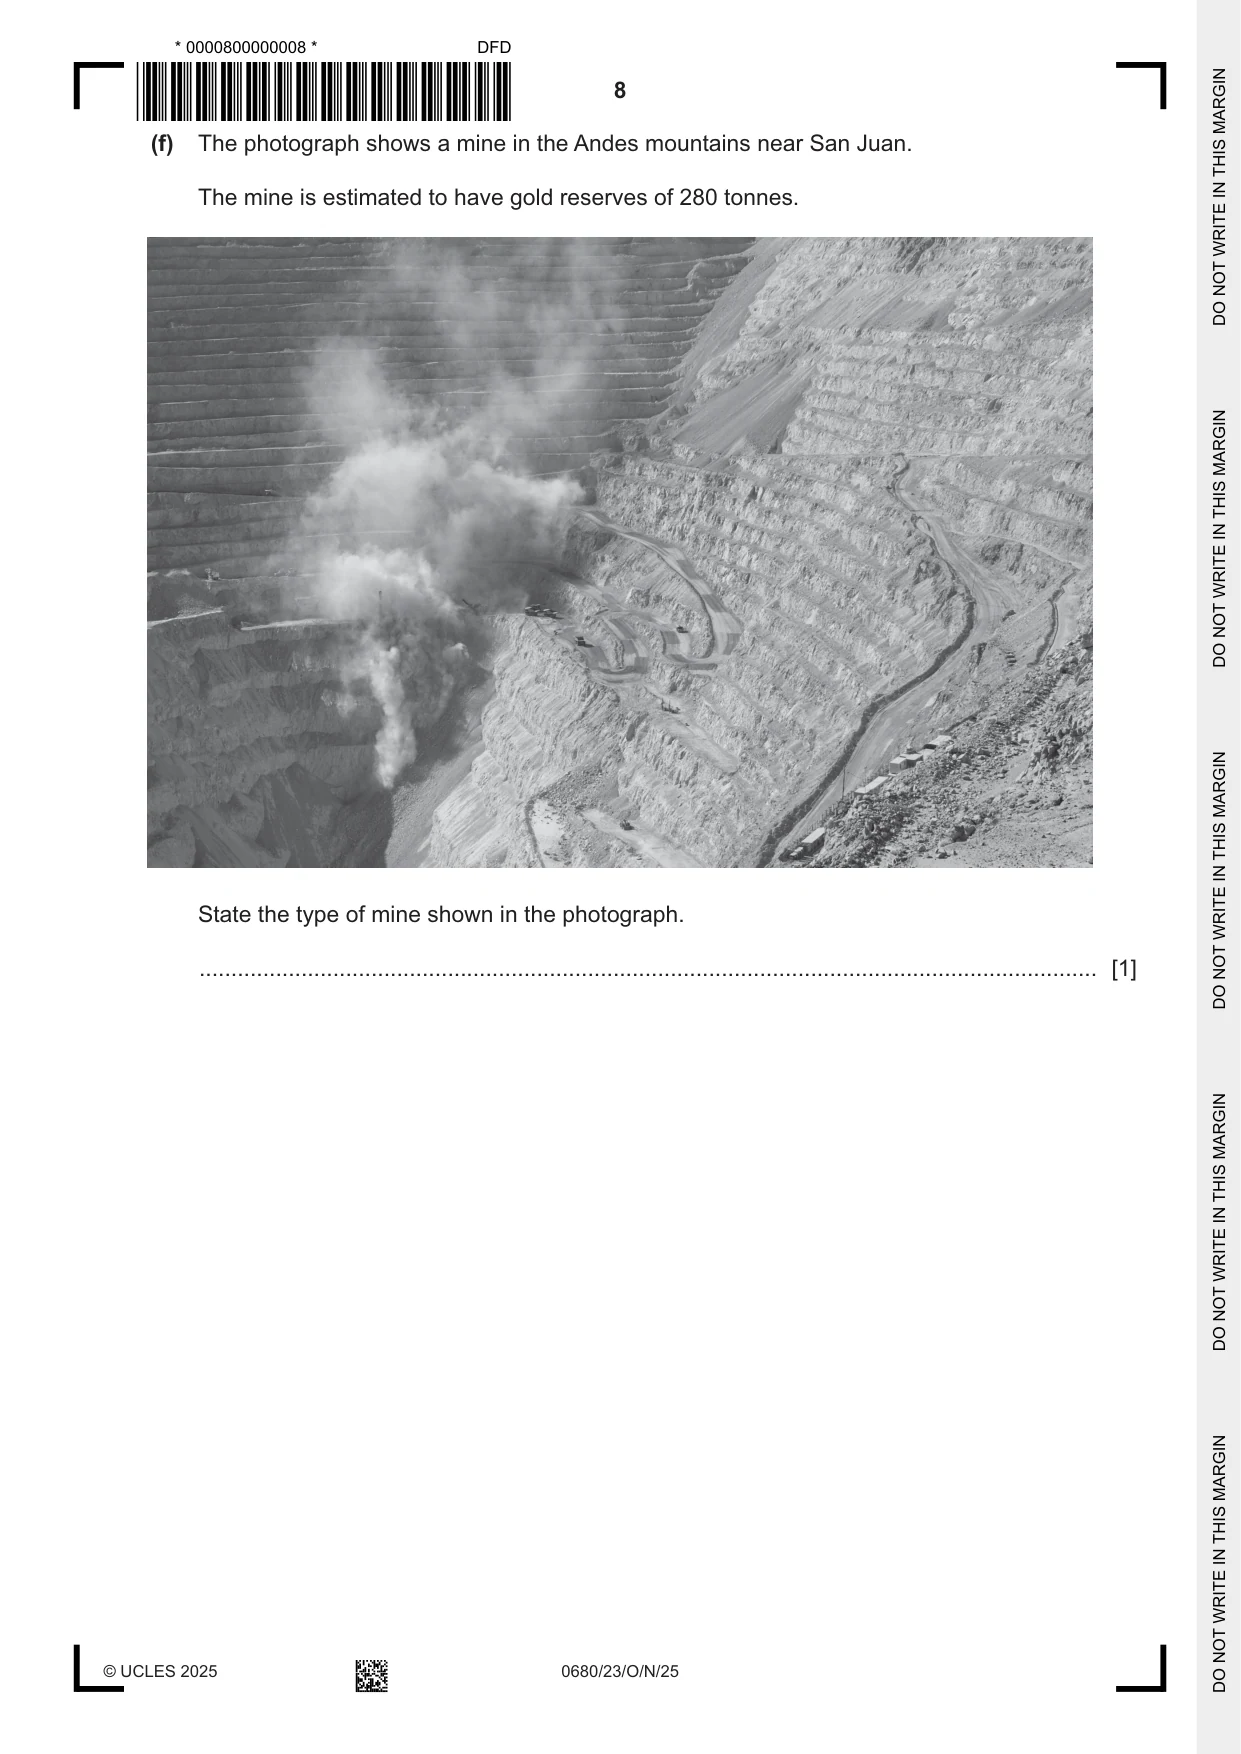
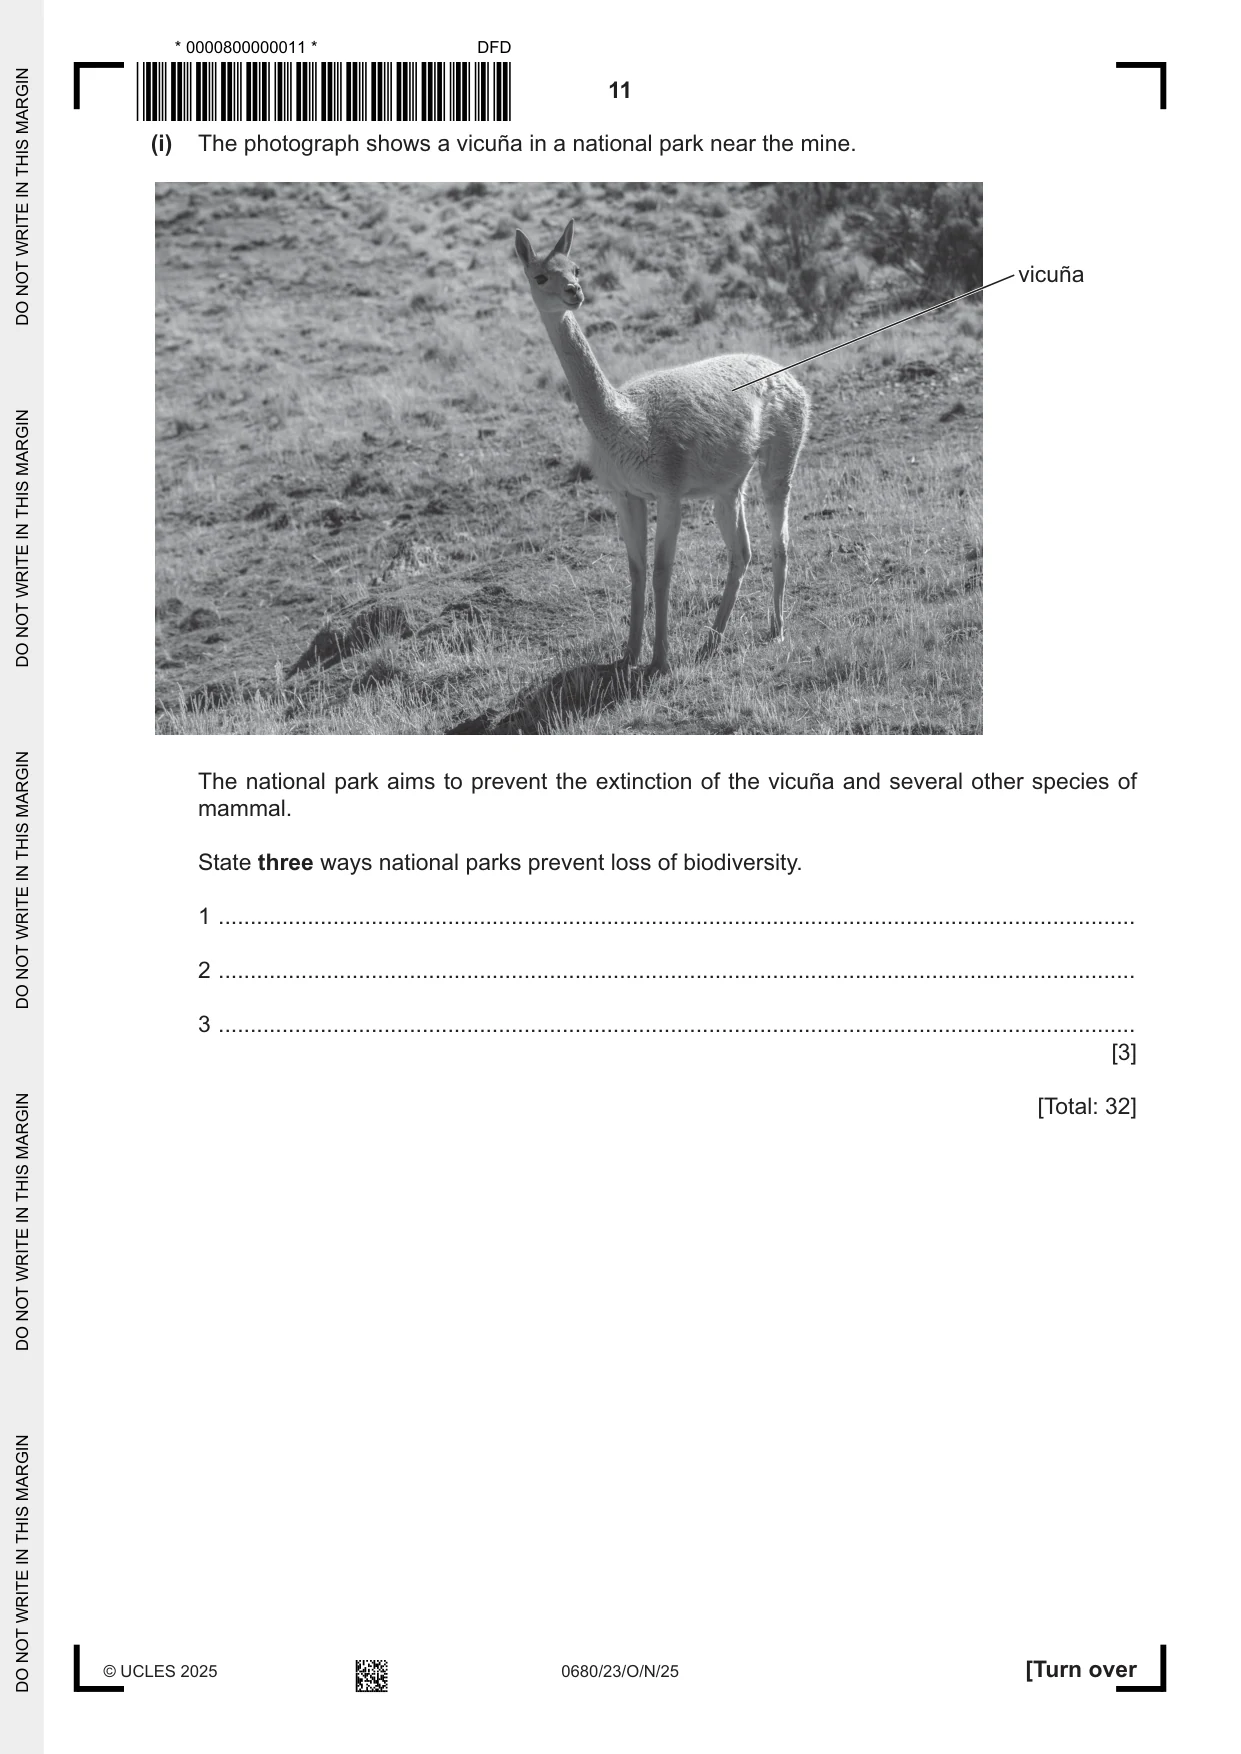
1 (a) (i) The working population of Argentina is aged between 15–64 years old. The working population is 63.8% of the total population. Calculate the number of working age people in 2023. ............................................... million [1] (ii) The diagram shows a population pyramid for Argentina. male female 100+ 95–99 90–94 85–89 80–84 75–79 70–74 65–69 60–64 55–59 ................................ 50–54 45–49 40–44 35–39 30–34 25–29 20–24 15–19 10–14 5–9 0–4 6 4 2 0 2 4 6 percentage of population Complete the population pyramid: • Label the vertical axis. • Plot the missing data for 20–24 males as 4.0% and 20–24 females as 3.8%. [2] (b) Describe how poverty impacts population size. ................................................................................................................................................... ................................................................................................................................................... ................................................................................................................................................... ................................................................................................................................................... ................................................................................................................................................... ................................................................................................................................................... ................................................................................................................................................... ............................................................................................................................................. [4] (c) More than 40 000 people are employed in the mining sector. The table shows the annual production from five mines in Argentina. annual production mine / million tonnes Río Turbio 1.5 Cerro Negro 0.9 Manantial Espejo 0.7 San José 0.5 Joaquin 0.1 (i) Plot a bar chart of the data in the table. [4] (ii) Determine how many times larger the annual production of the Río Turbio mine is compared to the San José mine. Circle the correct answer. 2.0 2.5 3.0 3.5 4.0 [1] (d) The table shows total gold production in Argentina between 2014 and 2022. year 2014 2015 2016 2017 2018 2019 2020 2021 2022 total gold production 60.2 61.3 57.0 61.0 58.0 53.1 35.0 35.0 35.0 / tonnes (i) Use information from the table to complete the sentences. The year with the highest gold production was .............................. . The largest increase in gold production was between years .............................. and .............................. . [2] (ii) Calculate the percentage decrease in production from 2019 to 2020. Give your answer to 1 decimal place. .......................................................% [2] (e) Gold is used in electronic devices including mobile phones and computers. When these devices are thrown away, they are known as e‑waste. Most of this e‑waste goes to landfill. There is up to 100 times more gold in 1 tonne of e‑waste than in 1 tonne of mined rock. Suggest two reasons why a small quantity of gold is recycled from e‑waste. 1 ................................................................................................................................................ ................................................................................................................................................... 2 ................................................................................................................................................ ................................................................................................................................................... [2] (f) The photograph shows a mine in the Andes mountains near San Juan. The mine is estimated to have gold reserves of 280 tonnes. State the type of mine shown in the photograph. ............................................................................................................................................. [1] (g) The rock from the mine is crushed. The gold is then extracted using mercury. This mine has contaminated five rivers with mercury. (i) Describe how mercury bioaccumulates in fish. ........................................................................................................................................... ........................................................................................................................................... ........................................................................................................................................... ........................................................................................................................................... ........................................................................................................................................... ..................................................................................................................................... [3] (ii) Local people use water in plastic bottles for drinking. Suggest two environmental impacts of using plastic bottles for drinking. 1 ........................................................................................................................................ ........................................................................................................................................... 2 ........................................................................................................................................ ........................................................................................................................................... [2] (iii) A person living near the mine said: The mining company pays a fine to the government each time the river is contaminated. People living near the mine predict that more river contamination events will occur in the future. Suggest one reason for this prediction. ........................................................................................................................................... ..................................................................................................................................... [1] (h) A student uses a questionnaire to record the views of people living near the mine about the river contamination. Each question is answered yes, no, or do not know. Question one: Do you think paying a fine will stop river contamination in the future? Question two: Do you think the mine should be closed? (i) Draw a tally chart to record the results of this questionnaire. [2] (ii) Describe how the student selects an unbiased sample of people living near the mine using: • random sampling ........................................................................................................... ........................................................................................................................................... • systematic sampling. ...................................................................................................... ........................................................................................................................................... [2] (i) The photograph shows a vicuña in a national park near the mine. vicuña The national park aims to prevent the extinction of the vicuña and several other species of mammal. State three ways national parks prevent loss of biodiversity. 1 ................................................................................................................................................ 2 ................................................................................................................................................ 3 ................................................................................................................................................ [3] [Total: 32]
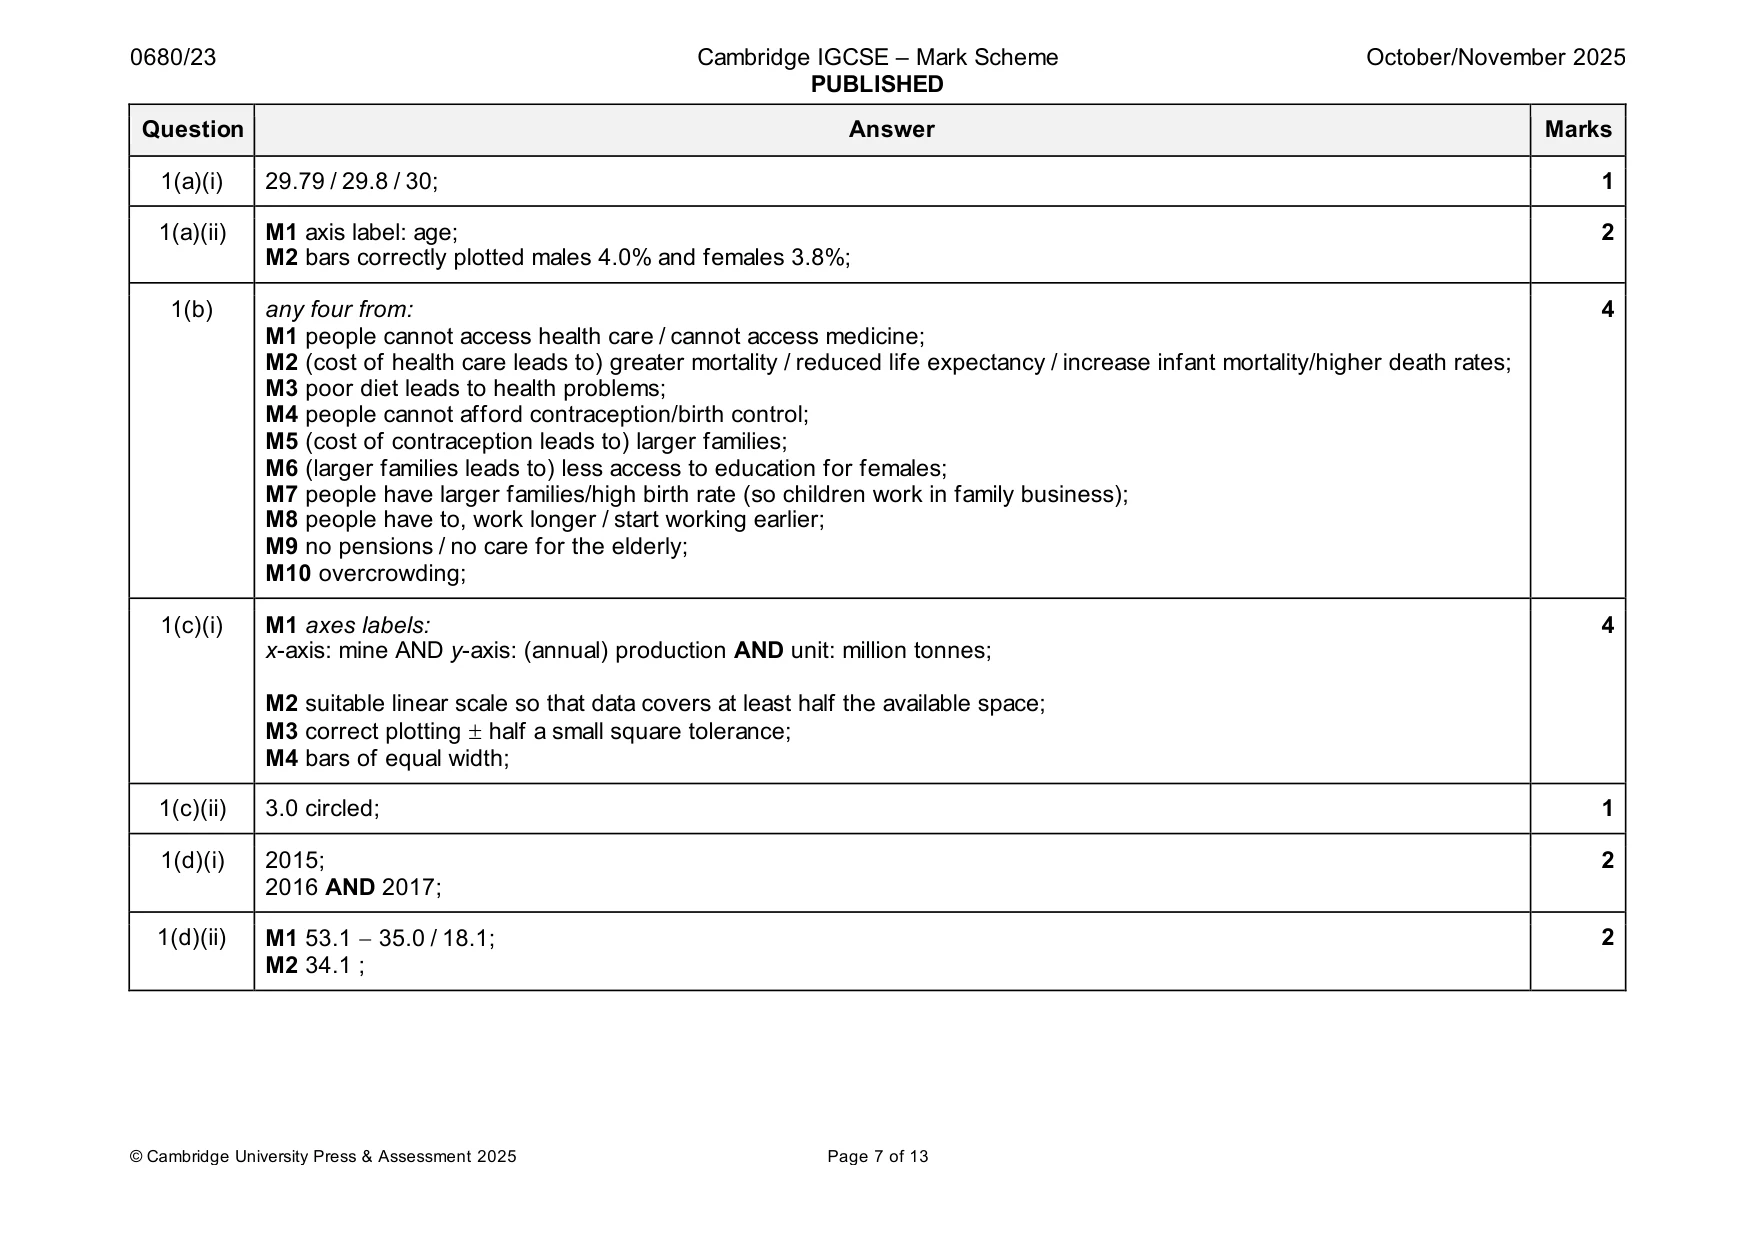
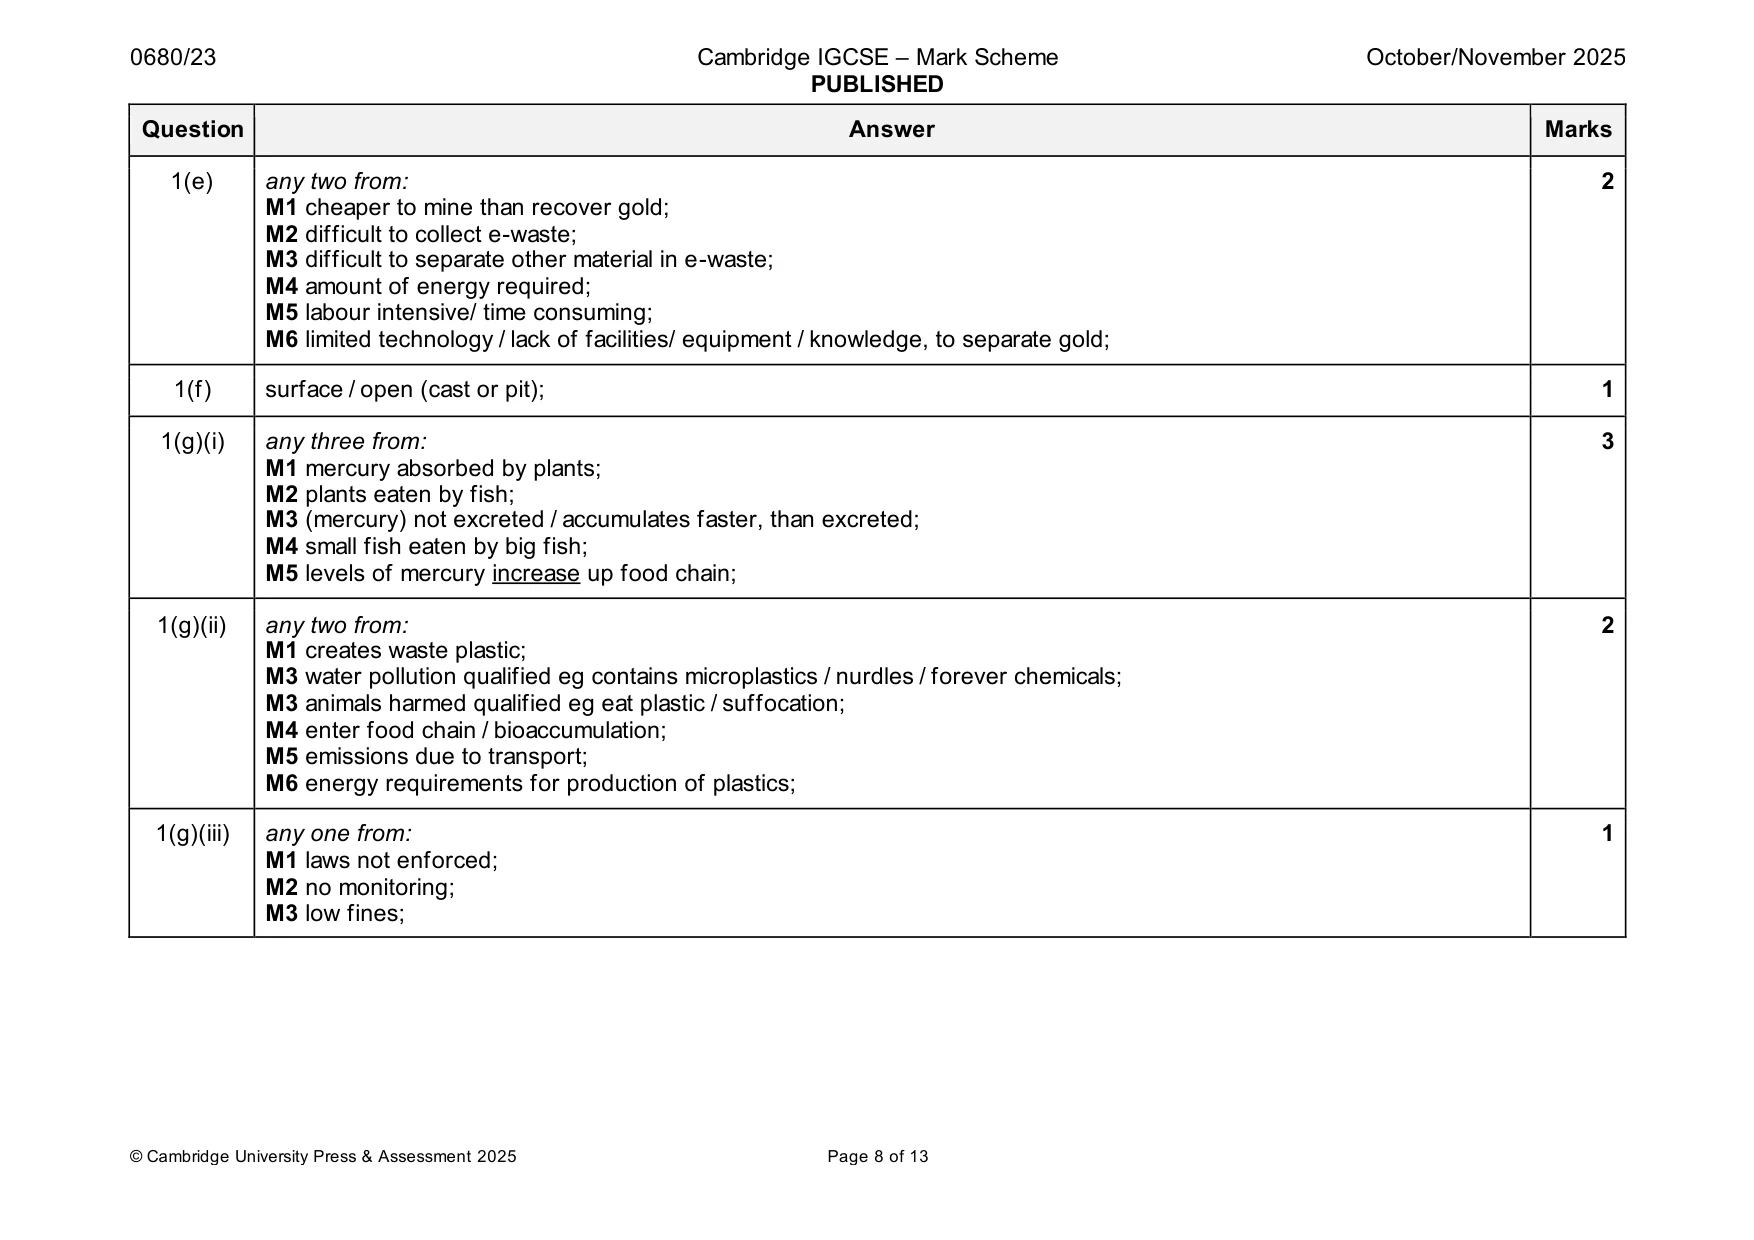
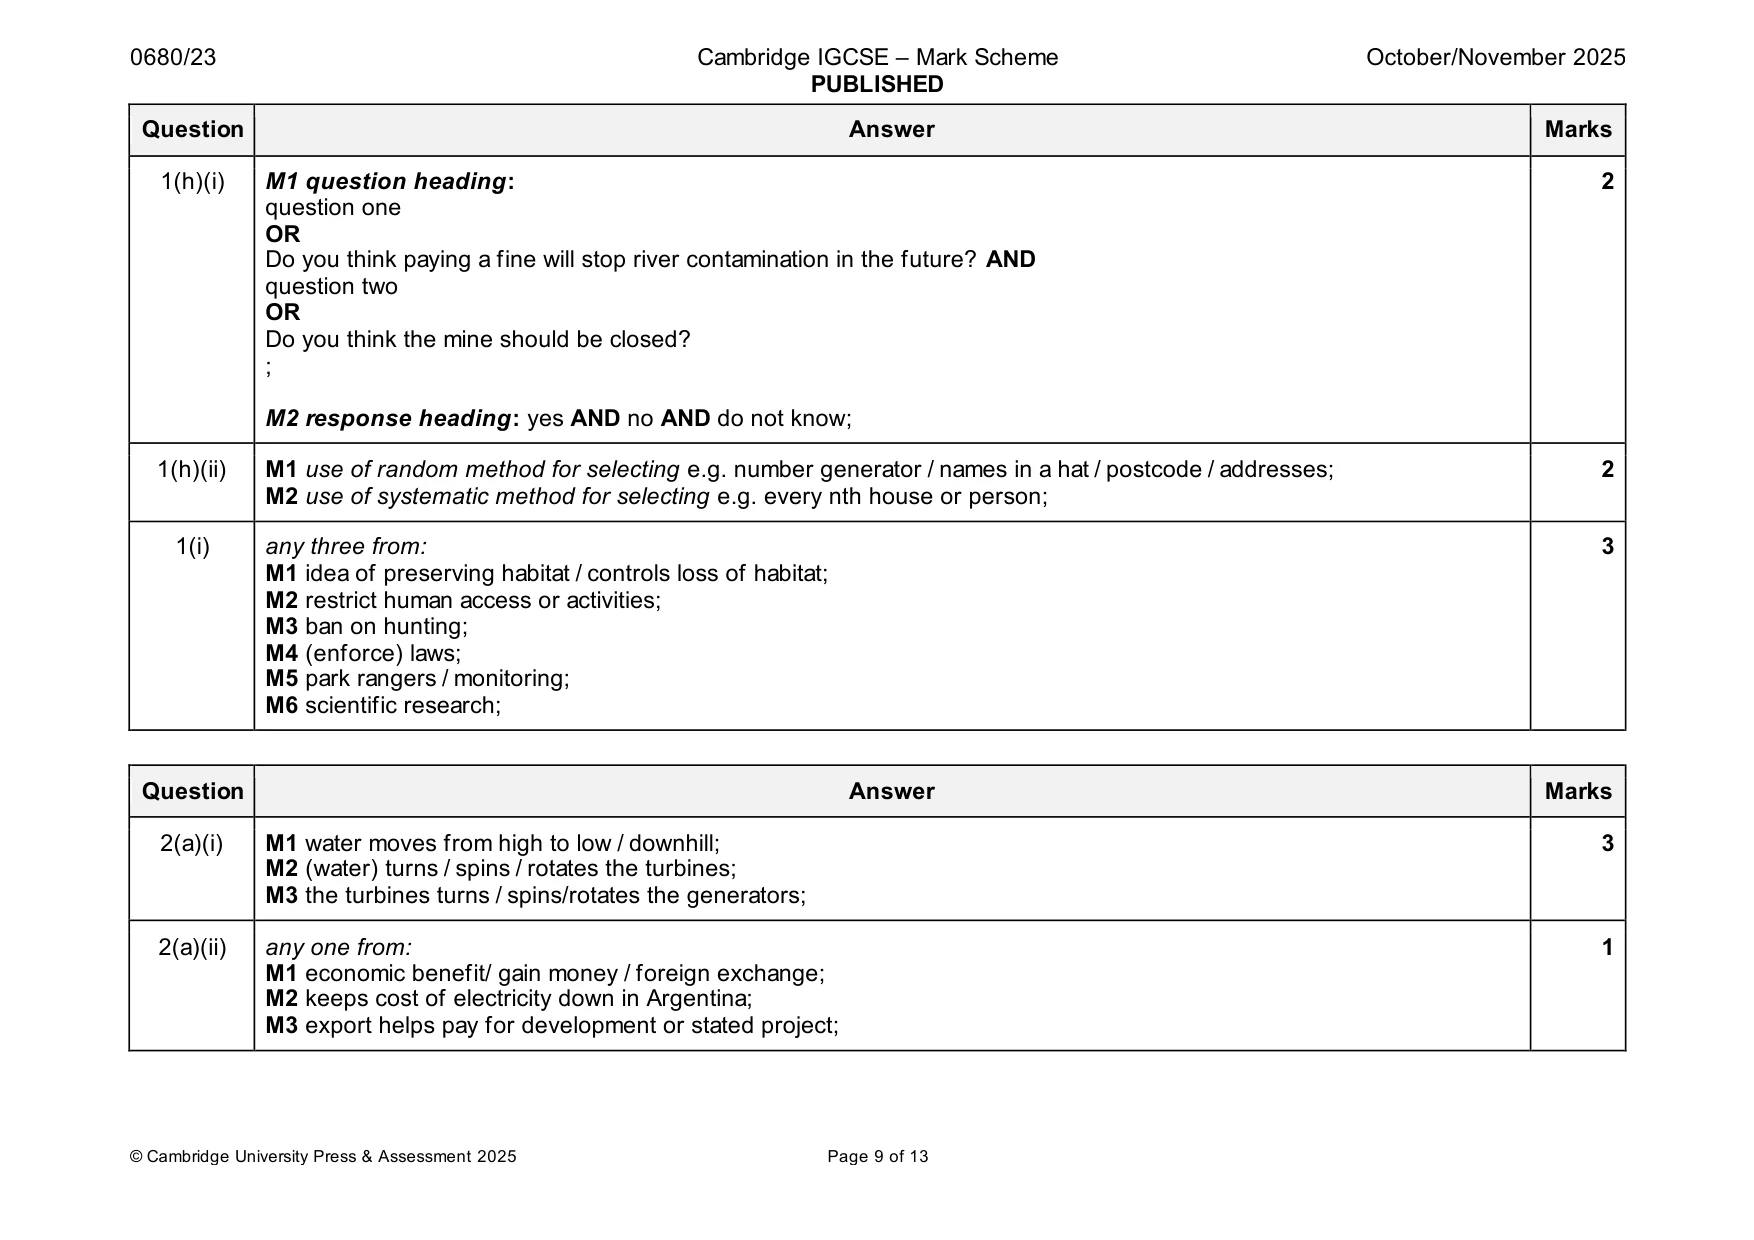
Mark scheme: Question Answer Marks 1(a)(i) 29.79 / 29.8 / 30; 1 1(a)(ii) M1 axis label: age; 2 M2 bars correctly plotted males 4.0% and females 3.8%; 1(b) any four from: 4 M1 people cannot access health care / cannot access medicine; M2 (cost of health care leads to) greater mortality / reduced life expectancy / increase infant mortality/higher death rates; M3 poor diet leads to health problems; M4 people cannot afford contraception/birth control; M5 (cost of contraception leads to) larger families; M6 (larger families leads to) less access to education for females; M7 people have larger families/high birth rate (so children work in family business); M8 people have to, work longer / start working earlier; M9 no pensions / no care for the elderly; M10 overcrowding; 1(c)(i) M1 axes labels: 4 x-axis: mine AND y-axis: (annual) production AND unit: million tonnes; M2 suitable linear scale so that data covers at least half the available space; M3 correct plotting half a small square tolerance; M4 bars of equal width; 1(c)(ii) 3.0 circled; 1 1(d)(i) 2015; 2 2016 AND 2017; 1(d)(ii) M1 53.1 − 35.0 / 18.1; 2 M2 34.1 ; 1(e) any two from: 2 M1 cheaper to mine than recover gold; M2 difficult to collect e-waste; M3 difficult to separate other material in e-waste; M4 amount of energy required; M5 labour intensive/ time consuming; M6 limited technology / lack of facilities/ equipment / knowledge, to separate gold; 1(f) surface / open (cast or pit); 1 1(g)(i) any three from: 3 M1 mercury absorbed by plants; M2 plants eaten by fish; M3 (mercury) not excreted / accumulates faster, than excreted; M4 small fish eaten by big fish; M5 levels of mercury increase up food chain; 1(g)(ii) any two from: 2 M1 creates waste plastic; M3 water pollution qualified eg contains microplastics / nurdles / forever chemicals; M3 animals harmed qualified eg eat plastic / suffocation; M4 enter food chain / bioaccumulation; M5 emissions due to transport; M6 energy requirements for production of plastics; 1(g)(iii) any one from: 1 M1 laws not enforced; M2 no monitoring; M3 low fines; 1(h)(i) M1 question heading: 2 question one OR Do you think paying a fine will stop river contamination in the future? AND question two OR Do you think the mine should be closed? ; M2 response heading: yes AND no AND do not know; 1(h)(ii) M1 use of random method for selecting e.g. number generator / names in a hat / postcode / addresses; 2 M2 use of systematic method for selecting e.g. every nth house or person; 1(i) any three from: 3 M1 idea of preserving habitat / controls loss of habitat; M2 restrict human access or activities; M3 ban on hunting; M4 (enforce) laws; M5 park rangers / monitoring; M6 scientific research;
Q2 · The photograph shows Yacyretá dam
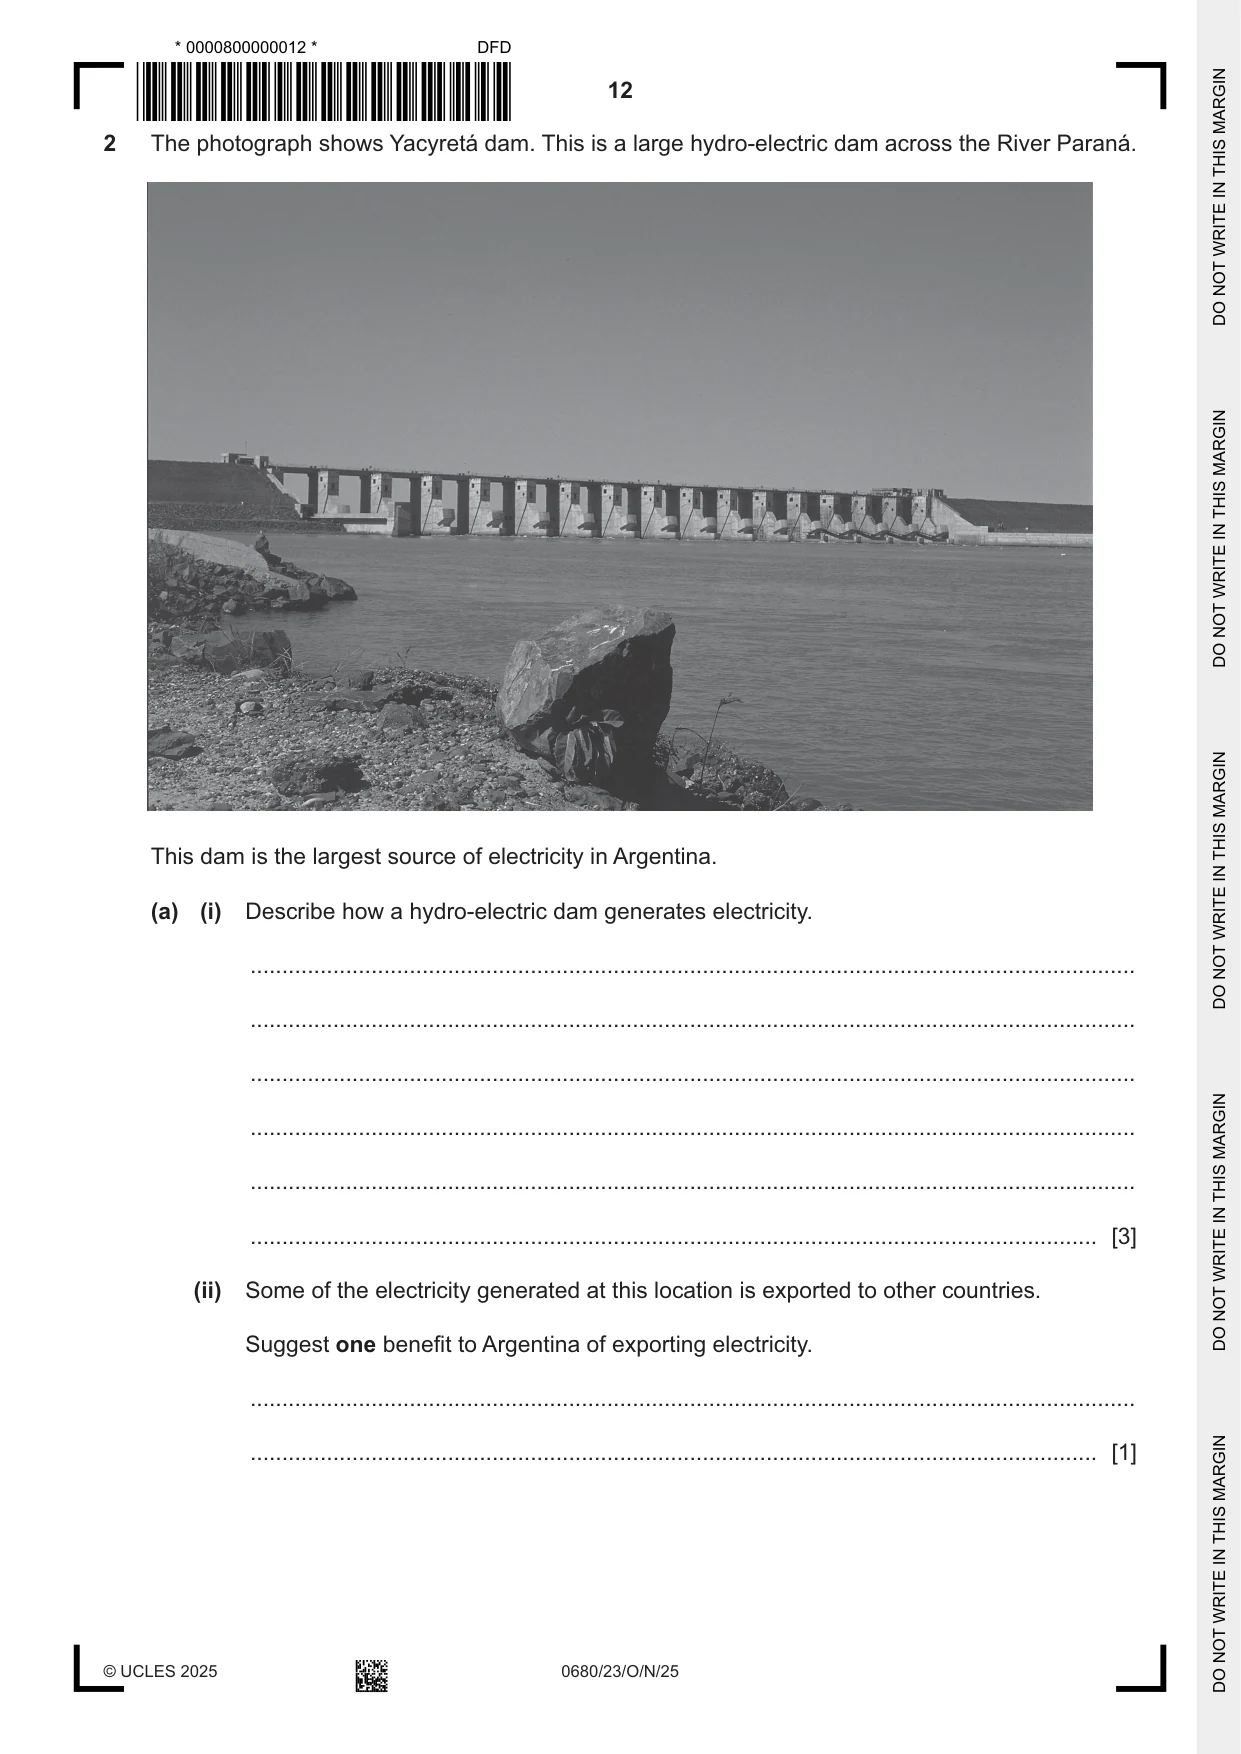
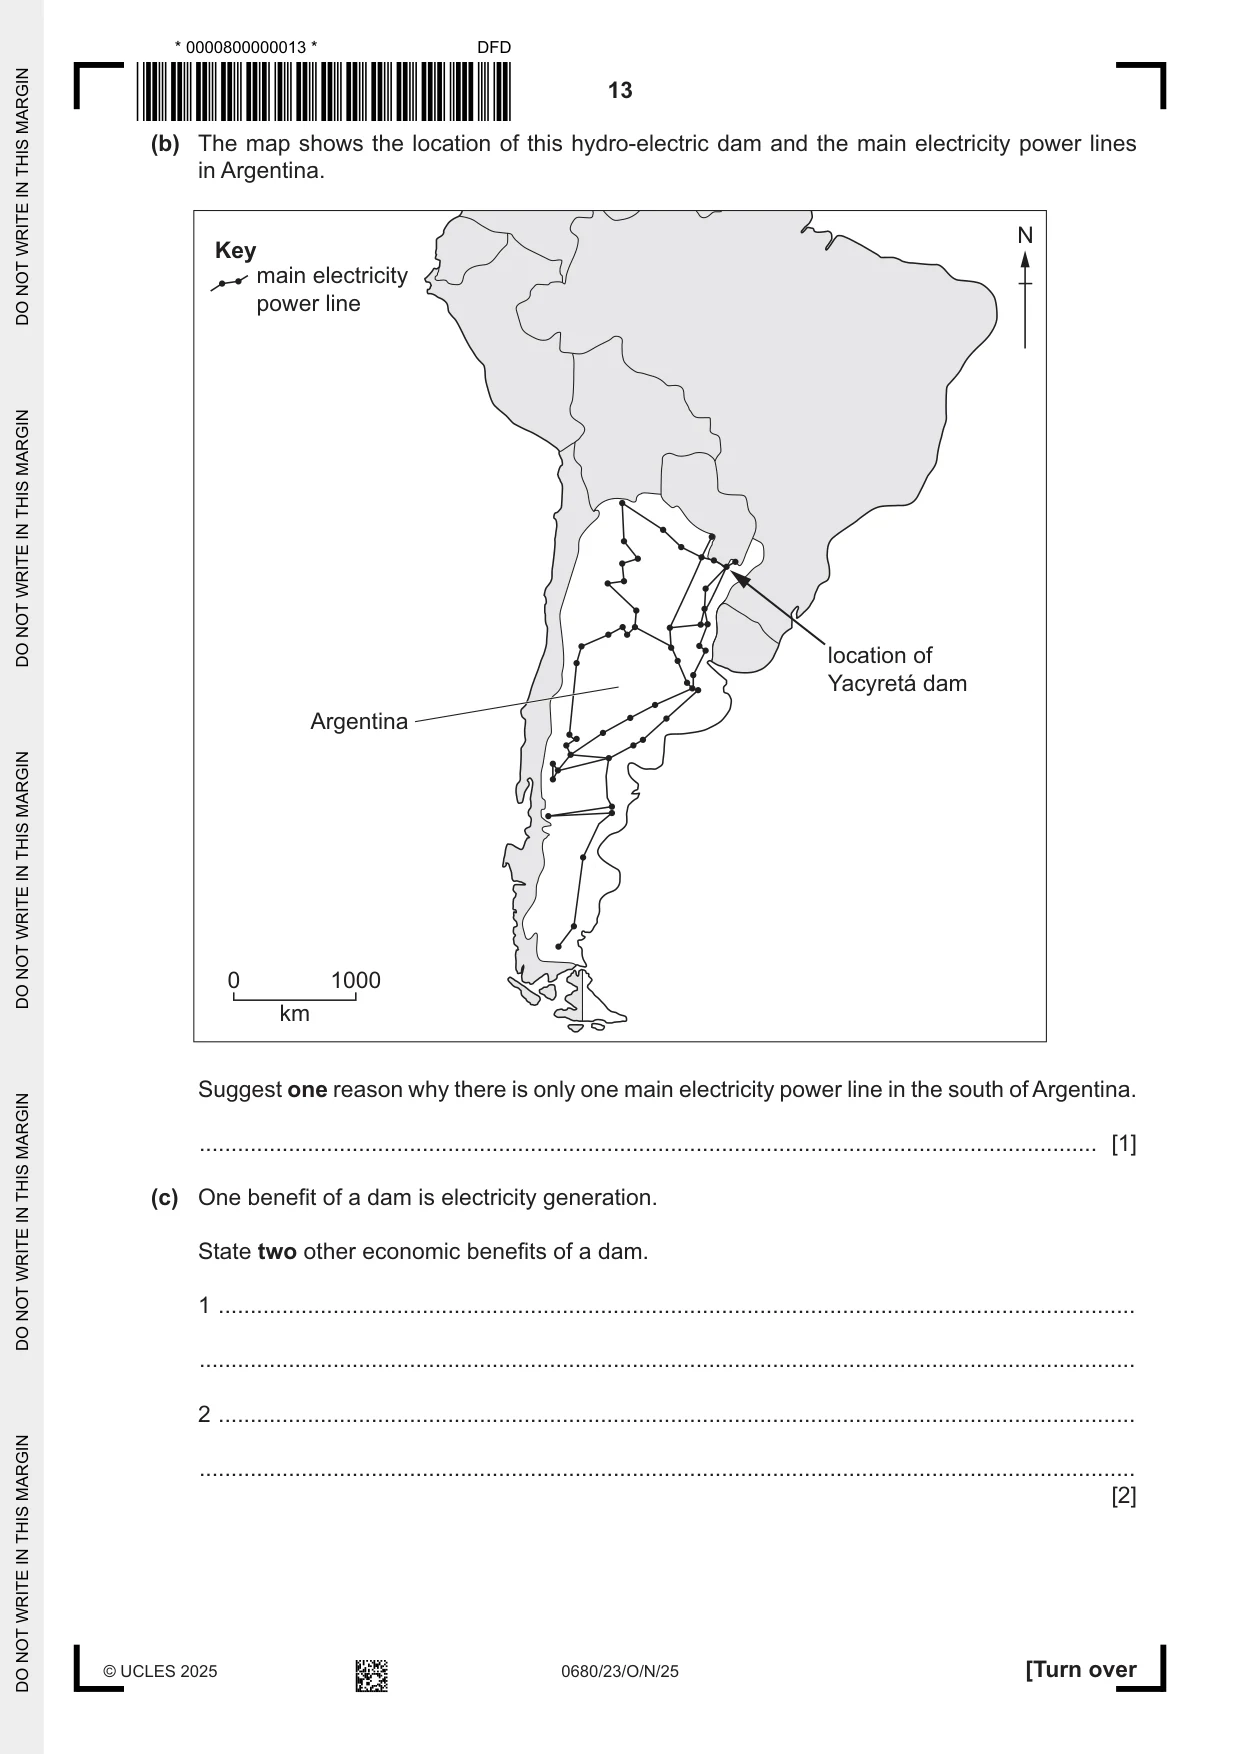
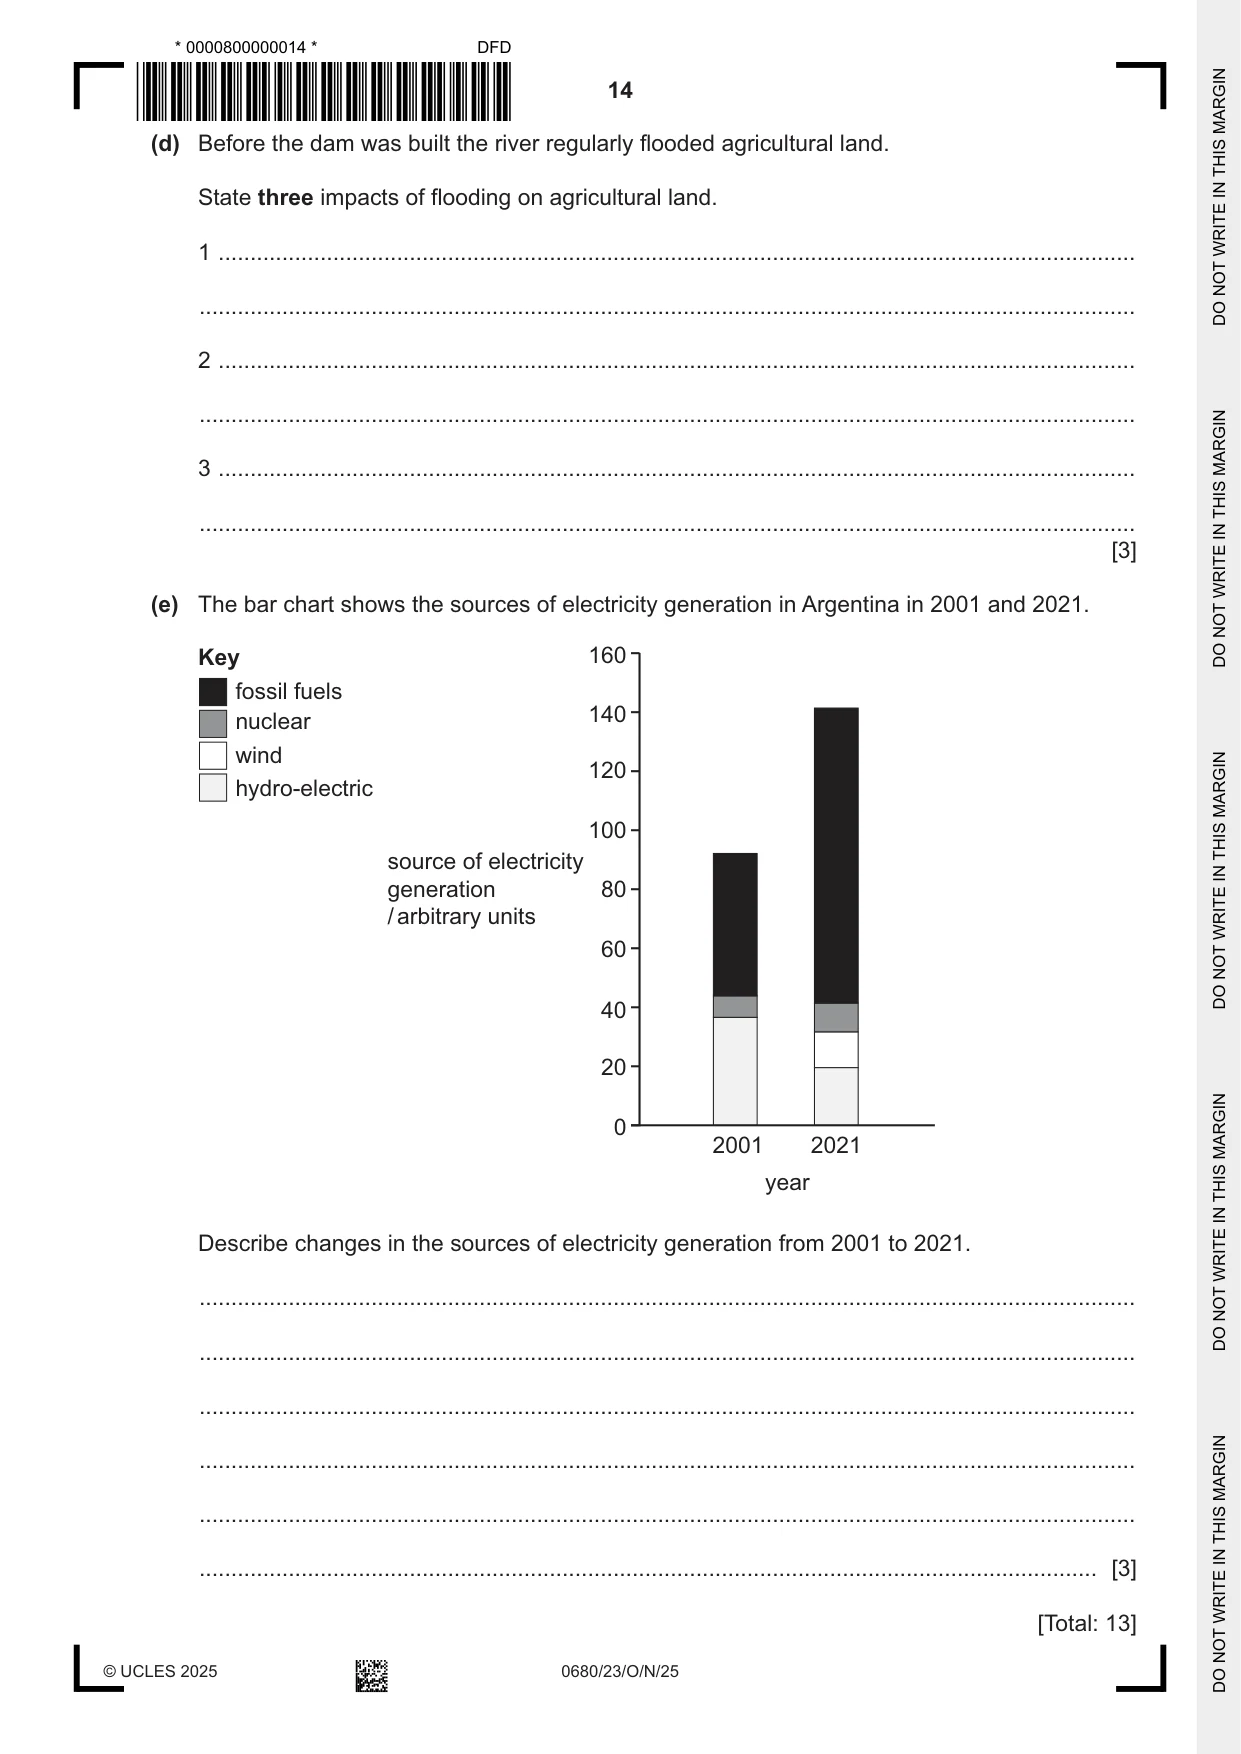
2 The photograph shows Yacyretá dam. This is a large hydro‑electric dam across the River Paraná. This dam is the largest source of electricity in Argentina. (a) (i) Describe how a hydro‑electric dam generates electricity. ........................................................................................................................................... ........................................................................................................................................... ........................................................................................................................................... ........................................................................................................................................... ........................................................................................................................................... ..................................................................................................................................... [3] (ii) Some of the electricity generated at this location is exported to other countries. Suggest one benefit to Argentina of exporting electricity. ........................................................................................................................................... ..................................................................................................................................... [1] (b) The map shows the location of this hydro‑electric dam and the main electricity power lines in Argentina. N Key main electricity power line location of Yacyretá dam Argentina 0 1000 km Suggest one reason why there is only one main electricity power line in the south of Argentina. ............................................................................................................................................. [1] (c) One benefit of a dam is electricity generation. State two other economic benefits of a dam. 1 ................................................................................................................................................ ................................................................................................................................................... 2 ................................................................................................................................................ ................................................................................................................................................... [2] (d) Before the dam was built the river regularly flooded agricultural land. State three impacts of flooding on agricultural land. 1 ................................................................................................................................................ ................................................................................................................................................... 2 ................................................................................................................................................ ................................................................................................................................................... 3 ................................................................................................................................................ ................................................................................................................................................... [3] (e) The bar chart shows the sources of electricity generation in Argentina in 2001 and 2021. Key 160 fossil fuels 140 nuclear wind 120 hydro-electric 100 source of electricity generation 80 / arbitrary units 60 40 20 0 2001 2021 year Describe changes in the sources of electricity generation from 2001 to 2021. ................................................................................................................................................... ................................................................................................................................................... ................................................................................................................................................... ................................................................................................................................................... ................................................................................................................................................... ............................................................................................................................................. [3] [Total: 13]
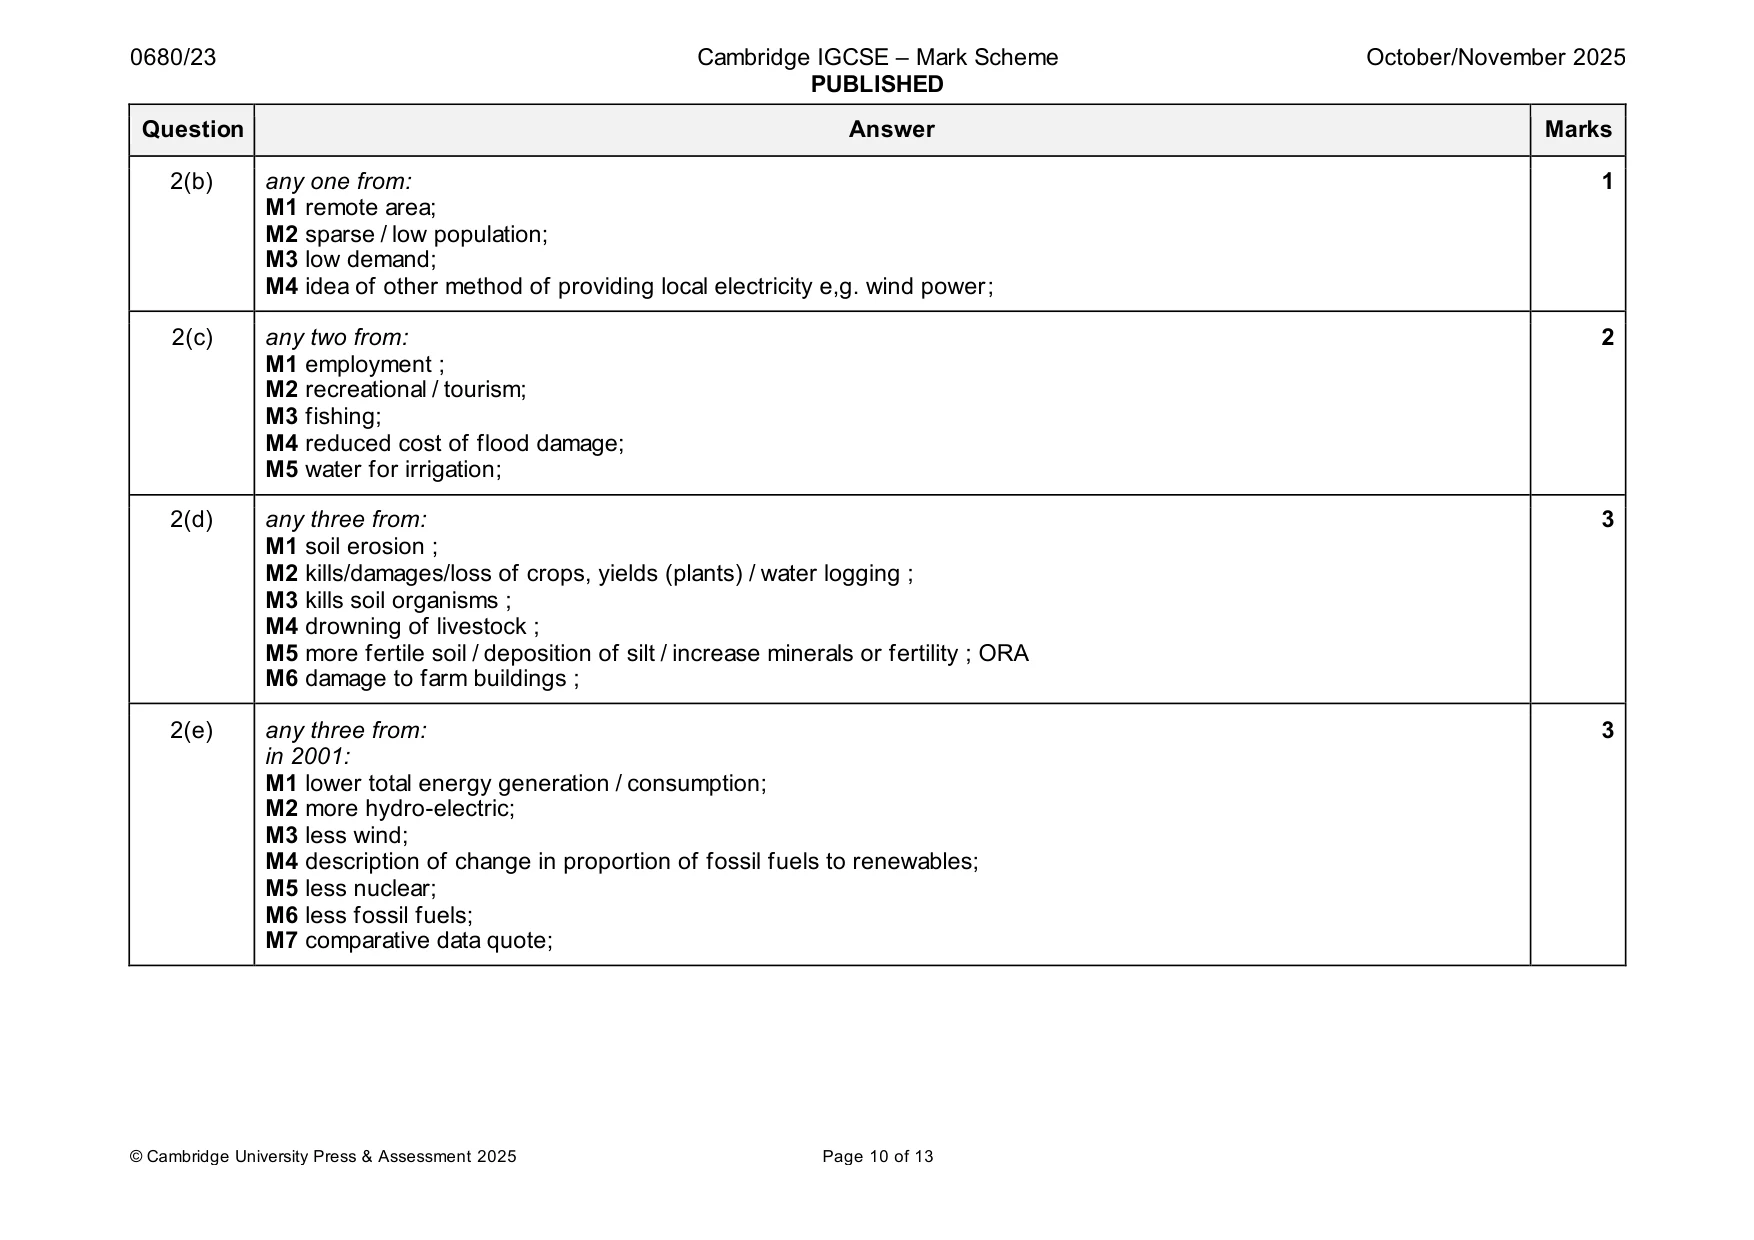
Mark scheme: 2(a)(i) M1 water moves from high to low / downhill; 3 M2 (water) turns / spins / rotates the turbines; M3 the turbines turns / spins/rotates the generators; 2(a)(ii) any one from: 1 M1 economic benefit/ gain money / foreign exchange; M2 keeps cost of electricity down in Argentina; M3 export helps pay for development or stated project; 2(b) any one from: 1 M1 remote area; M2 sparse / low population; M3 low demand; M4 idea of other method of providing local electricity e,g. wind power; 2(c) any two from: 2 M1 employment ; M2 recreational / tourism; M3 fishing; M4 reduced cost of flood damage; M5 water for irrigation; 2(d) any three from: 3 M1 soil erosion ; M2 kills/damages/loss of crops, yields (plants) / water logging ; M3 kills soil organisms ; M4 drowning of livestock ; M5 more fertile soil / deposition of silt / increase minerals or fertility ; ORA M6 damage to farm buildings ; 2(e) any three from: 3 in 2001: M1 lower total energy generation / consumption; M2 more hydro-electric; M3 less wind; M4 description of change in proportion of fossil fuels to renewables; M5 less nuclear; M6 less fossil fuels; M7 comparative data quote;
Q3 · The photograph shows a field of cotton in the north of Argentina
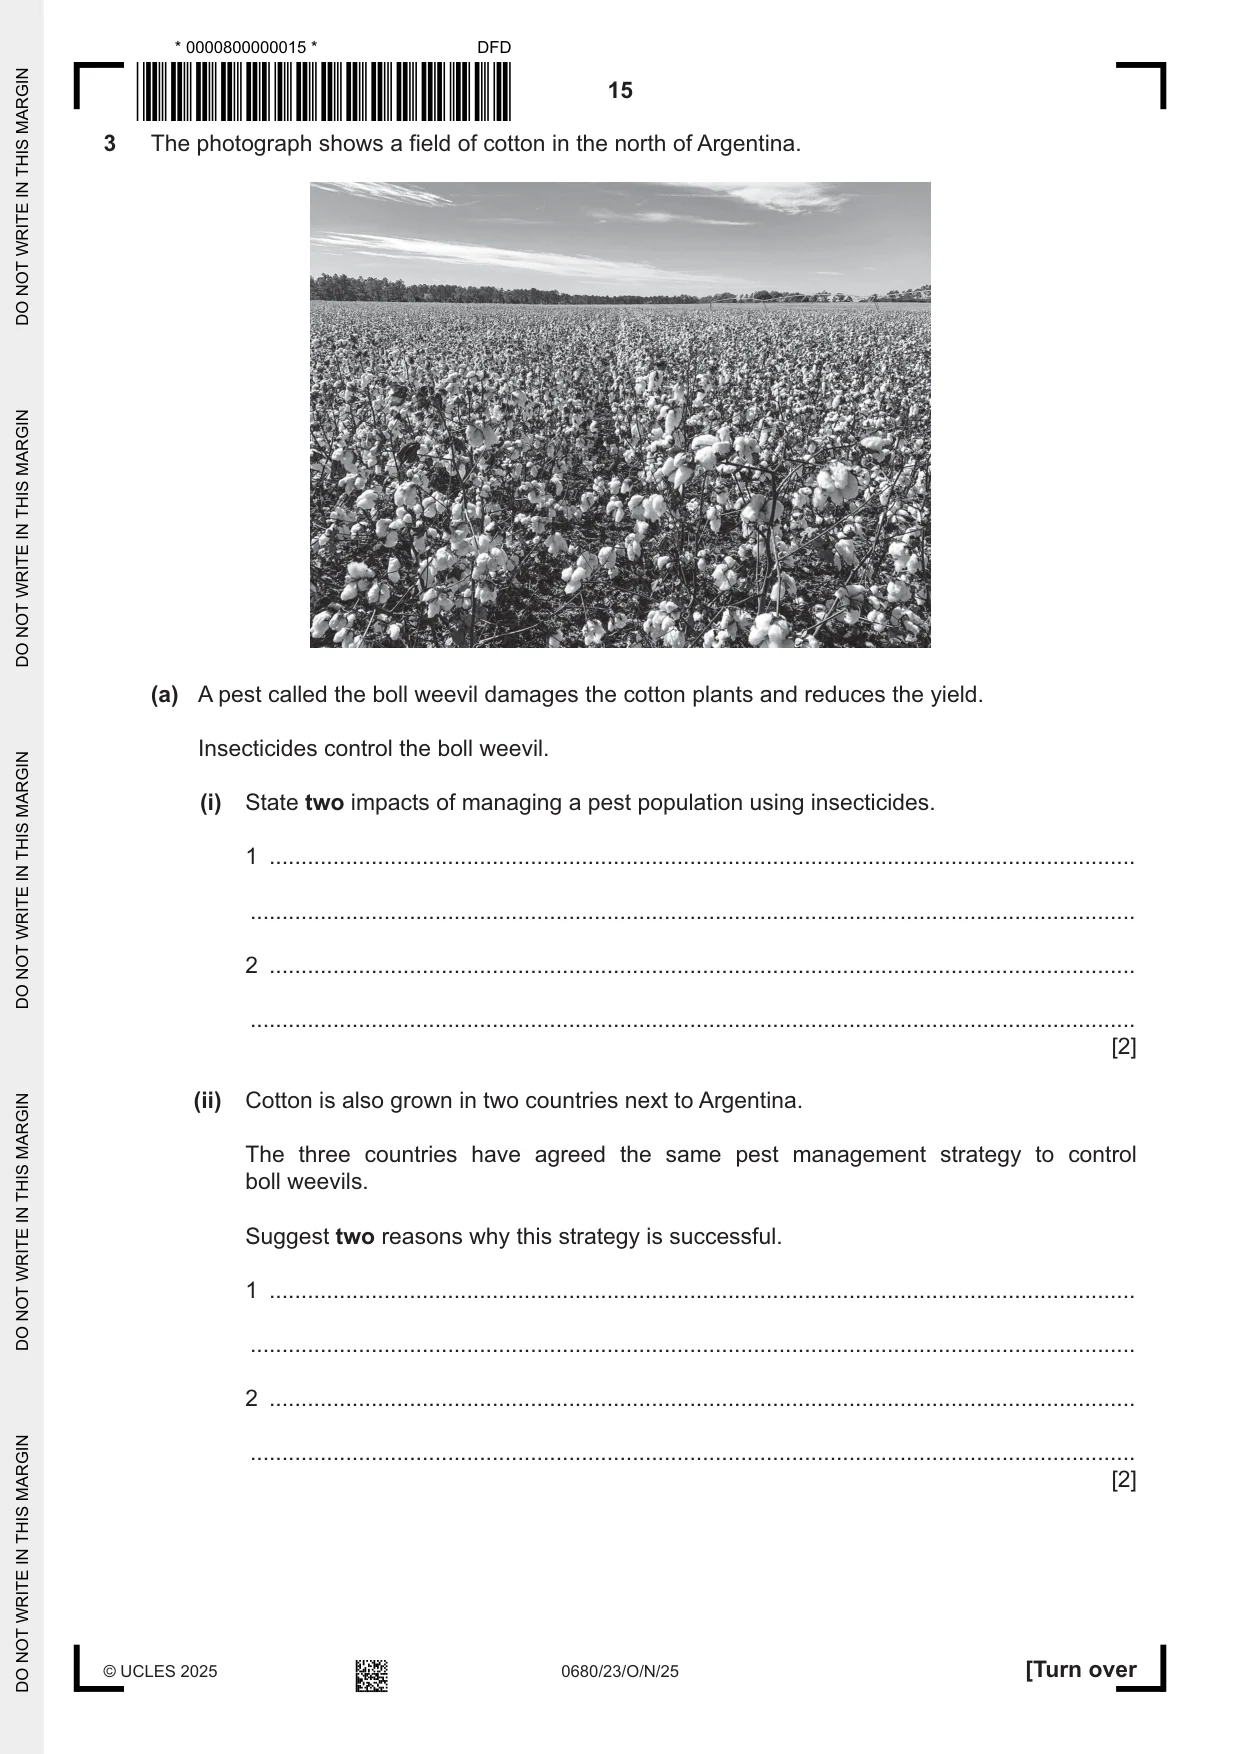
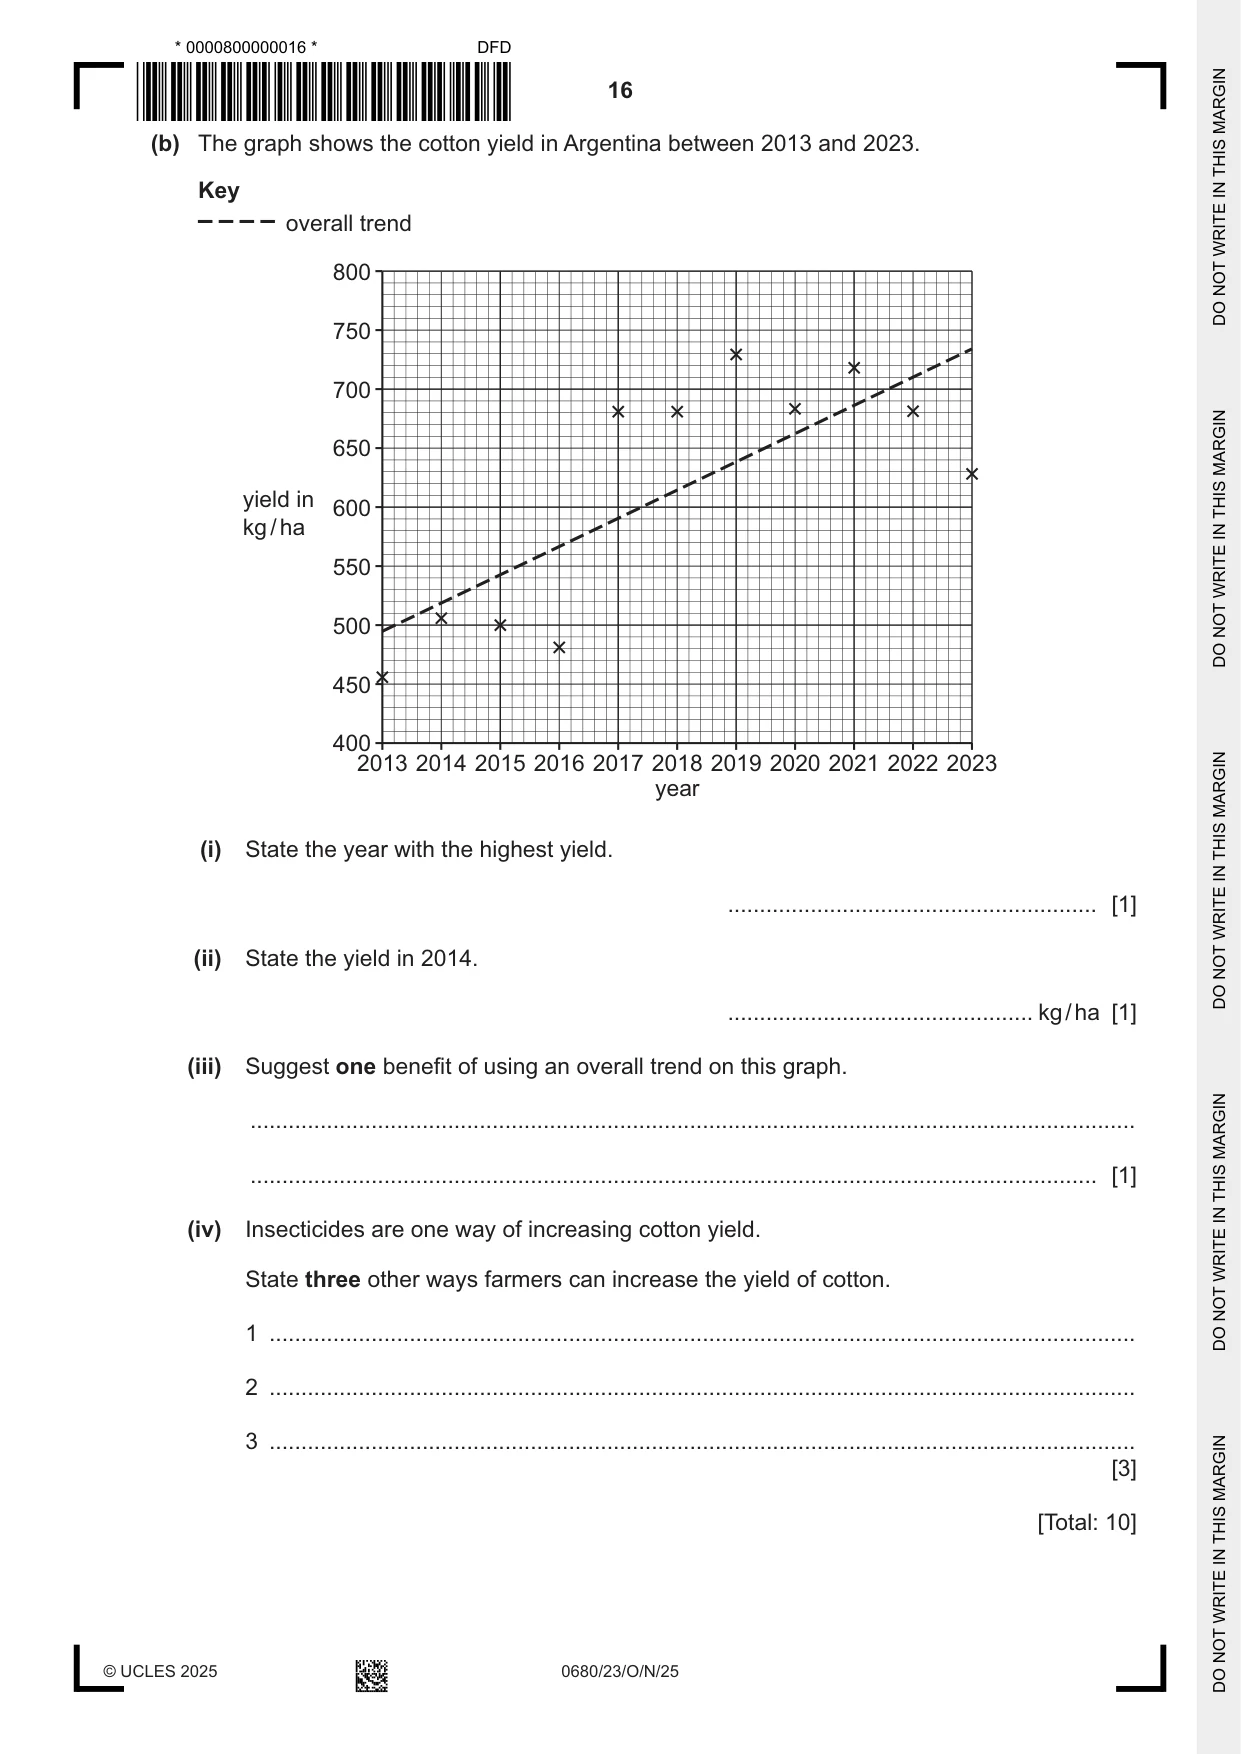
3 The photograph shows a field of cotton in the north of Argentina. (a) A pest called the boll weevil damages the cotton plants and reduces the yield. Insecticides control the boll weevil. (i) State two impacts of managing a pest population using insecticides. 1 ........................................................................................................................................ ........................................................................................................................................... 2 ........................................................................................................................................ ........................................................................................................................................... [2] (ii) Cotton is also grown in two countries next to Argentina. The three countries have agreed the same pest management strategy to control boll weevils. Suggest two reasons why this strategy is successful. 1 ........................................................................................................................................ ........................................................................................................................................... 2 ........................................................................................................................................ ........................................................................................................................................... [2] (b) The graph shows the cotton yield in Argentina between 2013 and 2023. Key overall trend 800 750 700 650 yield in 600 kg / ha 550 500 450 400 2013 2014 2015 2016 2017 2018 2019 2020 2021 2022 2023 year (i) State the year with the highest yield. .......................................................... [1] (ii) State the yield in 2014. ................................................ kg / ha [1] (iii) Suggest one benefit of using an overall trend on this graph. ........................................................................................................................................... ..................................................................................................................................... [1] (iv) Insecticides are one way of increasing cotton yield. State three other ways farmers can increase the yield of cotton. 1 ........................................................................................................................................ 2 ........................................................................................................................................ 3 ........................................................................................................................................ [3] [Total: 10]
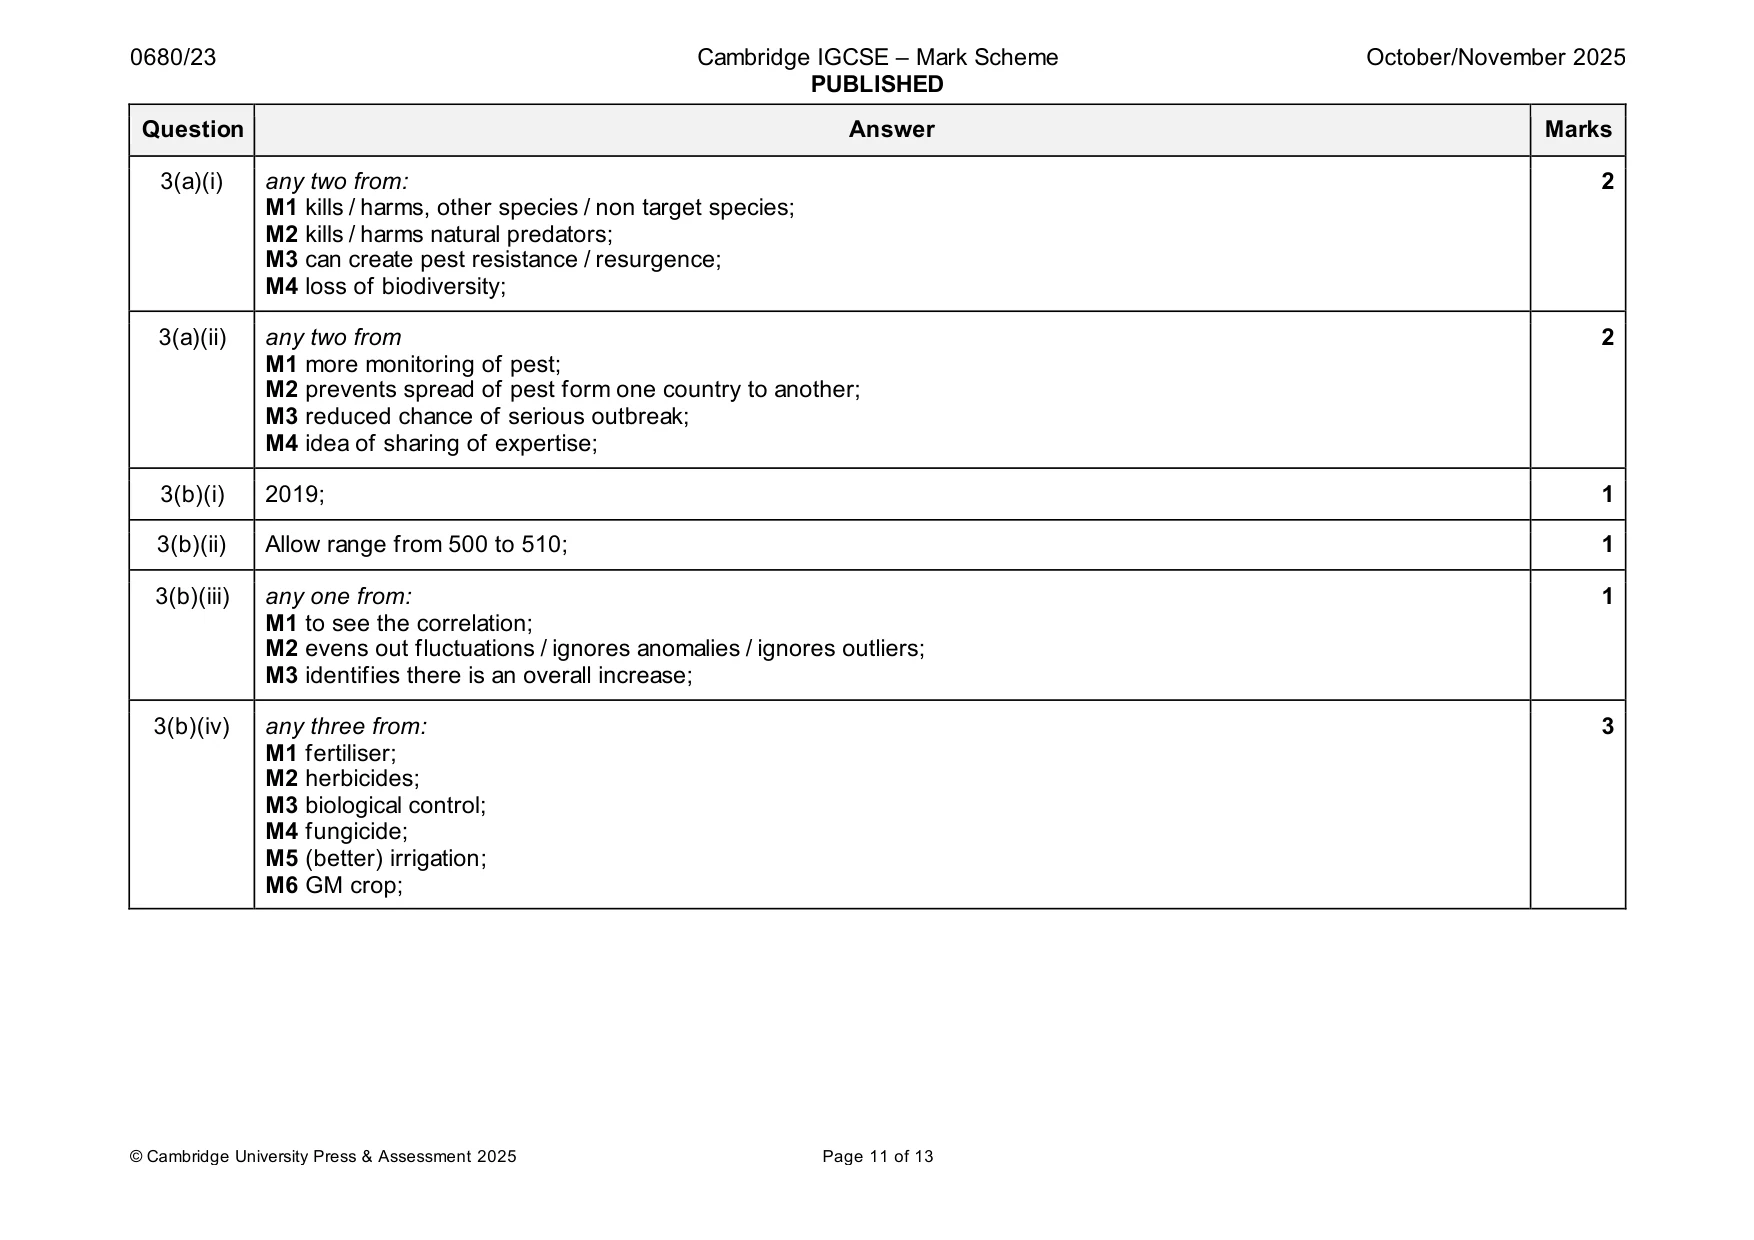
Mark scheme: 3(a)(i) any two from: 2 M1 kills / harms, other species / non target species; M2 kills / harms natural predators; M3 can create pest resistance / resurgence; M4 loss of biodiversity; 3(a)(ii) any two from 2 M1 more monitoring of pest; M2 prevents spread of pest form one country to another; M3 reduced chance of serious outbreak; M4 idea of sharing of expertise; 3(b)(i) 2019; 1 3(b)(ii) Allow range from 500 to 510; 1 3(b)(iii) any one from: 1 M1 to see the correlation; M2 evens out fluctuations / ignores anomalies / ignores outliers; M3 identifies there is an overall increase; 3(b)(iv) any three from: 3 M1 fertiliser; M2 herbicides; M3 biological control; M4 fungicide; M5 (better) irrigation; M6 GM crop;
Q4 · Soybeans are grown in Argentina as a cash crop
4 (a) Soybeans are grown in Argentina as a cash crop. In 2016, 60 million tonnes of soybeans were produced. In 2023, only 27 million tonnes of soybeans were produced. Explain the economic impacts of this reduction in soybean production. ................................................................................................................................................... ................................................................................................................................................... ................................................................................................................................................... ................................................................................................................................................... ................................................................................................................................................... ............................................................................................................................................. [3] (b) In 2023, rainfall was below average in Argentina. This caused drought conditions in large areas of the country. (i) Complete the sentence. One cause of below average rainfall is prolonged .............................. atmospheric .............................. . [2] (ii) Describe ways the impacts of drought can be managed. ........................................................................................................................................... ........................................................................................................................................... ........................................................................................................................................... ........................................................................................................................................... ........................................................................................................................................... ........................................................................................................................................... ........................................................................................................................................... ..................................................................................................................................... [4] [Total: 9]
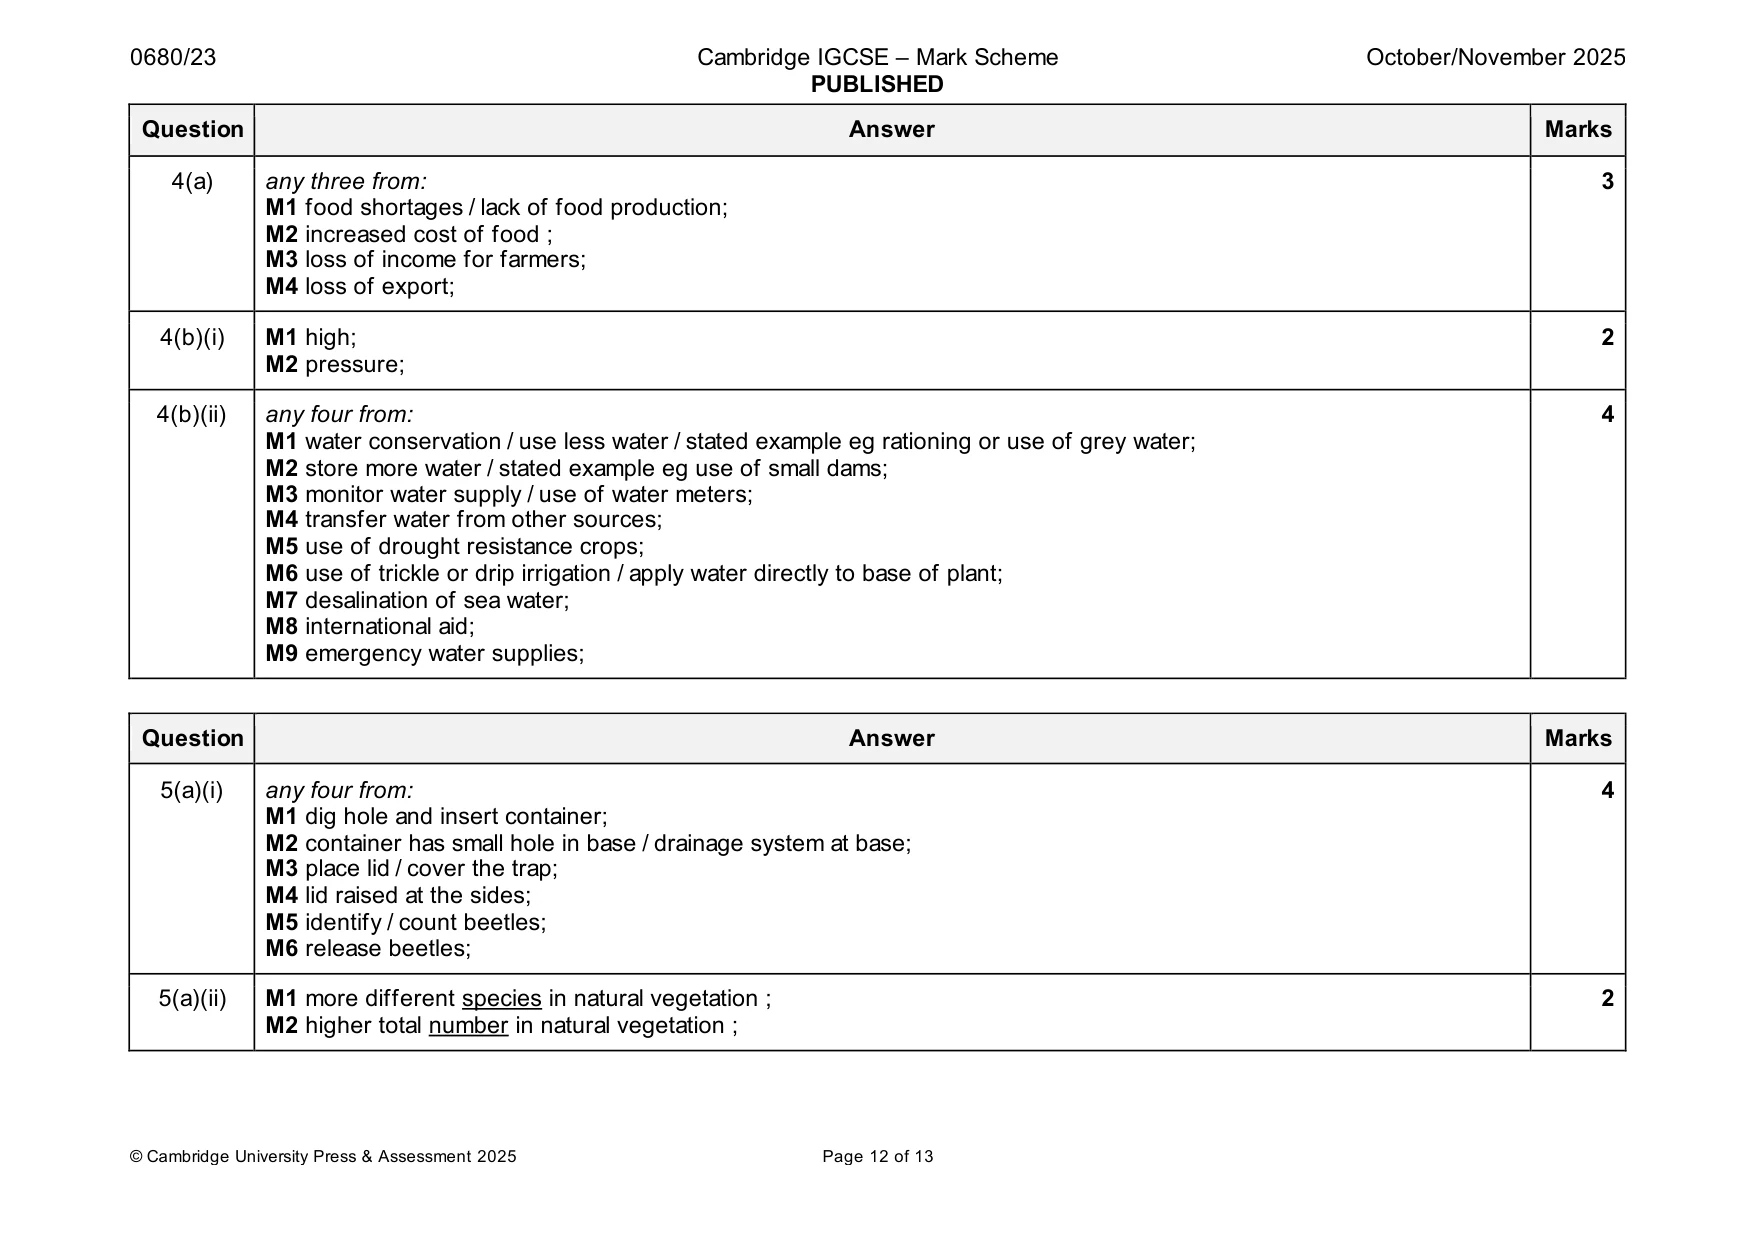
Mark scheme: 4(a) any three from: 3 M1 food shortages / lack of food production; M2 increased cost of food ; M3 loss of income for farmers; M4 loss of export; 4(b)(i) M1 high; 2 M2 pressure; 4(b)(ii) any four from: 4 M1 water conservation / use less water / stated example eg rationing or use of grey water; M2 store more water / stated example eg use of small dams; M3 monitor water supply / use of water meters; M4 transfer water from other sources; M5 use of drought resistance crops; M6 use of trickle or drip irrigation / apply water directly to base of plant; M7 desalination of sea water; M8 international aid; M9 emergency water supplies;
Q5 · The north‑west region of Argentina is very dry
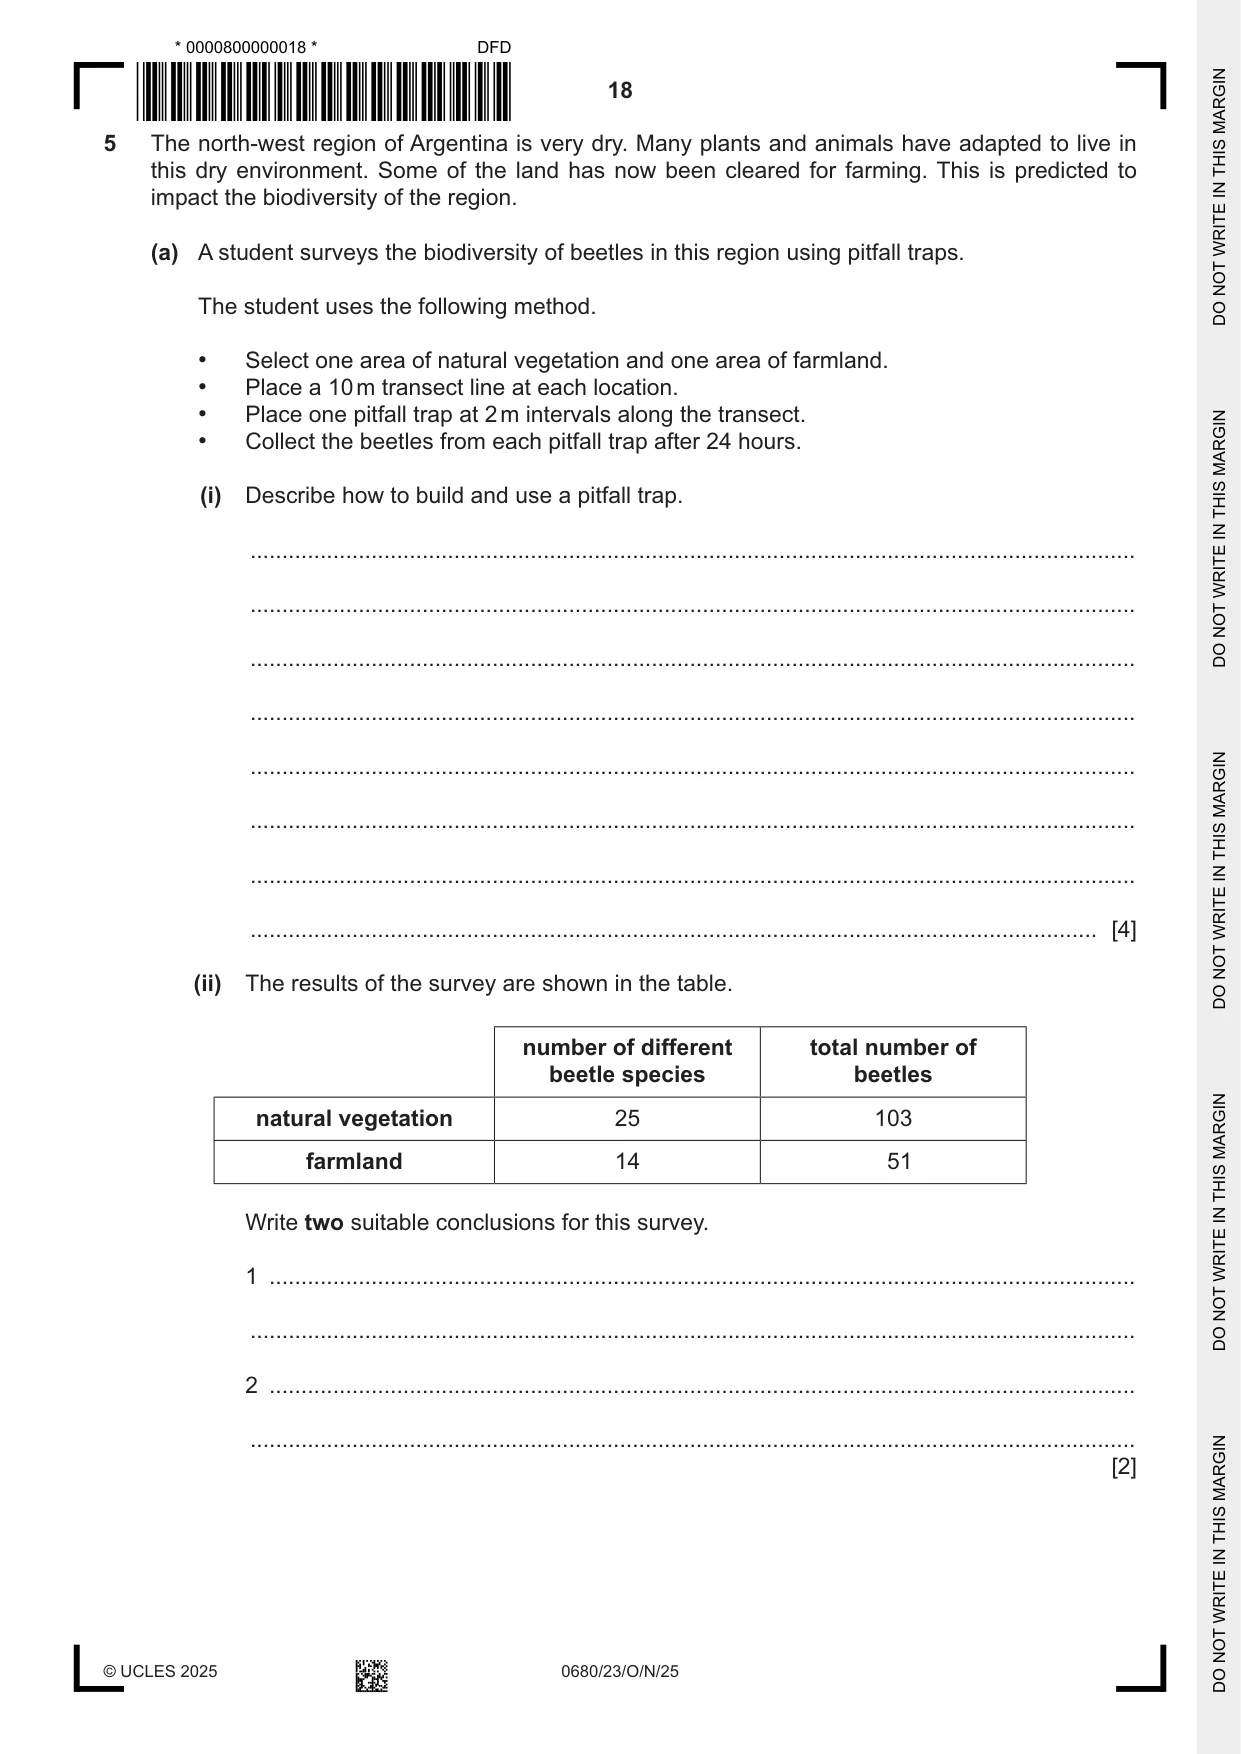
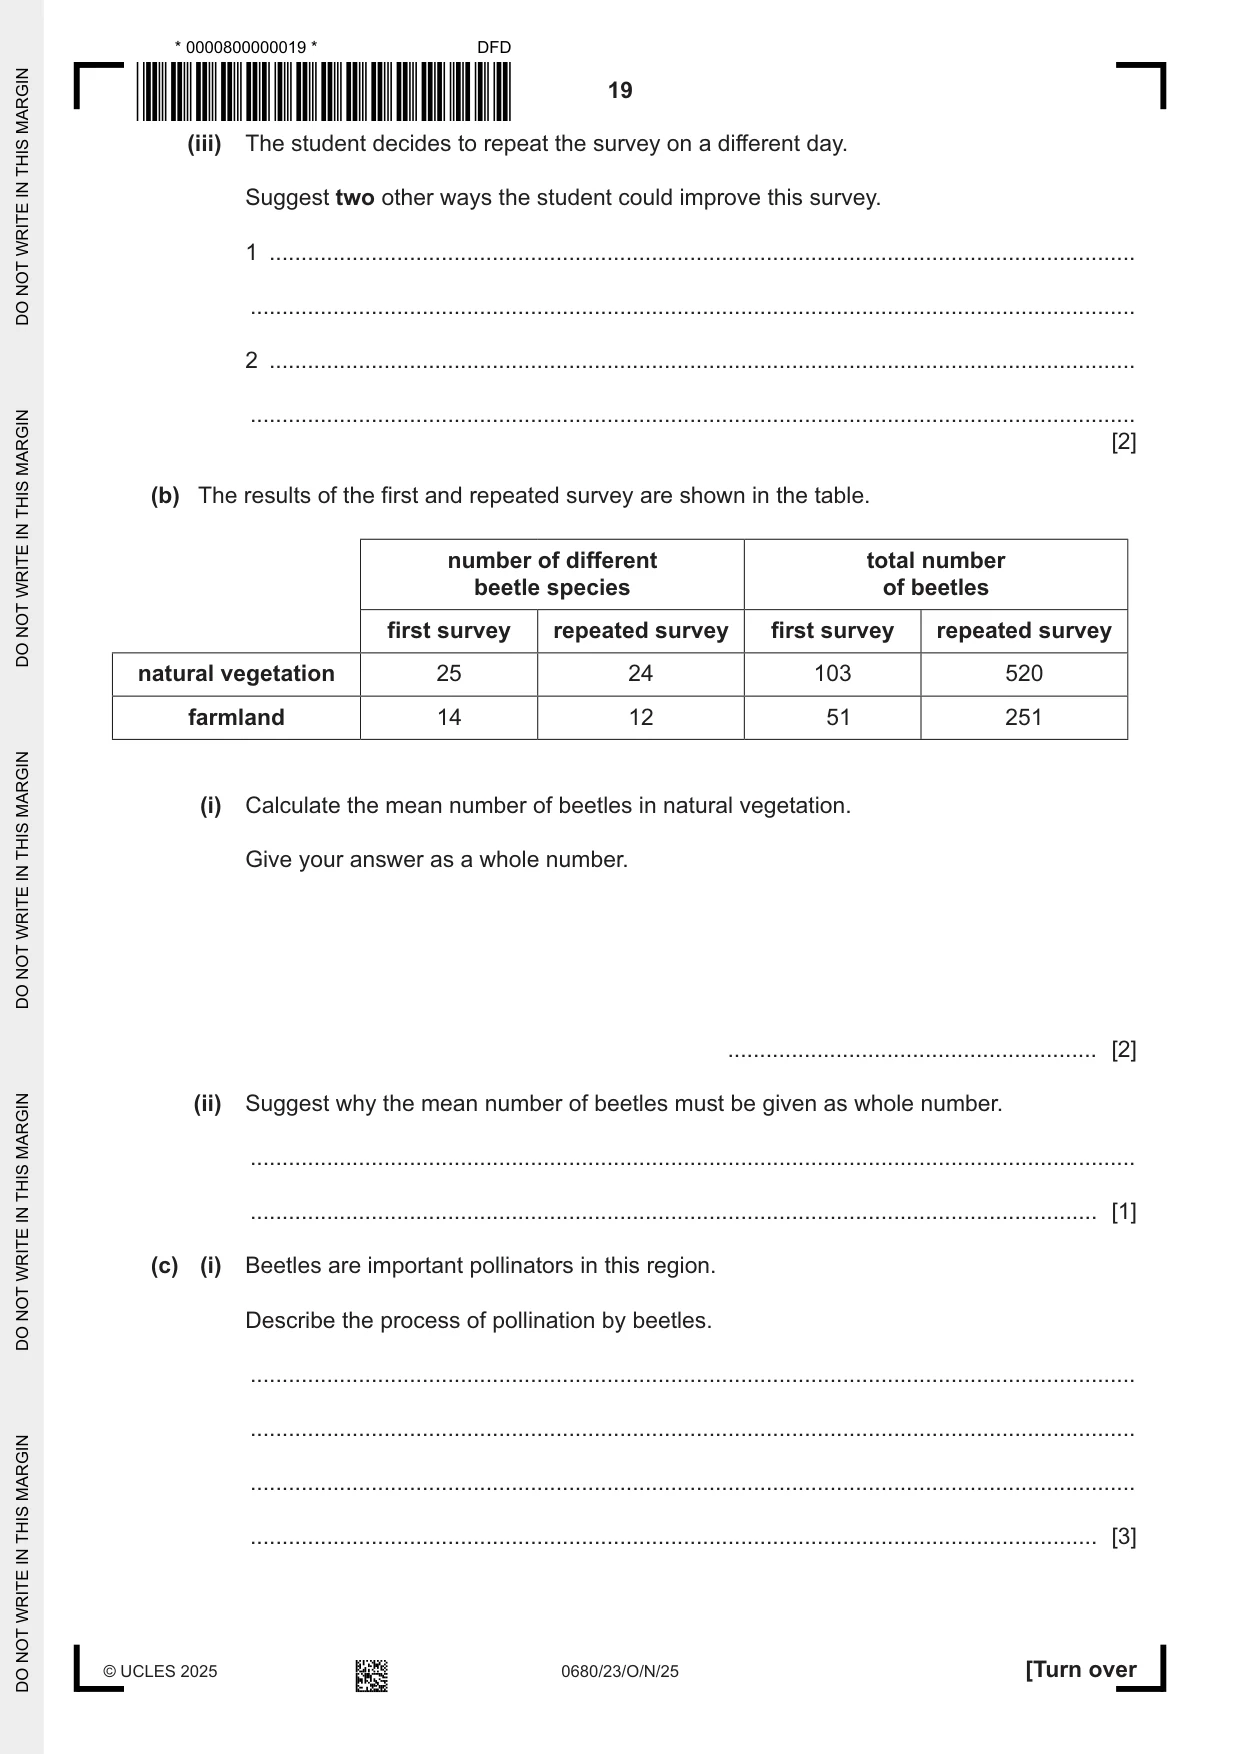
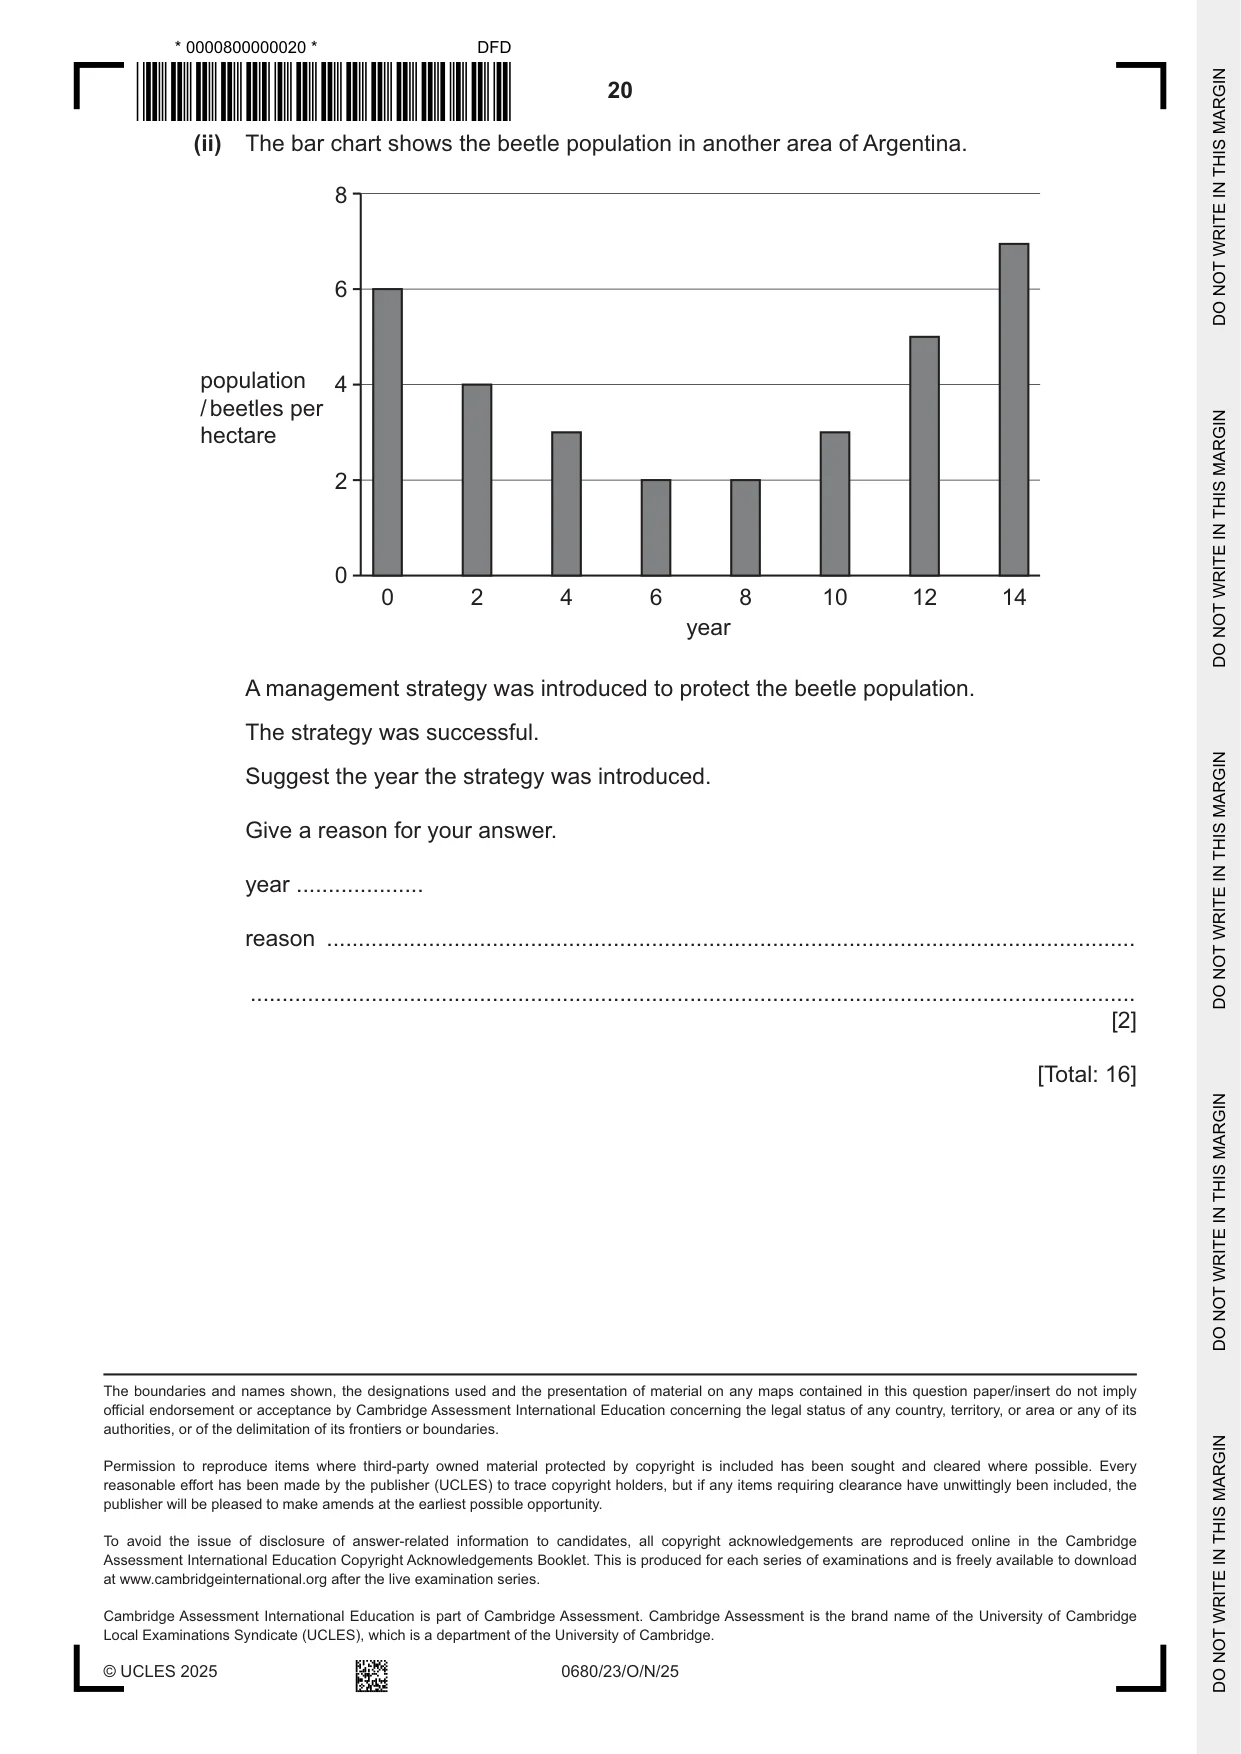
5 The north‑west region of Argentina is very dry. Many plants and animals have adapted to live in this dry environment. Some of the land has now been cleared for farming. This is predicted to impact the biodiversity of the region. (a) A student surveys the biodiversity of beetles in this region using pitfall traps. The student uses the following method. • Select one area of natural vegetation and one area of farmland. • Place a 10 m transect line at each location. • Place one pitfall trap at 2 m intervals along the transect. • Collect the beetles from each pitfall trap after 24 hours. (i) Describe how to build and use a pitfall trap. ........................................................................................................................................... ........................................................................................................................................... ........................................................................................................................................... ........................................................................................................................................... ........................................................................................................................................... ........................................................................................................................................... ........................................................................................................................................... ..................................................................................................................................... [4] (ii) The results of the survey are shown in the table. number of different total number of beetle species beetles natural vegetation 25 103 farmland 14 51 Write two suitable conclusions for this survey. 1 ........................................................................................................................................ ........................................................................................................................................... 2 ........................................................................................................................................ ........................................................................................................................................... [2] (iii) The student decides to repeat the survey on a different day. Suggest two other ways the student could improve this survey. 1 ........................................................................................................................................ ........................................................................................................................................... 2 ........................................................................................................................................ ........................................................................................................................................... [2] (b) The results of the first and repeated survey are shown in the table. number of different total number beetle species of beetles first survey repeated survey first survey repeated survey natural vegetation 25 24 103 520 farmland 14 12 51 251 (i) Calculate the mean number of beetles in natural vegetation. Give your answer as a whole number. .......................................................... [2] (ii) Suggest why the mean number of beetles must be given as whole number. ........................................................................................................................................... ..................................................................................................................................... [1] (c) (i) Beetles are important pollinators in this region. Describe the process of pollination by beetles. ........................................................................................................................................... ........................................................................................................................................... ........................................................................................................................................... ..................................................................................................................................... [3] (ii) The bar chart shows the beetle population in another area of Argentina. 8 6 population 4 / beetles per hectare 2 0 0 2 4 6 8 10 12 14 year A management strategy was introduced to protect the beetle population. The strategy was successful. Suggest the year the strategy was introduced. Give a reason for your answer. year .................... reason ............................................................................................................................... ........................................................................................................................................... [2] [Total: 16] The boundaries and names shown, the designations used and the presentation of material on any maps contained in this question paper/insert do not imply official endorsement or acceptance by Cambridge Assessment International Education concerning the legal status of any country, territory, or area or any of its authorities, or of the delimitation of its frontiers or boundaries.
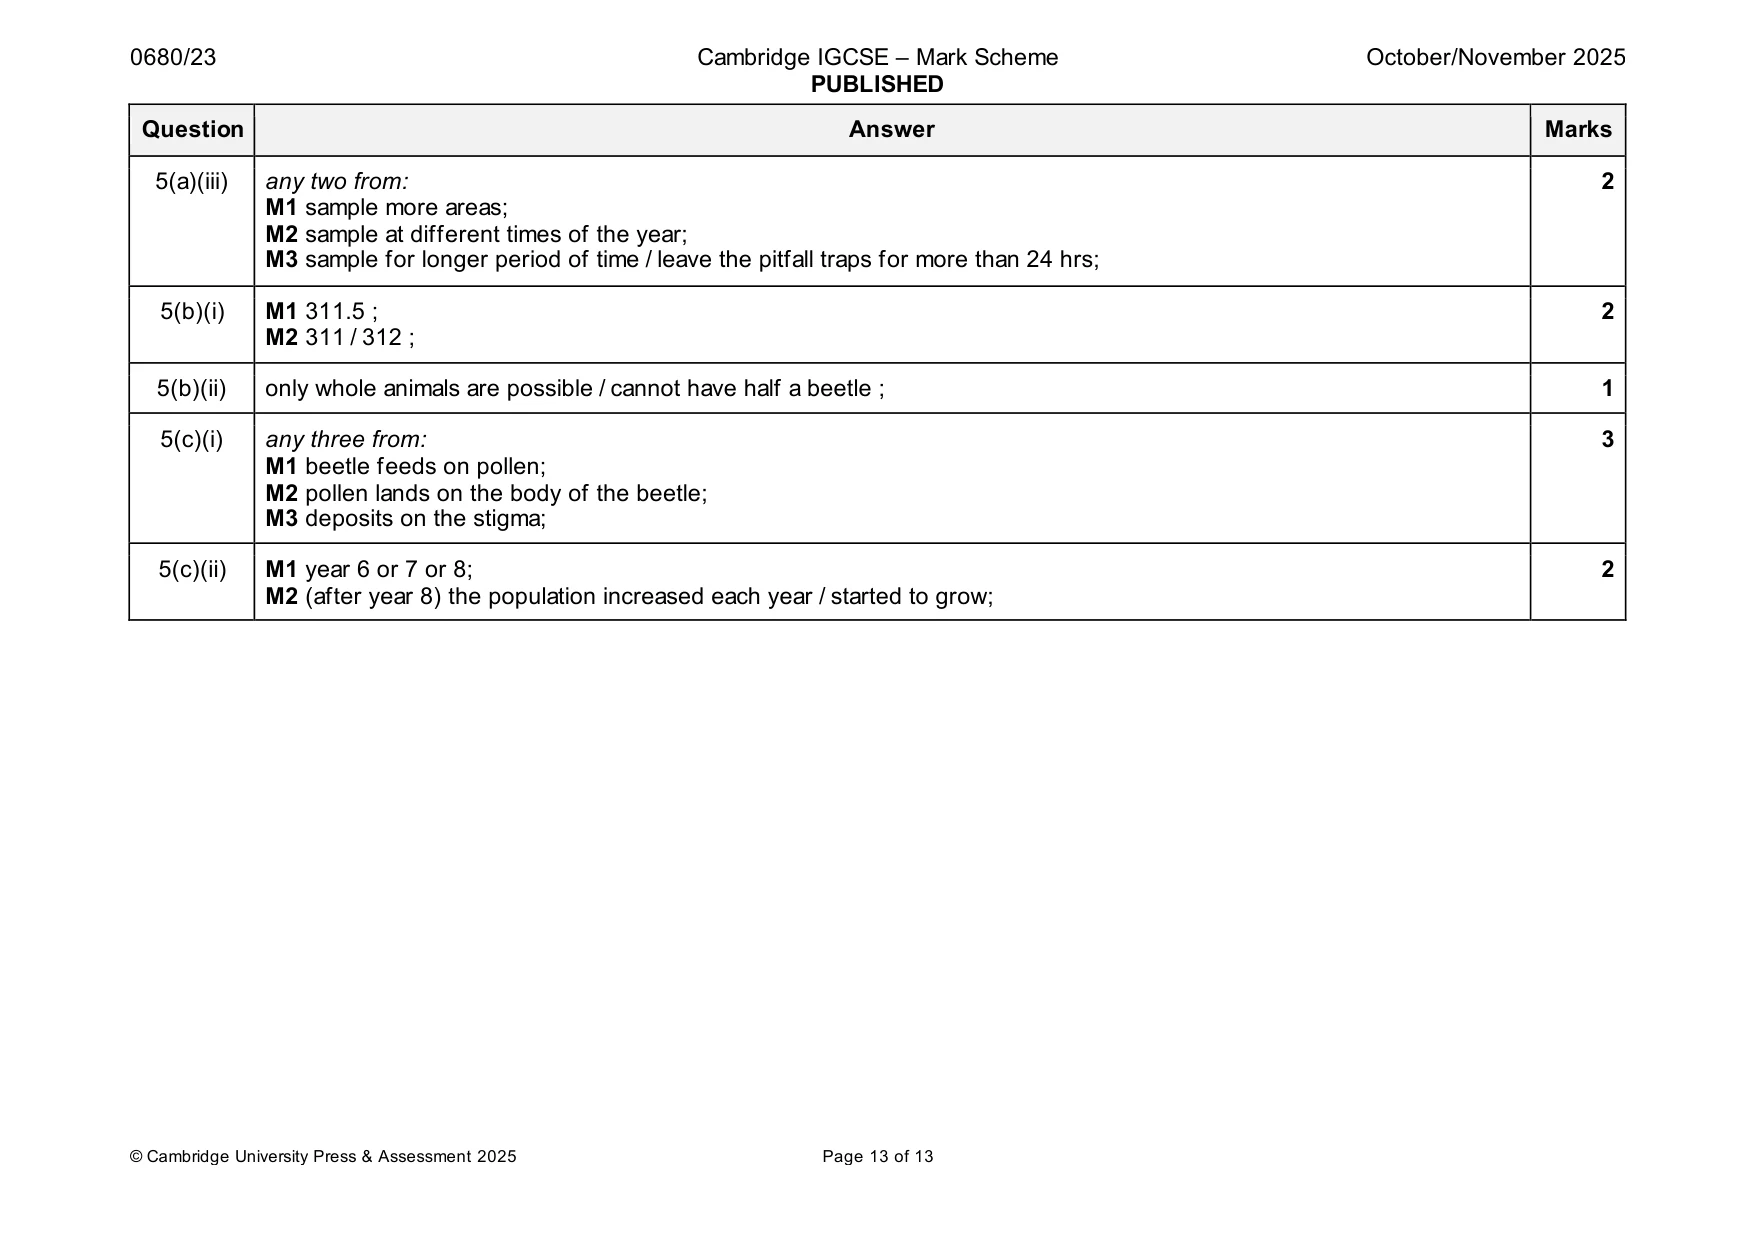
Mark scheme: 5(a)(i) any four from: 4 M1 dig hole and insert container; M2 container has small hole in base / drainage system at base; M3 place lid / cover the trap; M4 lid raised at the sides; M5 identify / count beetles; M6 release beetles; 5(a)(ii) M1 more different species in natural vegetation ; 2 M2 higher total number in natural vegetation ; 5(a)(iii) any two from: 2 M1 sample more areas; M2 sample at different times of the year; M3 sample for longer period of time / leave the pitfall traps for more than 24 hrs; 5(b)(i) M1 311.5 ; 2 M2 311 / 312 ; 5(b)(ii) only whole animals are possible / cannot have half a beetle ; 1 5(c)(i) any three from: 3 M1 beetle feeds on pollen; M2 pollen lands on the body of the beetle; M3 deposits on the stigma; 5(c)(ii) M1 year 6 or 7 or 8; 2 M2 (after year 8) the population increased each year / started to grow;
What was in this paper
The subtopics covered by these 5 questions, and how many questions each got. Open one in a new tab to see every Cambridge question on it.
What you needed in this session
Cambridge’s own grade thresholds for 2025 Oct/Nov, Paper 2 · Variant 3. A higher threshold means an easier paper — the bar moves with how the cohort did.