Cambridge IGCSE Environmental Management 0680 — 2024 May/June Paper 2 · Variant 3
0680/23/M/J/24 · 3 questions · 80 marks · ≈90 min
The question paper and its mark scheme, free to read here and free to download. This is Cambridge’s own paper, exactly as it was sat.
Question paper20 pages

Mark scheme10 pages
Answers below. Sit the paper first if you are practising.
Questions as text
Q1 · State one fact from the source information that indicates New Zealand is a more…
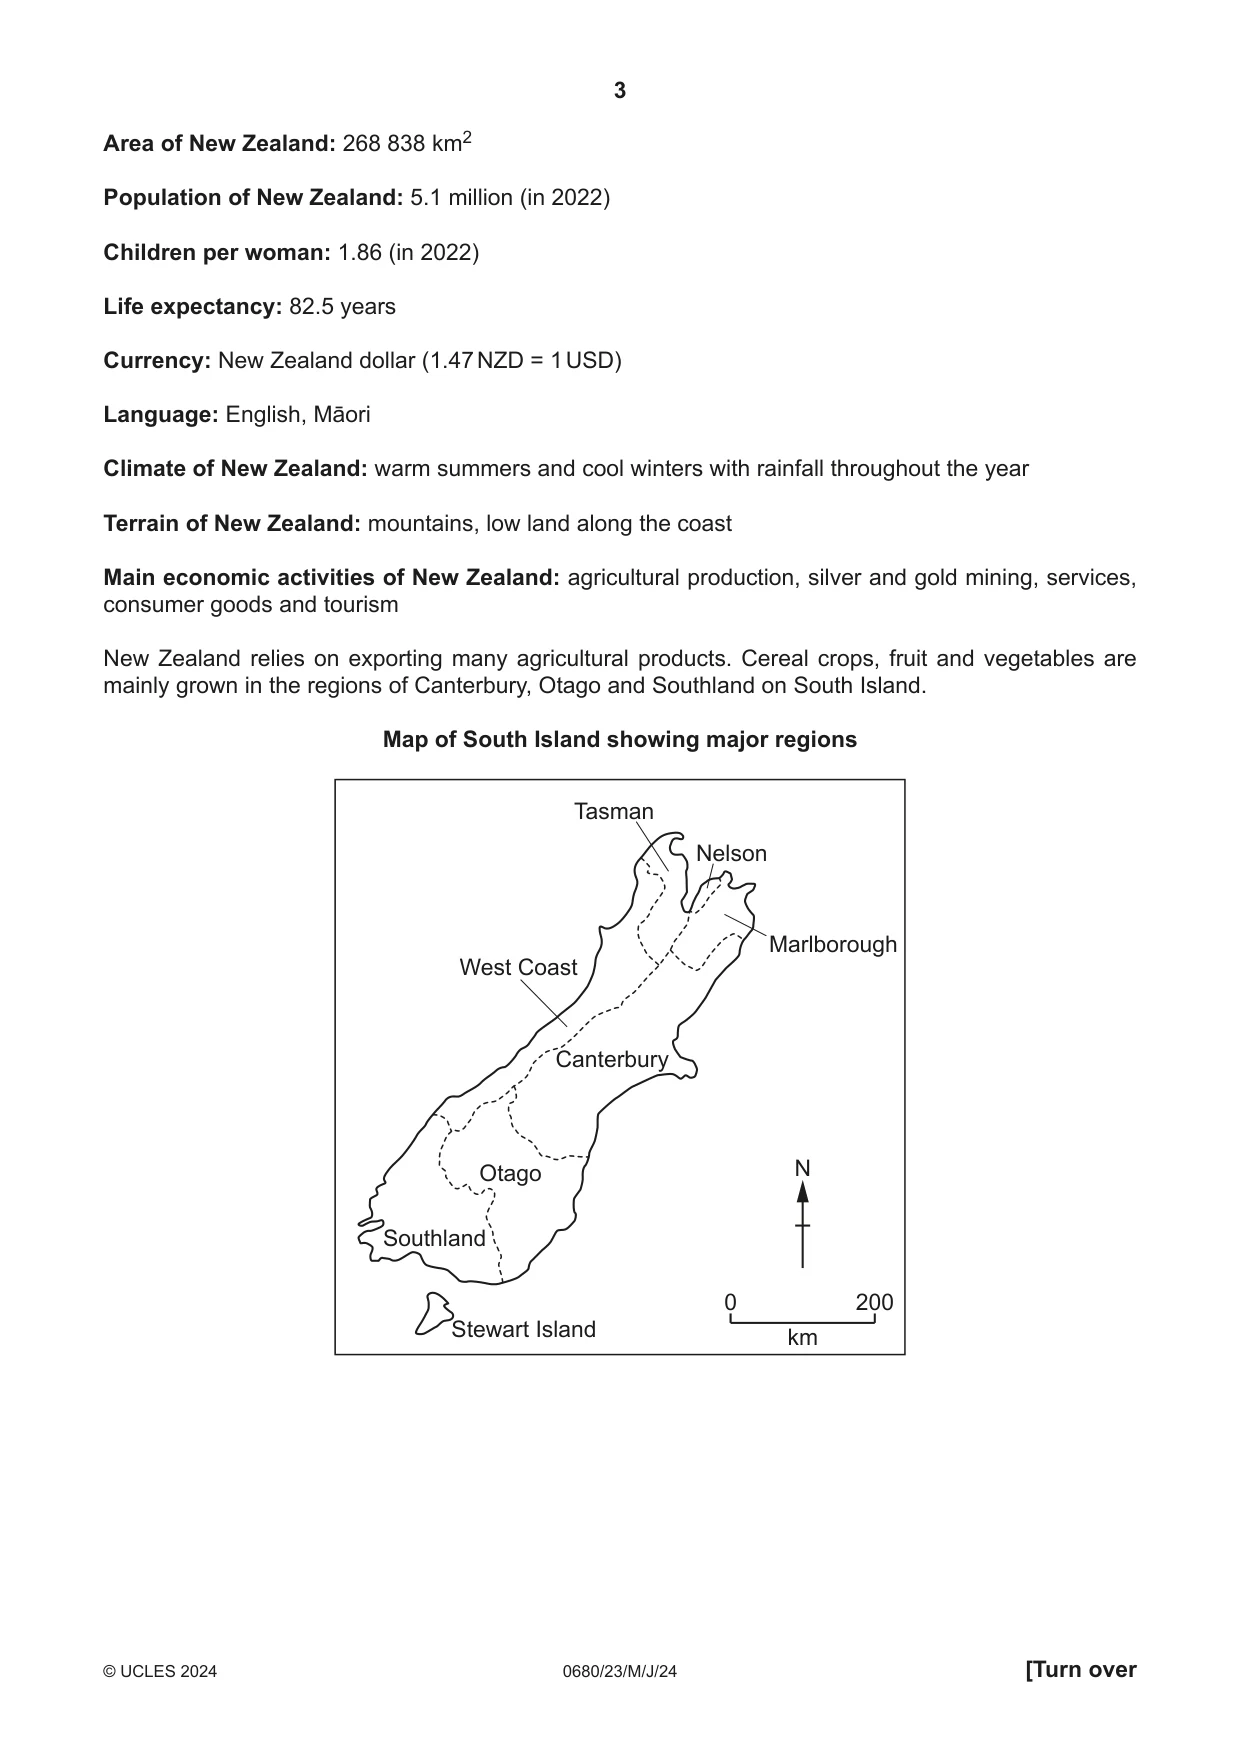
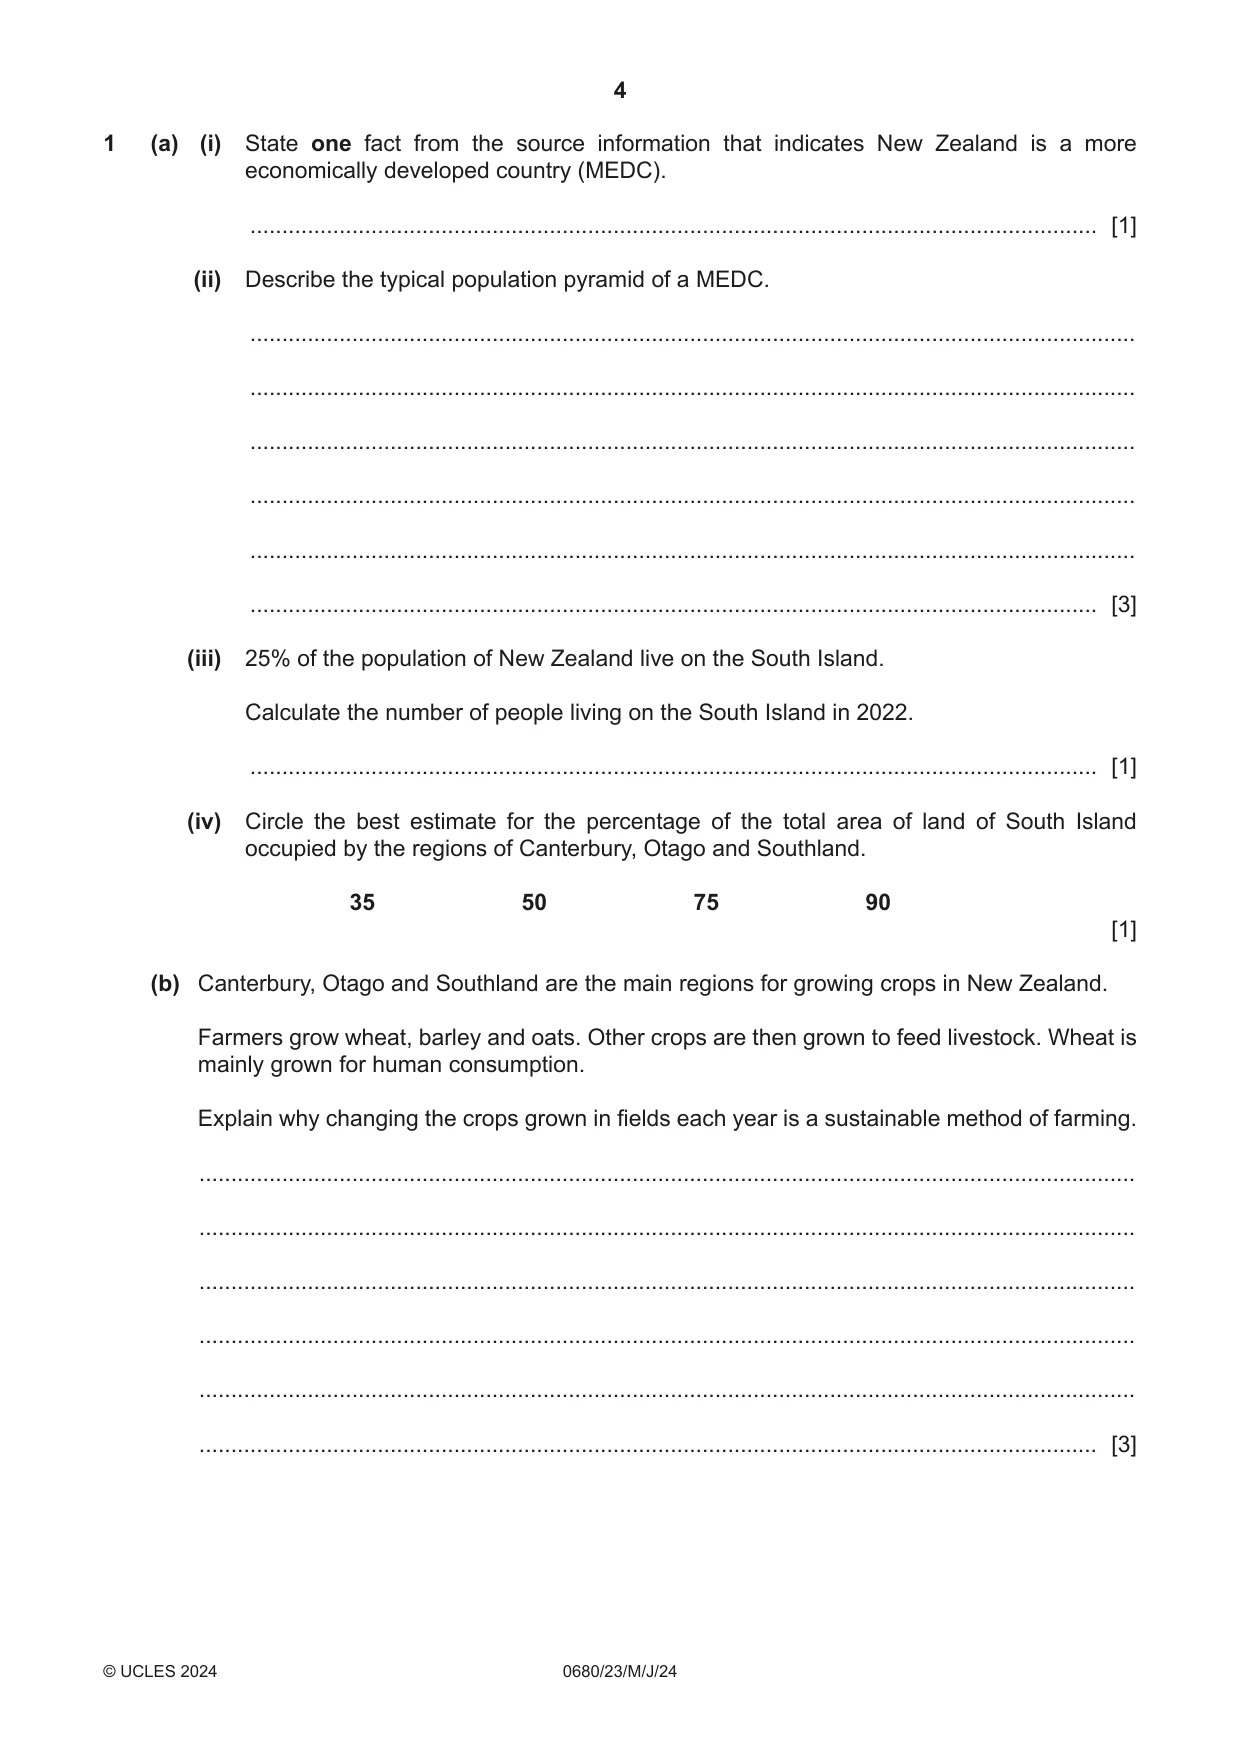
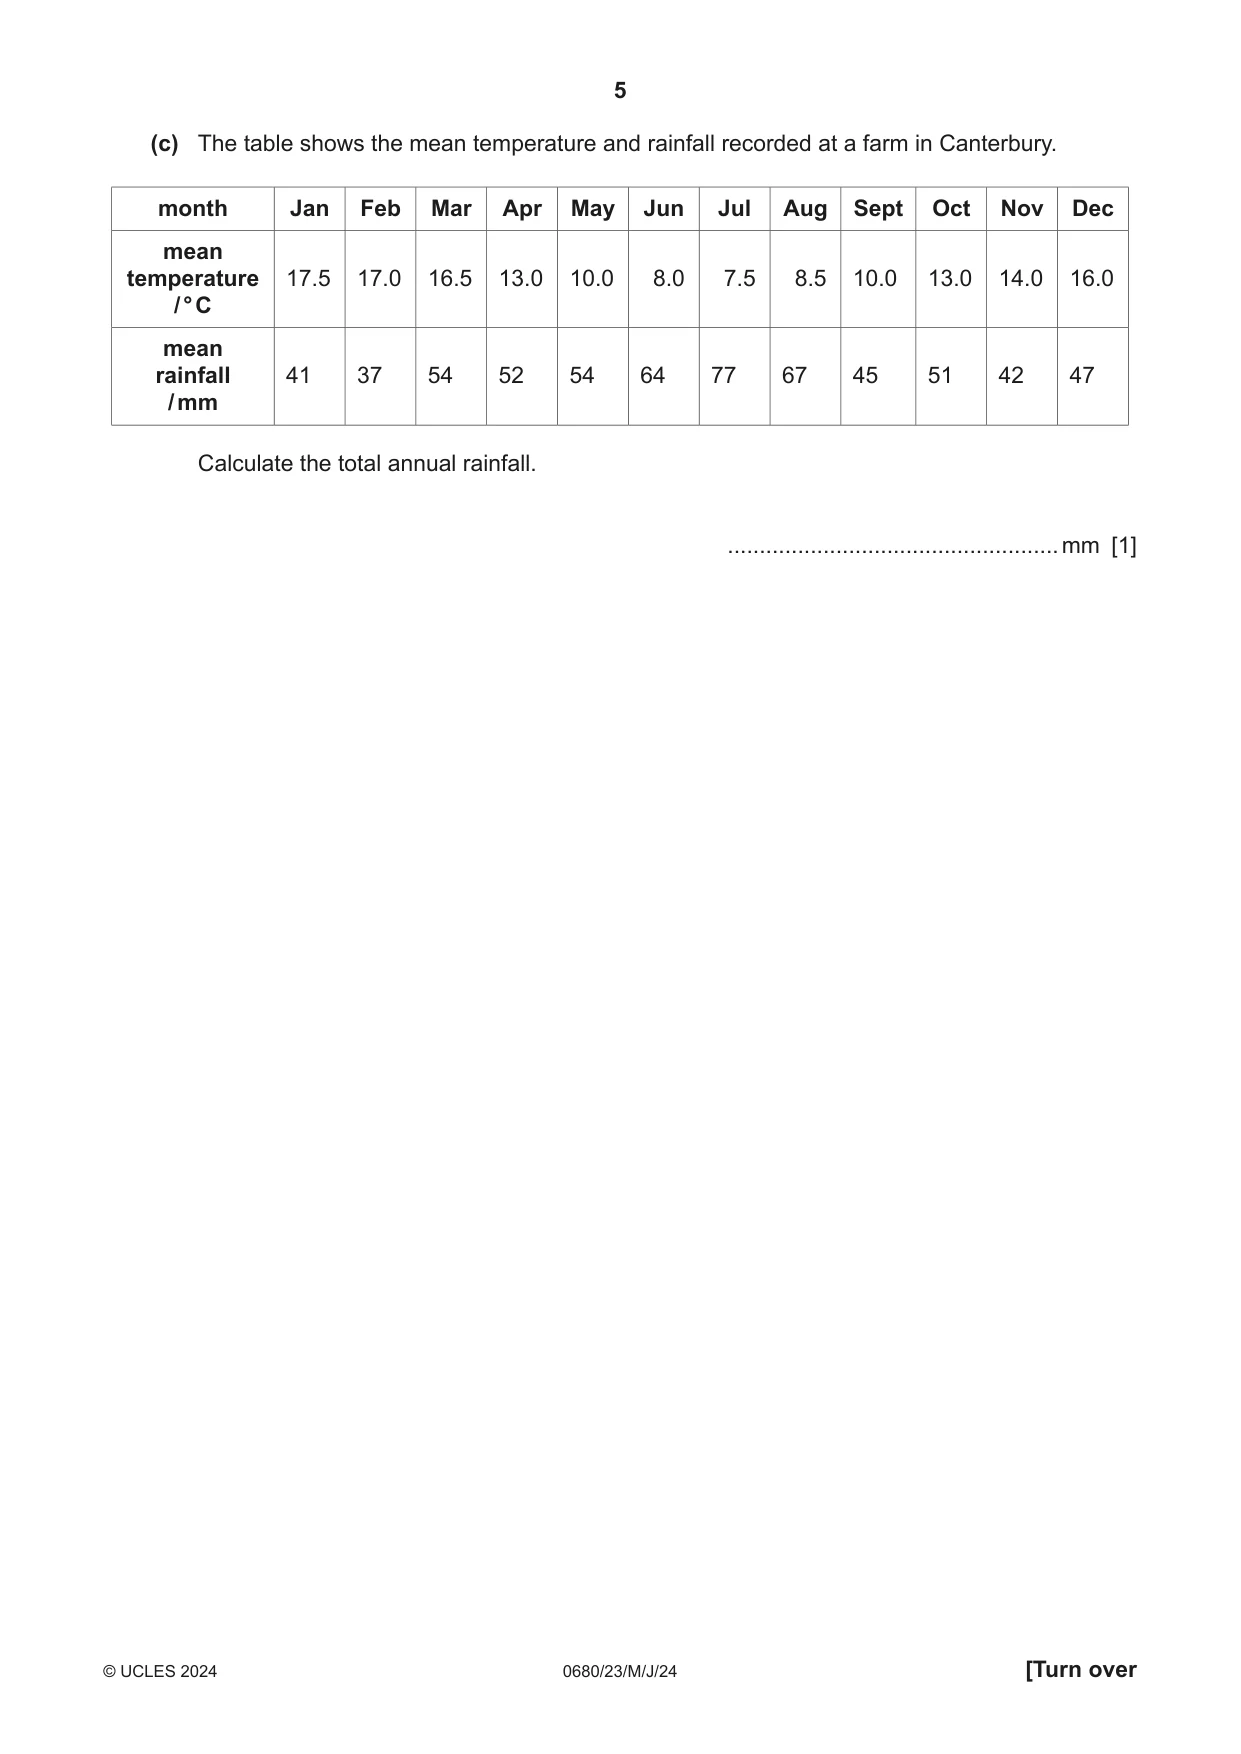
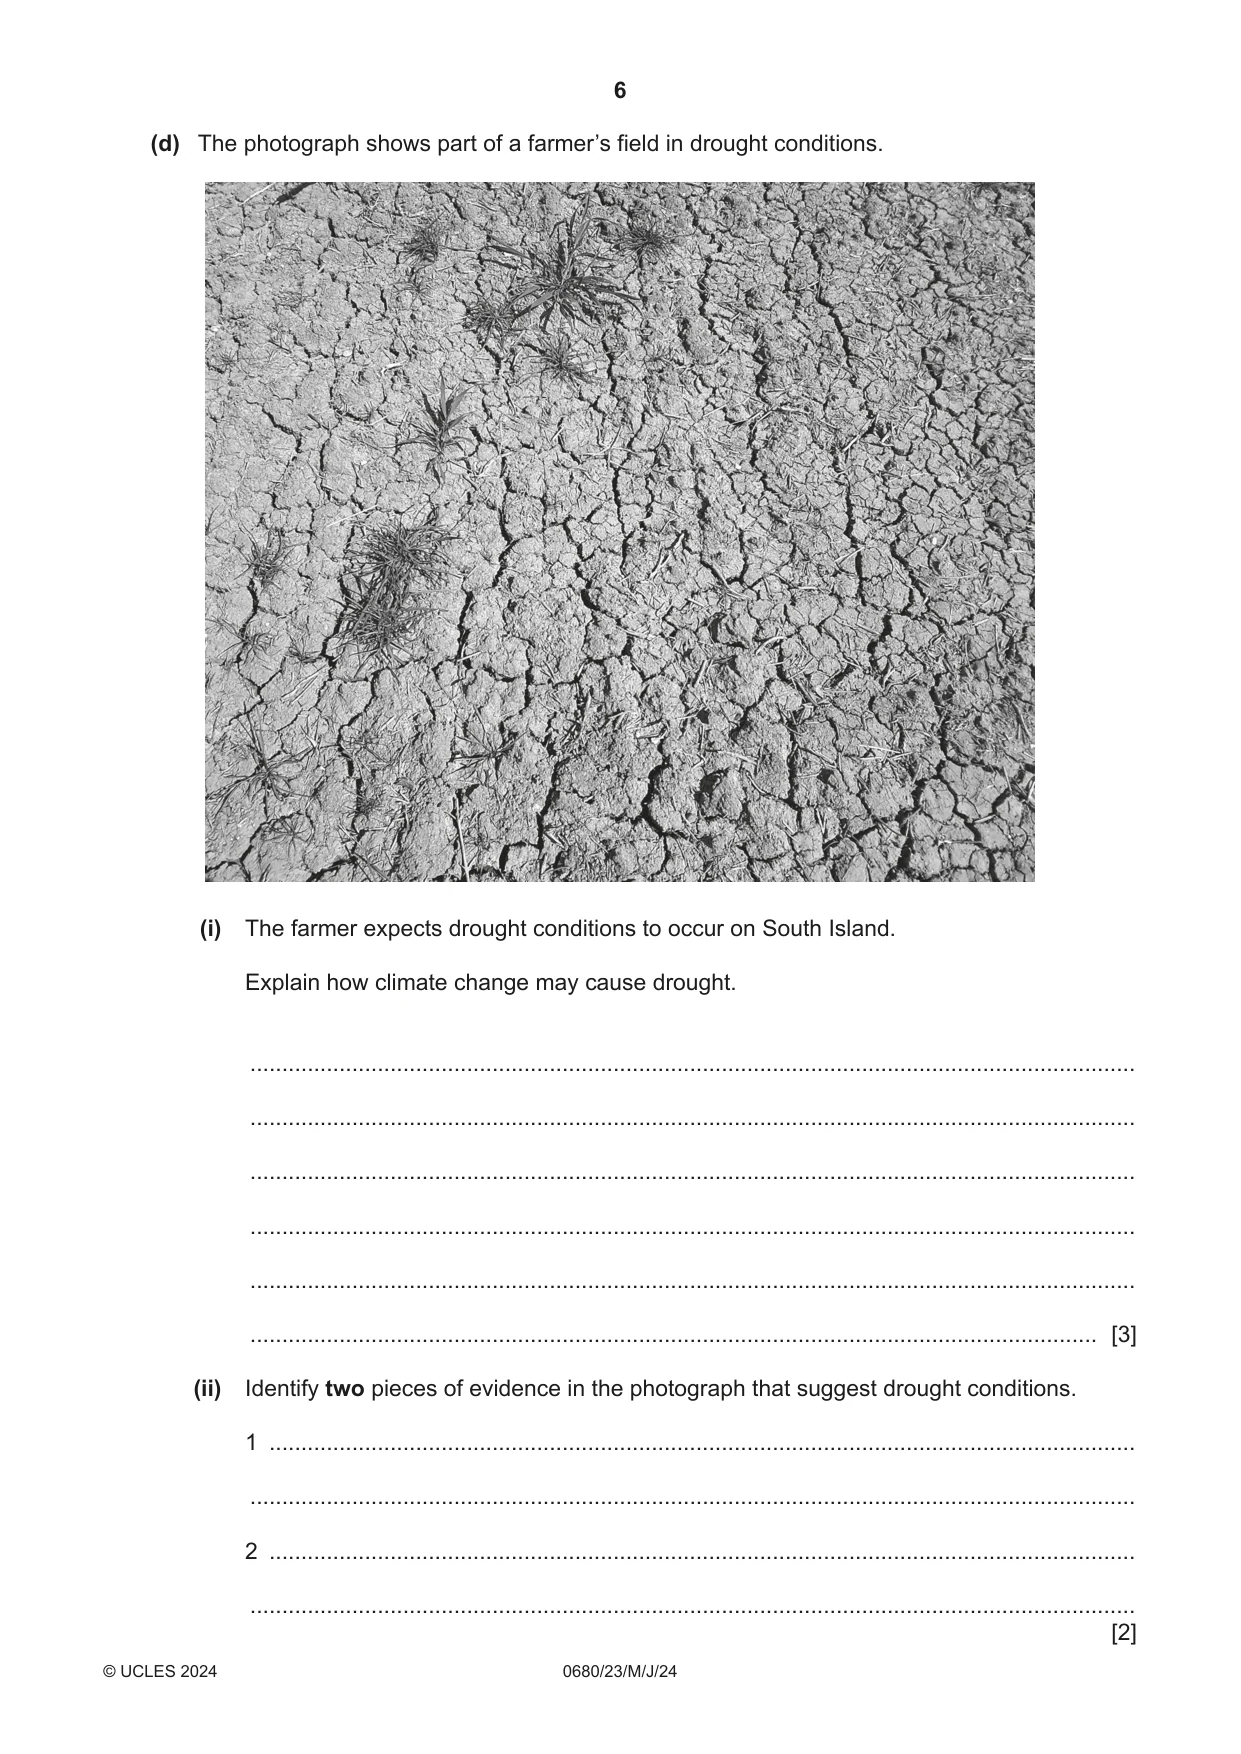
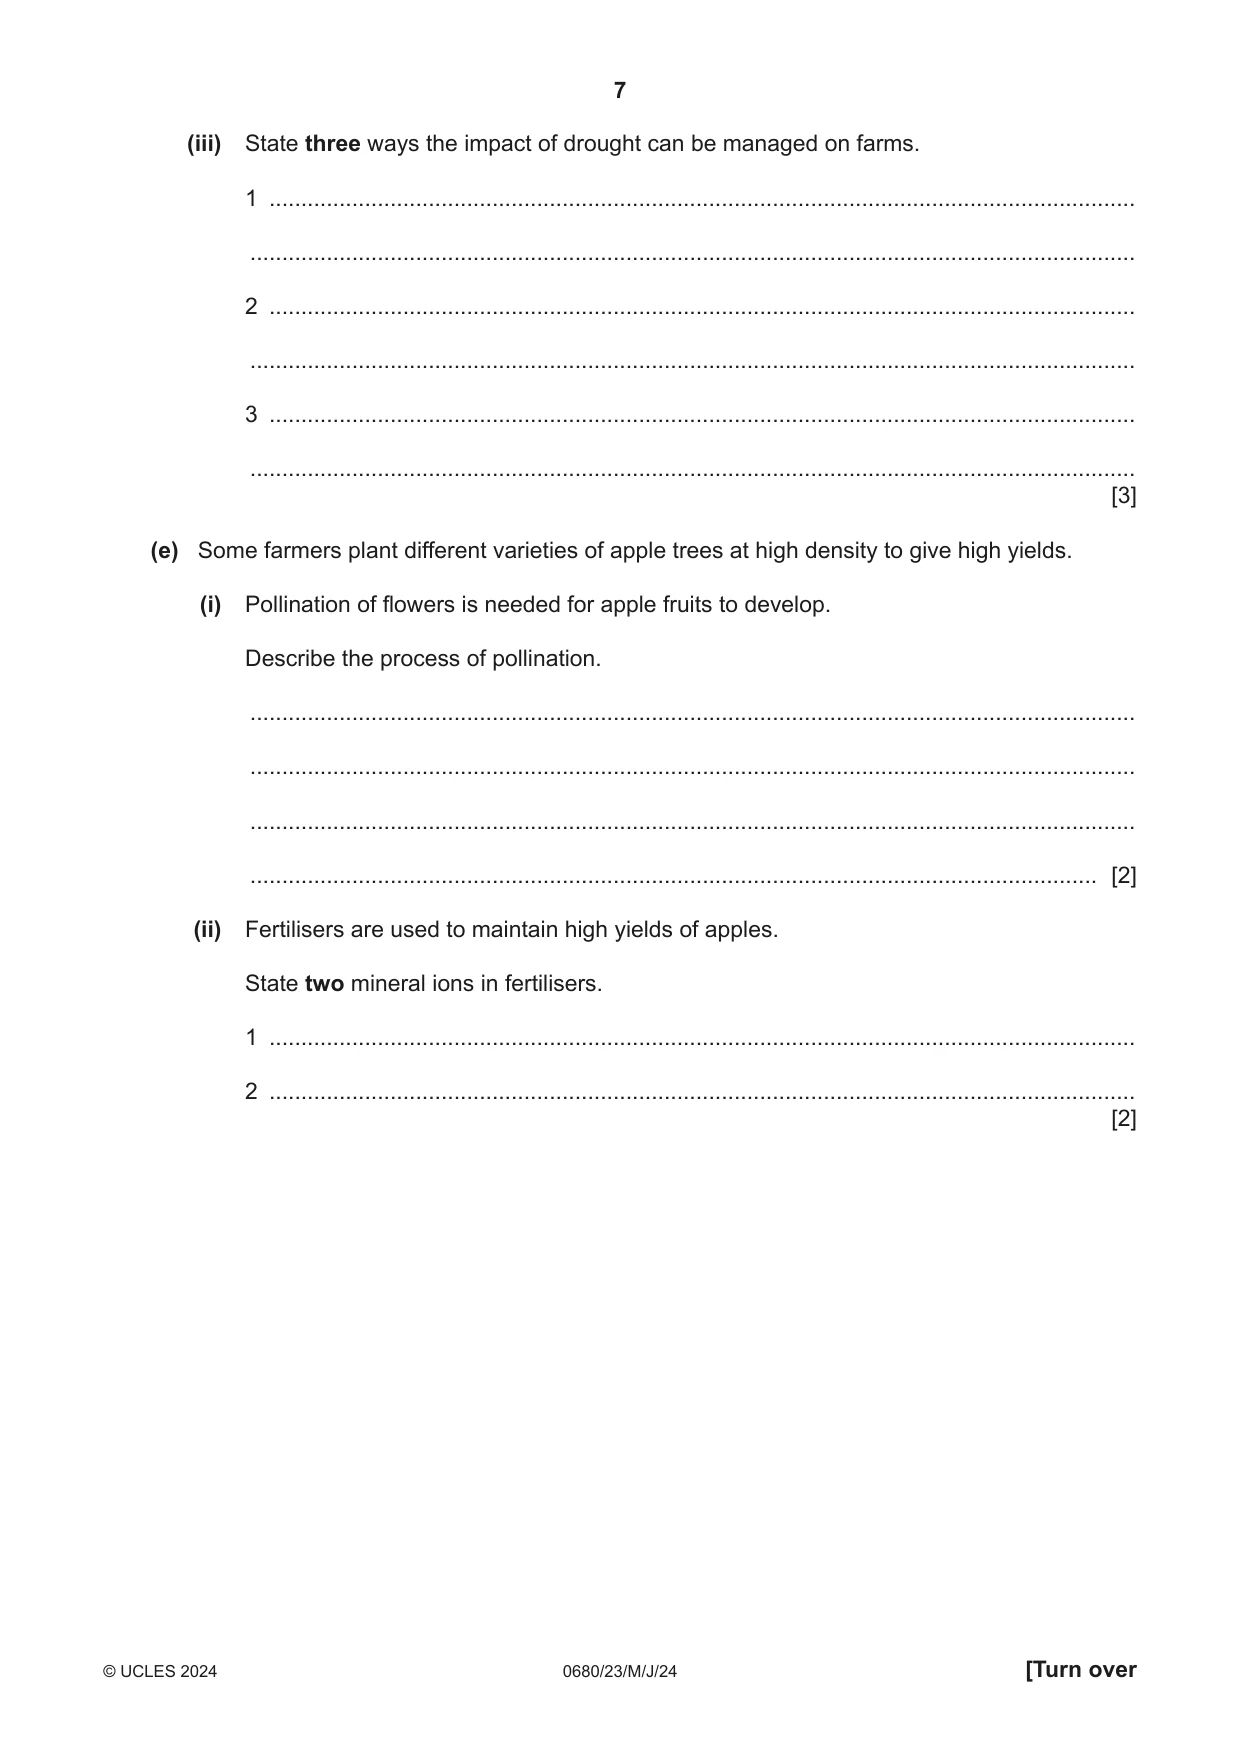
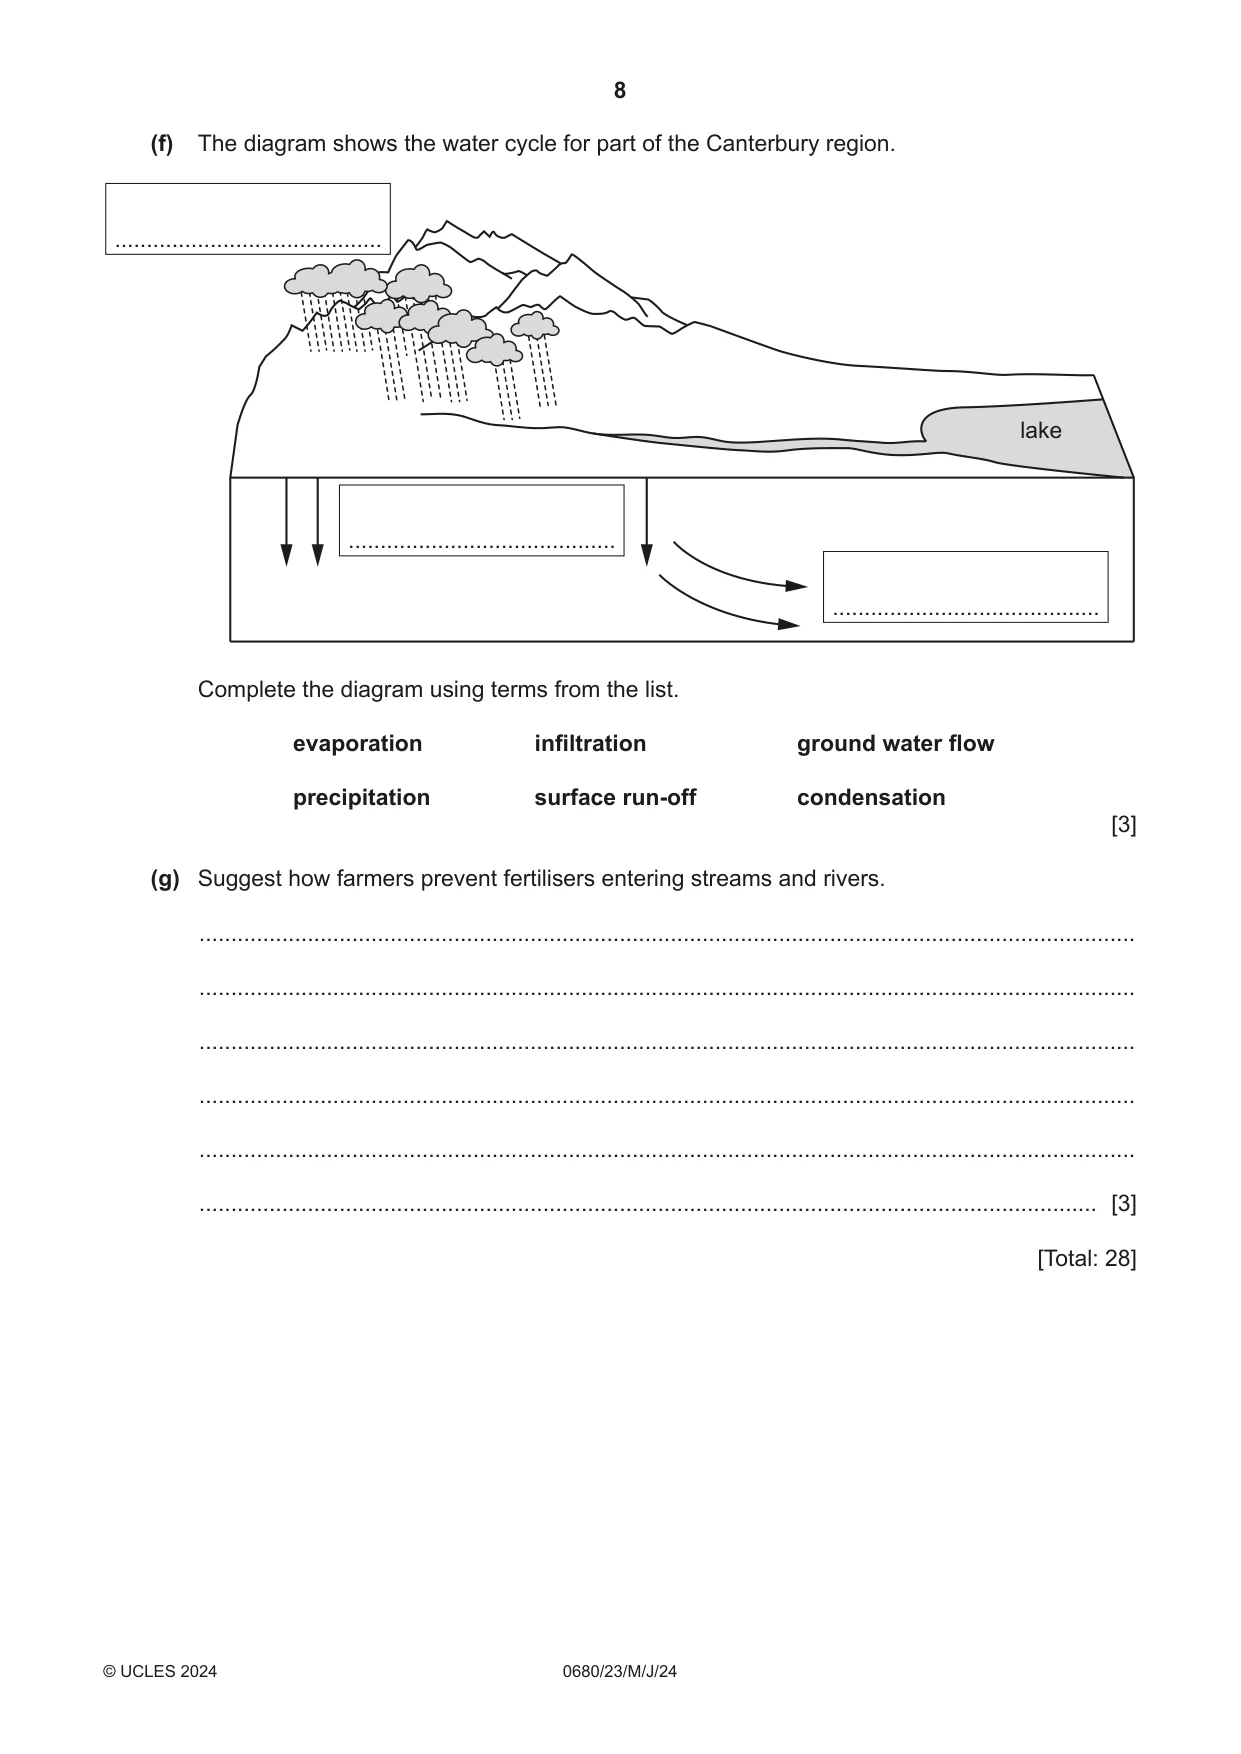
1 (a) (i) State one fact from the source information that indicates New Zealand is a more economically developed country (MEDC). ..................................................................................................................................... [1] (ii) Describe the typical population pyramid of a MEDC. ........................................................................................................................................... ........................................................................................................................................... ........................................................................................................................................... ........................................................................................................................................... ........................................................................................................................................... ..................................................................................................................................... [3] (iii) 25% of the population of New Zealand live on the South Island. Calculate the number of people living on the South Island in 2022. ..................................................................................................................................... [1] (iv) Circle the best estimate for the percentage of the total area of land of South Island occupied by the regions of Canterbury, Otago and Southland. 35 50 75 90 [1] (b) Canterbury, Otago and Southland are the main regions for growing crops in New Zealand. Farmers grow wheat, barley and oats. Other crops are then grown to feed livestock. Wheat is mainly grown for human consumption. Explain why changing the crops grown in fields each year is a sustainable method of farming. ................................................................................................................................................... ................................................................................................................................................... ................................................................................................................................................... ................................................................................................................................................... ................................................................................................................................................... ............................................................................................................................................. [3] (c) The table shows the mean temperature and rainfall recorded at a farm in Canterbury. month Jan Feb Mar Apr May Jun Jul Aug Sept Oct Nov Dec mean temperature 17.5 17.0 16.5 13.0 10.0 8.0 7.5 8.5 10.0 13.0 14.0 16.0 / ° C mean rainfall 41 37 54 52 54 64 77 67 45 51 42 47 / mm Calculate the total annual rainfall. ....................................................mm [1] (d) The photograph shows part of a farmer’s field in drought conditions. (i) The farmer expects drought conditions to occur on South Island. Explain how climate change may cause drought. ........................................................................................................................................... ........................................................................................................................................... ........................................................................................................................................... ........................................................................................................................................... ........................................................................................................................................... ..................................................................................................................................... [3] (ii) Identify two pieces of evidence in the photograph that suggest drought conditions. 1 ........................................................................................................................................ ........................................................................................................................................... 2 ........................................................................................................................................ ........................................................................................................................................... [2] (iii) State three ways the impact of drought can be managed on farms. 1 ........................................................................................................................................ ........................................................................................................................................... 2 ........................................................................................................................................ ........................................................................................................................................... 3 ........................................................................................................................................ ........................................................................................................................................... [3] (e) Some farmers plant different varieties of apple trees at high density to give high yields. (i) Pollination of flowers is needed for apple fruits to develop. Describe the process of pollination. ........................................................................................................................................... ........................................................................................................................................... ........................................................................................................................................... ..................................................................................................................................... [2] (ii) Fertilisers are used to maintain high yields of apples. State two mineral ions in fertilisers. 1 ........................................................................................................................................ 2 ........................................................................................................................................ [2] (f) The diagram shows the water cycle for part of the Canterbury region. .......................................... lake .......................................... .......................................... Complete the diagram using terms from the list. evaporation infiltration ground water flow precipitation surface run-off condensation [3] (g) Suggest how farmers prevent fertilisers entering streams and rivers. ................................................................................................................................................... ................................................................................................................................................... ................................................................................................................................................... ................................................................................................................................................... ................................................................................................................................................... ............................................................................................................................................. [3] [Total: 28]
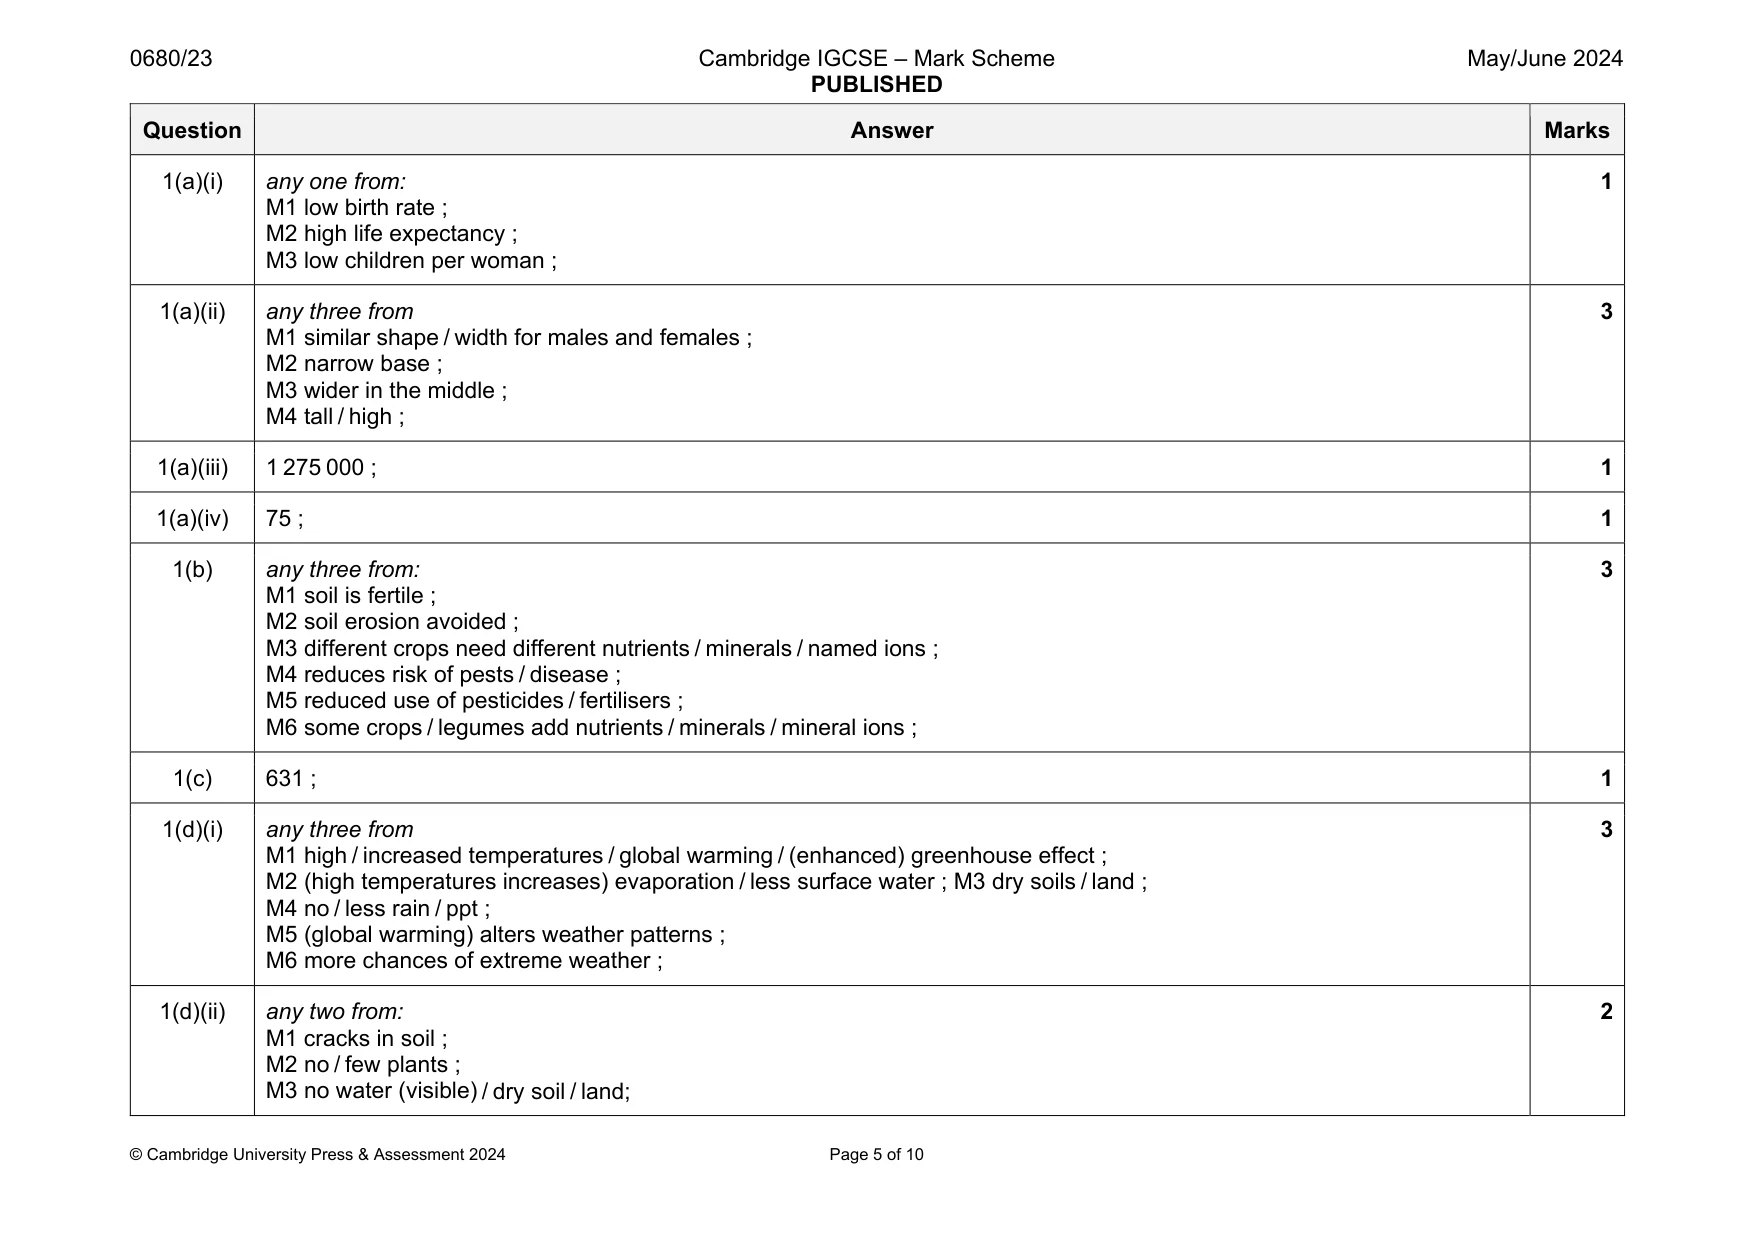
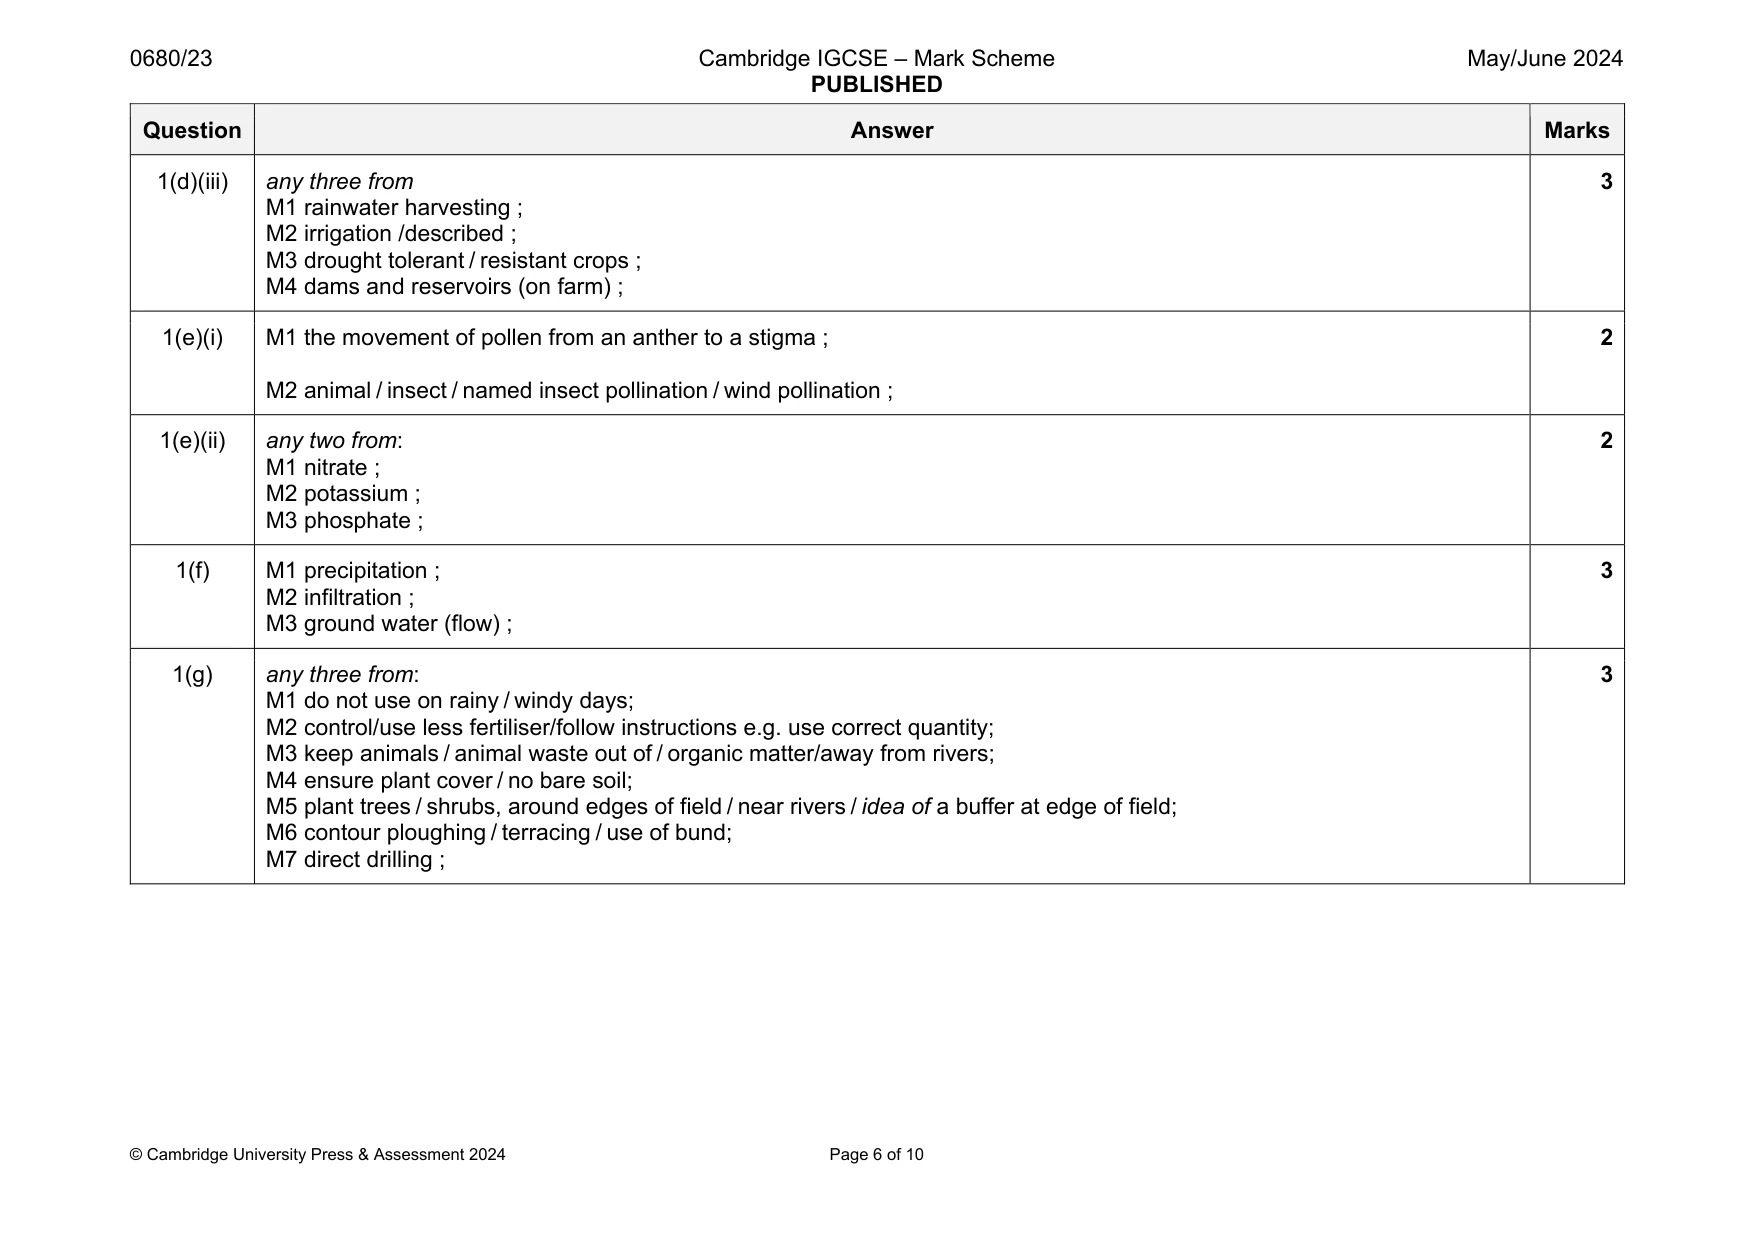
Mark scheme: 1(a)(i) any one from: M1 low birth rate ; M2 high life expectancy ; M3 low children per woman ; 1 1(a)(ii) any three from M1 similar shape / width for males and females ; M2 narrow base ; M3 wider in the middle ; M4 tall / high ; 3 1(a)(iii) 1 275 000 ; 1 1(a)(iv) 75 ; 1 1(b) any three from: M1 soil is fertile ; M2 soil erosion avoided ; M3 different crops need different nutrients / minerals / named ions ; M4 reduces risk of pests / disease ; M5 reduced use of pesticides / fertilisers ; M6 some crops / legumes add nutrients / minerals / mineral ions ; 3 1(c) 631 ; 1 1(d)(i) any three from M1 high / increased temperatures / global warming / (enhanced) greenhouse effect ; M2 (high temperatures increases) evaporation / less surface water ; M3 dry soils / land ; M4 no / less rain / ppt ; M5 (global warming) alters weather patterns ; M6 more chances of extreme weather ; 3 1(d)(ii) any two from: M1 cracks in soil ; M2 no / few plants ; M3 no water (visible) / dry soil / land; 2 Question Answer Marks 1(d)(iii) any three from M1 rainwater harvesting ; M2 irrigation /described ; M3 drought tolerant / resistant crops ; M4 dams and reservoirs (on farm) ; 3 1(e)(i) M1 the movement of pollen from an anther to a stigma ; M2 animal / insect / named insect pollination / wind pollination ; 2 1(e)(ii) any two from: M1 nitrate ; M2 potassium ; M3 phosphate ; 2 1(f) M1 precipitation ; M2 infiltration ; M3 ground water (flow) ; 3 1(g) any three from: M1 do not use on rainy / windy days; M2 control/use less fertiliser/follow instructions e.g. use correct quantity; M3 keep animals / animal waste out of / organic matter/away from rivers; M4 ensure plant cover / no bare soil; M5 plant trees / shrubs, around edges of field / near rivers / idea of a buffer at edge of field; M6 contour ploughing / terracing / use of bund; M7 direct drilling ; 3
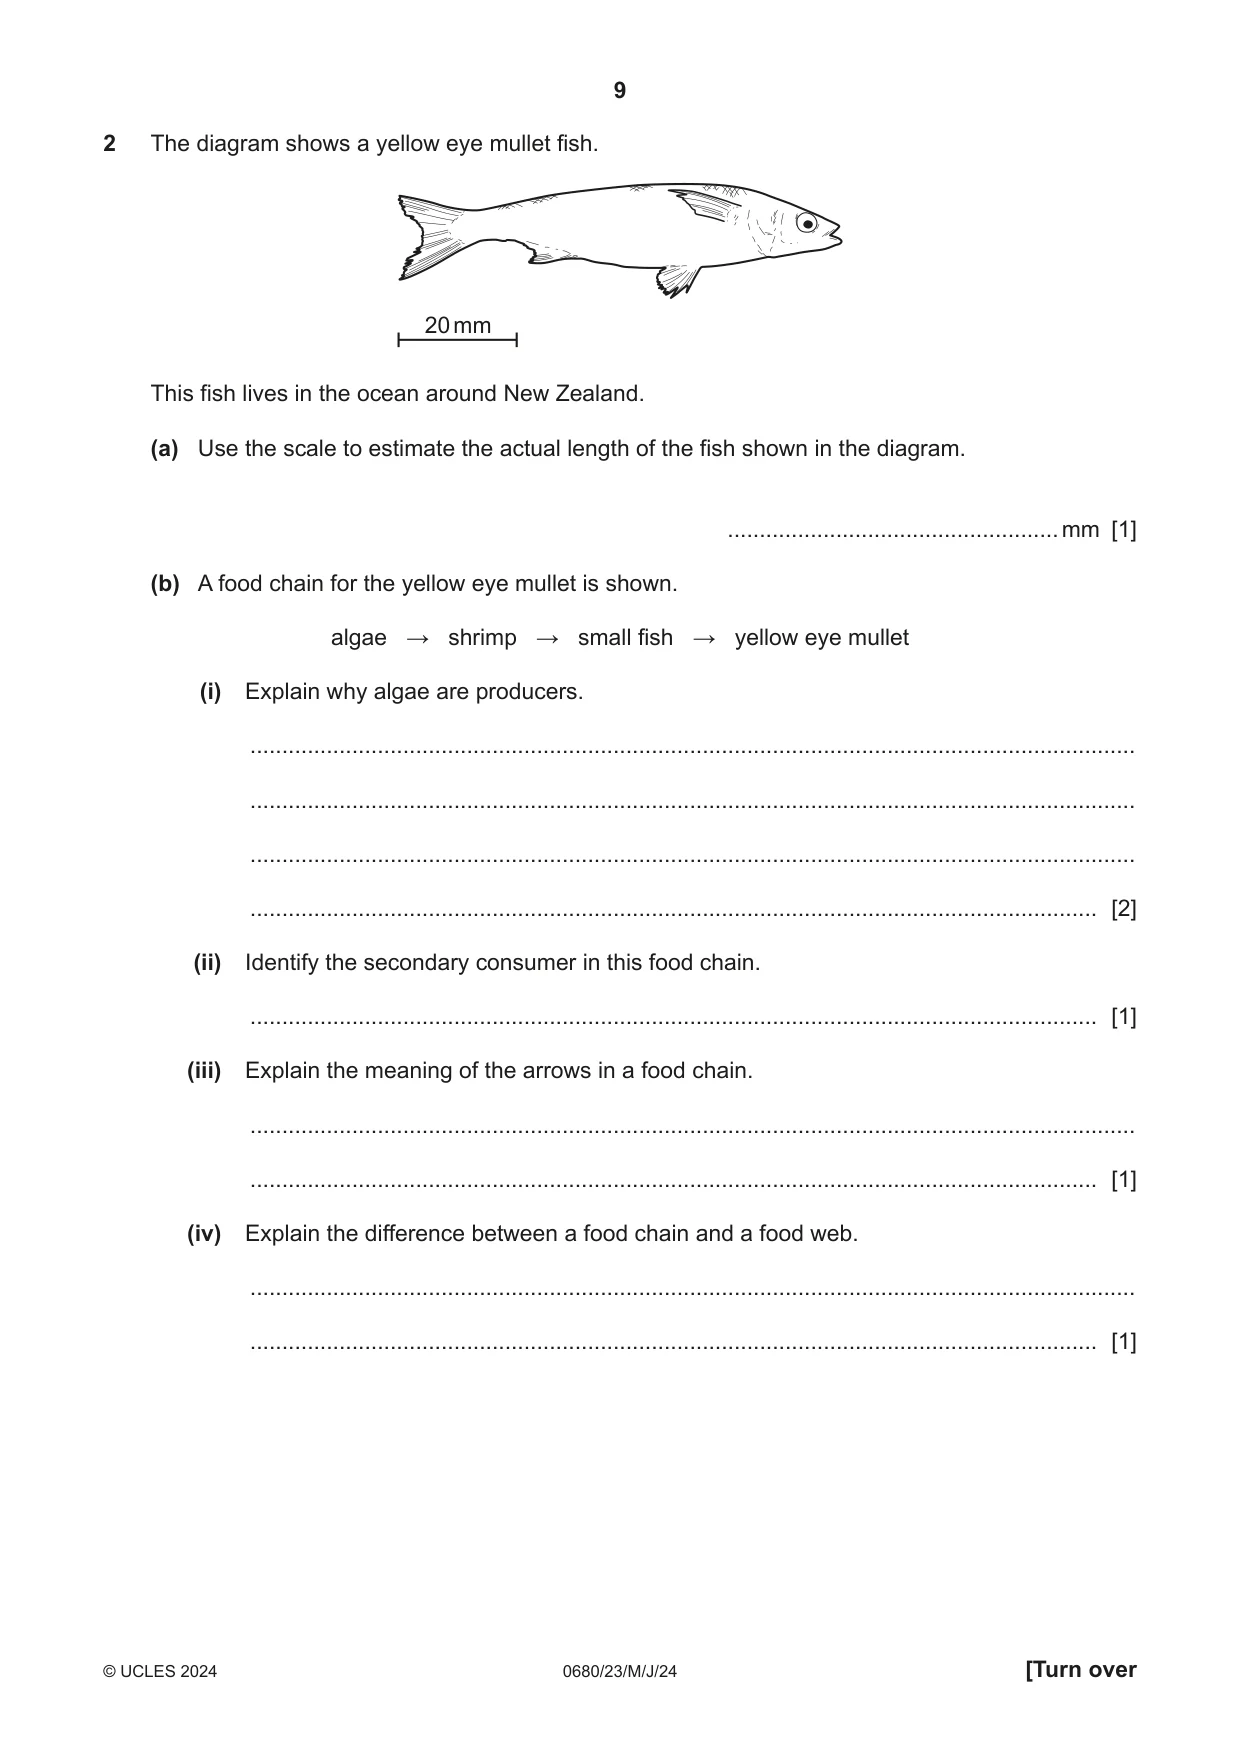
Q2 · The diagram shows a yellow eye mullet fish
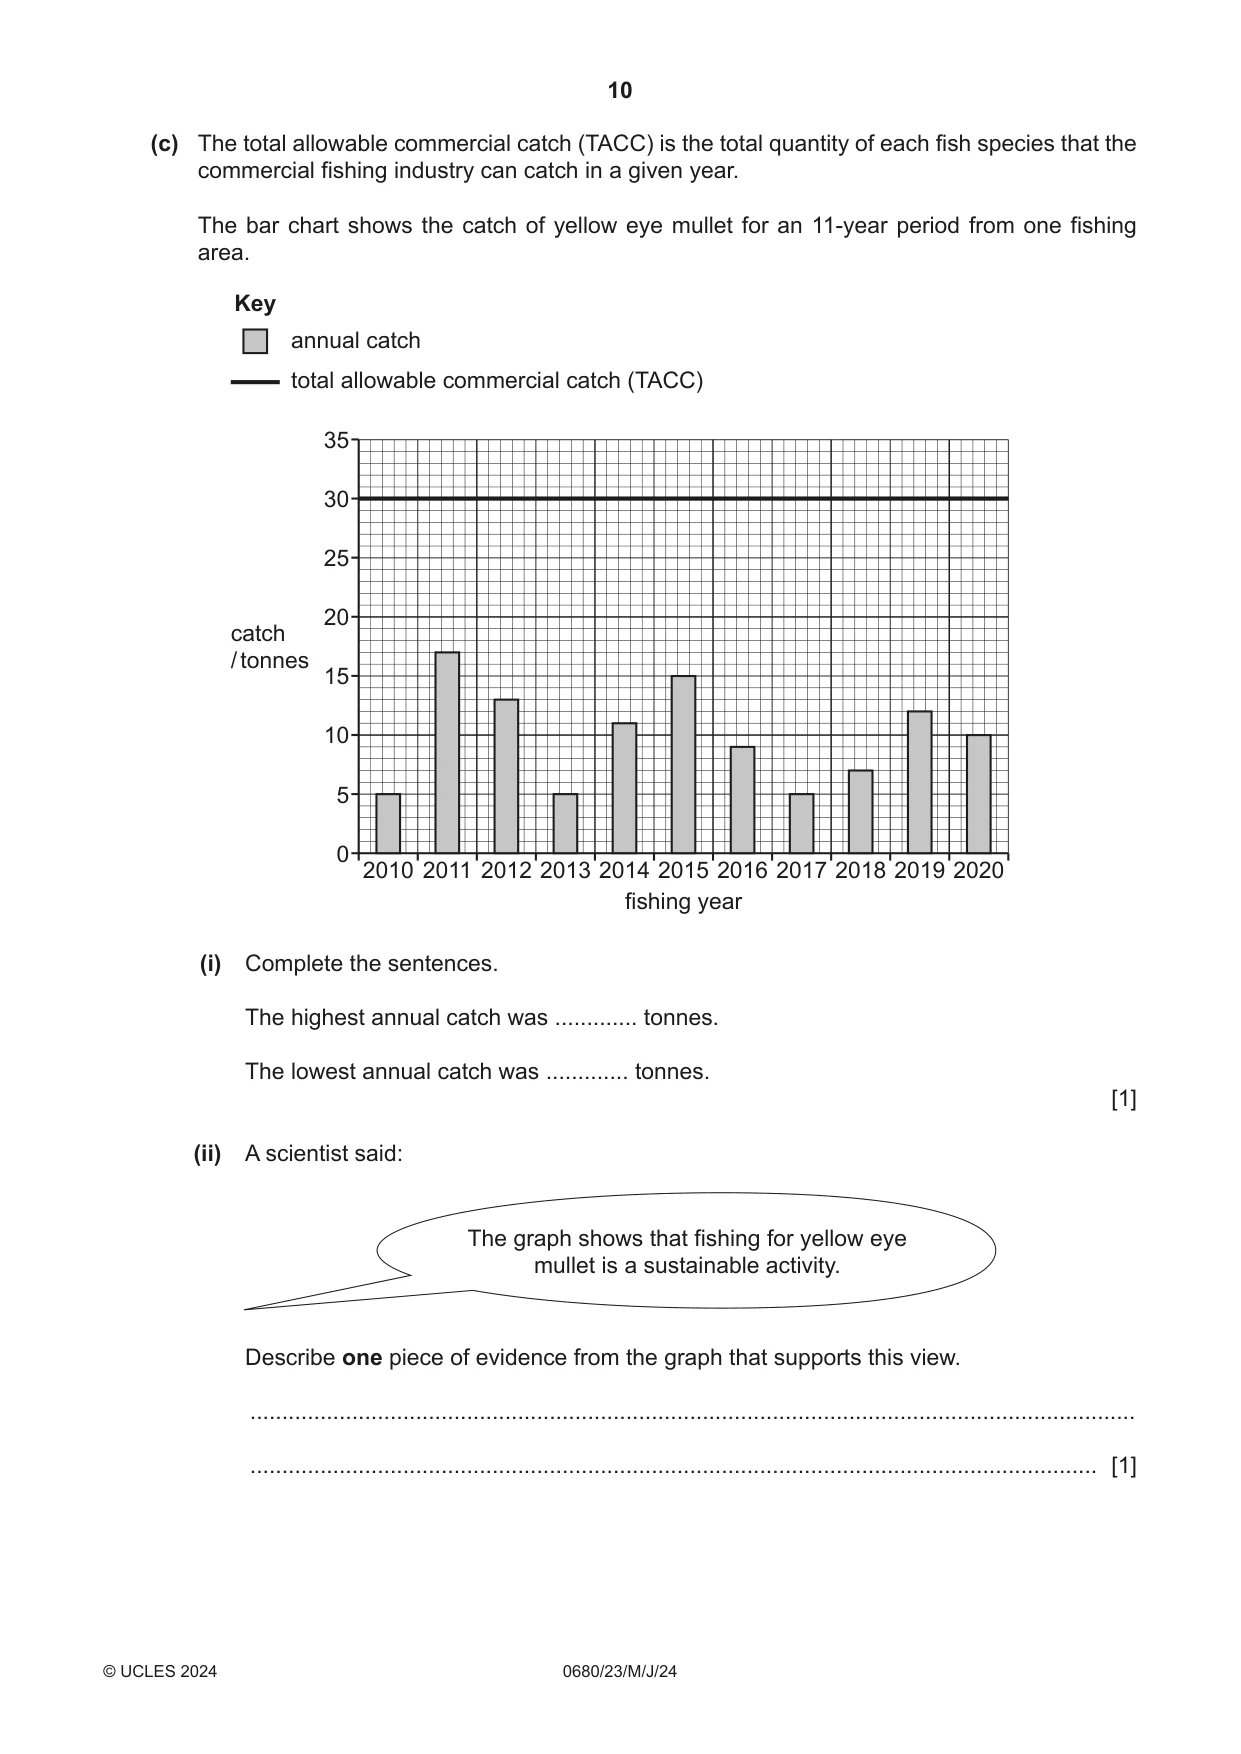
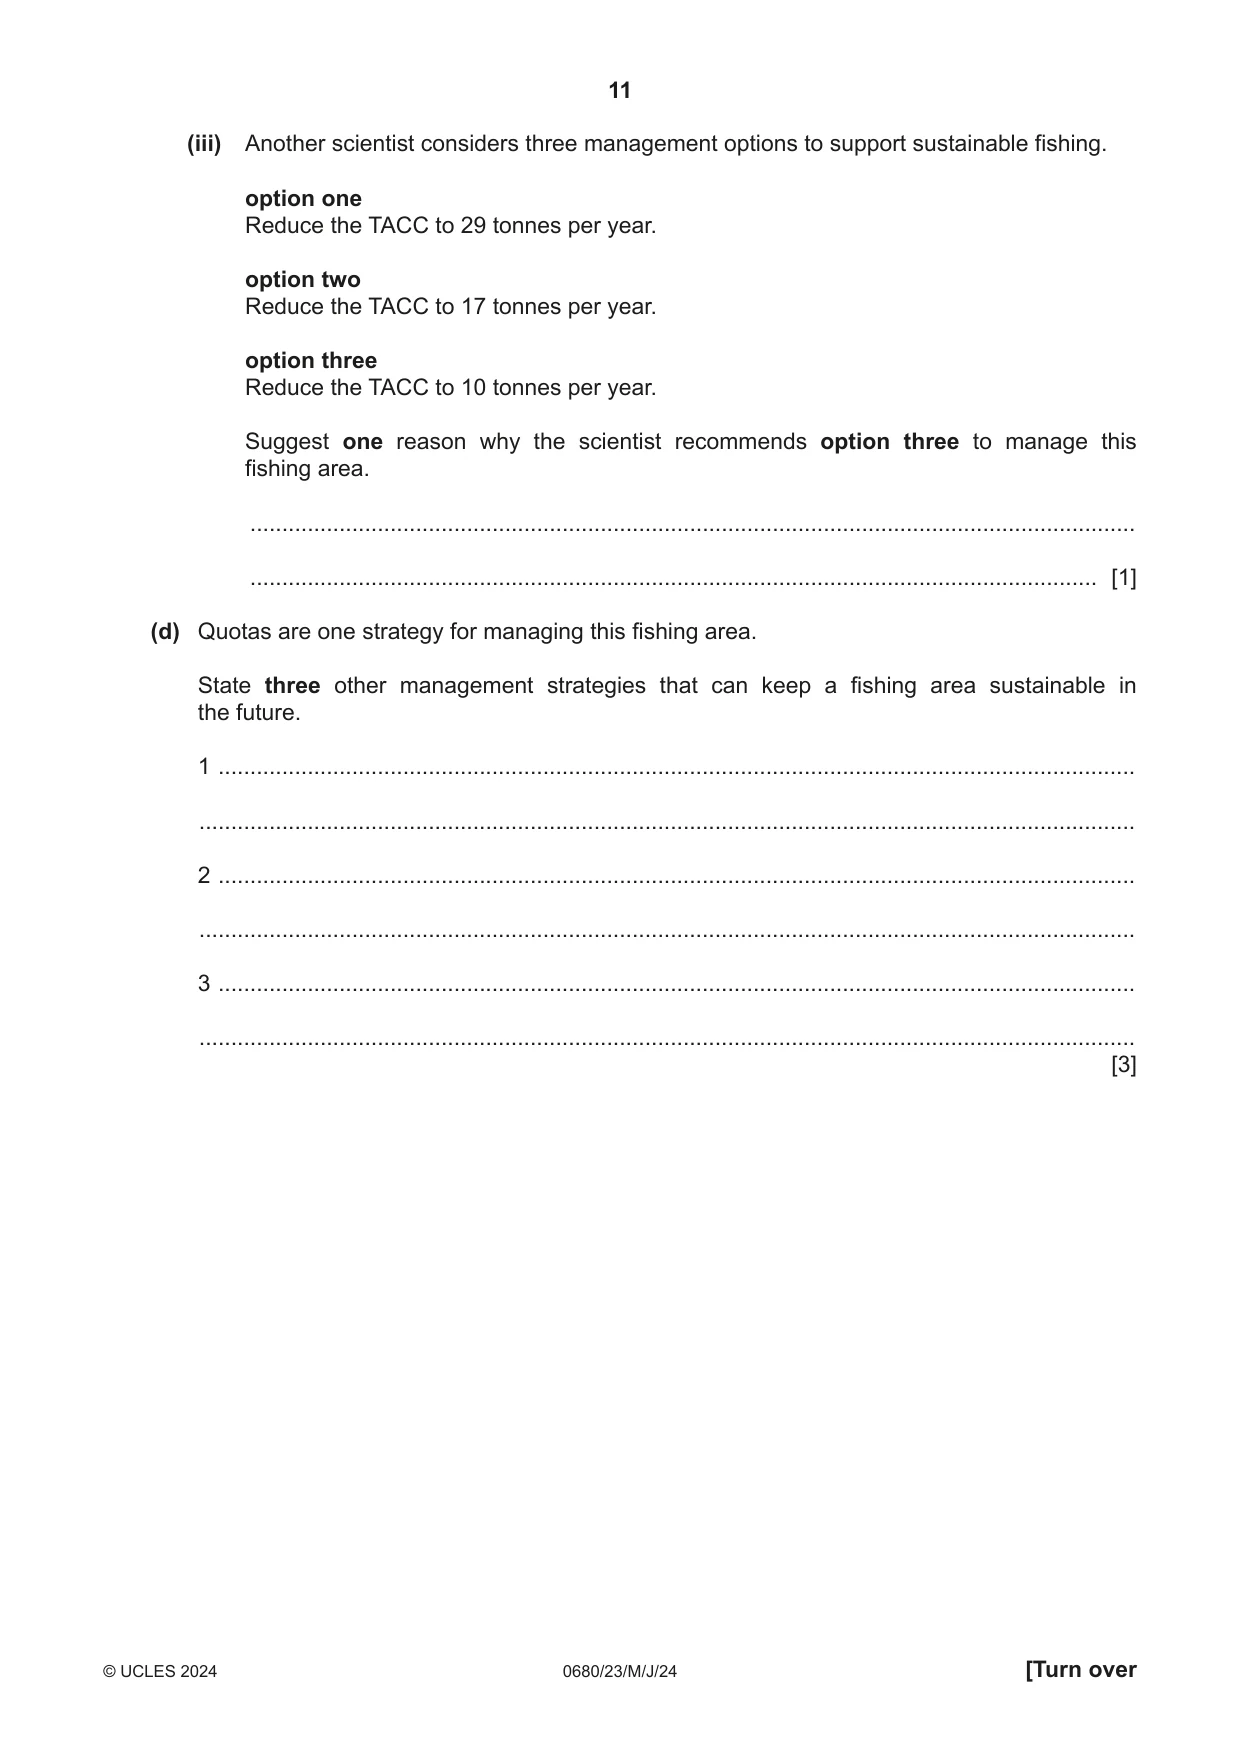
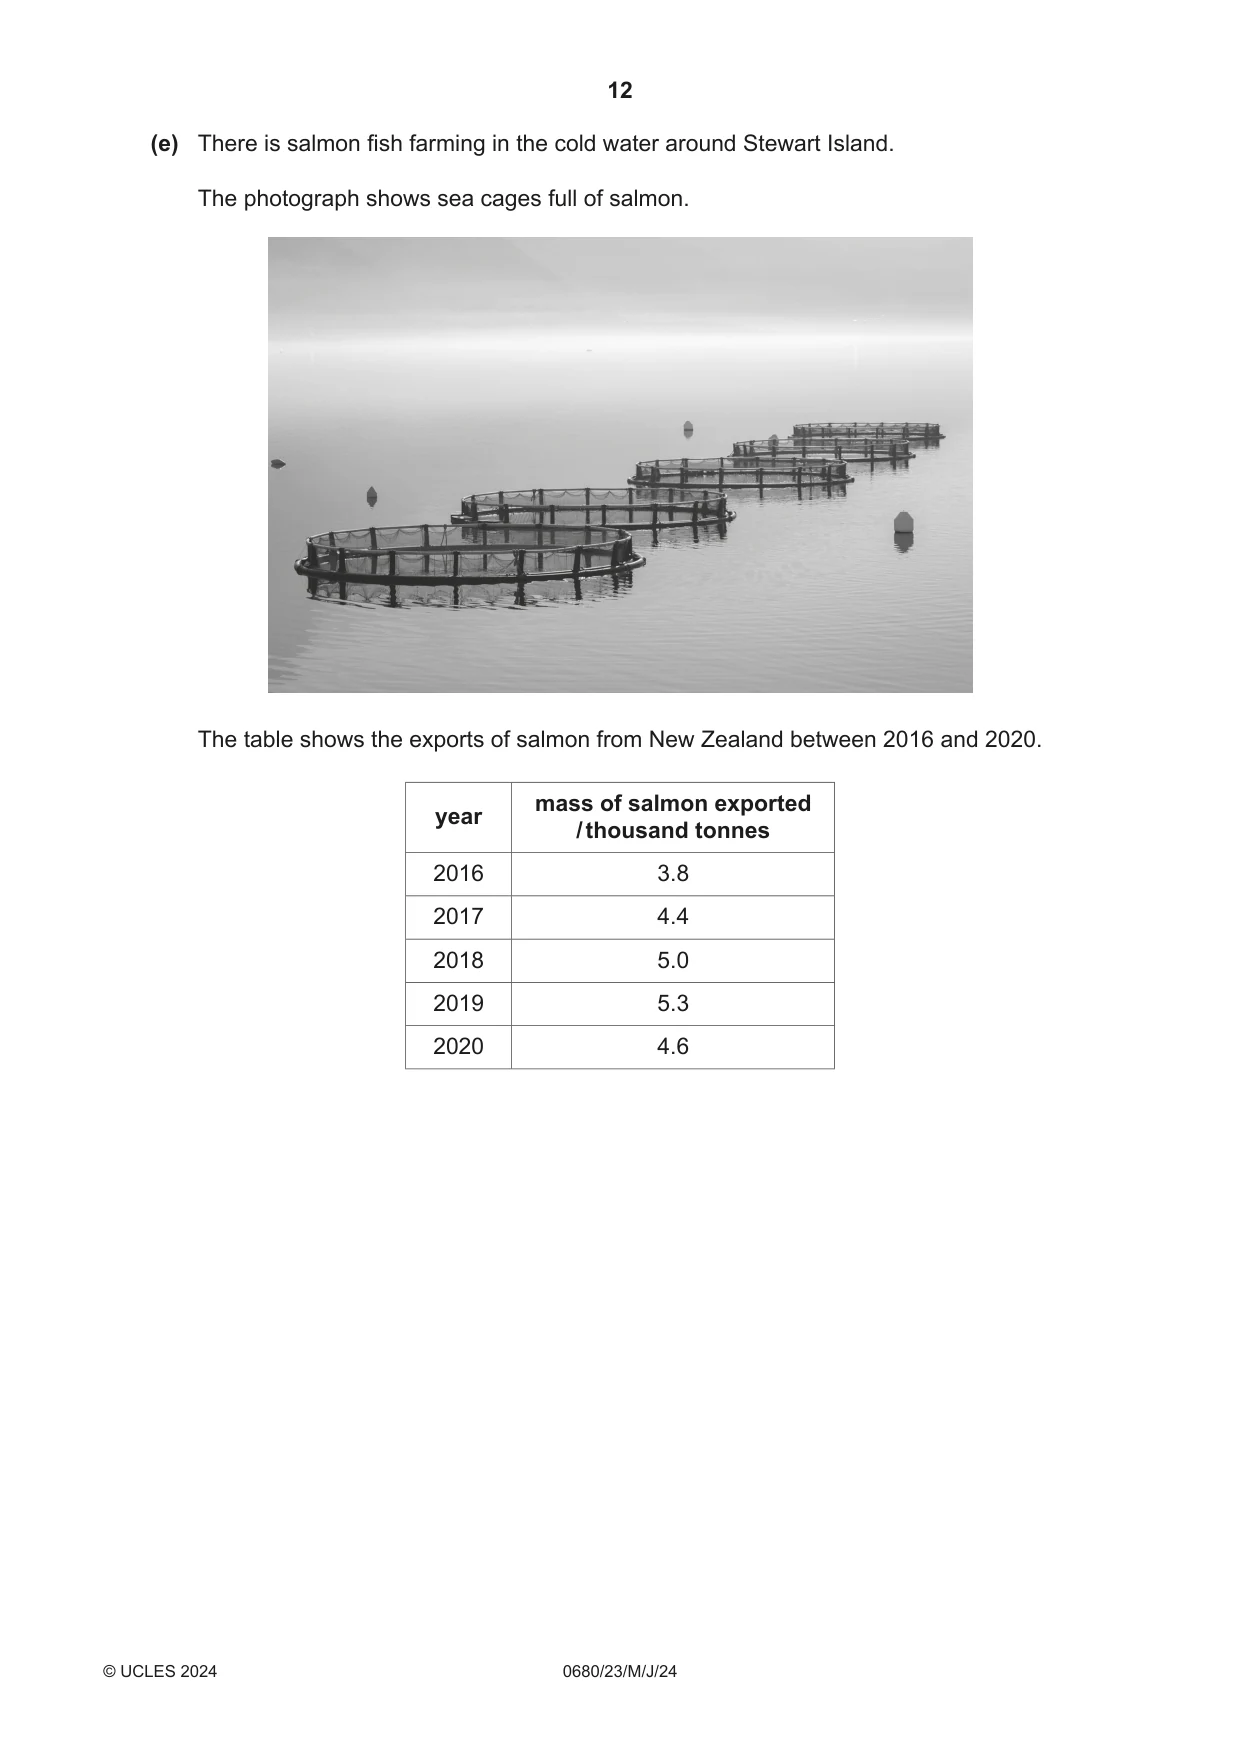
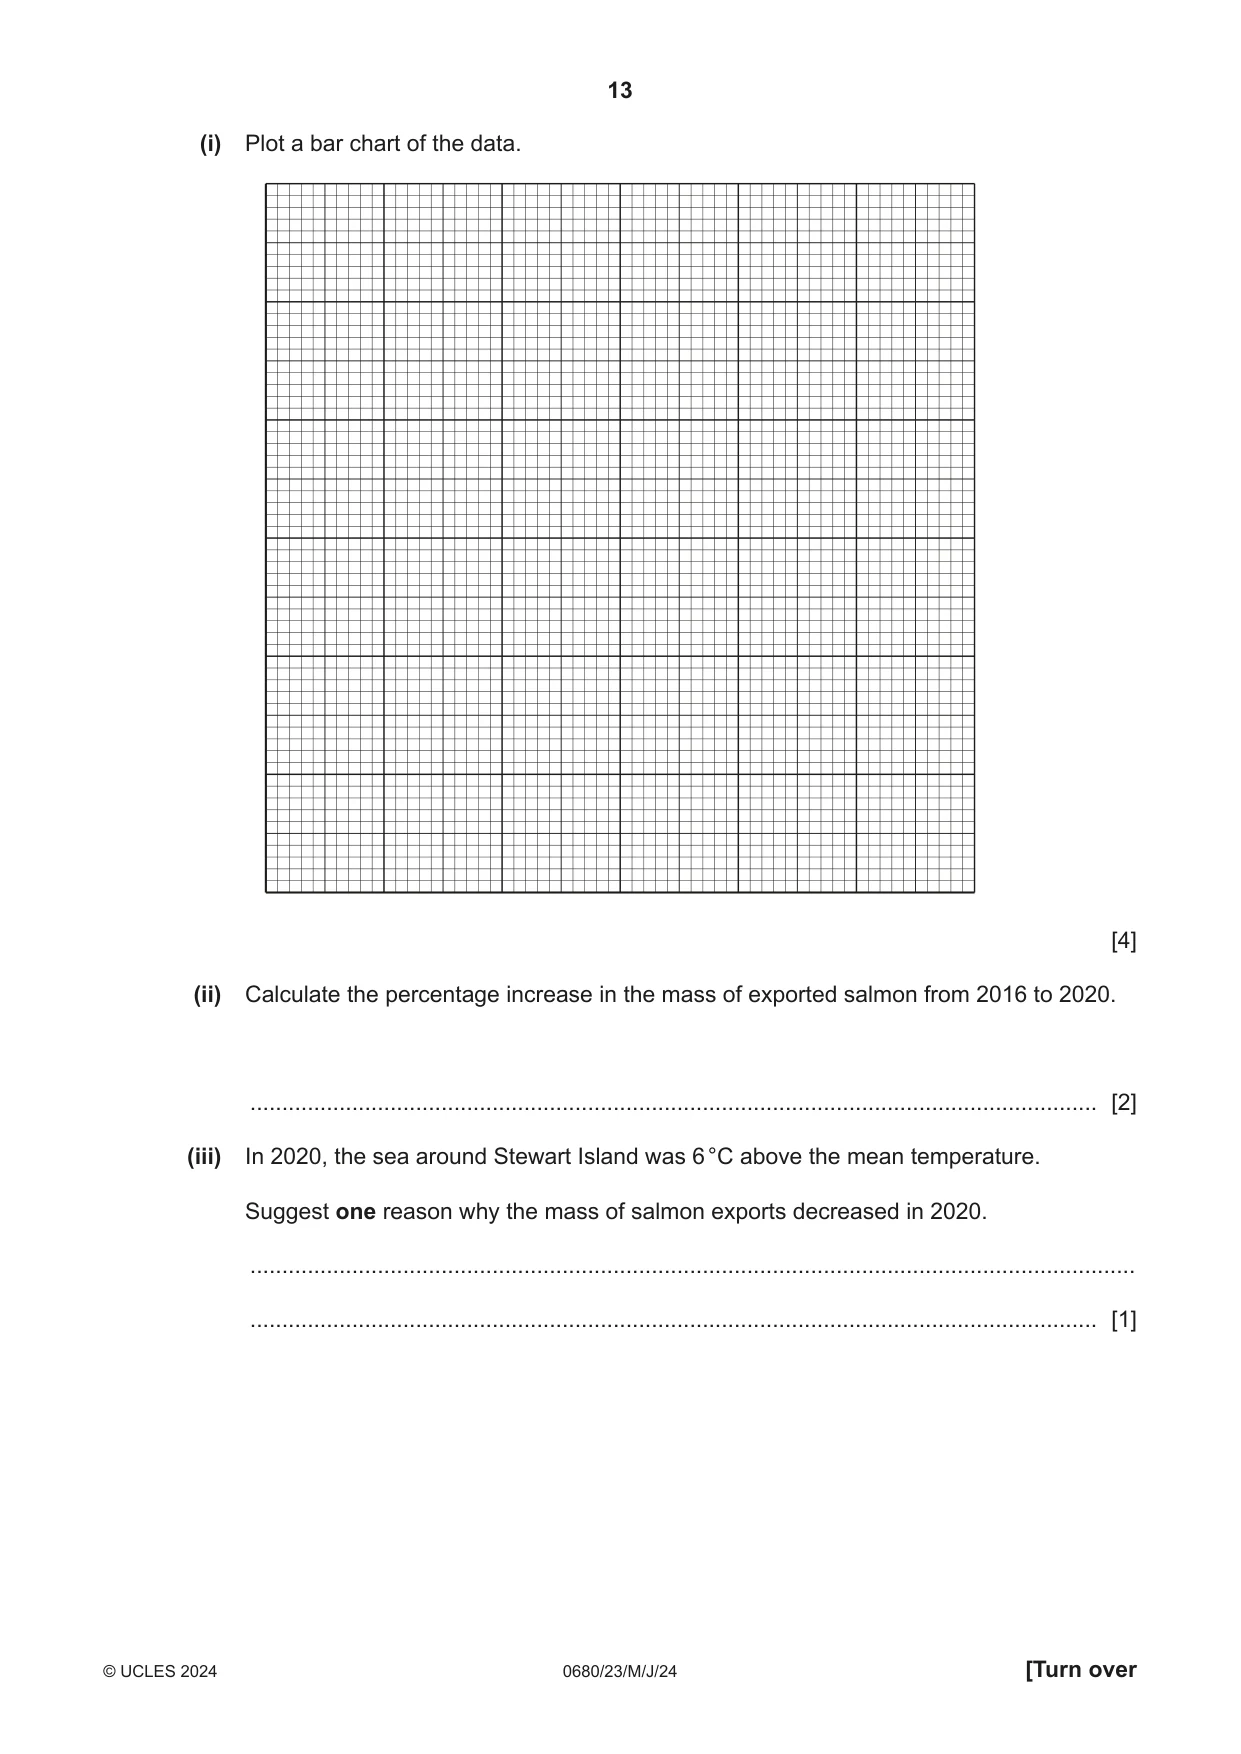
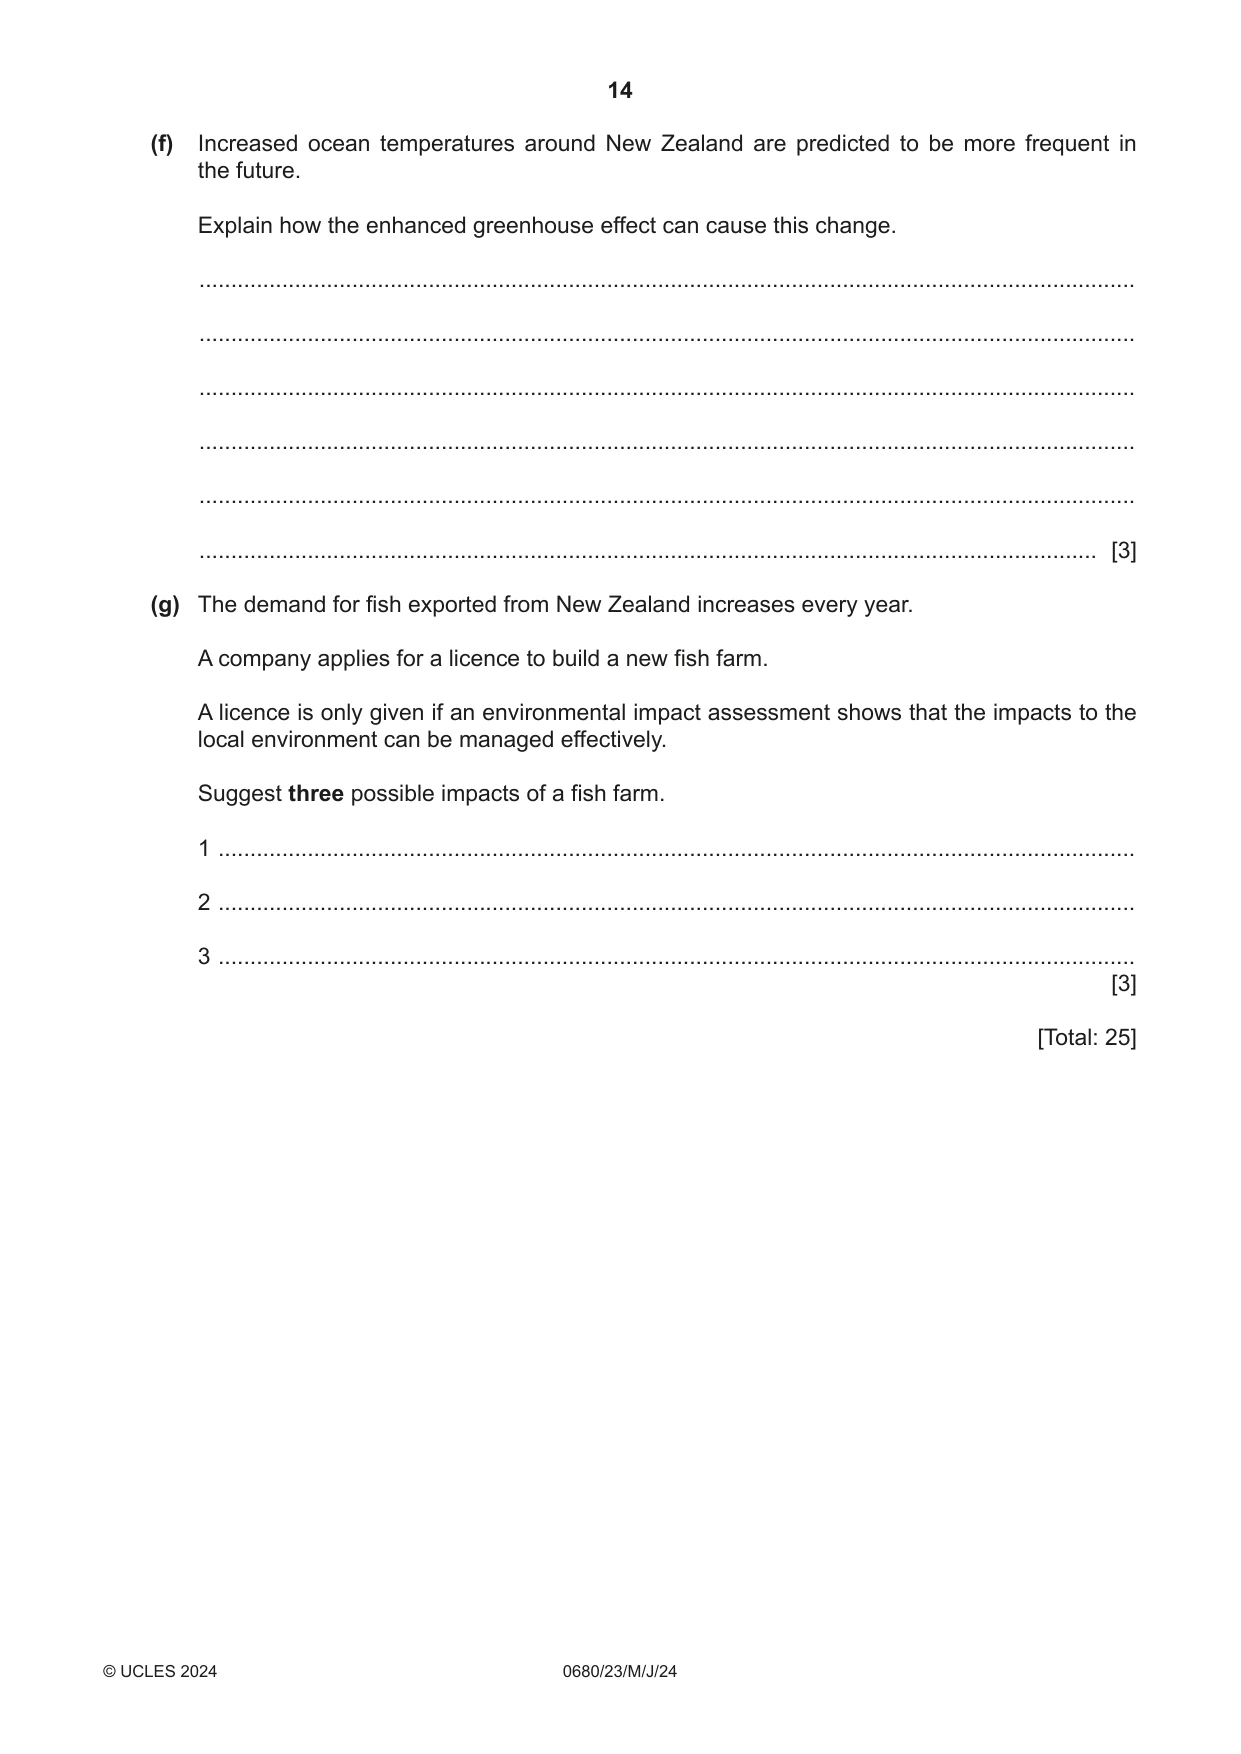
2 The diagram shows a yellow eye mullet fish. 20 mm This fish lives in the ocean around New Zealand. (a) Use the scale to estimate the actual length of the fish shown in the diagram. ....................................................mm [1] (b) A food chain for the yellow eye mullet is shown. algae → shrimp → small fish → yellow eye mullet (i) Explain why algae are producers. ........................................................................................................................................... ........................................................................................................................................... ........................................................................................................................................... ..................................................................................................................................... [2] (ii) Identify the secondary consumer in this food chain. ..................................................................................................................................... [1] (iii) Explain the meaning of the arrows in a food chain. ........................................................................................................................................... ..................................................................................................................................... [1] (iv) Explain the difference between a food chain and a food web. ........................................................................................................................................... ..................................................................................................................................... [1] (c) The total allowable commercial catch (TACC) is the total quantity of each fish species that the commercial fishing industry can catch in a given year. The bar chart shows the catch of yellow eye mullet for an 11-year period from one fishing area. Key annual catch total allowable commercial catch (TACC) 35 30 25 20 catch / tonnes 15 10 5 0 2010 2011 2012 2013 2014 2015 2016 2017 2018 2019 2020 fishing year (i) Complete the sentences. The highest annual catch was ............. tonnes. The lowest annual catch was ............. tonnes. [1] (ii) A scientist said: The graph shows that fishing for yellow eye mullet is a sustainable activity. Describe one piece of evidence from the graph that supports this view. ........................................................................................................................................... ..................................................................................................................................... [1] (iii) Another scientist considers three management options to support sustainable fishing. option one Reduce the TACC to 29 tonnes per year. option two Reduce the TACC to 17 tonnes per year. option three Reduce the TACC to 10 tonnes per year. Suggest one reason why the scientist recommends option three to manage this fishing area. ........................................................................................................................................... ..................................................................................................................................... [1] (d) Quotas are one strategy for managing this fishing area. State three other management strategies that can keep a fishing area sustainable in the future. 1 ................................................................................................................................................ ................................................................................................................................................... 2 ................................................................................................................................................ ................................................................................................................................................... 3 ................................................................................................................................................ ................................................................................................................................................... [3] (e) There is salmon fish farming in the cold water around Stewart Island. The photograph shows sea cages full of salmon. The table shows the exports of salmon from New Zealand between 2016 and 2020. mass of salmon exported year / thousand tonnes 2016 3.8 2017 4.4 2018 5.0 2019 5.3 2020 4.6 (i) Plot a bar chart of the data. [4] (ii) Calculate the percentage increase in the mass of exported salmon from 2016 to 2020. ..................................................................................................................................... [2] (iii) In 2020, the sea around Stewart Island was 6 °C above the mean temperature. Suggest one reason why the mass of salmon exports decreased in 2020. ........................................................................................................................................... ..................................................................................................................................... [1] (f) Increased ocean temperatures around New Zealand are predicted to be more frequent in the future. Explain how the enhanced greenhouse effect can cause this change. ................................................................................................................................................... ................................................................................................................................................... ................................................................................................................................................... ................................................................................................................................................... ................................................................................................................................................... ............................................................................................................................................. [3] (g) The demand for fish exported from New Zealand increases every year. A company applies for a licence to build a new fish farm. A licence is only given if an environmental impact assessment shows that the impacts to the local environment can be managed effectively. Suggest three possible impacts of a fish farm. 1 ................................................................................................................................................ 2 ................................................................................................................................................ 3 ................................................................................................................................................ [3] [Total: 25]
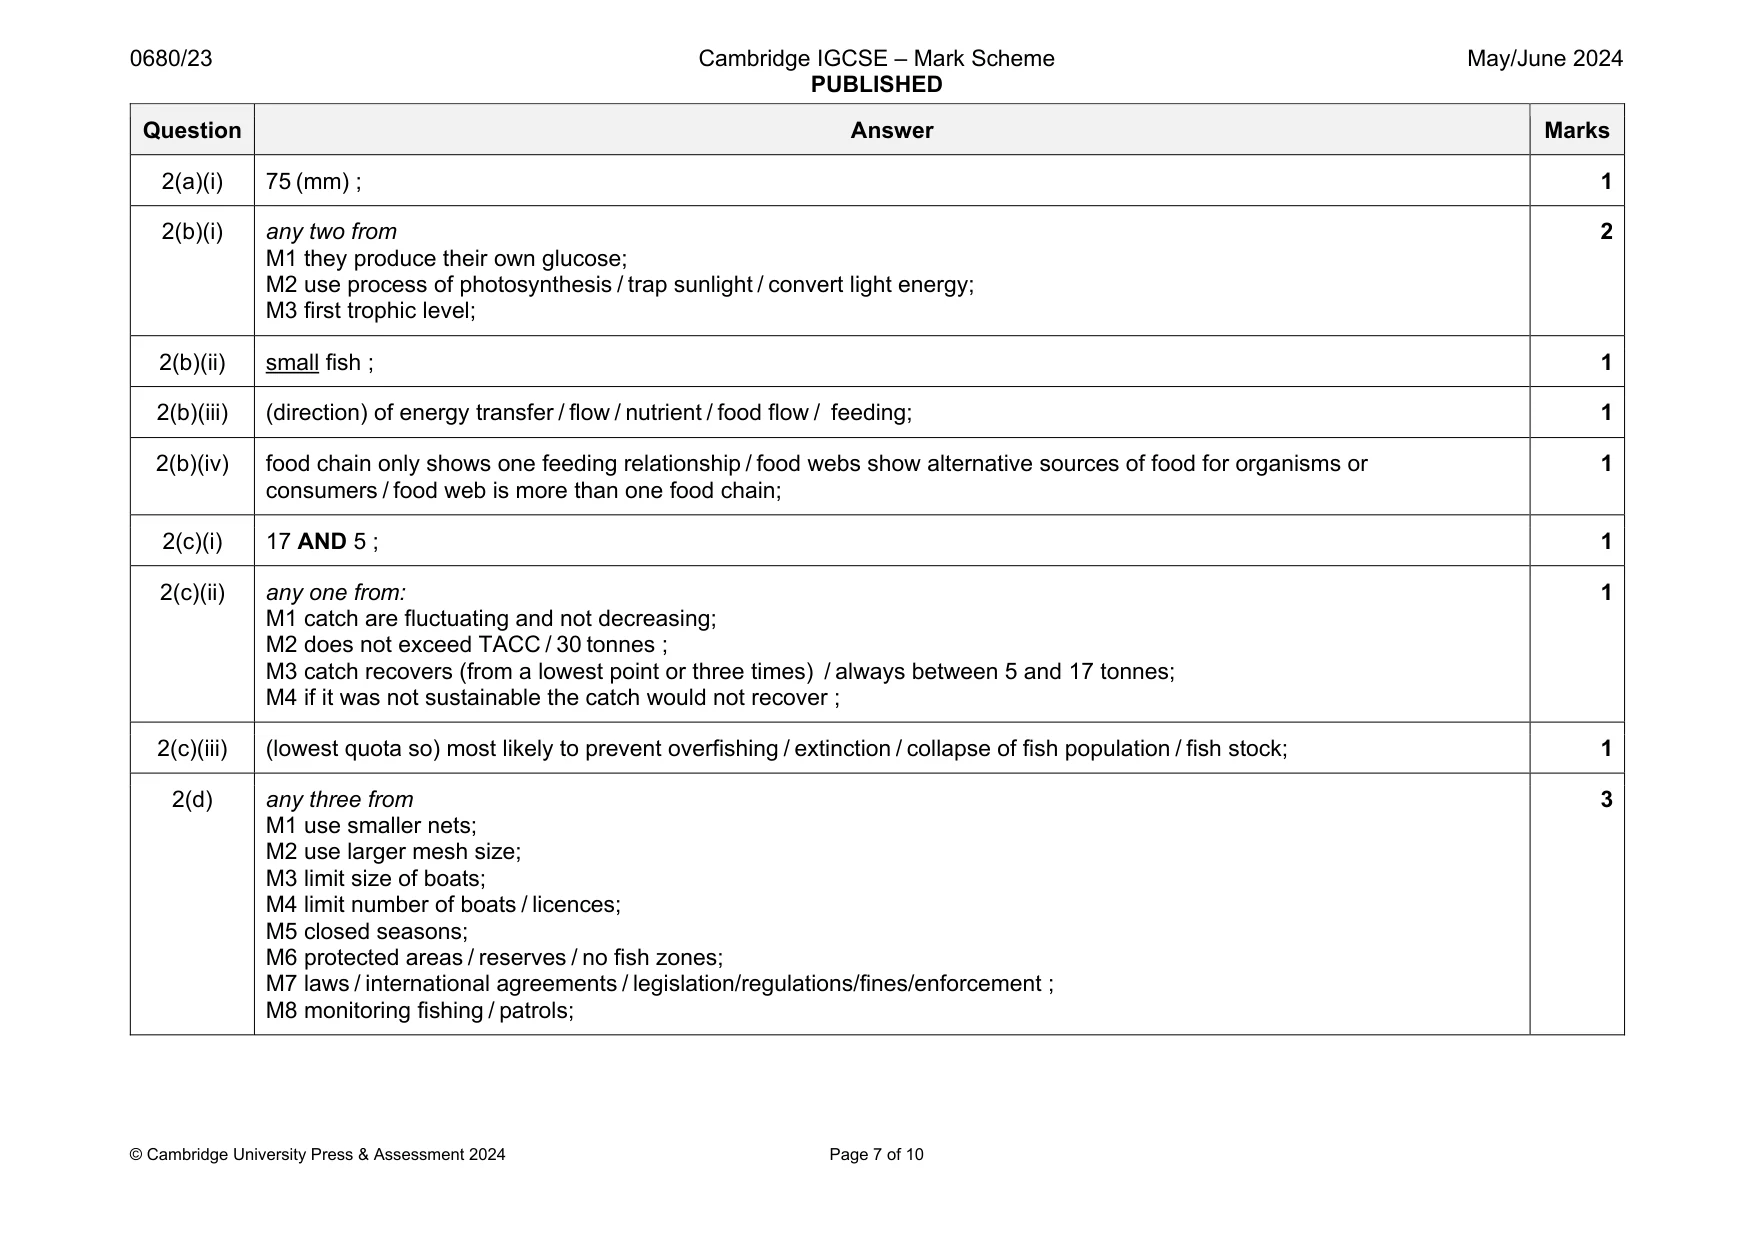
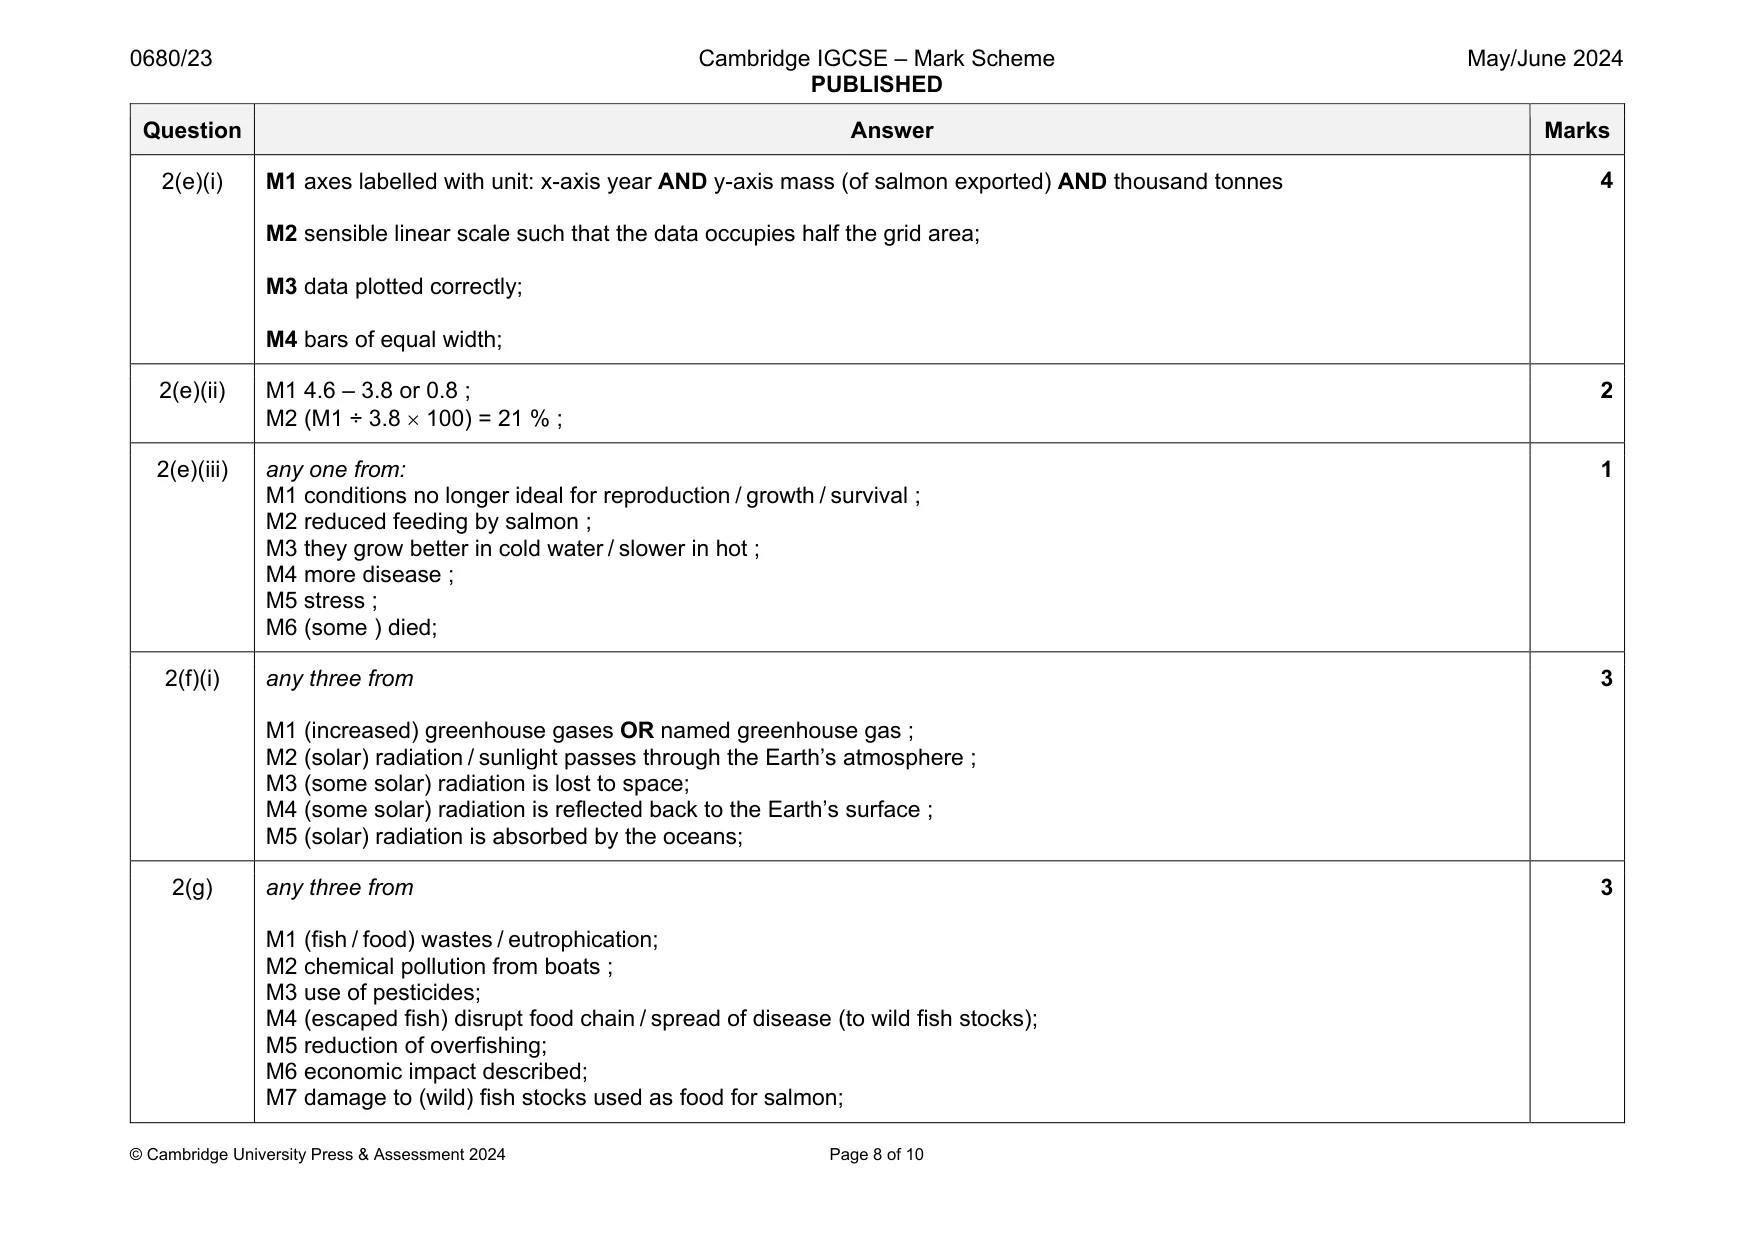
Mark scheme: 2(a)(i) 75 (mm) ; 1 2(b)(i) any two from M1 they produce their own glucose; M2 use process of photosynthesis / trap sunlight / convert light energy; M3 first trophic level; 2 2(b)(ii) small fish ; 1 2(b)(iii) (direction) of energy transfer / flow / nutrient / food flow / feeding; 1 2(b)(iv) food chain only shows one feeding relationship / food webs show alternative sources of food for organisms or consumers / food web is more than one food chain; 1 2(c)(i) 17 AND 5 ; 1 2(c)(ii) any one from: M1 catch are fluctuating and not decreasing; M2 does not exceed TACC / 30 tonnes ; M3 catch recovers (from a lowest point or three times) / always between 5 and 17 tonnes; M4 if it was not sustainable the catch would not recover ; 1 2(c)(iii) (lowest quota so) most likely to prevent overfishing / extinction / collapse of fish population / fish stock; 1 2(d) any three from M1 use smaller nets; M2 use larger mesh size; M3 limit size of boats; M4 limit number of boats / licences; M5 closed seasons; M6 protected areas / reserves / no fish zones; M7 laws / international agreements / legislation/regulations/fines/enforcement ; M8 monitoring fishing / patrols; 3 Question Answer Marks 2(e)(i) M1 axes labelled with unit: x-axis year AND y-axis mass (of salmon exported) AND thousand tonnes M2 sensible linear scale such that the data occupies half the grid area; M3 data plotted correctly; M4 bars of equal width; 4 2(e)(ii) M1 4.6 – 3.8 or 0.8 ; M2 (M1 ÷ 3.8 100) = 21 % ; 2 2(e)(iii) any one from: M1 conditions no longer ideal for reproduction / growth / survival ; M2 reduced feeding by salmon ; M3 they grow better in cold water / slower in hot ; M4 more disease ; M5 stress ; M6 (some ) died; 1 2(f)(i) any three from M1 (increased) greenhouse gases OR named greenhouse gas ; M2 (solar) radiation / sunlight passes through the Earth’s atmosphere ; M3 (some solar) radiation is lost to space; M4 (some solar) radiation is reflected back to the Earth’s surface ; M5 (solar) radiation is absorbed by the oceans; 3 2(g) any three from M1 (fish / food) wastes / eutrophication; M2 chemical pollution from boats ; M3 use of pesticides; M4 (escaped fish) disrupt food chain / spread of disease (to wild fish stocks); M5 reduction of overfishing; M6 economic impact described; M7 damage to (wild) fish stocks used as food for salmon; 3
Q3 · The photograph shows a gold and silver mine on North Island
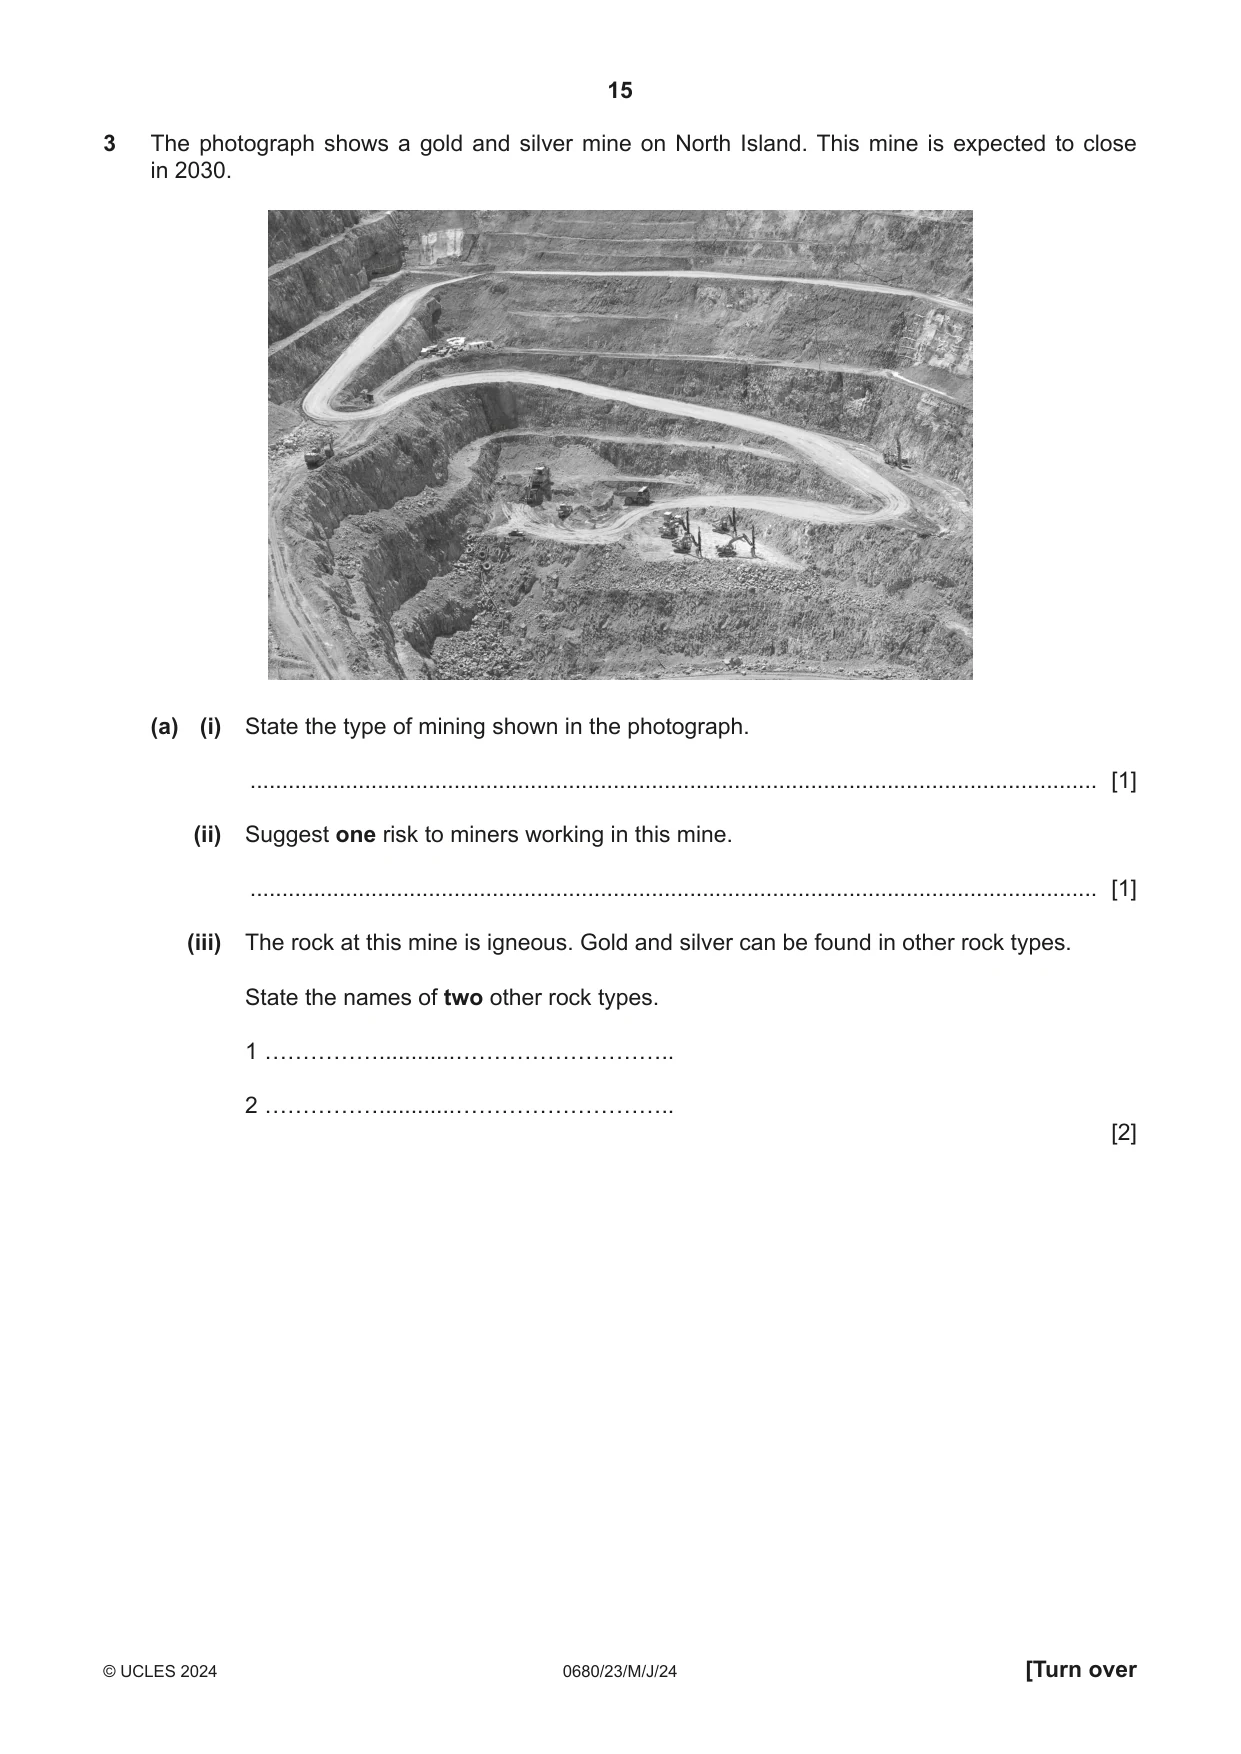
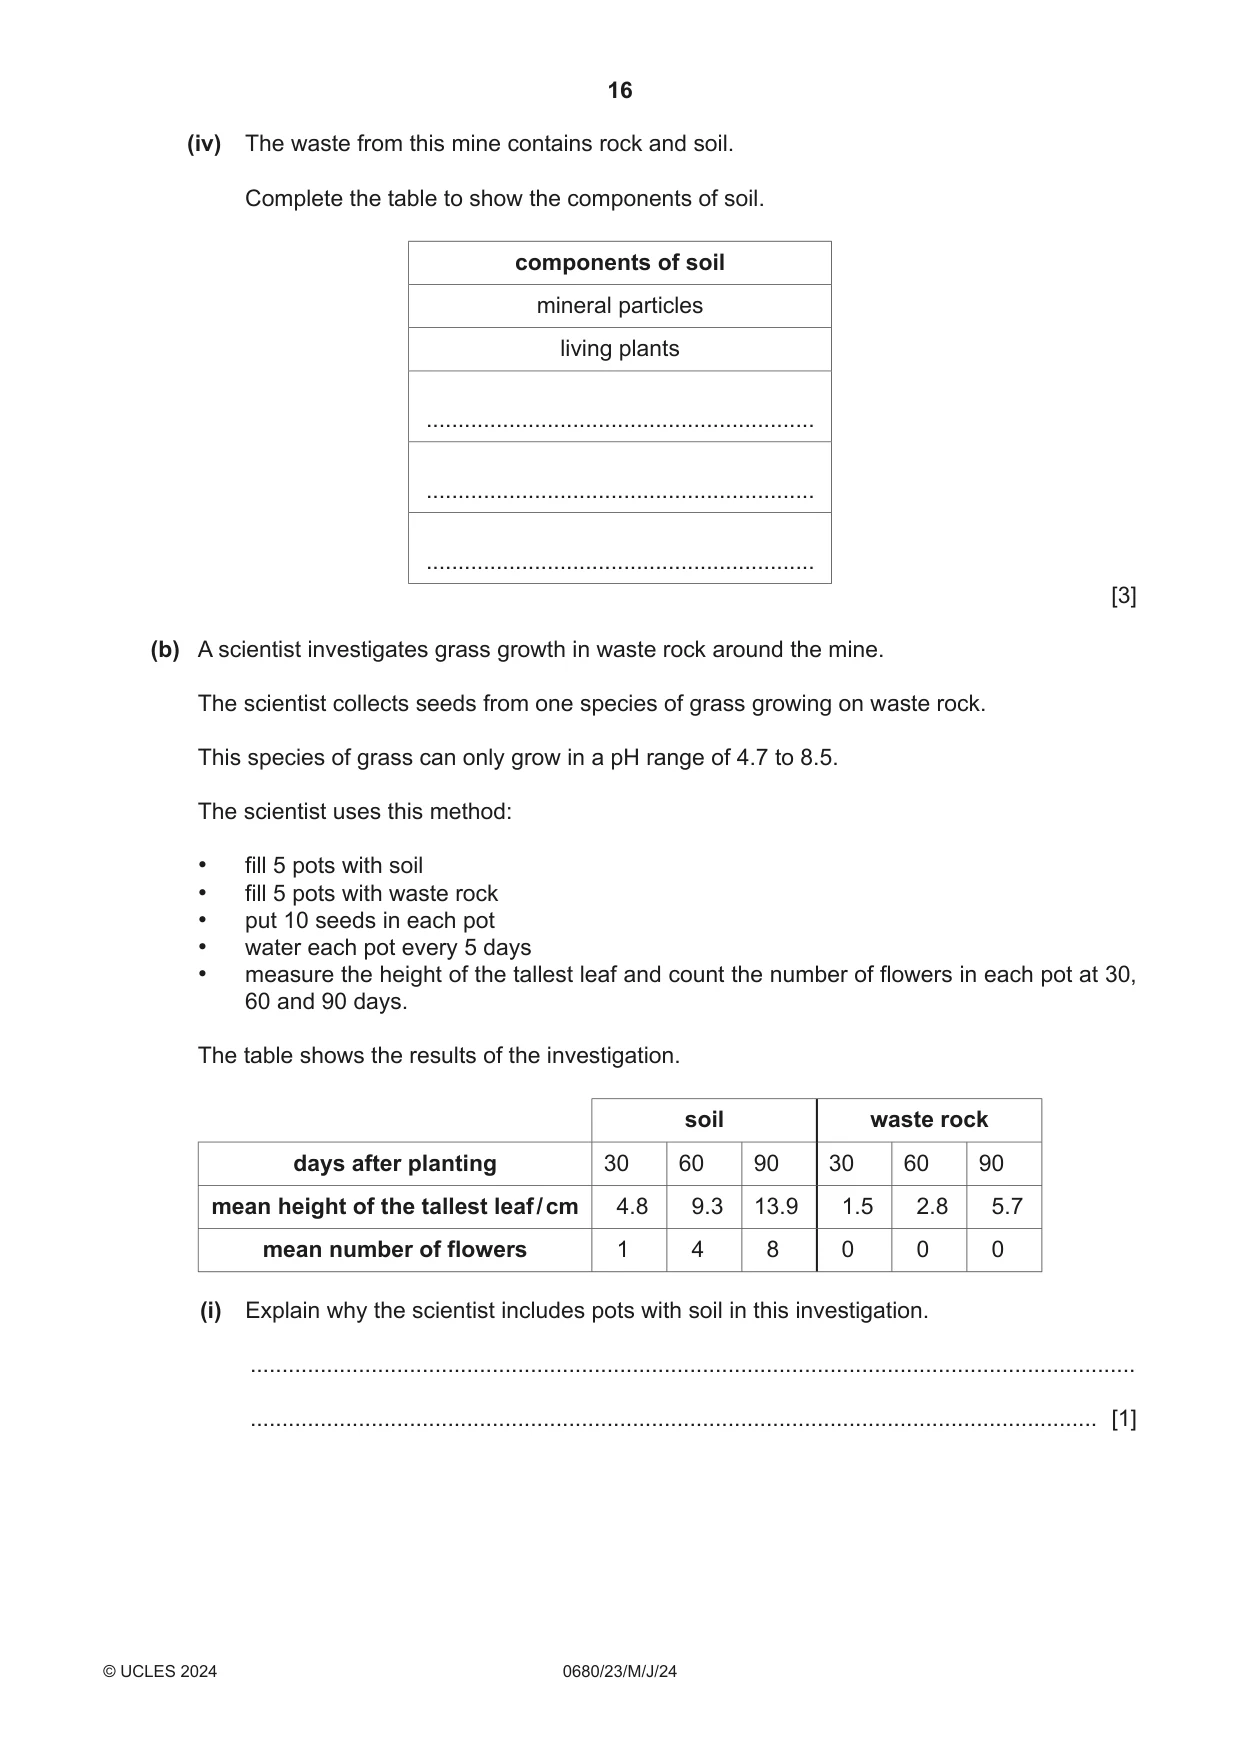
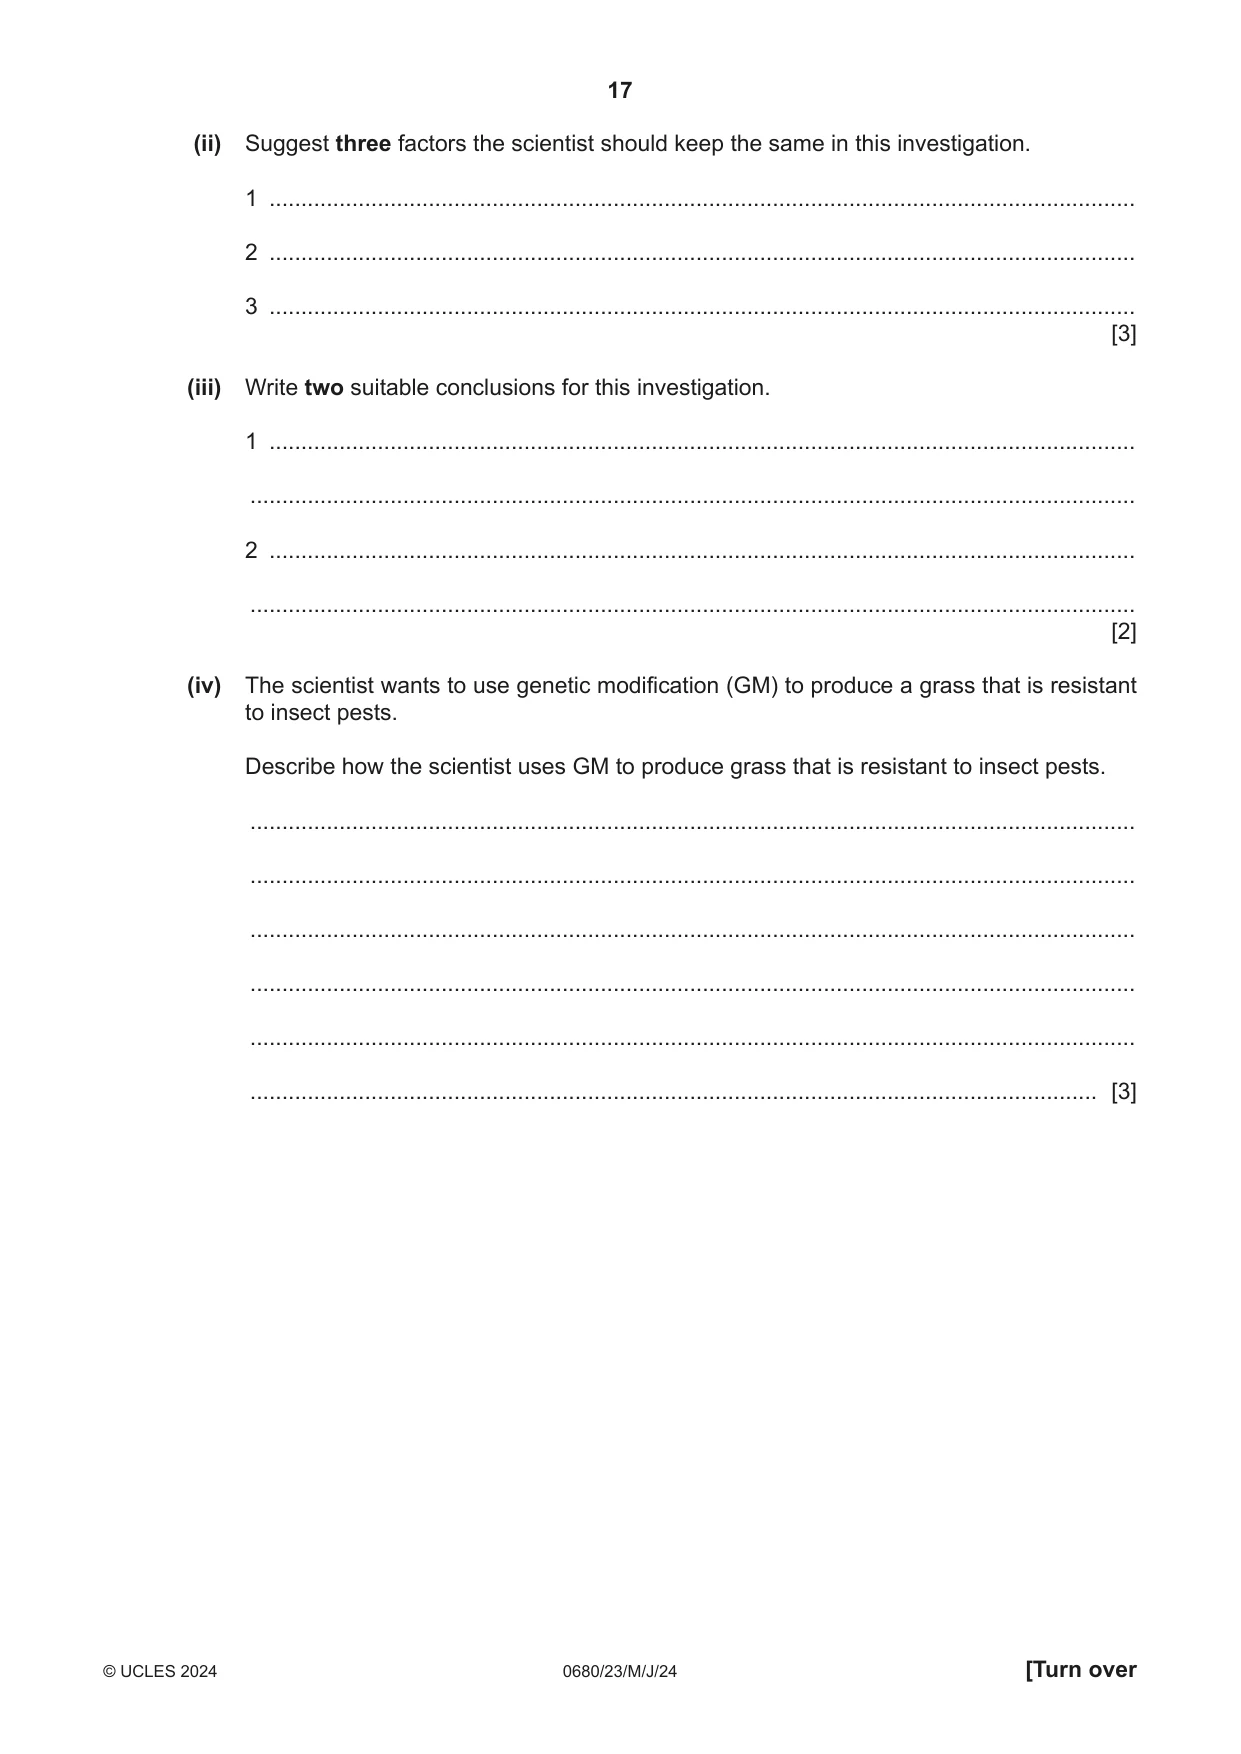
3 The photograph shows a gold and silver mine on North Island. This mine is expected to close in 2030. (a) (i) State the type of mining shown in the photograph. ..................................................................................................................................... [1] (ii) Suggest one risk to miners working in this mine. ..................................................................................................................................... [1] (iii) The rock at this mine is igneous. Gold and silver can be found in other rock types. State the names of two other rock types. 1 ……………............……………………….. 2 ……………............……………………….. [2] (iv) The waste from this mine contains rock and soil. Complete the table to show the components of soil. components of soil mineral particles living plants ............................................................. ............................................................. ............................................................. [3] (b) A scientist investigates grass growth in waste rock around the mine. The scientist collects seeds from one species of grass growing on waste rock. This species of grass can only grow in a pH range of 4.7 to 8.5. The scientist uses this method: • fill 5 pots with soil • fill 5 pots with waste rock • put 10 seeds in each pot • water each pot every 5 days • measure the height of the tallest leaf and count the number of flowers in each pot at 30, 60 and 90 days. The table shows the results of the investigation. soil waste rock days after planting 30 60 90 30 60 90 mean height of the tallest leaf / cm 4.8 9.3 13.9 1.5 2.8 5.7 mean number of flowers 1 4 8 0 0 0 (i) Explain why the scientist includes pots with soil in this investigation. ........................................................................................................................................... ..................................................................................................................................... [1] (ii) Suggest three factors the scientist should keep the same in this investigation. 1 ........................................................................................................................................ 2 ........................................................................................................................................ 3 ........................................................................................................................................ [3] (iii) Write two suitable conclusions for this investigation. 1 ........................................................................................................................................ ........................................................................................................................................... 2 ........................................................................................................................................ ........................................................................................................................................... [2] (iv) The scientist wants to use genetic modification (GM) to produce a grass that is resistant to insect pests. Describe how the scientist uses GM to produce grass that is resistant to insect pests. ........................................................................................................................................... ........................................................................................................................................... ........................................................................................................................................... ........................................................................................................................................... ........................................................................................................................................... ..................................................................................................................................... [3]
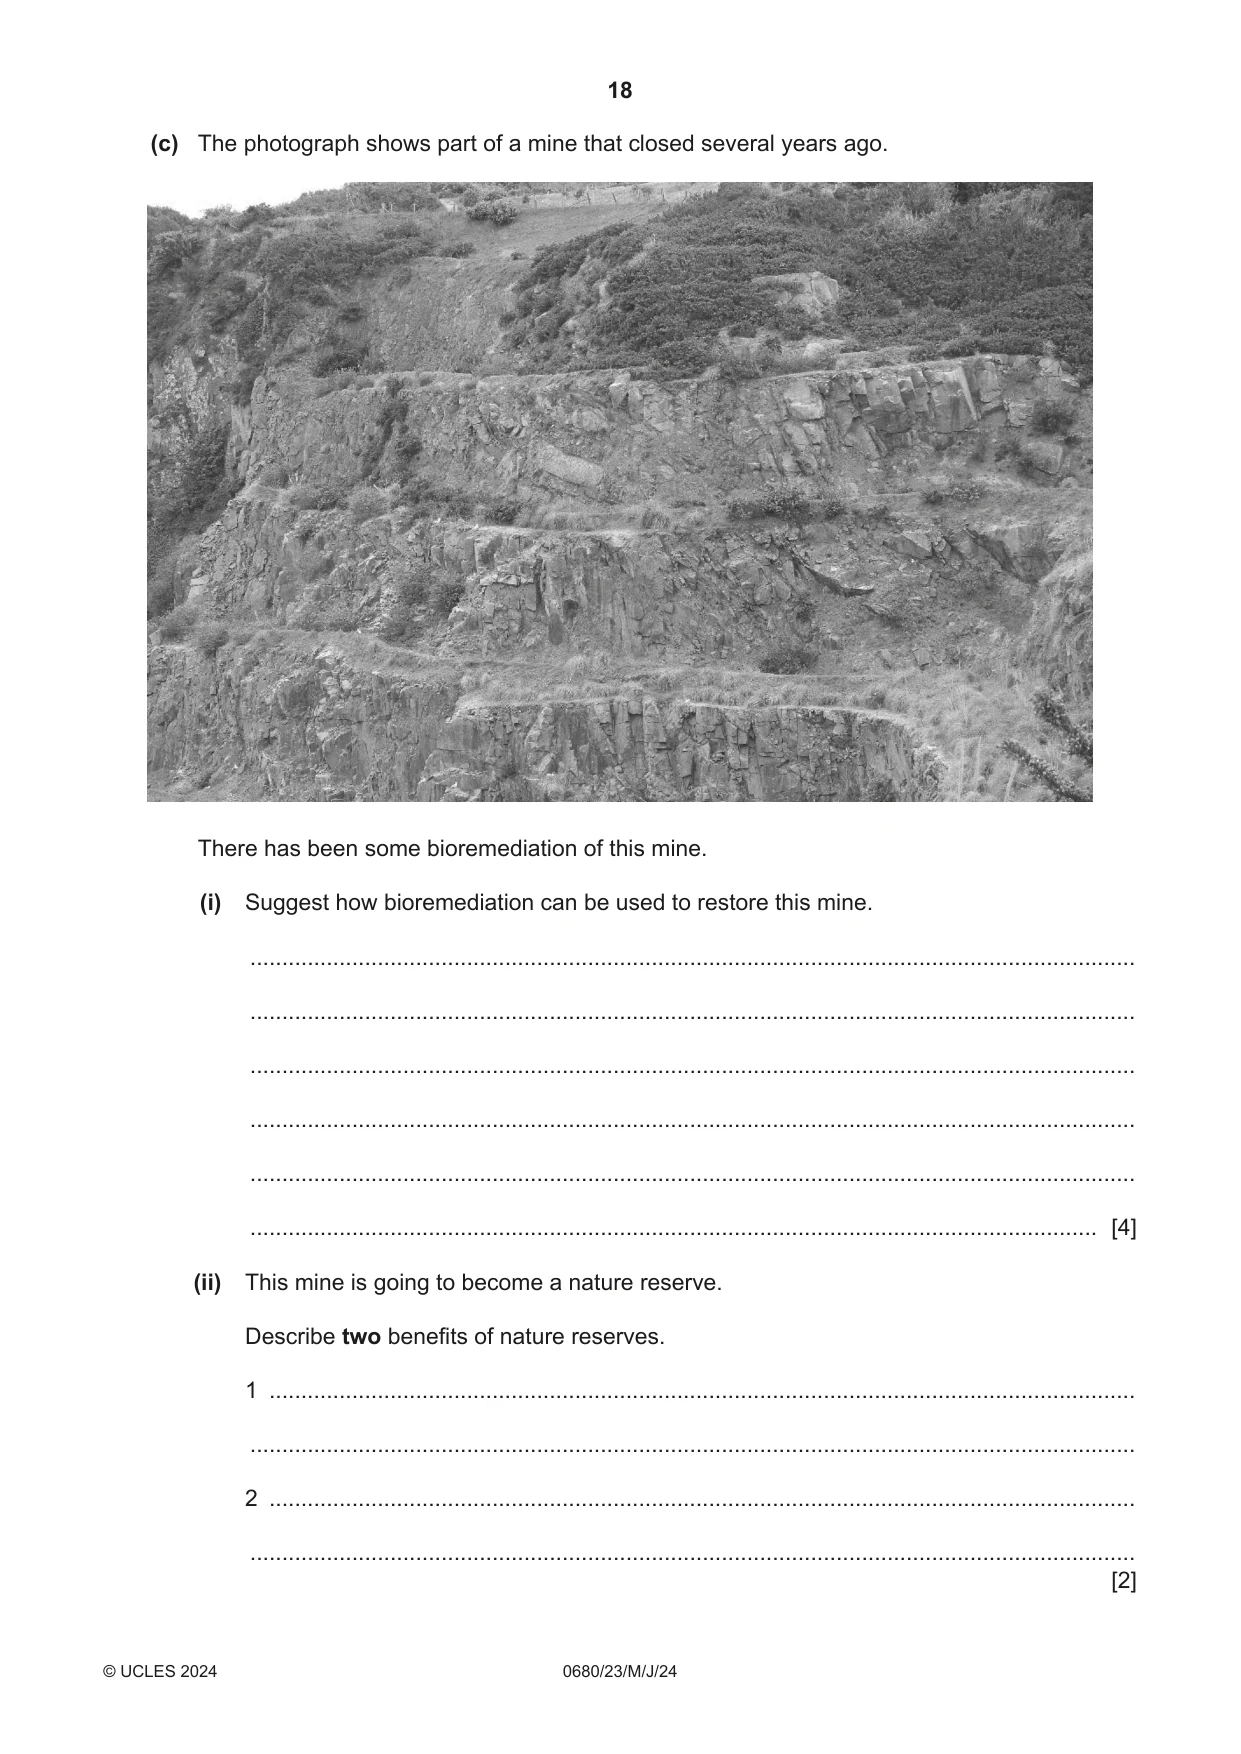
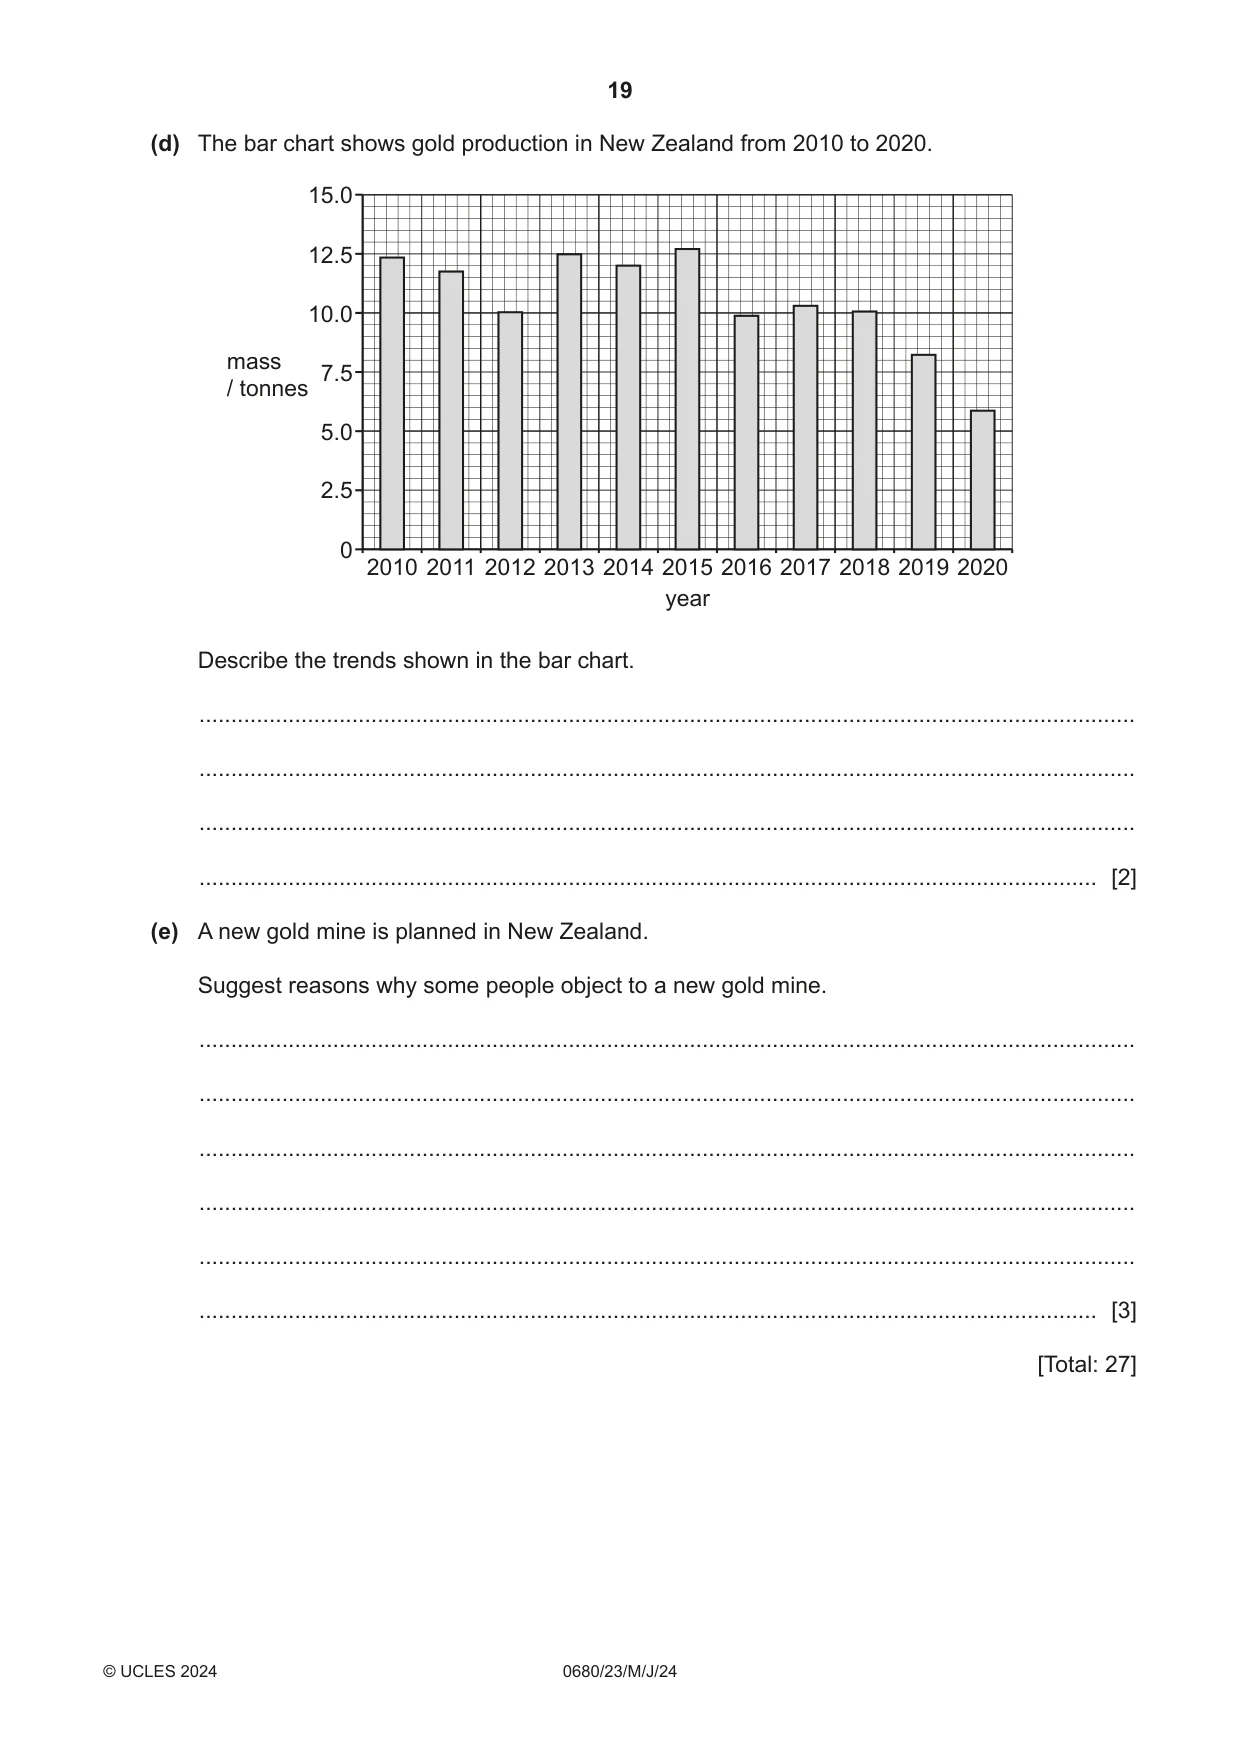
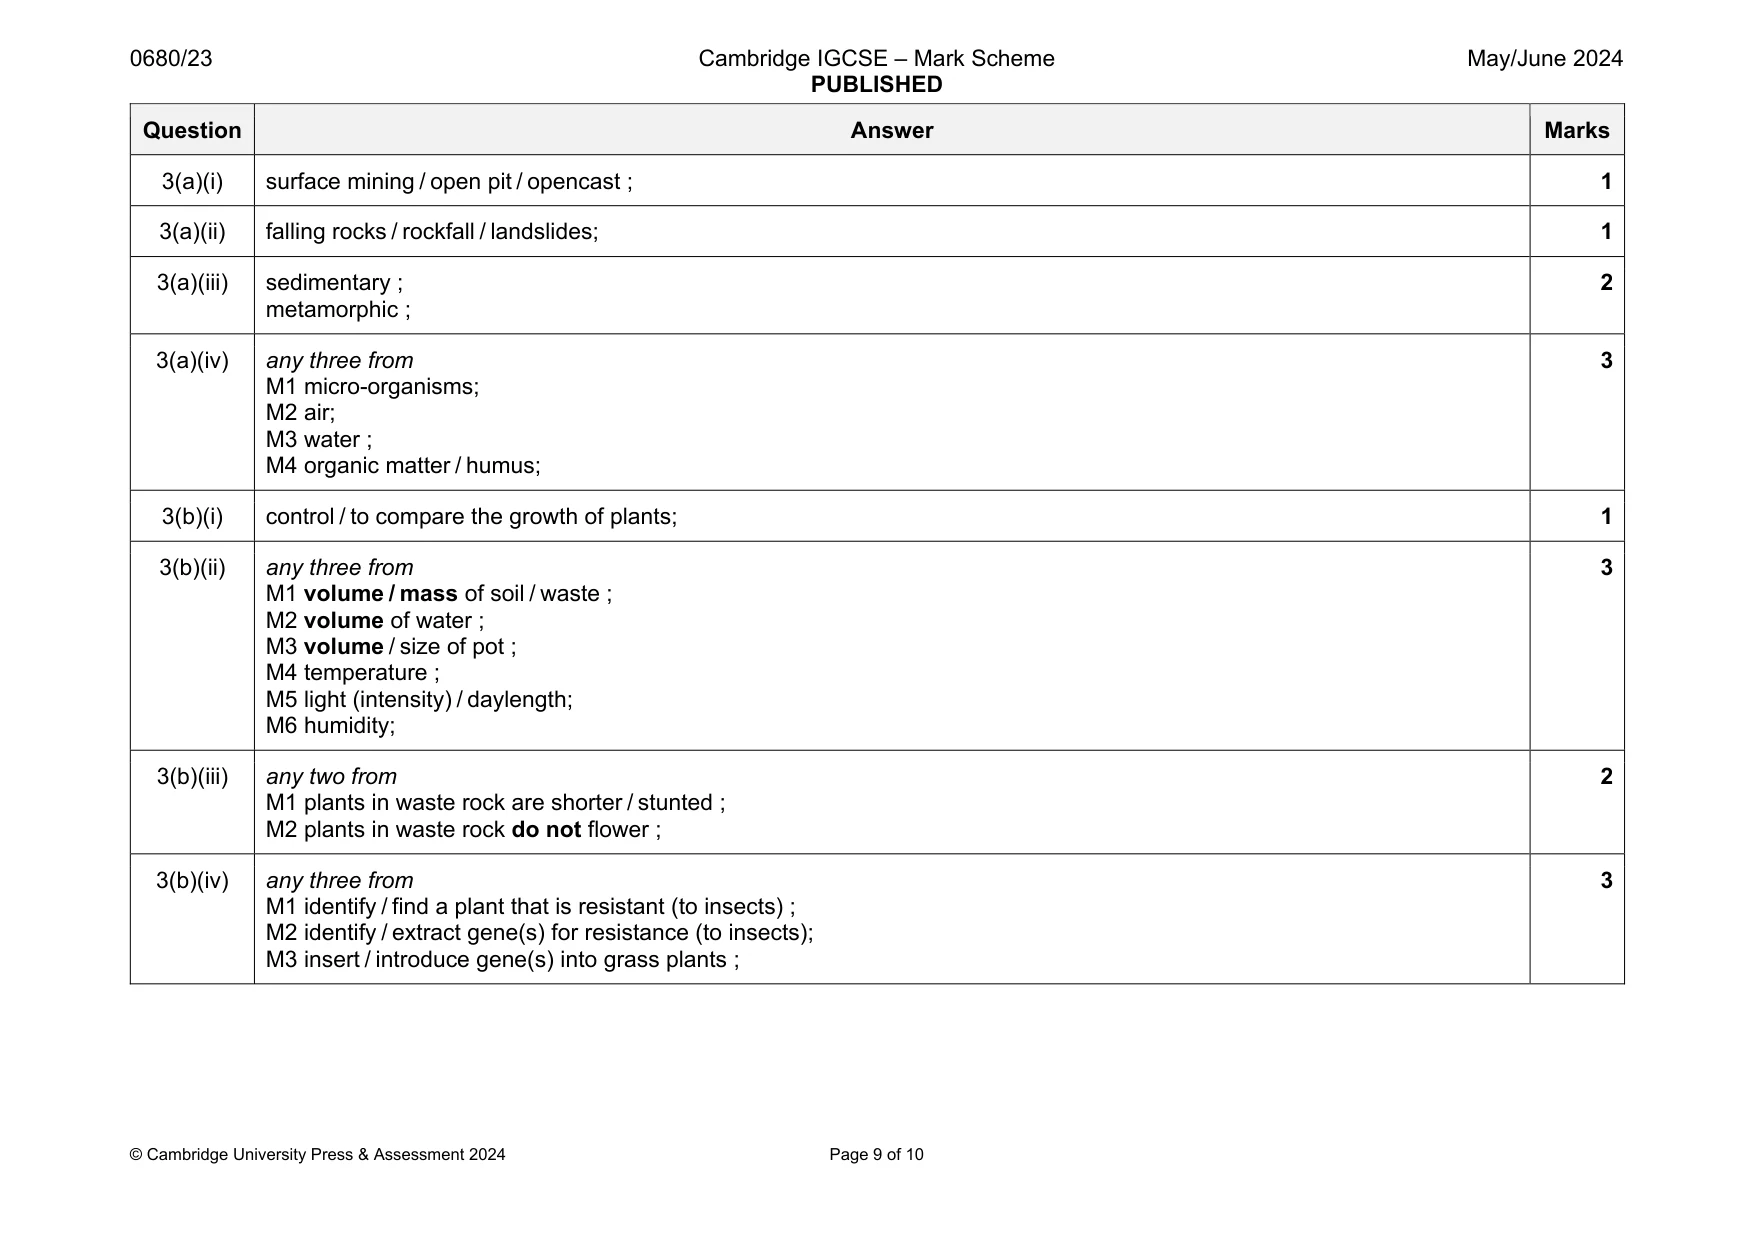
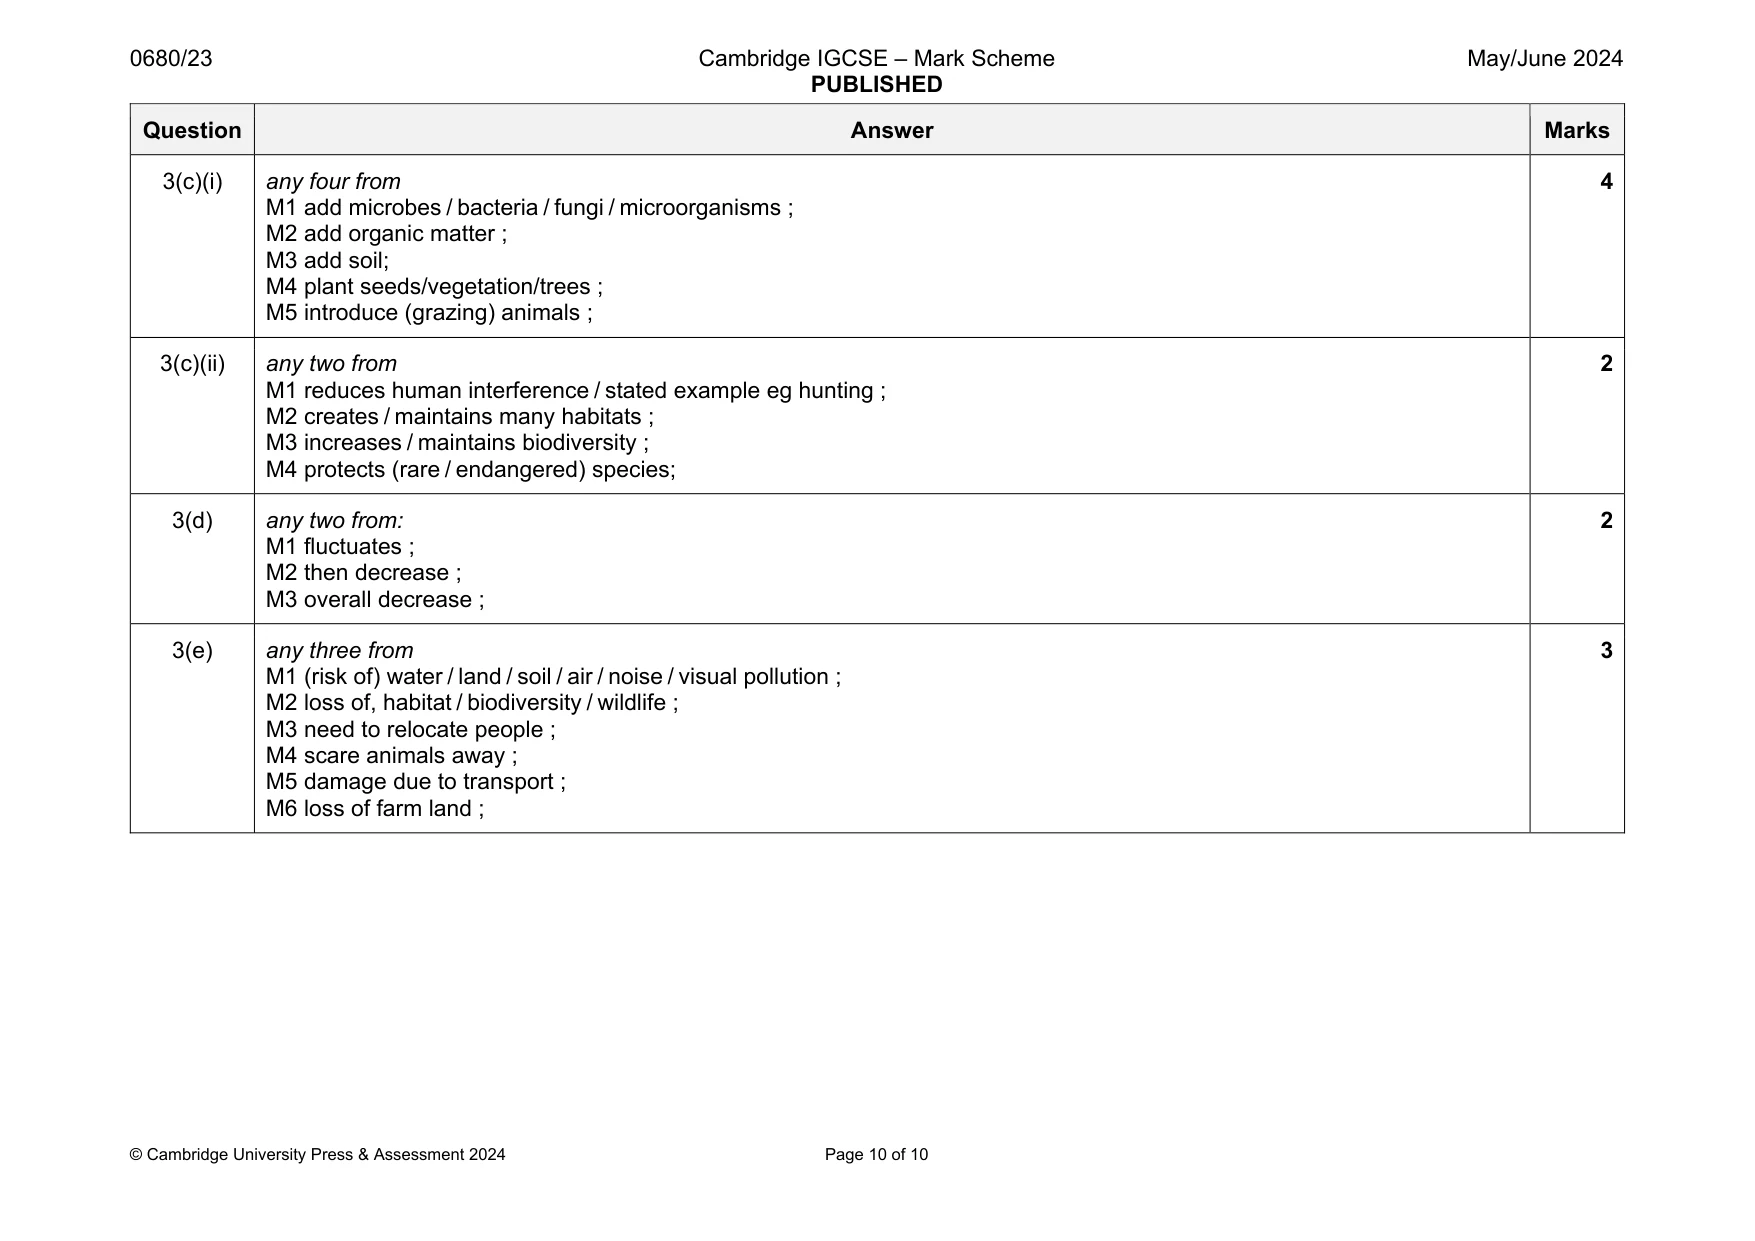
Mark scheme: 3(a)(i) surface mining / open pit / opencast ; 1 3(a)(ii) falling rocks / rockfall / landslides; 1 3(a)(iii) sedimentary ; metamorphic ; 2 3(a)(iv) any three from M1 micro-organisms; M2 air; M3 water ; M4 organic matter / humus; 3 3(b)(i) control / to compare the growth of plants; 1 3(b)(ii) any three from M1 volume / mass of soil / waste ; M2 volume of water ; M3 volume / size of pot ; M4 temperature ; M5 light (intensity) / daylength; M6 humidity; 3 3(b)(iii) any two from M1 plants in waste rock are shorter / stunted ; M2 plants in waste rock do not flower ; 2 3(b)(iv) any three from M1 identify / find a plant that is resistant (to insects) ; M2 identify / extract gene(s) for resistance (to insects); M3 insert / introduce gene(s) into grass plants ; 3 Question Answer Marks 3(c)(i) any four from M1 add microbes / bacteria / fungi / microorganisms ; M2 add organic matter ; M3 add soil; M4 plant seeds/vegetation/trees ; M5 introduce (grazing) animals ; 4 3(c)(ii) any two from M1 reduces human interference / stated example eg hunting ; M2 creates / maintains many habitats ; M3 increases / maintains biodiversity ; M4 protects (rare / endangered) species; 2 3(d) any two from: M1 fluctuates ; M2 then decrease ; M3 overall decrease ; 2 3(e) any three from M1 (risk of) water / land / soil / air / noise / visual pollution ; M2 loss of, habitat / biodiversity / wildlife ; M3 need to relocate people ; M4 scare animals away ; M5 damage due to transport ; M6 loss of farm land ; 3
What was in this paper
The subtopics covered by these 3 questions, and how many questions each got. Open one in a new tab to see every Cambridge question on it.
What you needed in this session
Cambridge’s own grade thresholds for 2024 May/June, Paper 2 · Variant 3. A higher threshold means an easier paper — the bar moves with how the cohort did.