Cambridge IGCSE Environmental Management 0680 — 2025 Oct/Nov Paper 2 · Variant 1
0680/21/O/N/25 · 5 questions · 80 marks · 105 min
The question paper and its mark scheme, free to read here and free to download. This is Cambridge’s own paper, exactly as it was sat.
Question paper24 pages

Mark scheme15 pages
Answers below. Sit the paper first if you are practising.
Questions as text
Q1 · The population of Amsterdam in 2023 was 1 174 025
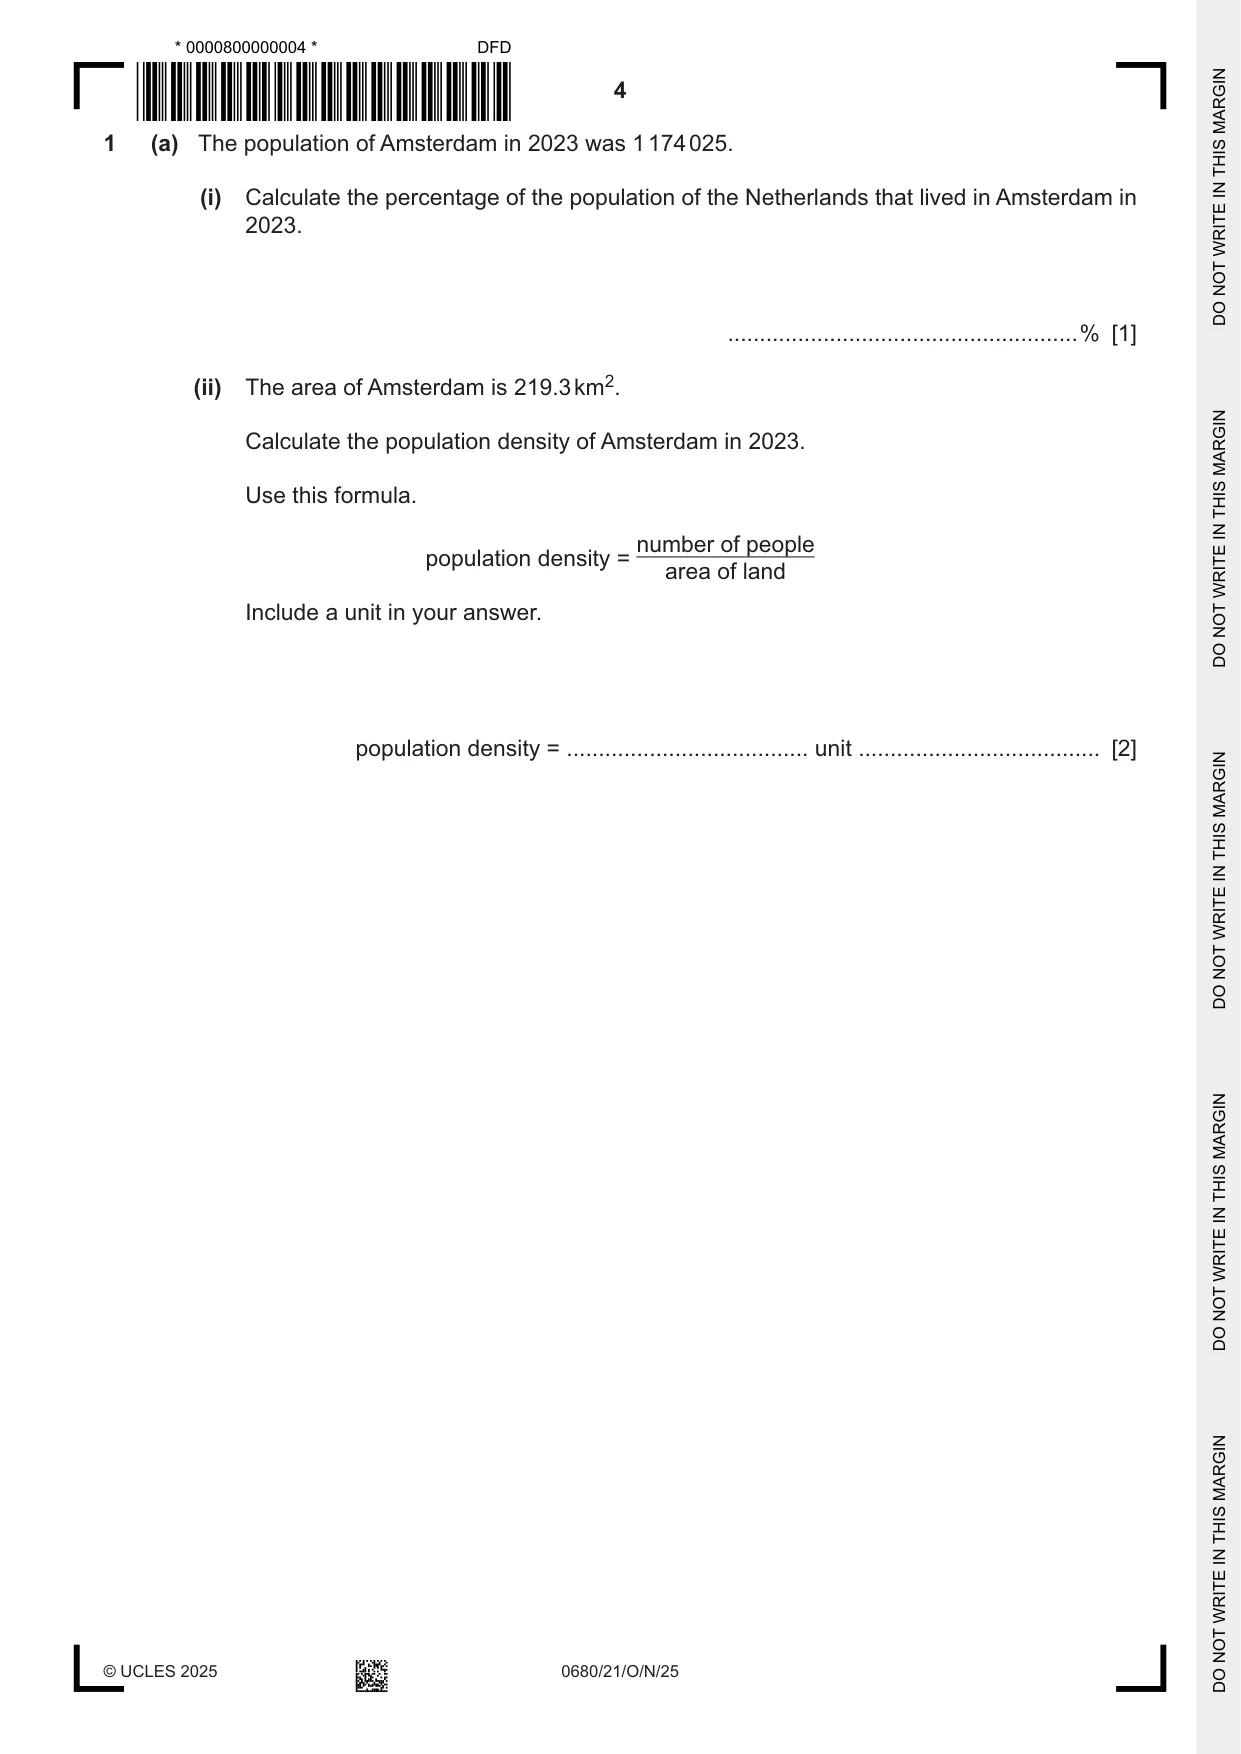
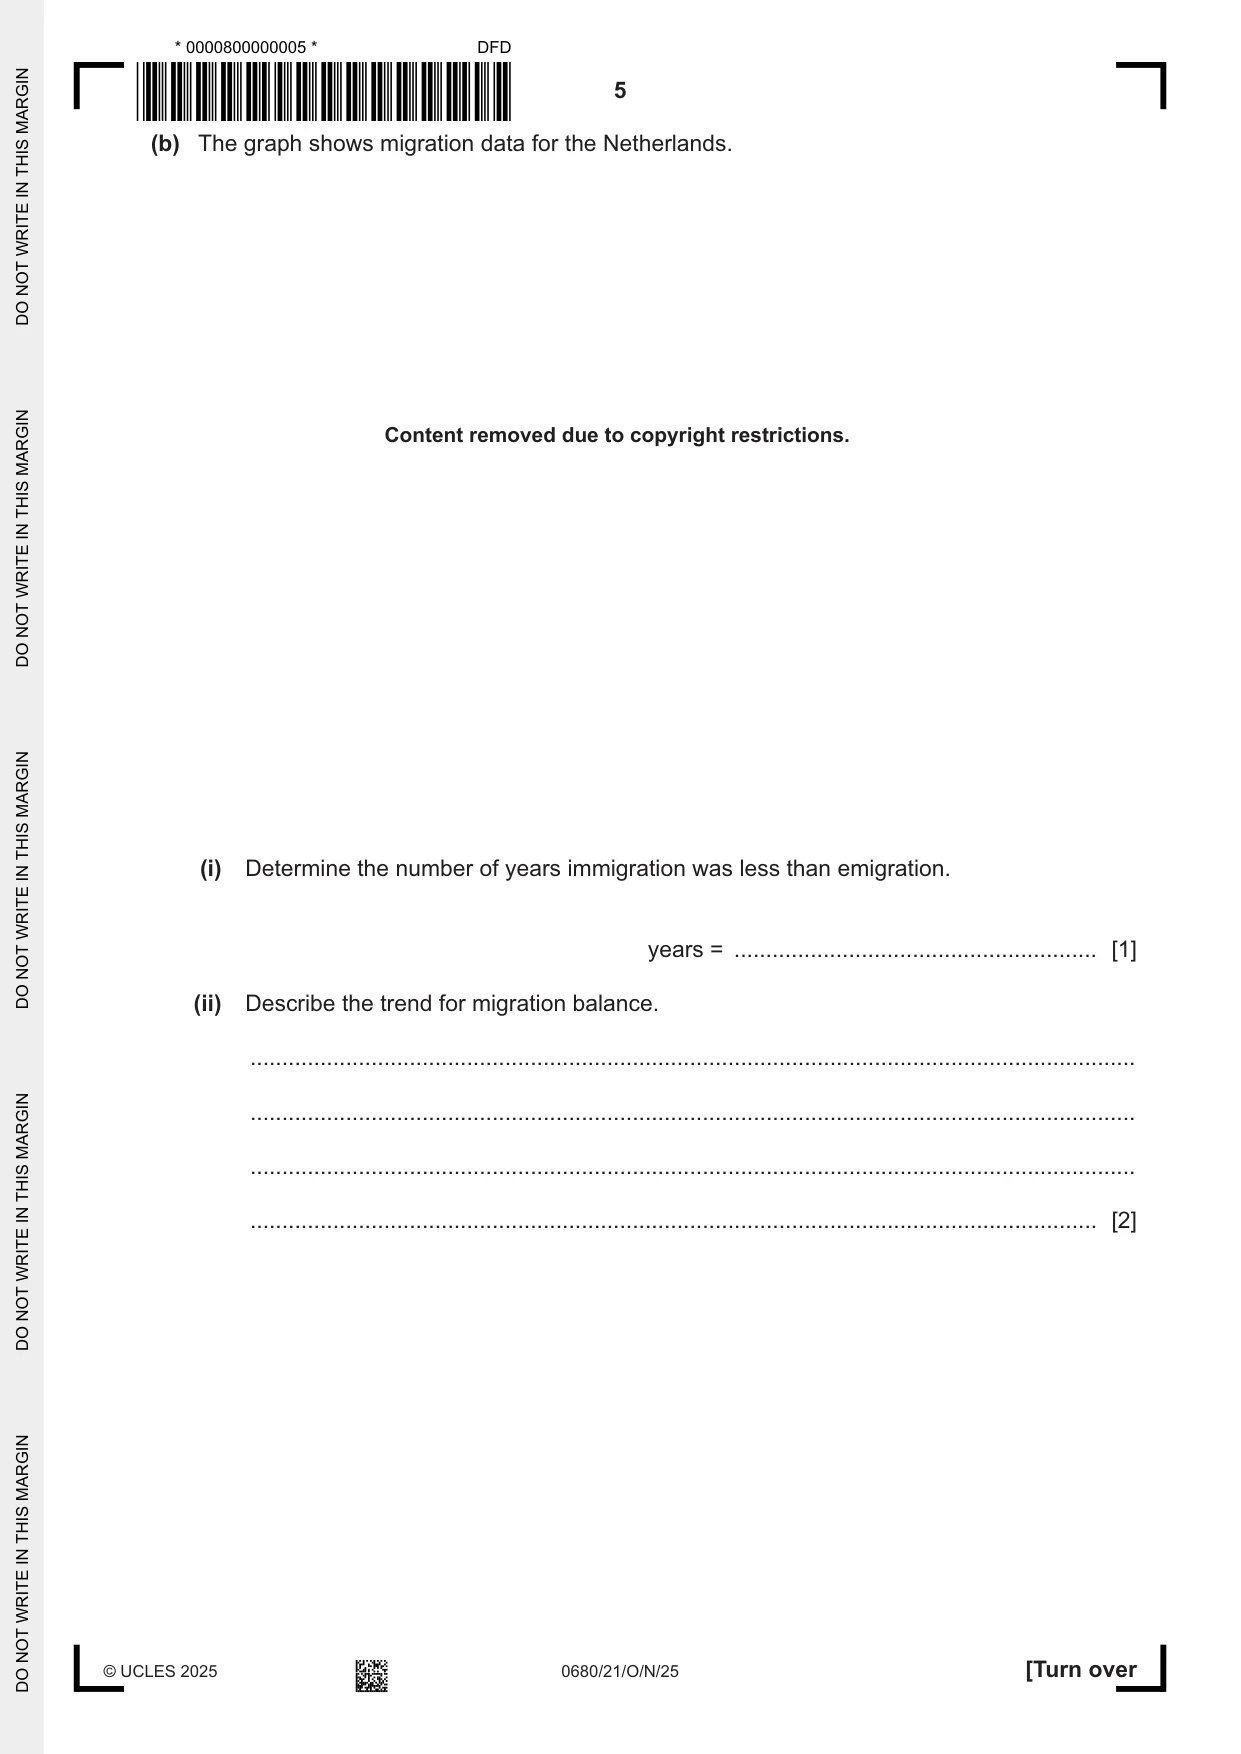
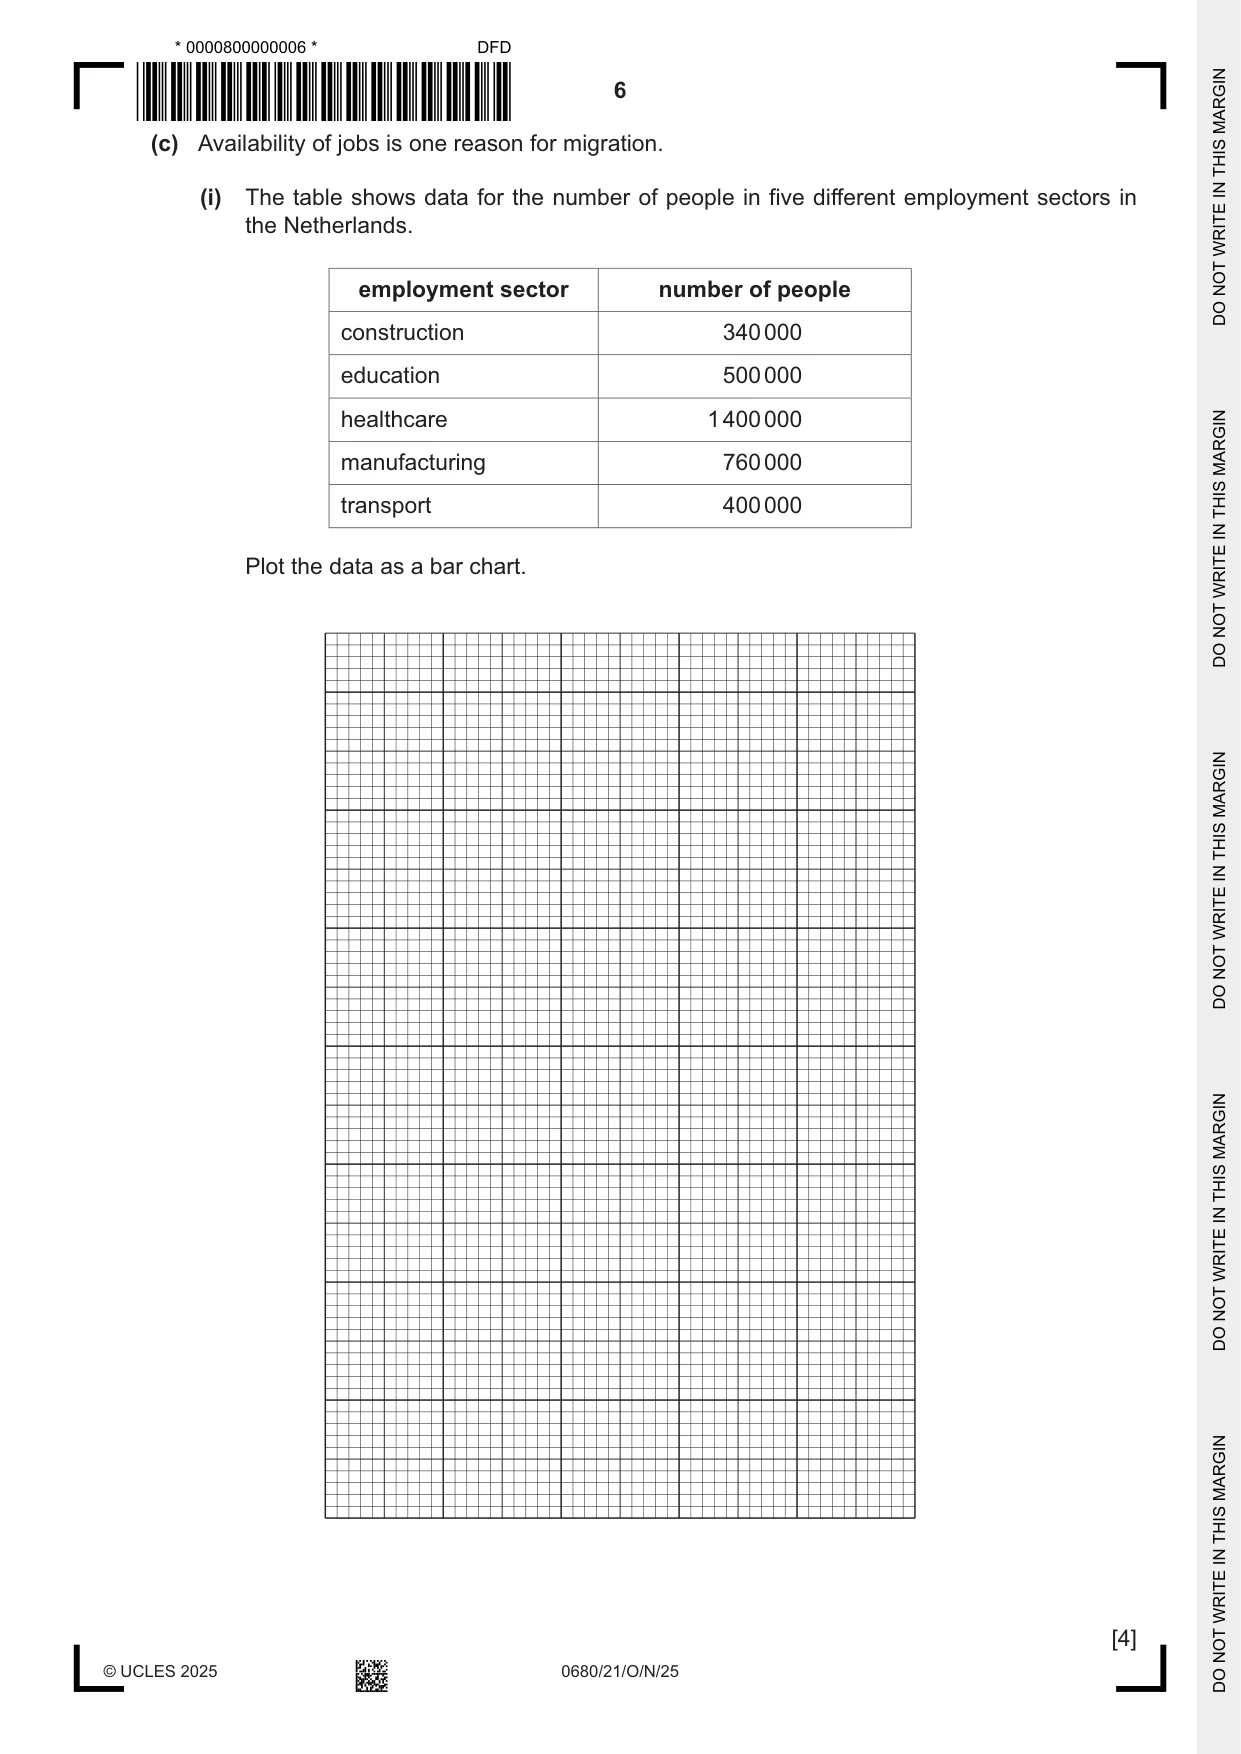
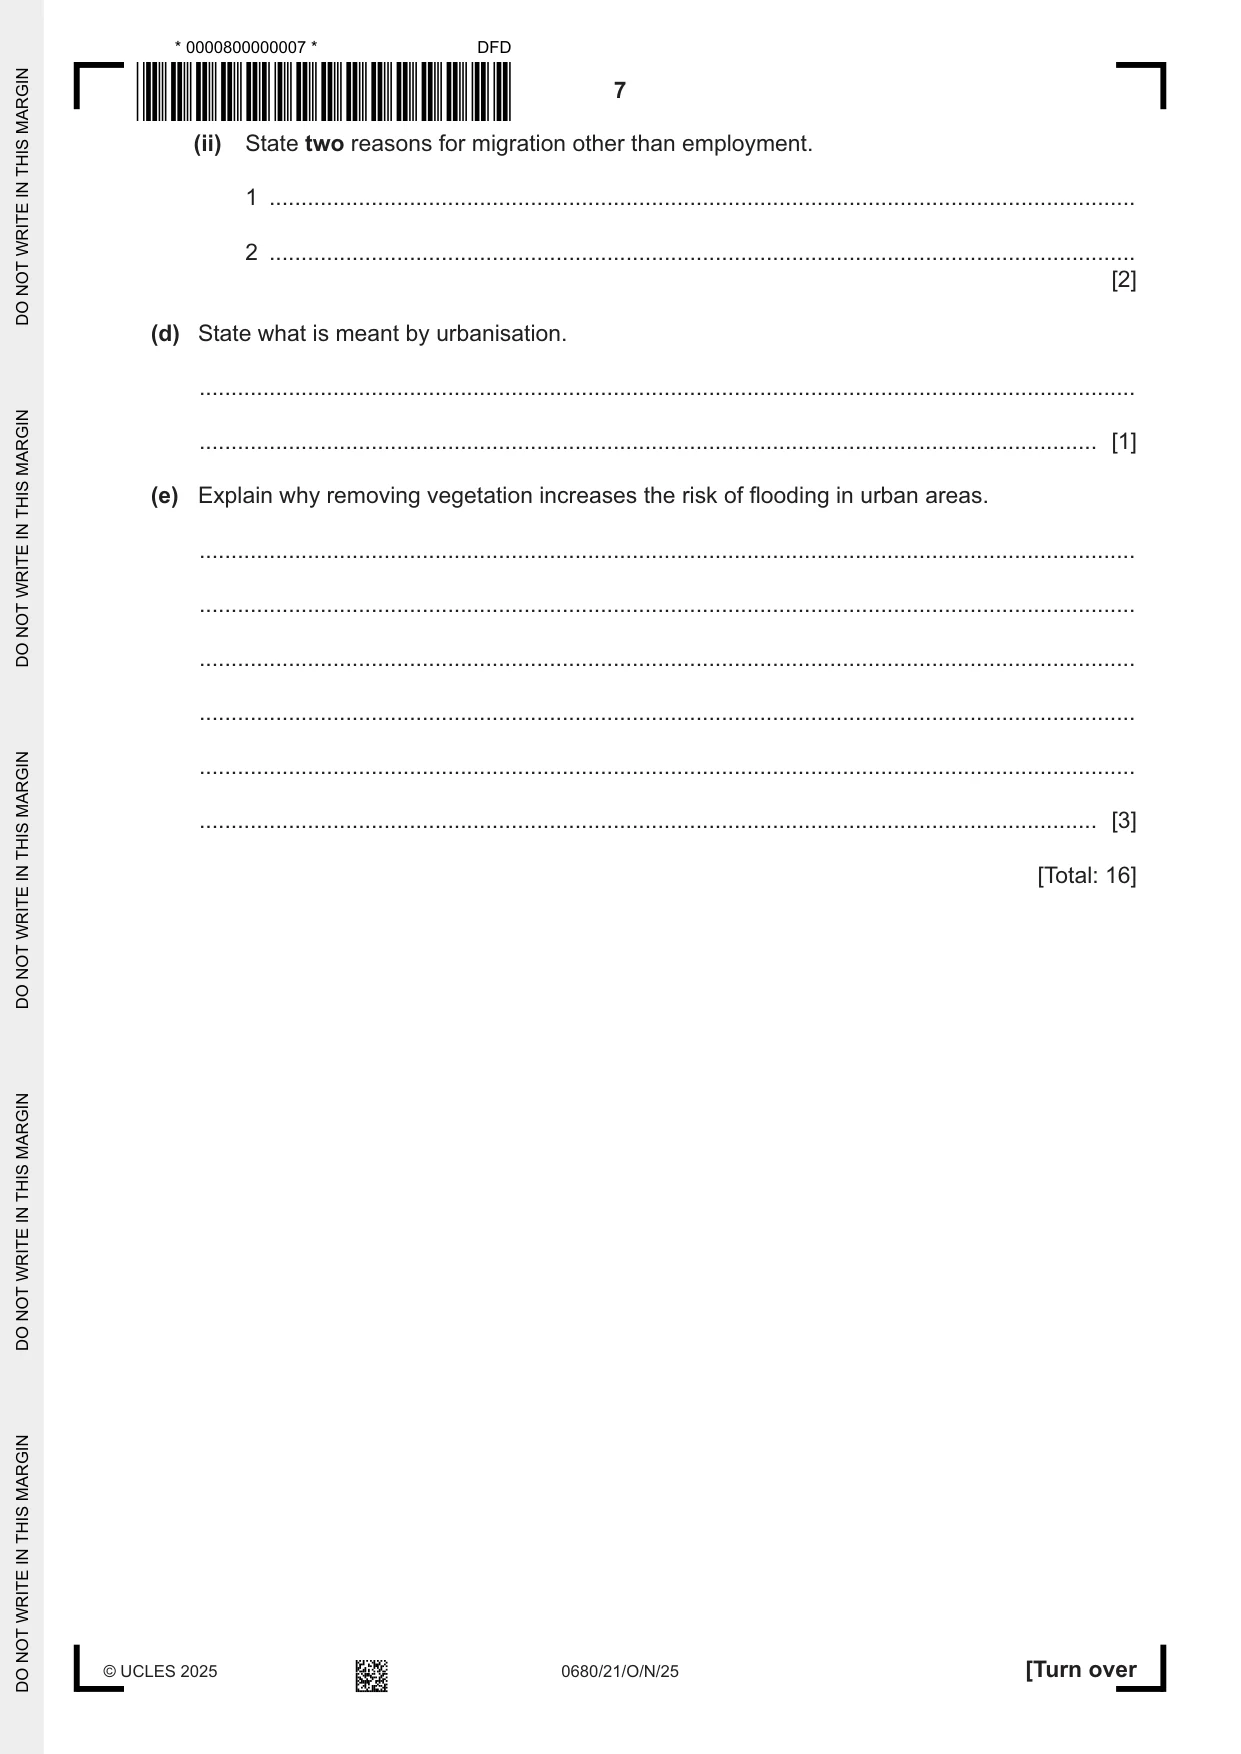
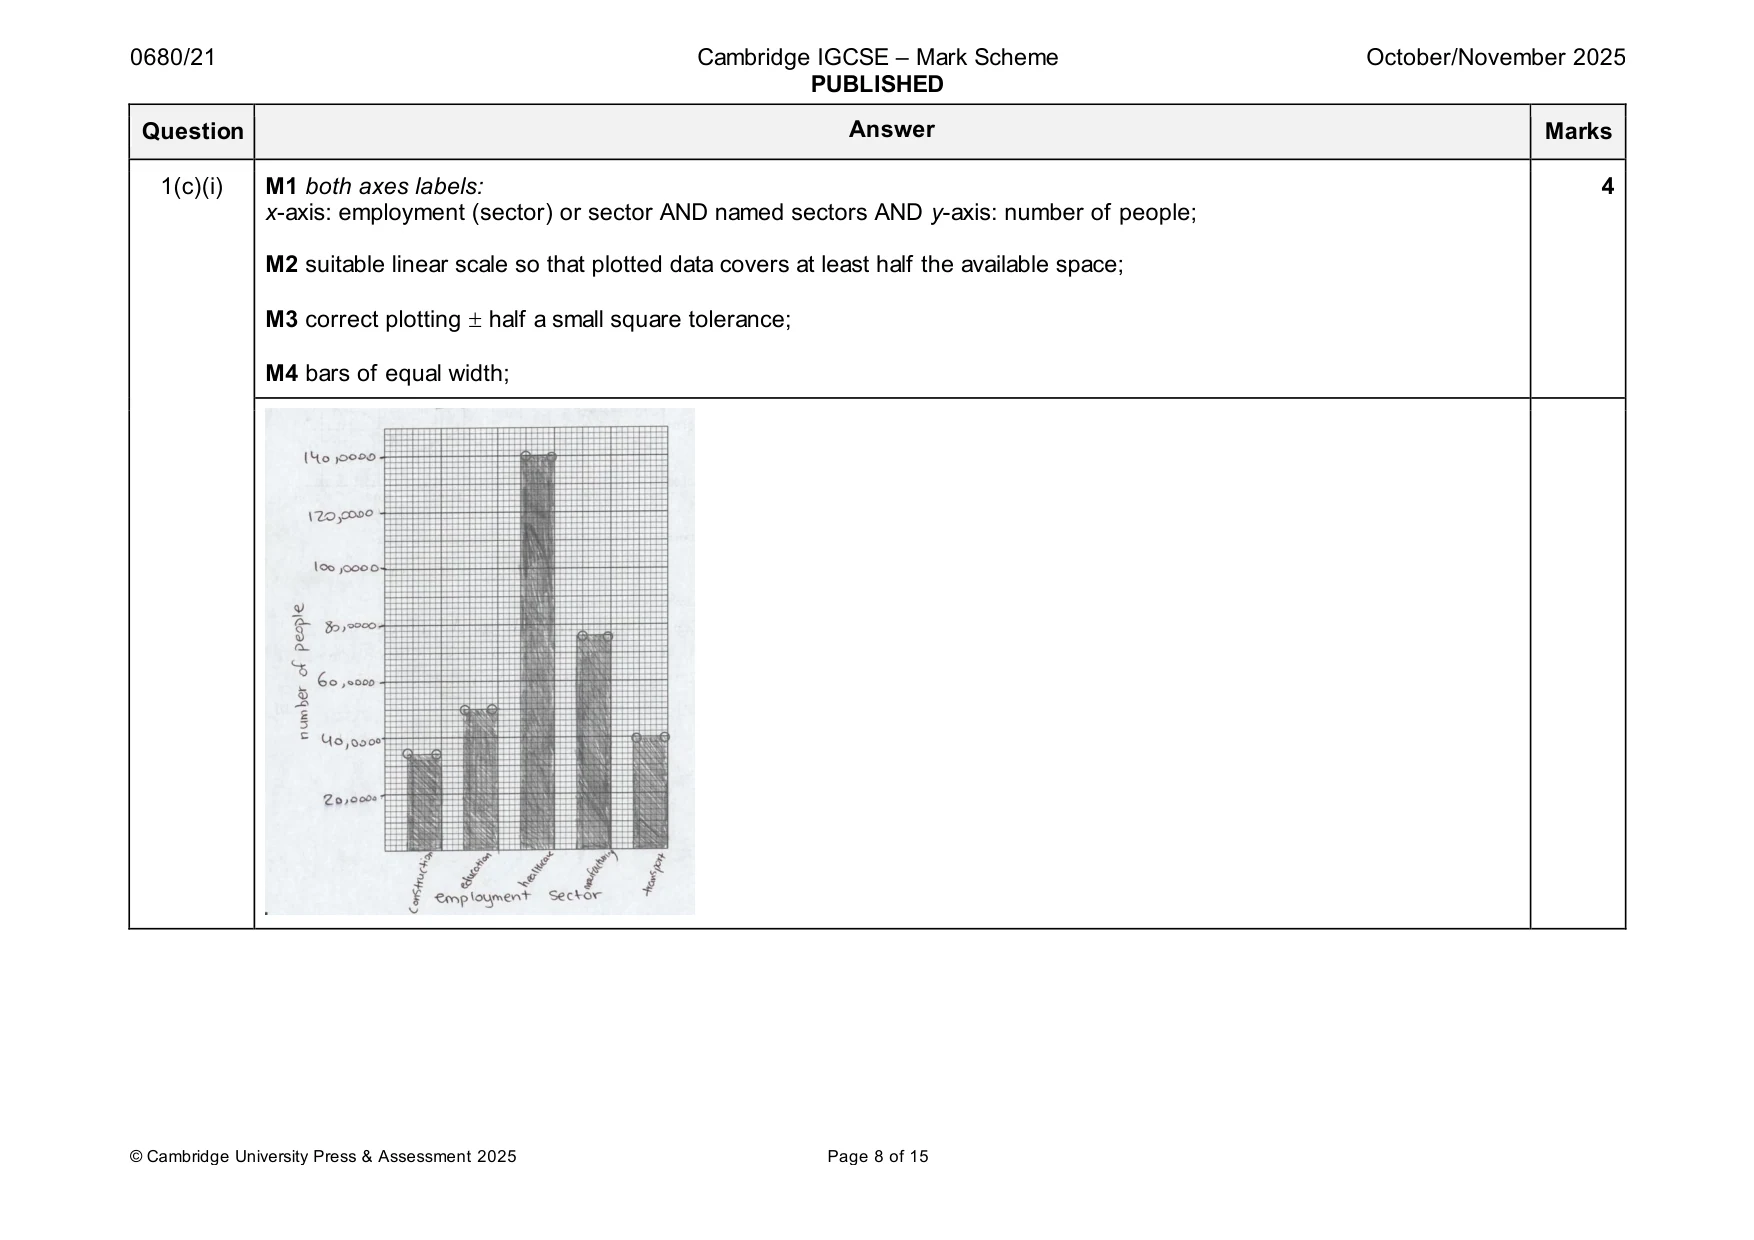
1 (a) The population of Amsterdam in 2023 was 1 174 025. (i) Calculate the percentage of the population of the Netherlands that lived in Amsterdam in 2023. .......................................................% [1] (ii) The area of Amsterdam is 219.3 km2. Calculate the population density of Amsterdam in 2023. Use this formula. number of people population density = area of land Include a unit in your answer. population density = ...................................... unit ...................................... [2] (b) The graph shows migration data for the Netherlands. Content removed due to copyright restrictions. (i) Determine the number of years immigration was less than emigration. years = ......................................................... [1] (ii) Describe the trend for migration balance. ........................................................................................................................................... ........................................................................................................................................... ........................................................................................................................................... ..................................................................................................................................... [2] (c) Availability of jobs is one reason for migration. (i) The table shows data for the number of people in five different employment sectors in the Netherlands. employment sector number of people construction 340 000 education 500 000 healthcare 1 400 000 manufacturing 760 000 transport 400 000 Plot the data as a bar chart. [4] (ii) State two reasons for migration other than employment. 1 ........................................................................................................................................ 2 ........................................................................................................................................ [2] (d) State what is meant by urbanisation. ................................................................................................................................................... ............................................................................................................................................. [1] (e) Explain why removing vegetation increases the risk of flooding in urban areas. ................................................................................................................................................... ................................................................................................................................................... ................................................................................................................................................... ................................................................................................................................................... ................................................................................................................................................... ............................................................................................................................................. [3] [Total: 16]
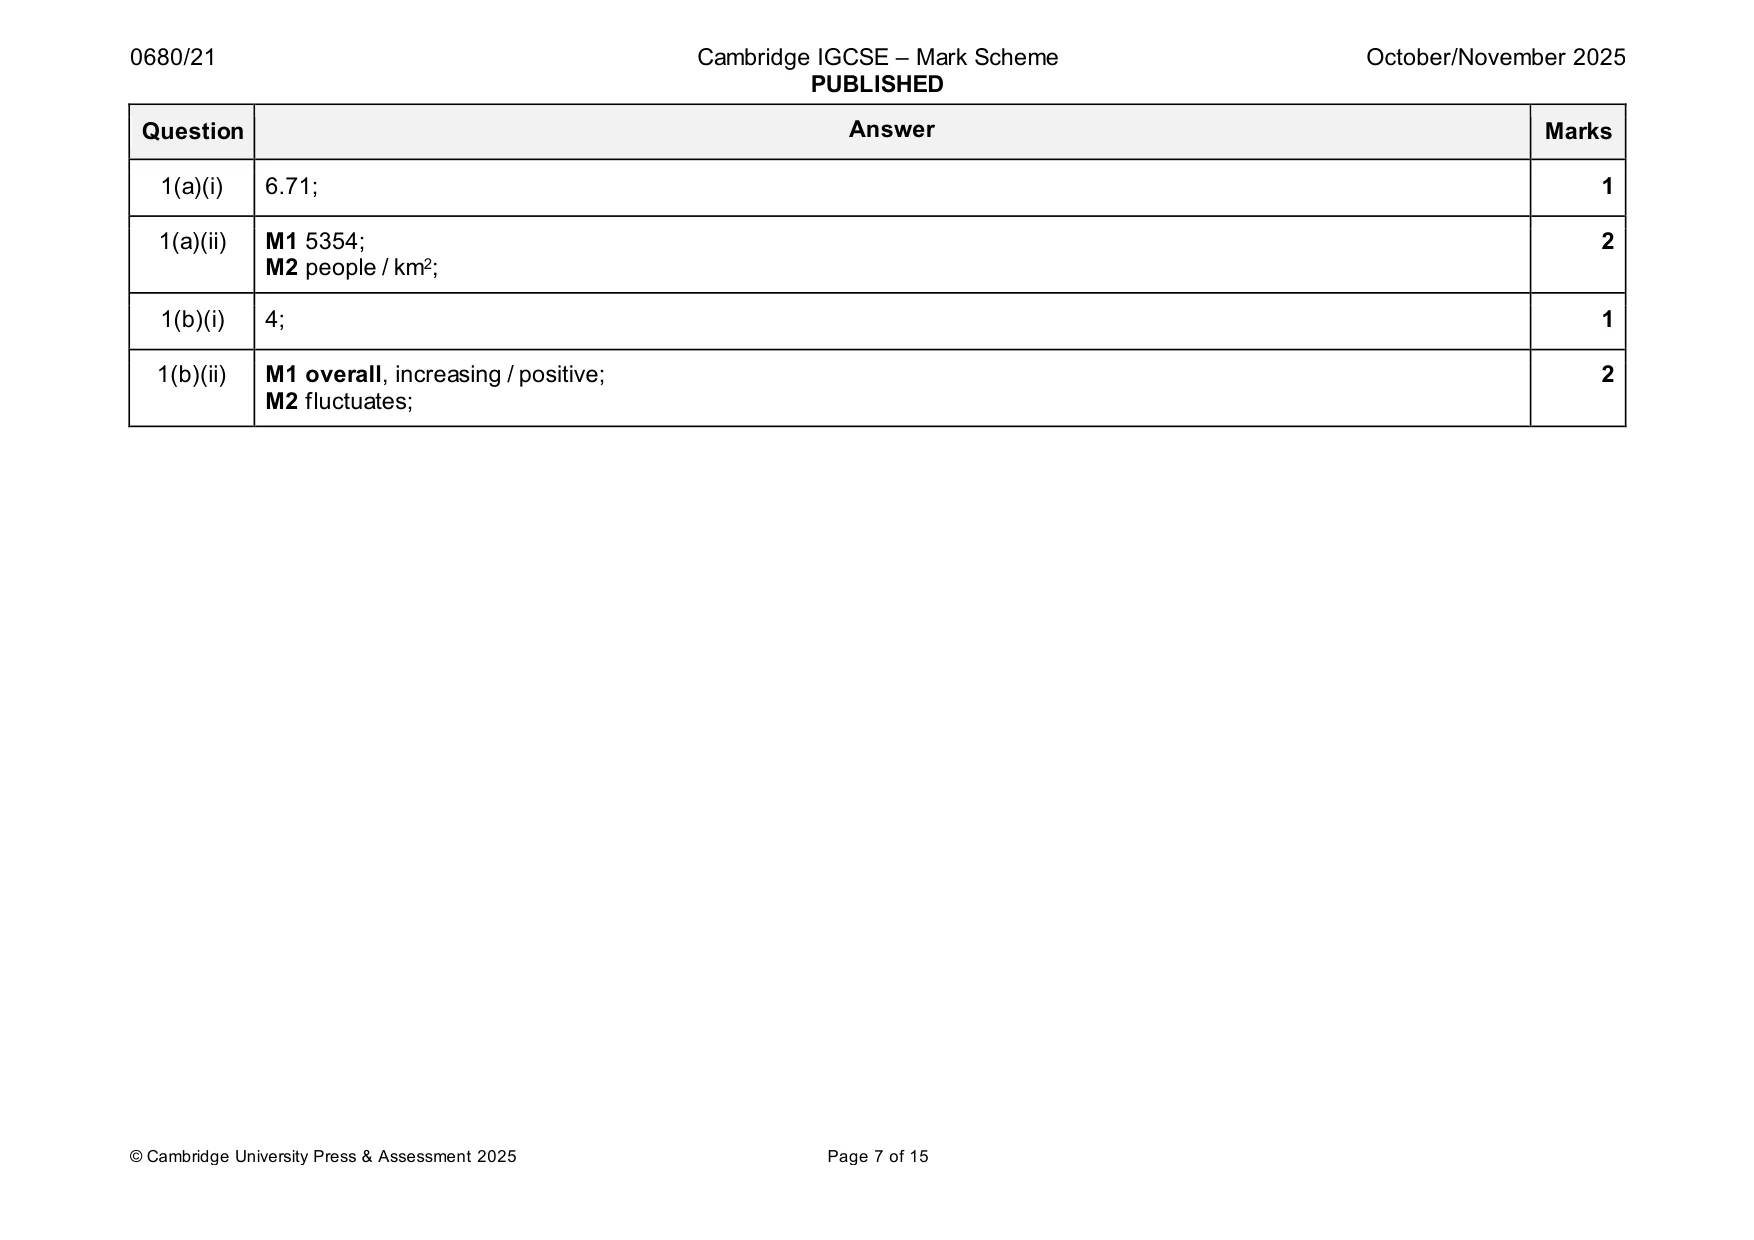
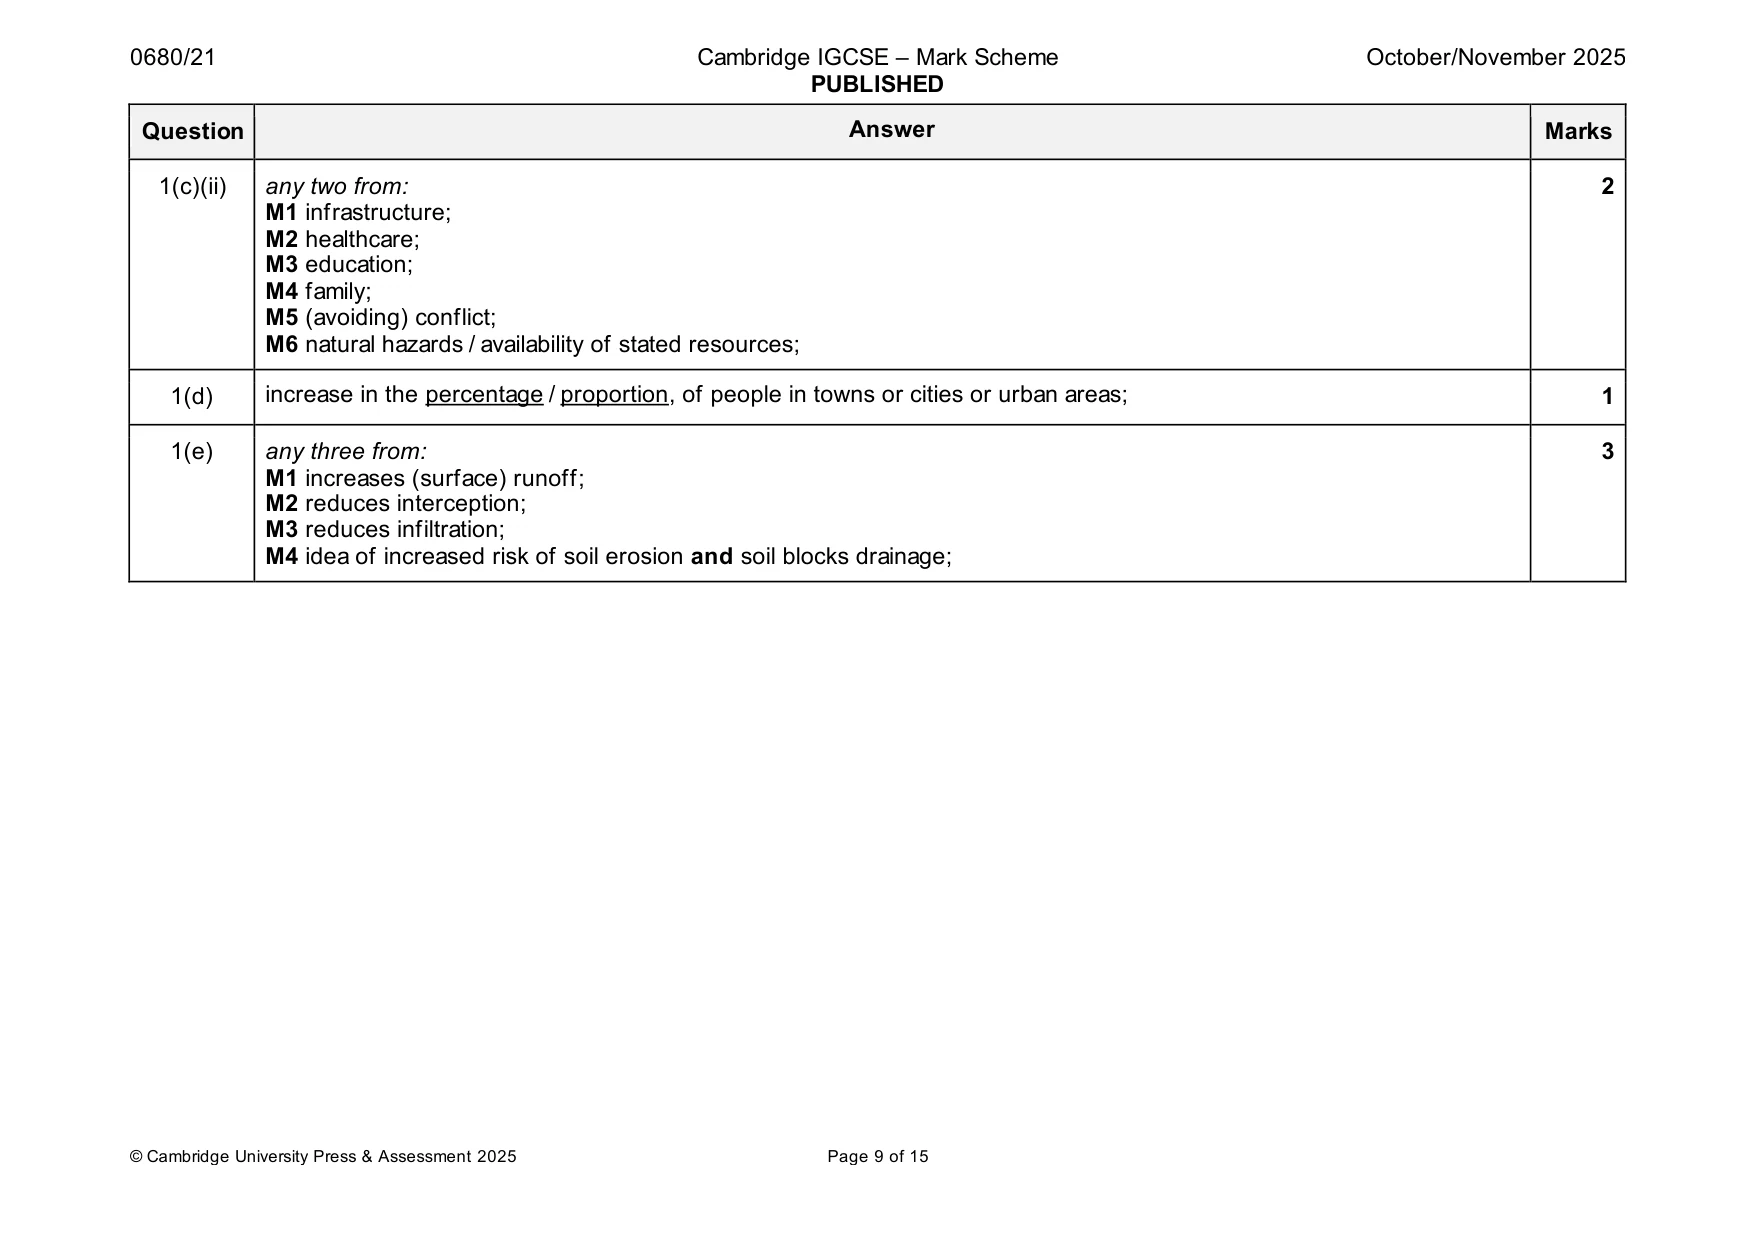
Mark scheme: Question Answer Marks 1(a)(i) 6.71; 1 1(a)(ii) M1 5354; 2 M2 people / km2; 1(b)(i) 4; 1 1(b)(ii) M1 overall, increasing / positive; 2 M2 fluctuates; 1(c)(i) M1 both axes labels: 4 x-axis: employment (sector) or sector AND named sectors AND y-axis: number of people; M2 suitable linear scale so that plotted data covers at least half the available space; M3 correct plotting half a small square tolerance; M4 bars of equal width; 1(c)(ii) any two from: 2 M1 infrastructure; M2 healthcare; M3 education; M4 family; M5 (avoiding) conflict; M6 natural hazards / availability of stated resources; 1(d) increase in the percentage / proportion, of people in towns or cities or urban areas; 1 1(e) any three from: 3 M1 increases (surface) runoff; M2 reduces interception; M3 reduces infiltration; M4 idea of increased risk of soil erosion and soil blocks drainage;
Q2 · Flooding is an environmental threat to the Netherlands
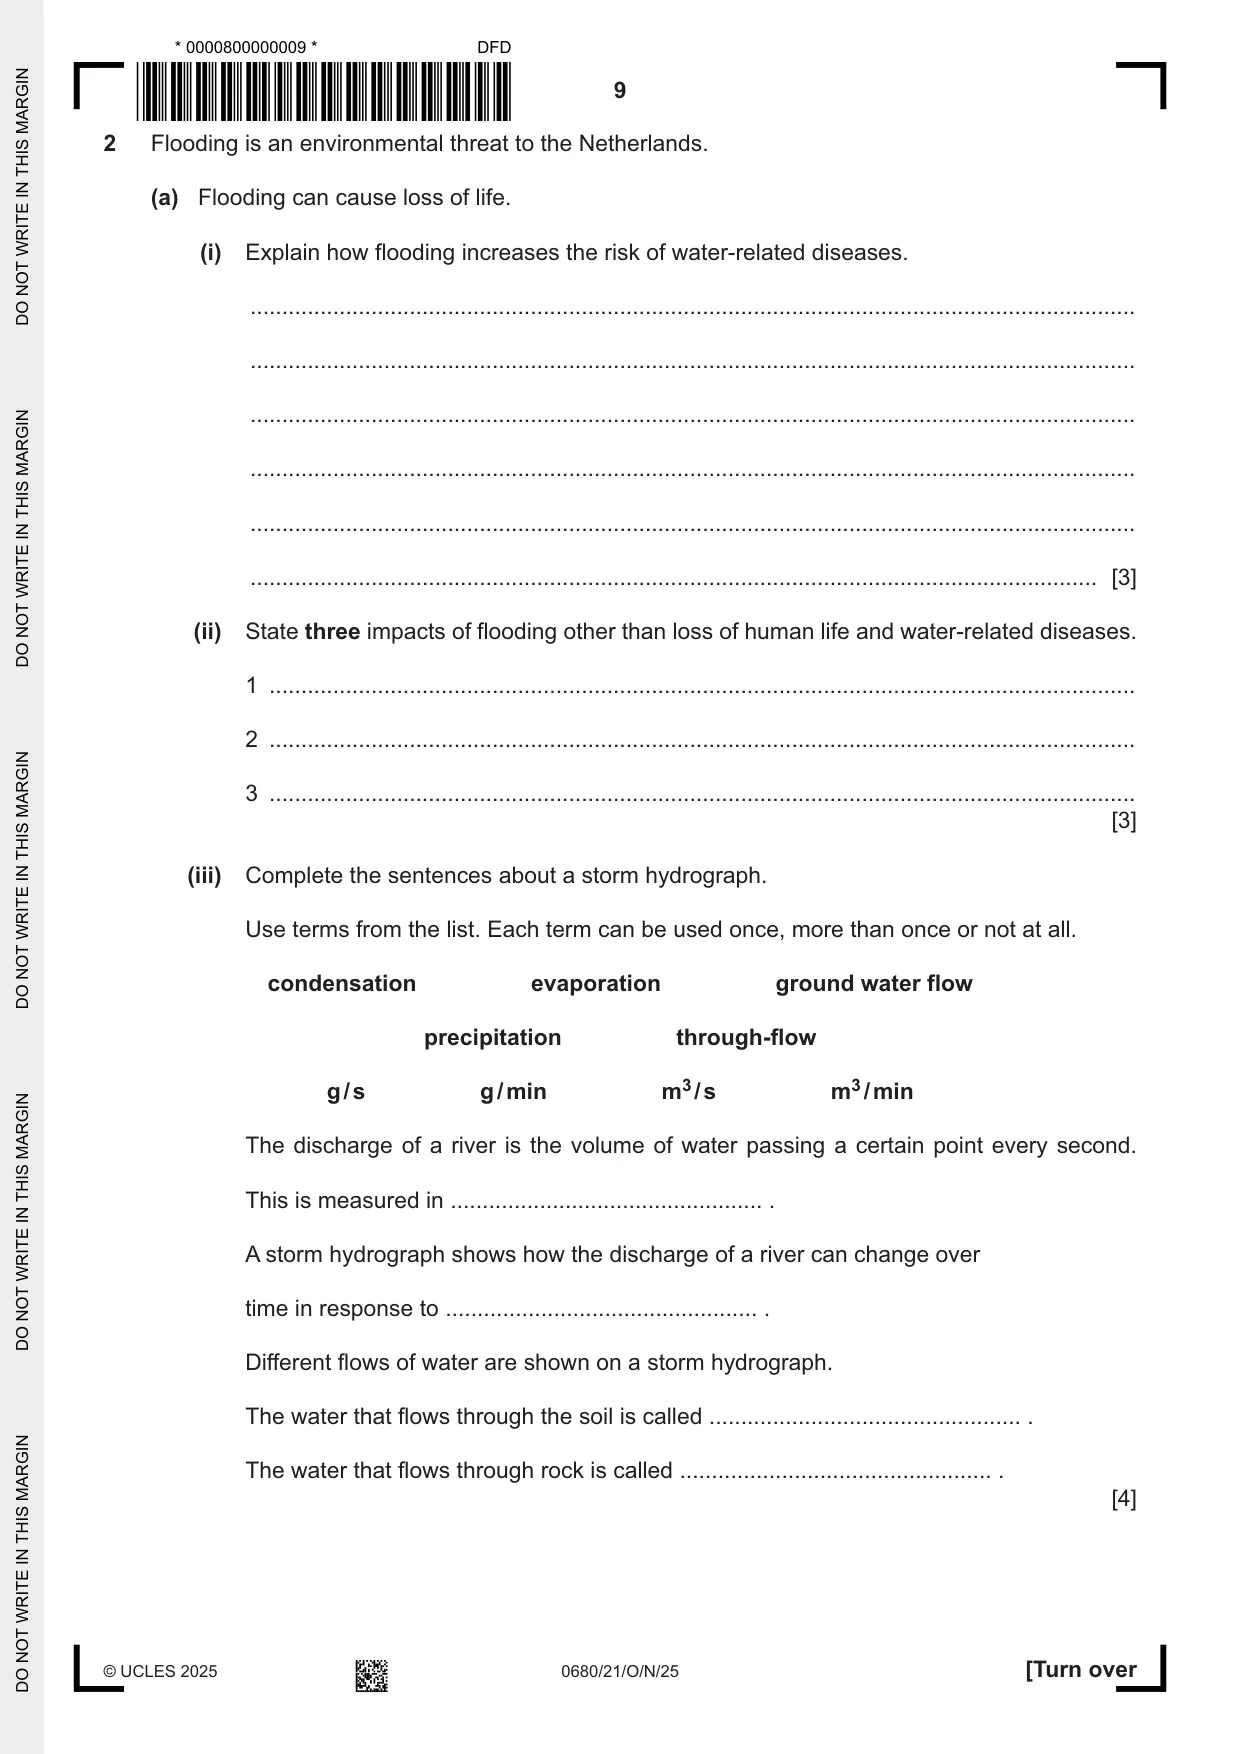
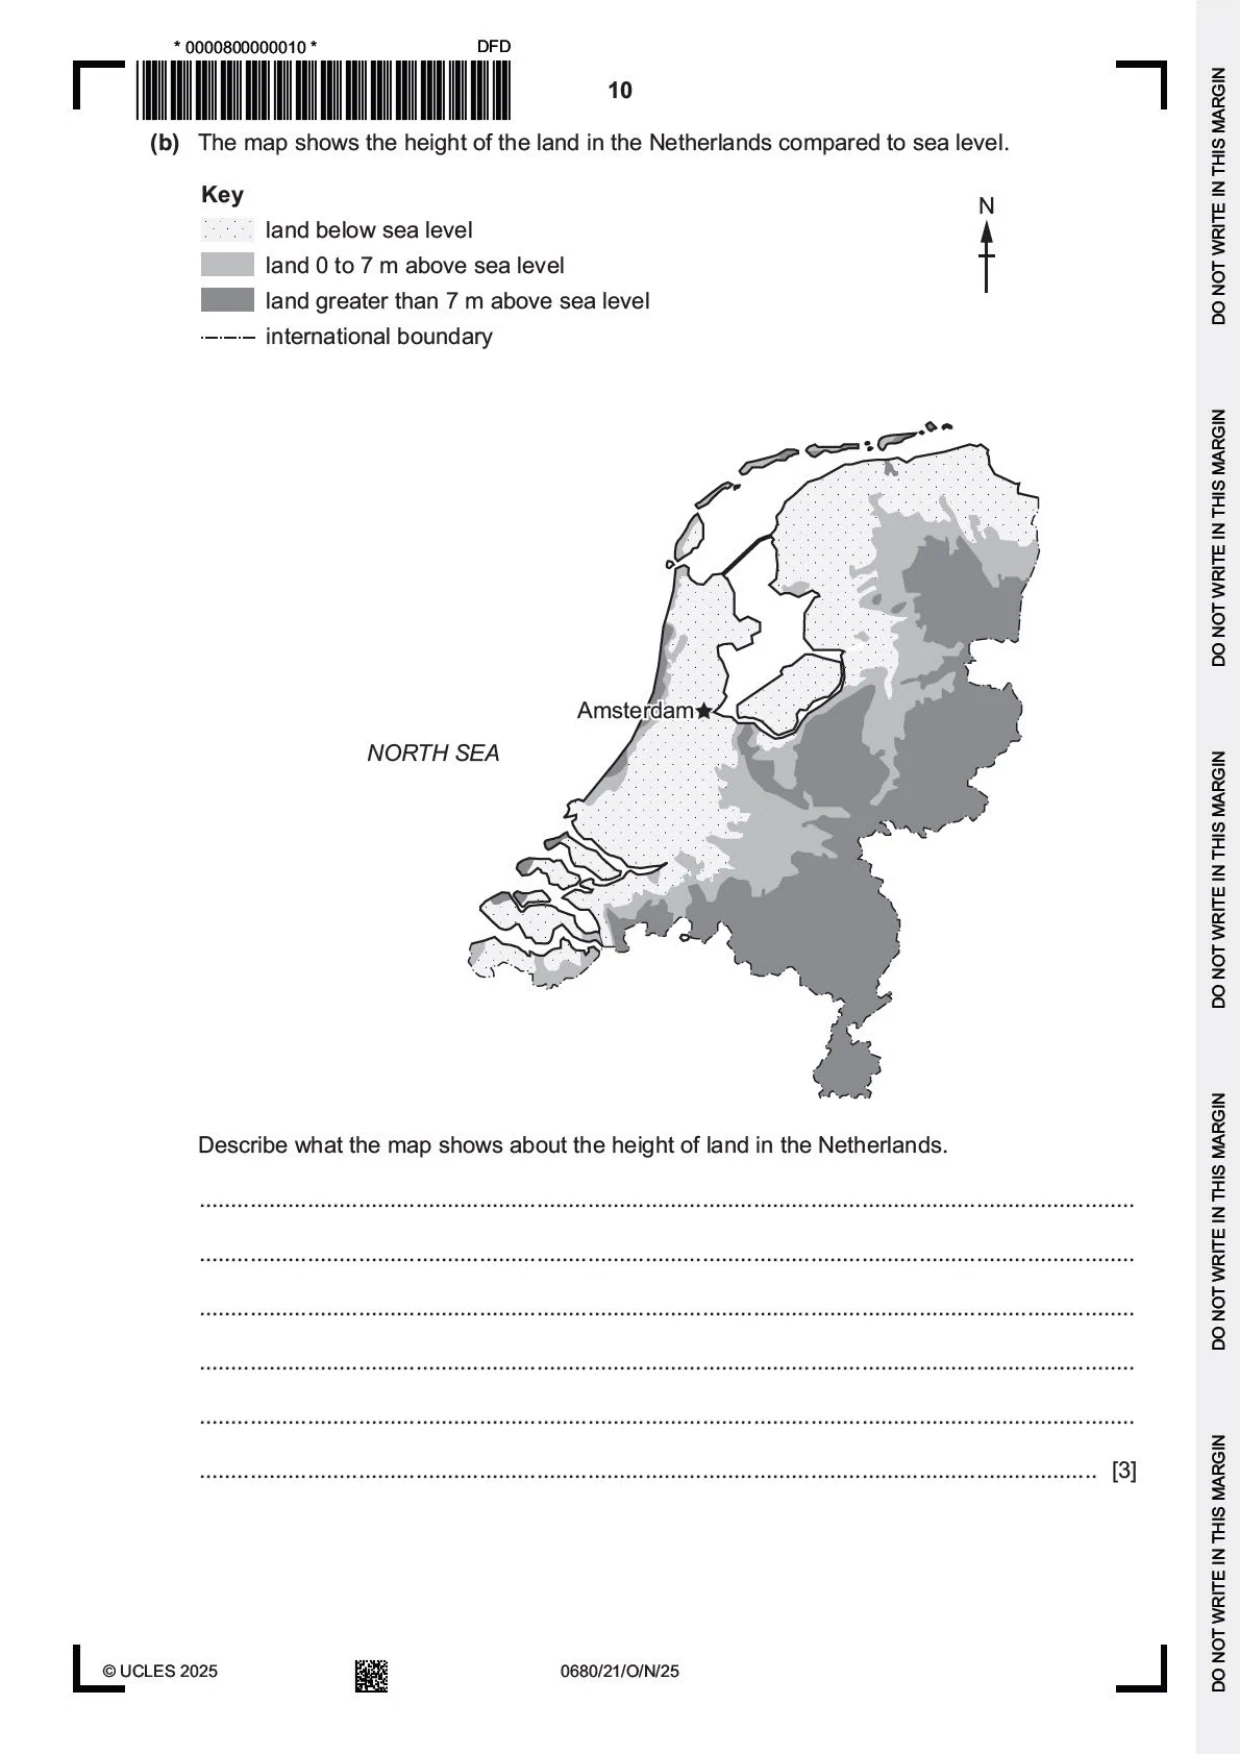
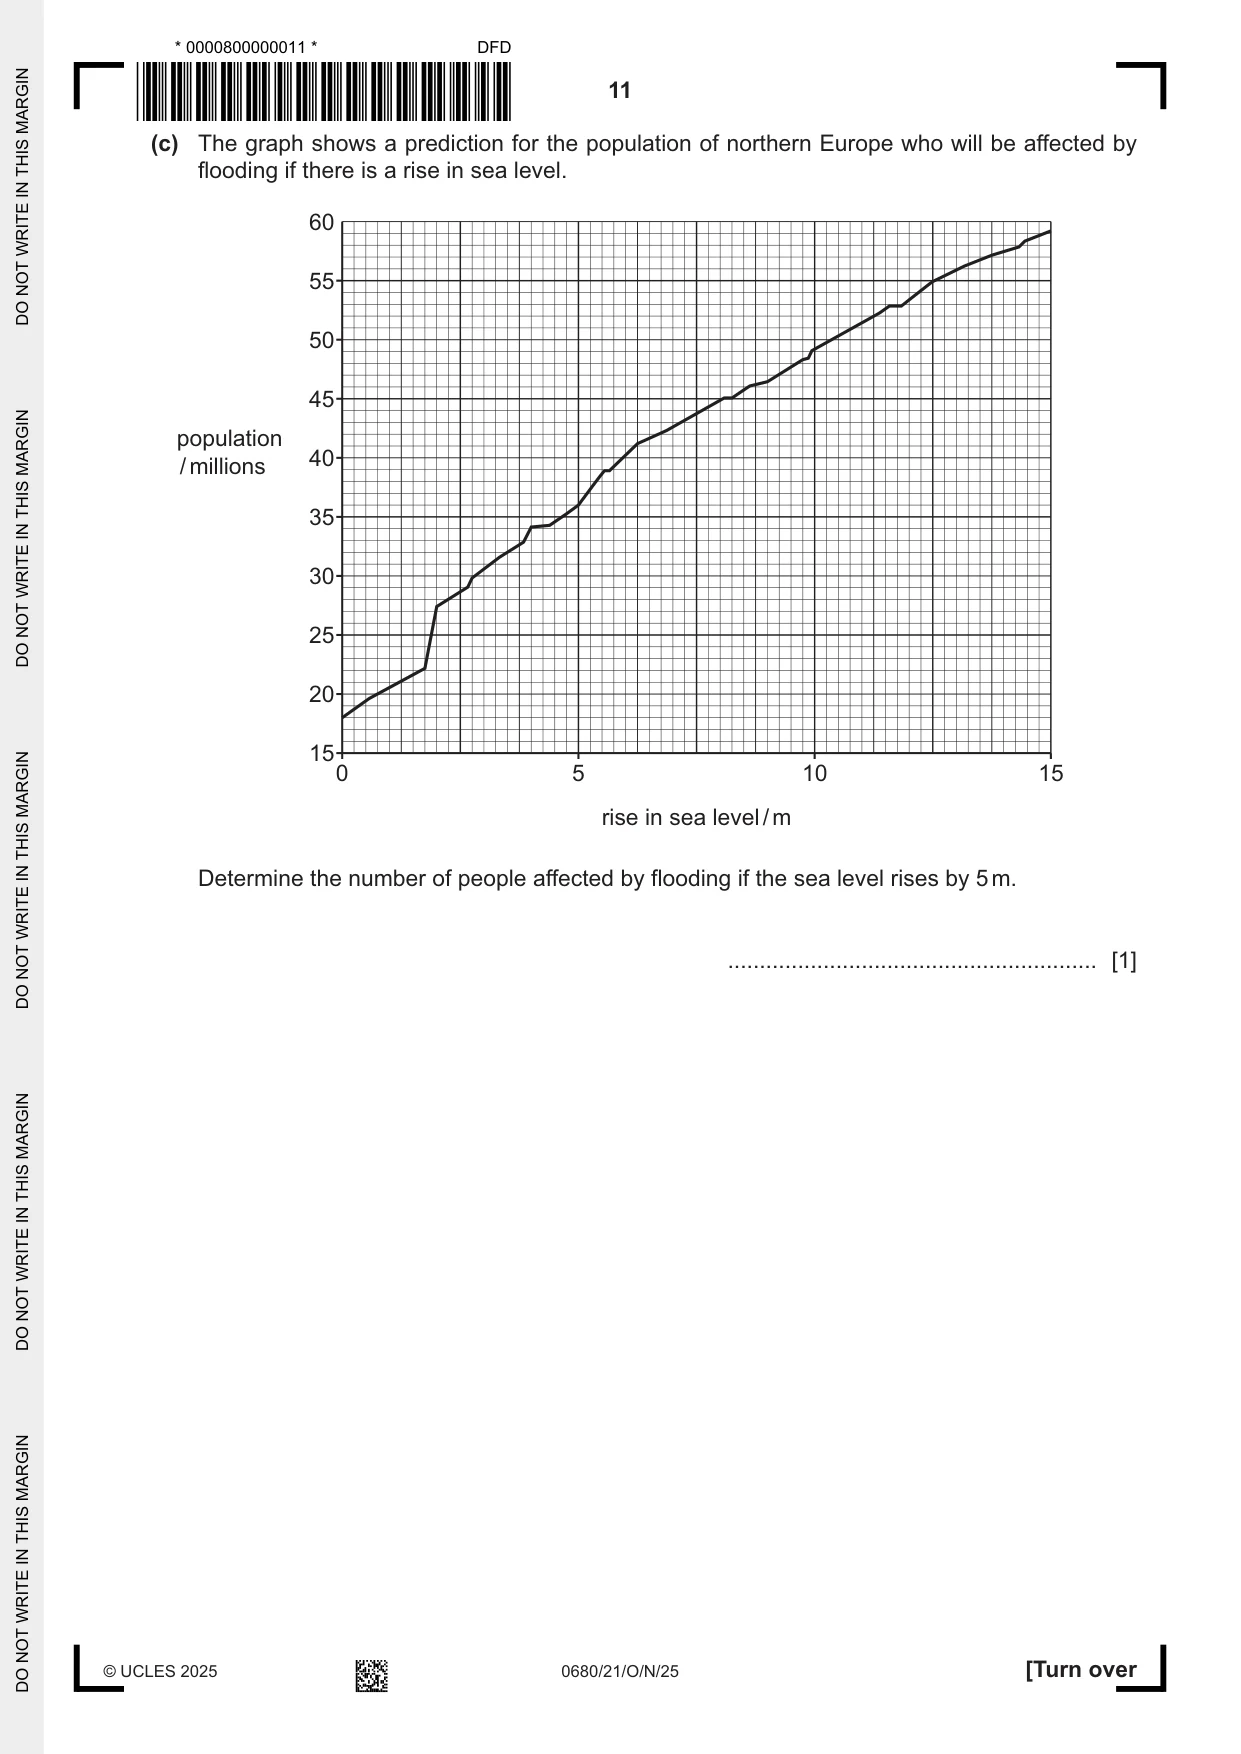
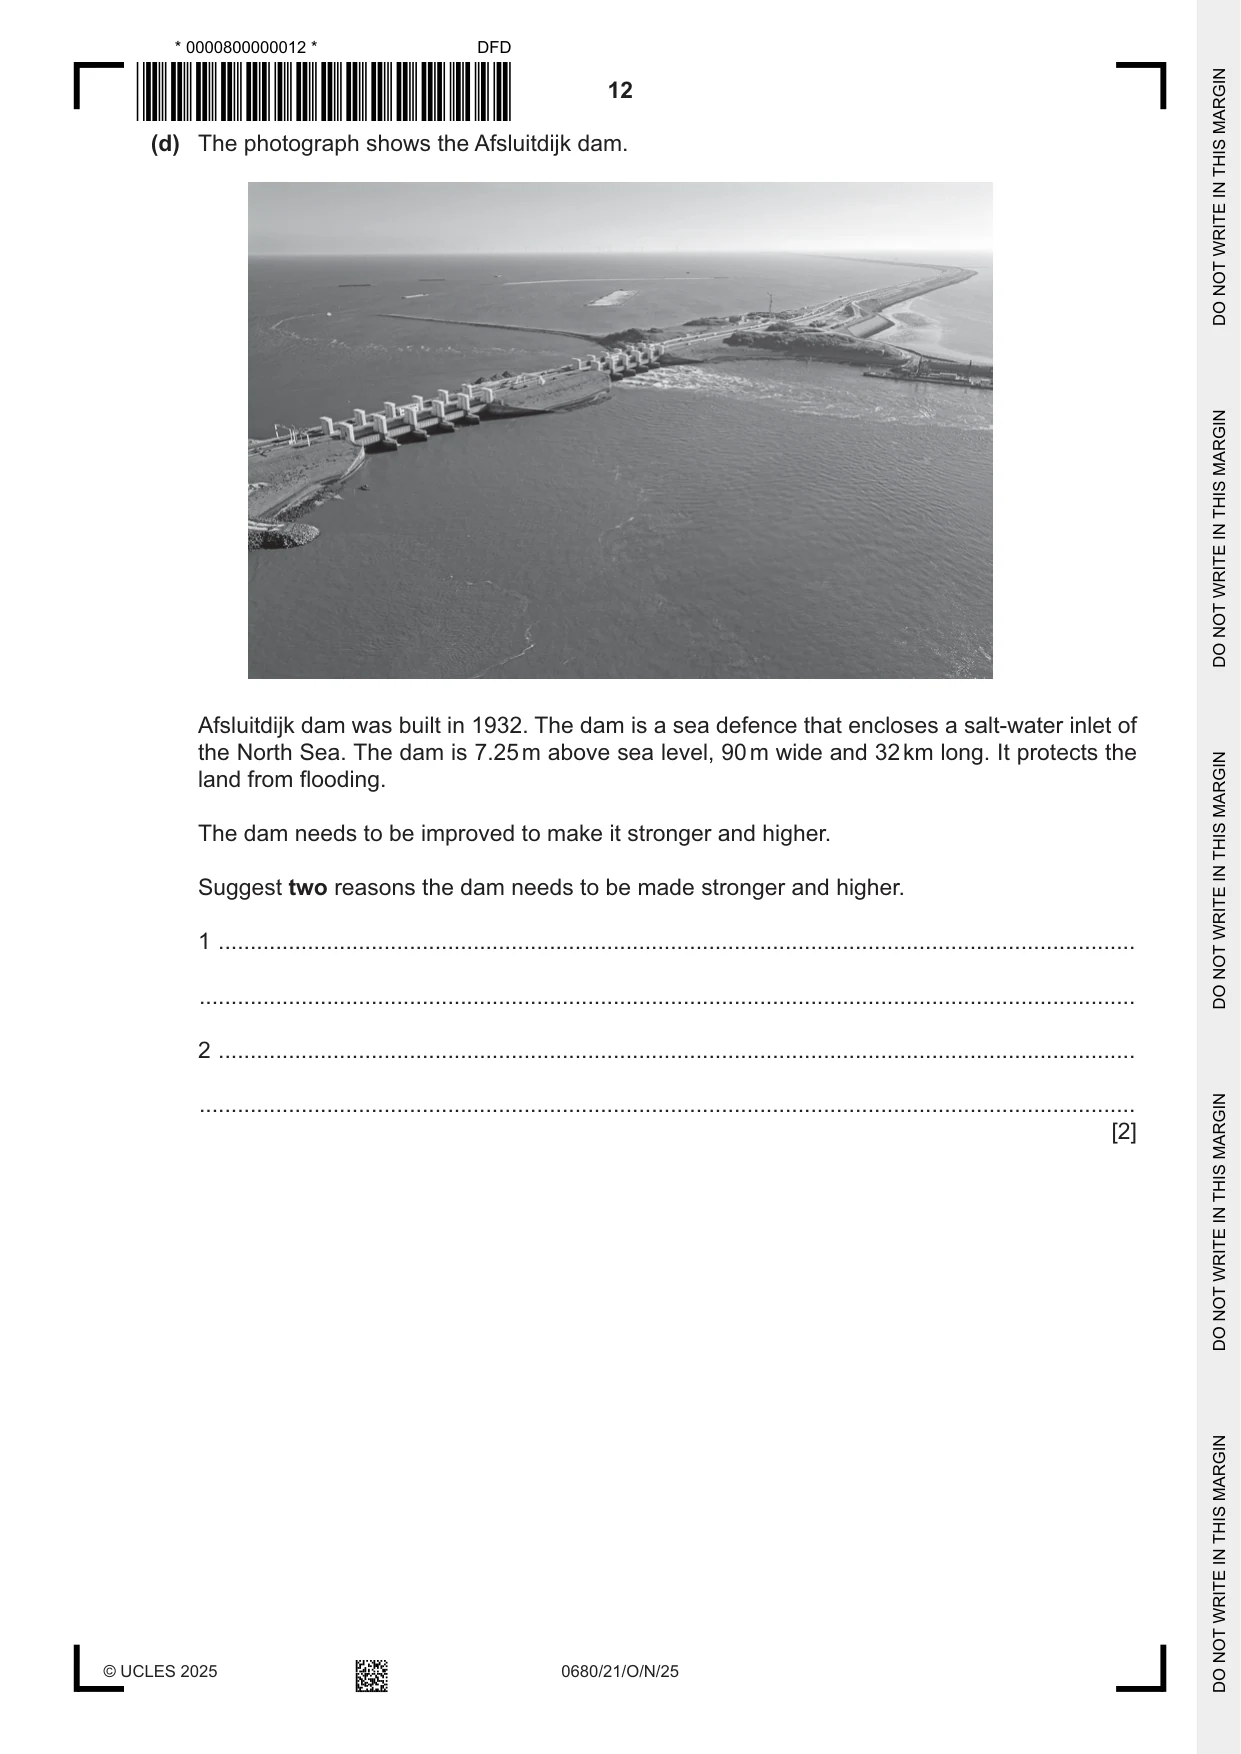
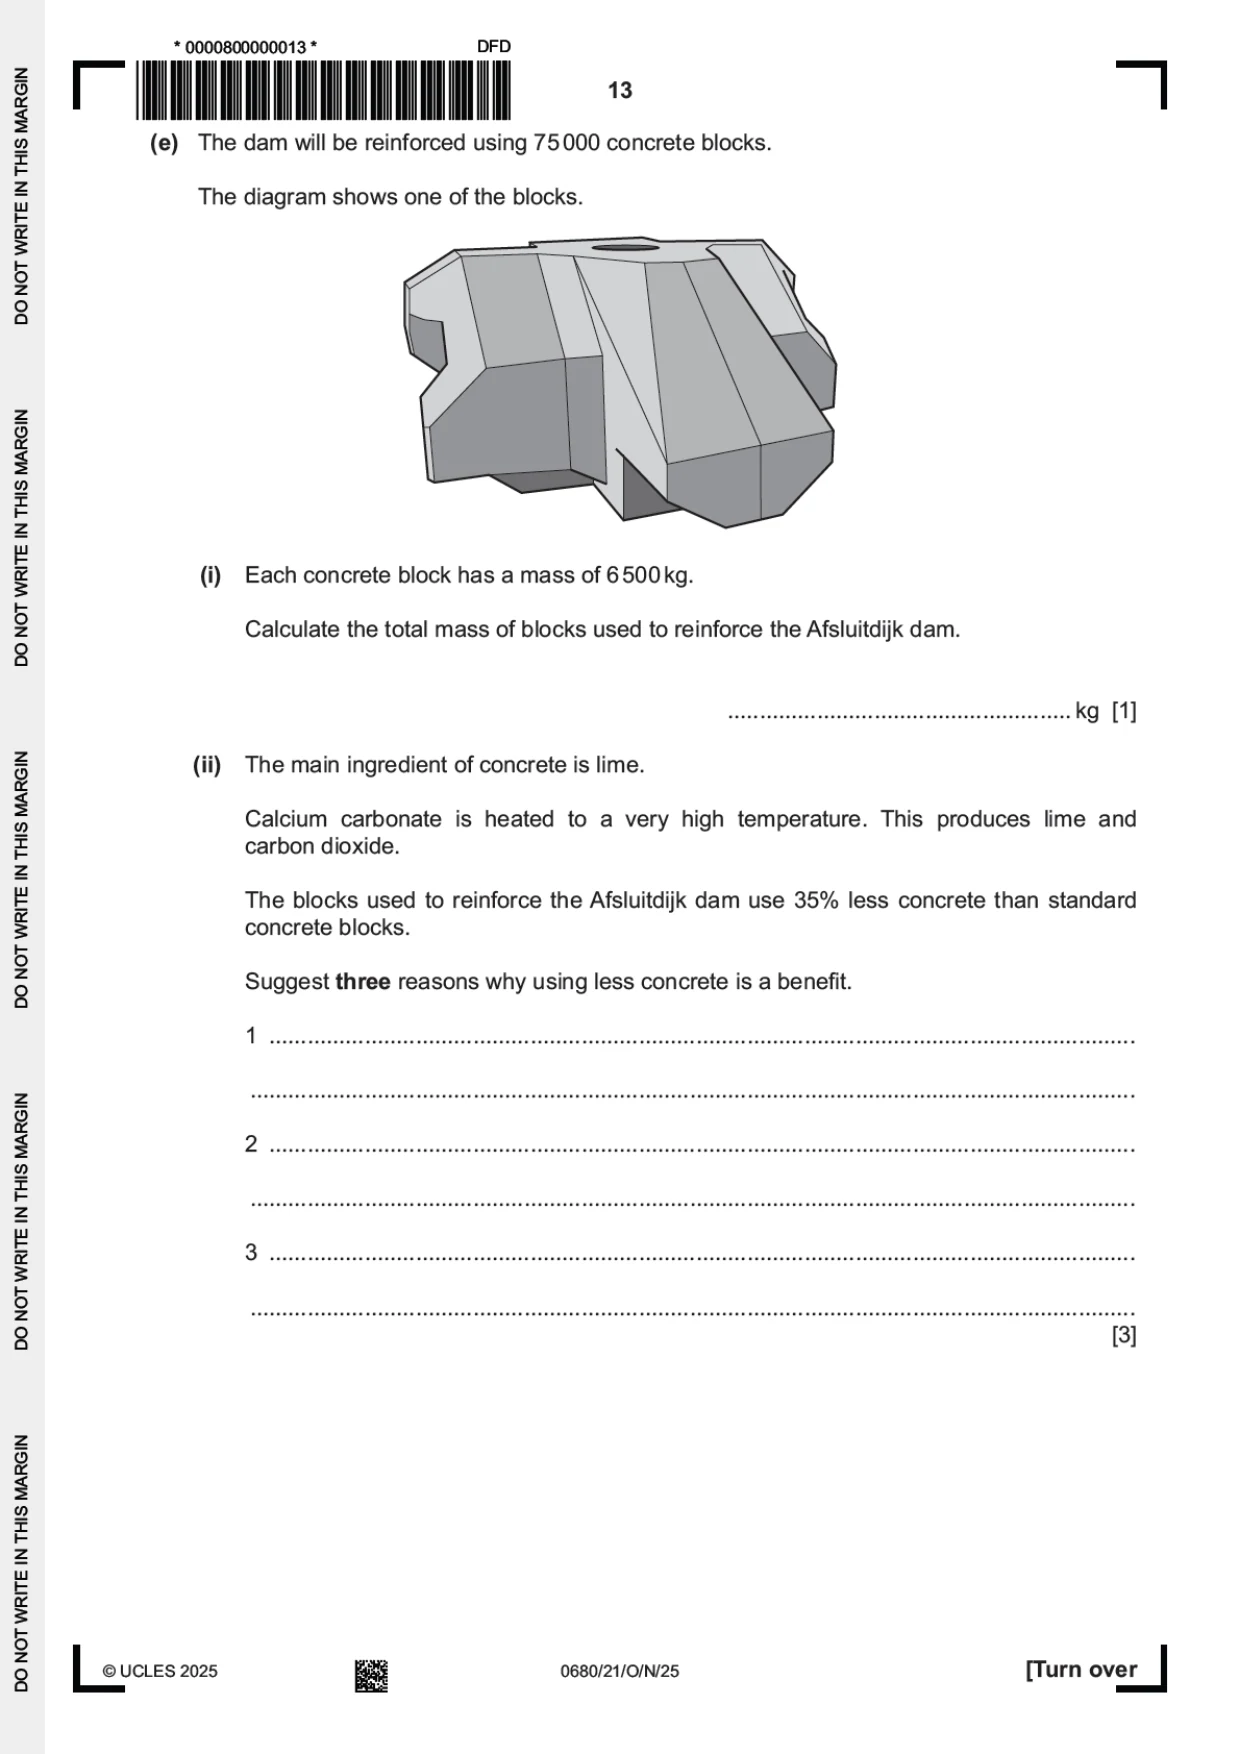
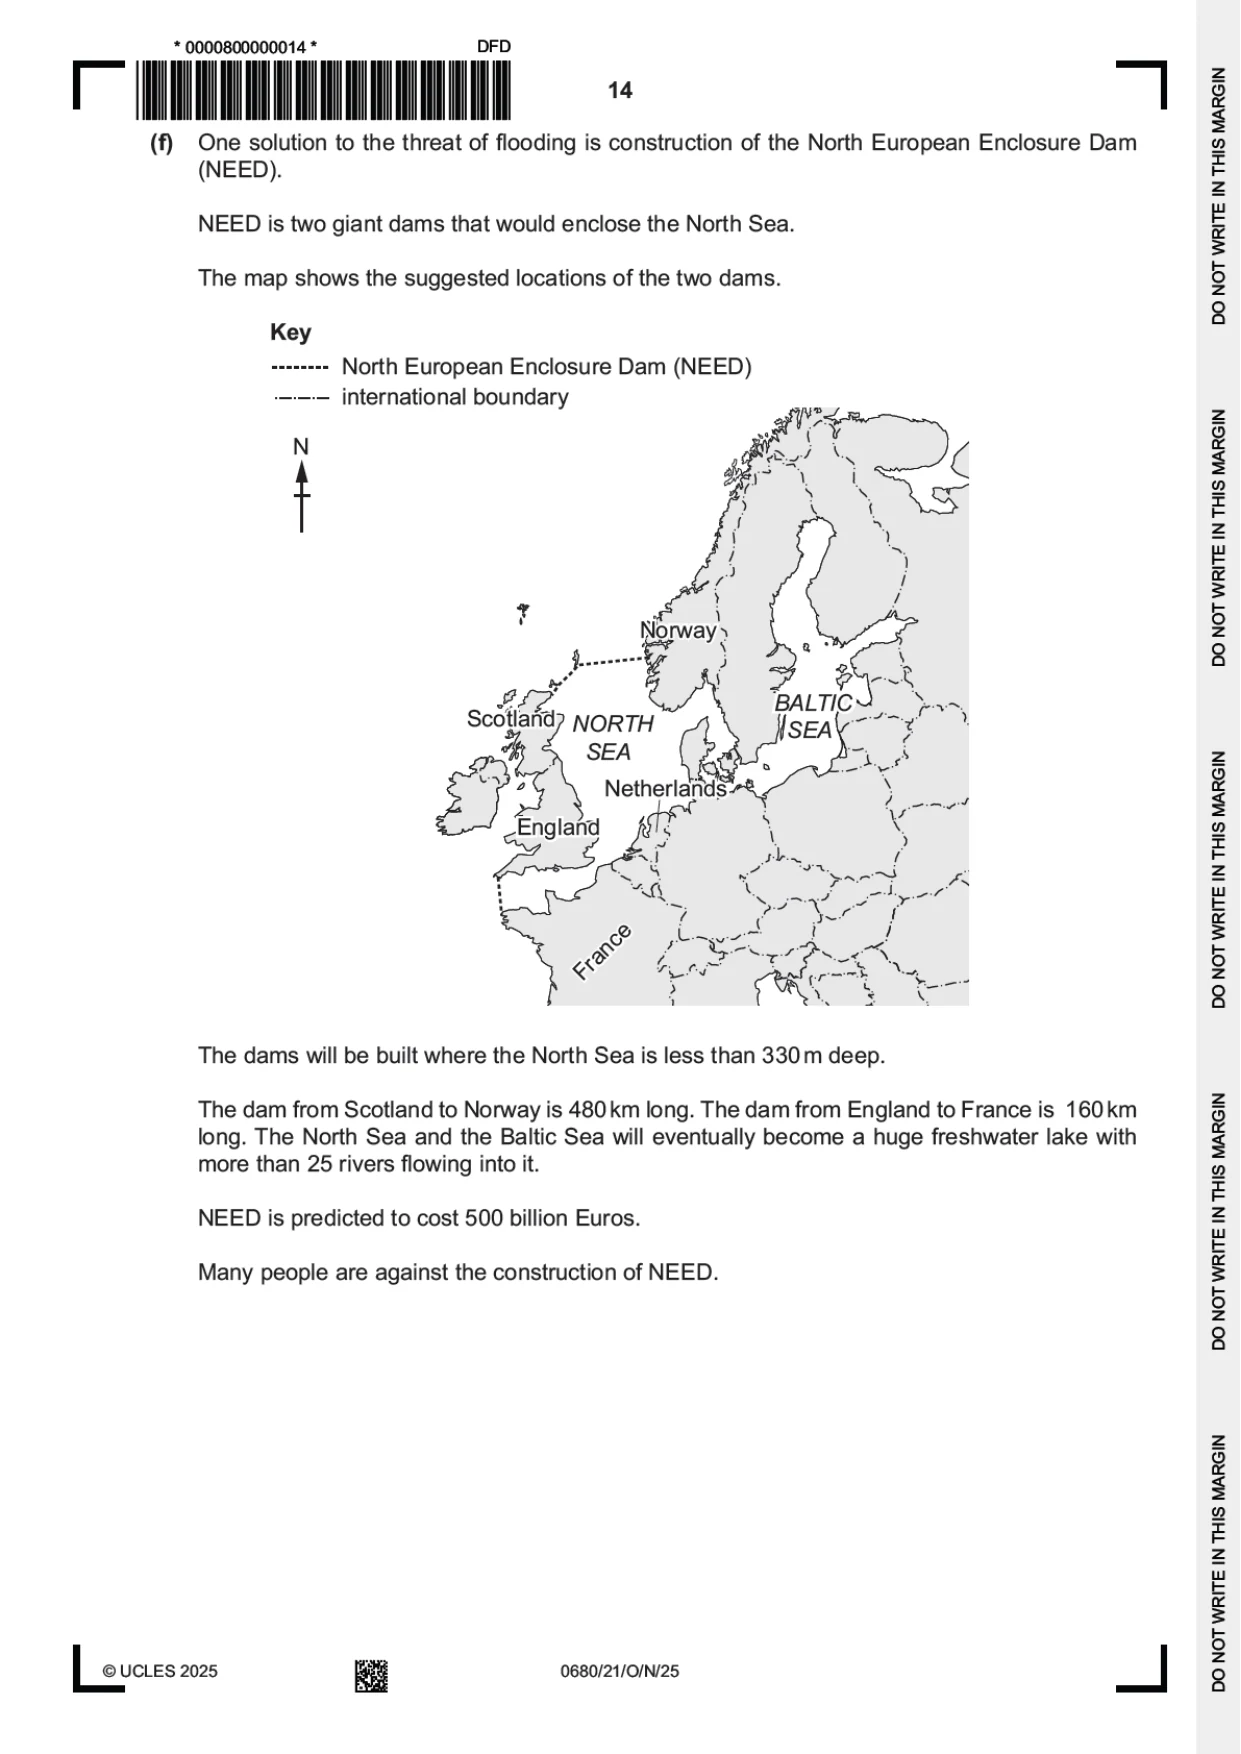
2 Flooding is an environmental threat to the Netherlands. (a) Flooding can cause loss of life. (i) Explain how flooding increases the risk of water‑related diseases. ........................................................................................................................................... ........................................................................................................................................... ........................................................................................................................................... ........................................................................................................................................... ........................................................................................................................................... ..................................................................................................................................... [3] (ii) State three impacts of flooding other than loss of human life and water‑related diseases. 1 ........................................................................................................................................ 2 ........................................................................................................................................ 3 ........................................................................................................................................ [3] (iii) Complete the sentences about a storm hydrograph. Use terms from the list. Each term can be used once, more than once or not at all. condensation evaporation ground water flow precipitation through‑flow g / s g / min m3 / s m3 / min The discharge of a river is the volume of water passing a certain point every second. This is measured in ................................................. . A storm hydrograph shows how the discharge of a river can change over time in response to ................................................. . Different flows of water are shown on a storm hydrograph. The water that flows through the soil is called ................................................. . The water that flows through rock is called ................................................. . [4] (c) The graph shows a prediction for the population of northern Europe who will be affected by flooding if there is a rise in sea level. 60 55 50 45 population 40 / millions 35 30 25 20 15 0 5 10 15 rise in sea level / m Determine the number of people affected by flooding if the sea level rises by 5 m. .......................................................... [1] (d) The photograph shows the Afsluitdijk dam. Afsluitdijk dam was built in 1932. The dam is a sea defence that encloses a salt‑water inlet of the North Sea. The dam is 7.25 m above sea level, 90 m wide and 32 km long. It protects the land from flooding. The dam needs to be improved to make it stronger and higher. Suggest two reasons the dam needs to be made stronger and higher. 1 ................................................................................................................................................ ................................................................................................................................................... 2 ................................................................................................................................................ ................................................................................................................................................... [2] (i) Suggest reasons why people are against the construction of NEED. ........................................................................................................................................... ........................................................................................................................................... ........................................................................................................................................... ........................................................................................................................................... ........................................................................................................................................... ........................................................................................................................................... ........................................................................................................................................... ..................................................................................................................................... [4] (ii) Suggest why international cooperation is necessary for NEED to be constructed. ........................................................................................................................................... ..................................................................................................................................... [1] [Total: 25]
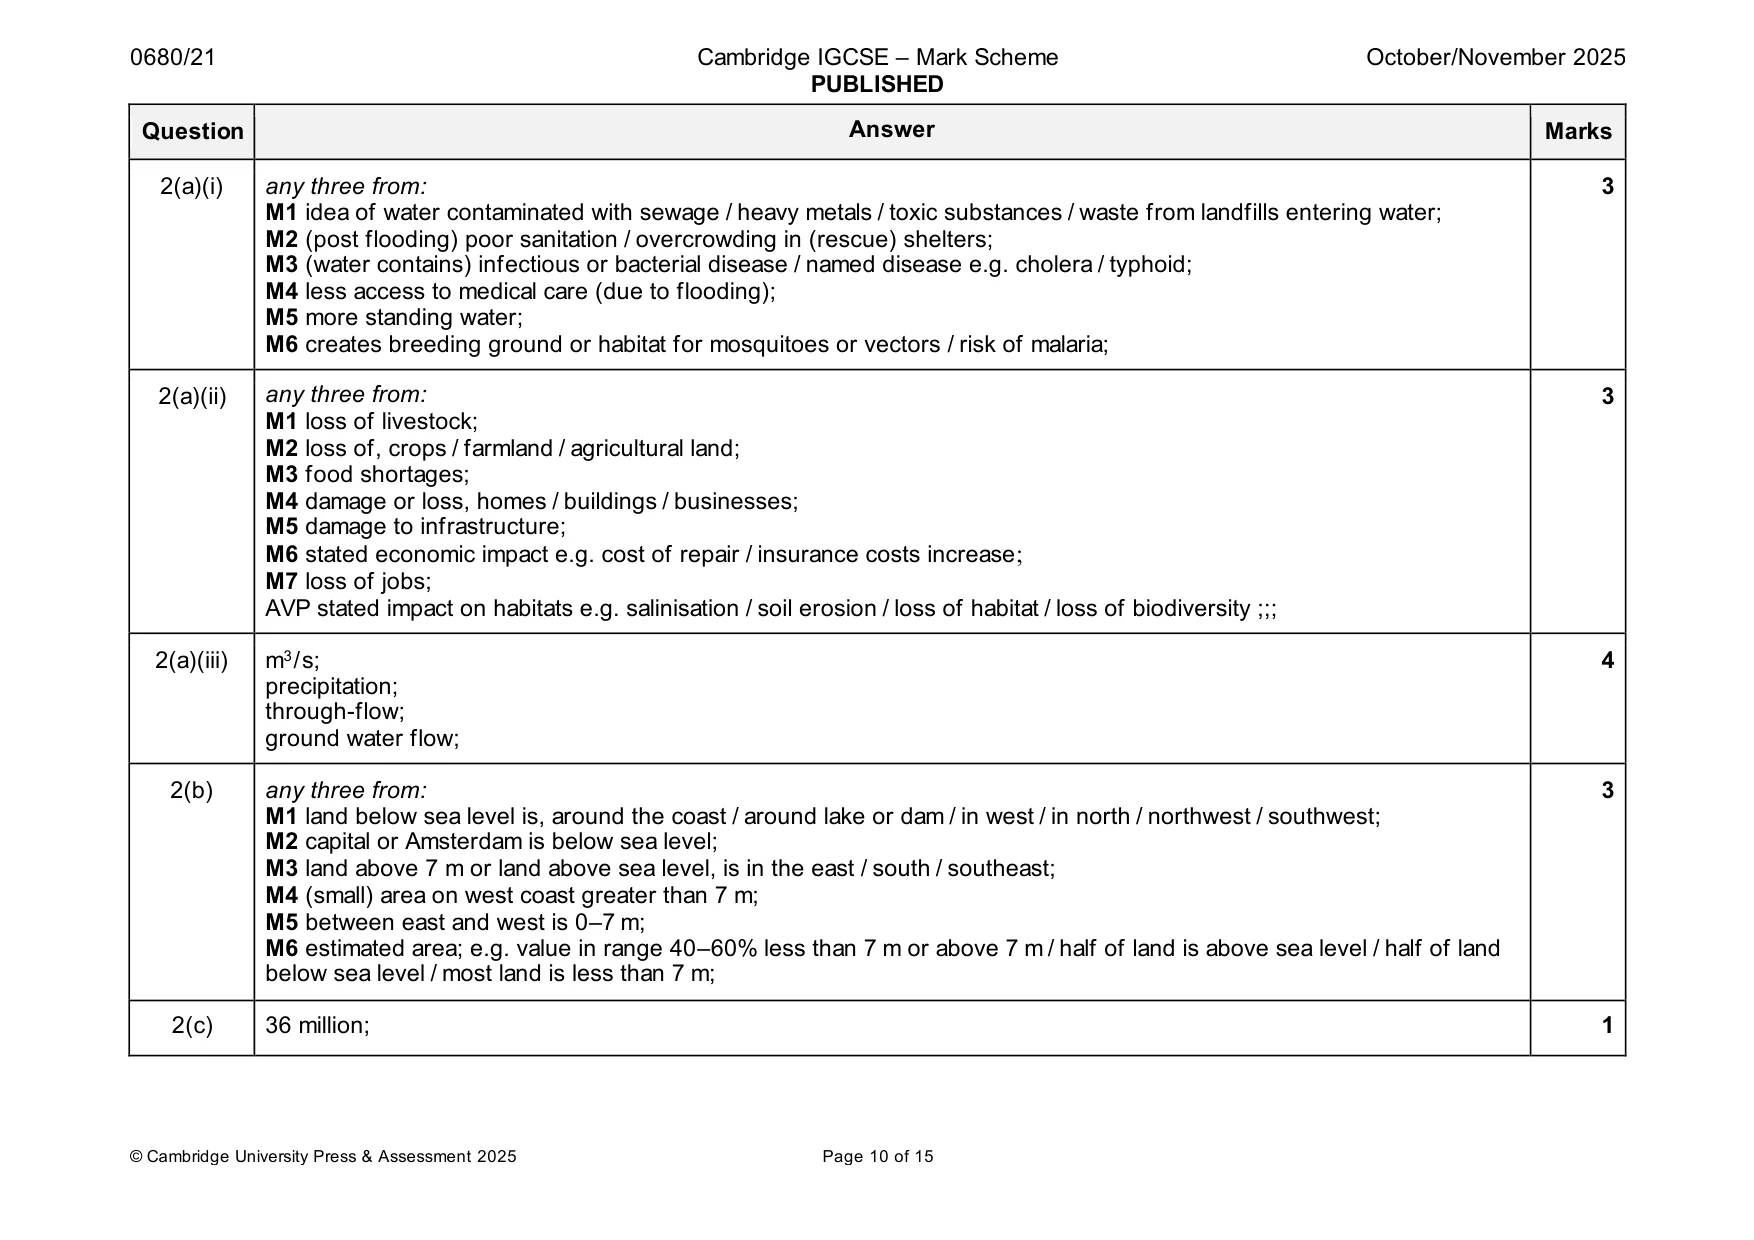
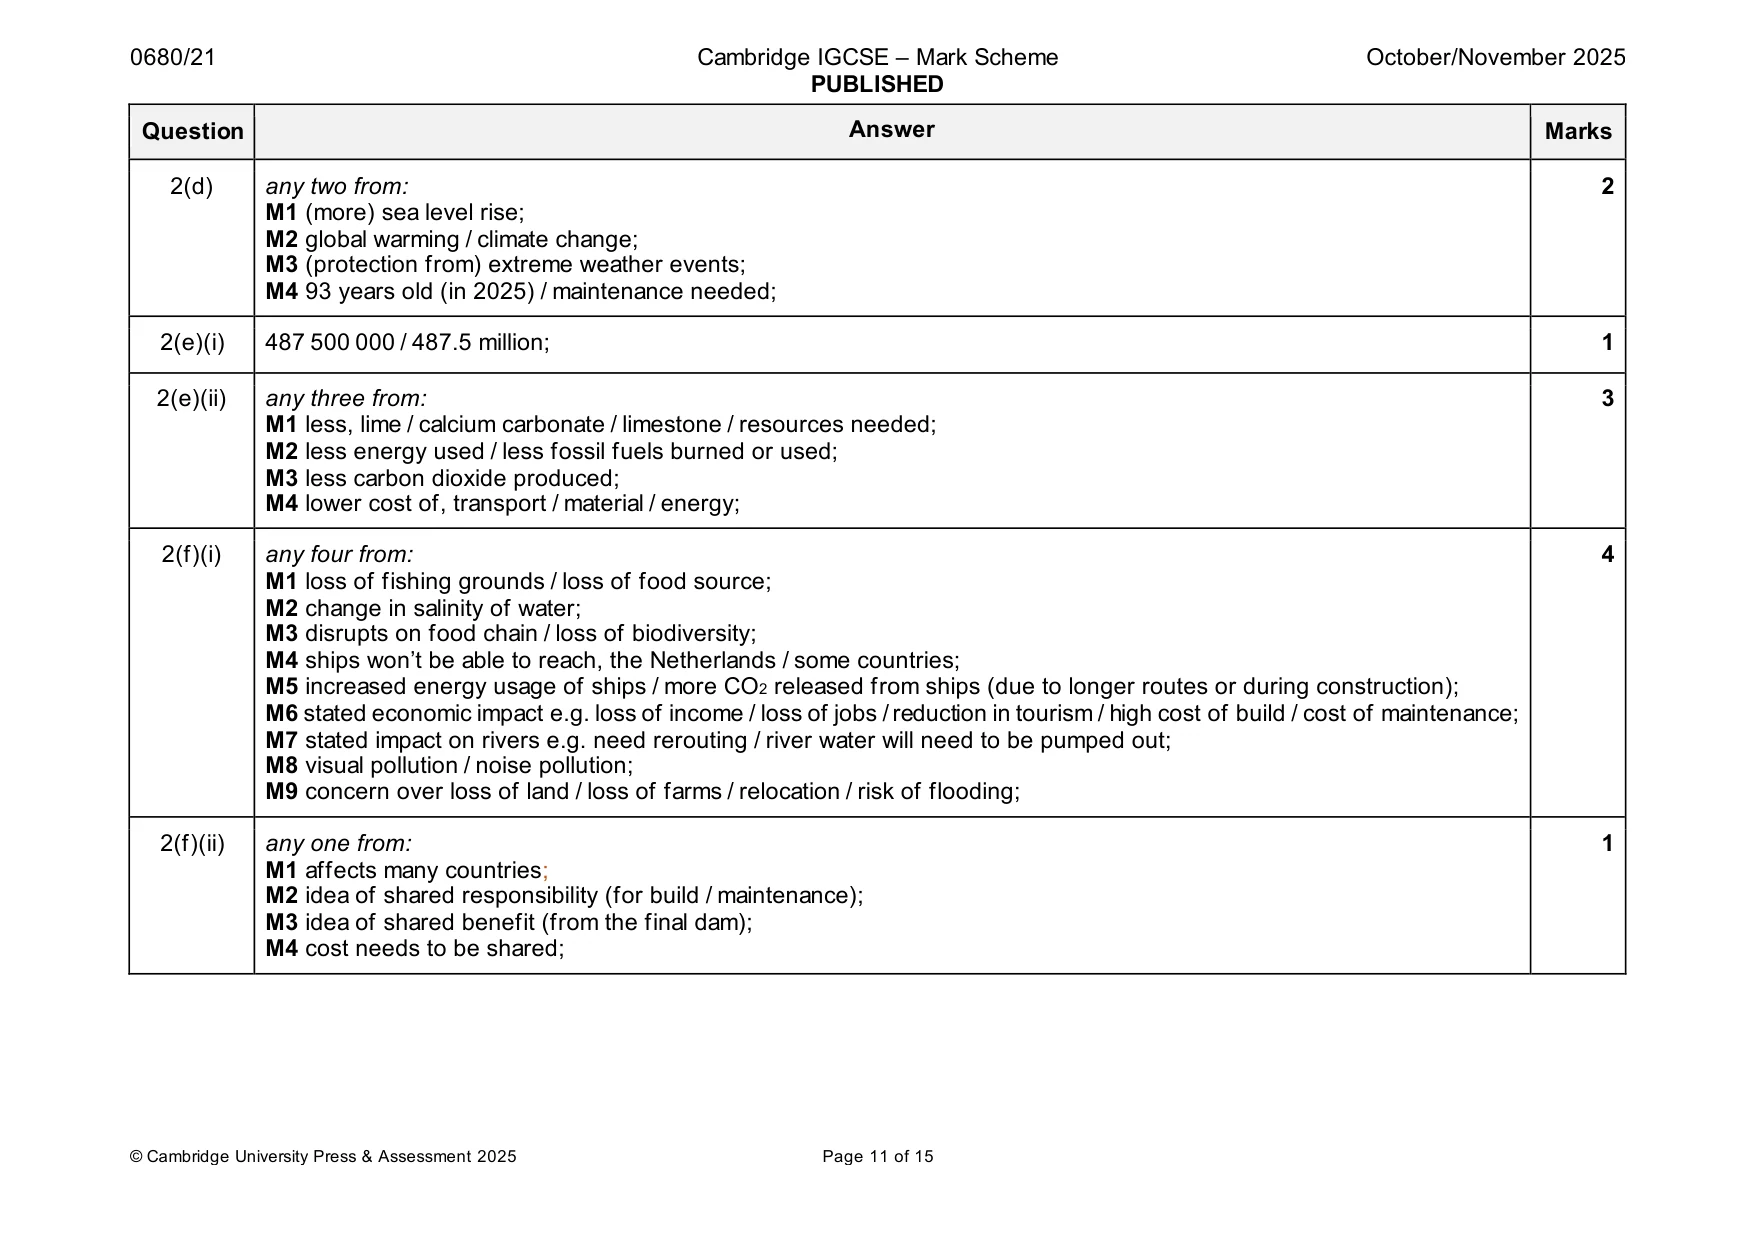
Mark scheme: 2(a)(i) any three from: 3 M1 idea of water contaminated with sewage / heavy metals / toxic substances / waste from landfills entering water; M2 (post flooding) poor sanitation / overcrowding in (rescue) shelters; M3 (water contains) infectious or bacterial disease / named disease e.g. cholera / typhoid; M4 less access to medical care (due to flooding); M5 more standing water; M6 creates breeding ground or habitat for mosquitoes or vectors / risk of malaria; 2(a)(ii) any three from: 3 M1 loss of livestock; M2 loss of, crops / farmland / agricultural land; M3 food shortages; M4 damage or loss, homes / buildings / businesses; M5 damage to infrastructure; M6 stated economic impact e.g. cost of repair / insurance costs increase; M7 loss of jobs; AVP stated impact on habitats e.g. salinisation / soil erosion / loss of habitat / loss of biodiversity ;;; 2(a)(iii) m3 / s; 4 precipitation; through-flow; ground water flow; 2(b) any three from: 3 M1 land below sea level is, around the coast / around lake or dam / in west / in north / northwest / southwest; M2 capital or Amsterdam is below sea level; M3 land above 7 m or land above sea level, is in the east / south / southeast; M4 (small) area on west coast greater than 7 m; M5 between east and west is 0–7 m; M6 estimated area; e.g. value in range 40–60% less than 7 m or above 7 m / half of land is above sea level / half of land below sea level / most land is less than 7 m; 2(c) 36 million; 1 2(d) any two from: 2 M1 (more) sea level rise; M2 global warming / climate change; M3 (protection from) extreme weather events; M4 93 years old (in 2025) / maintenance needed; 2(e)(i) 487 500 000 / 487.5 million; 1 2(e)(ii) any three from: 3 M1 less, lime / calcium carbonate / limestone / resources needed; M2 less energy used / less fossil fuels burned or used; M3 less carbon dioxide produced; M4 lower cost of, transport / material / energy; 2(f)(i) any four from: 4 M1 loss of fishing grounds / loss of food source; M2 change in salinity of water; M3 disrupts on food chain / loss of biodiversity; M4 ships won’t be able to reach, the Netherlands / some countries; M5 increased energy usage of ships / more CO2 released from ships (due to longer routes or during construction); M6 stated economic impact e.g. loss of income / loss of jobs / reduction in tourism / high cost of build / cost of maintenance; M7 stated impact on rivers e.g. need rerouting / river water will need to be pumped out; M8 visual pollution / noise pollution; M9 concern over loss of land / loss of farms / relocation / risk of flooding; 2(f)(ii) any one from: 1 M1 affects many countries; M2 idea of shared responsibility (for build / maintenance); M3 idea of shared benefit (from the final dam); M4 cost needs to be shared;
Q3 · Lake Markermeer is one of the largest freshwater lakes in Europe
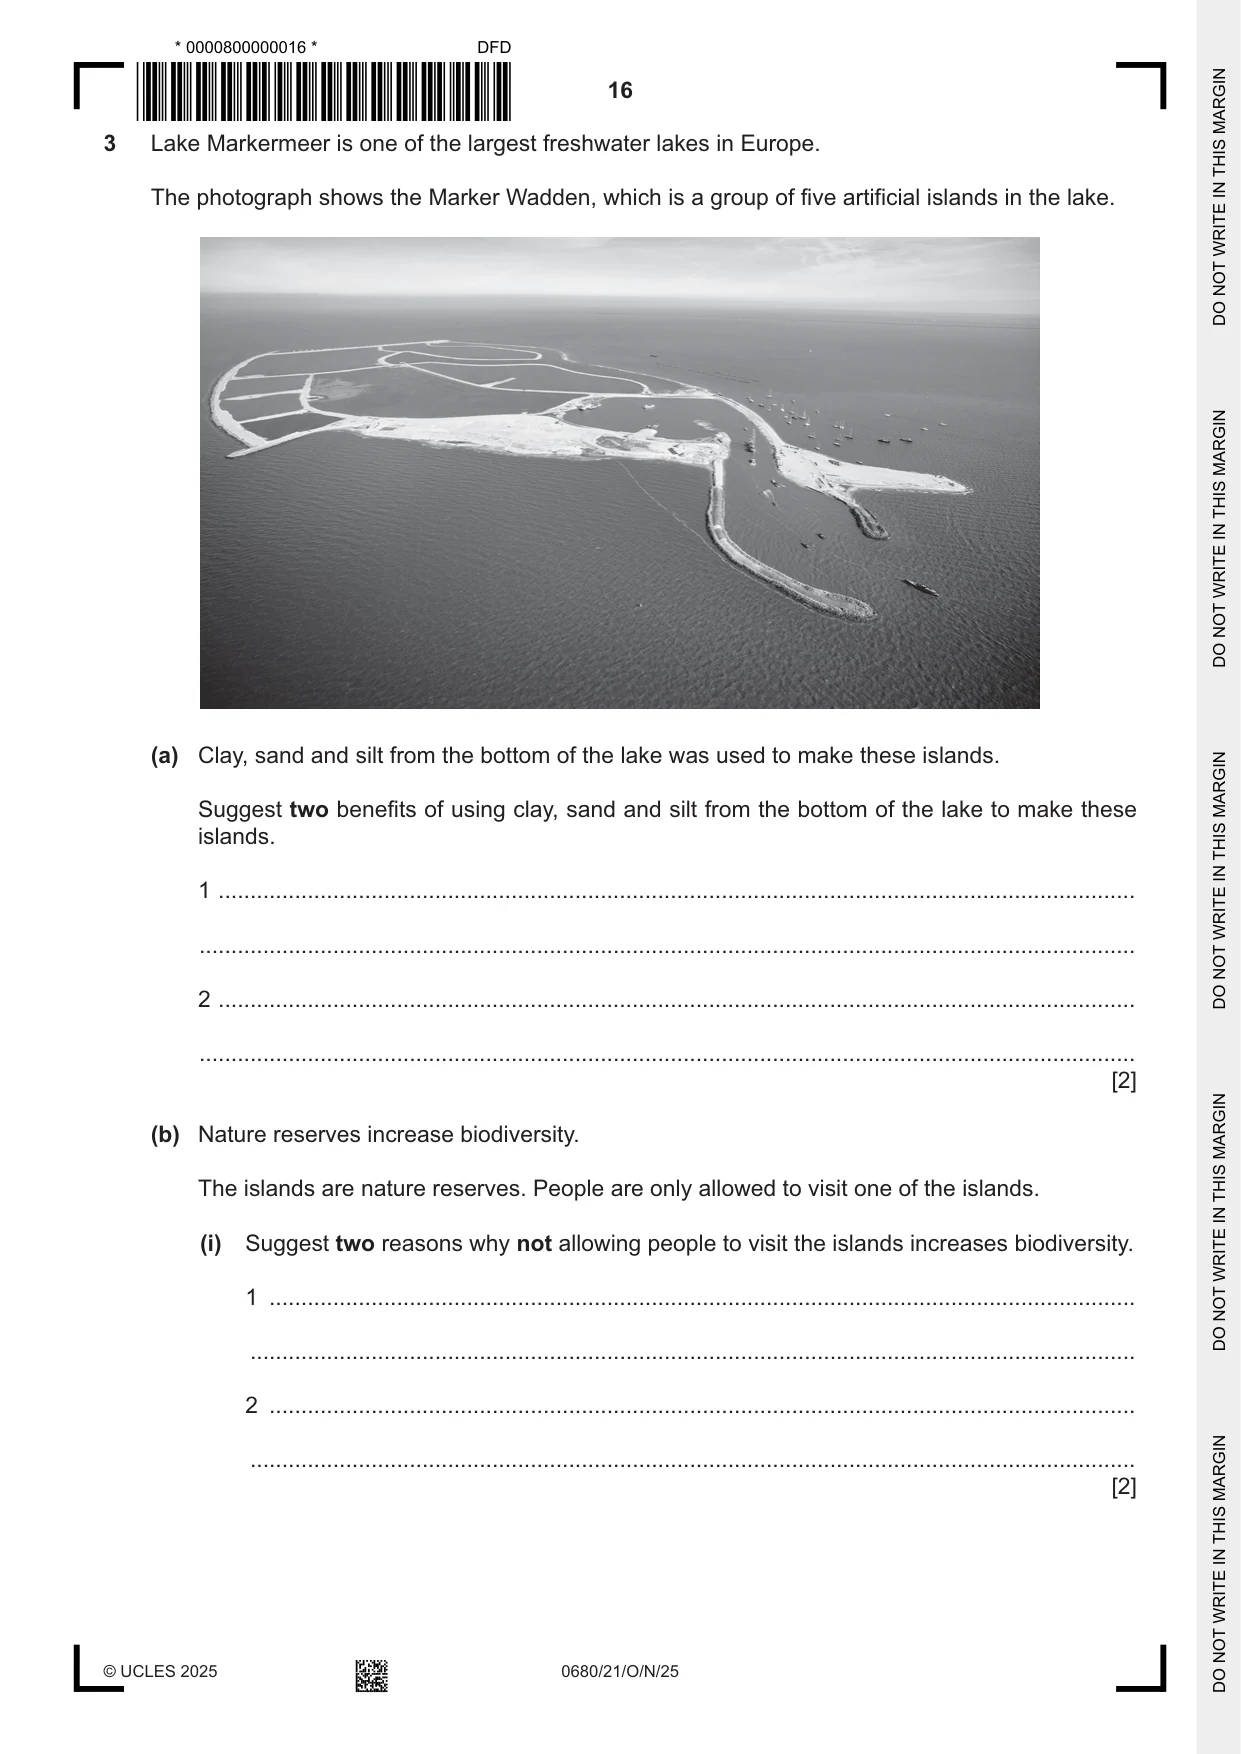
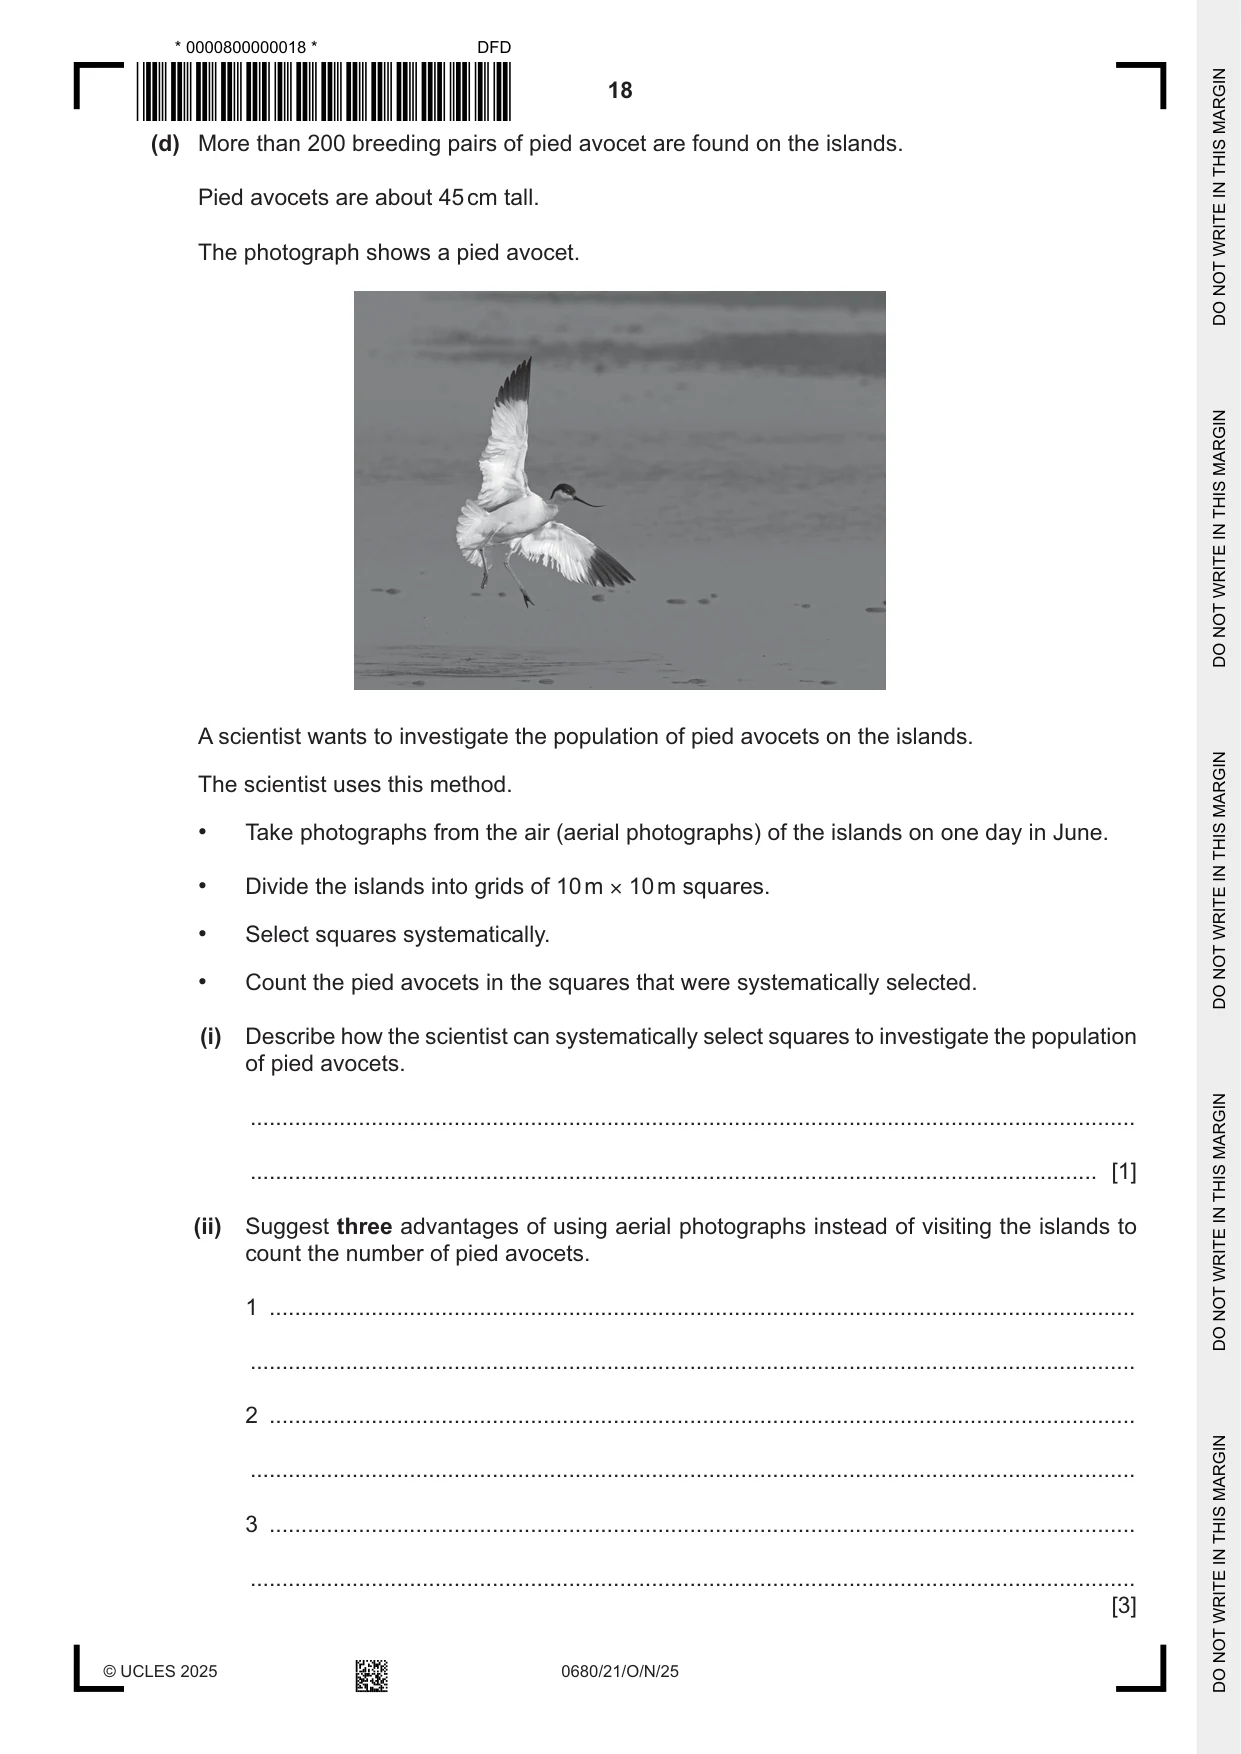
3 Lake Markermeer is one of the largest freshwater lakes in Europe. The photograph shows the Marker Wadden, which is a group of five artificial islands in the lake. (a) Clay, sand and silt from the bottom of the lake was used to make these islands. Suggest two benefits of using clay, sand and silt from the bottom of the lake to make these islands. 1 ................................................................................................................................................ ................................................................................................................................................... 2 ................................................................................................................................................ ................................................................................................................................................... [2] (b) Nature reserves increase biodiversity. The islands are nature reserves. People are only allowed to visit one of the islands. (i) Suggest two reasons why not allowing people to visit the islands increases biodiversity. 1 ........................................................................................................................................ ........................................................................................................................................... 2 ........................................................................................................................................ ........................................................................................................................................... [2] (ii) Describe how zoos can also increase biodiversity. ........................................................................................................................................... ........................................................................................................................................... ........................................................................................................................................... ........................................................................................................................................... ........................................................................................................................................... ..................................................................................................................................... [3] (iii) Suggest one reason why some people are against zoos. ........................................................................................................................................... ..................................................................................................................................... [1] (iv) Extractive reserves are a strategy to increase biodiversity. Describe what is meant by an extractive reserve. ........................................................................................................................................... ........................................................................................................................................... ........................................................................................................................................... ..................................................................................................................................... [2] (c) People are allowed to visit one of the islands. Electricity on this island is generated by solar and wind power. Explain how wind power is used to generate electricity. ................................................................................................................................................... ................................................................................................................................................... ................................................................................................................................................... ................................................................................................................................................... ................................................................................................................................................... ............................................................................................................................................. [3] (d) More than 200 breeding pairs of pied avocet are found on the islands. Pied avocets are about 45 cm tall. The photograph shows a pied avocet. A scientist wants to investigate the population of pied avocets on the islands. The scientist uses this method. • Take photographs from the air (aerial photographs) of the islands on one day in June. • Divide the islands into grids of 10 m × 10 m squares. • Select squares systematically. • Count the pied avocets in the squares that were systematically selected. (i) Describe how the scientist can systematically select squares to investigate the population of pied avocets. ........................................................................................................................................... ..................................................................................................................................... [1] (ii) Suggest three advantages of using aerial photographs instead of visiting the islands to count the number of pied avocets. 1 ........................................................................................................................................ ........................................................................................................................................... 2 ........................................................................................................................................ ........................................................................................................................................... 3 ........................................................................................................................................ ........................................................................................................................................... [3] (iii) Suggest one improvement to the scientist’s method. ........................................................................................................................................... ..................................................................................................................................... [1] (iv) Describe how the scientist estimates the total number of pied avocets on the islands. ........................................................................................................................................... ........................................................................................................................................... ........................................................................................................................................... ..................................................................................................................................... [2] (v) Explain why pitfall traps are not used to sample pied avocets. ........................................................................................................................................... ........................................................................................................................................... ........................................................................................................................................... ..................................................................................................................................... [2] [Total: 22]
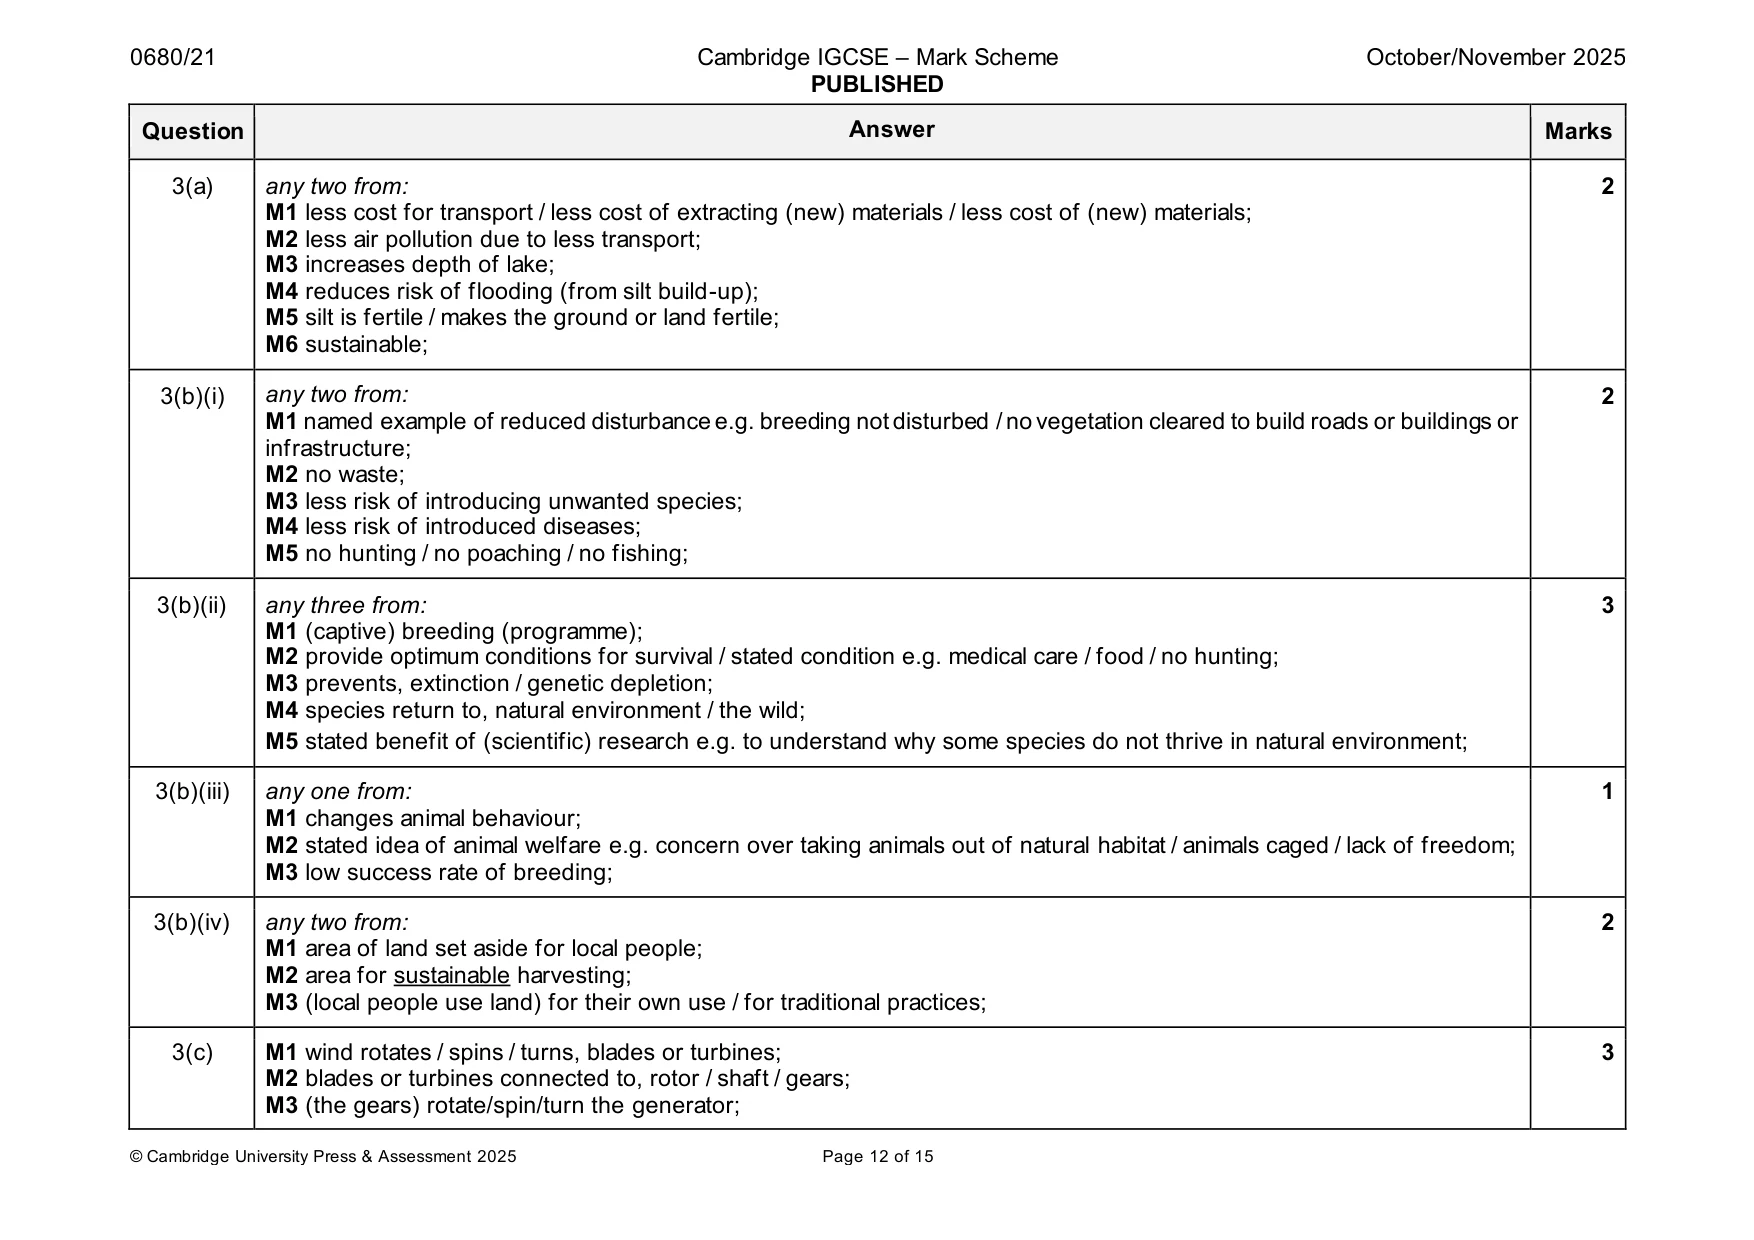
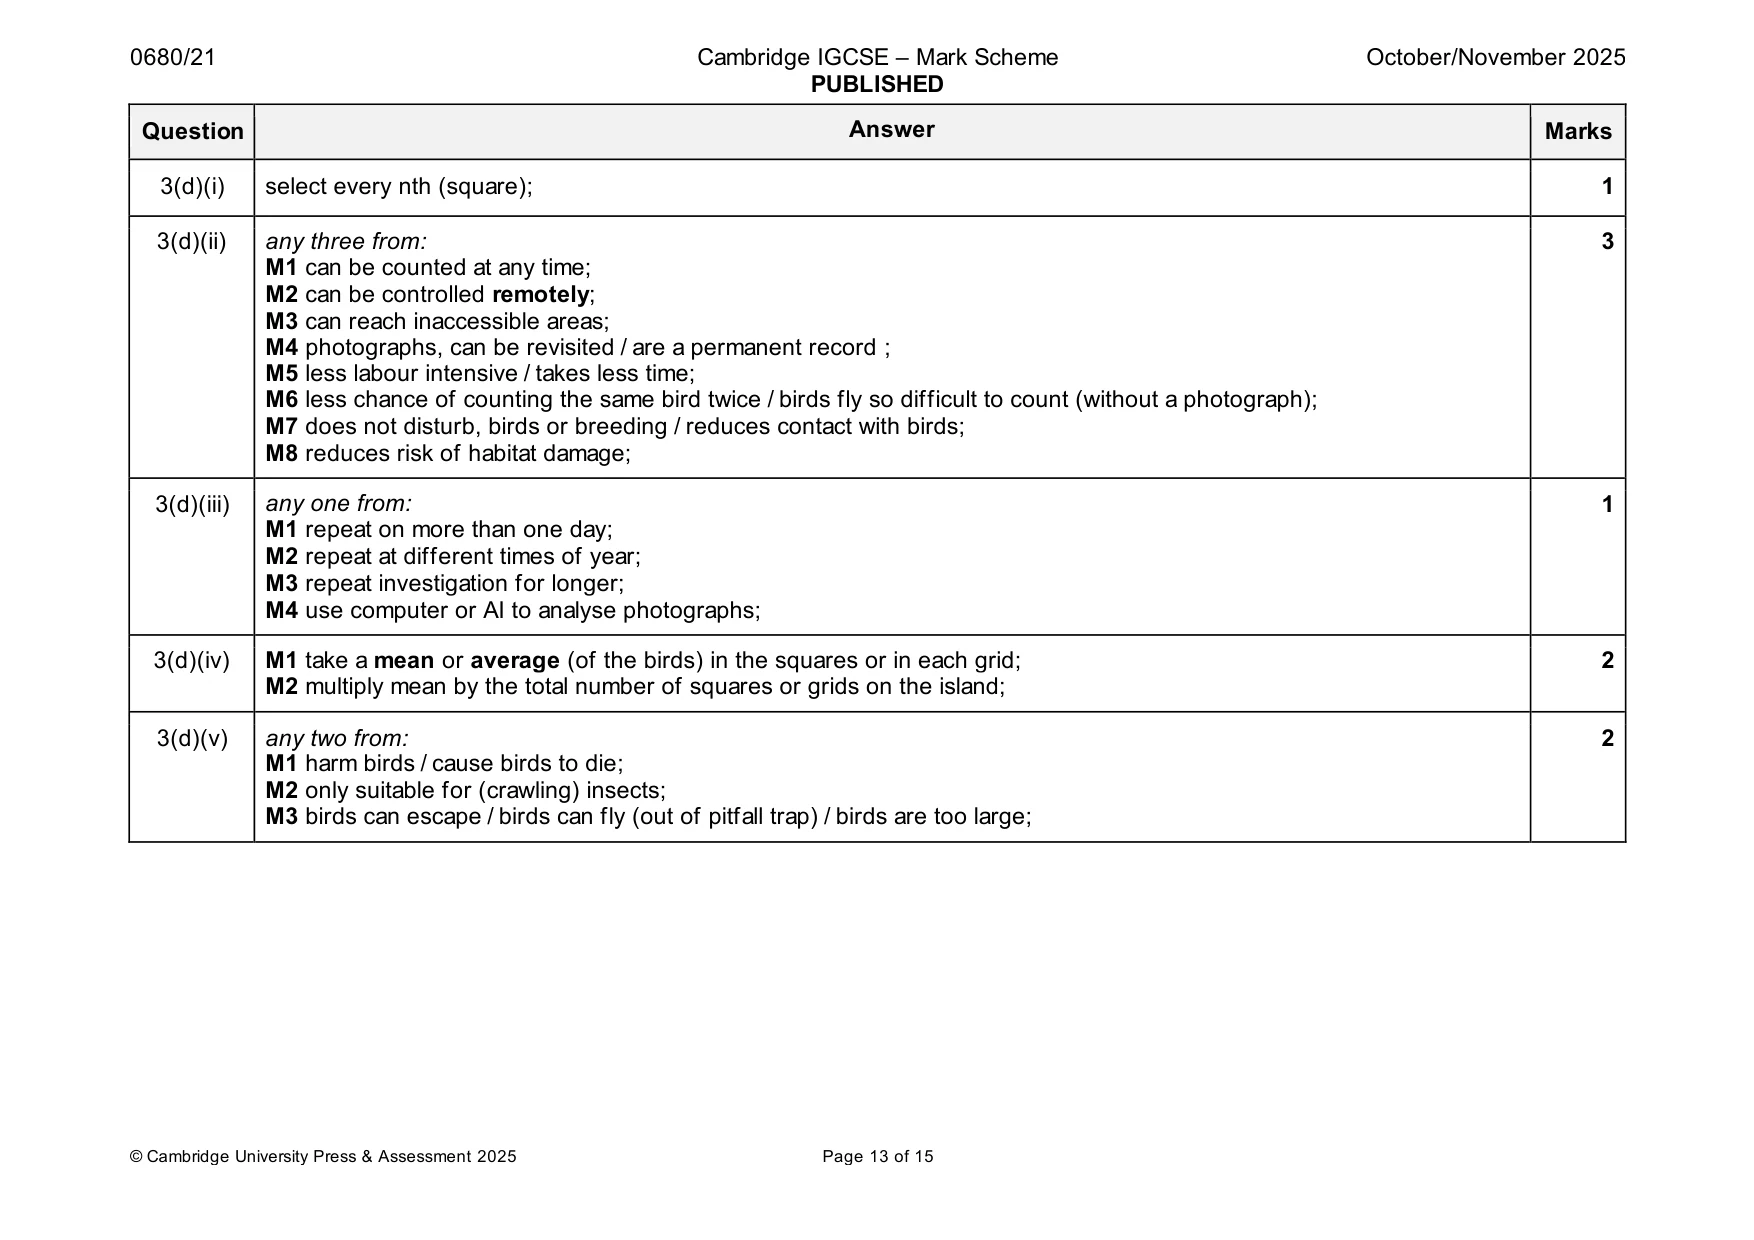
Mark scheme: 3(a) any two from: 2 M1 less cost for transport / less cost of extracting (new) materials / less cost of (new) materials; M2 less air pollution due to less transport; M3 increases depth of lake; M4 reduces risk of flooding (from silt build-up); M5 silt is fertile / makes the ground or land fertile; M6 sustainable; 3(b)(i) any two from: 2 M1 named example of reduced disturbance e.g. breeding not disturbed / no vegetation cleared to build roads or buildings or infrastructure; M2 no waste; M3 less risk of introducing unwanted species; M4 less risk of introduced diseases; M5 no hunting / no poaching / no fishing; 3(b)(ii) any three from: 3 M1 (captive) breeding (programme); M2 provide optimum conditions for survival / stated condition e.g. medical care / food / no hunting; M3 prevents, extinction / genetic depletion; M4 species return to, natural environment / the wild; M5 stated benefit of (scientific) research e.g. to understand why some species do not thrive in natural environment; 3(b)(iii) any one from: 1 M1 changes animal behaviour; M2 stated idea of animal welfare e.g. concern over taking animals out of natural habitat / animals caged / lack of freedom; M3 low success rate of breeding; 3(b)(iv) any two from: 2 M1 area of land set aside for local people; M2 area for sustainable harvesting; M3 (local people use land) for their own use / for traditional practices; 3(c) M1 wind rotates / spins / turns, blades or turbines; 3 M2 blades or turbines connected to, rotor / shaft / gears; M3 (the gears) rotate/spin/turn the generator; 3(d)(i) select every nth (square); 1 3(d)(ii) any three from: 3 M1 can be counted at any time; M2 can be controlled remotely; M3 can reach inaccessible areas; M4 photographs, can be revisited / are a permanent record ; M5 less labour intensive / takes less time; M6 less chance of counting the same bird twice / birds fly so difficult to count (without a photograph); M7 does not disturb, birds or breeding / reduces contact with birds; M8 reduces risk of habitat damage; 3(d)(iii) any one from: 1 M1 repeat on more than one day; M2 repeat at different times of year; M3 repeat investigation for longer; M4 use computer or AI to analyse photographs; 3(d)(iv) M1 take a mean or average (of the birds) in the squares or in each grid; 2 M2 multiply mean by the total number of squares or grids on the island; 3(d)(v) any two from: 2 M1 harm birds / cause birds to die; M2 only suitable for (crawling) insects; M3 birds can escape / birds can fly (out of pitfall trap) / birds are too large;
Q4 · The table shows the percentage of different energy resources used to generate electricity…
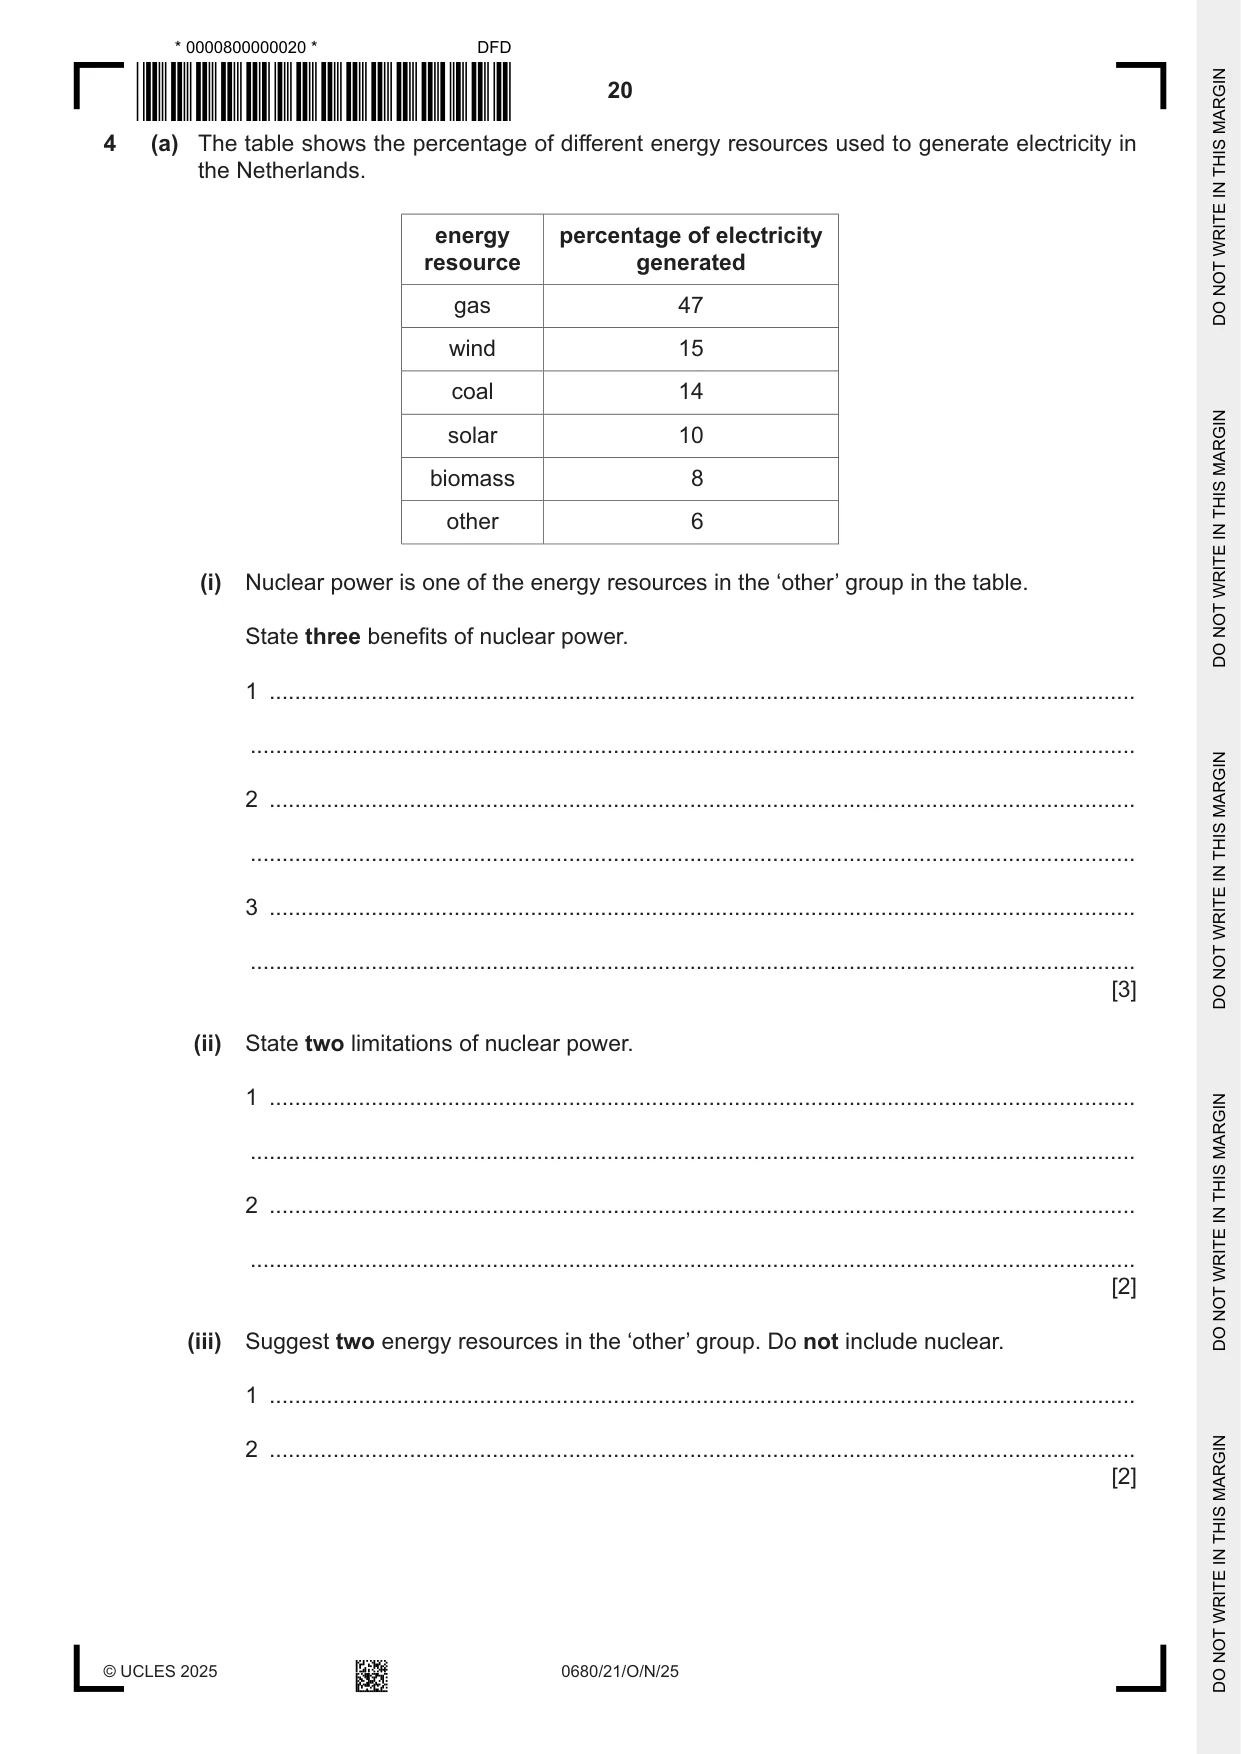
4 (a) The table shows the percentage of different energy resources used to generate electricity in the Netherlands. energy percentage of electricity resource generated gas 47 wind 15 coal 14 solar 10 biomass 8 other 6 (i) Nuclear power is one of the energy resources in the ‘other’ group in the table. State three benefits of nuclear power. 1 ........................................................................................................................................ ........................................................................................................................................... 2 ........................................................................................................................................ ........................................................................................................................................... 3 ........................................................................................................................................ ........................................................................................................................................... [3] (ii) State two limitations of nuclear power. 1 ........................................................................................................................................ ........................................................................................................................................... 2 ........................................................................................................................................ ........................................................................................................................................... [2] (iii) Suggest two energy resources in the ‘other’ group. Do not include nuclear. 1 ........................................................................................................................................ 2 ........................................................................................................................................ [2] (iv) The Netherlands plans a 55% reduction in carbon emissions by 2030. Explain why a 55% reduction in carbon emissions will be difficult to achieve. Use information in the table to support your answer. ........................................................................................................................................... ........................................................................................................................................... ........................................................................................................................................... ........................................................................................................................................... ........................................................................................................................................... ..................................................................................................................................... [3] (b) The bar chart shows the electricity exported by 6 countries in one year. Content removed due to copyright restrictions. (i) In the same year, the electricity imported to the Netherlands was 15 billion kWh. Determine the ratio of electricity imported to electricity exported in the Netherlands. Give your answer as the simplest whole number ratio. imported : exported = .................... : .................... [1] (ii) Suggest one reason why countries export electricity. ........................................................................................................................................... ..................................................................................................................................... [1] [Total: 12]
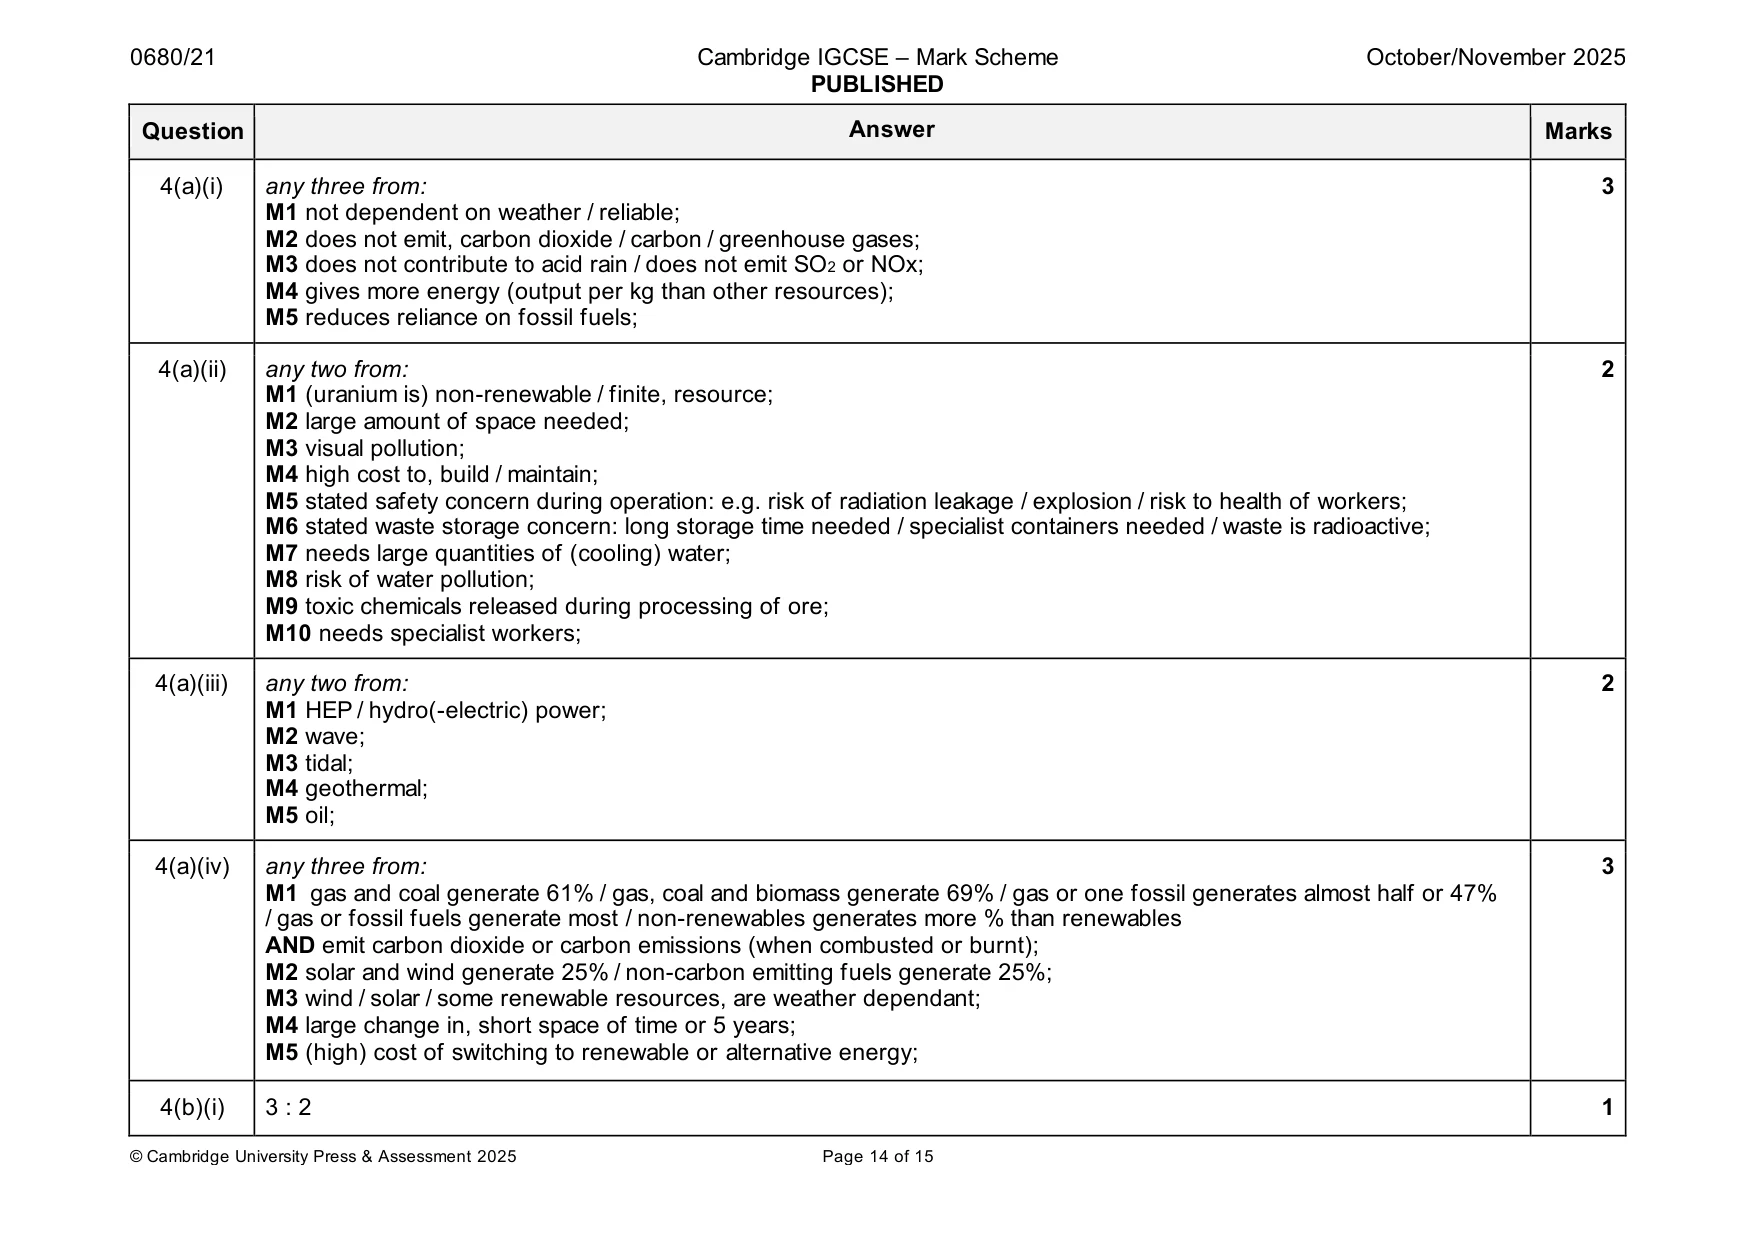
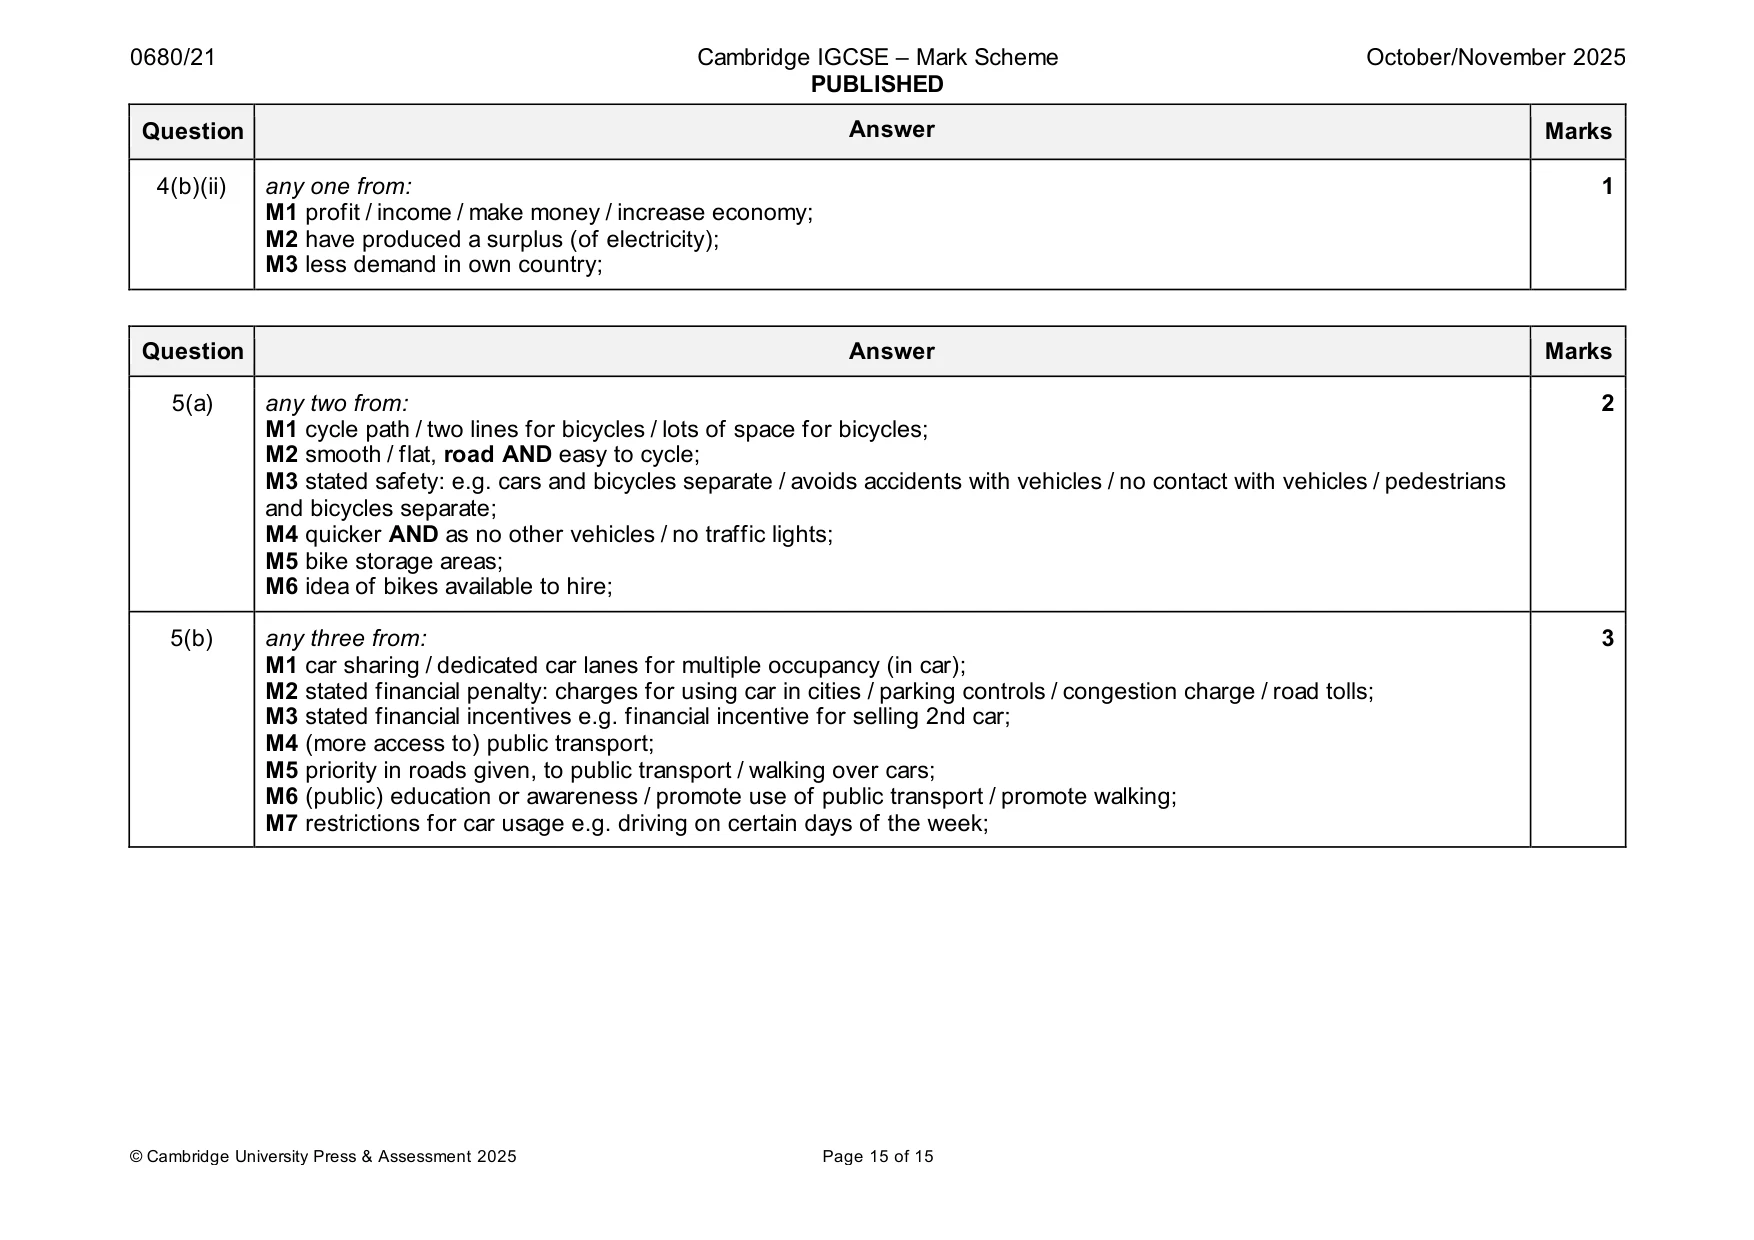
Mark scheme: 4(a)(i) any three from: 3 M1 not dependent on weather / reliable; M2 does not emit, carbon dioxide / carbon / greenhouse gases; M3 does not contribute to acid rain / does not emit SO2 or NOx; M4 gives more energy (output per kg than other resources); M5 reduces reliance on fossil fuels; 4(a)(ii) any two from: 2 M1 (uranium is) non-renewable / finite, resource; M2 large amount of space needed; M3 visual pollution; M4 high cost to, build / maintain; M5 stated safety concern during operation: e.g. risk of radiation leakage / explosion / risk to health of workers; M6 stated waste storage concern: long storage time needed / specialist containers needed / waste is radioactive; M7 needs large quantities of (cooling) water; M8 risk of water pollution; M9 toxic chemicals released during processing of ore; M10 needs specialist workers; 4(a)(iii) any two from: 2 M1 HEP / hydro(-electric) power; M2 wave; M3 tidal; M4 geothermal; M5 oil; 4(a)(iv) any three from: 3 M1 gas and coal generate 61% / gas, coal and biomass generate 69% / gas or one fossil generates almost half or 47% / gas or fossil fuels generate most / non-renewables generates more % than renewables AND emit carbon dioxide or carbon emissions (when combusted or burnt); M2 solar and wind generate 25% / non-carbon emitting fuels generate 25%; M3 wind / solar / some renewable resources, are weather dependant; M4 large change in, short space of time or 5 years; M5 (high) cost of switching to renewable or alternative energy; 4(b)(i) 3 : 2 1 4(b)(ii) any one from: 1 M1 profit / income / make money / increase economy; M2 have produced a surplus (of electricity); M3 less demand in own country;
Q5 · Many people in the Netherlands use bicycles to travel to work
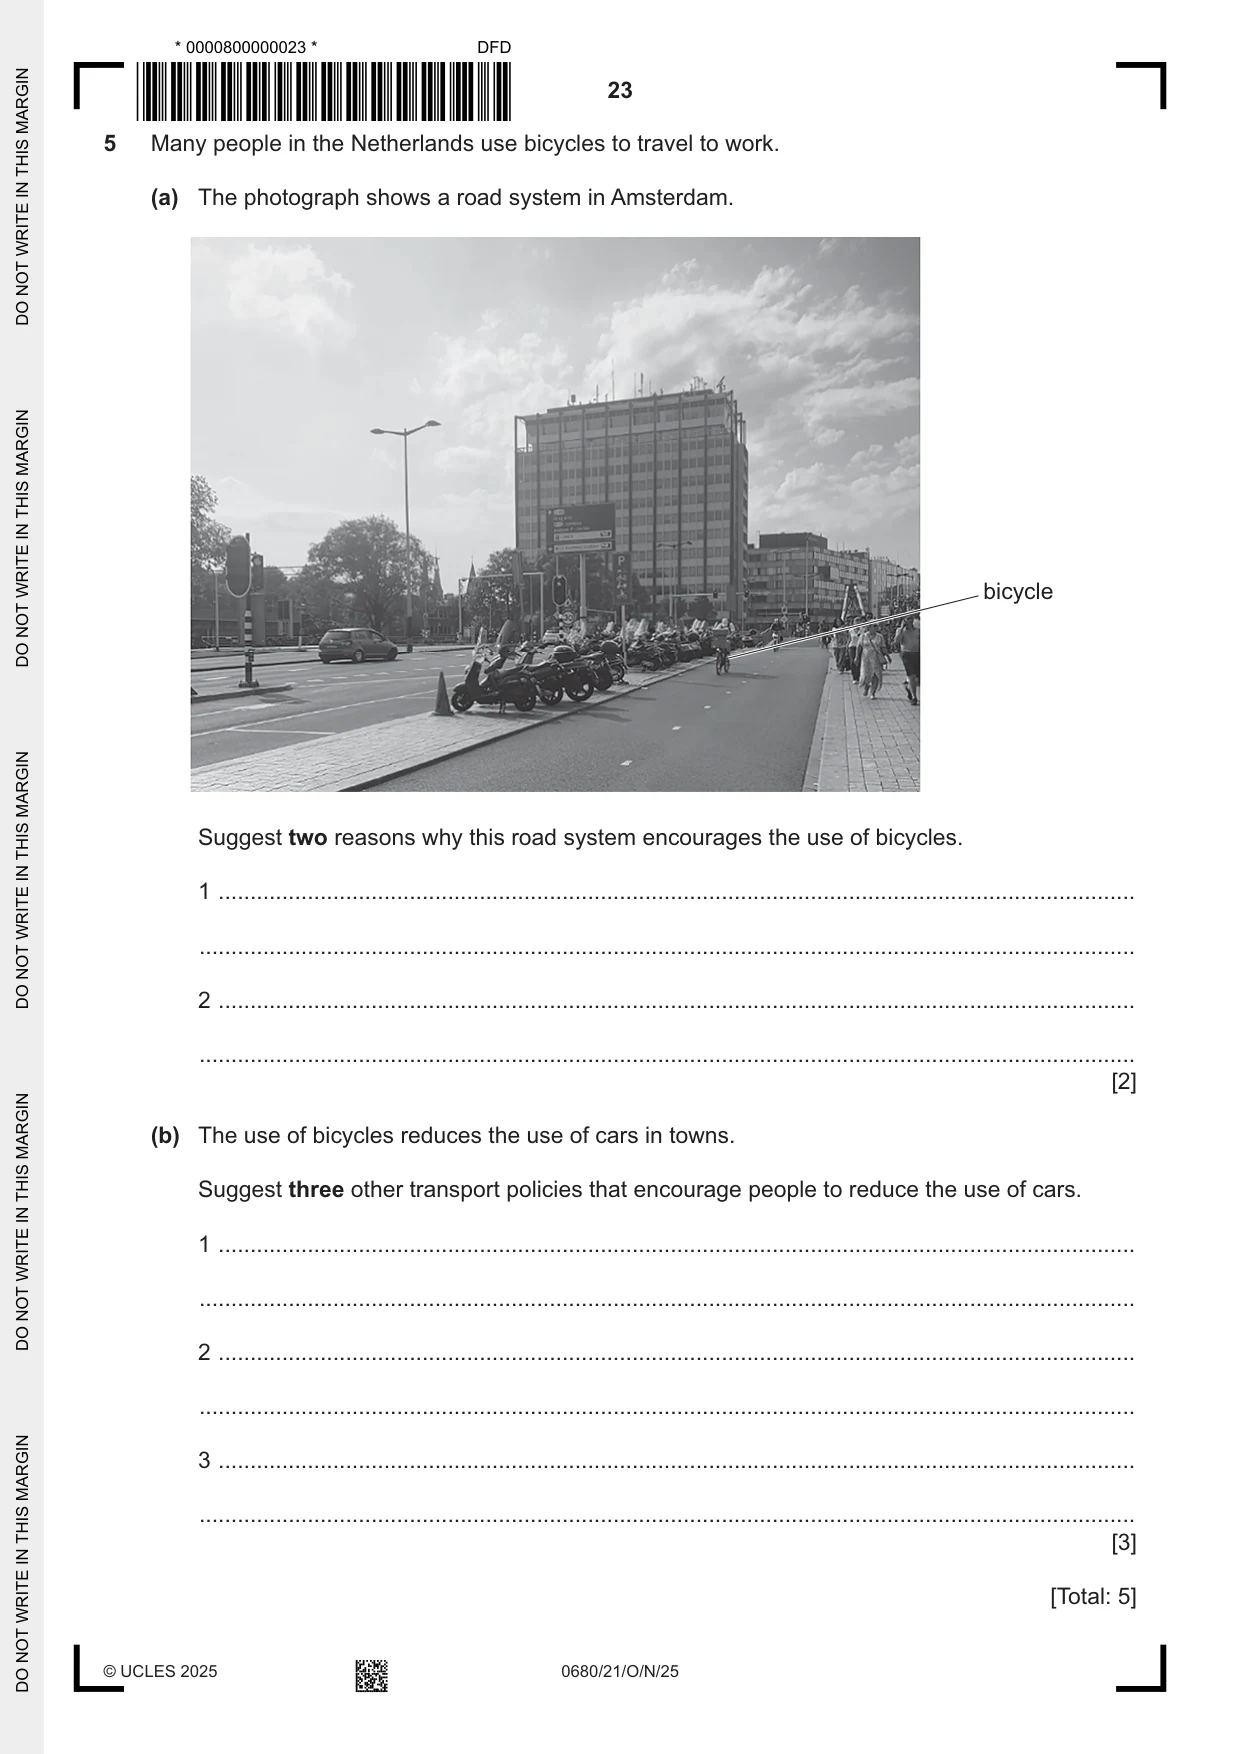
5 Many people in the Netherlands use bicycles to travel to work. (a) The photograph shows a road system in Amsterdam. bicycle Suggest two reasons why this road system encourages the use of bicycles. 1 ................................................................................................................................................ ................................................................................................................................................... 2 ................................................................................................................................................ ................................................................................................................................................... [2] (b) The use of bicycles reduces the use of cars in towns. Suggest three other transport policies that encourage people to reduce the use of cars. 1 ................................................................................................................................................ ................................................................................................................................................... 2 ................................................................................................................................................ ................................................................................................................................................... 3 ................................................................................................................................................ ................................................................................................................................................... [3] [Total: 5]
Mark scheme: 5(a) any two from: 2 M1 cycle path / two lines for bicycles / lots of space for bicycles; M2 smooth / flat, road AND easy to cycle; M3 stated safety: e.g. cars and bicycles separate / avoids accidents with vehicles / no contact with vehicles / pedestrians and bicycles separate; M4 quicker AND as no other vehicles / no traffic lights; M5 bike storage areas; M6 idea of bikes available to hire; 5(b) any three from: 3 M1 car sharing / dedicated car lanes for multiple occupancy (in car); M2 stated financial penalty: charges for using car in cities / parking controls / congestion charge / road tolls; M3 stated financial incentives e.g. financial incentive for selling 2nd car; M4 (more access to) public transport; M5 priority in roads given, to public transport / walking over cars; M6 (public) education or awareness / promote use of public transport / promote walking; M7 restrictions for car usage e.g. driving on certain days of the week;
What was in this paper
The subtopics covered by these 5 questions, and how many questions each got. Open one in a new tab to see every Cambridge question on it.
What you needed in this session
Cambridge’s own grade thresholds for 2025 Oct/Nov, Paper 2 · Variant 1. A higher threshold means an easier paper — the bar moves with how the cohort did.