Cambridge IGCSE Environmental Management 0680 — 2025 May/June Paper 2 · Variant 3
0680/23/M/J/25 · 3 questions · 80 marks · 105 min
The question paper and its mark scheme, free to read here and free to download. This is Cambridge’s own paper, exactly as it was sat.
Question paper20 pages

Mark scheme12 pages
Answers below. Sit the paper first if you are practising.
Questions as text
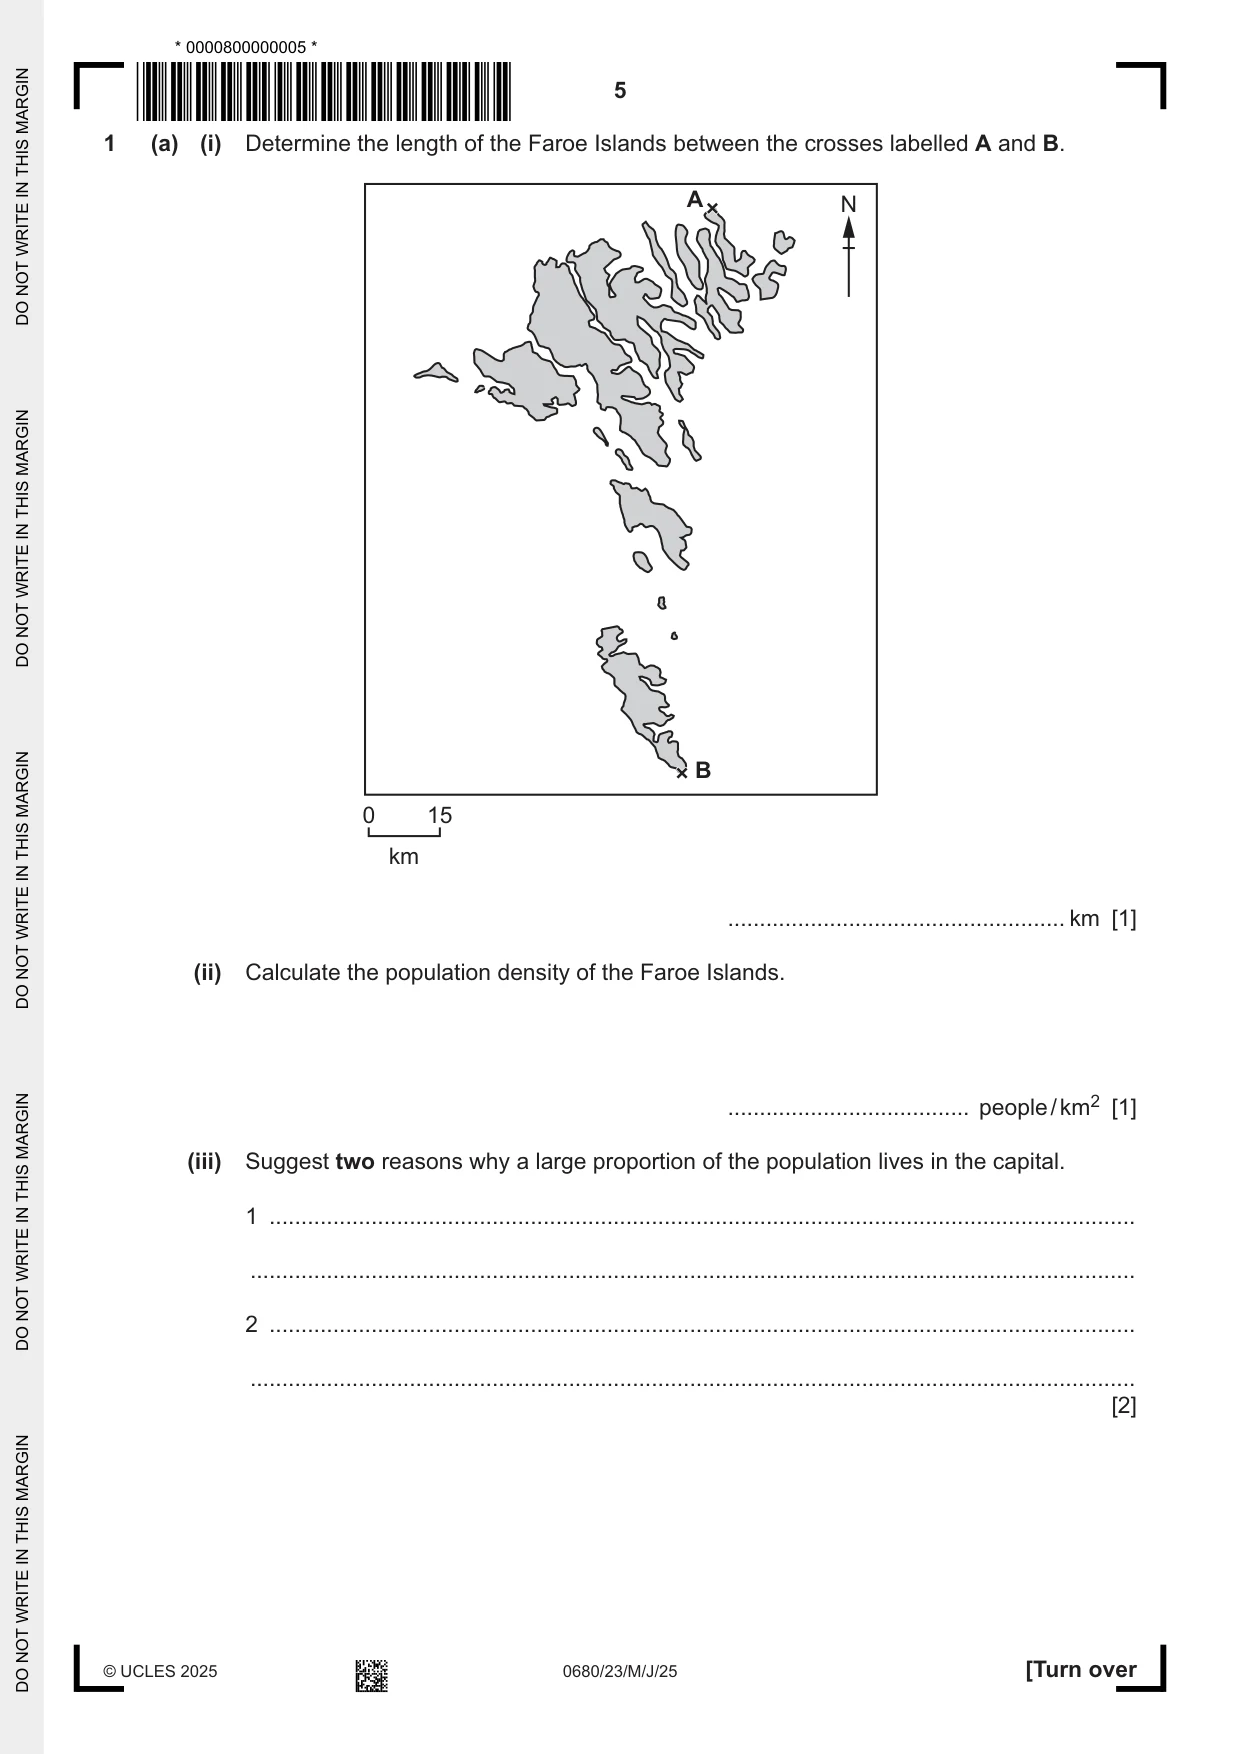
Q1 · Determine the length of the Faroe Islands between the crosses labelled A and B
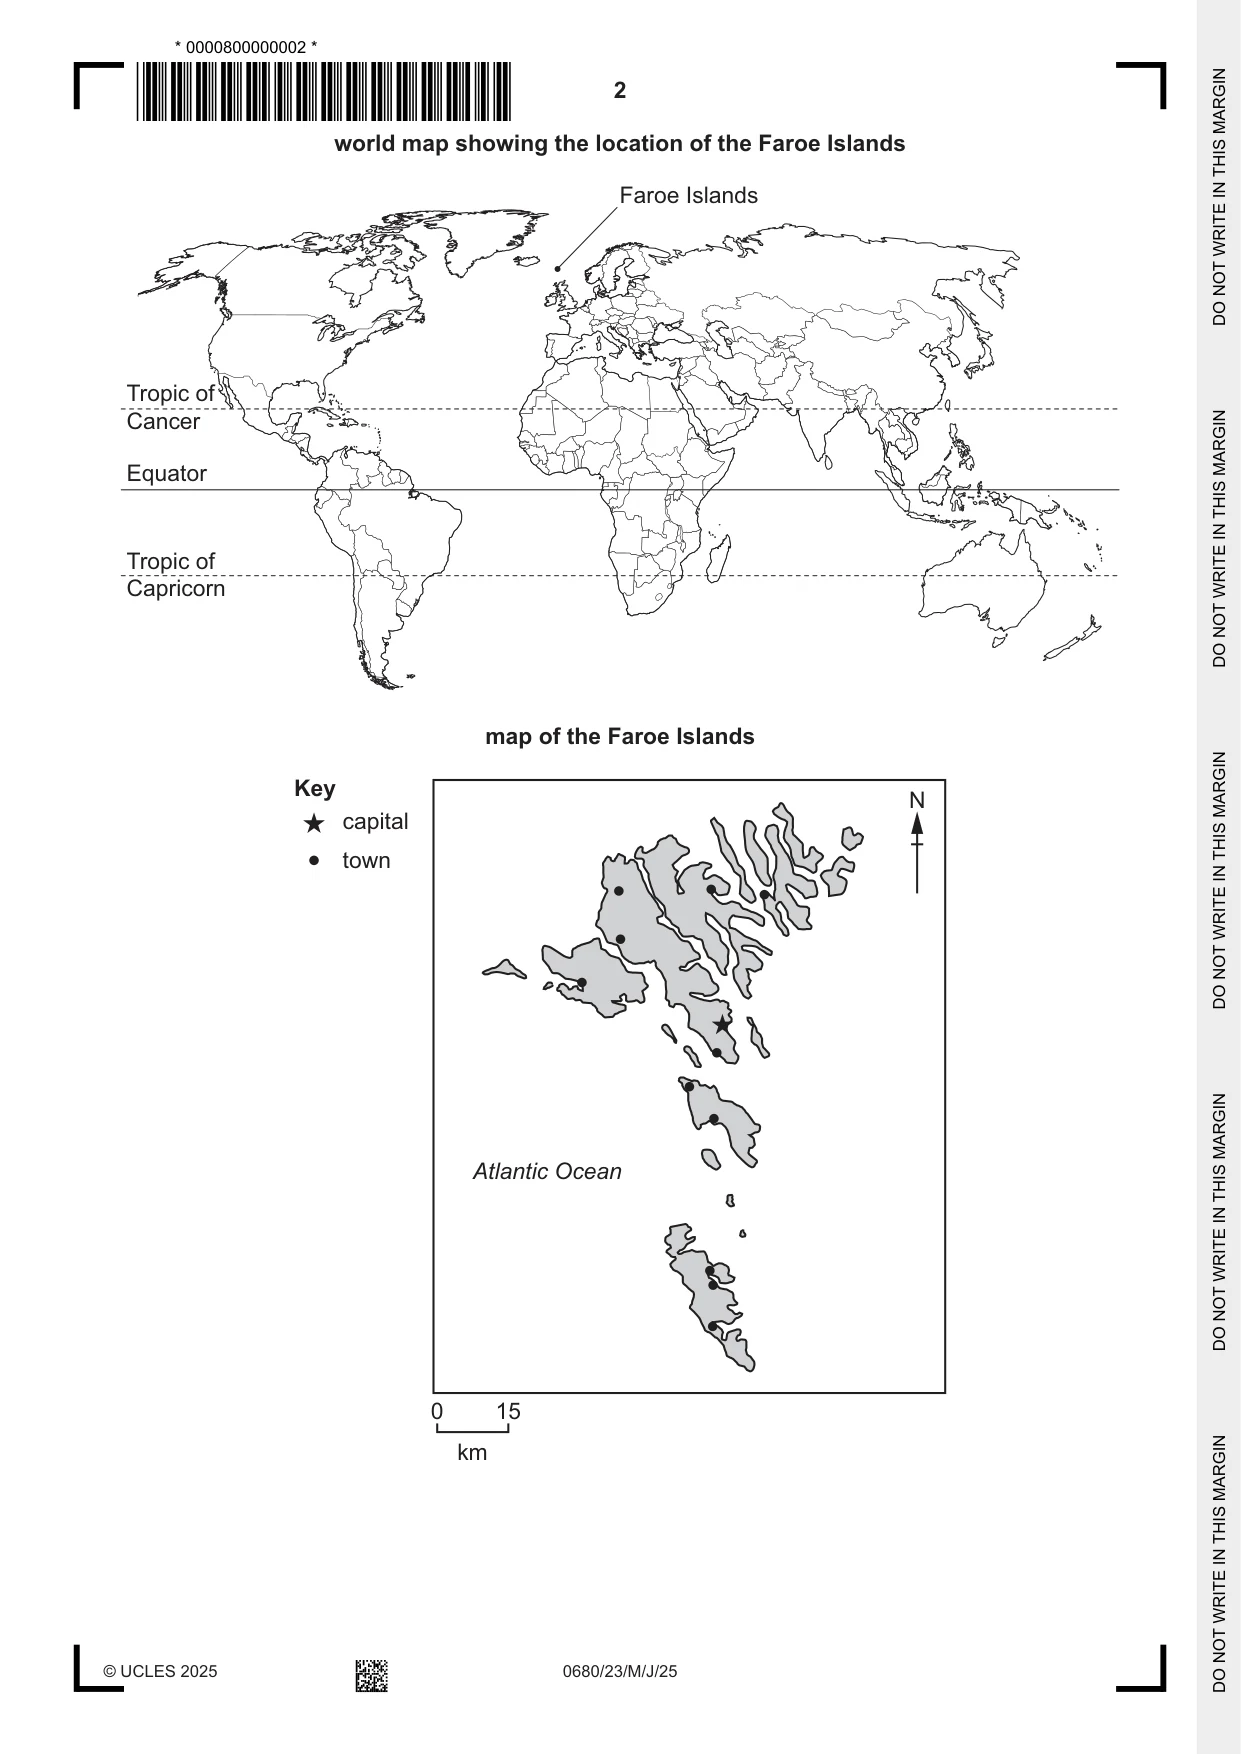
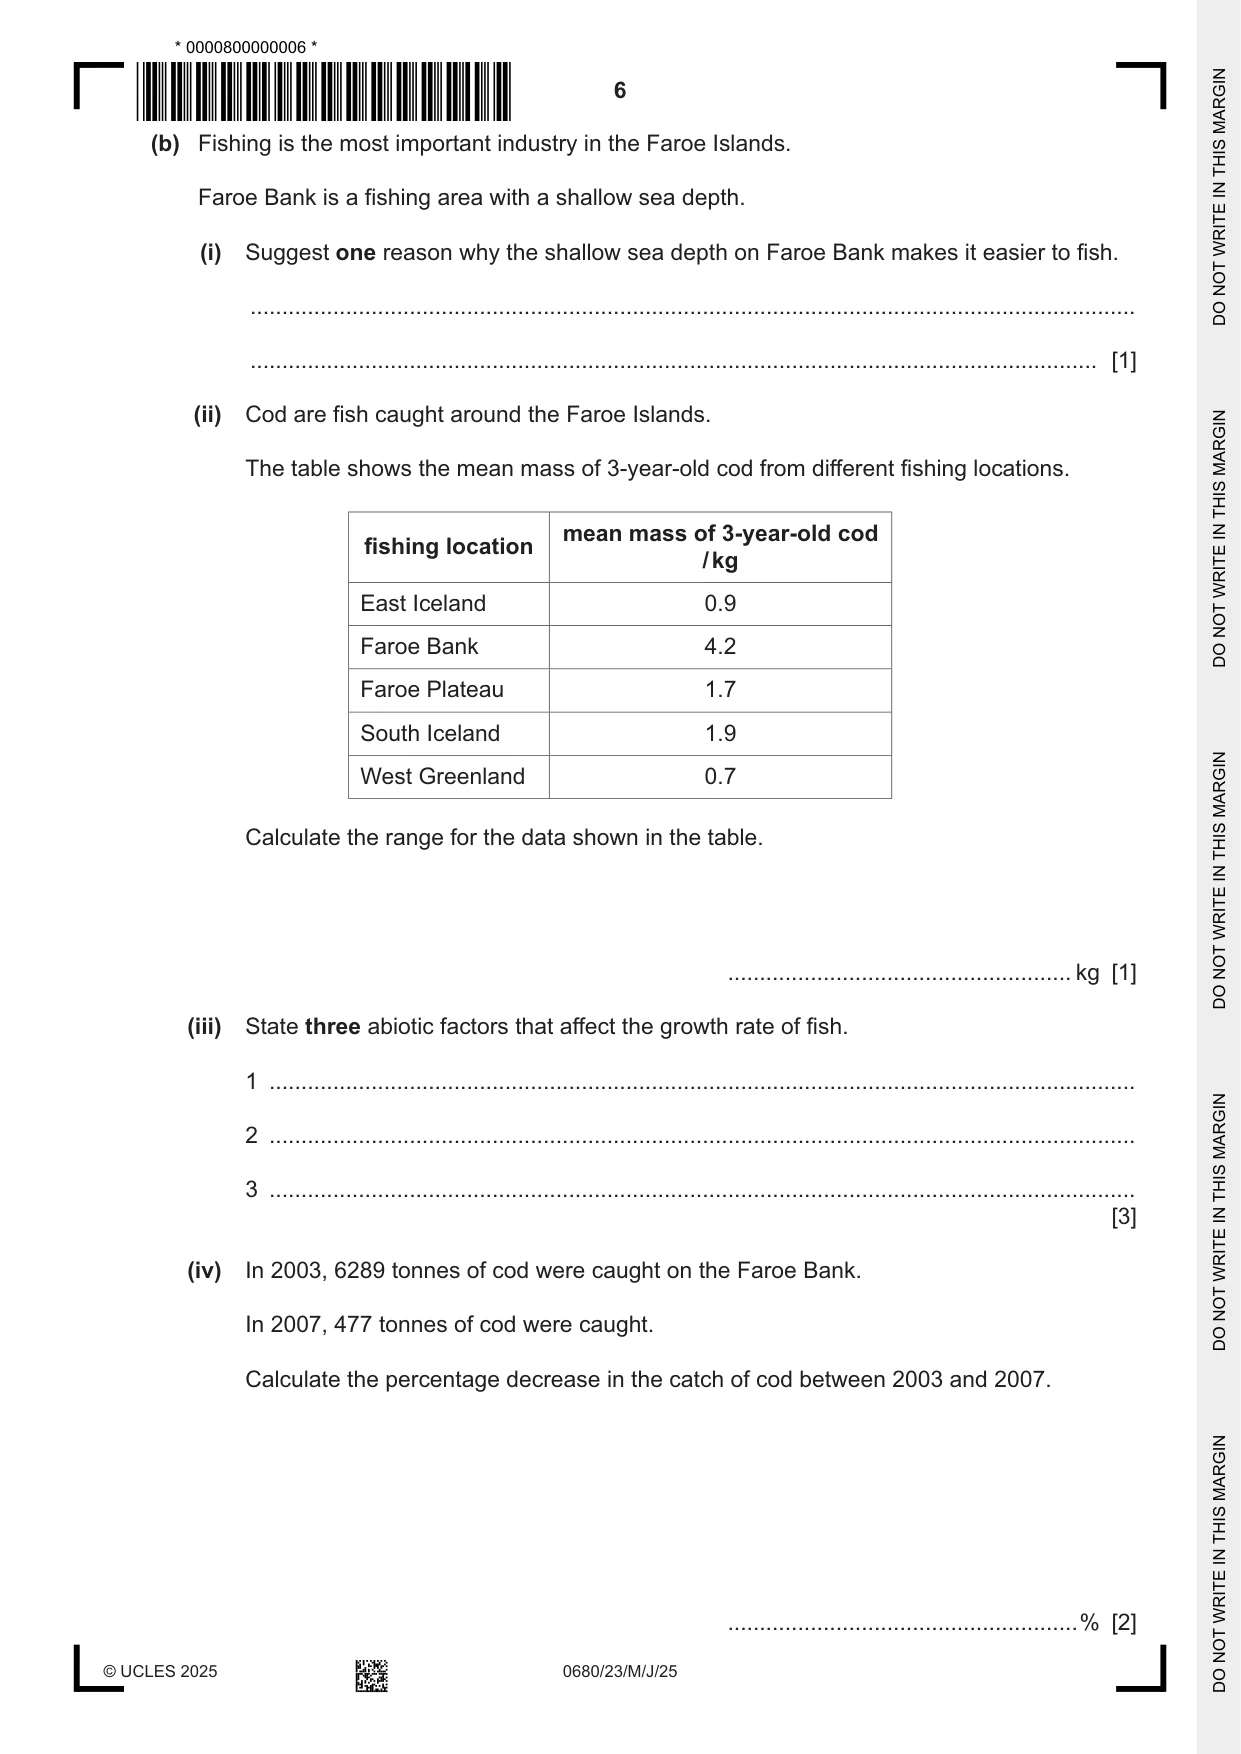
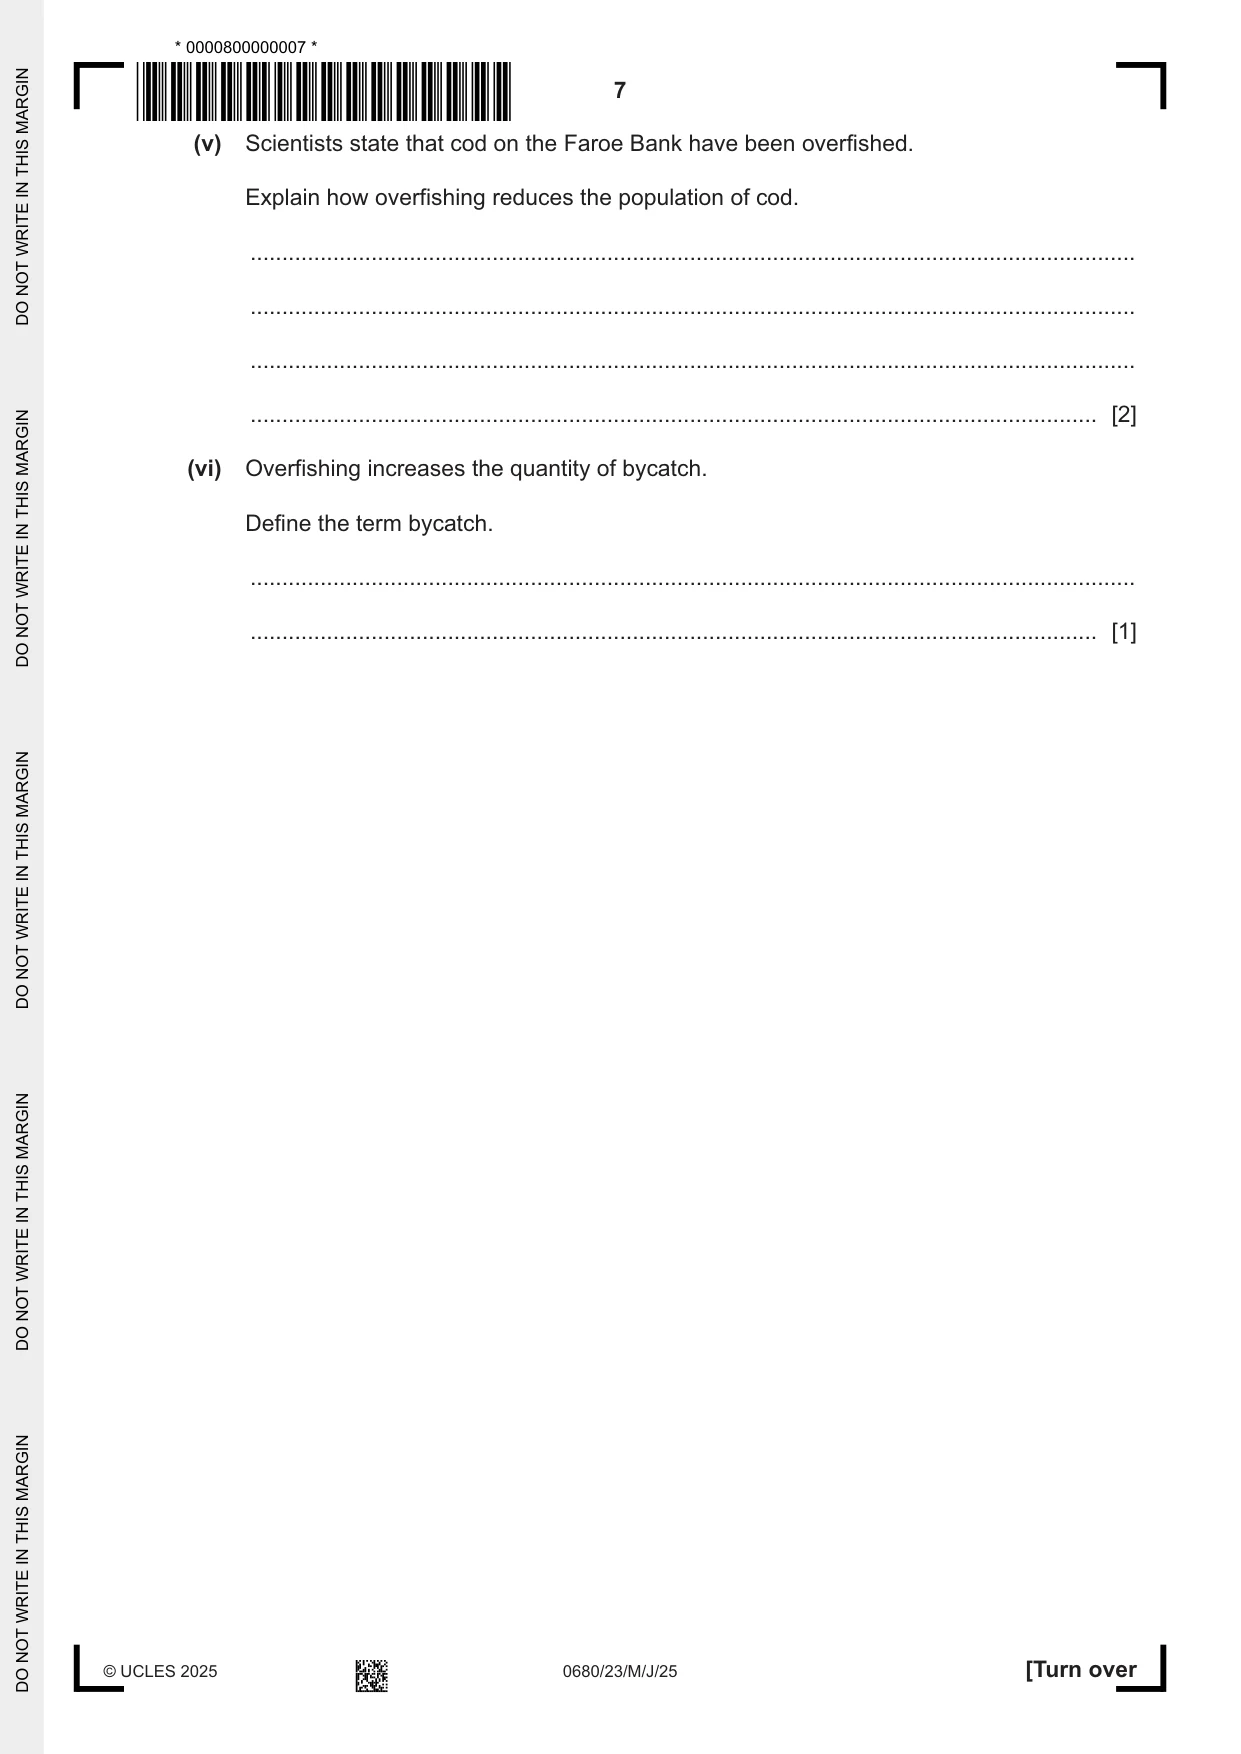
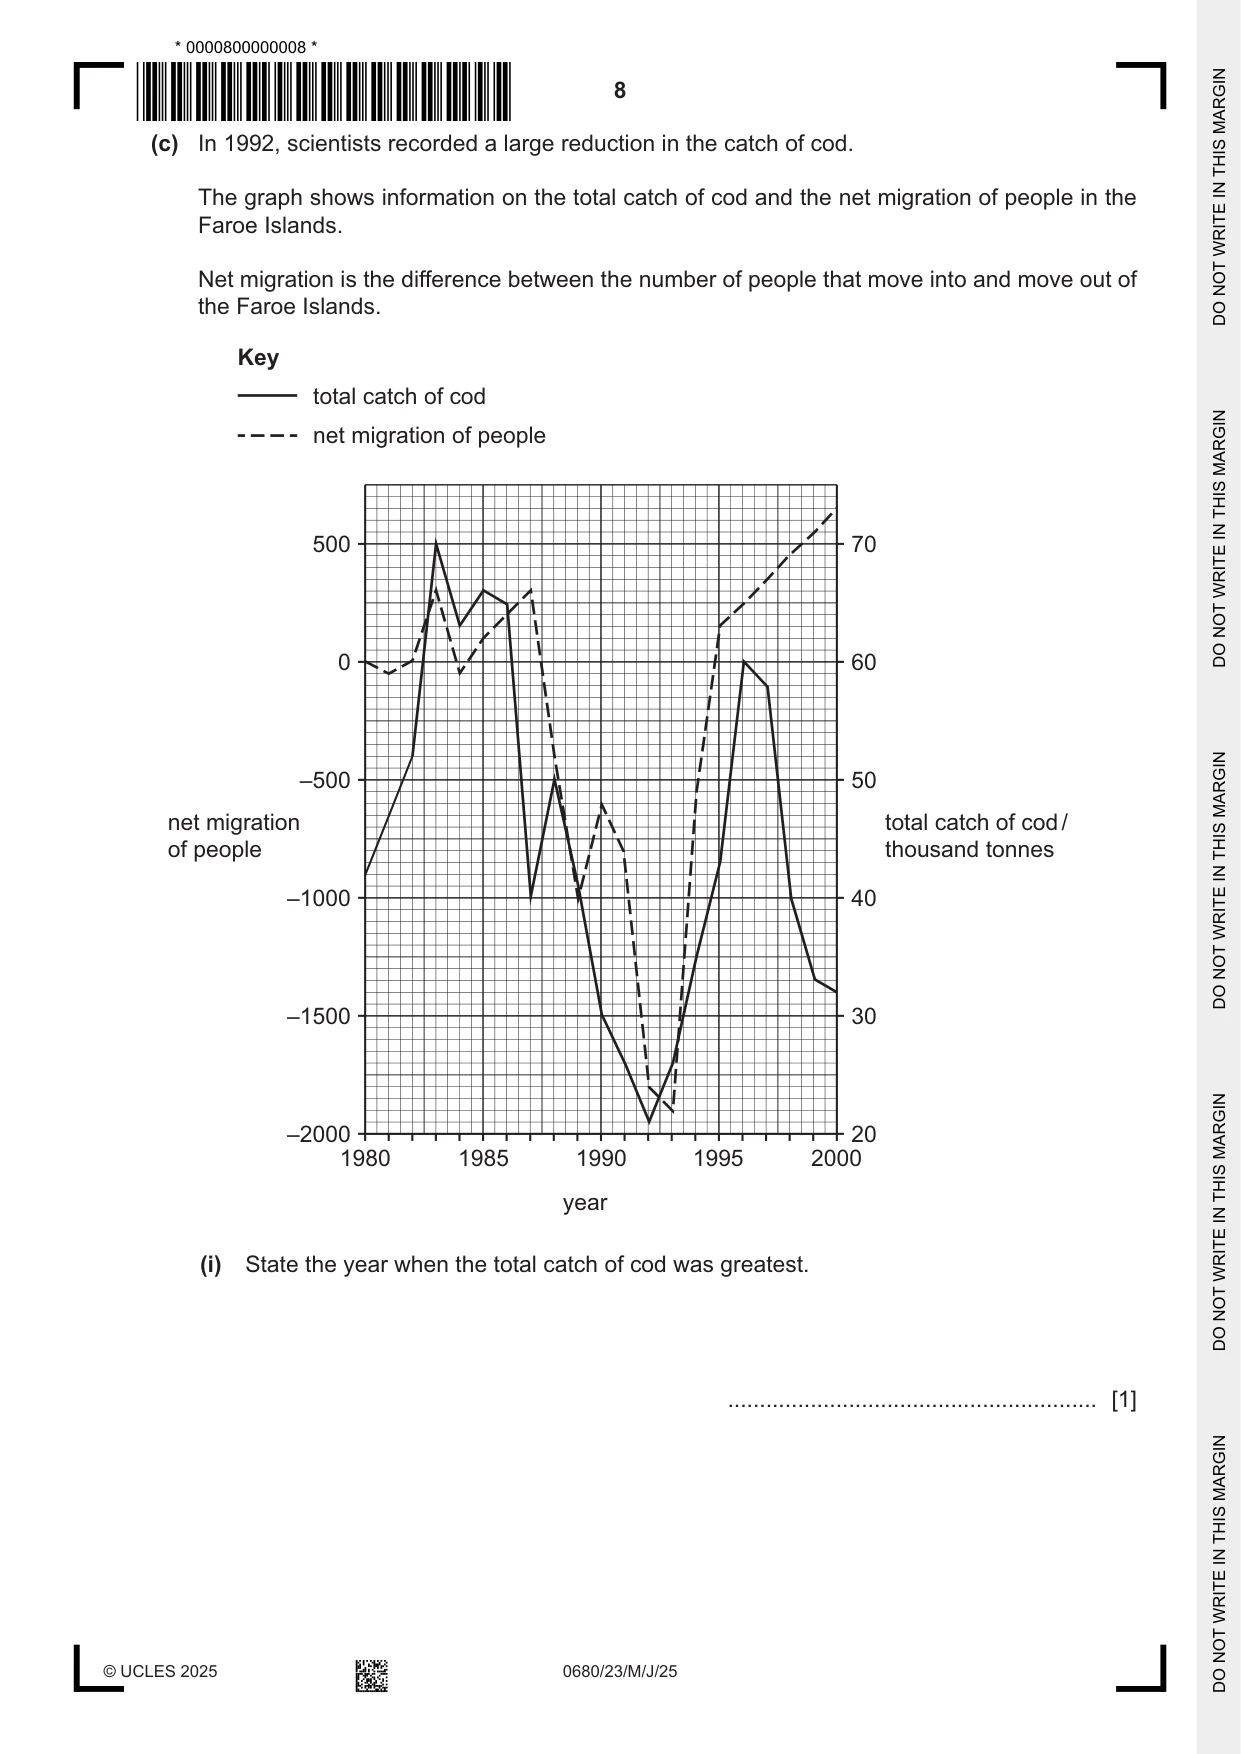
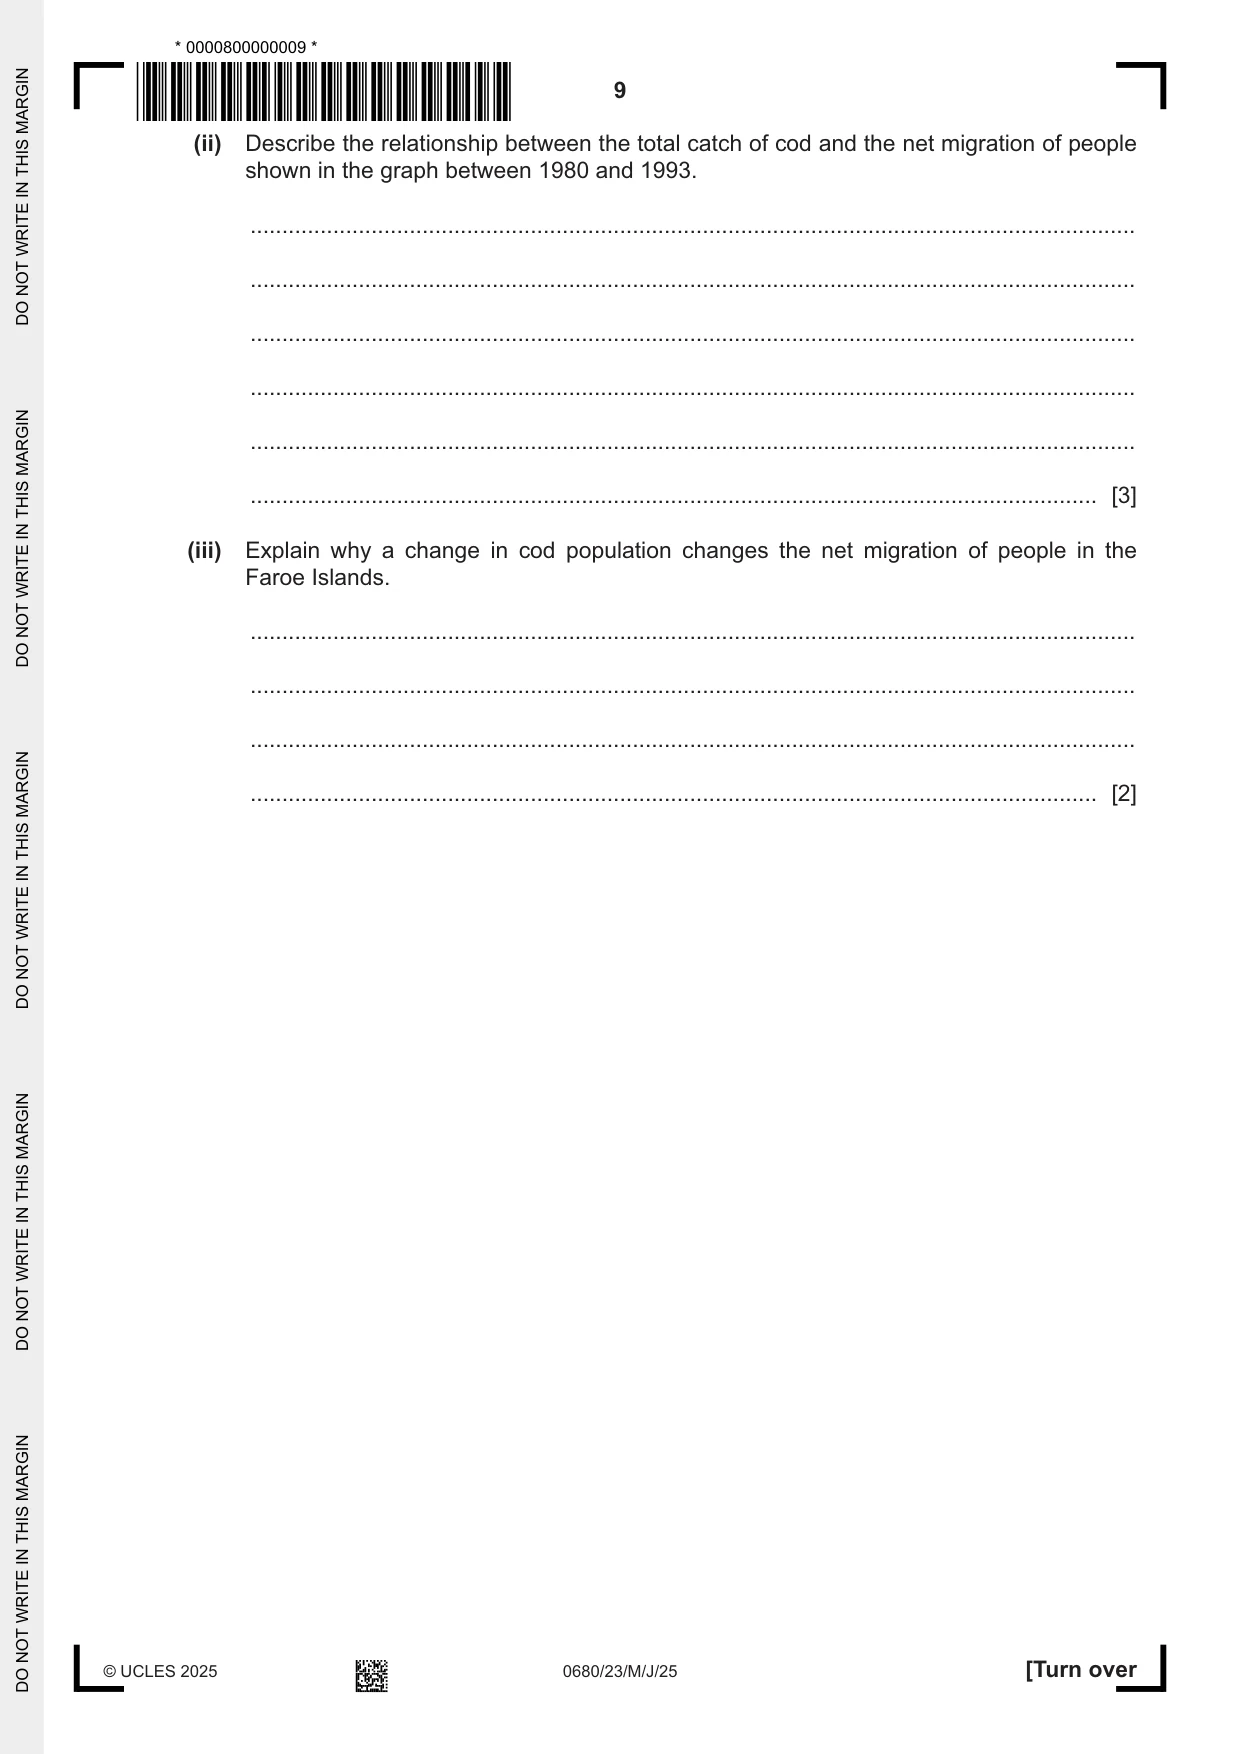
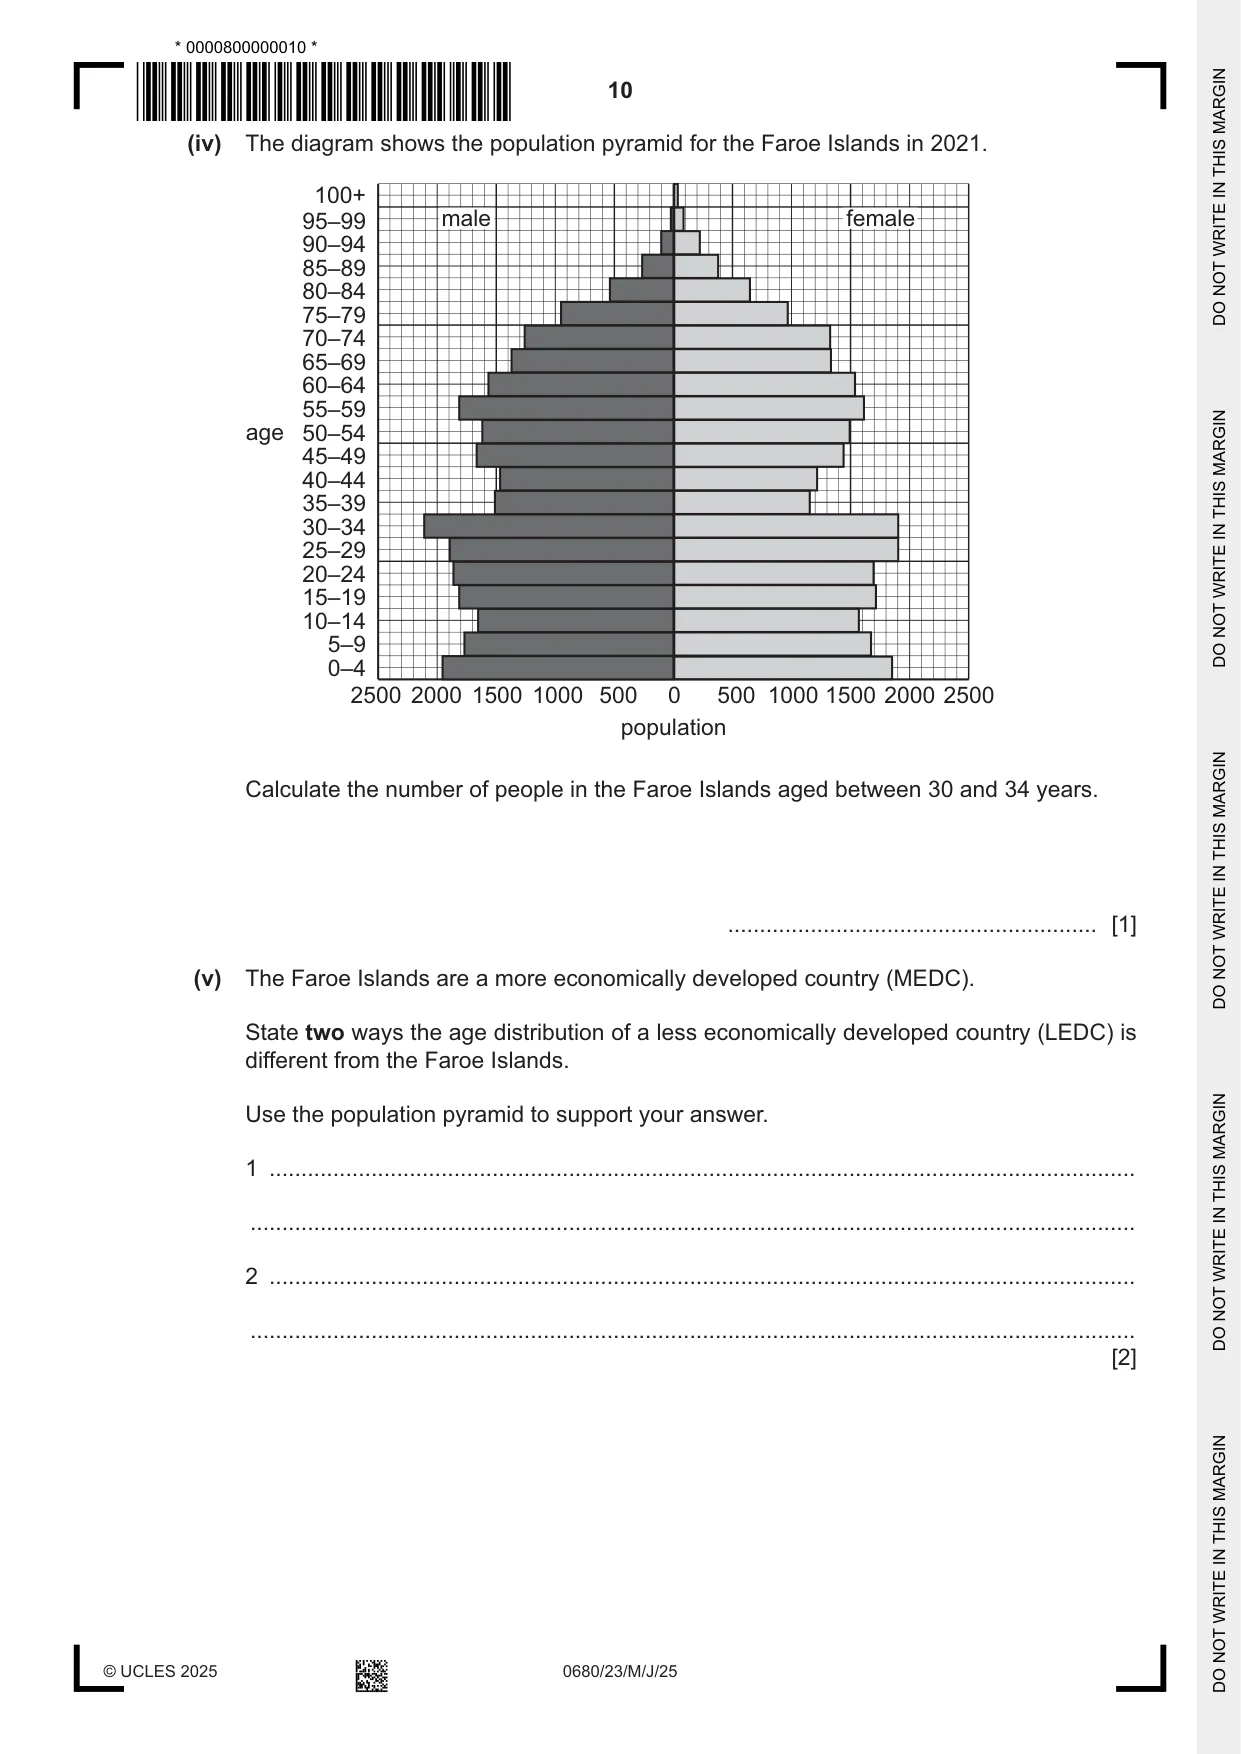
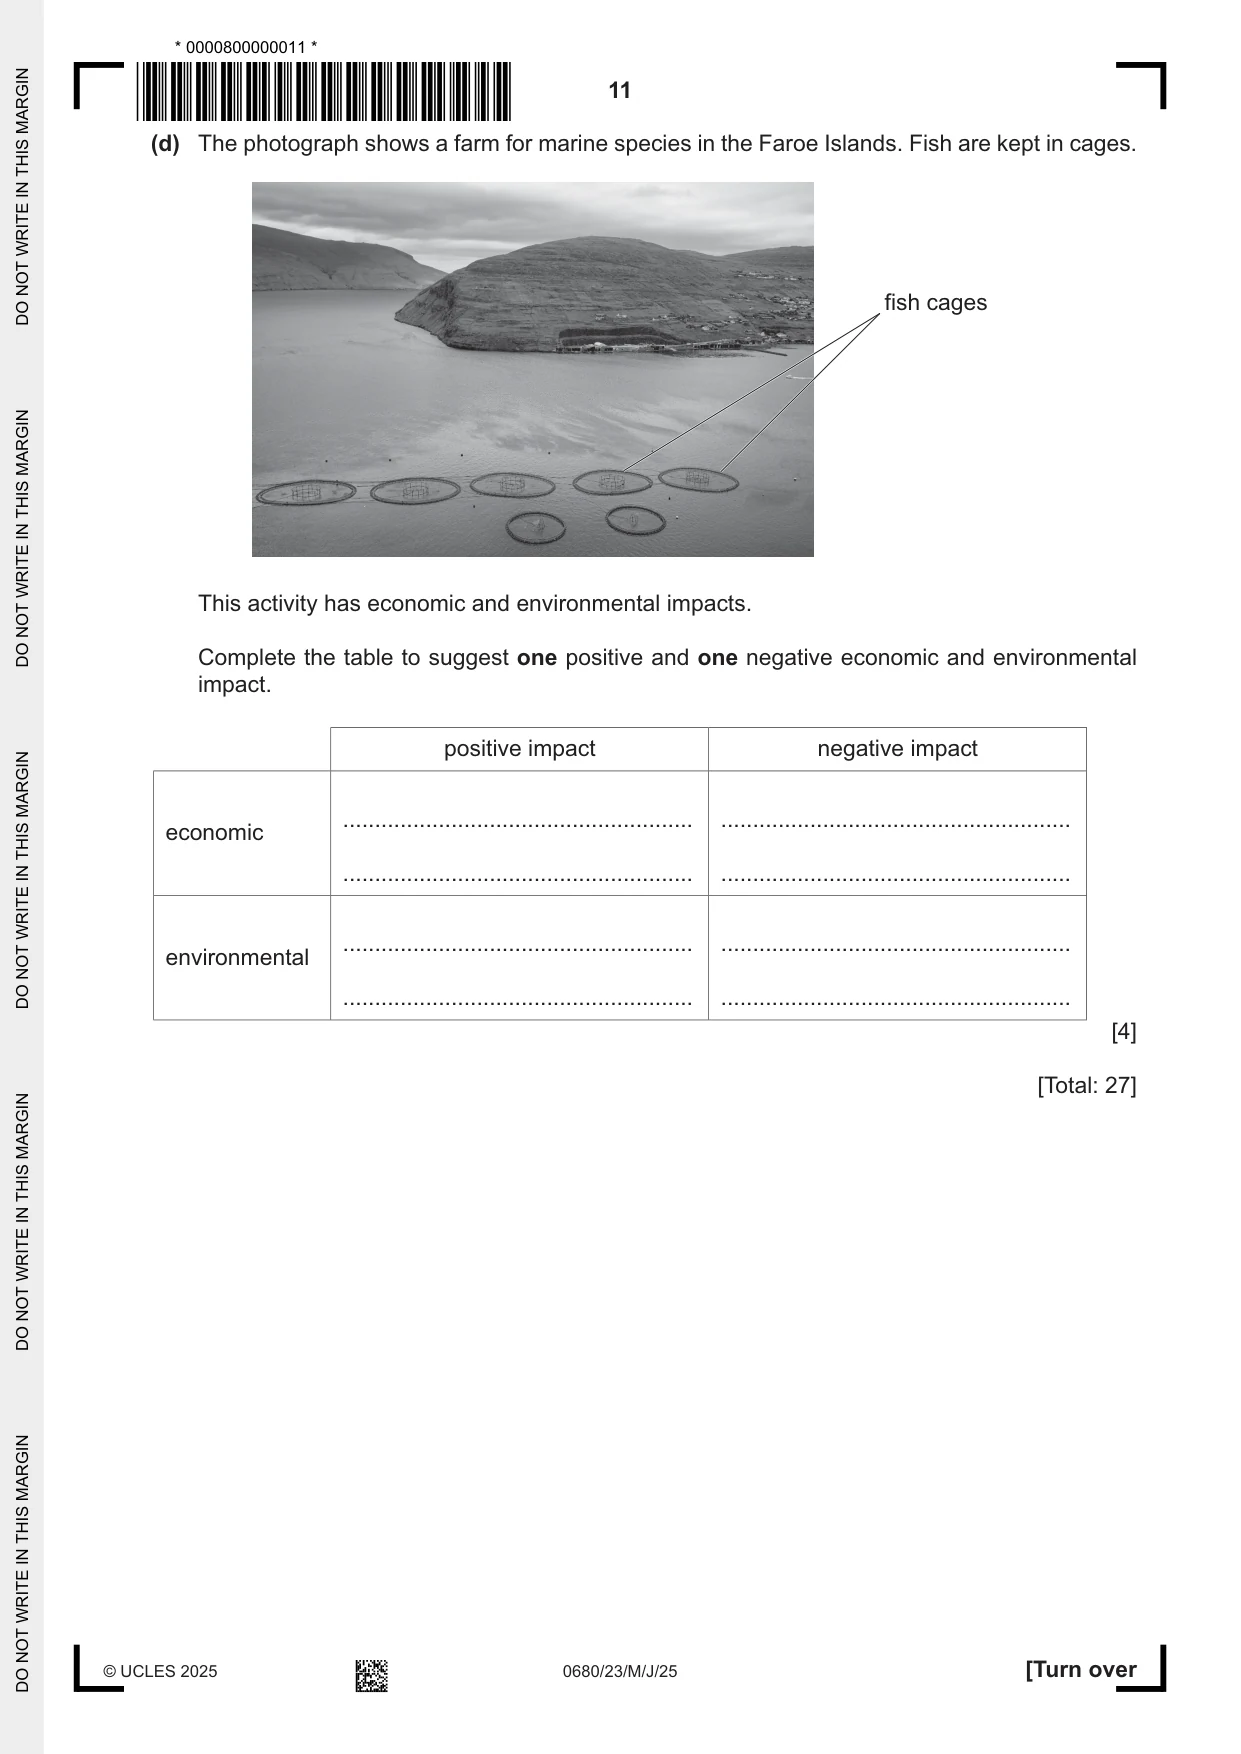
1 (a) (i) Determine the length of the Faroe Islands between the crosses labelled A and B. A N B 0 15 km ..................................................... km [1] (ii) Calculate the population density of the Faroe Islands. ...................................... people / km2 [1] (iii) Suggest two reasons why a large proportion of the population lives in the capital. 1 ........................................................................................................................................ ........................................................................................................................................... 2 ........................................................................................................................................ ........................................................................................................................................... [2] (b) Fishing is the most important industry in the Faroe Islands. Faroe Bank is a fishing area with a shallow sea depth. (i) Suggest one reason why the shallow sea depth on Faroe Bank makes it easier to fish. ........................................................................................................................................... ..................................................................................................................................... [1] (ii) Cod are fish caught around the Faroe Islands. The table shows the mean mass of 3‑year‑old cod from different fishing locations. mean mass of 3‑year‑old cod fishing location / kg East Iceland 0.9 Faroe Bank 4.2 Faroe Plateau 1.7 South Iceland 1.9 West Greenland 0.7 Calculate the range for the data shown in the table. ...................................................... kg [1] (iii) State three abiotic factors that affect the growth rate of fish. 1 ........................................................................................................................................ 2 ........................................................................................................................................ 3 ........................................................................................................................................ [3] (iv) In 2003, 6289 tonnes of cod were caught on the Faroe Bank. In 2007, 477 tonnes of cod were caught. Calculate the percentage decrease in the catch of cod between 2003 and 2007. .......................................................% [2] (v) Scientists state that cod on the Faroe Bank have been overfished. Explain how overfishing reduces the population of cod. ........................................................................................................................................... ........................................................................................................................................... ........................................................................................................................................... ..................................................................................................................................... [2] (vi) Overfishing increases the quantity of bycatch. Define the term bycatch. ........................................................................................................................................... ..................................................................................................................................... [1] (c) In 1992, scientists recorded a large reduction in the catch of cod. The graph shows information on the total catch of cod and the net migration of people in the Faroe Islands. Net migration is the difference between the number of people that move into and move out of the Faroe Islands. Key total catch of cod net migration of people 500 70 0 60 –500 50 net migration total catch of cod / of people thousand tonnes –1000 40 –1500 30 –2000 20 1980 1985 1990 1995 2000 year (i) State the year when the total catch of cod was greatest. .......................................................... [1] (ii) Describe the relationship between the total catch of cod and the net migration of people shown in the graph between 1980 and 1993. ........................................................................................................................................... ........................................................................................................................................... ........................................................................................................................................... ........................................................................................................................................... ........................................................................................................................................... ..................................................................................................................................... [3] (iii) Explain why a change in cod population changes the net migration of people in the Faroe Islands. ........................................................................................................................................... ........................................................................................................................................... ........................................................................................................................................... ..................................................................................................................................... [2] (iv) The diagram shows the population pyramid for the Faroe Islands in 2021. 100+ 95–99 male female 90–94 85–89 80–84 75–79 70–74 65–69 60–64 55–59 age 50–54 45–49 40–44 35–39 30–34 25–29 20–24 15–19 10–14 5–9 0–4 2500 2000 1500 1000 500 0 500 1000 1500 2000 2500 population Calculate the number of people in the Faroe Islands aged between 30 and 34 years. .......................................................... [1] (v) The Faroe Islands are a more economically developed country (MEDC). State two ways the age distribution of a less economically developed country (LEDC) is different from the Faroe Islands. Use the population pyramid to support your answer. 1 ........................................................................................................................................ ........................................................................................................................................... 2 ........................................................................................................................................ ........................................................................................................................................... [2] (d) The photograph shows a farm for marine species in the Faroe Islands. Fish are kept in cages. fish cages This activity has economic and environmental impacts. Complete the table to suggest one positive and one negative economic and environmental impact. positive impact negative impact ....................................................... ....................................................... economic ....................................................... ....................................................... ....................................................... ....................................................... environmental ....................................................... ....................................................... [4] [Total: 27]
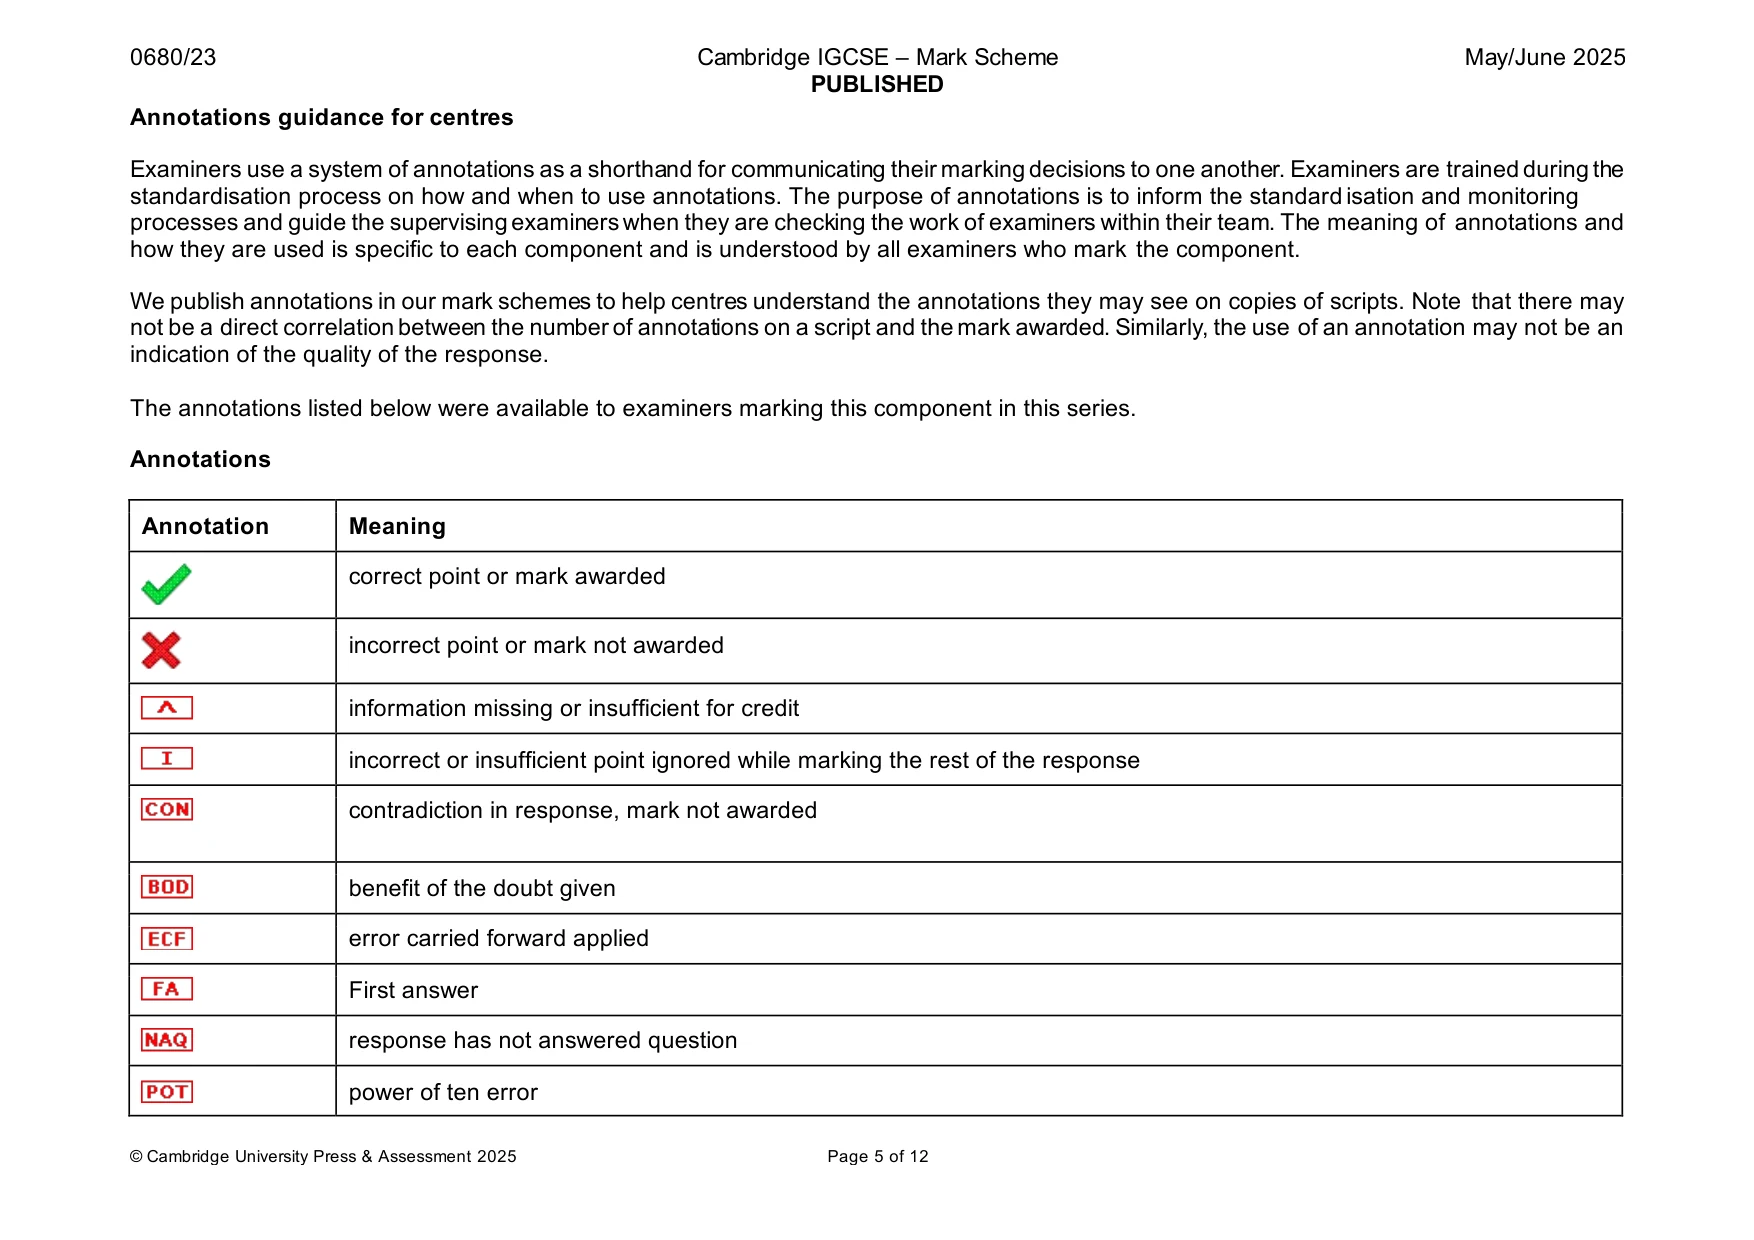
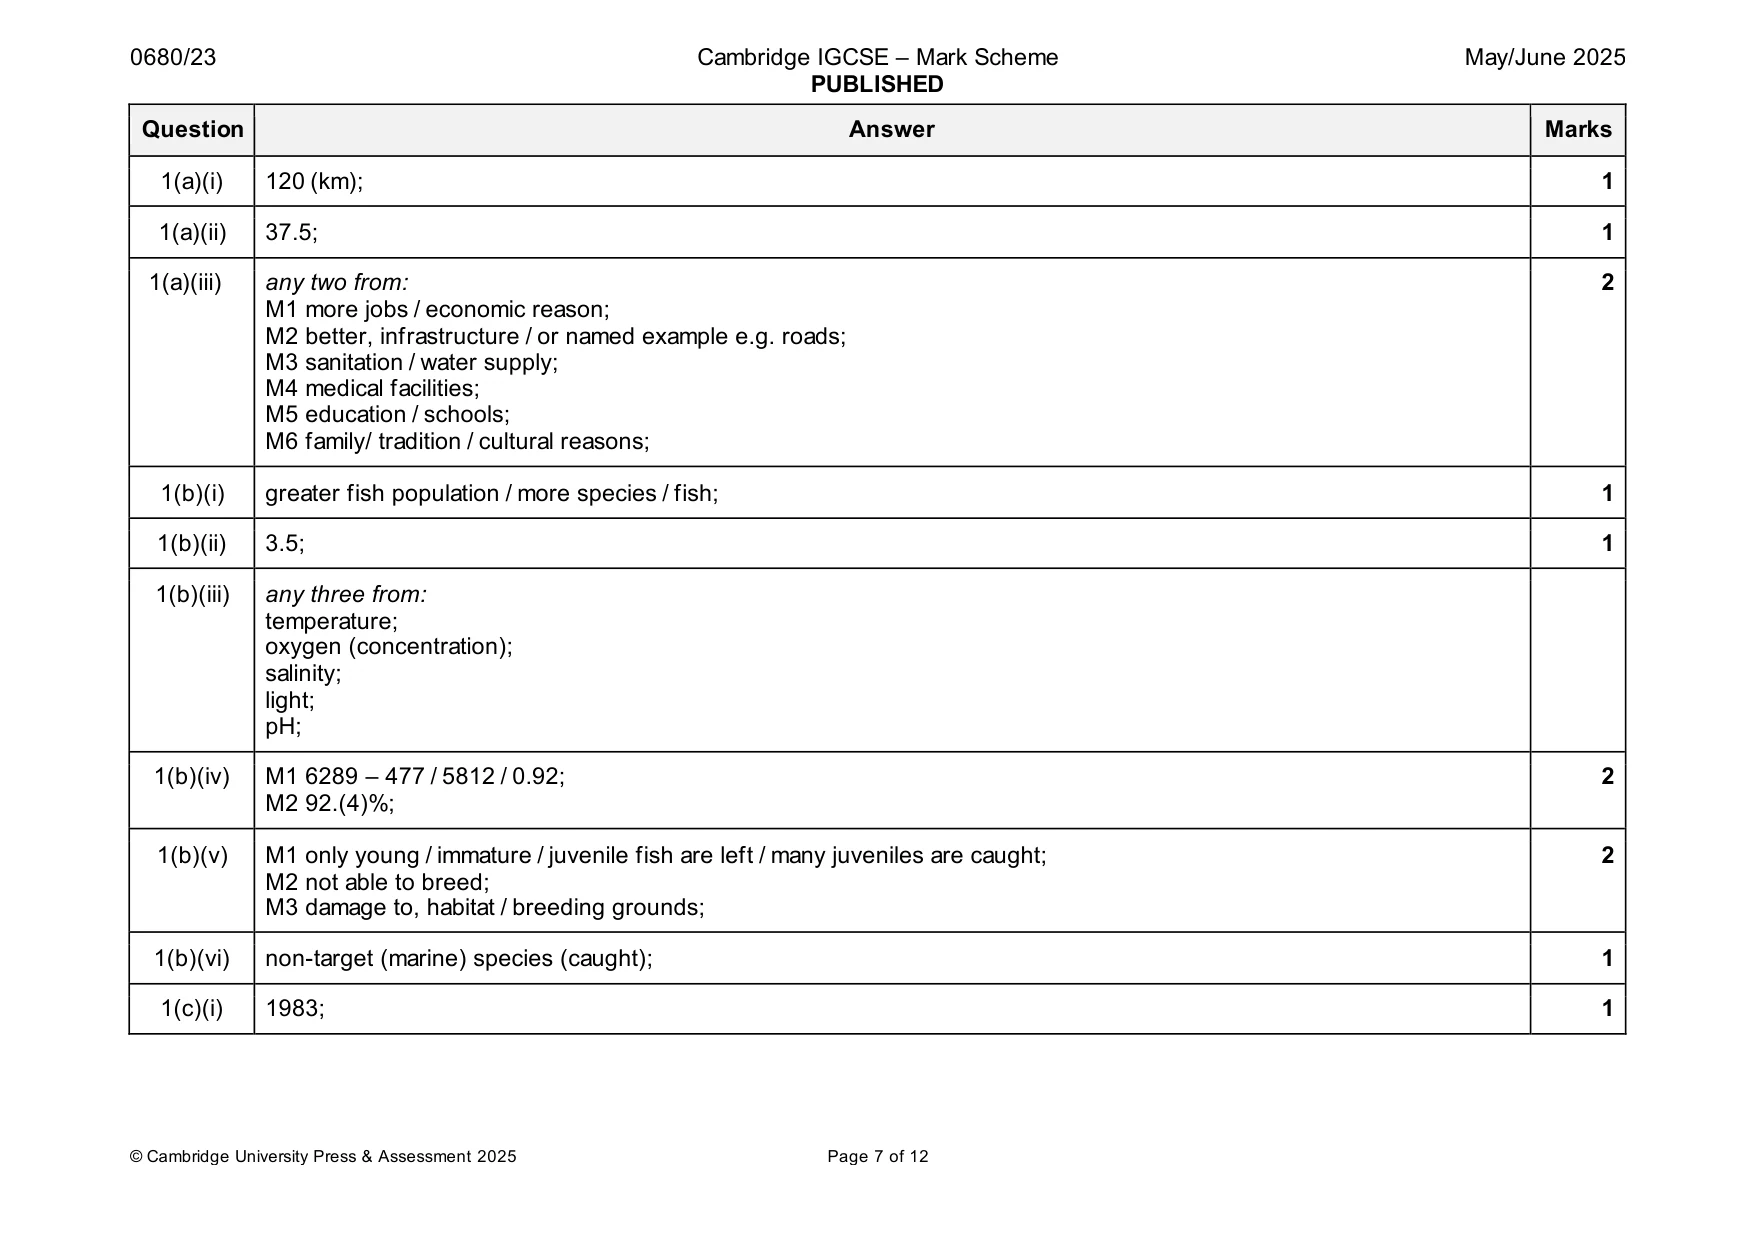
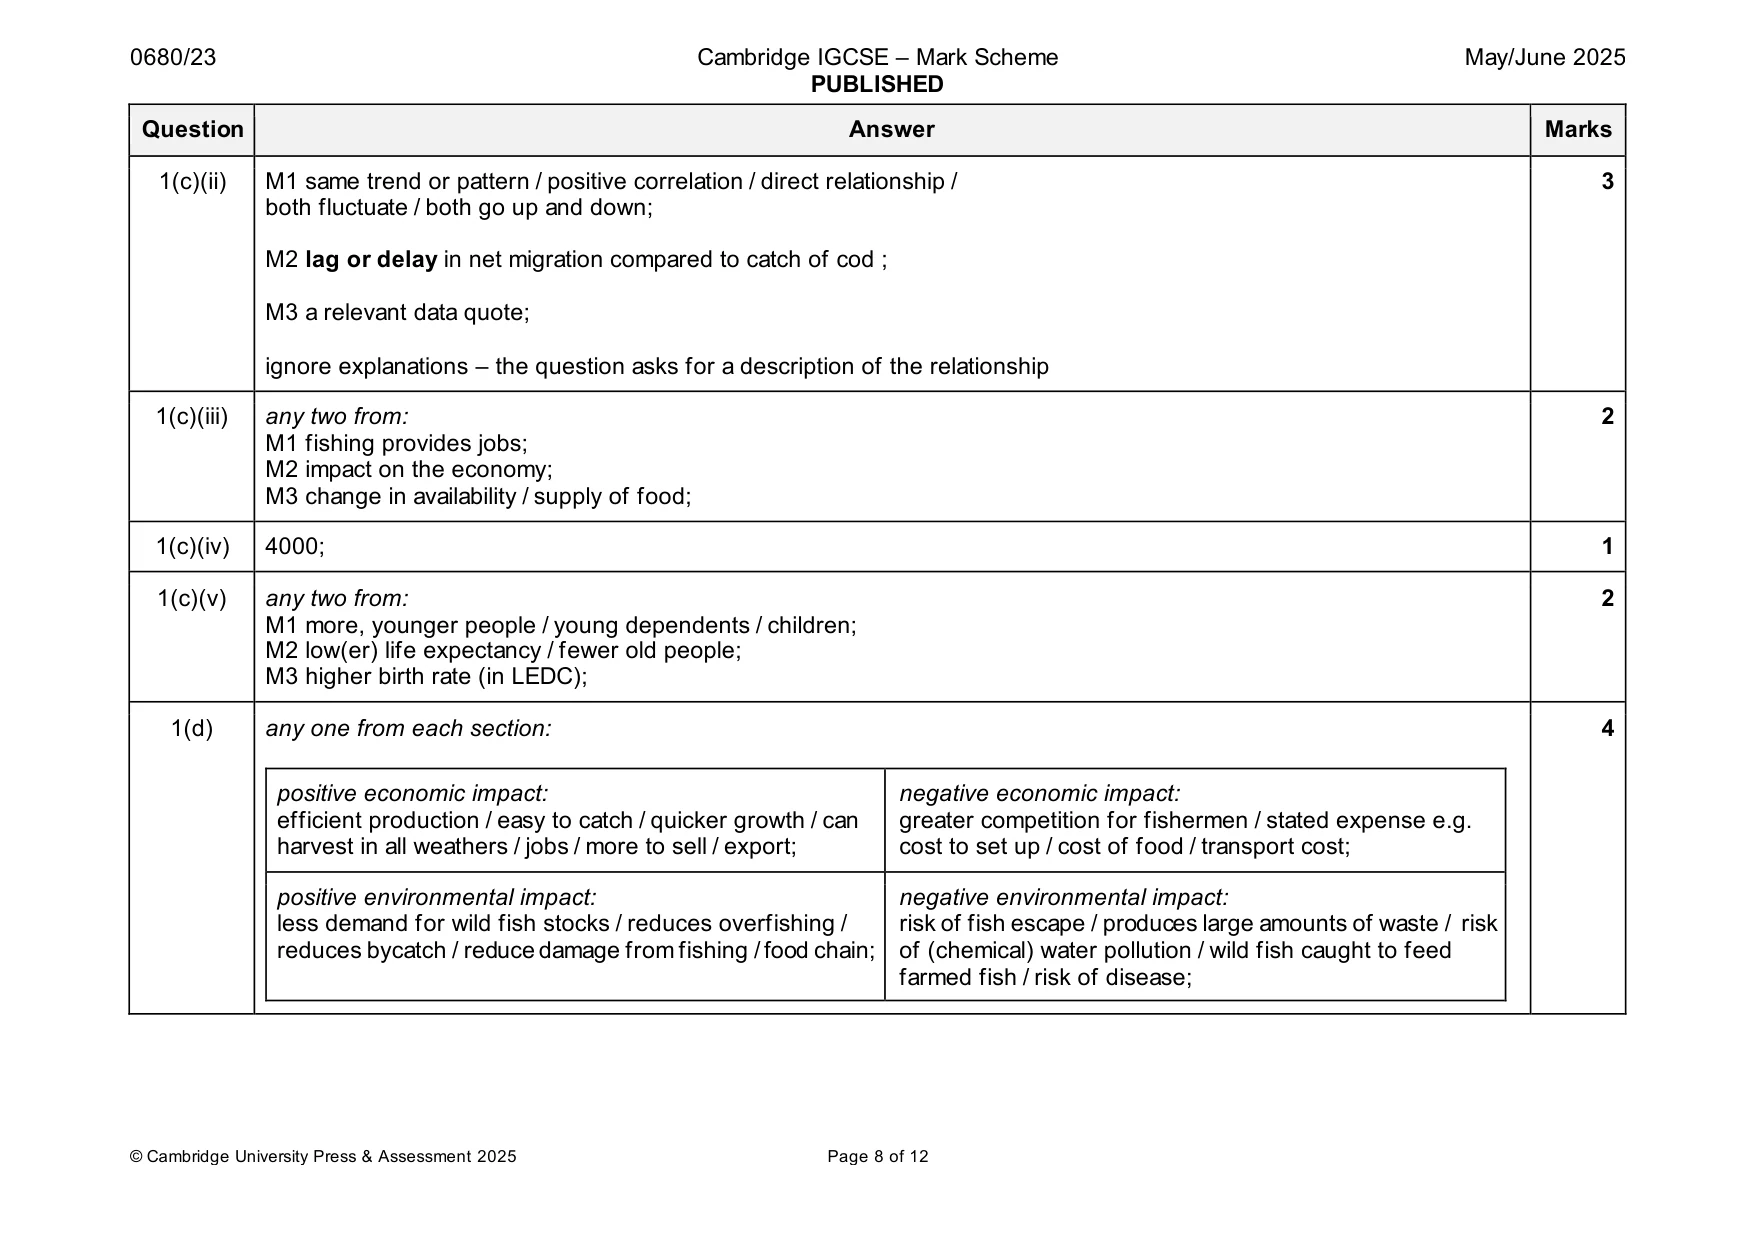
Mark scheme: Question Answer Marks 1(a)(i) 120 (km); 1 1(a)(ii) 37.5; 1 1(a)(iii) any two from: 2 M1 more jobs / economic reason; M2 better, infrastructure / or named example e.g. roads; M3 sanitation / water supply; M4 medical facilities; M5 education / schools; M6 family/ tradition / cultural reasons; 1(b)(i) greater fish population / more species / fish; 1 1(b)(ii) 3.5; 1 1(b)(iii) any three from: temperature; oxygen (concentration); salinity; light; pH; 1(b)(iv) M1 6289 – 477 / 5812 / 0.92; 2 M2 92.(4)%; 1(b)(v) M1 only young / immature / juvenile fish are left / many juveniles are caught; 2 M2 not able to breed; M3 damage to, habitat / breeding grounds; 1(b)(vi) non-target (marine) species (caught); 1 1(c)(i) 1983; 1 1(c)(ii) M1 same trend or pattern / positive correlation / direct relationship / 3 both fluctuate / both go up and down; M2 lag or delay in net migration compared to catch of cod ; M3 a relevant data quote; ignore explanations – the question asks for a description of the relationship 1(c)(iii) any two from: 2 M1 fishing provides jobs; M2 impact on the economy; M3 change in availability / supply of food; 1(c)(iv) 4000; 1 1(c)(v) any two from: 2 M1 more, younger people / young dependents / children; M2 low(er) life expectancy / fewer old people; M3 higher birth rate (in LEDC); 1(d) any one from each section: 4 positive economic impact: negative economic impact: efficient production / easy to catch / quicker growth / can greater competition for fishermen / stated expense e.g. harvest in all weathers / jobs / more to sell / export; cost to set up / cost of food / transport cost; positive environmental impact: negative environmental impact: less demand for wild fish stocks / reduces overfishing / risk of fish escape / produces large amounts of waste / risk reduces bycatch / reduce damage from fishing / food chain; of (chemical) water pollution / wild fish caught to feed farmed fish / risk of disease;
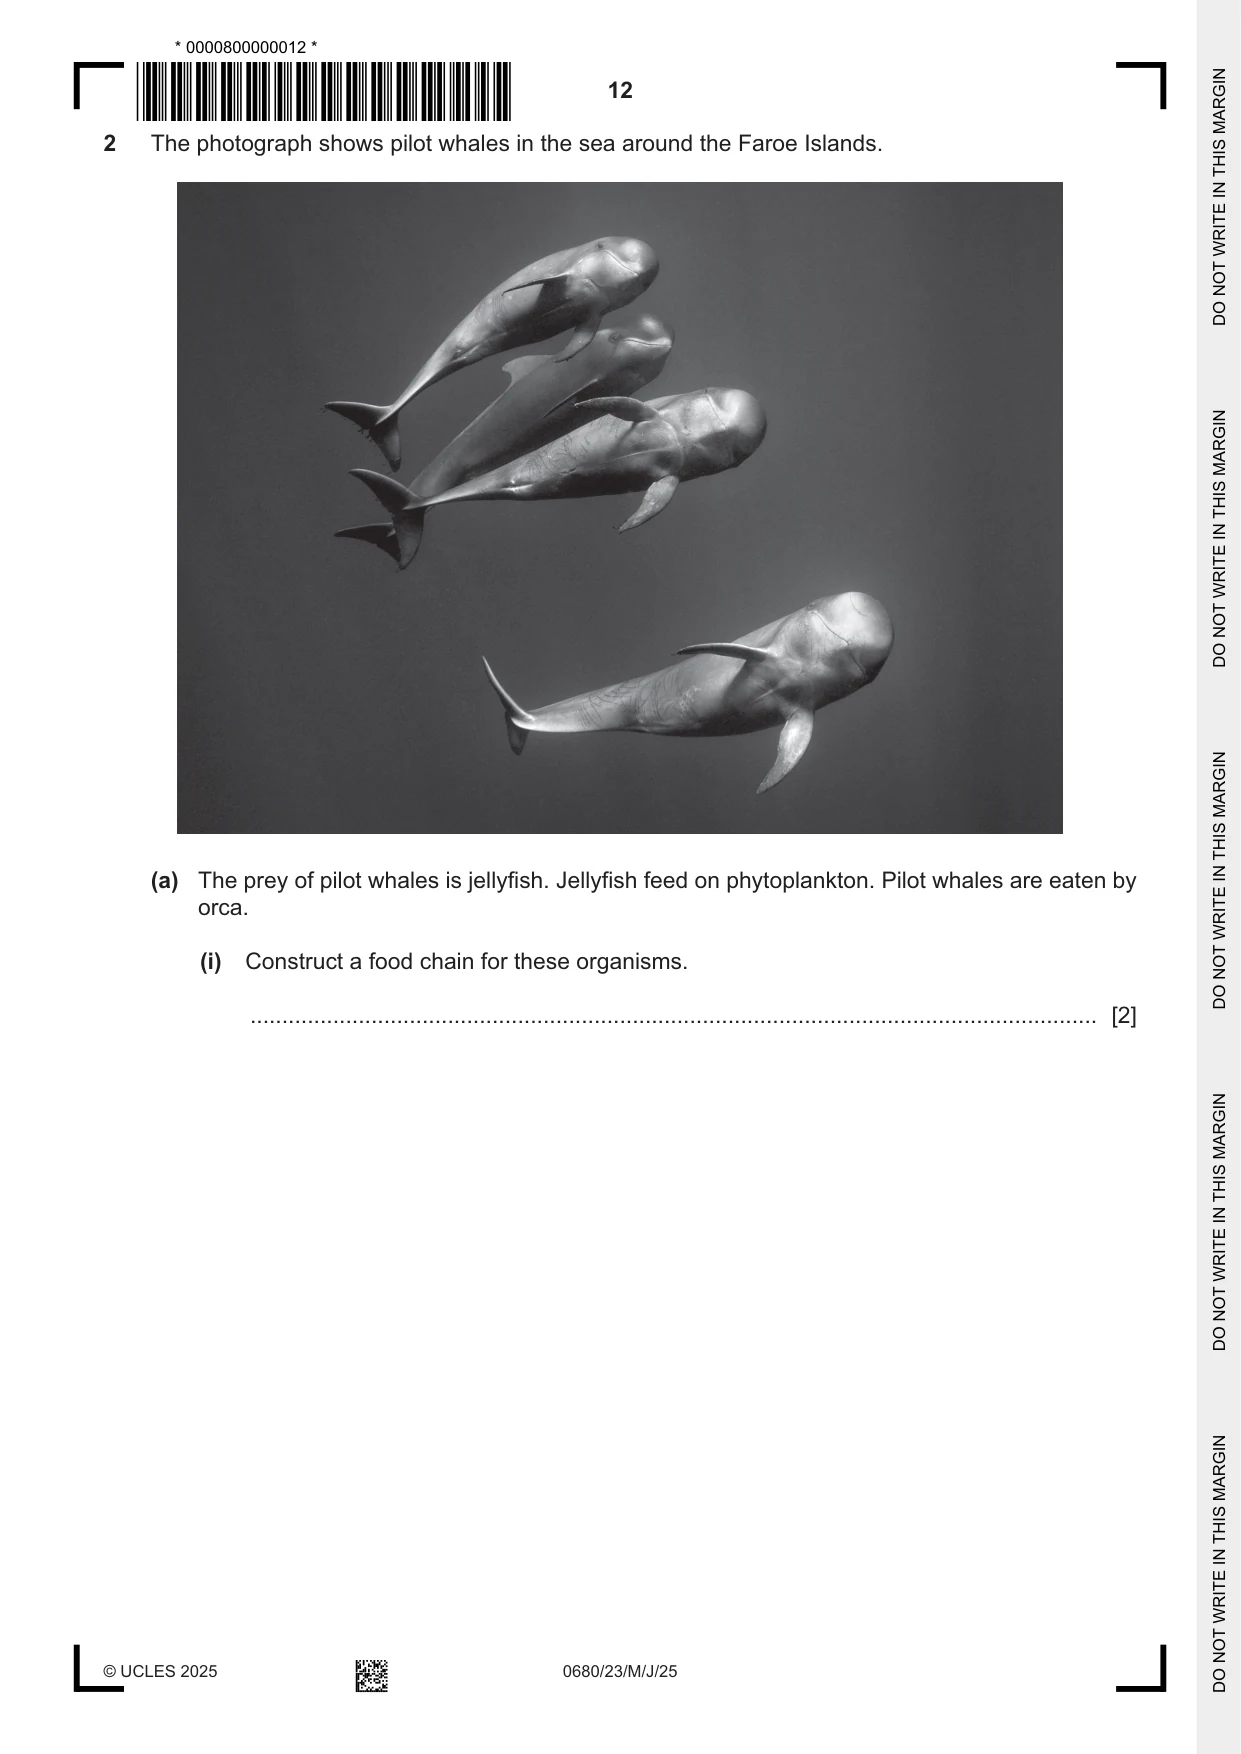
Q2 · The photograph shows pilot whales in the sea around the Faroe Islands
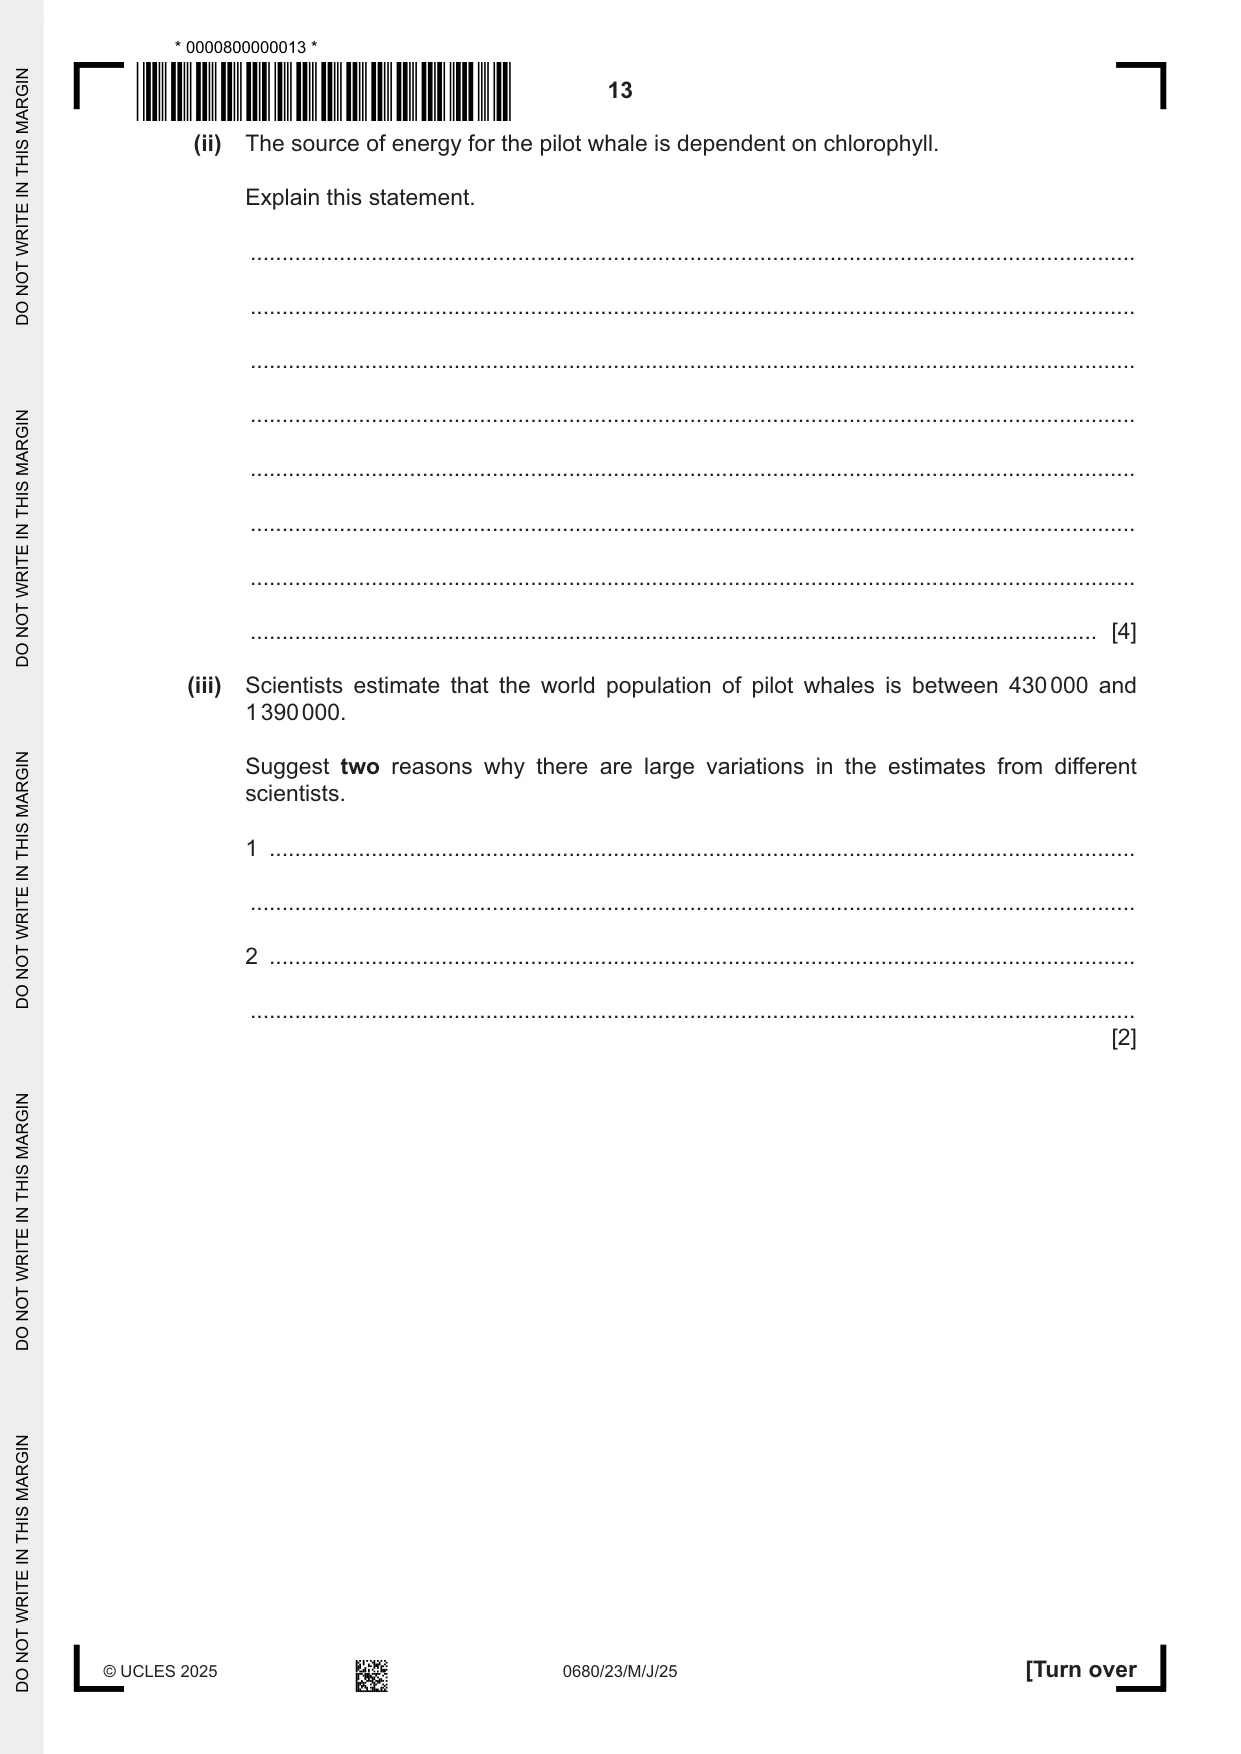
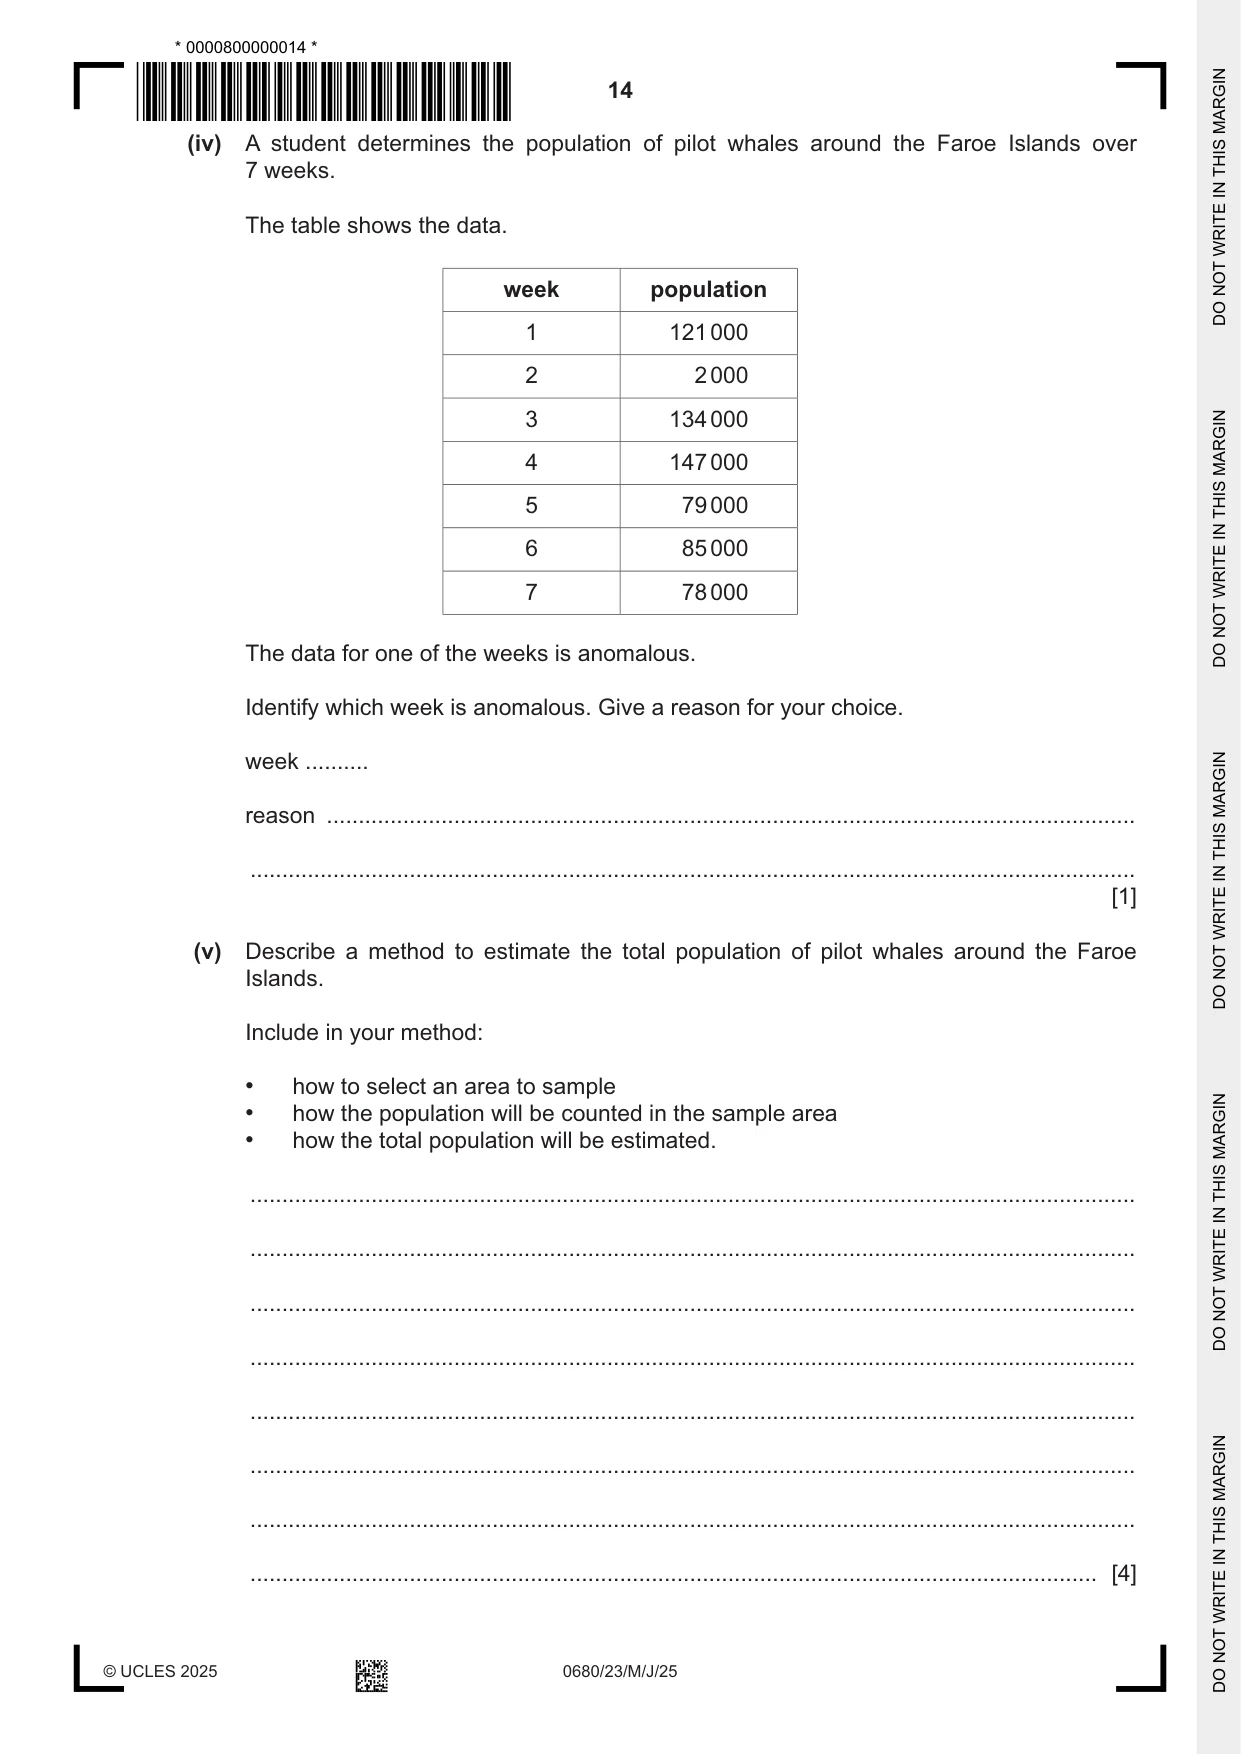
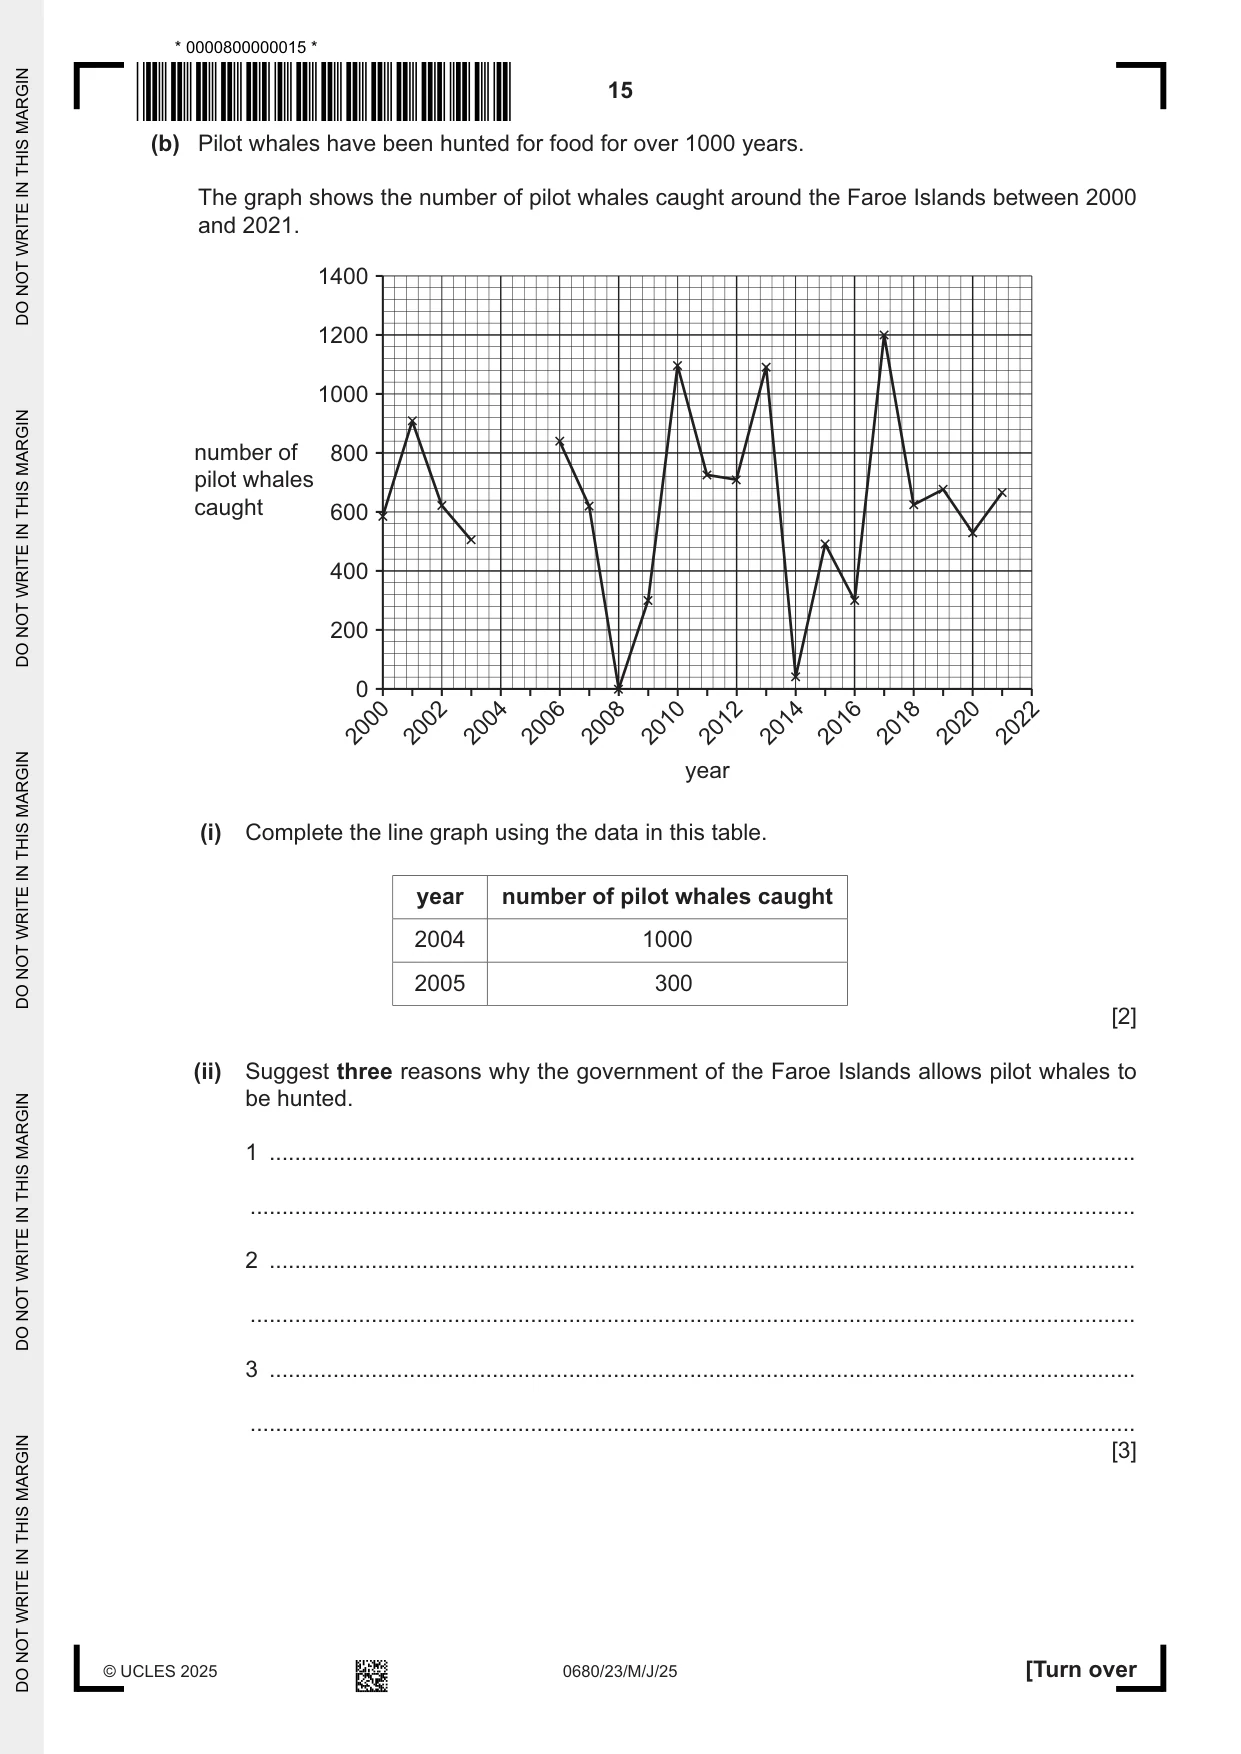
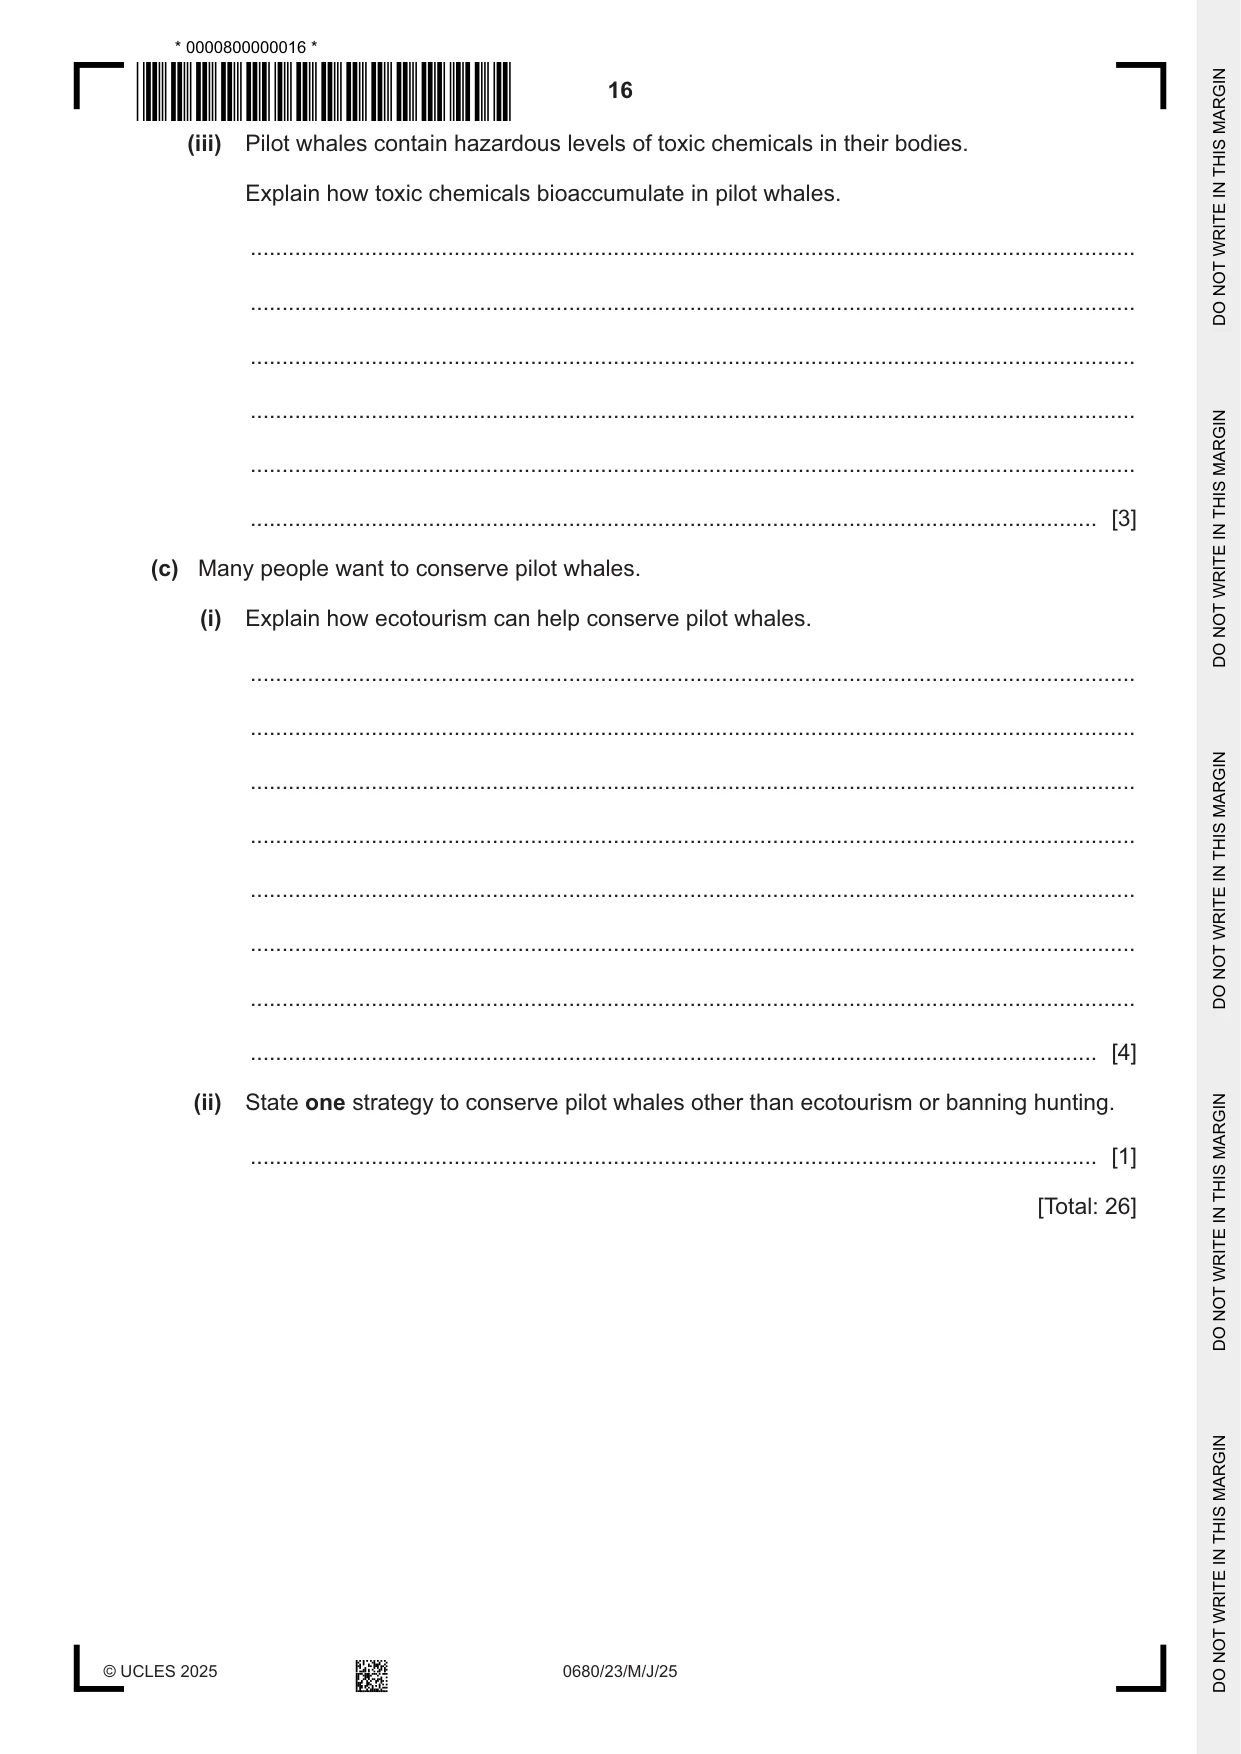
2 The photograph shows pilot whales in the sea around the Faroe Islands. (a) The prey of pilot whales is jellyfish. Jellyfish feed on phytoplankton. Pilot whales are eaten by orca. (i) Construct a food chain for these organisms. ..................................................................................................................................... [2] (ii) The source of energy for the pilot whale is dependent on chlorophyll. Explain this statement. ........................................................................................................................................... ........................................................................................................................................... ........................................................................................................................................... ........................................................................................................................................... ........................................................................................................................................... ........................................................................................................................................... ........................................................................................................................................... ..................................................................................................................................... [4] (iii) Scientists estimate that the world population of pilot whales is between 430 000 and 1 390 000. Suggest two reasons why there are large variations in the estimates from different scientists. 1 ........................................................................................................................................ ........................................................................................................................................... 2 ........................................................................................................................................ ........................................................................................................................................... [2] (iv) A student determines the population of pilot whales around the Faroe Islands over 7 weeks. The table shows the data. week population 1 121 000 2 2 000 3 134 000 4 147 000 5 79 000 6 85 000 7 78 000 The data for one of the weeks is anomalous. Identify which week is anomalous. Give a reason for your choice. week .......... reason ............................................................................................................................... ........................................................................................................................................... [1] (v) Describe a method to estimate the total population of pilot whales around the Faroe Islands. Include in your method: • how to select an area to sample • how the population will be counted in the sample area • how the total population will be estimated. ........................................................................................................................................... ........................................................................................................................................... ........................................................................................................................................... ........................................................................................................................................... ........................................................................................................................................... ........................................................................................................................................... ........................................................................................................................................... ..................................................................................................................................... [4] (b) Pilot whales have been hunted for food for over 1000 years. The graph shows the number of pilot whales caught around the Faroe Islands between 2000 and 2021. 1400 1200 1000 number of 800 pilot whales caught 600 400 200 0 2000 2002 2004 2006 2008 2010 2012 2014 2016 2018 2020 2022 year (i) Complete the line graph using the data in this table. year number of pilot whales caught 2004 1000 2005 300 [2] (ii) Suggest three reasons why the government of the Faroe Islands allows pilot whales to be hunted. 1 ........................................................................................................................................ ........................................................................................................................................... 2 ........................................................................................................................................ ........................................................................................................................................... 3 ........................................................................................................................................ ........................................................................................................................................... [3] (iii) Pilot whales contain hazardous levels of toxic chemicals in their bodies. Explain how toxic chemicals bioaccumulate in pilot whales. ........................................................................................................................................... ........................................................................................................................................... ........................................................................................................................................... ........................................................................................................................................... ........................................................................................................................................... ..................................................................................................................................... [3] (c) Many people want to conserve pilot whales. (i) Explain how ecotourism can help conserve pilot whales. ........................................................................................................................................... ........................................................................................................................................... ........................................................................................................................................... ........................................................................................................................................... ........................................................................................................................................... ........................................................................................................................................... ........................................................................................................................................... ..................................................................................................................................... [4] (ii) State one strategy to conserve pilot whales other than ecotourism or banning hunting. ..................................................................................................................................... [1] [Total: 26]
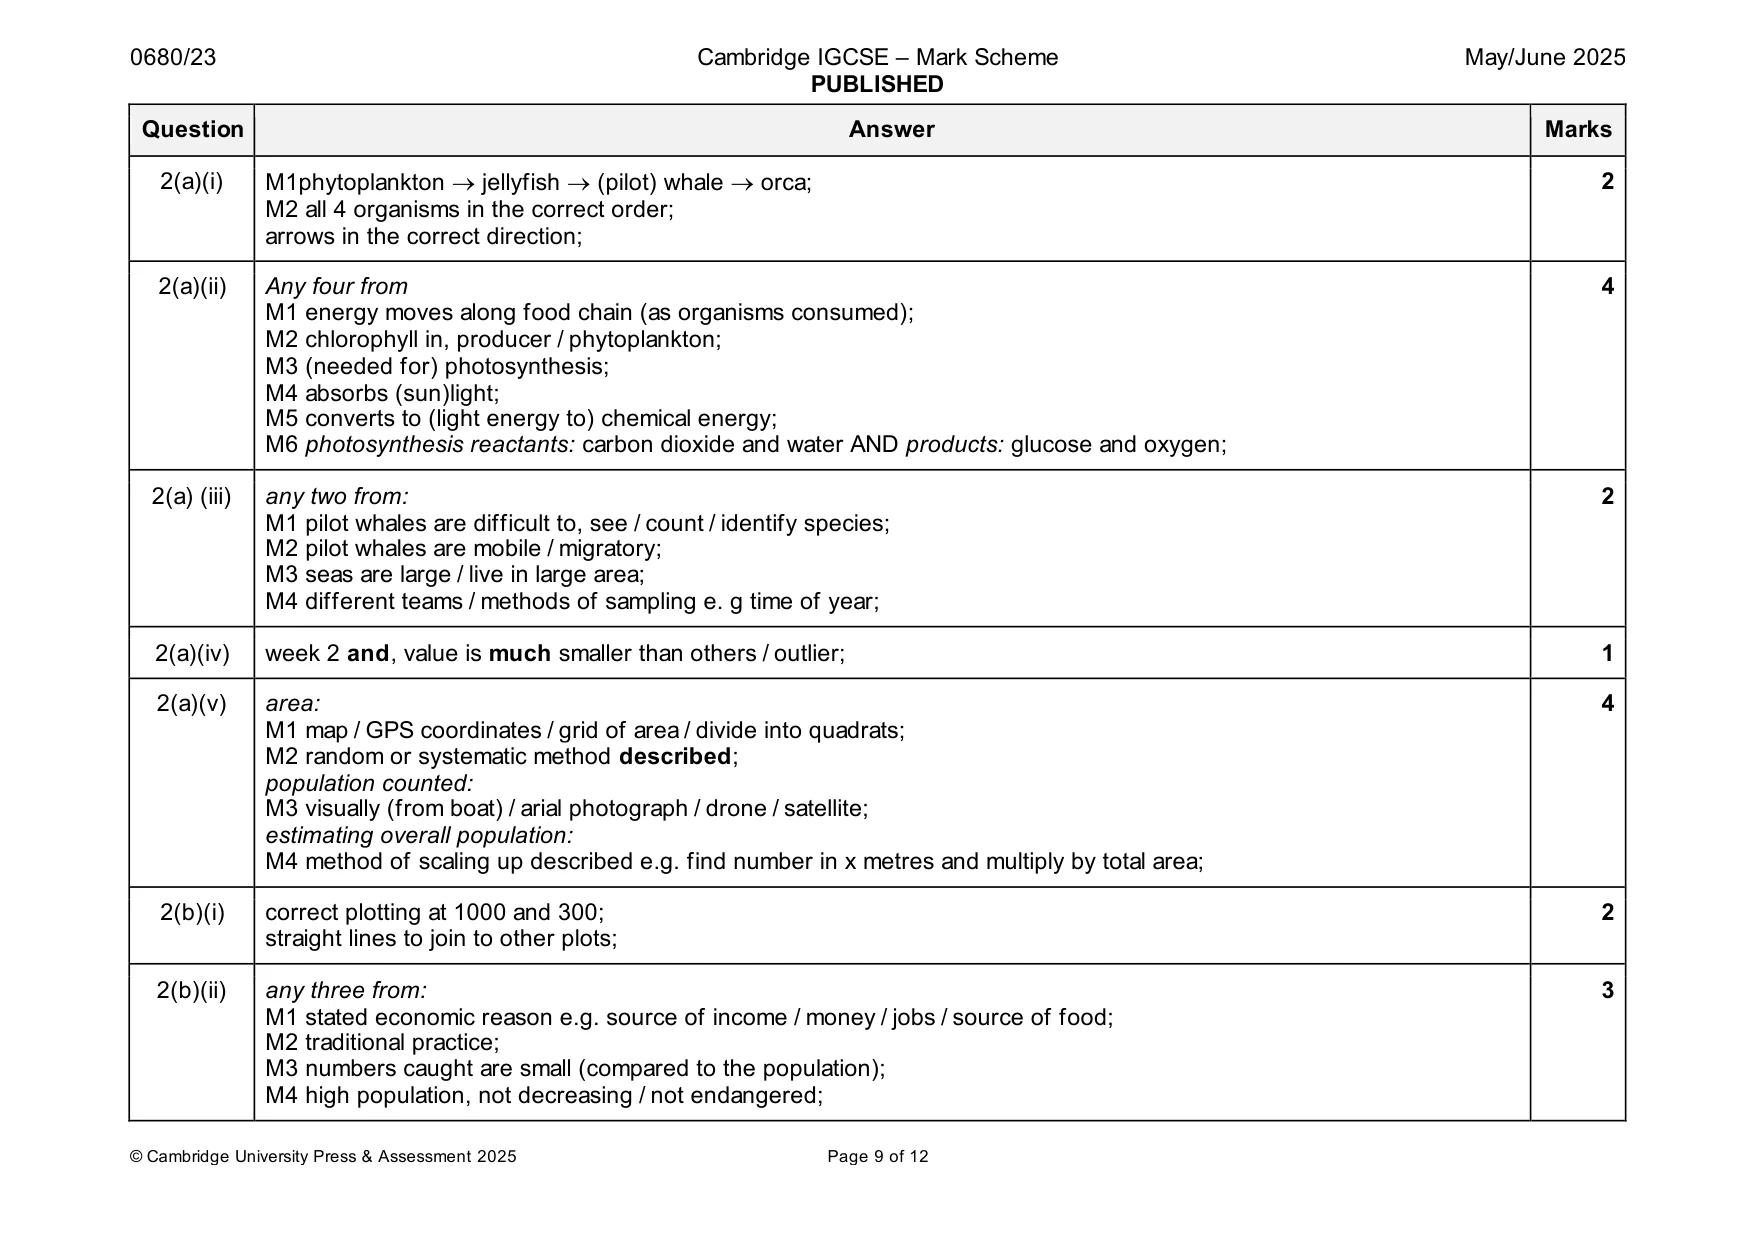
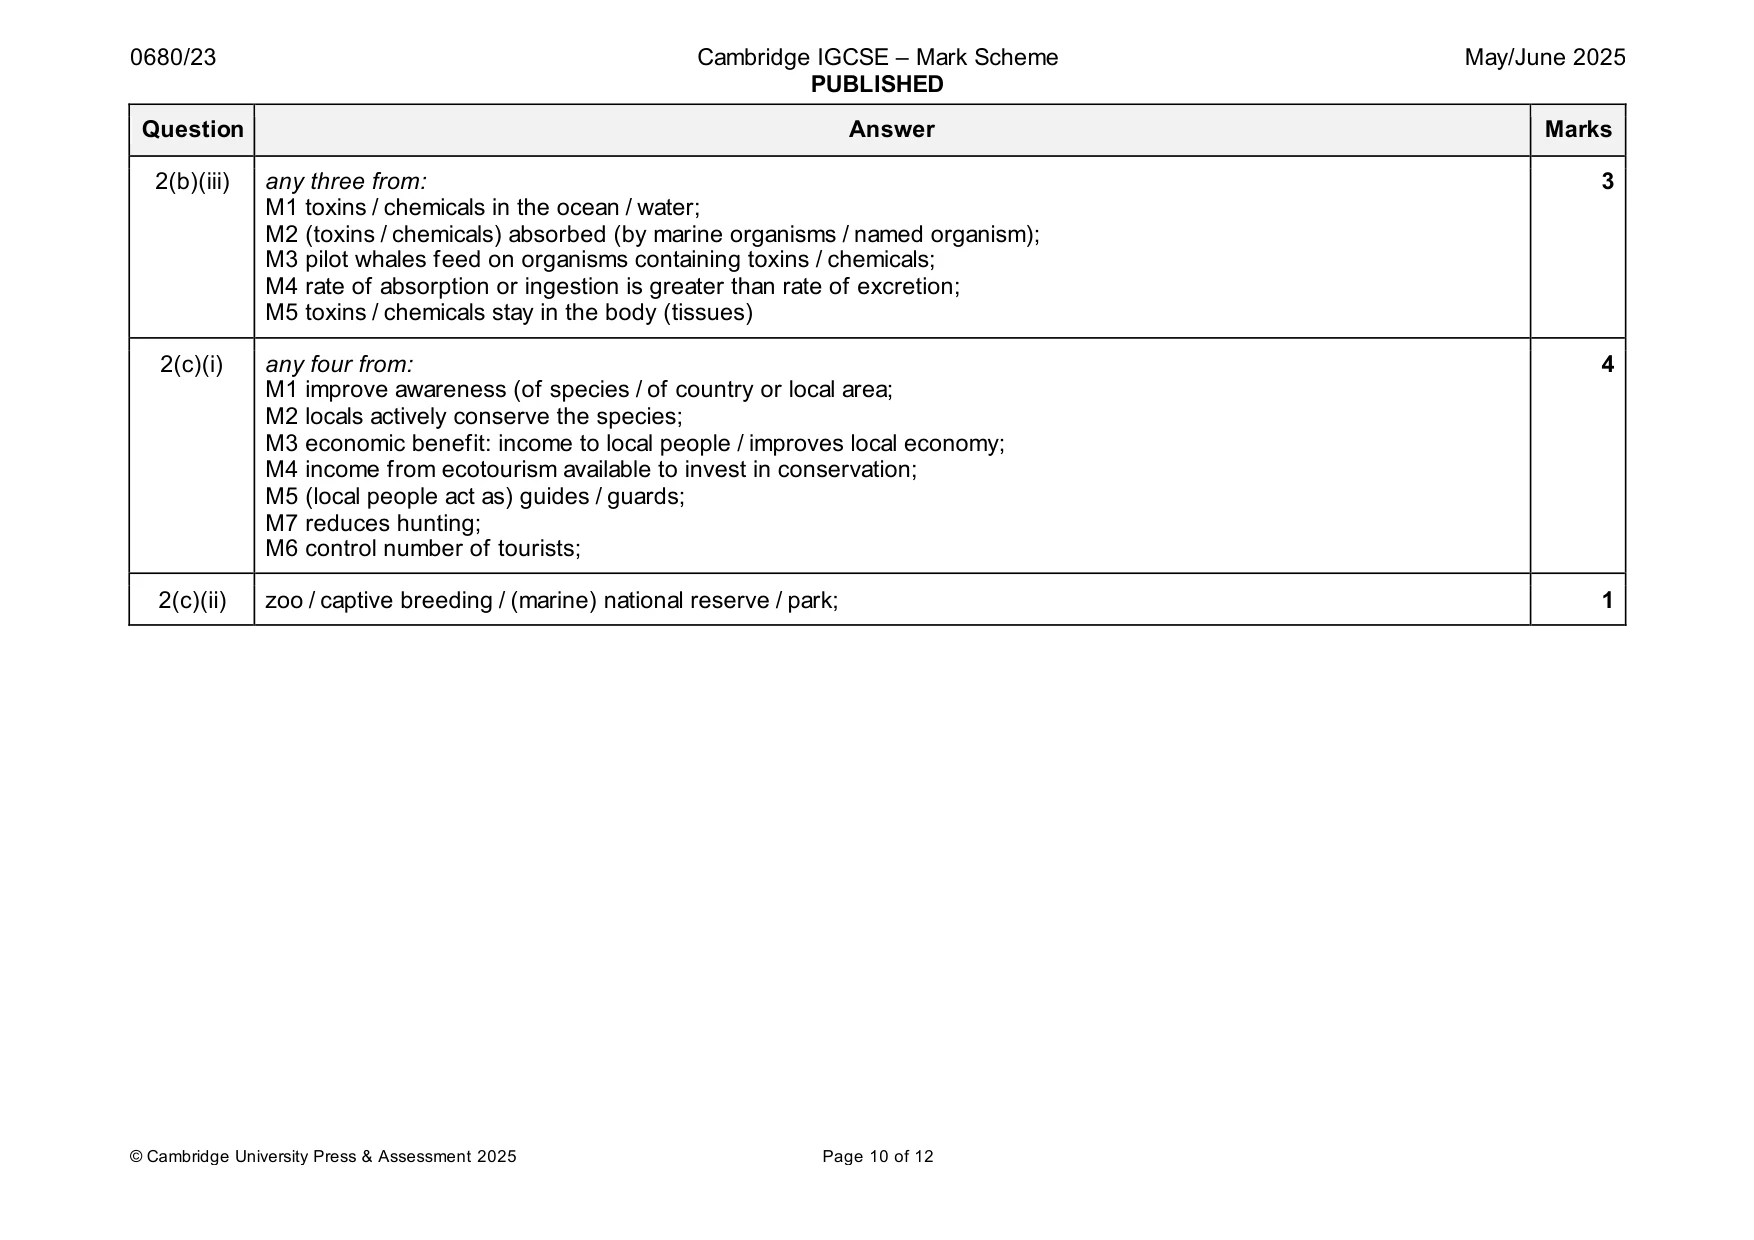
Mark scheme: 2(a)(i) M1phytoplankton → jellyfish → (pilot) whale → orca; 2 M2 all 4 organisms in the correct order; arrows in the correct direction; 2(a)(ii) Any four from 4 M1 energy moves along food chain (as organisms consumed); M2 chlorophyll in, producer / phytoplankton; M3 (needed for) photosynthesis; M4 absorbs (sun)light; M5 converts to (light energy to) chemical energy; M6 photosynthesis reactants: carbon dioxide and water AND products: glucose and oxygen; 2(a) (iii) any two from: 2 M1 pilot whales are difficult to, see / count / identify species; M2 pilot whales are mobile / migratory; M3 seas are large / live in large area; M4 different teams / methods of sampling e. g time of year; 2(a)(iv) week 2 and, value is much smaller than others / outlier; 1 2(a)(v) area: 4 M1 map / GPS coordinates / grid of area / divide into quadrats; M2 random or systematic method described; population counted: M3 visually (from boat) / arial photograph / drone / satellite; estimating overall population: M4 method of scaling up described e.g. find number in x metres and multiply by total area; 2(b)(i) correct plotting at 1000 and 300; 2 straight lines to join to other plots; 2(b)(ii) any three from: 3 M1 stated economic reason e.g. source of income / money / jobs / source of food; M2 traditional practice; M3 numbers caught are small (compared to the population); M4 high population, not decreasing / not endangered; 2(b)(iii) any three from: 3 M1 toxins / chemicals in the ocean / water; M2 (toxins / chemicals) absorbed (by marine organisms / named organism); M3 pilot whales feed on organisms containing toxins / chemicals; M4 rate of absorption or ingestion is greater than rate of excretion; M5 toxins / chemicals stay in the body (tissues) 2(c)(i) any four from: 4 M1 improve awareness (of species / of country or local area; M2 locals actively conserve the species; M3 economic benefit: income to local people / improves local economy; M4 income from ecotourism available to invest in conservation; M5 (local people act as) guides / guards; M7 reduces hunting; M6 control number of tourists; 2(c)(ii) zoo / captive breeding / (marine) national reserve / park; 1
Q3 · The table shows total electricity generation and consumption in the Faroe Islands in 2020
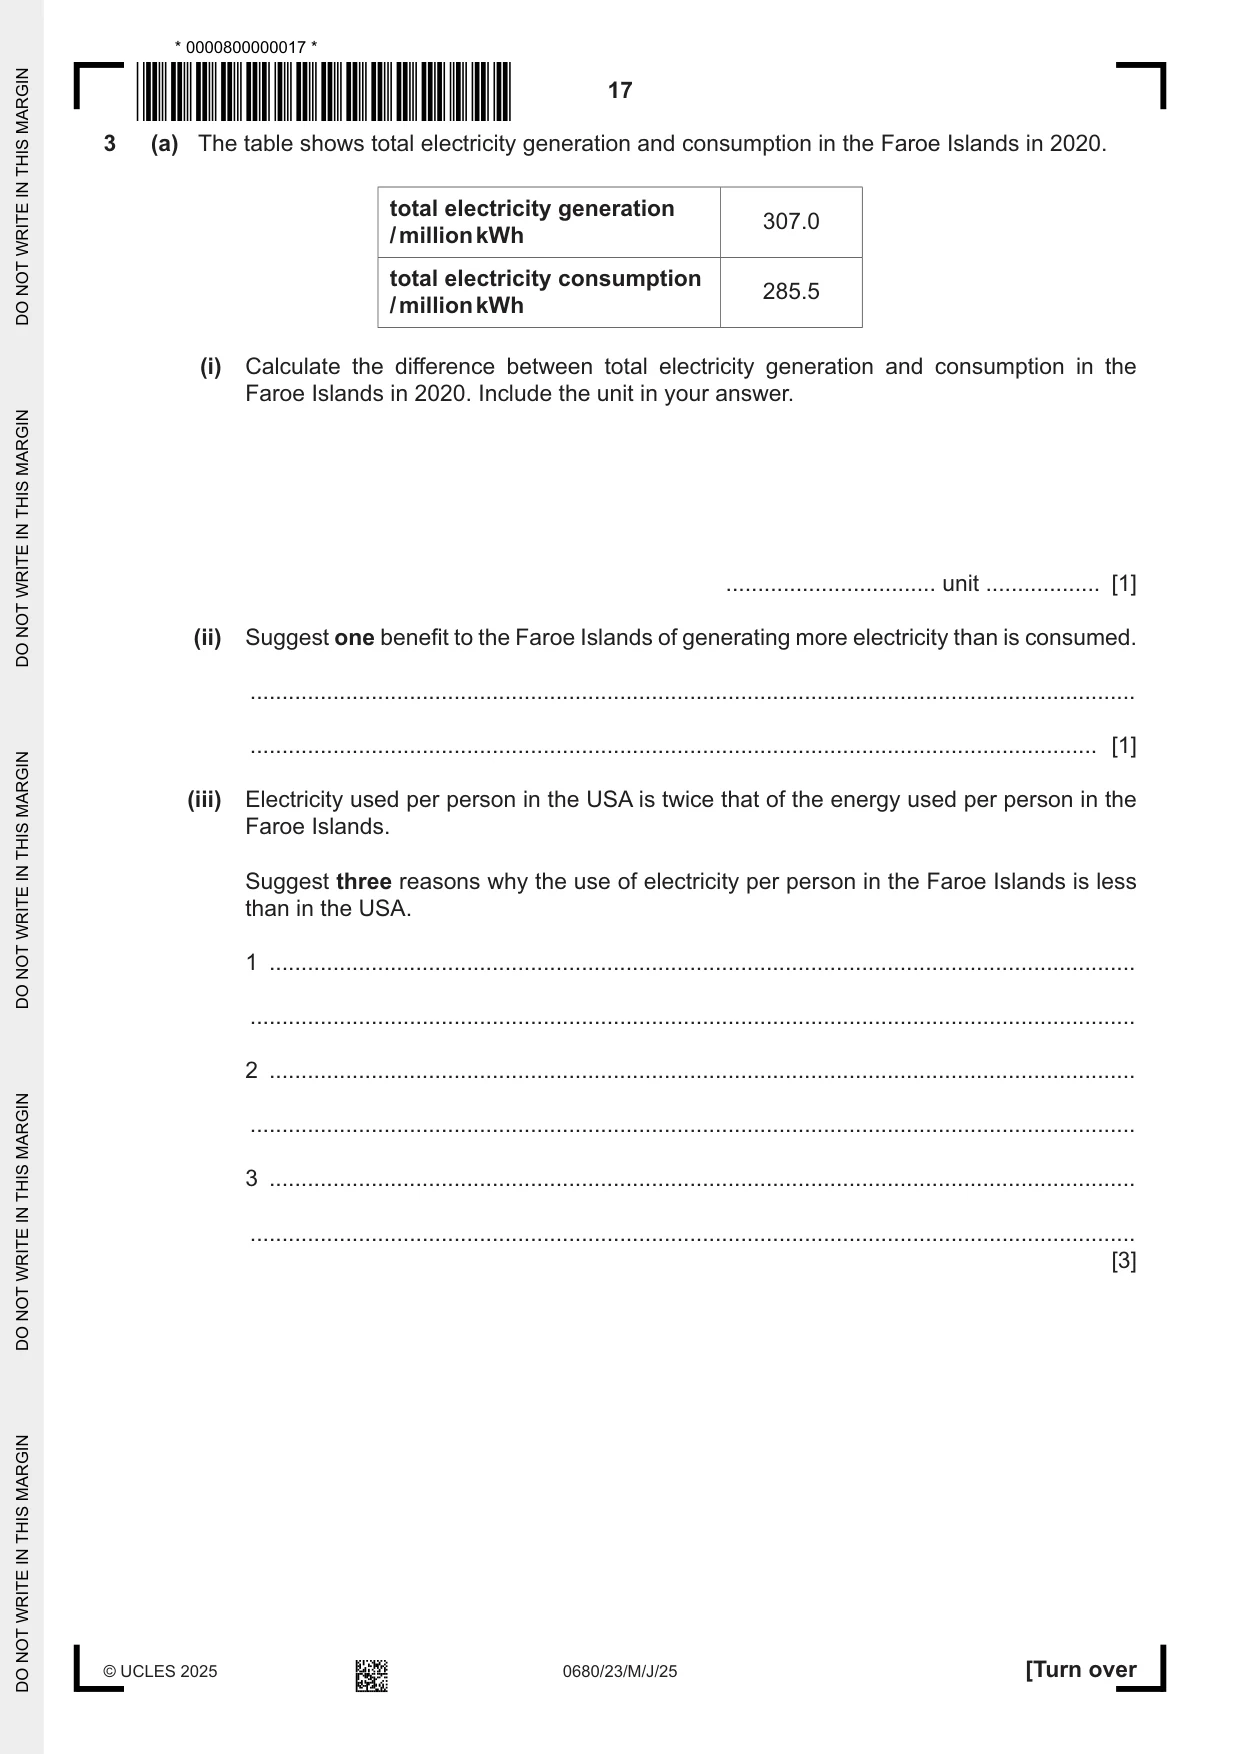
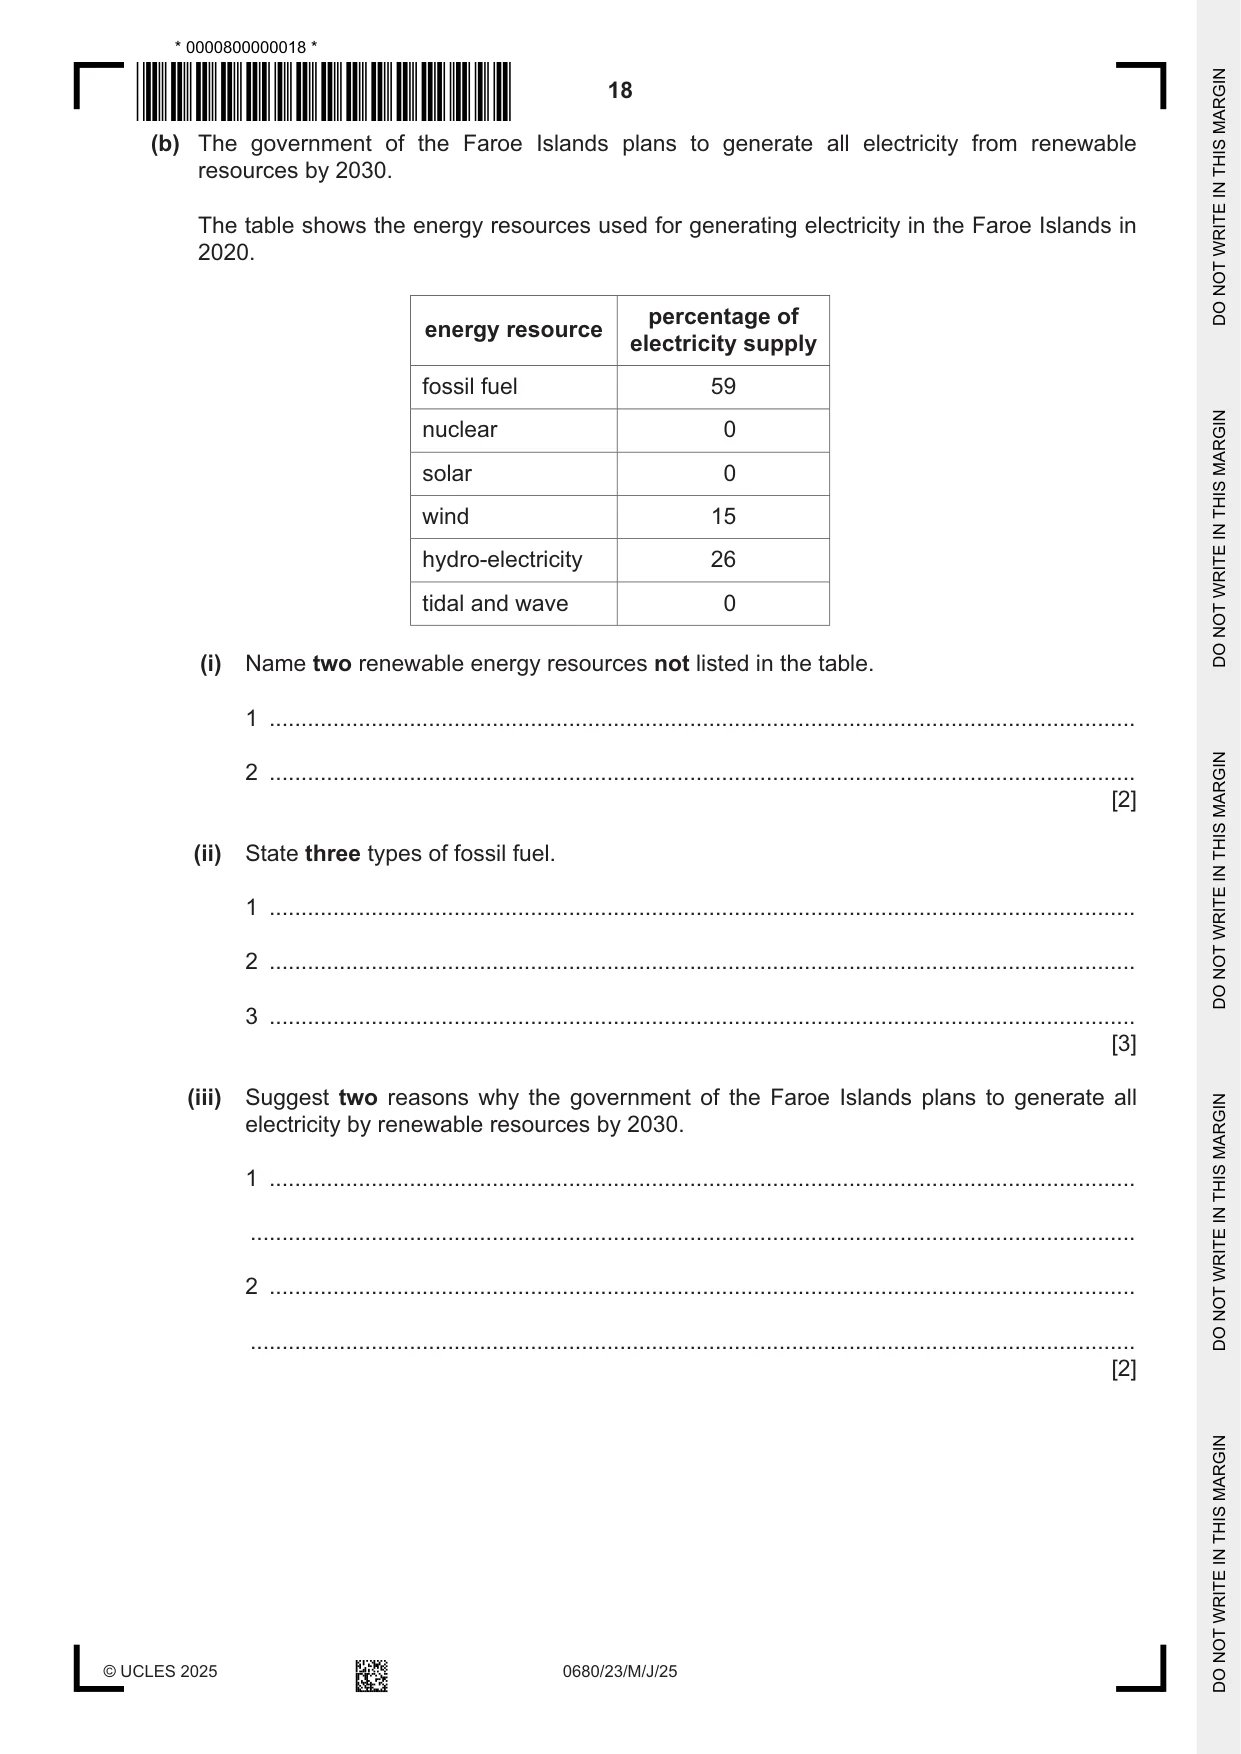
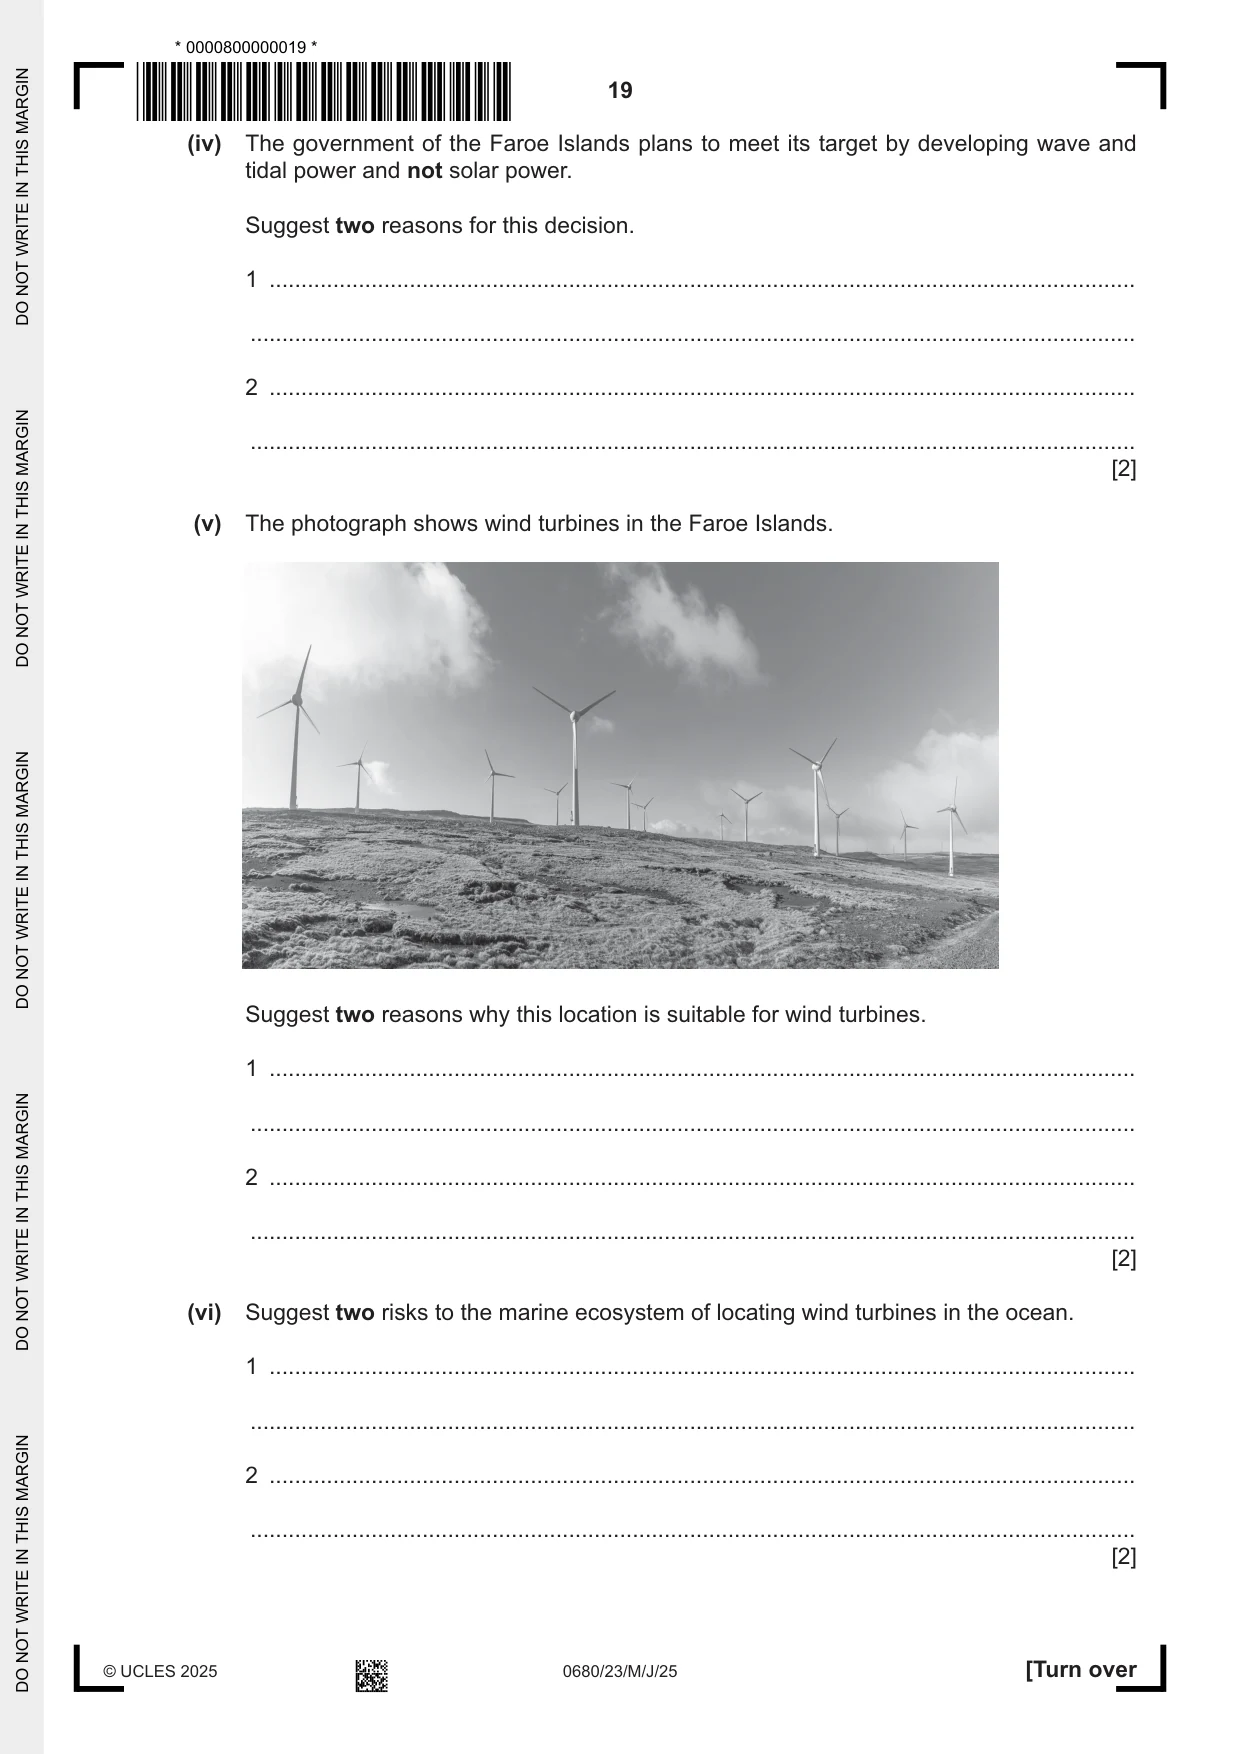
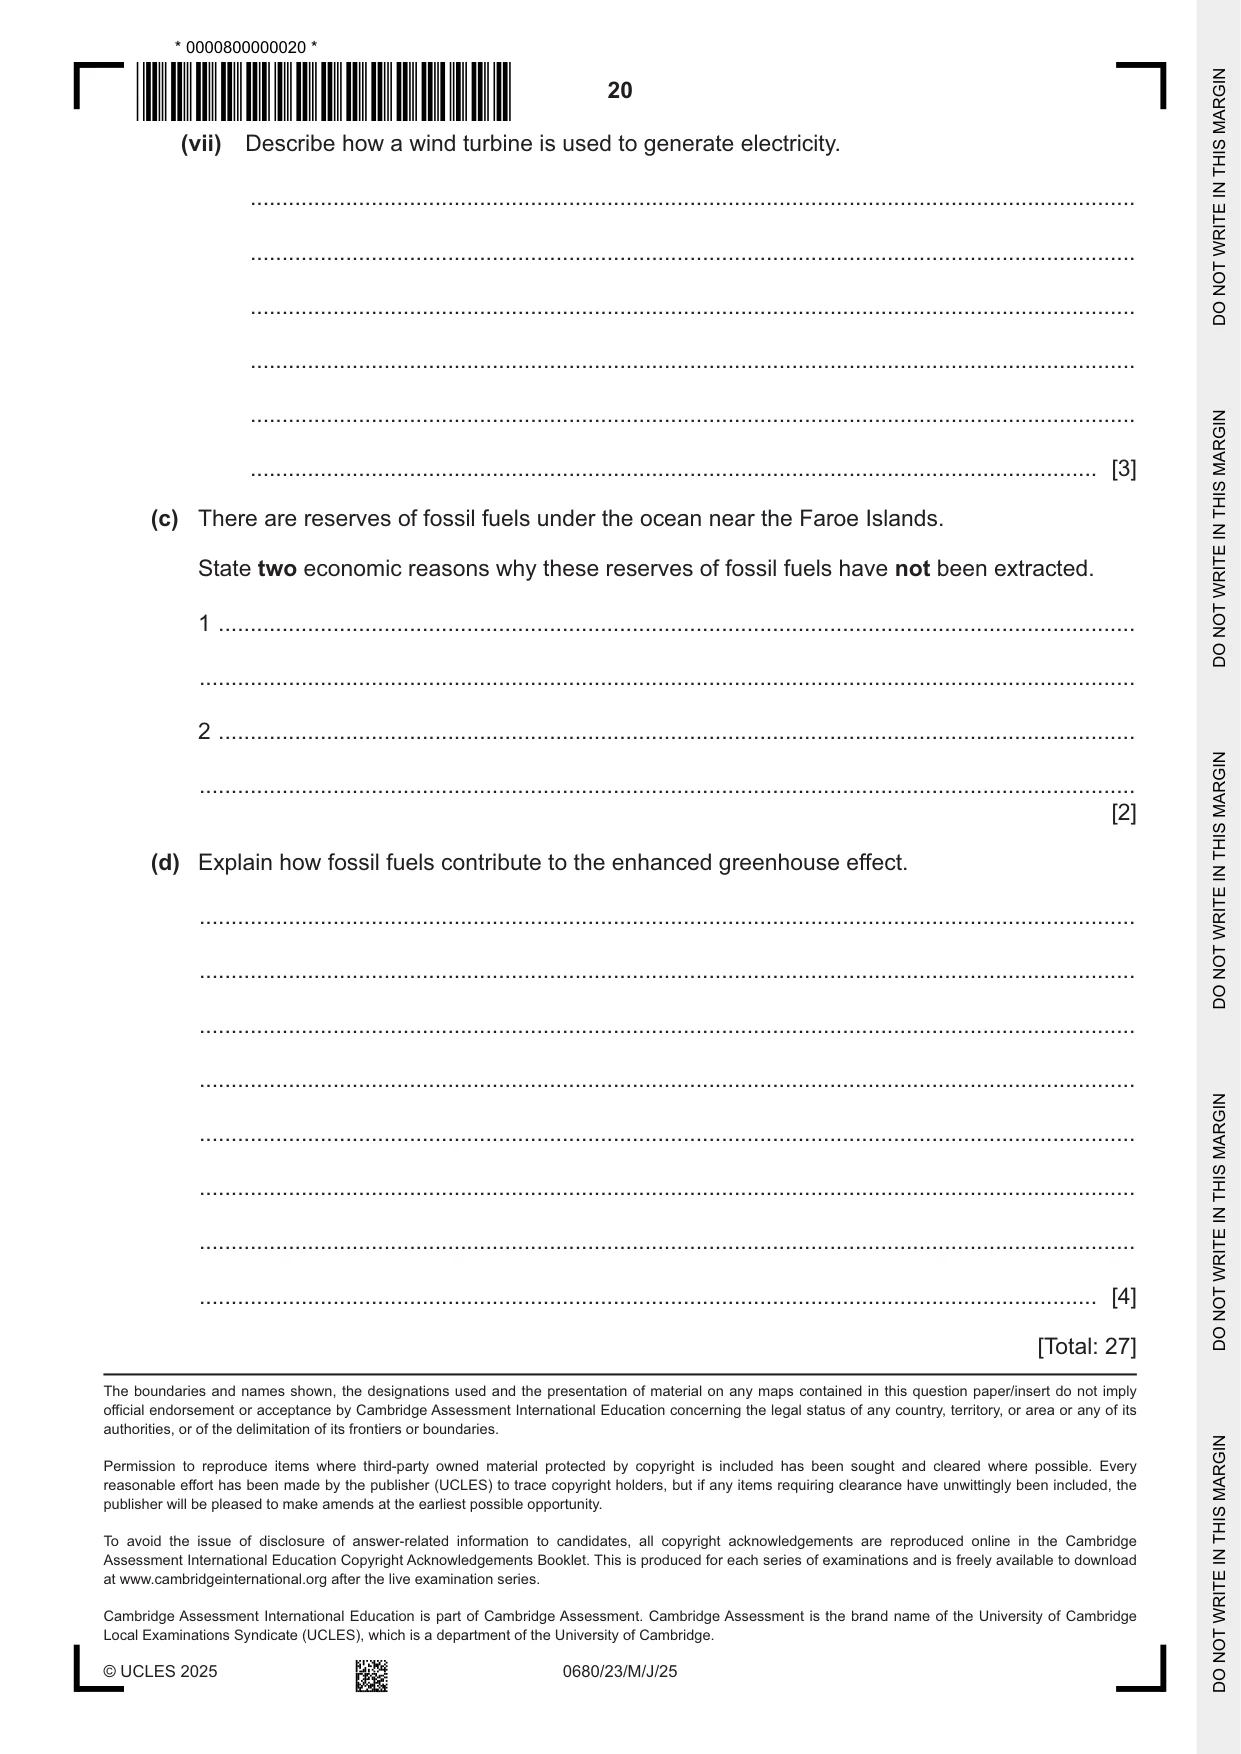
3 (a) The table shows total electricity generation and consumption in the Faroe Islands in 2020. total electricity generation 307.0 / million kWh total electricity consumption 285.5 / million kWh (i) Calculate the difference between total electricity generation and consumption in the Faroe Islands in 2020. Include the unit in your answer. ................................. unit .................. [1] (ii) Suggest one benefit to the Faroe Islands of generating more electricity than is consumed. ........................................................................................................................................... ..................................................................................................................................... [1] (iii) Electricity used per person in the USA is twice that of the energy used per person in the Faroe Islands. Suggest three reasons why the use of electricity per person in the Faroe Islands is less than in the USA. 1 ........................................................................................................................................ ........................................................................................................................................... 2 ........................................................................................................................................ ........................................................................................................................................... 3 ........................................................................................................................................ ........................................................................................................................................... [3] (b) The government of the Faroe Islands plans to generate all electricity from renewable resources by 2030. The table shows the energy resources used for generating electricity in the Faroe Islands in 2020. percentage of energy resource electricity supply fossil fuel 59 nuclear 0 solar 0 wind 15 hydro‑electricity 26 tidal and wave 0 (i) Name two renewable energy resources not listed in the table. 1 ........................................................................................................................................ 2 ........................................................................................................................................ [2] (ii) State three types of fossil fuel. 1 ........................................................................................................................................ 2 ........................................................................................................................................ 3 ........................................................................................................................................ [3] (iii) Suggest two reasons why the government of the Faroe Islands plans to generate all electricity by renewable resources by 2030. 1 ........................................................................................................................................ ........................................................................................................................................... 2 ........................................................................................................................................ ........................................................................................................................................... [2] (iv) The government of the Faroe Islands plans to meet its target by developing wave and tidal power and not solar power. Suggest two reasons for this decision. 1 ........................................................................................................................................ ........................................................................................................................................... 2 ........................................................................................................................................ ........................................................................................................................................... [2] (v) The photograph shows wind turbines in the Faroe Islands. Suggest two reasons why this location is suitable for wind turbines. 1 ........................................................................................................................................ ........................................................................................................................................... 2 ........................................................................................................................................ ........................................................................................................................................... [2] (vi) Suggest two risks to the marine ecosystem of locating wind turbines in the ocean. 1 ........................................................................................................................................ ........................................................................................................................................... 2 ........................................................................................................................................ ........................................................................................................................................... [2]
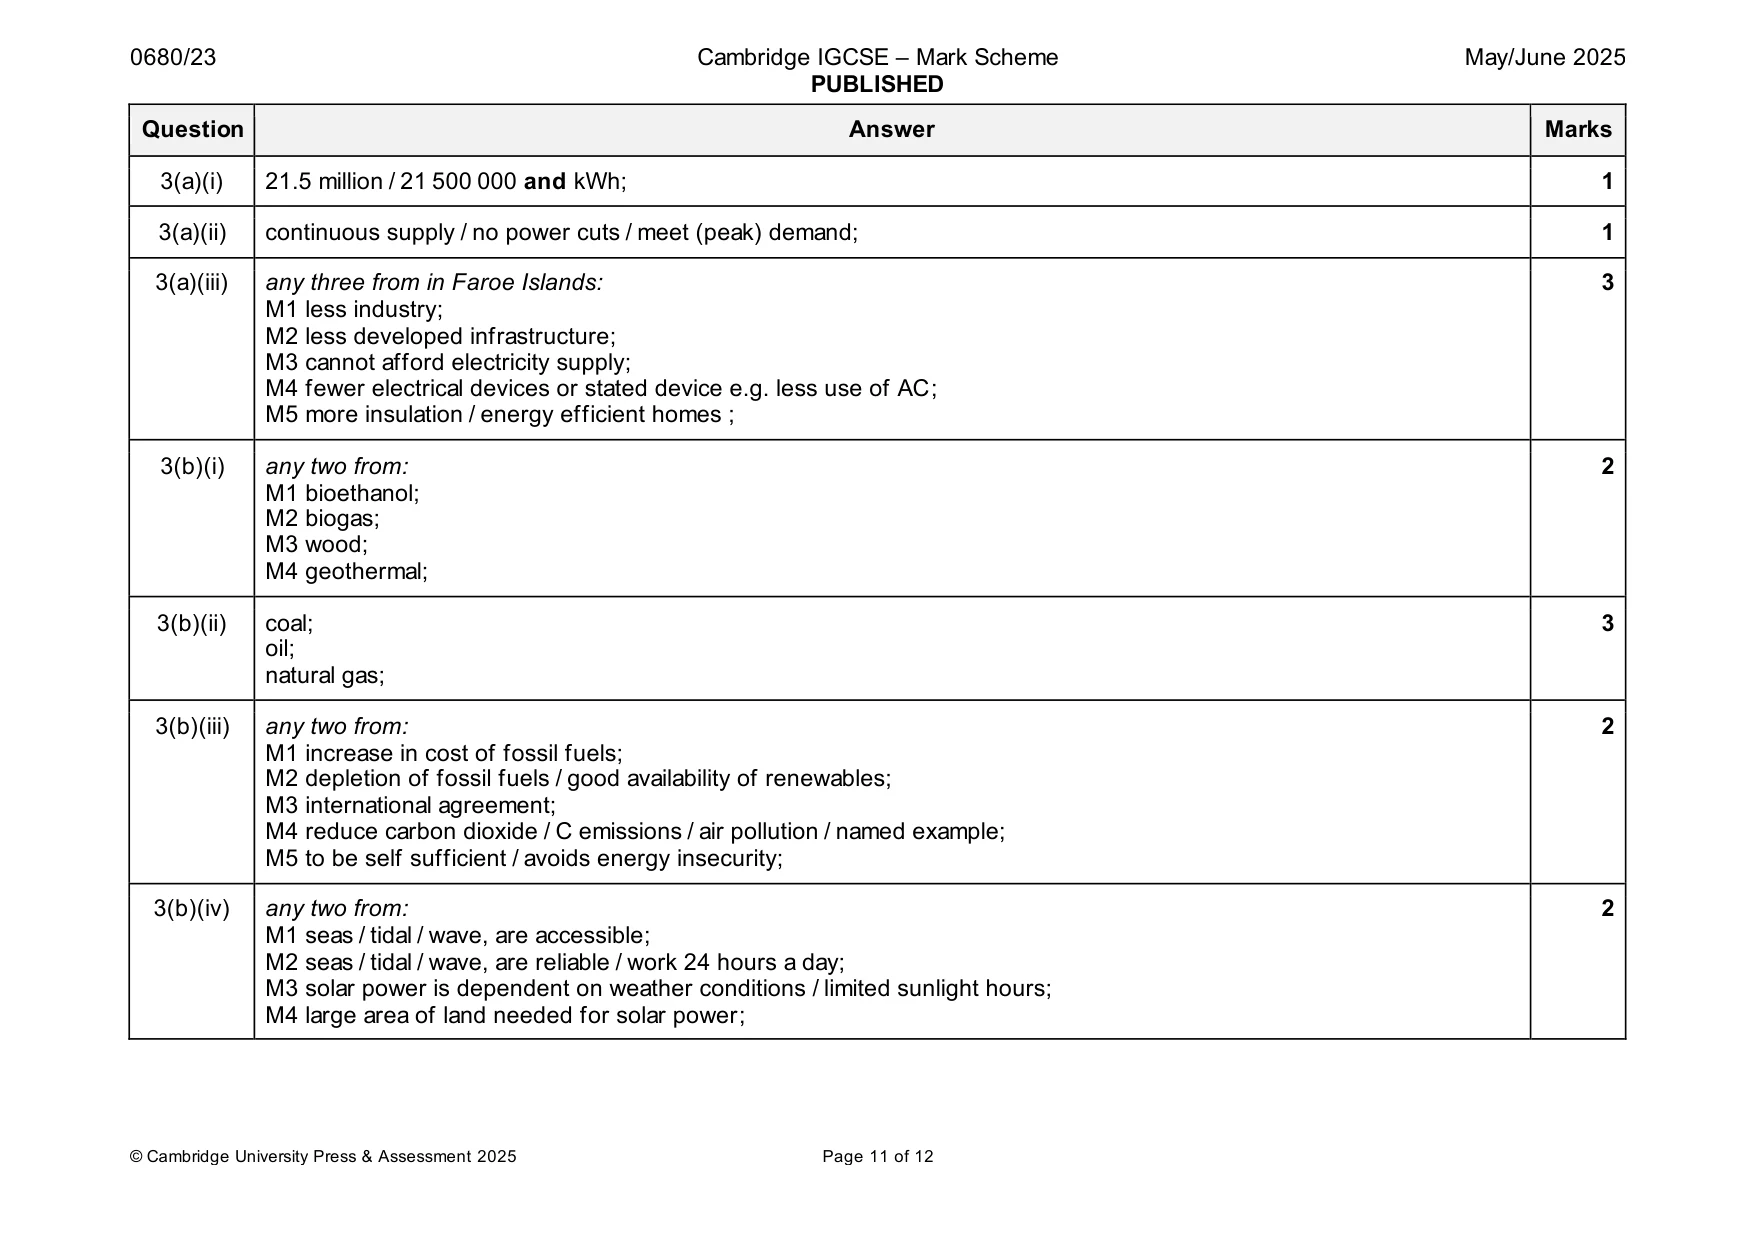
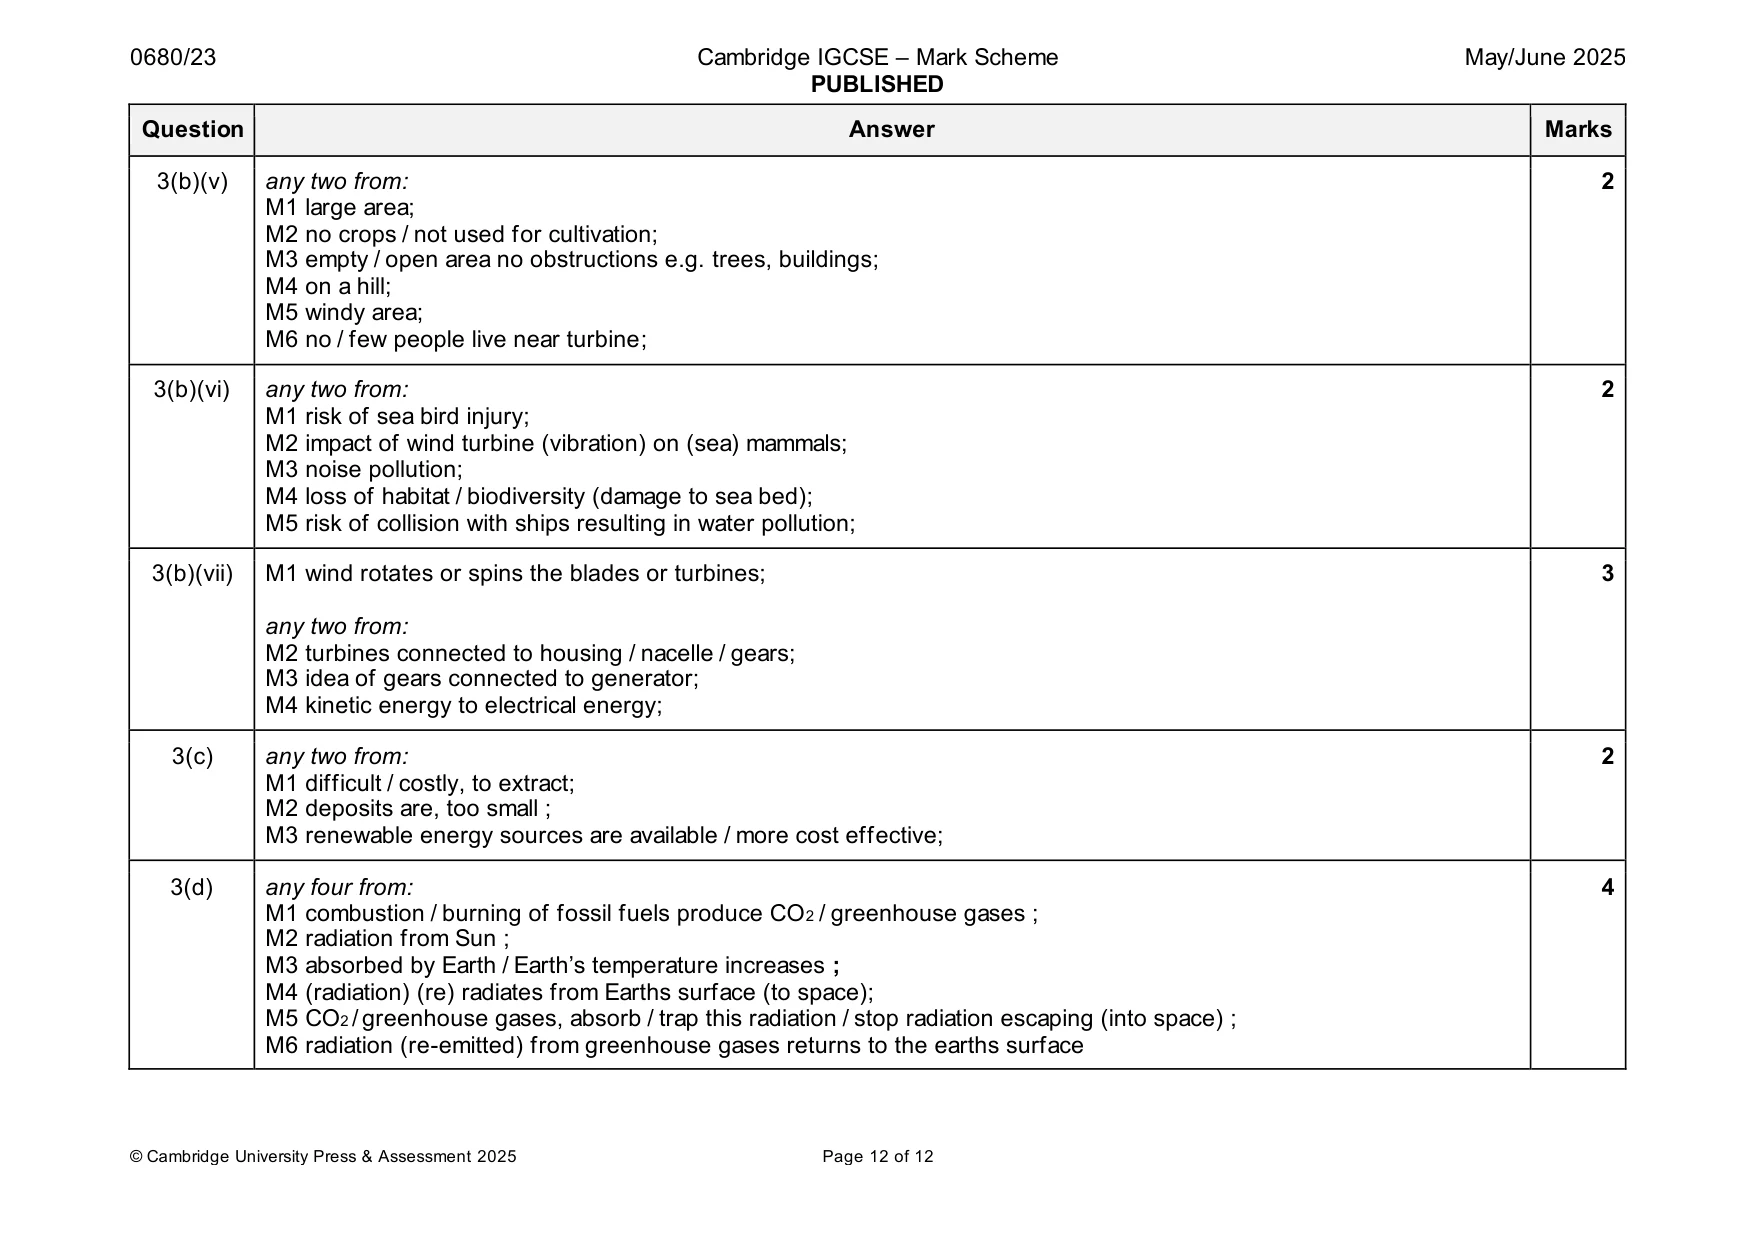
Mark scheme: 3(a)(i) 21.5 million / 21 500 000 and kWh; 1 3(a)(ii) continuous supply / no power cuts / meet (peak) demand; 1 3(a)(iii) any three from in Faroe Islands: 3 M1 less industry; M2 less developed infrastructure; M3 cannot afford electricity supply; M4 fewer electrical devices or stated device e.g. less use of AC; M5 more insulation / energy efficient homes ; 3(b)(i) any two from: 2 M1 bioethanol; M2 biogas; M3 wood; M4 geothermal; 3(b)(ii) coal; 3 oil; natural gas; 3(b)(iii) any two from: 2 M1 increase in cost of fossil fuels; M2 depletion of fossil fuels / good availability of renewables; M3 international agreement; M4 reduce carbon dioxide / C emissions / air pollution / named example; M5 to be self sufficient / avoids energy insecurity; 3(b)(iv) any two from: 2 M1 seas / tidal / wave, are accessible; M2 seas / tidal / wave, are reliable / work 24 hours a day; M3 solar power is dependent on weather conditions / limited sunlight hours; M4 large area of land needed for solar power; 3(b)(v) any two from: 2 M1 large area; M2 no crops / not used for cultivation; M3 empty / open area no obstructions e.g. trees, buildings; M4 on a hill; M5 windy area; M6 no / few people live near turbine; 3(b)(vi) any two from: 2 M1 risk of sea bird injury; M2 impact of wind turbine (vibration) on (sea) mammals; M3 noise pollution; M4 loss of habitat / biodiversity (damage to sea bed); M5 risk of collision with ships resulting in water pollution; 3(b)(vii) M1 wind rotates or spins the blades or turbines; 3 any two from: M2 turbines connected to housing / nacelle / gears; M3 idea of gears connected to generator; M4 kinetic energy to electrical energy; 3(c) any two from: 2 M1 difficult / costly, to extract; M2 deposits are, too small ; M3 renewable energy sources are available / more cost effective; 3(d) any four from: 4 M1 combustion / burning of fossil fuels produce CO2 / greenhouse gases ; M2 radiation from Sun ; M3 absorbed by Earth / Earth’s temperature increases ; M4 (radiation) (re) radiates from Earths surface (to space); M5 CO2 / greenhouse gases, absorb / trap this radiation / stop radiation escaping (into space) ; M6 radiation (re-emitted) from greenhouse gases returns to the earths surface
What was in this paper
The subtopics covered by these 3 questions, and how many questions each got. Open one in a new tab to see every Cambridge question on it.
What you needed in this session
Cambridge’s own grade thresholds for 2025 May/June, Paper 2 · Variant 3. A higher threshold means an easier paper — the bar moves with how the cohort did.