Cambridge IGCSE Environmental Management 0680 — 2023 Oct/Nov Paper 2 · Variant 3
0680/23/O/N/23 · 4 questions · 80 marks · ≈90 min
The question paper and its mark scheme, free to read here and free to download. This is Cambridge’s own paper, exactly as it was sat.
Question paper20 pages
Mark scheme11 pages
Answers below. Sit the paper first if you are practising.
Questions as text
Q1 · Calculate the number of people living in urban areas in Zimbabwe in 2021
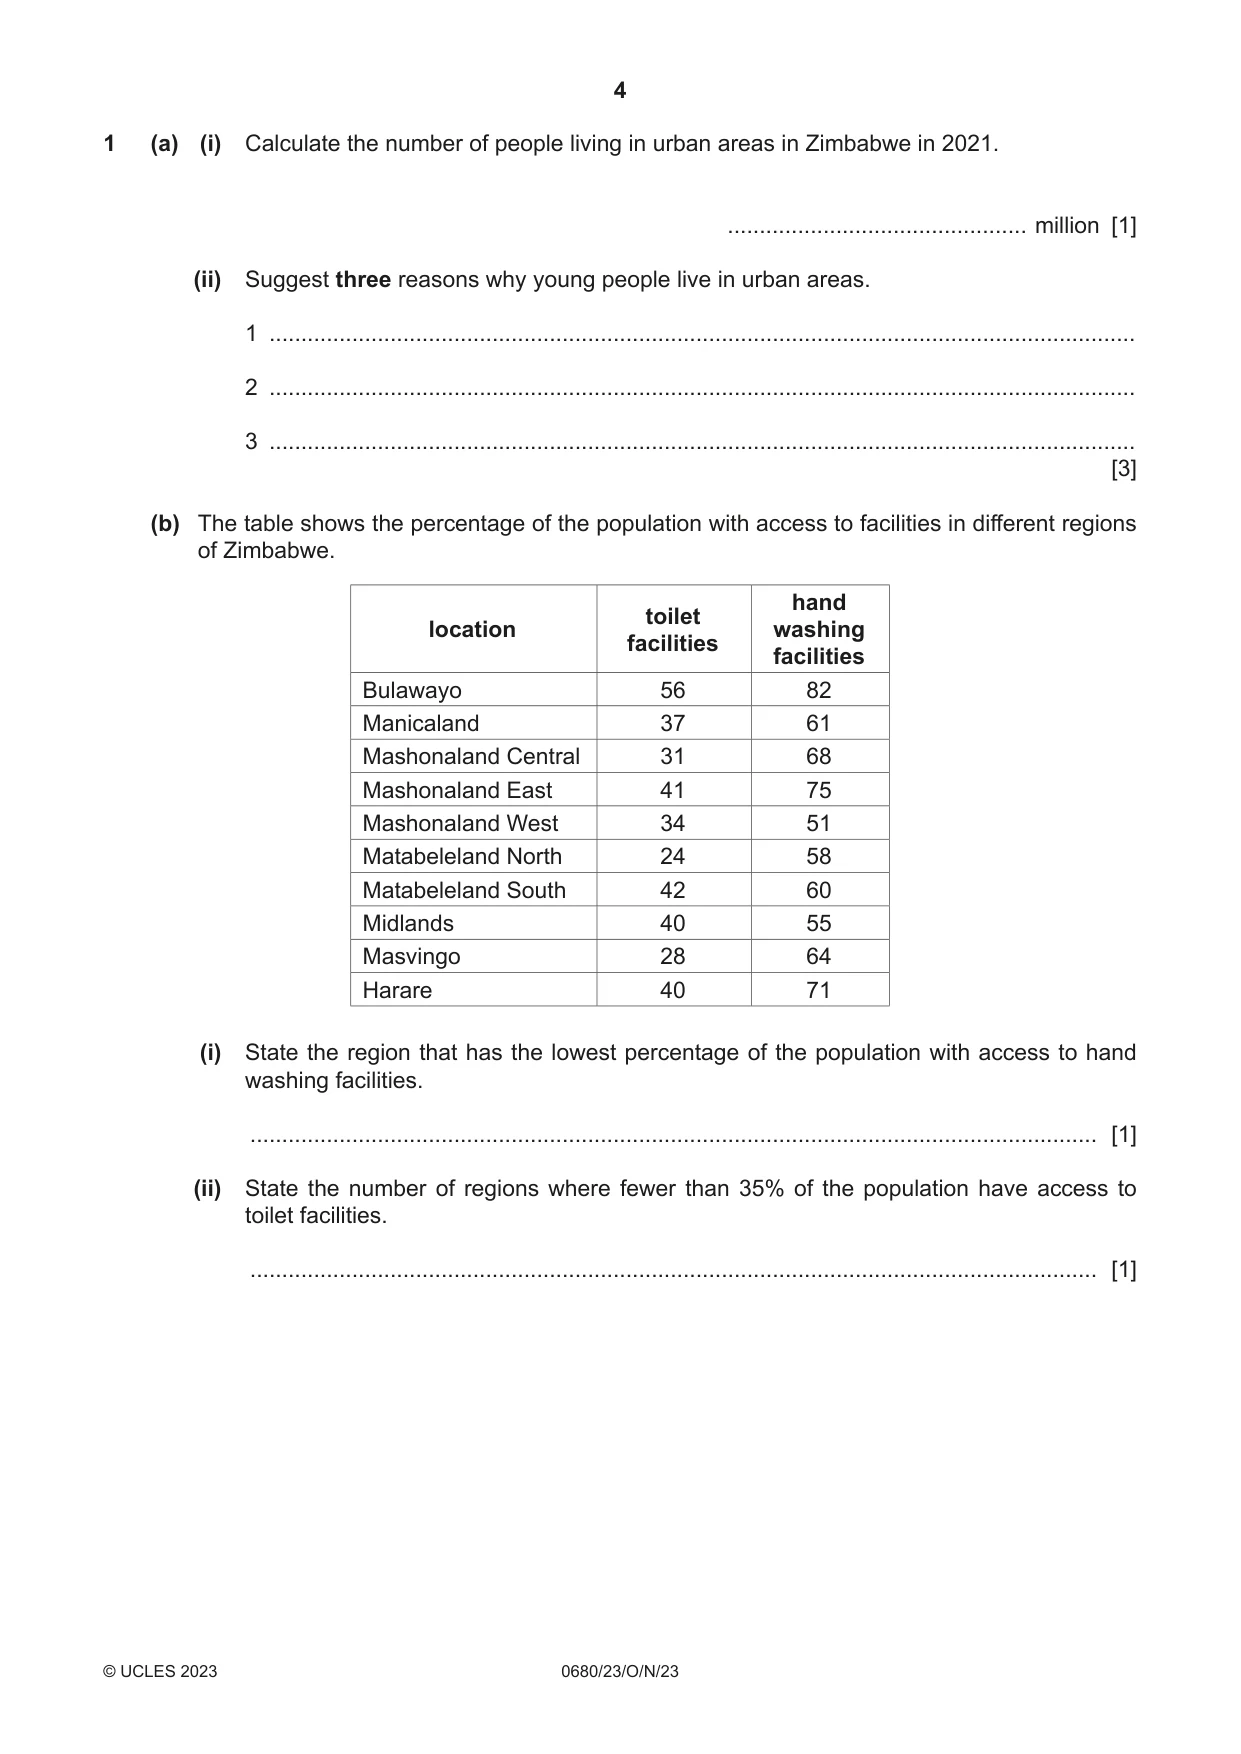
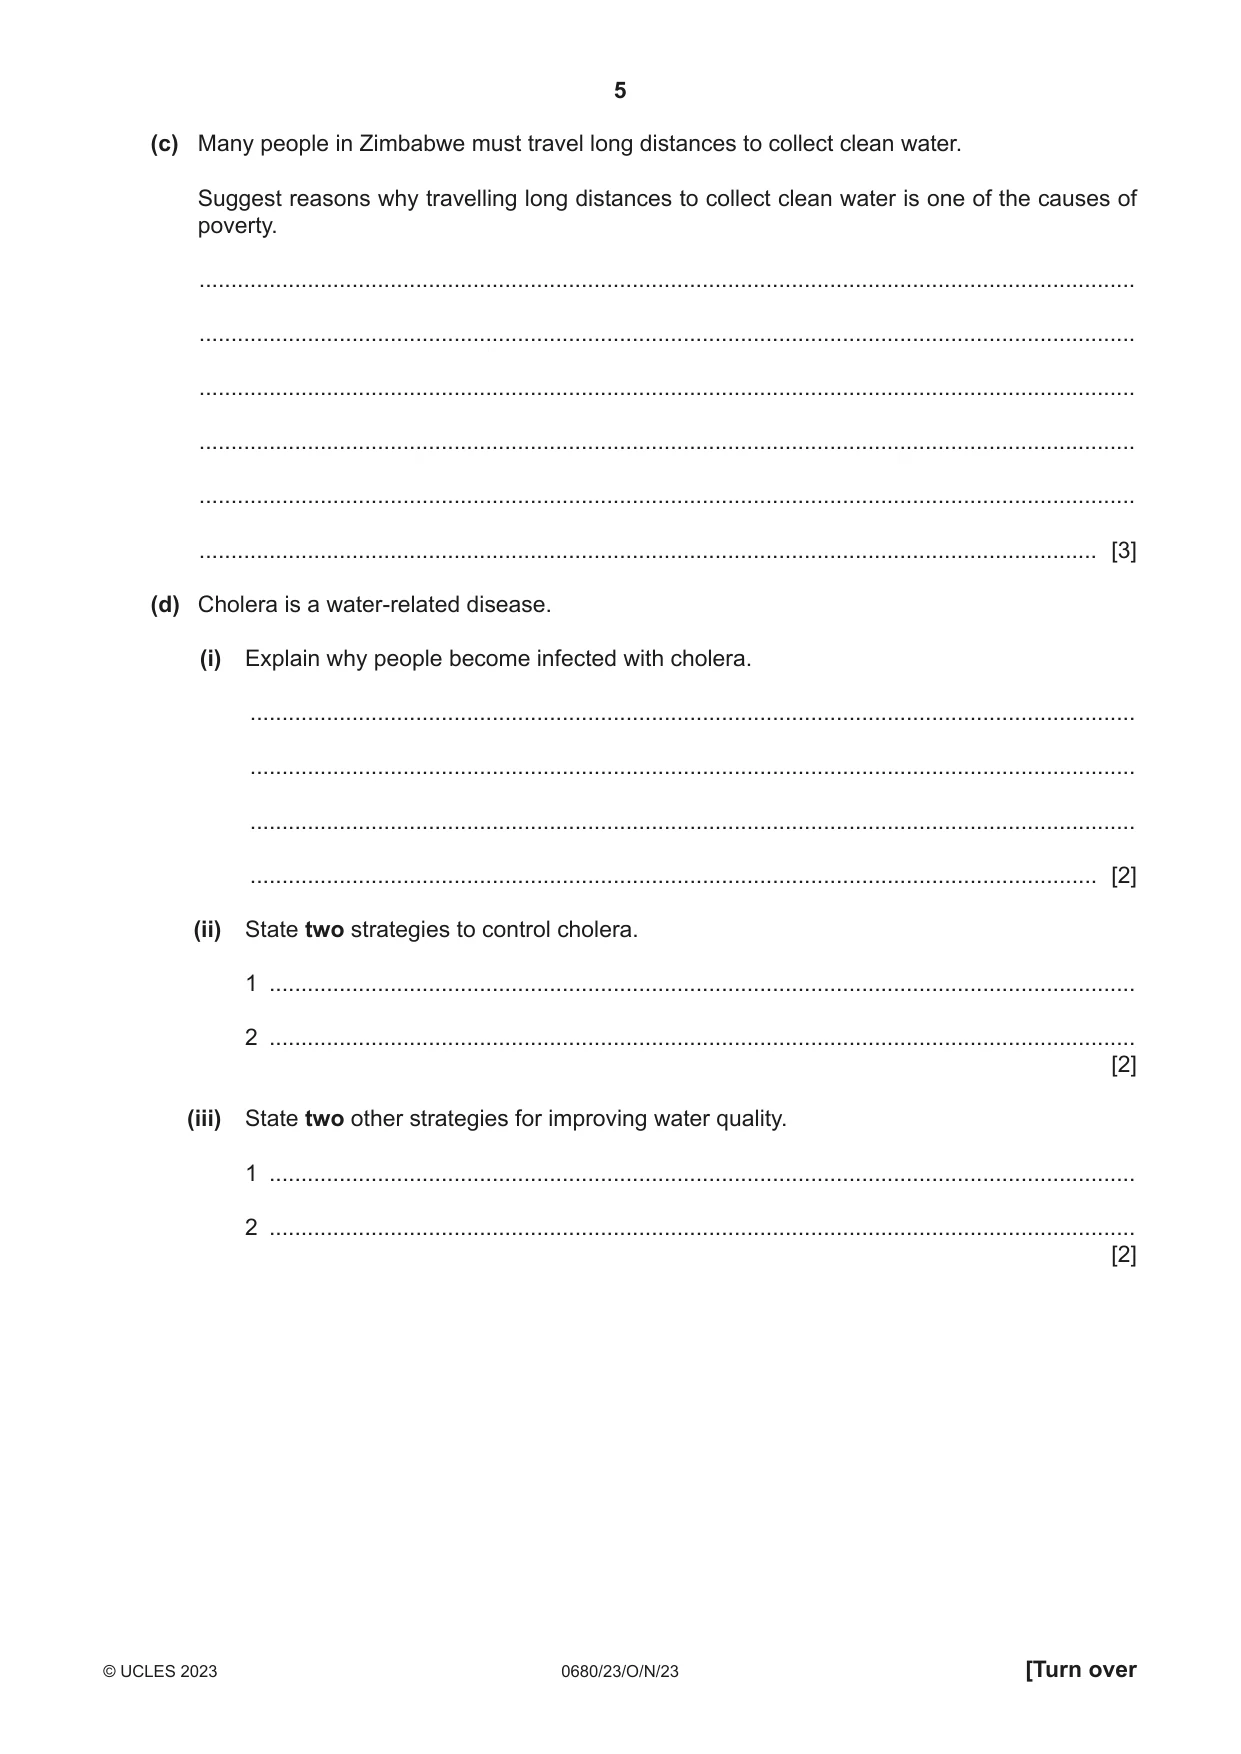
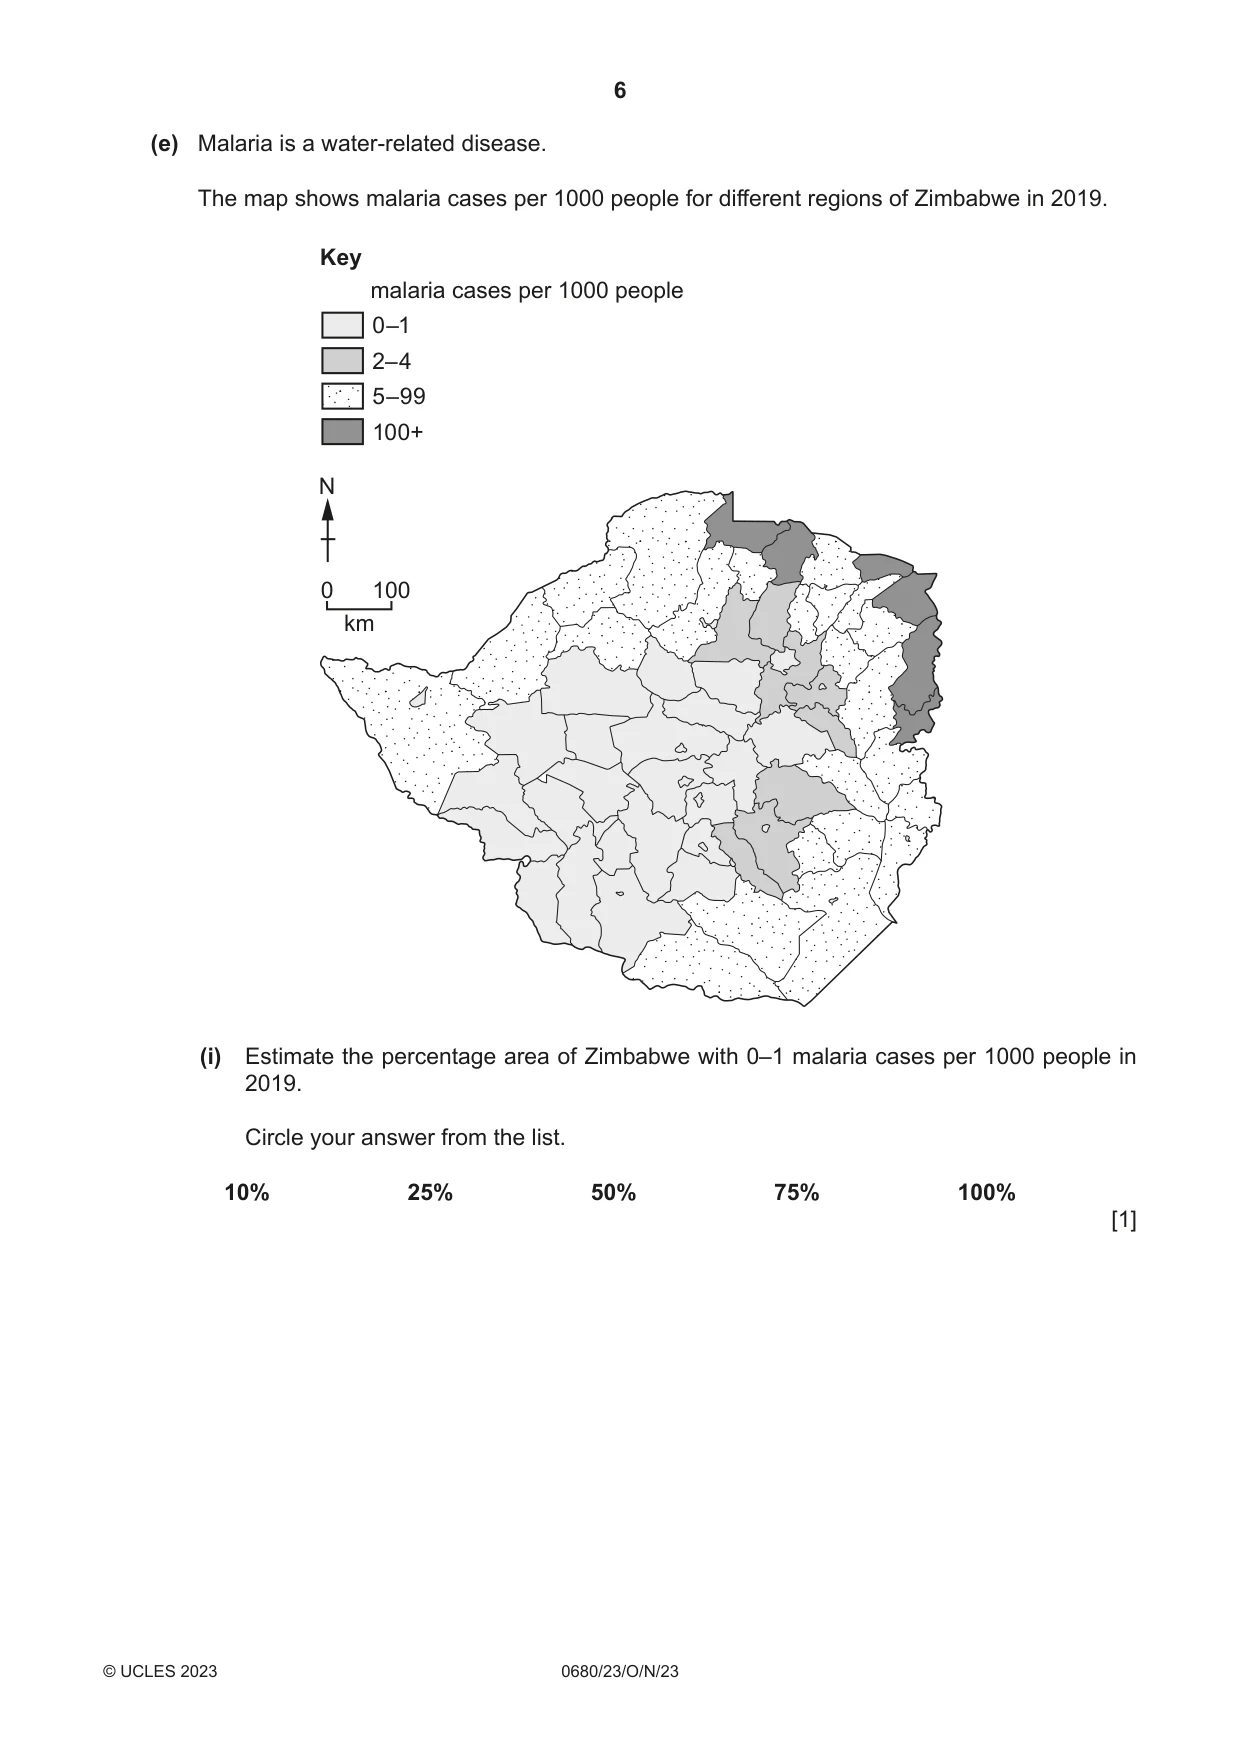
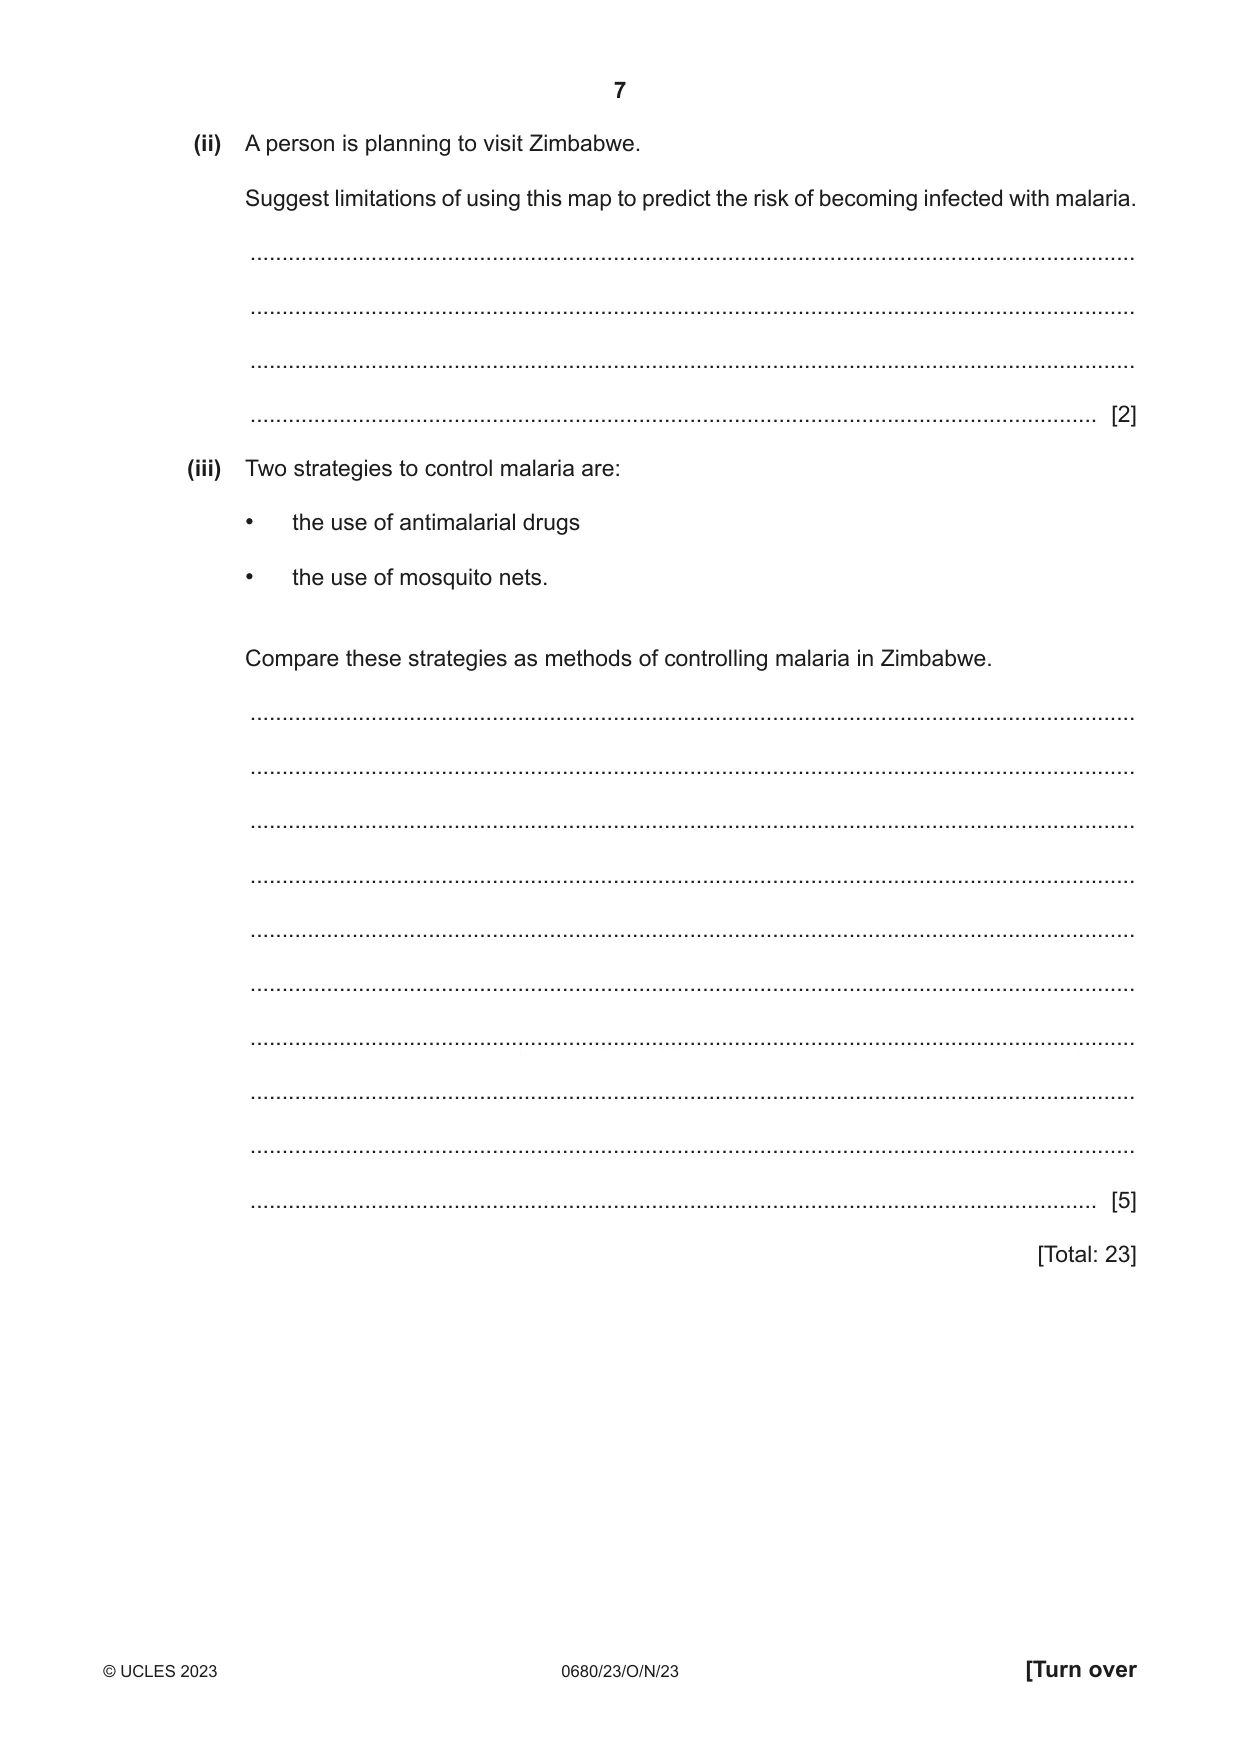
1 (a) (i) Calculate the number of people living in urban areas in Zimbabwe in 2021. ............................................... million [1] (ii) Suggest three reasons why young people live in urban areas. 1 ........................................................................................................................................ 2 ........................................................................................................................................ 3 ........................................................................................................................................ [3] (b) The table shows the percentage of the population with access to facilities in different regions of Zimbabwe. hand toilet location washing facilities facilities Bulawayo 56 82 Manicaland 37 61 Mashonaland Central 31 68 Mashonaland East 41 75 Mashonaland West 34 51 Matabeleland North 24 58 Matabeleland South 42 60 Midlands 40 55 Masvingo 28 64 Harare 40 71 (i) State the region that has the lowest percentage of the population with access to hand washing facilities. ..................................................................................................................................... [1] (ii) State the number of regions where fewer than 35% of the population have access to toilet facilities. ..................................................................................................................................... [1] (c) Many people in Zimbabwe must travel long distances to collect clean water. Suggest reasons why travelling long distances to collect clean water is one of the causes of poverty. ................................................................................................................................................... ................................................................................................................................................... ................................................................................................................................................... ................................................................................................................................................... ................................................................................................................................................... ............................................................................................................................................. [3] (d) Cholera is a water-related disease. (i) Explain why people become infected with cholera. ........................................................................................................................................... ........................................................................................................................................... ........................................................................................................................................... ..................................................................................................................................... [2] (ii) State two strategies to control cholera. 1 ........................................................................................................................................ 2 ........................................................................................................................................ [2] (iii) State two other strategies for improving water quality. 1 ........................................................................................................................................ 2 ........................................................................................................................................ [2] (e) Malaria is a water-related disease. The map shows malaria cases per 1000 people for different regions of Zimbabwe in 2019. Key malaria cases per 1000 people 0–1 2–4 5–99 100+ N 0 100 km (i) Estimate the percentage area of Zimbabwe with 0–1 malaria cases per 1000 people in 2019. Circle your answer from the list. 10% 25% 50% 75% 100% [1] (ii) A person is planning to visit Zimbabwe. Suggest limitations of using this map to predict the risk of becoming infected with malaria. ........................................................................................................................................... ........................................................................................................................................... ........................................................................................................................................... ..................................................................................................................................... [2] (iii) Two strategies to control malaria are: • the use of antimalarial drugs • the use of mosquito nets. Compare these strategies as methods of controlling malaria in Zimbabwe. ........................................................................................................................................... ........................................................................................................................................... ........................................................................................................................................... ........................................................................................................................................... ........................................................................................................................................... ........................................................................................................................................... ........................................................................................................................................... ........................................................................................................................................... ........................................................................................................................................... ..................................................................................................................................... [5] [Total: 23]
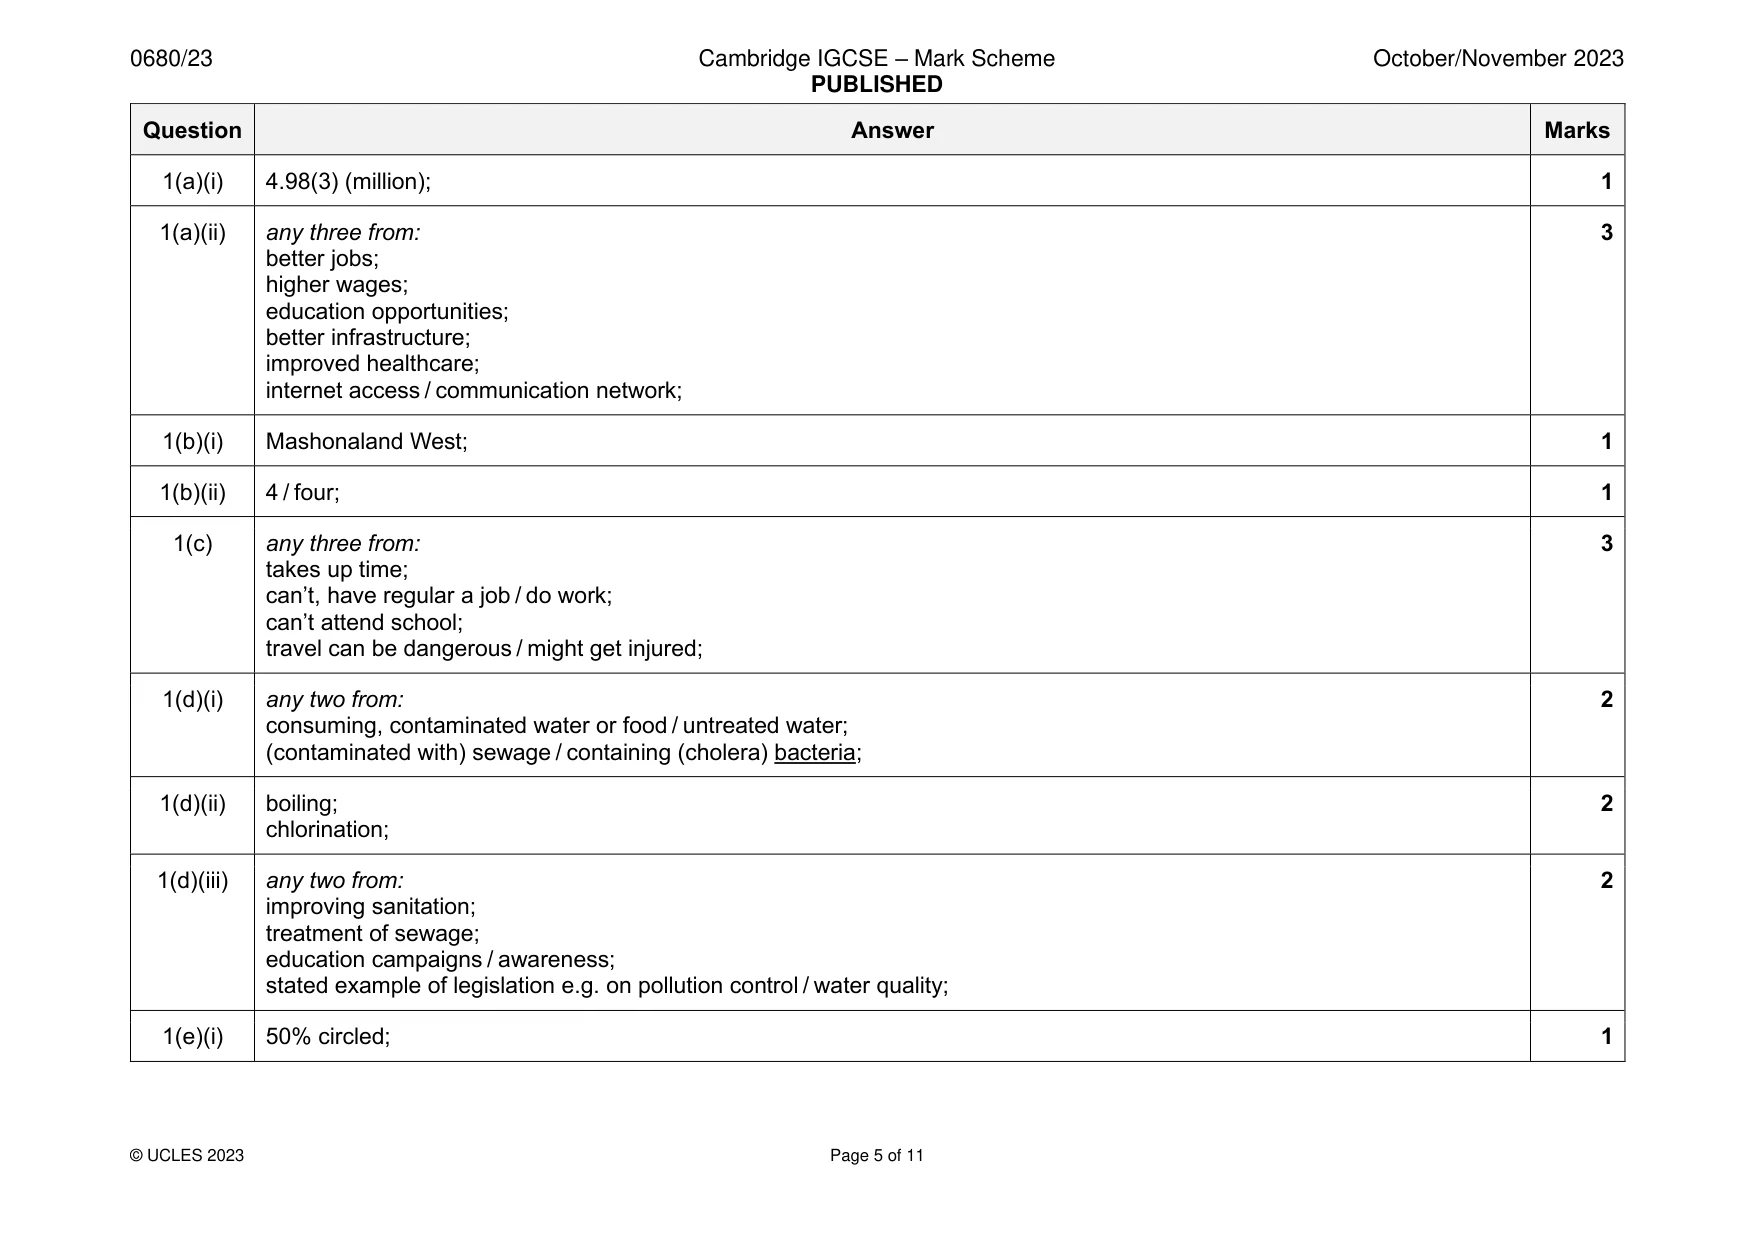
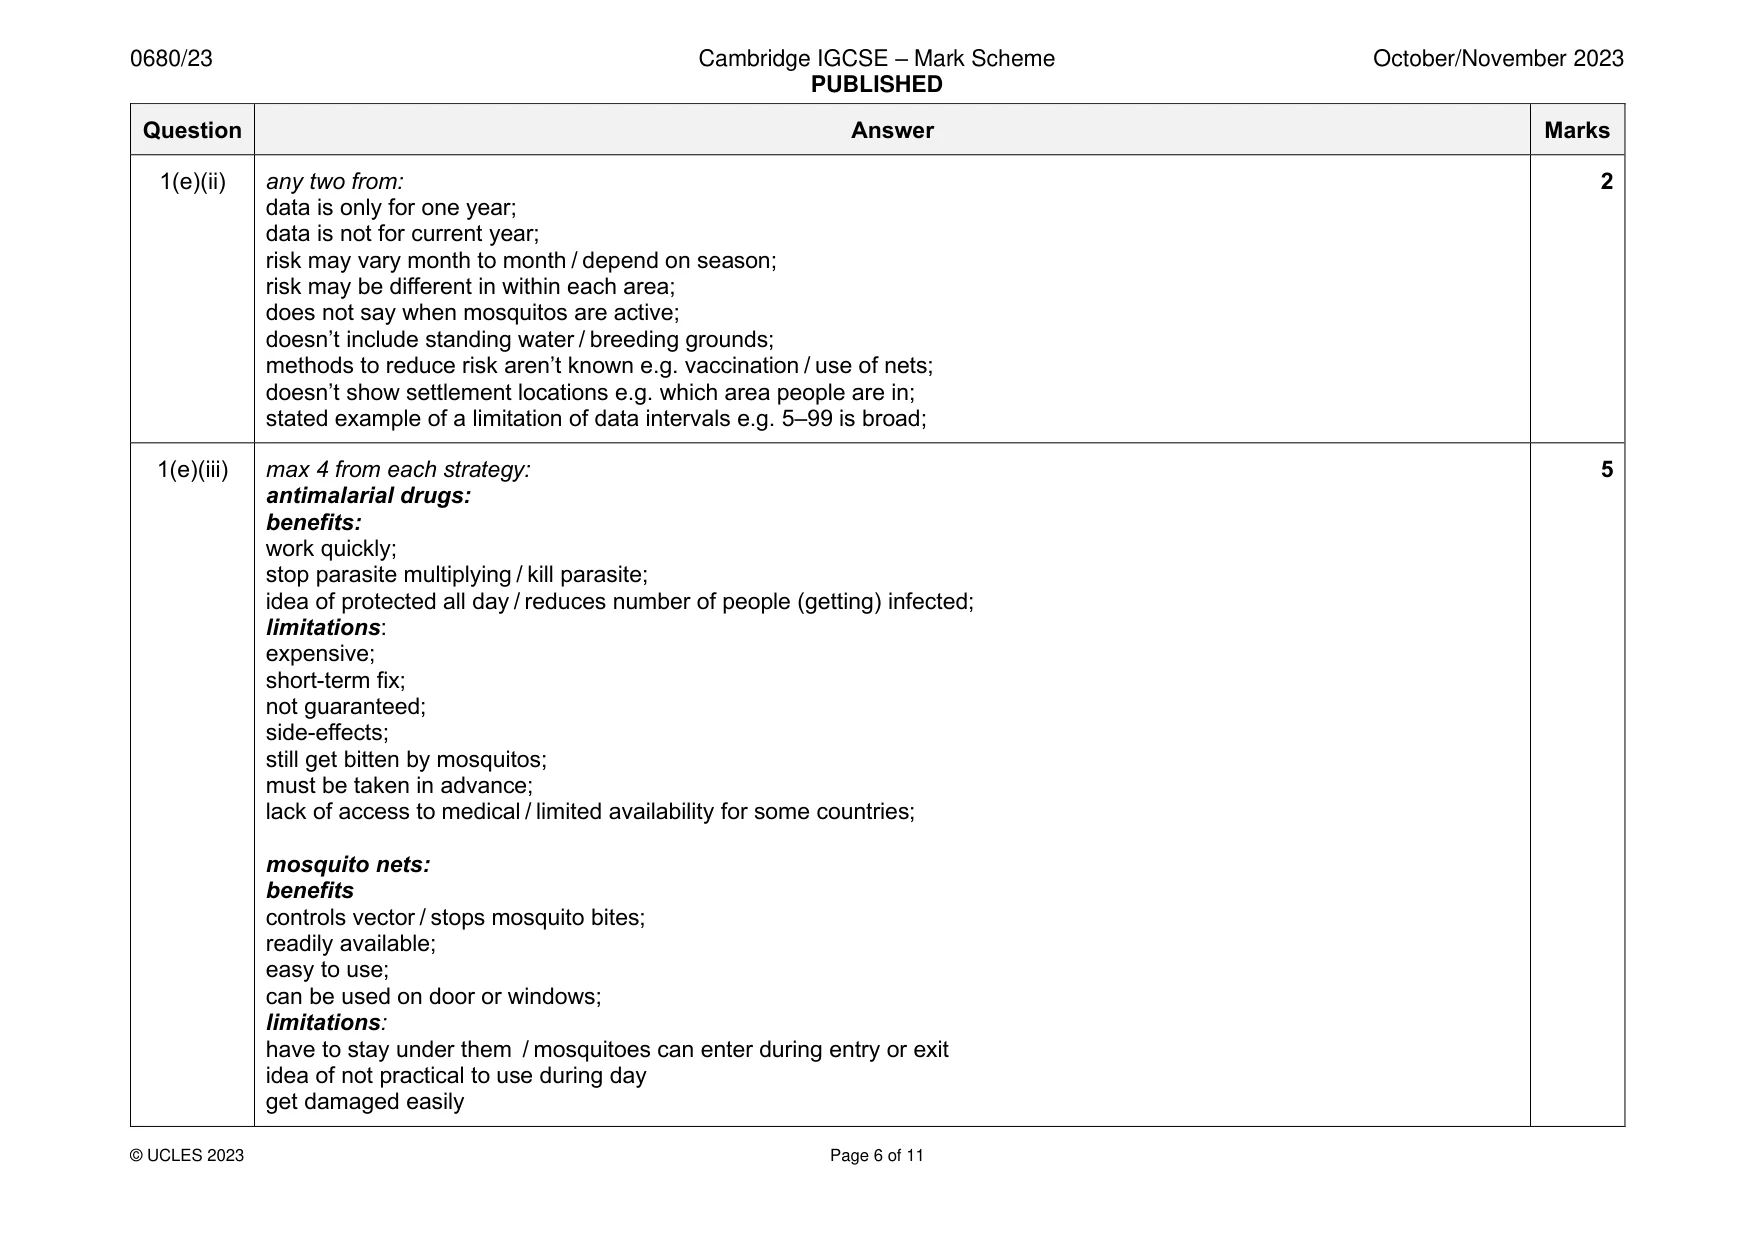
Mark scheme: Question Answer Marks 1(a)(i) 4.98(3) (million); 1 1(a)(ii) any three from: 3 better jobs; higher wages; education opportunities; better infrastructure; improved healthcare; internet access / communication network; 1(b)(i) Mashonaland West; 1 1(b)(ii) 4 / four; 1 1(c) any three from: 3 takes up time; can’t, have regular a job / do work; can’t attend school; travel can be dangerous / might get injured; 1(d)(i) any two from: 2 consuming, contaminated water or food / untreated water; (contaminated with) sewage / containing (cholera) bacteria; 1(d)(ii) boiling; 2 chlorination; 1(d)(iii) any two from: 2 improving sanitation; treatment of sewage; education campaigns / awareness; stated example of legislation e.g. on pollution control / water quality; 1(e)(i) 50% circled; 1 1(e)(ii) any two from: 2 data is only for one year; data is not for current year; risk may vary month to month / depend on season; risk may be different in within each area; does not say when mosquitos are active; doesn’t include standing water / breeding grounds; methods to reduce risk aren’t known e.g. vaccination / use of nets; doesn’t show settlement locations e.g. which area people are in; stated example of a limitation of data intervals e.g. 5–99 is broad; 1(e)(iii) max 4 from each strategy: 5 antimalarial drugs: benefits: work quickly; stop parasite multiplying / kill parasite; idea of protected all day / reduces number of people (getting) infected; limitations: expensive; short-term fix; not guaranteed; side-effects; still get bitten by mosquitos; must be taken in advance; lack of access to medical / limited availability for some countries; mosquito nets: benefits controls vector / stops mosquito bites; readily available; easy to use; can be used on door or windows; limitations: have to stay under them / mosquitoes can enter during entry or exit idea of not practical to use during day get damaged easily
Q2 · A reservoir supplies the population of Harare with fresh water
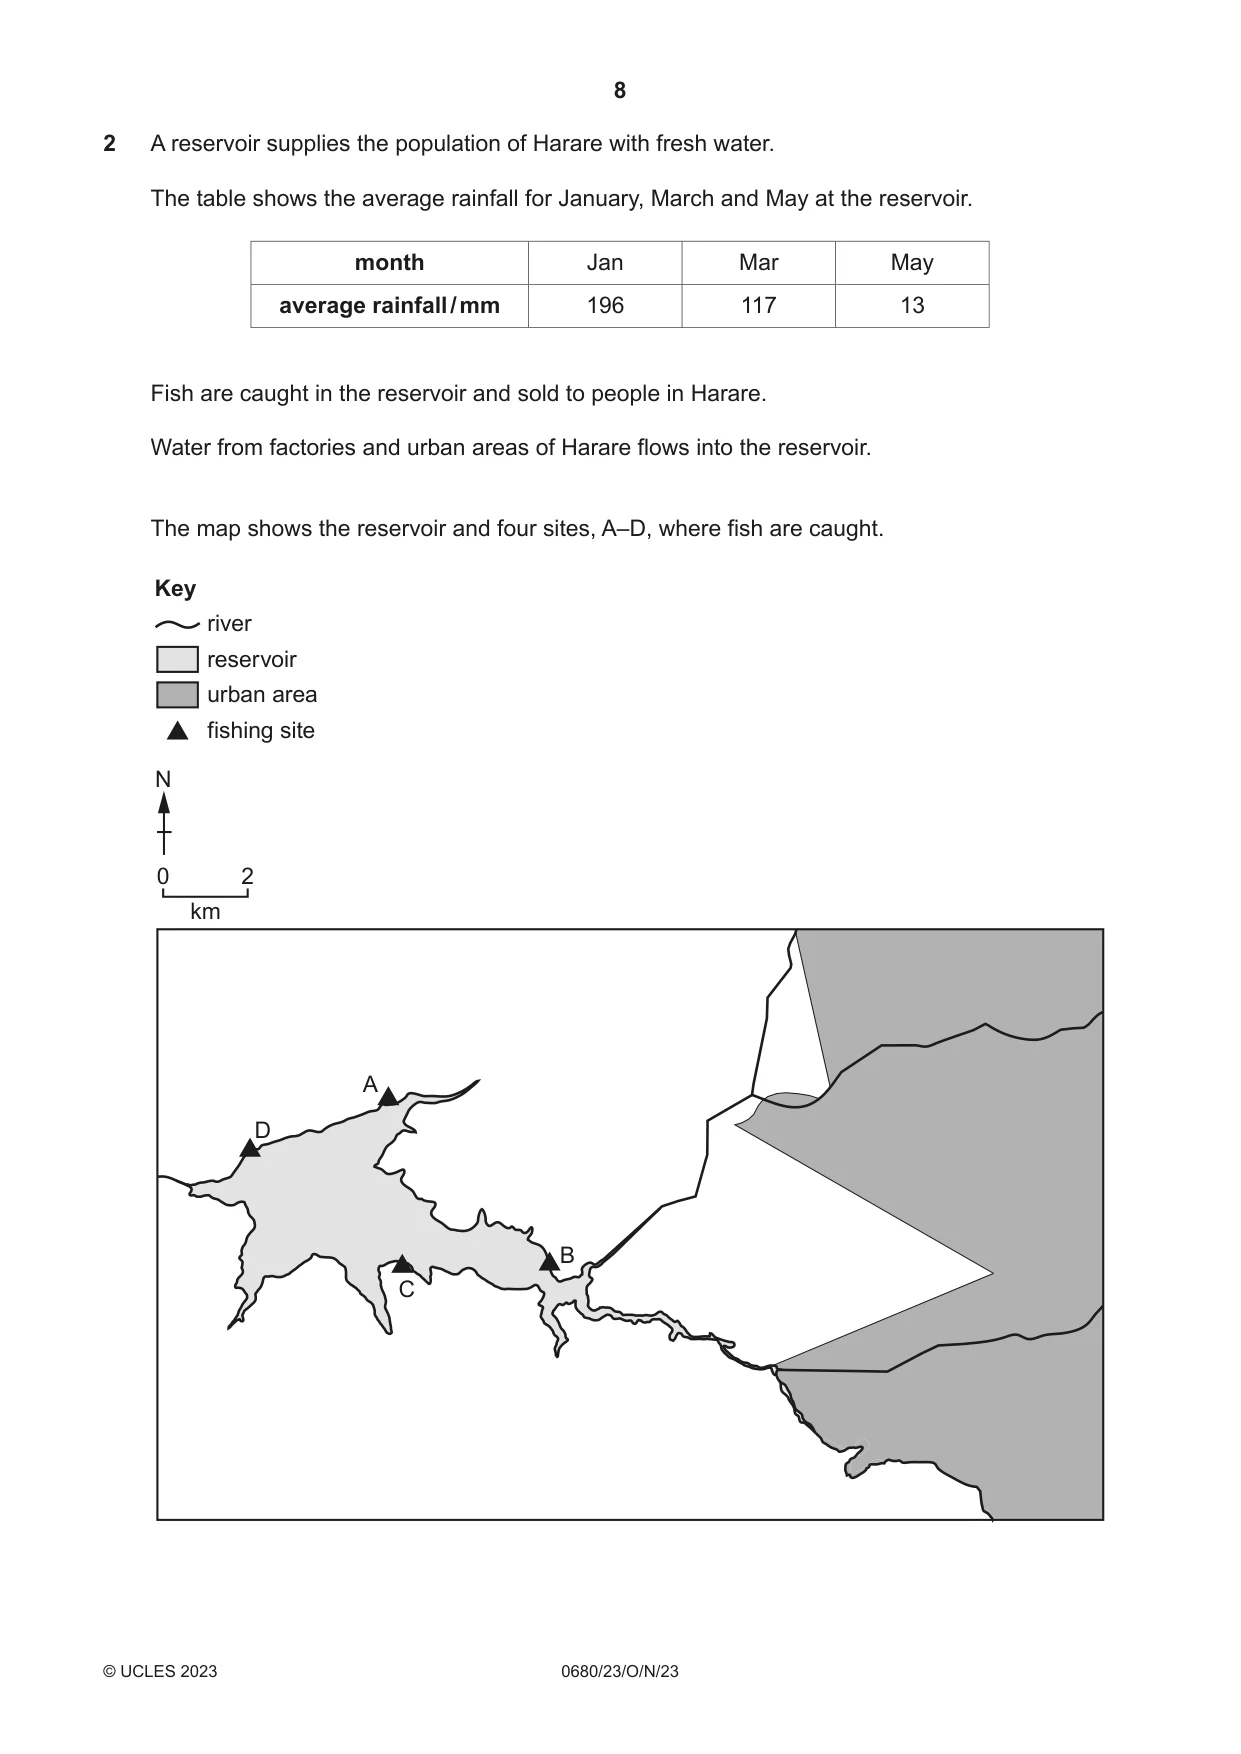
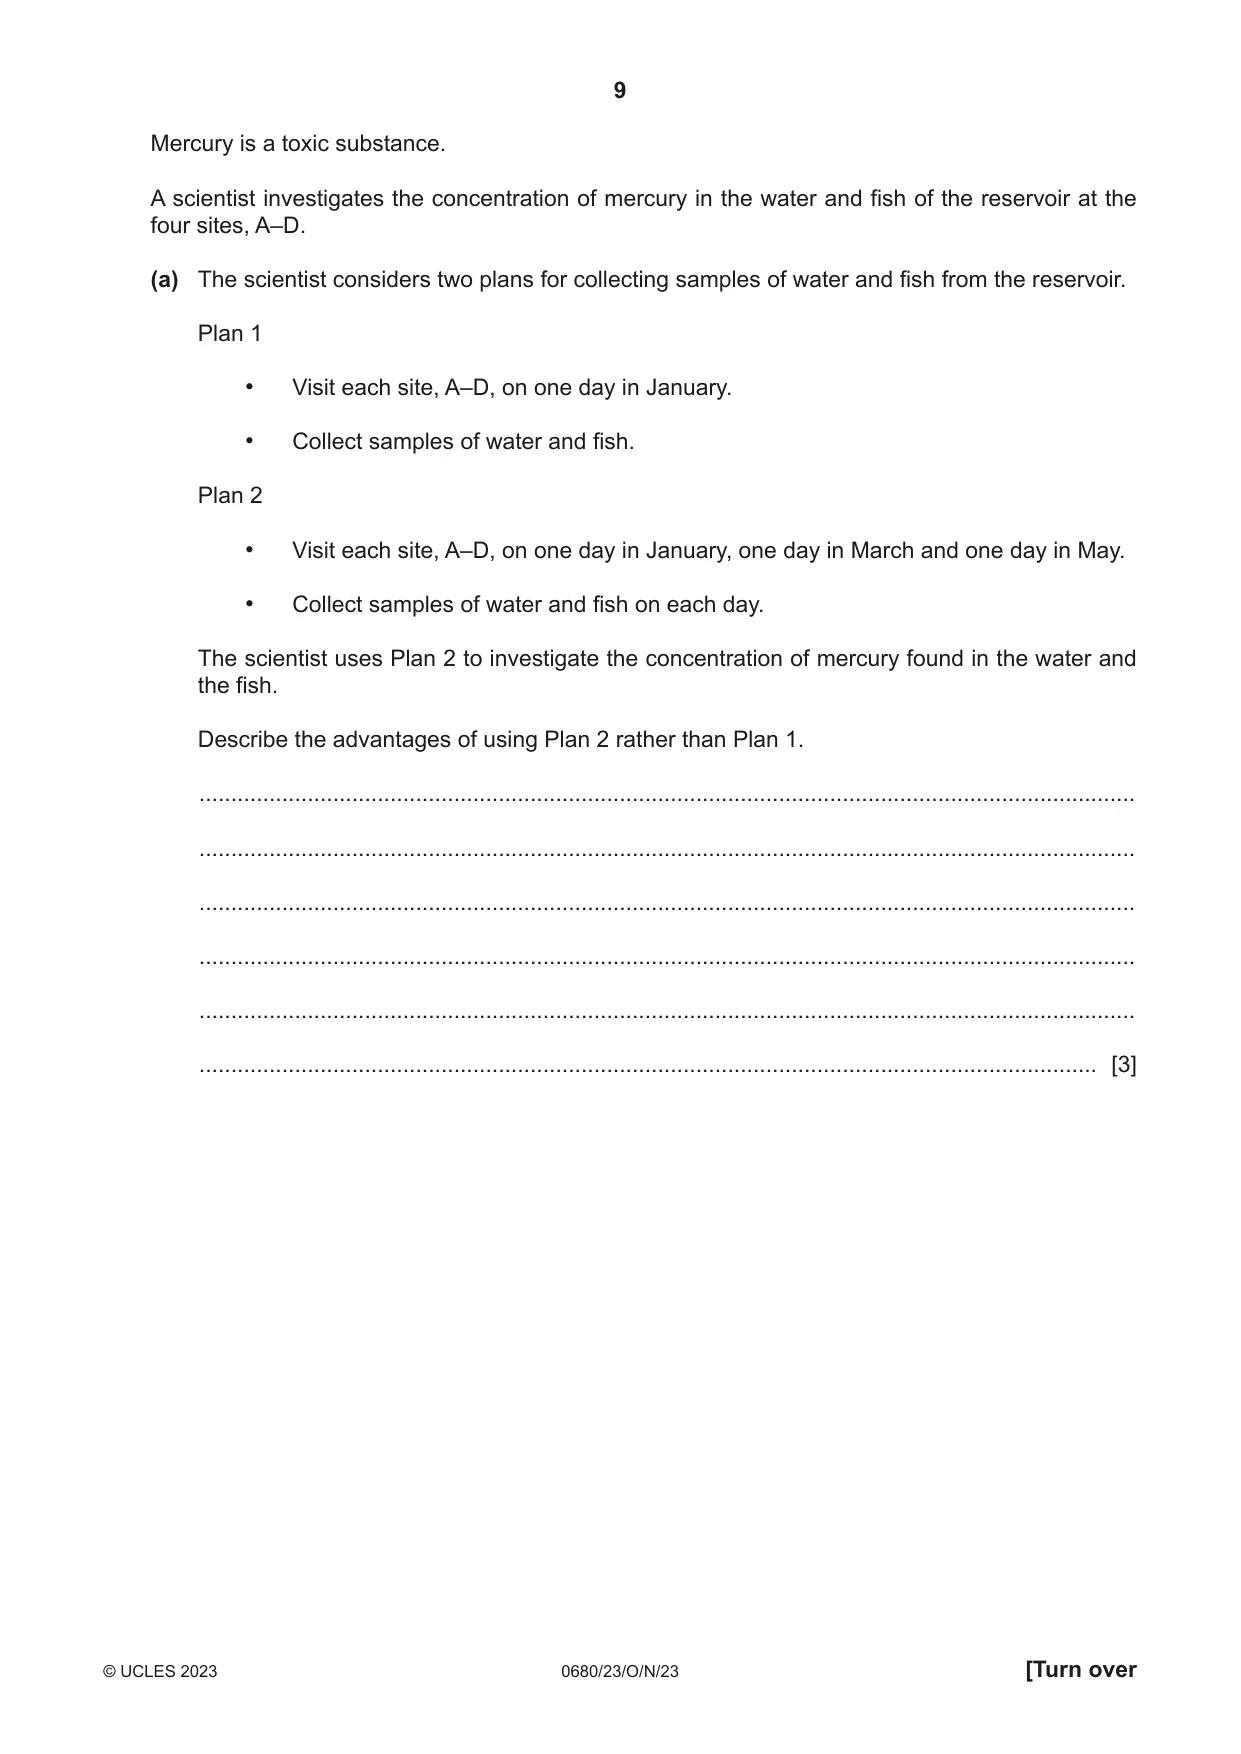
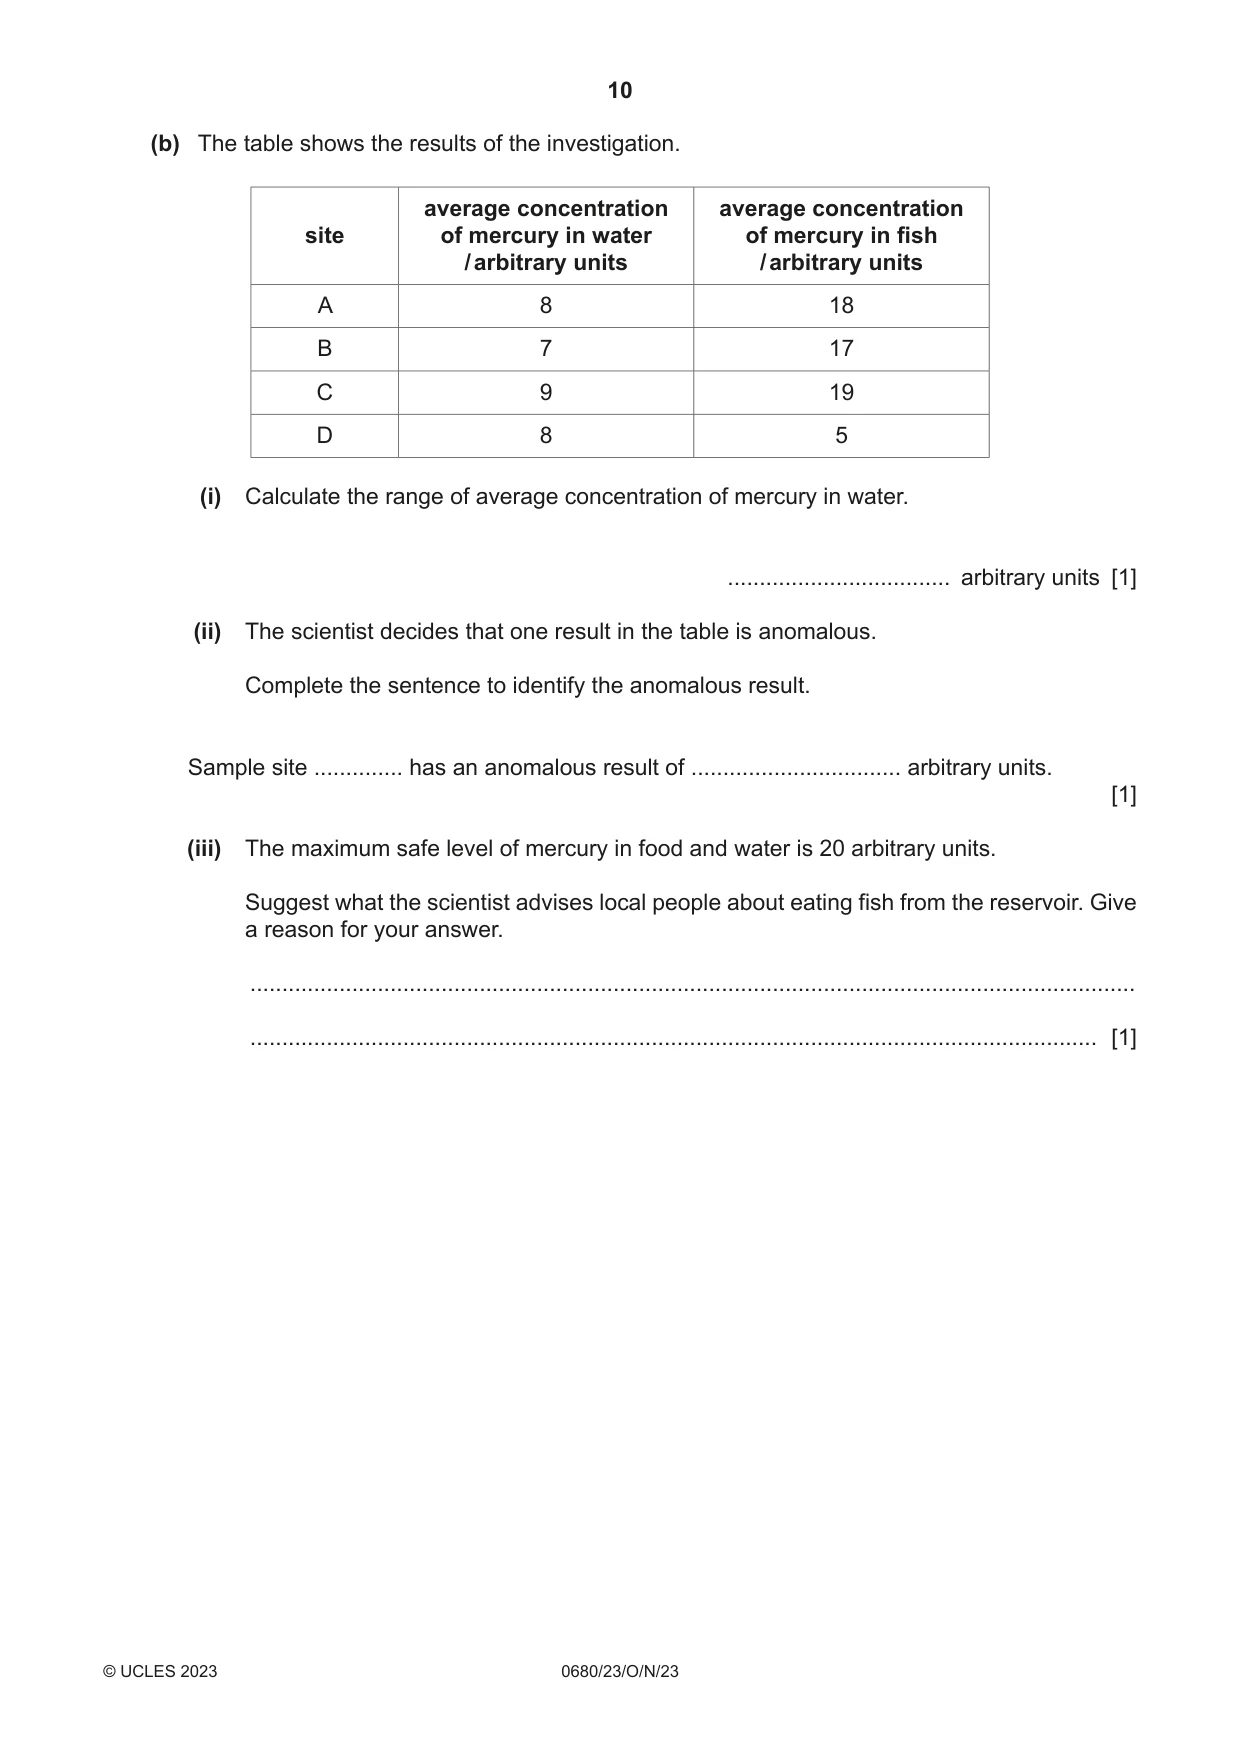
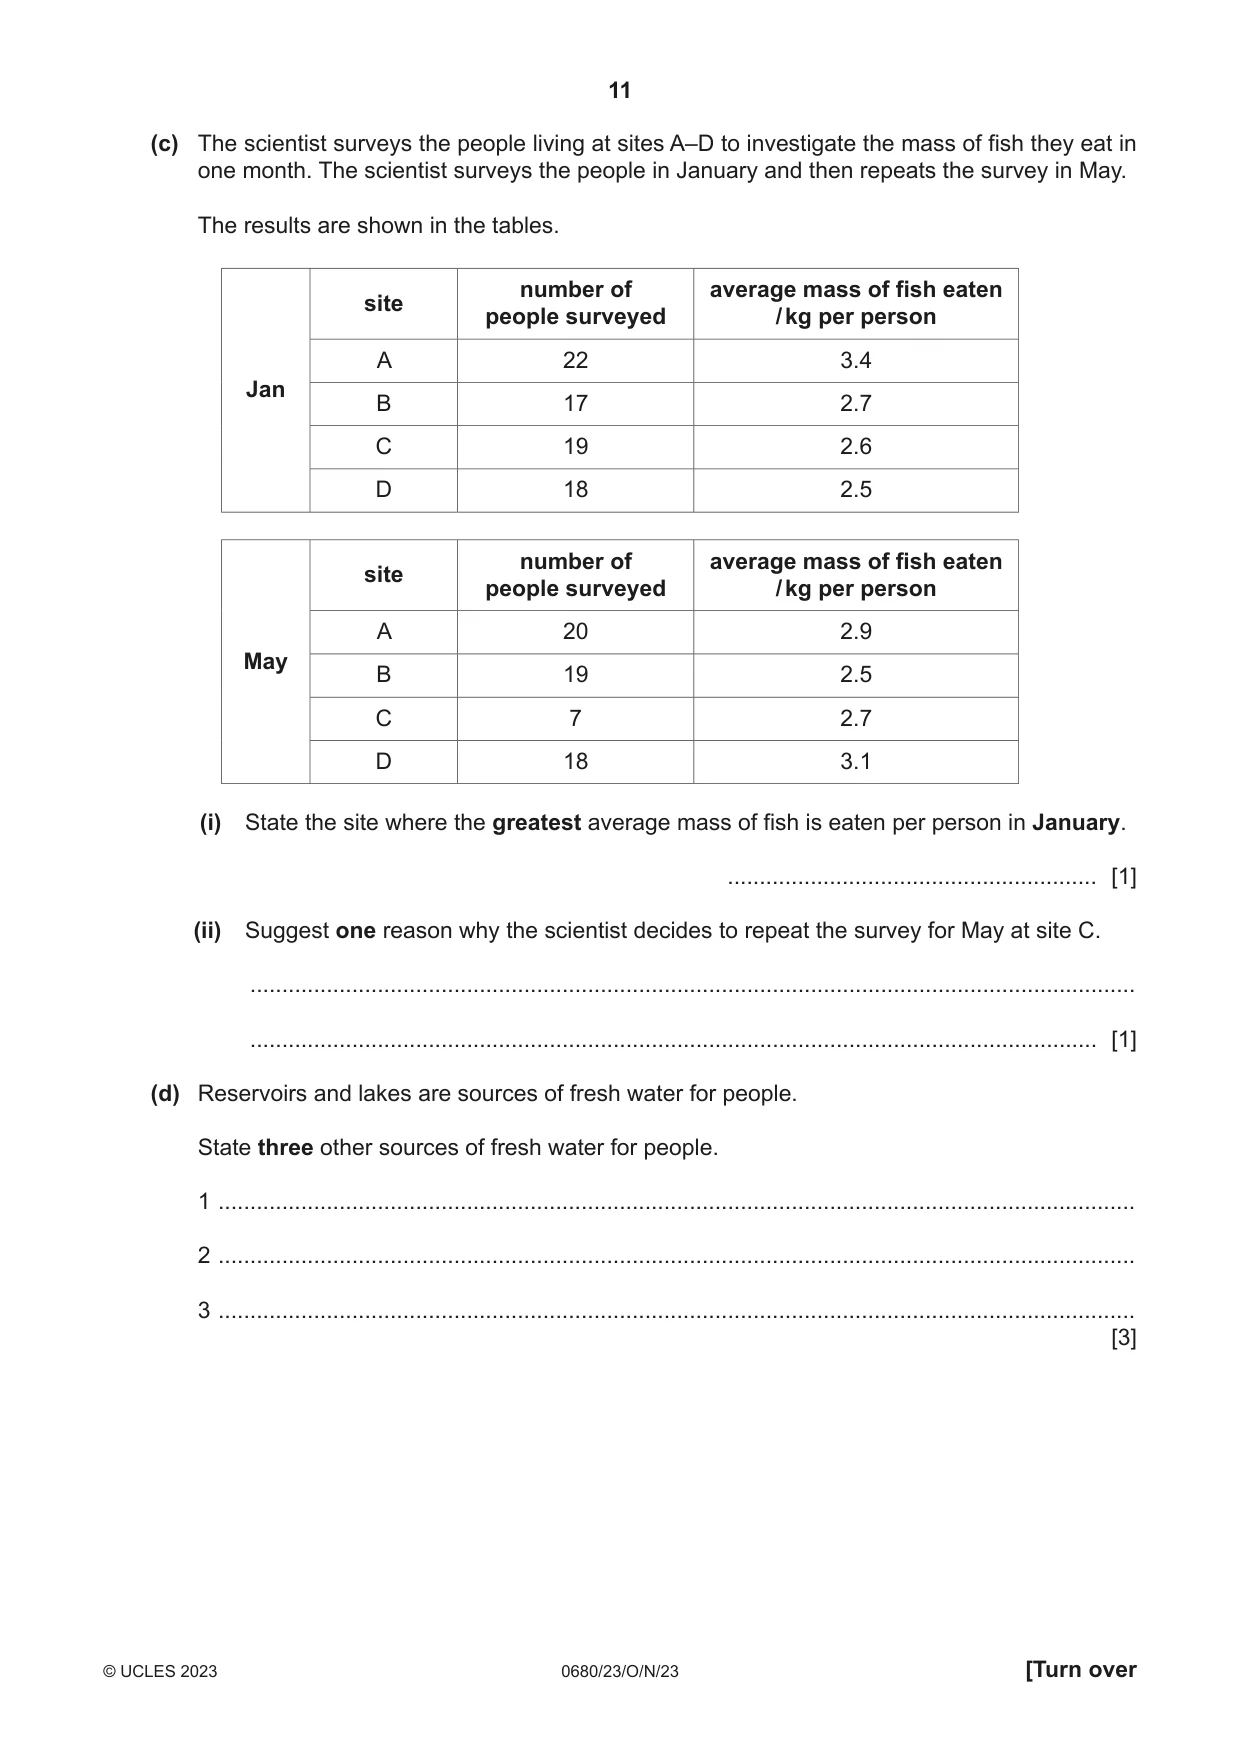
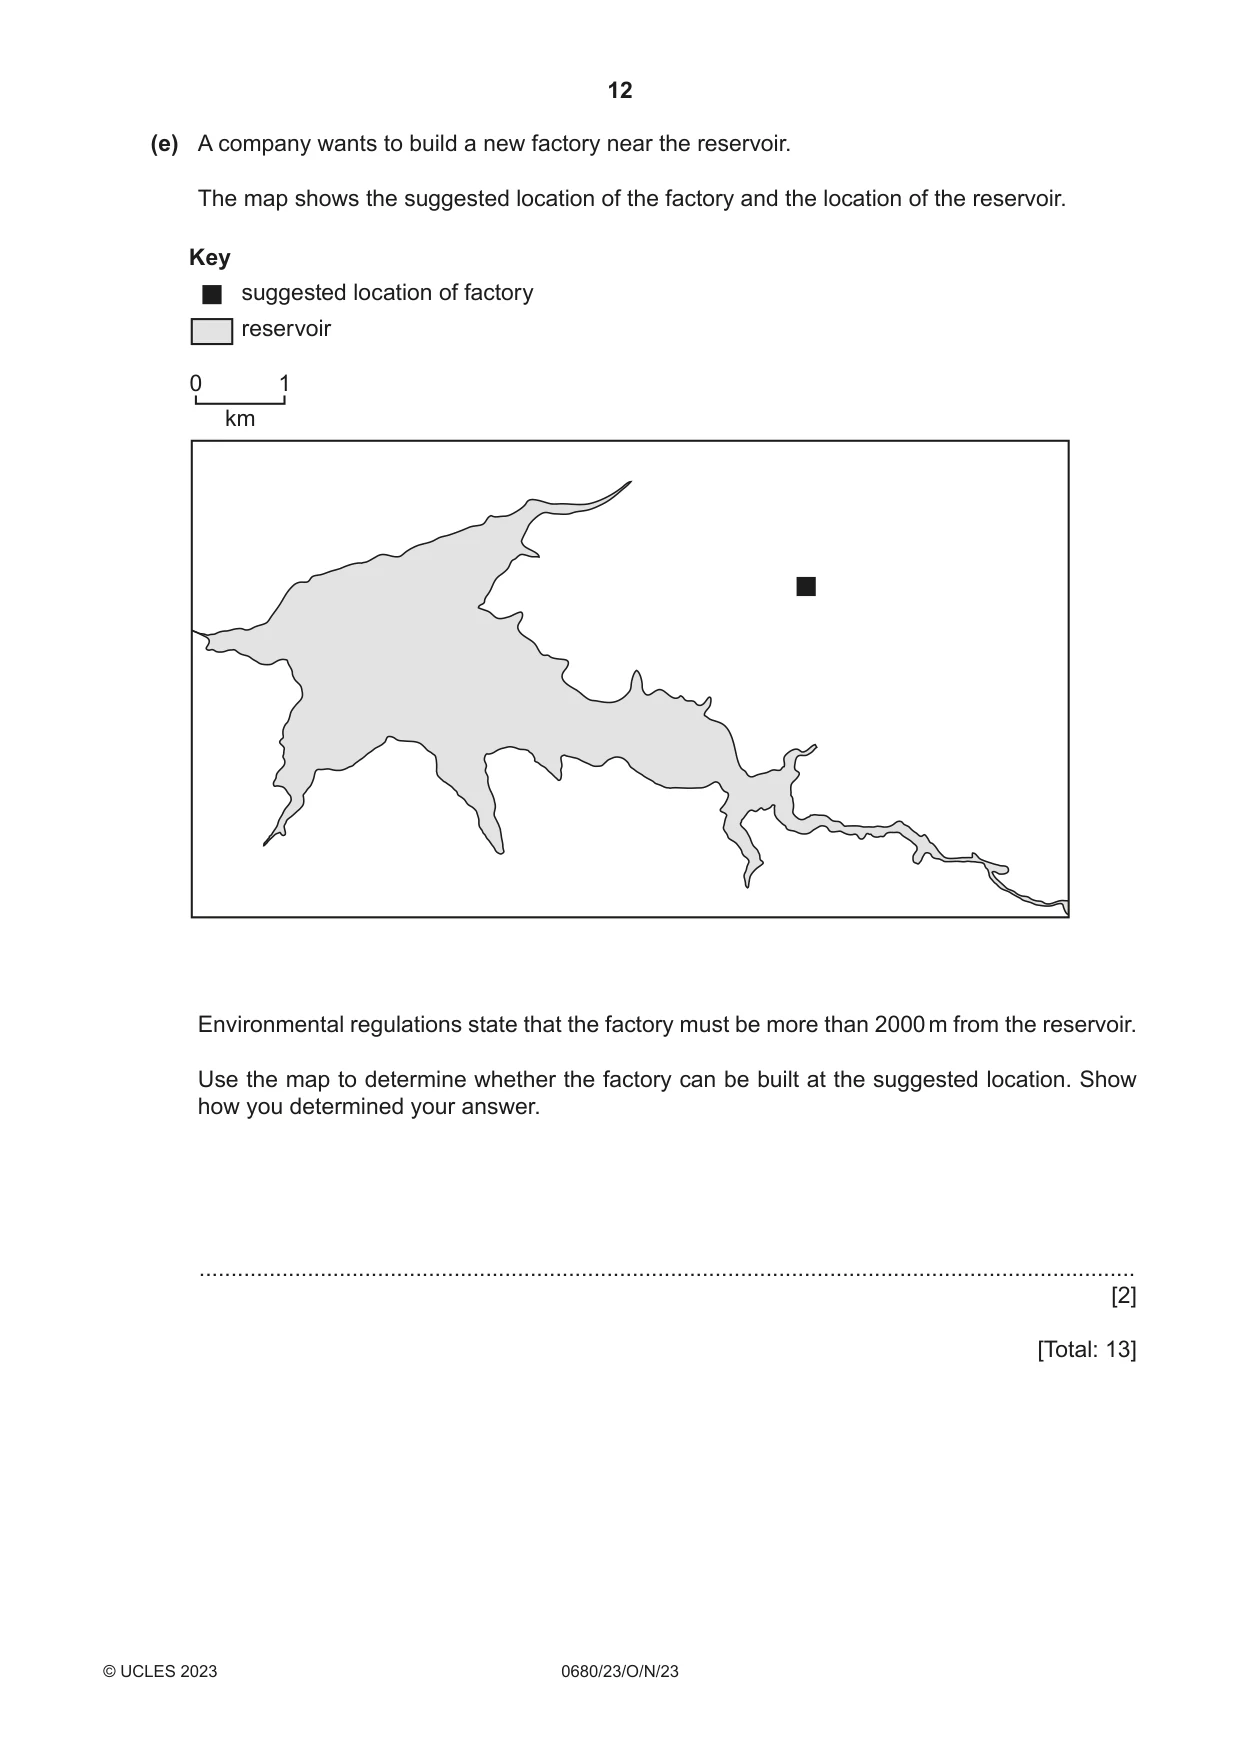
2 A reservoir supplies the population of Harare with fresh water. The table shows the average rainfall for January, March and May at the reservoir. month Jan Mar May average rainfall / mm 196 117 13 Fish are caught in the reservoir and sold to people in Harare. Water from factories and urban areas of Harare flows into the reservoir. The map shows the reservoir and four sites, A–D, where fish are caught. Key river reservoir urban area fishing site N 0 2 km A D B C Mercury is a toxic substance. A scientist investigates the concentration of mercury in the water and fish of the reservoir at the four sites, A–D. (a) The scientist considers two plans for collecting samples of water and fish from the reservoir. Plan 1 • Visit each site, A–D, on one day in January. • Collect samples of water and fish. Plan 2 • Visit each site, A–D, on one day in January, one day in March and one day in May. • Collect samples of water and fish on each day. The scientist uses Plan 2 to investigate the concentration of mercury found in the water and the fish. Describe the advantages of using Plan 2 rather than Plan 1. ................................................................................................................................................... ................................................................................................................................................... ................................................................................................................................................... ................................................................................................................................................... ................................................................................................................................................... ............................................................................................................................................. [3] (b) The table shows the results of the investigation. average concentration average concentration site of mercury in water of mercury in fish / arbitrary units / arbitrary units A 8 18 B 7 17 C 9 19 D 8 5 (i) Calculate the range of average concentration of mercury in water. ................................... arbitrary units [1] (ii) The scientist decides that one result in the table is anomalous. Complete the sentence to identify the anomalous result. Sample site .............. has an anomalous result of ................................. arbitrary units. [1] (iii) The maximum safe level of mercury in food and water is 20 arbitrary units. Suggest what the scientist advises local people about eating fish from the reservoir. Give a reason for your answer. ........................................................................................................................................... ..................................................................................................................................... [1] (c) The scientist surveys the people living at sites A–D to investigate the mass of fish they eat in one month. The scientist surveys the people in January and then repeats the survey in May. The results are shown in the tables. number of average mass of fish eaten site people surveyed / kg per person A 22 3.4 Jan B 17 2.7 C 19 2.6 D 18 2.5 number of average mass of fish eaten site people surveyed / kg per person A 20 2.9 May B 19 2.5 C 7 2.7 D 18 3.1 (i) State the site where the greatest average mass of fish is eaten per person in January. .......................................................... [1] (ii) Suggest one reason why the scientist decides to repeat the survey for May at site C. ........................................................................................................................................... ..................................................................................................................................... [1] (d) Reservoirs and lakes are sources of fresh water for people. State three other sources of fresh water for people. 1 ................................................................................................................................................ 2 ................................................................................................................................................ 3 ................................................................................................................................................ [3] (e) A company wants to build a new factory near the reservoir. The map shows the suggested location of the factory and the location of the reservoir. Key suggested location of factory reservoir 0 1 km Environmental regulations state that the factory must be more than 2000 m from the reservoir. Use the map to determine whether the factory can be built at the suggested location. Show how you determined your answer. ................................................................................................................................................... [2] [Total: 13]
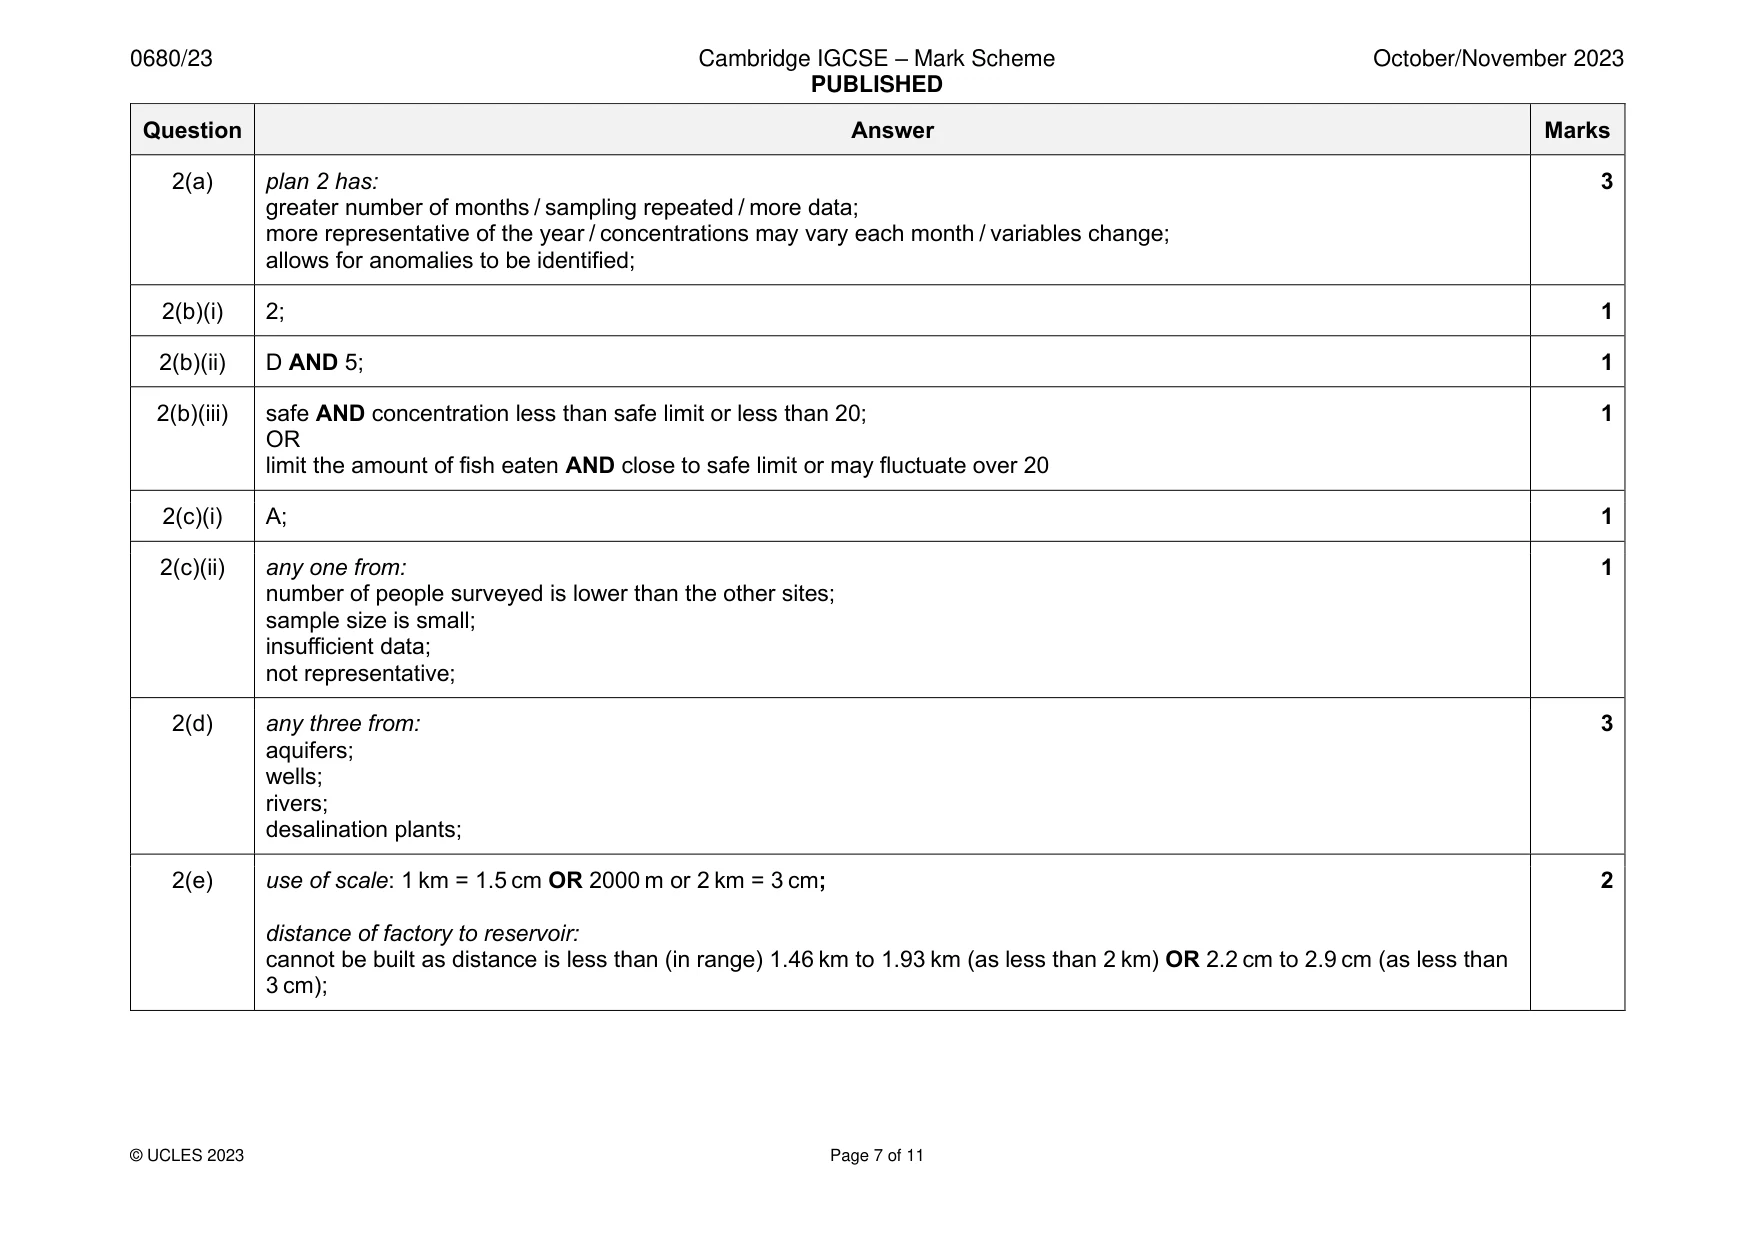
Mark scheme: 2(a) plan 2 has: 3 greater number of months / sampling repeated / more data; more representative of the year / concentrations may vary each month / variables change; allows for anomalies to be identified; 2(b)(i) 2; 1 2(b)(ii) D AND 5; 1 2(b)(iii) safe AND concentration less than safe limit or less than 20; 1 OR limit the amount of fish eaten AND close to safe limit or may fluctuate over 20 2(c)(i) A; 1 2(c)(ii) any one from: 1 number of people surveyed is lower than the other sites; sample size is small; insufficient data; not representative; 2(d) any three from: 3 aquifers; wells; rivers; desalination plants; 2(e) use of scale: 1 km = 1.5 cm OR 2000 m or 2 km = 3 cm; 2 distance of factory to reservoir: cannot be built as distance is less than (in range) 1.46 km to 1.93 km (as less than 2 km) OR 2.2 cm to 2.9 cm (as less than 3 cm);
Q3 · The supply of electricity in Zimbabwe comes from one hydroelectric power station and four…
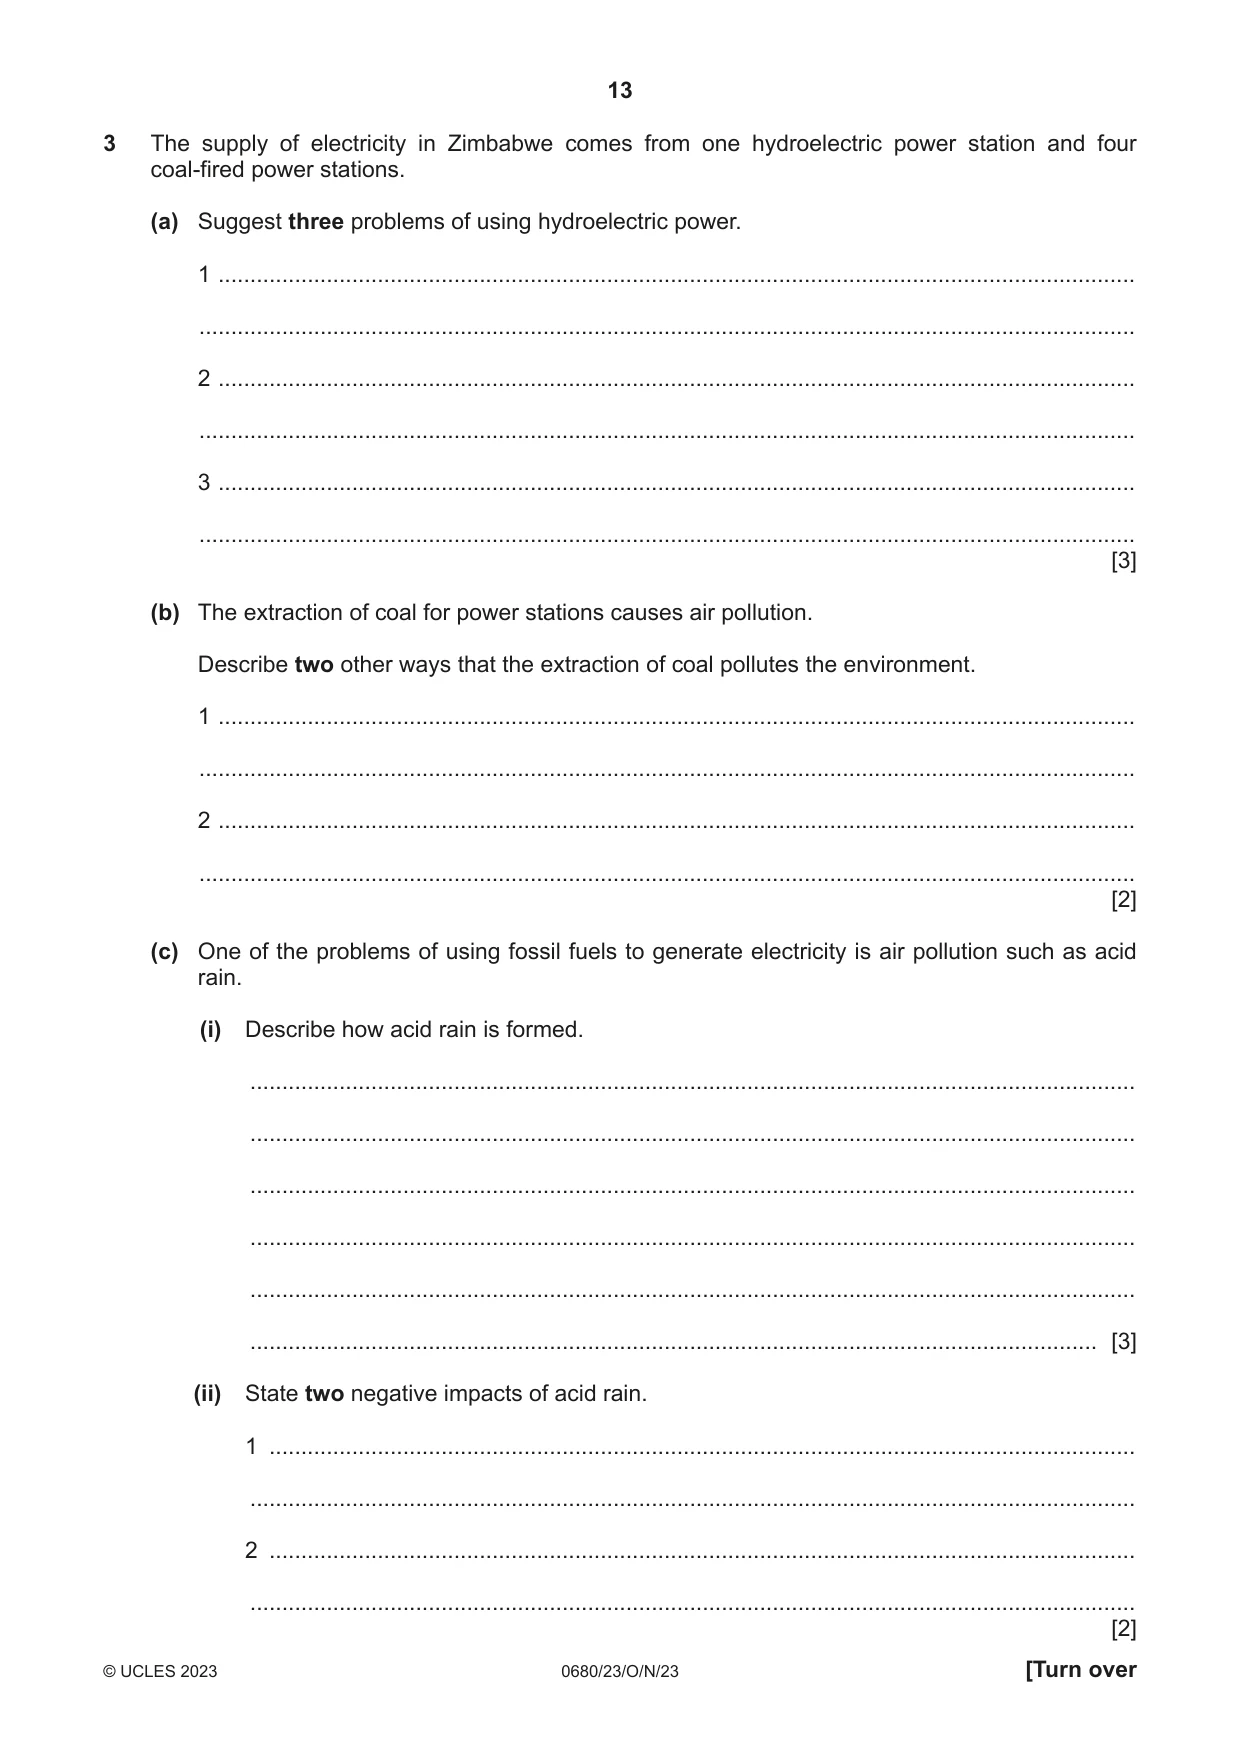
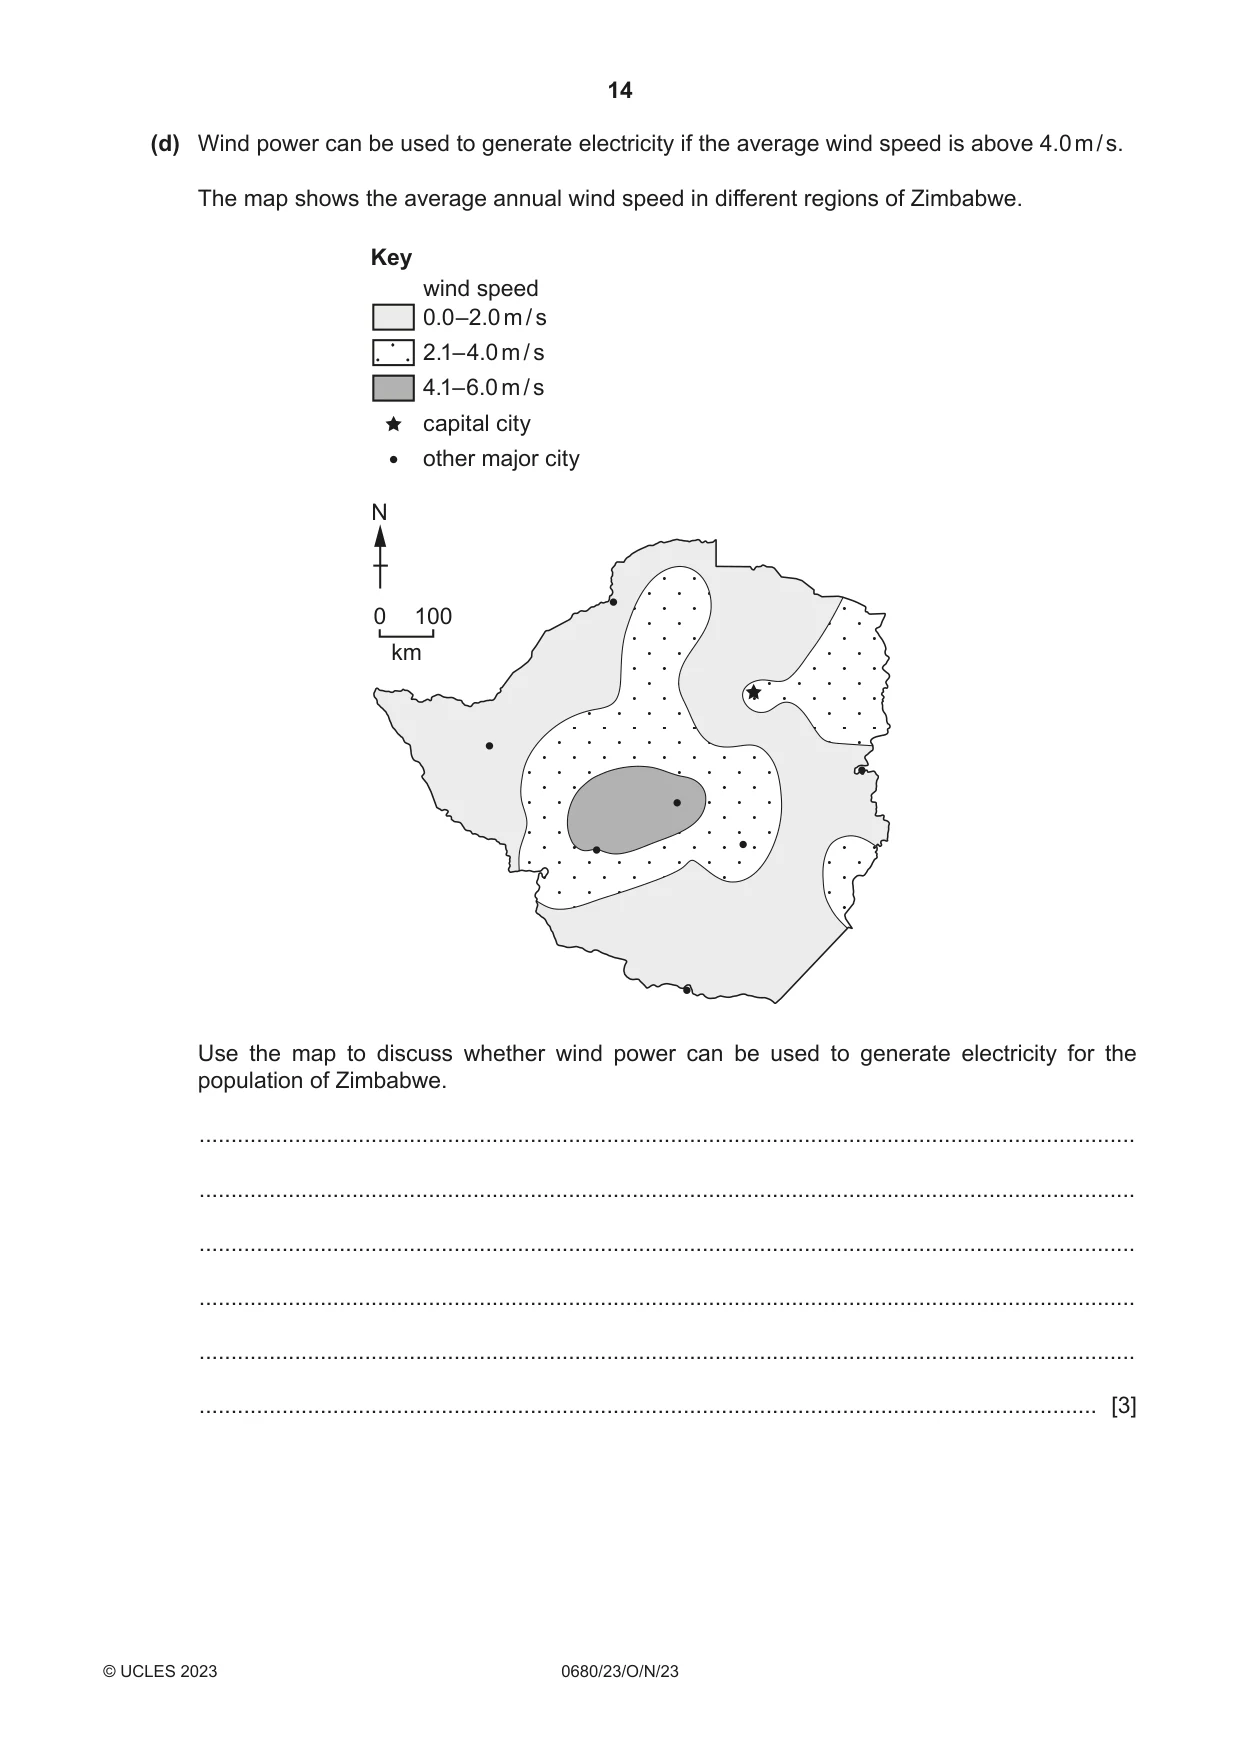
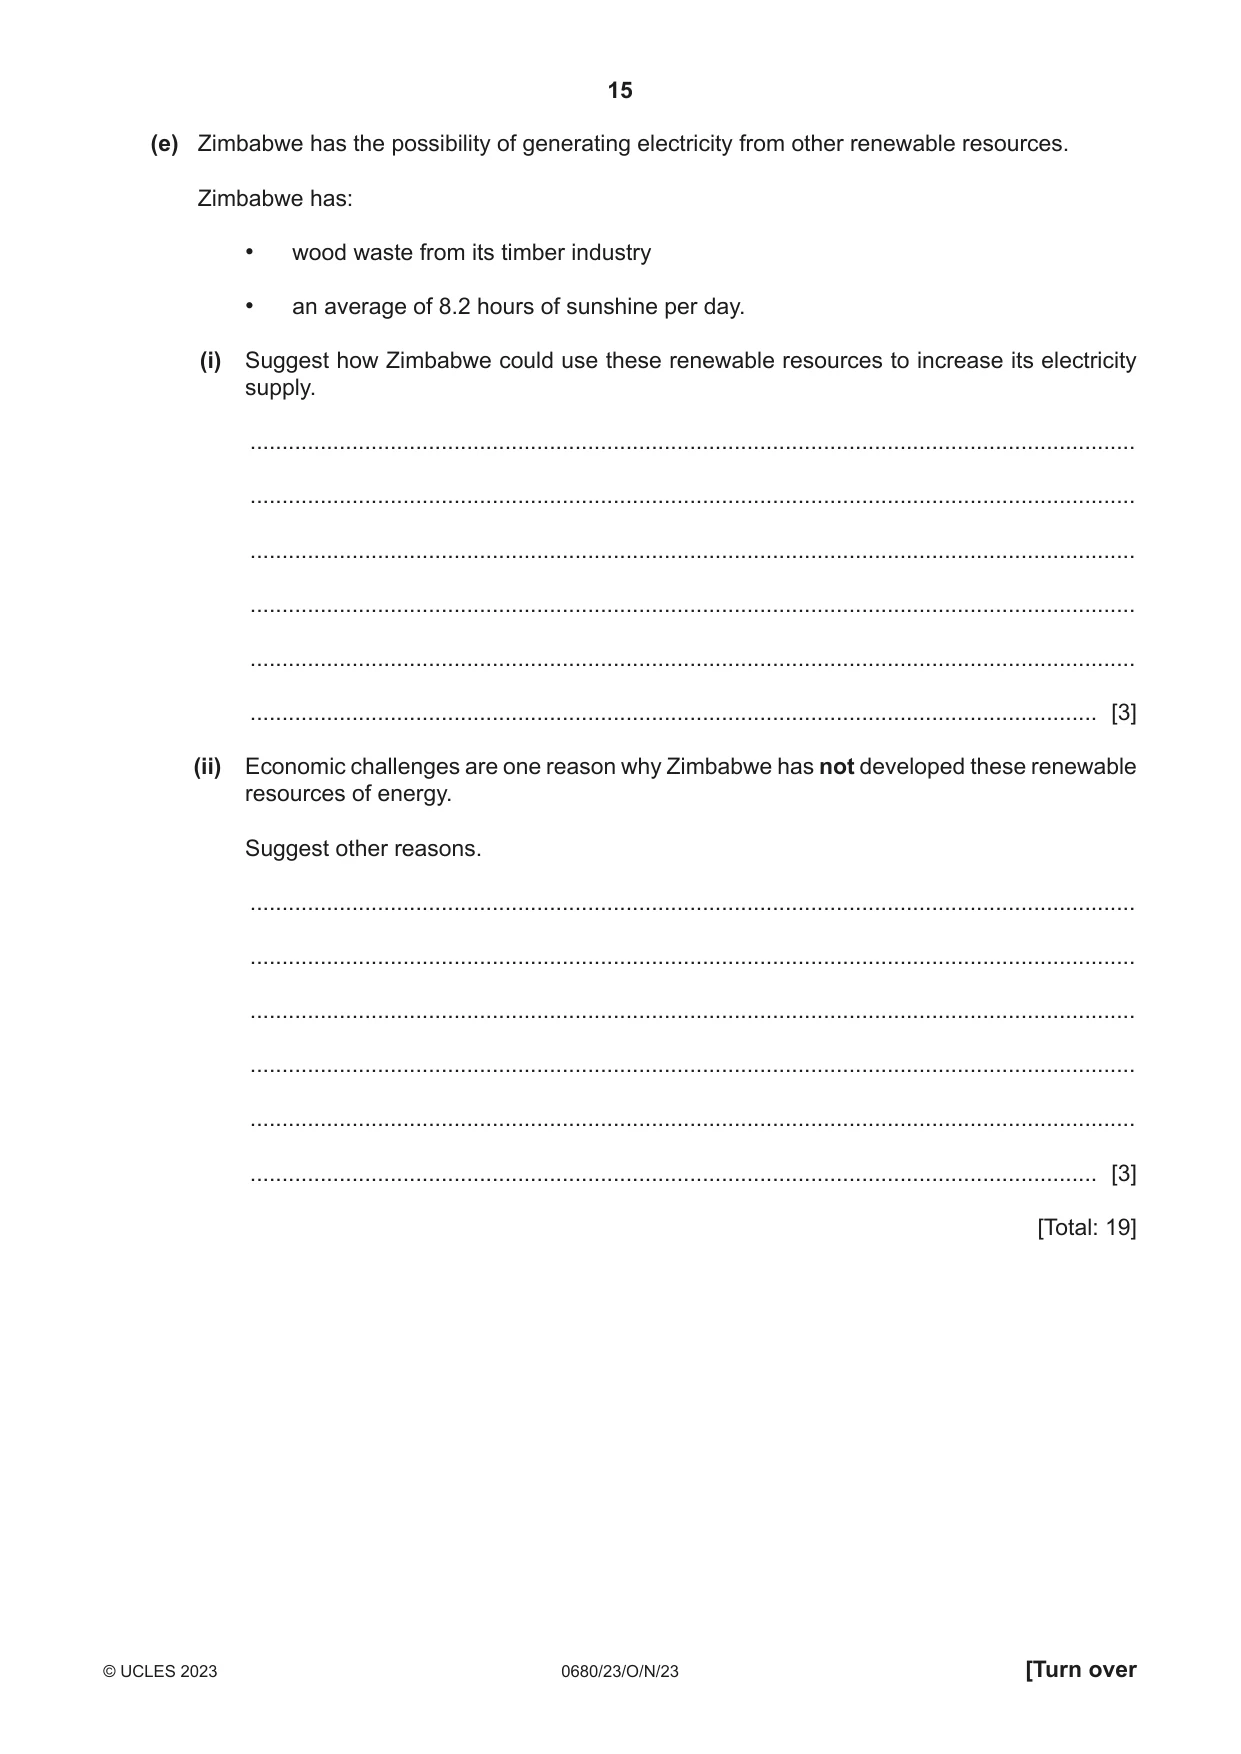
3 The supply of electricity in Zimbabwe comes from one hydroelectric power station and four coal-fired power stations. (a) Suggest three problems of using hydroelectric power. 1 ................................................................................................................................................ ................................................................................................................................................... 2 ................................................................................................................................................ ................................................................................................................................................... 3 ................................................................................................................................................ ................................................................................................................................................... [3] (b) The extraction of coal for power stations causes air pollution. Describe two other ways that the extraction of coal pollutes the environment. 1 ................................................................................................................................................ ................................................................................................................................................... 2 ................................................................................................................................................ ................................................................................................................................................... [2] (c) One of the problems of using fossil fuels to generate electricity is air pollution such as acid rain. (i) Describe how acid rain is formed. ........................................................................................................................................... ........................................................................................................................................... ........................................................................................................................................... ........................................................................................................................................... ........................................................................................................................................... ..................................................................................................................................... [3] (ii) State two negative impacts of acid rain. 1 ........................................................................................................................................ ........................................................................................................................................... 2 ........................................................................................................................................ ........................................................................................................................................... [2] (d) Wind power can be used to generate electricity if the average wind speed is above 4.0 m / s. The map shows the average annual wind speed in different regions of Zimbabwe. Key wind speed 0.0–2.0 m / s 2.1–4.0 m / s 4.1–6.0 m / s capital city other major city N 0 100 km Use the map to discuss whether wind power can be used to generate electricity for the population of Zimbabwe. ................................................................................................................................................... ................................................................................................................................................... ................................................................................................................................................... ................................................................................................................................................... ................................................................................................................................................... ............................................................................................................................................. [3] (e) Zimbabwe has the possibility of generating electricity from other renewable resources. Zimbabwe has: • wood waste from its timber industry • an average of 8.2 hours of sunshine per day. (i) Suggest how Zimbabwe could use these renewable resources to increase its electricity supply. ........................................................................................................................................... ........................................................................................................................................... ........................................................................................................................................... ........................................................................................................................................... ........................................................................................................................................... ..................................................................................................................................... [3] (ii) Economic challenges are one reason why Zimbabwe has not developed these renewable resources of energy. Suggest other reasons. ........................................................................................................................................... ........................................................................................................................................... ........................................................................................................................................... ........................................................................................................................................... ........................................................................................................................................... ..................................................................................................................................... [3] [Total: 19]
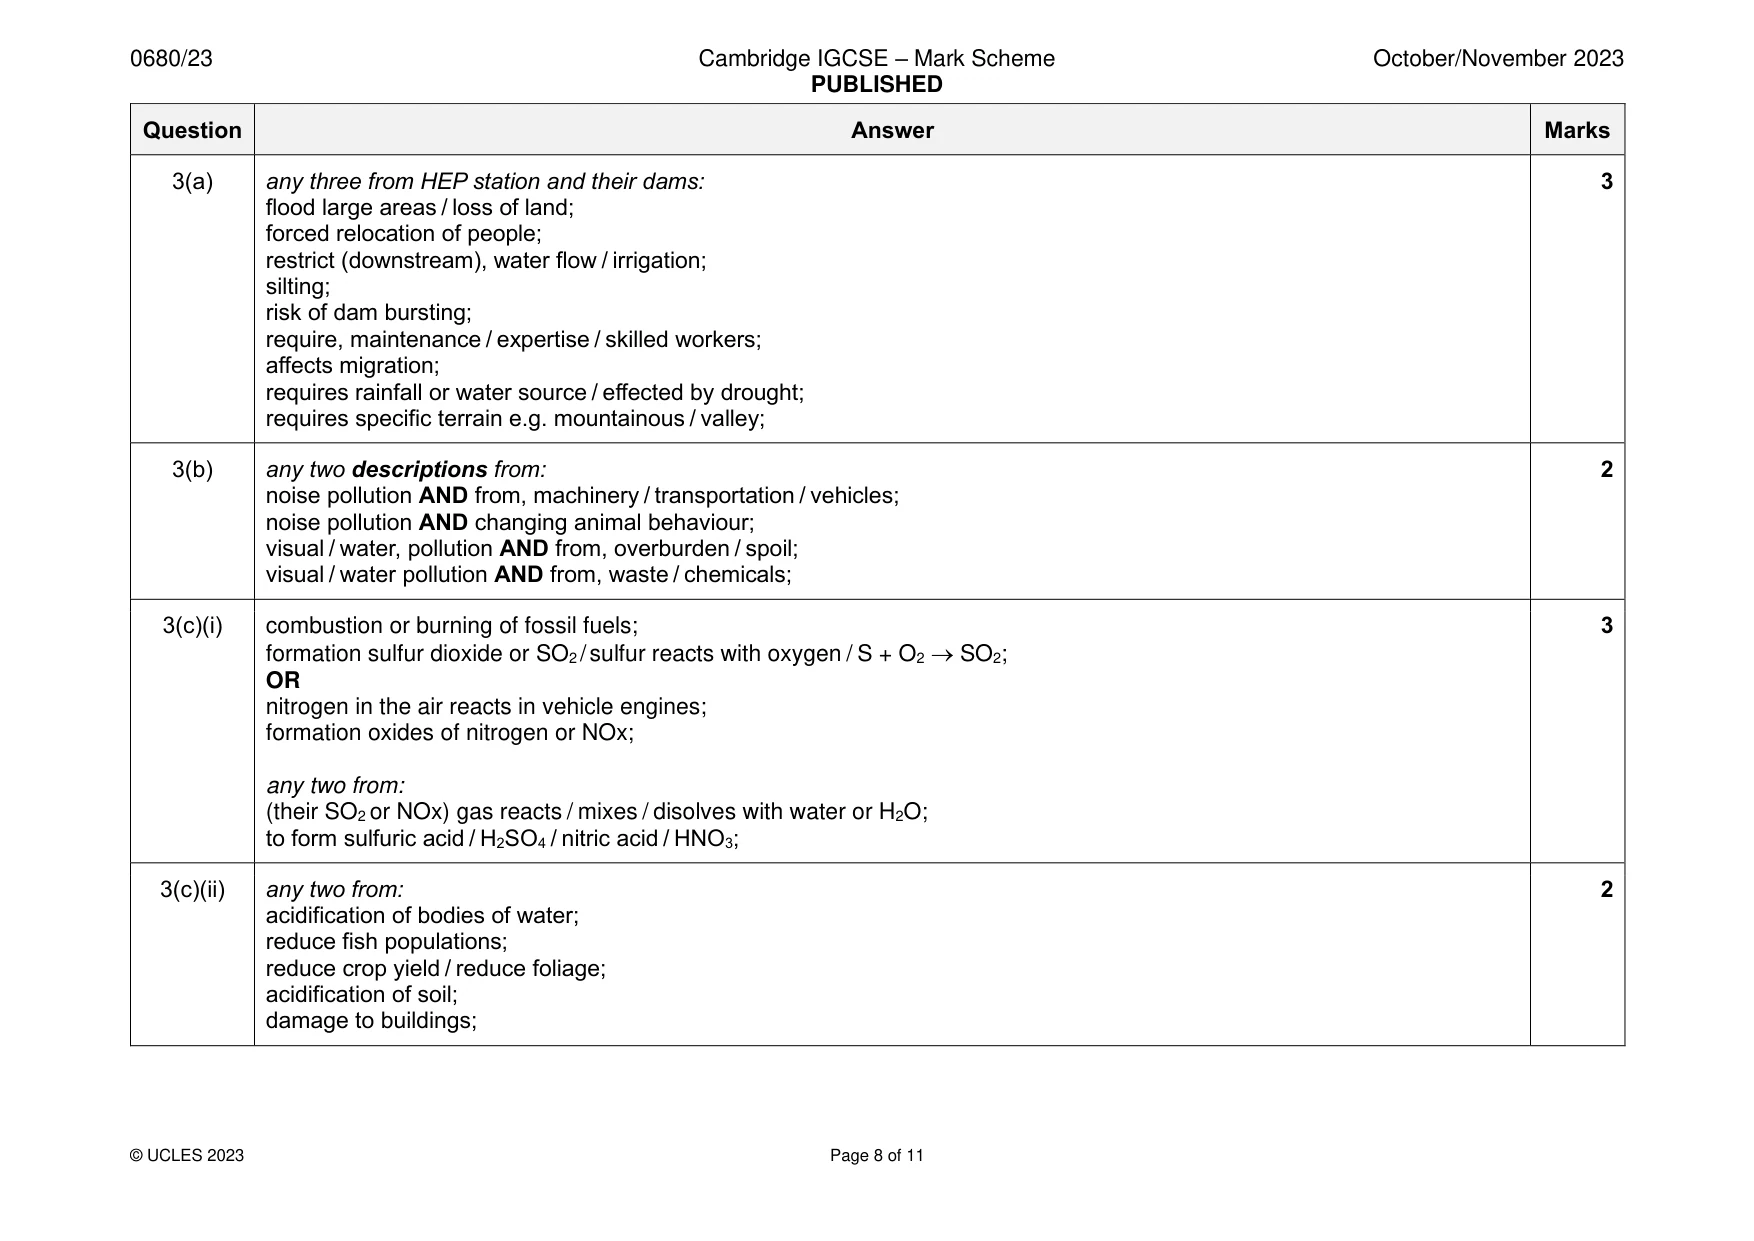
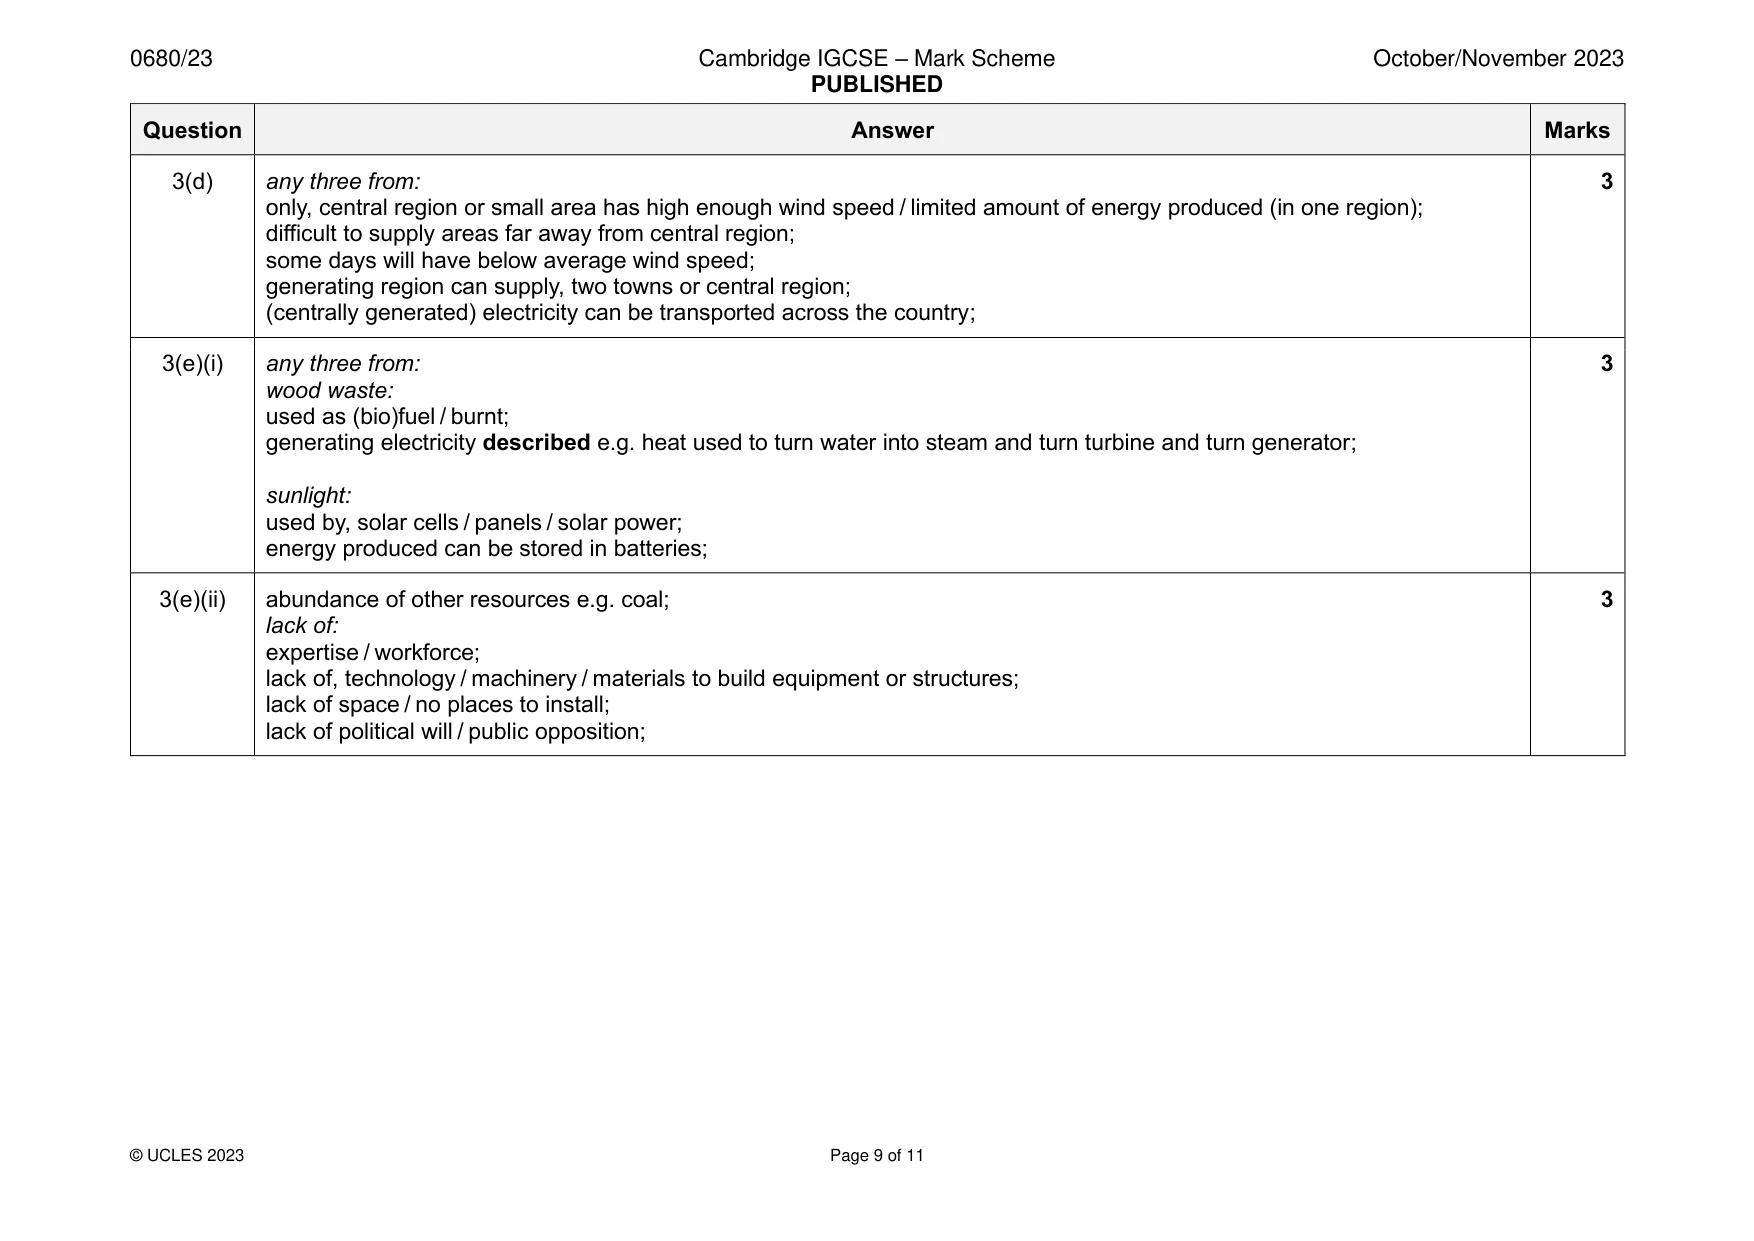
Mark scheme: 3(a) any three from HEP station and their dams: 3 flood large areas / loss of land; forced relocation of people; restrict (downstream), water flow / irrigation; silting; risk of dam bursting; require, maintenance / expertise / skilled workers; affects migration; requires rainfall or water source / effected by drought; requires specific terrain e.g. mountainous / valley; 3(b) any two descriptions from: 2 noise pollution AND from, machinery / transportation / vehicles; noise pollution AND changing animal behaviour; visual / water, pollution AND from, overburden / spoil; visual / water pollution AND from, waste / chemicals; 3(c)(i) combustion or burning of fossil fuels; 3 formation sulfur dioxide or SO2 / sulfur reacts with oxygen / S + O2 → SO2; OR nitrogen in the air reacts in vehicle engines; formation oxides of nitrogen or NOx; any two from: (their SO2 or NOx) gas reacts / mixes / disolves with water or H2O; to form sulfuric acid / H2SO4 / nitric acid / HNO3; 3(c)(ii) any two from: 2 acidification of bodies of water; reduce fish populations; reduce crop yield / reduce foliage; acidification of soil; damage to buildings; 3(d) any three from: 3 only, central region or small area has high enough wind speed / limited amount of energy produced (in one region); difficult to supply areas far away from central region; some days will have below average wind speed; generating region can supply, two towns or central region; (centrally generated) electricity can be transported across the country; 3(e)(i) any three from: 3 wood waste: used as (bio)fuel / burnt; generating electricity described e.g. heat used to turn water into steam and turn turbine and turn generator; sunlight: used by, solar cells / panels / solar power; energy produced can be stored in batteries; 3(e)(ii) abundance of other resources e.g. coal; 3 lack of: expertise / workforce; lack of, technology / machinery / materials to build equipment or structures; lack of space / no places to install; lack of political will / public opposition;
Q4 · The main crops grown by Zimbabwe’s commercial farmers are sugar cane, maize, cassava and…
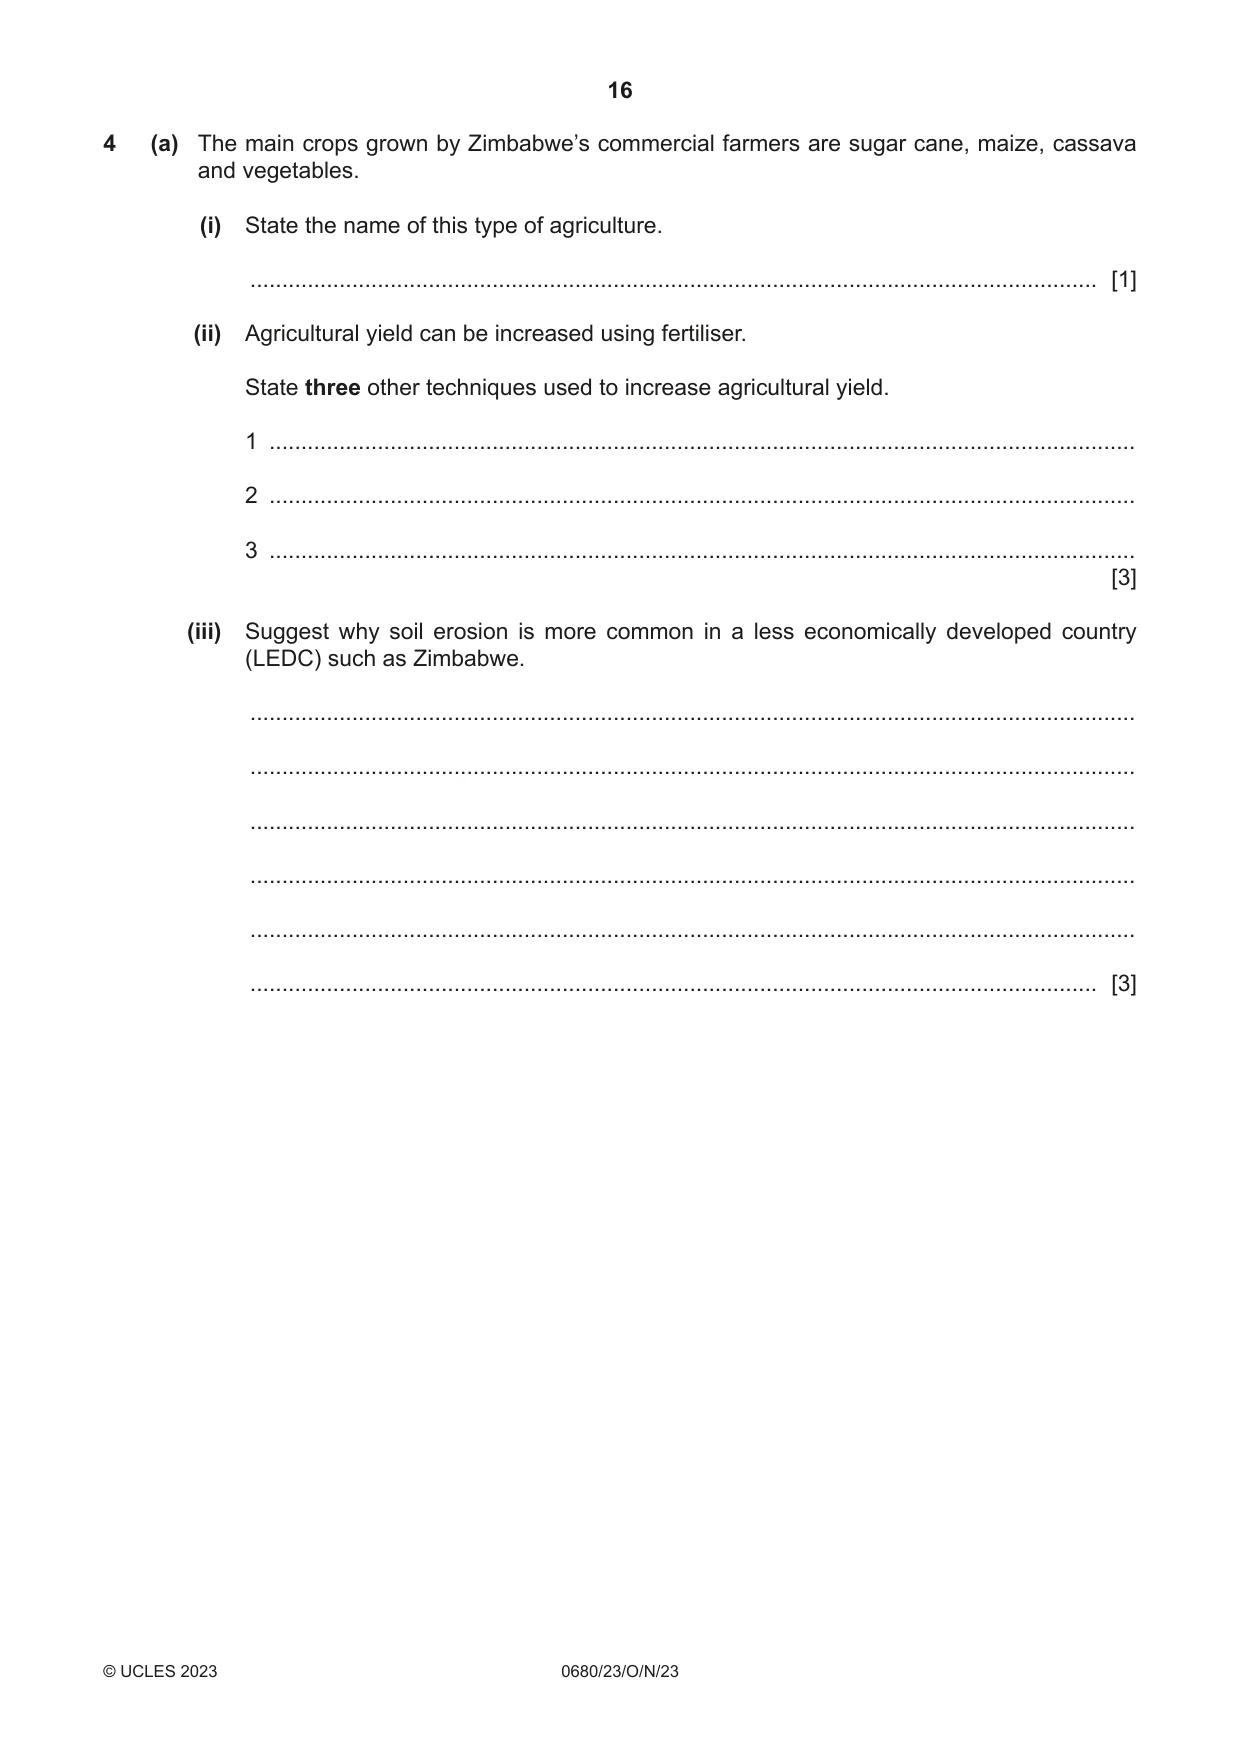
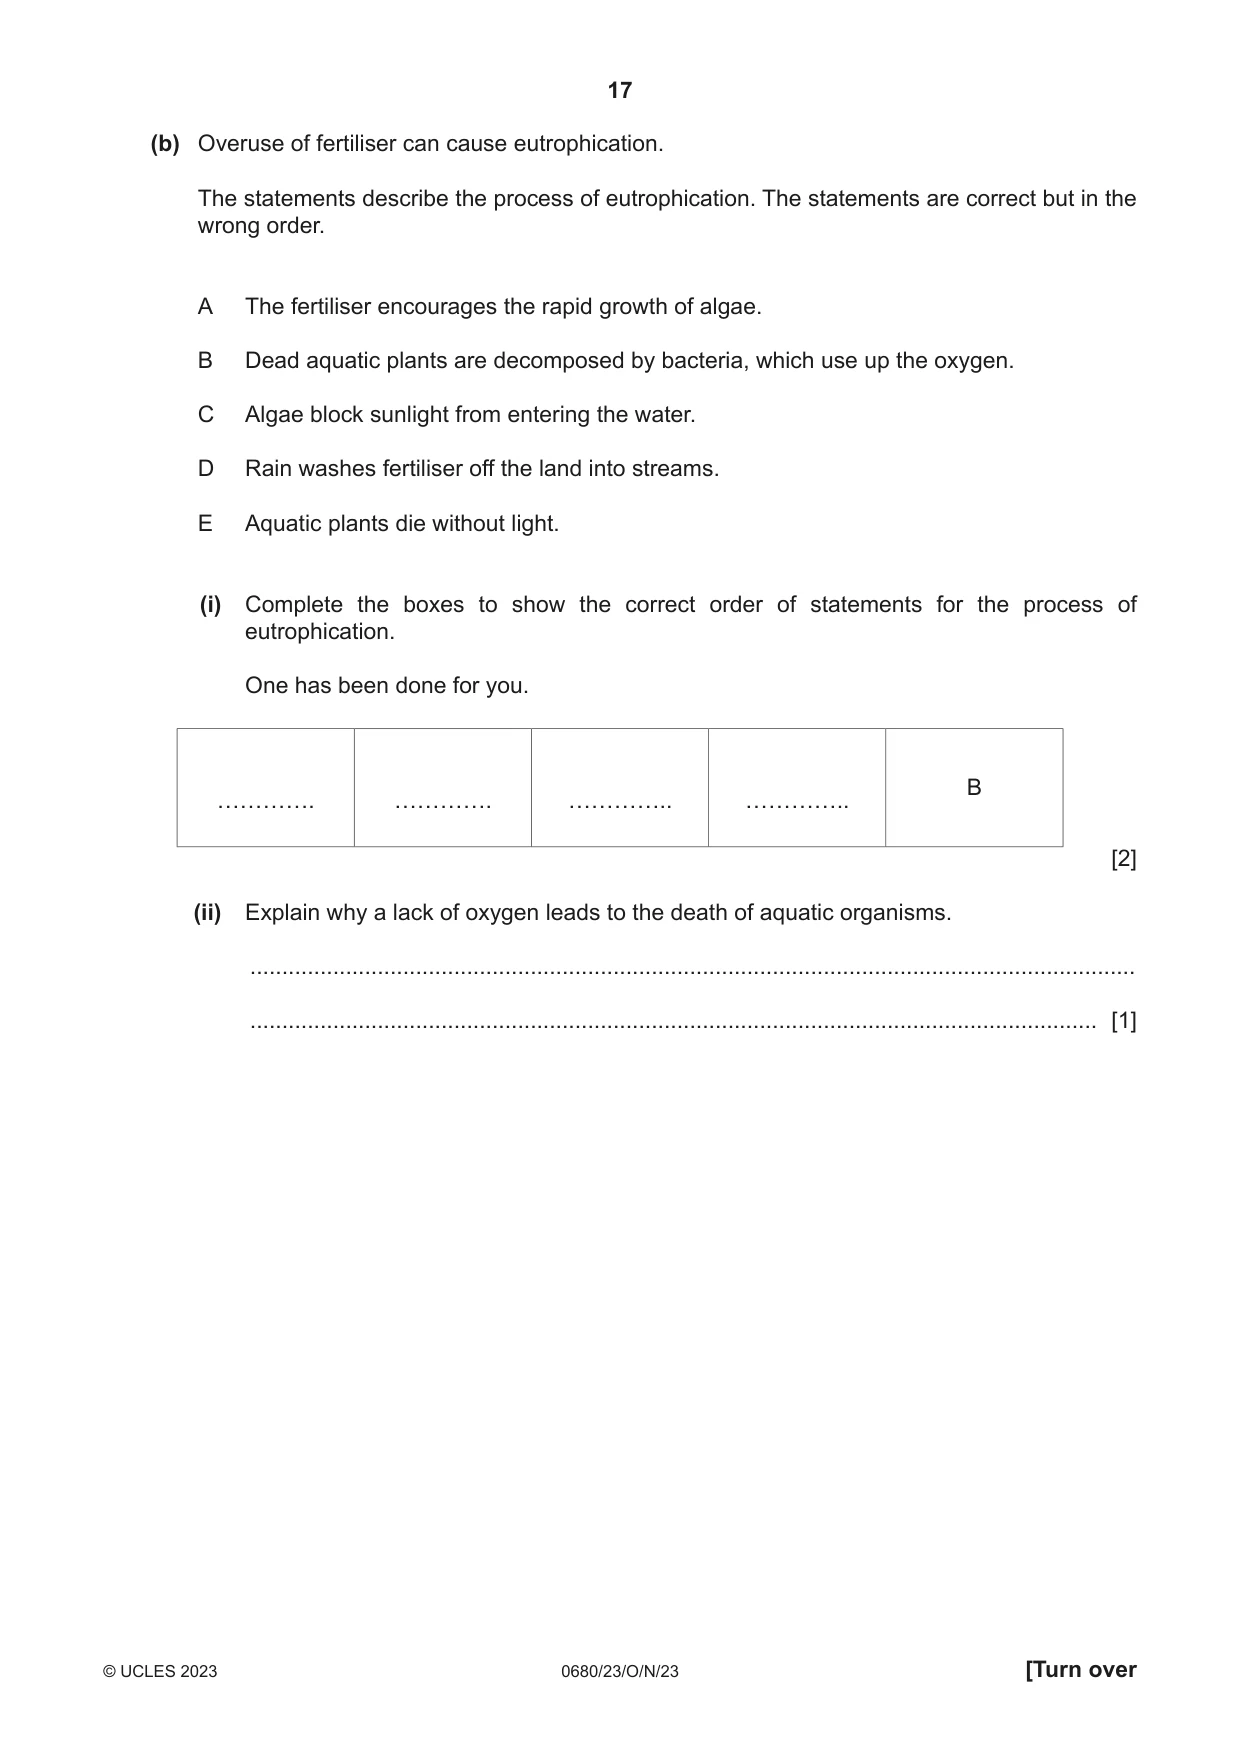
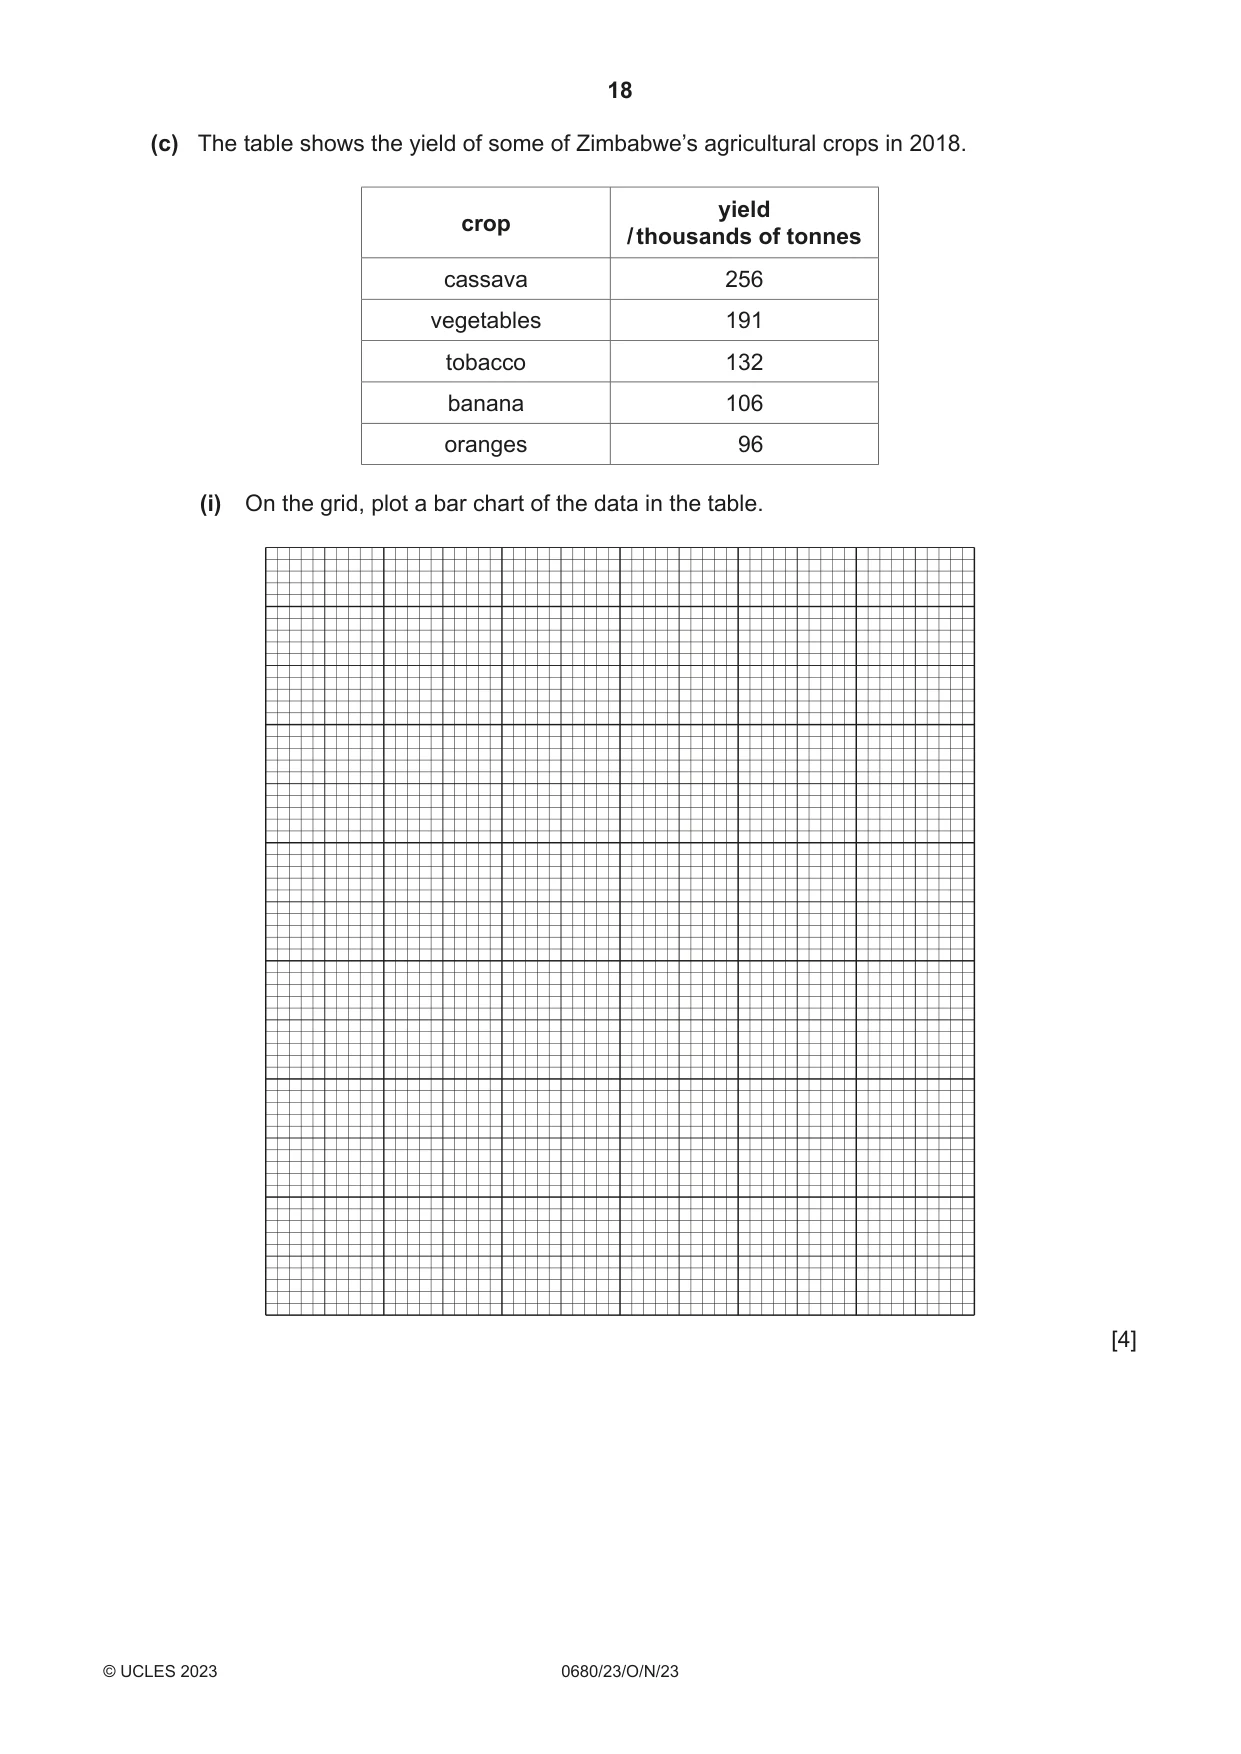
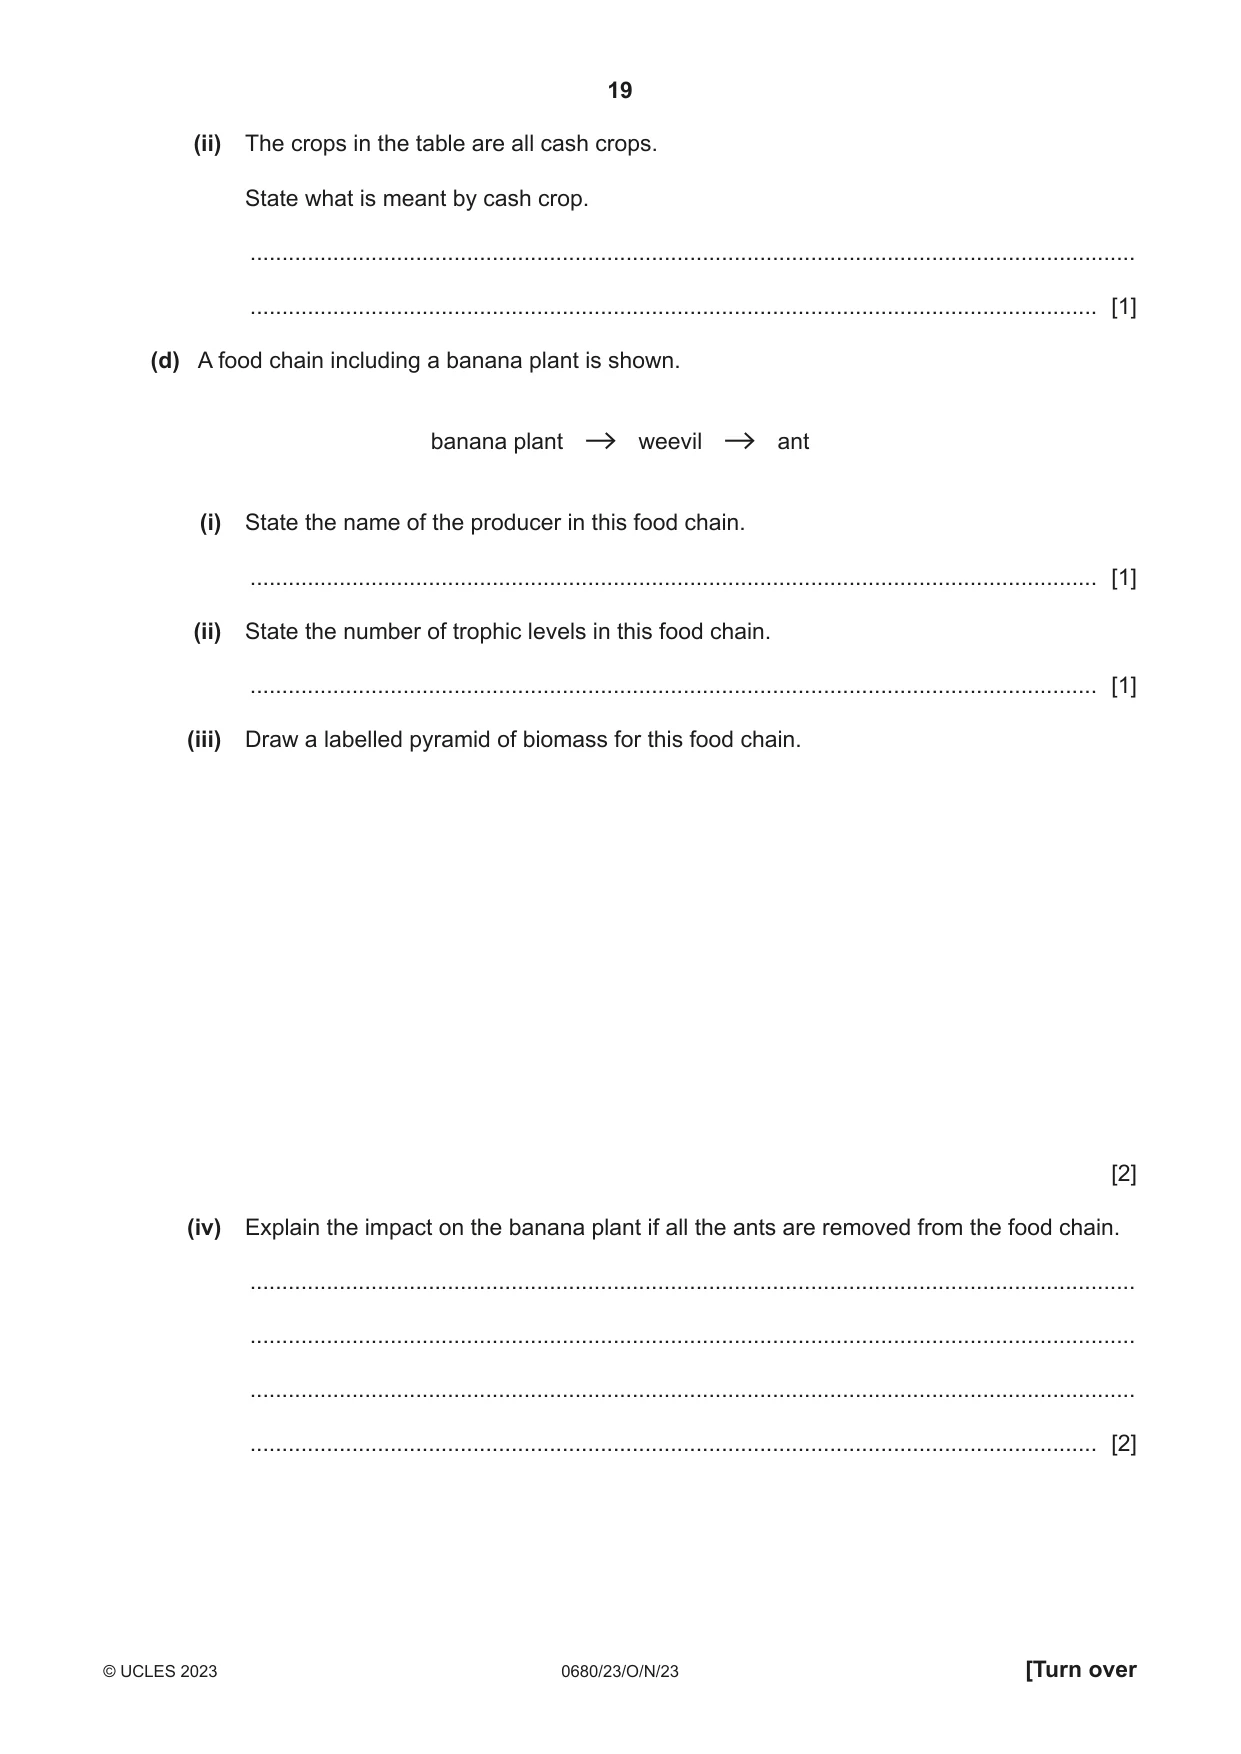
4 (a) The main crops grown by Zimbabwe’s commercial farmers are sugar cane, maize, cassava and vegetables. (i) State the name of this type of agriculture. ..................................................................................................................................... [1] (ii) Agricultural yield can be increased using fertiliser. State three other techniques used to increase agricultural yield. 1 ........................................................................................................................................ 2 ........................................................................................................................................ 3 ........................................................................................................................................ [3] (iii) Suggest why soil erosion is more common in a less economically developed country (LEDC) such as Zimbabwe. ........................................................................................................................................... ........................................................................................................................................... ........................................................................................................................................... ........................................................................................................................................... ........................................................................................................................................... ..................................................................................................................................... [3] (b) Overuse of fertiliser can cause eutrophication. The statements describe the process of eutrophication. The statements are correct but in the wrong order. A The fertiliser encourages the rapid growth of algae. B Dead aquatic plants are decomposed by bacteria, which use up the oxygen. C Algae block sunlight from entering the water. D Rain washes fertiliser off the land into streams. E Aquatic plants die without light. (i) Complete the boxes to show the correct order of statements for the process of eutrophication. One has been done for you. B …………. …………. ………….. ………….. [2] (ii) Explain why a lack of oxygen leads to the death of aquatic organisms. ........................................................................................................................................... ..................................................................................................................................... [1] (c) The table shows the yield of some of Zimbabwe’s agricultural crops in 2018. yield crop / thousands of tonnes cassava 256 vegetables 191 tobacco 132 banana 106 oranges 96 (i) On the grid, plot a bar chart of the data in the table. [4]
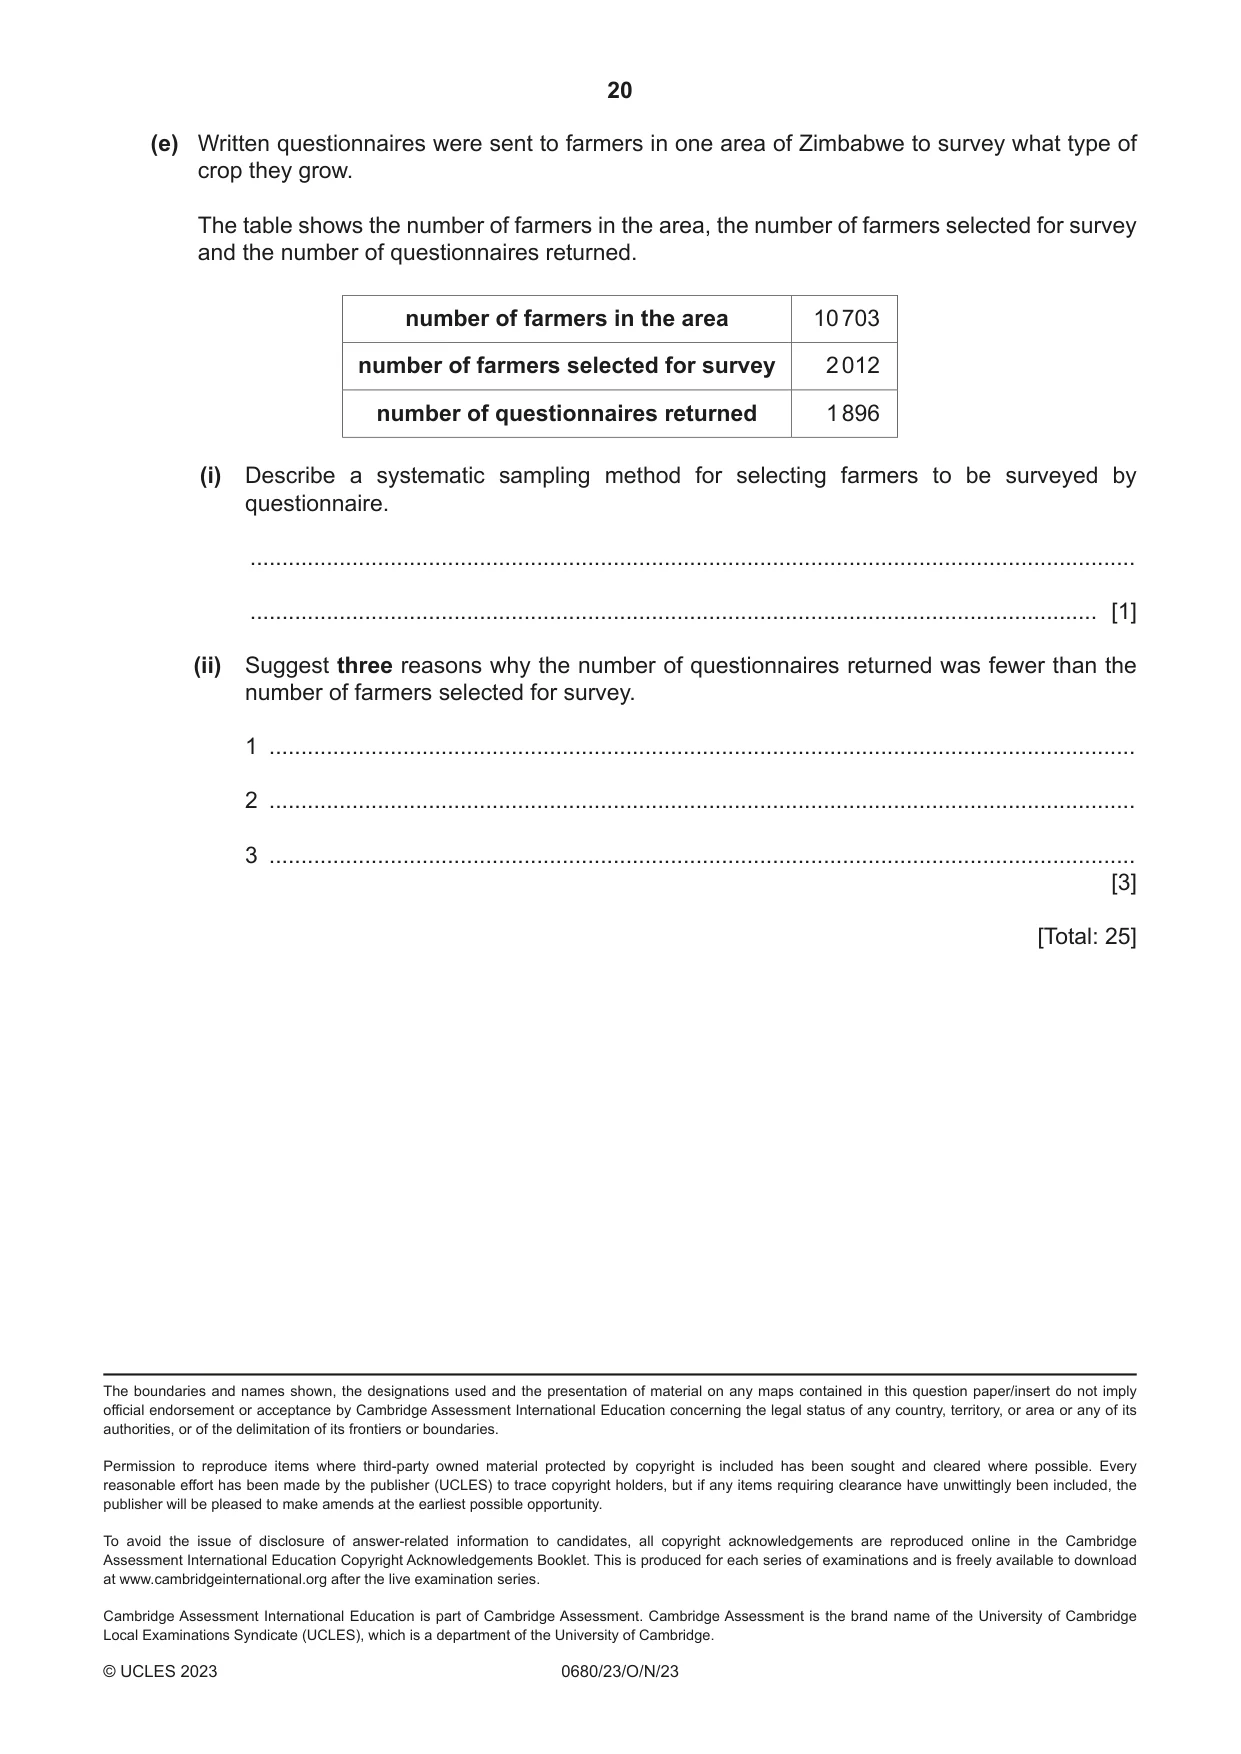
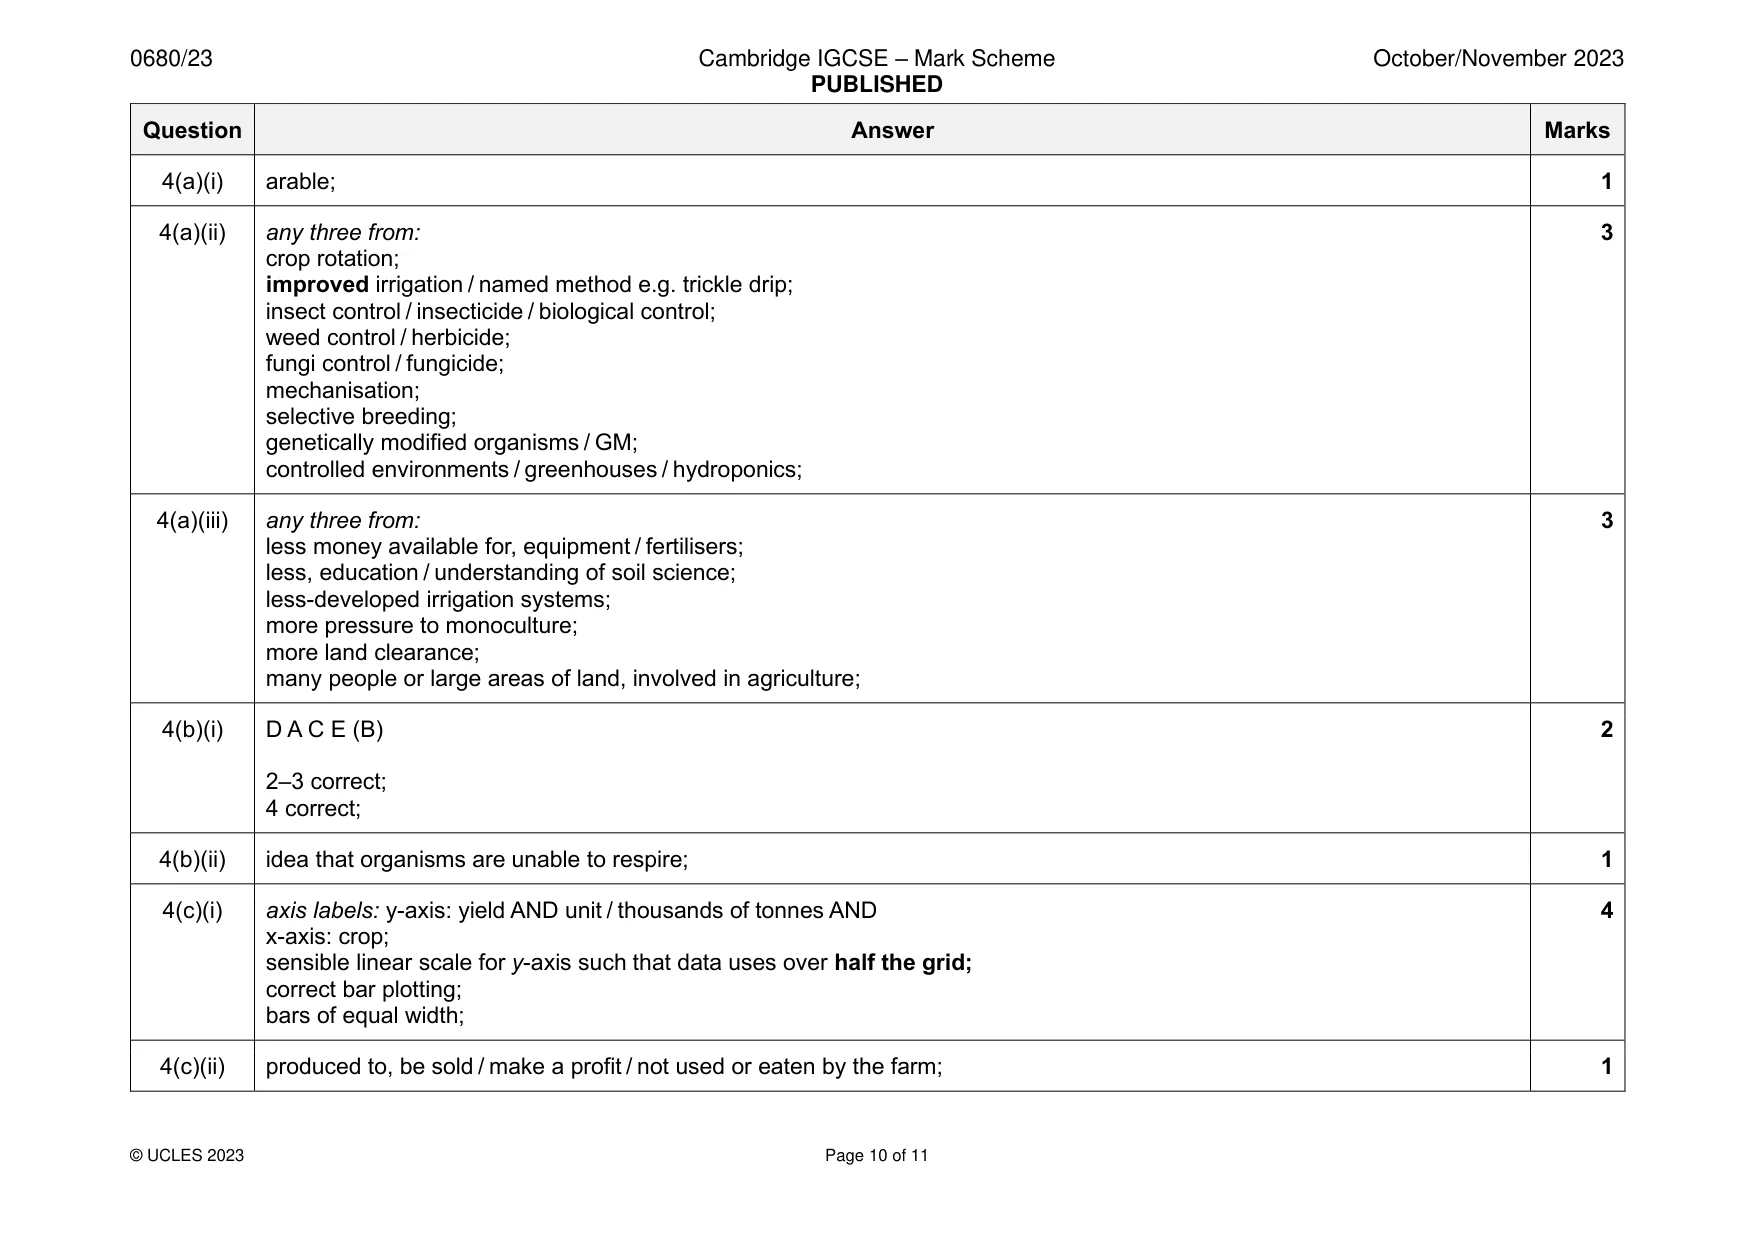
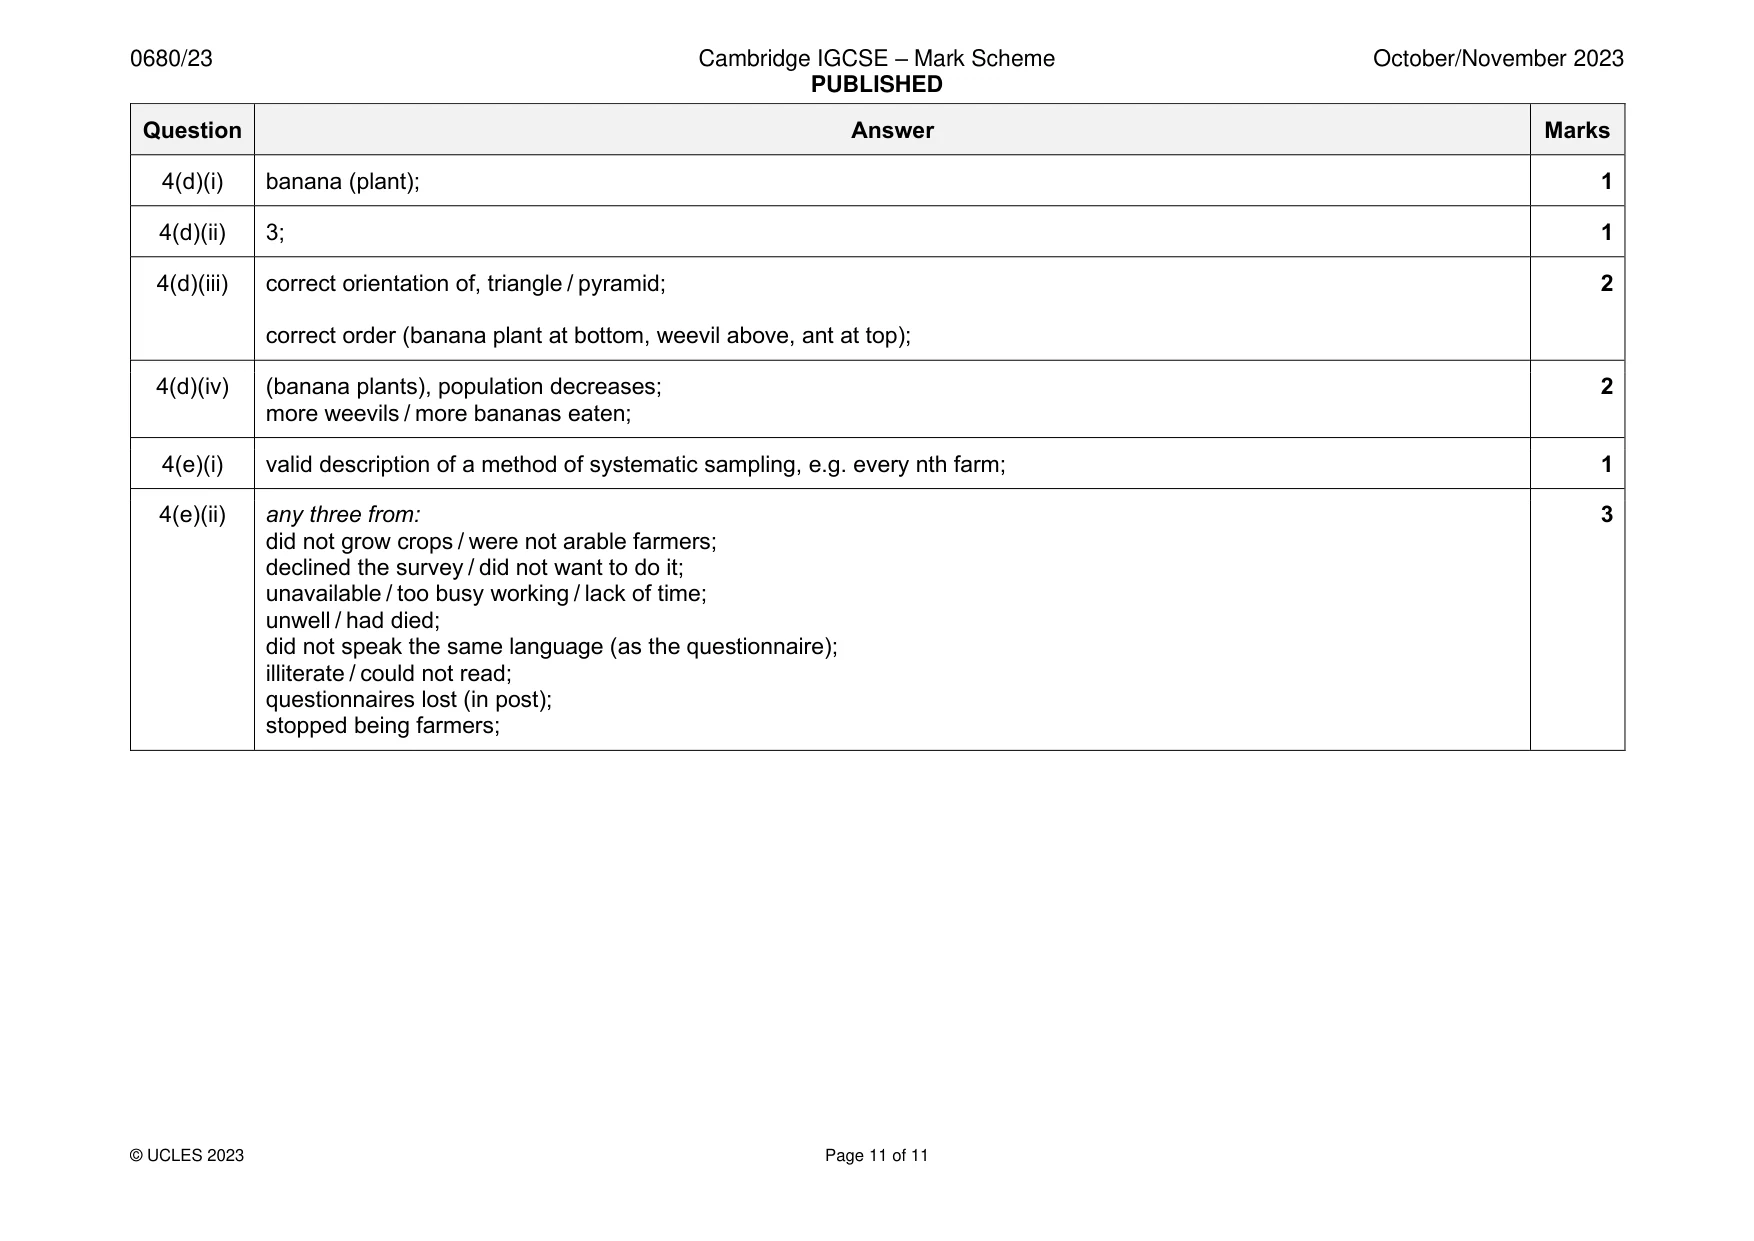
Mark scheme: 4(a)(i) arable; 1 4(a)(ii) any three from: 3 crop rotation; improved irrigation / named method e.g. trickle drip; insect control / insecticide / biological control; weed control / herbicide; fungi control / fungicide; mechanisation; selective breeding; genetically modified organisms / GM; controlled environments / greenhouses / hydroponics; 4(a)(iii) any three from: 3 less money available for, equipment / fertilisers; less, education / understanding of soil science; less-developed irrigation systems; more pressure to monoculture; more land clearance; many people or large areas of land, involved in agriculture; 4(b)(i) D A C E (B) 2 2–3 correct; 4 correct; 4(b)(ii) idea that organisms are unable to respire; 1 4(c)(i) axis labels: y-axis: yield AND unit / thousands of tonnes AND 4 x-axis: crop; sensible linear scale for y-axis such that data uses over half the grid; correct bar plotting; bars of equal width; 4(c)(ii) produced to, be sold / make a profit / not used or eaten by the farm; 1 4(d)(i) banana (plant); 1 4(d)(ii) 3; 1 4(d)(iii) correct orientation of, triangle / pyramid; 2 correct order (banana plant at bottom, weevil above, ant at top); 4(d)(iv) (banana plants), population decreases; 2 more weevils / more bananas eaten; 4(e)(i) valid description of a method of systematic sampling, e.g. every nth farm; 1 4(e)(ii) any three from: 3 did not grow crops / were not arable farmers; declined the survey / did not want to do it; unavailable / too busy working / lack of time; unwell / had died; did not speak the same language (as the questionnaire); illiterate / could not read; questionnaires lost (in post); stopped being farmers;
What was in this paper
The subtopics covered by these 4 questions, and how many questions each got. Open one in a new tab to see every Cambridge question on it.
What you needed in this session
Cambridge’s own grade thresholds for 2023 Oct/Nov, Paper 2 · Variant 3. A higher threshold means an easier paper — the bar moves with how the cohort did.